Article

3D Quantitative Metallogenic Prediction of Indium-Rich Ore Bodies in the Dulong Sn-Zn Polymetallic Deposit, Yunnan Province, SW China

1
College of Land Resources and Engineering, Kunming University of Science and Technology, Kunming 650093, China
2
No. 317 Geological Party of Yunnan Nonferrous Geological Bureau, Qujing 655000, China
3
Hualian Zinc & Indium Co., Ltd., Maguan 663701, China
*
Author to whom correspondence should be addressed.
Minerals 2022, 12(12), 1591; https://doi.org/10.3390/min12121591
Submission received: 17 October 2022 / Revised: 5 December 2022 / Accepted: 9 December 2022 / Published: 12 December 2022
(This article belongs to the Special Issue Pb-Zn Deposits and Associated Critical Metals)

Abstract

:
The southwestern South China Block is one of the most important Sn polymetallic ore districts in the world, of which the Dulong Sn-Zn polymetallic deposit, closely related to Late Cretaceous granitic magmatism, contains 0.4 Mt Sn, 5.0 Mt Zn, 0.2 Mt Pb, and 7 Kt In, and is one of the largest Sn-Zn polymetallic deposits in this region. In this paper, on the basis of a 3D model of ore bodies established by the cut-off grade of the main ore-forming elements, the In grades were estimated by the ordinary Kriging method and the In-rich cells were extracted. The 3D models of strata, faults, granites, and granite porphyries in the mining area were established and assigned the attributes to the cells, which built buffer zones representing the influence space of the geological factors. The weight of evidence and artificial neural network methods were used to quantitatively evaluate the contribution of each geological factor to mineralization. The results show that the Neoproterozoic Xinzhai Formation (Pt3x), fault (F1), and Silurian granites (S3L) have considerable control effects on the occurrence of In-rich ore bodies. The metallogenic predictions according to the spatial coupling relationship of each geological factor in 3D space were carried out, and then the 3D-space-prospecting target areas of In-rich ore bodies were delineated. In addition, the early geological maps and data information of the mining area were comprehensively integrated in 3D space. The feasibility of 3D quantitative metallogenic prediction based on the deposit model was explored by comparing the two methods, and then, the 3D-space prospecting target area was delineated. The ROC curve evaluation shows that the results of two methods have indicative value for prospecting. The modeling results may support its use for future deep prospecting and exploitation of the Dulong and other similar deposits.

1. Introduction

Indium (In) is widely used in the aerospace, radio, electronic, and medical industries and is defined as a “critical mineral” by many economically developed countries and regions around the world. The types of skarn and massive sulfide deposits are the main sources of indium, which account for 29% and 28% of global indium resources, respectively, followed by epithermal and sedimentary Pb-Zn deposits, which account for 19.9% and 18.0% of the global indium resources, respectively [1,2]. The representative skarn In-rich deposits in the world include Dulong and Dachang in China, Ayawilca in Peru, and Tellerhauser and Pohla-Globenstein in Germany. Massive sulfide In-rich deposits include Kidd Creek, Geco/Manitouwadge, and Heath Steele in Canada; and Gaiskoye, Podolskoye, and Sibaiskoye in Russia. Indium mainly forms in Zn and Cu sulfide ores. The main In-rich sulfide is sphalerite, which accounts for 95% of global indium resources [3].
The Dulong Sn-Zn polymetallic deposit is located in the outer contact zone of the southwest side of the Cretaceous granite. The mining area is about 8 km long from north to south and 1.5 km wide from east to west. The Dulong mining area has proven reserves of 0.4 Mt of Sn, 5 Mt of Zn, 0.2 Mt of Pb, 7 Kt of In, and 3 Kt of Cd, and it is also rich in Ag, Cu, Ga, and Ge. The development and utilization values of the mineral resources are high, and the mining area has considerable prospecting potential [4]. Indium exists in the Dulong Sn-Zn polymetallic deposit as associated elements of polymetallic sulfide ores, and its main carrier mineral is marmatite, with a small amount in chalcopyrite. The In-rich ore bodies occur as stratified or stratiform-like in skarn, and the ore-bearing skarn is mainly composed of diopside, tremolite, chlorite, epidote, and actinolite, whose occurrence regularity are as follows: (a) The skarn and In-rich ore bodies are stratified, stratiform-like or lenticular restricted in the Neoproterozoic Xinzhai Formation and are consistent with the stratigraphic occurrence; (b) Occurs in the contact zone between marble and clastic rocks and often forms multilayered skarn and In-rich ore bodies in the area where these two types of rocks interact; (c) Occurs in the upper and lower plates of the fault (F1); (d) The upper part of the Cretaceous granite ridge uplift is the site of concentrated occurrence of the skarn and In-rich ore bodies. At present, the average drilling depth of the mine area is about 312 m, and the risks of deep exploration are gradually increasing. Therefore, a comprehensive analysis of the existing geological data and an exploration of the valuable prospecting space in the deep and peripheral parts of the mine area are necessary in order to improve the success rate of prospecting.
The deposit’s 3D geological model mainly includes models of ore bodies, strata, faults, and magmatic rocks. The 3D ore body model is widely used to resource reserve estimations [5,6,7,8,9,10,11,12,13]. 3D geological models can intuitively show the spatial forms of geological bodies and reflect the spatial position relationships between geological bodies, with varying degree of success [14,15,16,17,18]. Traditional 2D metallogenic prediction methods include the weight of evidence, information value, neural network, logistic regression, and fractal analysis methods. These 2D metallogenic prediction methods have played an important role in regional metallogenic prediction, but are difficult in one given deposit [19,20,21,22]. Based on the establishment of the deposit model, this study reveals the control effects of strata, faults, and granites on In-rich ore bodies using 3D weight of evidence and 3D neural network methods. Additionally, a 3D quantitative metallogenic prediction was carried out to explore the mining area’s deep and peripheral prospecting targets. The results can provide clues for the same types of ore deposits.

2. Geological Background and Deposit Model

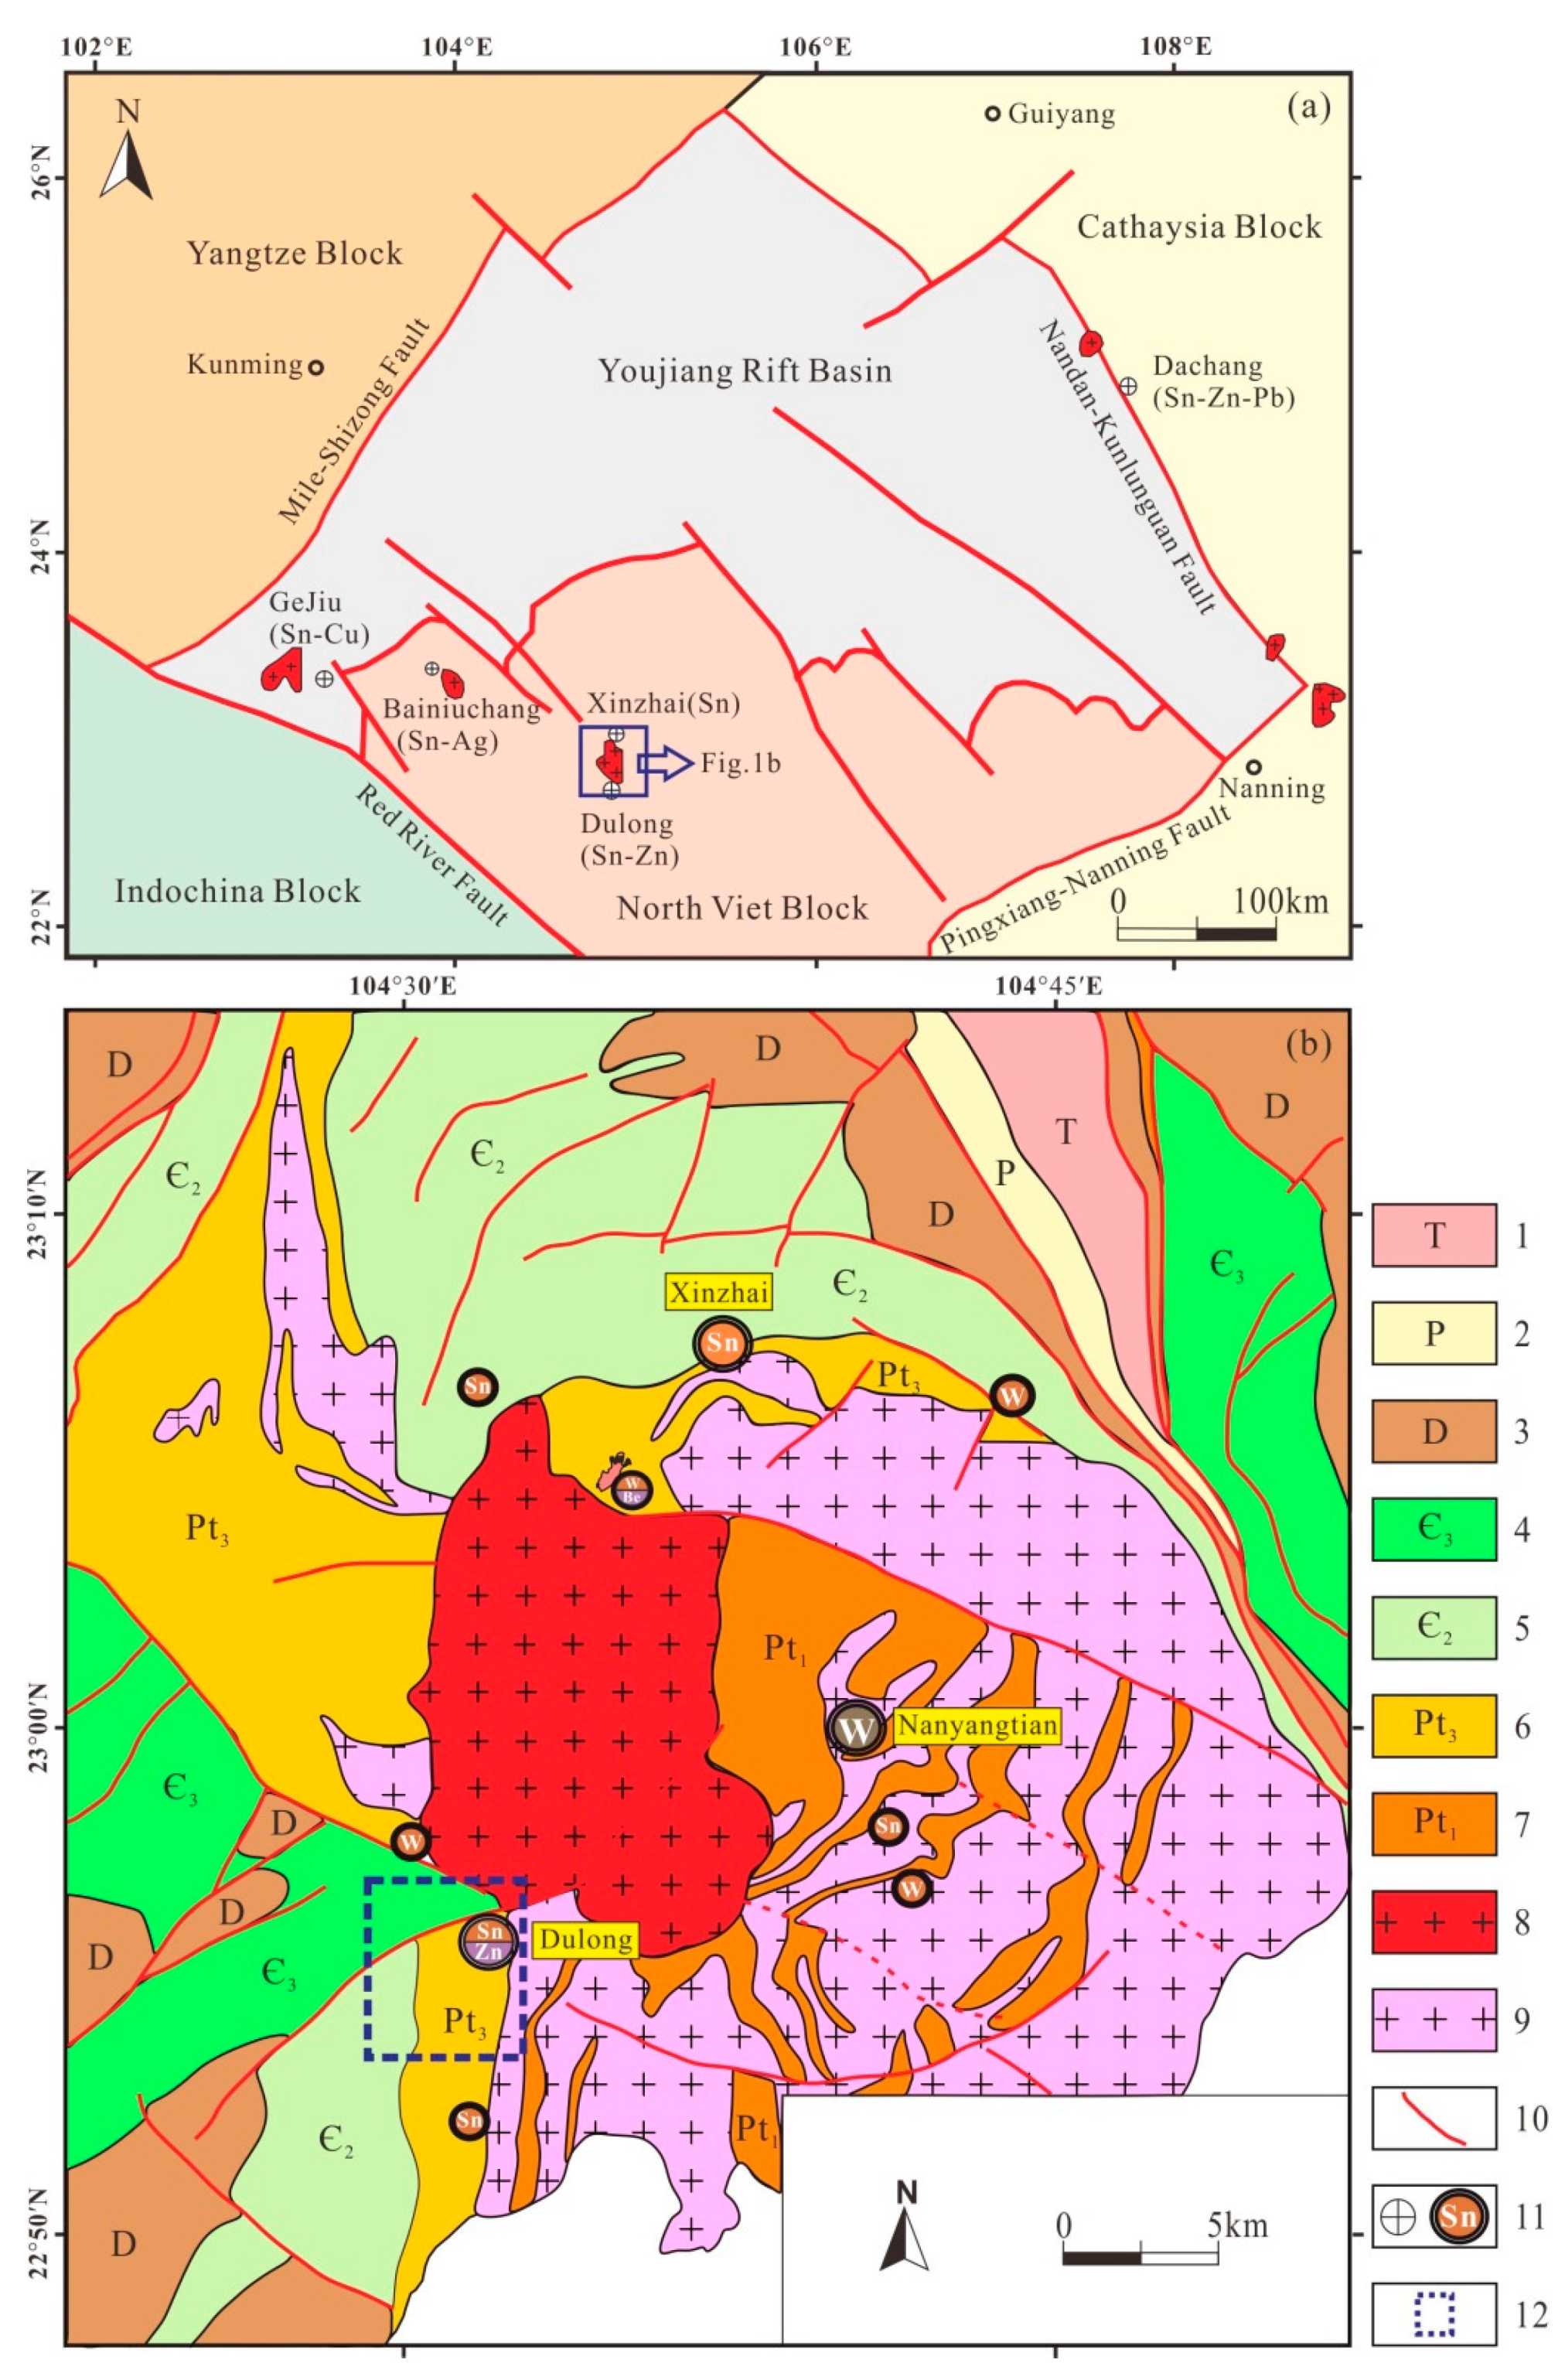
2.1. Geological Background

The Dulong Sn-Zn polymetallic deposit is located in the joint part of the Cathaysia, Yangtze, Indochina, and North Viet blocks (Figure 1a). The main outcrop strata are Neoproterozoic, Cambrian, and Devonian. The Neoproterozoic Xinzhai Formation is the main ore-bearing stratum of the Dulong Sn-Zn polymetallic deposit (Figure 1b and Figure 2a). The upper part of the Neoproterozoic Xinzhai Formation is composed of gray-green quartz-mica schist, calcite marble, and skarn lenticles. The middle part is a composite lithological section that composes of quartz-mica schist, marble, skarn, granulite, and a small amount of gneiss with frequent changes in the lithofacies, complex rock assemblage, and skarn geological bodies appearing in groups and zones. This is the main occurrence horizon of the mining area’s Sn-Zn industrial ores. The lower part consists of marble lens and dark gray biotite-plagioclase gneiss, biotite plagioclase hornblende gneiss, and granite gneiss, in addition to plagioclase granulite with a small amount of garnet skarn and siliceous marble lenticle.
The well-developed south-north strike faults, which mainly interlayer dislocation faults with multistage activity characteristics, were observed with the same occurrence as strata in the mining area. Among them, the largest is the F0 fault that comprises the eastern boundary of the ore bodies. Moreover, the F1 fault is located in the middle of the mining area, and its hanging wall and footwall have ore bodies. The F2 fault is located parallel to F0 and F1 in the mining area’s western section. The F3 fault strike is NE-SW, staggered to the north-south fault, and has the characteristics of late activity (Figure 2b).
The Cretaceous granites have an outcrop area of about 153 km2. The granites can be roughly divided into three sub-stages according to their evolutionary sequences [24]. The first sub-stage is gray-white porphyry-bearing medium-coarse-grained dimica granite, accounting for 2/3 of the total outcrop area of the magmatic rock. The second sub-stage is gray-white medium-fine-grained dimica granite, which intrudes into the first sub-stage pluton in the shape of a rock cluster. The third sub-stage is gray-white granite porphyry, which is interspersed in the early granite and metamorphic rock series in the shape of rock branches and veins. The Silurian granite is medium-fine-grained, mostly metamorphic to (eyeball-shaped) granite gneiss, and the zircon U-Pb ages are 427–436 Ma [25].
A series of dome-shaped metamorphic rocks are exposed around the Cretaceous granite, which is called the “Laojunshan metamorphic core complex” [26,27], and the metamorphic strata are mainly composed of the Neoproterozoic Xinzhai and Lower-Middle Cambrian Formations, while the Upper Cambrian, Lower Ordovician, and Devonian Formations also suffered from mild metamorphism. Metamorphism is dominated by regional metamorphism, and strong migmatization occurs in the late stages.

2.2. Deposit Geology

The Dulong deposit is located in the southwest outer contact zone of the Laojunshan granites. The stratigraphic trend is north-south, dips to the west, and the dip angle is 10°–35°. The strata exposed in the mine area include the Middle Cambrian Longha Formation, Tianpeng Formation and Neoproterozoic Xinzhai Formation, which are subject to moderate metamorphism, and the Xinzhai Formation is the ore-bearing stratum of the Sn-Zn polymetallic ore body. Normal faults are very well-developed in the mine area, mainly as interstratified glide. The typical faults are F0, F1, F2, and F3, where F0 is the eastern boundary of the ore body output; F1 has ore body output in both upper and lower plates, which is closely related to the spatial location of the ore bodies; and F2 is the boundary between the ore-bearing Xinzhai Formation and the Tianpeng Formation. The exposed magmatic rocks in the mine area mainly include Silurian granite, Cretaceous granite, and Cretaceous granite porphyry. Silurian granite is located in the lower plate of fault F0, Cretaceous granite is exposed in the northern part of the mine area and the burial depth gradually increases to the south, Cretaceous granite porphyry intrudes into the aforementioned strata and granite in the form of veins, and there is no ore body output inside the granite and granite porphyry. The alterations of the surrounding rocks in the mine area mainly include marbleization, skarnization, silicification, etc. The types of skarns mainly include chlorite skarn, epidote skarn, actinolite skarn, diopside skarn, tremolite skarn, clinotetrahedrite skarn, and garnet skarn, among which chlorite skarn and actinolite skarn have the best ore-bearing properties.
The ore bodies occur stratified, stratiform-like, or lenticular restricted in the Neoproterozoic Xinzhai Formation and are consistent with the stratigraphic occurrence. Metal minerals mainly include marmatite, pyrite, chalcopyrite, cassiterite, pyrrhotite, and magnetite. Gangue minerals include diopside, chlorite, epidote, actinolite, clinozoisite, garnet, tremolite, quartz, and calcite. Indium enters marmatite by coupled substitution as (Cu+ or Ag+, In3+)↔(2Zn2+) and is mainly contained homogeneously in the marmatite [28].

2.3. Deposit Model

The Dulong Sn-Zn polymetallic deposit modeling area is 5.0 km wide from east to west, 5.7 km long from north to south, and the surface elevation is 650–1768 m. The minimum modeling elevation is −1000 m. The boundaries of the strata, magmatic rocks, and ore bodies according to the geological survey and prospecting engineering data of the mining area were determined using 3Dmine software, and the model of each geological factor according to the occurrence of these boundaries was appropriately extrapolated (Figure 2a,b). The modeling strata include the Middle Cambrian Longha, Middle Cambrian Tianpeng, and Neoproterozoic Xinzhai Formations. Our modeled magmatic rocks are Cretaceous granite (K1H), Cretaceous granite porphyry (K2K), and Silurian granite (S3L). Furthermore, our modeled faults are the F0, F1, and F2 NS-strike faults, and the F3 NE-SW-strike fault. The ore bodies’ model with boundary grades of Zn 1.00%, Sn 0.15%, and Cu 0.20% was established. It has been proven that if the cell division is too small, it not only causes the geological phenomenon to be artificially divided, but also brings inconvenience to the huge data processing work; if the cell division is too large, it makes the morphological distribution of ore-bearing units unreliable. Taking into account the strata, structure, granite, and ore-body occurrence and scale in the deposit model, as well as the data processing capability of the computer, and taking a 20 m × 20 m × 20 m cube as the unit block, the ore deposit modeling area was represented by 7,994,700 cells, of which 19,101 were ore-bearing cells (Figure 2a,b).
The 3D spatial positioning for In-grade test data from drilling was carried out, and the polymetallic ore body model by the ordinary Kriging method was estimated. Thus, the In-grade attributes corresponding to 10,320 ore-bearing cells were obtained. In these cells, the maximum, minimum, and mean values were 1780 g/t, 2 g/t, and 69 g/t, respectively. The In-grade log–log plot of the ore bodies was obtained by fractal analysis (Figure 2c) and calculated the grade boundary of the In-rich cells to be 60 g/t. The 3752 cells with indium grades extracted were greater than 60 g/t, forming an In-rich ore model (Figure 2d).

3. Prediction Method and Ore Control Factors

3.1. Weight of Evidence Method

Bonham Carter et al. (1988) and Agterberg (1989) first proposed the weight of evidence method for multivariate statistics and the fusion of discrete data using probability and Bayesian theory [19]. The posterior probability of determining the favorable area for mineralization is obtained through the superposition and composite analysis of several kinds of mineralization-related geological information. Each metallogenic factor is regarded as an evidence factor of the metallogenic prospect, and the weight value of each evidence factor represents its contribution to the metallogenic prediction [29]. The evidence weight analysis needs to verify the conditional independence of different evidence and then calculate the posterior probability of each basic unit divided into the study area. The value represents the metallogenic probability, and the area where the posterior probability is greater than the critical value is the metallogenic prospect area.
The modeling area is evenly divided into T units with the same volume, the number of ore-bearing cells in the model is D, and P is the probability of any cell containing ore.
The formula of prior probability is:
P p r i = P ( D ) = D T
The priori probability ( O p r i ) is:
O p r i = O ( D ) = P ( D ) 1 P ( D ) = D T D
where O p r i is used to calculate the ratio of the prior probability of ore-bearing to non-ore-bearing blocks in the attributes of each metallogenic geological factor.
The weight of any geological factor’s binary image is defined as:
W + = ln P ( B / D ) P ( B / D ¯ ) = ln N ( B D ) / N ( D ) ( N ( B ) N ( B D ) ) / ( N ( T ) N ( D ) )
W = ln P ( B ¯ / D ) P ( B ¯ / D ¯ ) = ln ( N ( D ) N ( B D ) ) / N ( D ) ( N ( T ) N ( B ) N ( D ) + N ( B D ) ) / ( N ( T ) N ( D ) )
In the formula, W + represents that the weight value of each metallogenic geological factor’s attribute exists within the prediction area, and W represents that the weight value of each metallogenic geological factor’s attribute does not exist within the prediction area. If the weight value is 0, it means that the data in the prediction area is missing. B and B   ¯ represent the presence or absence of each metallogenic geological factor’s attributes in the layer.
The correlation between geological factors and known ore-bearing units is represented by contrast C :
C = W + W
The value of C being greater than 0 indicates that the attribute of the geological factor is favorable for mineralization. This means it can participate in quantitative mineralization prediction. A C value equal to 0 indicates that the attribute of this geological factor has no guiding significance for metallogenic prediction, and a C value of less than 0 indicates that the attribute of the geological factor is not conducive to mineralization and should be discarded.
If the n evidence factors are conditionally independent from the ore-bearing unit distribution, the logarithm of the posterior probability is:
ln ( O ( D | B 1 k B 2 k B 3 k B n k ) ) = j = 1 n W j k + ln ( O ( D ) )
The posterior probability O p o s is expressed as:
O p o s = exp { ln ( O p r i ) + j = 1 n W j k }
W j k = { W +                               evidence   factor               W                               no   evidence   factor               0                                       missing   data                        
The posterior probability is expressed as:
P p o s = O p o s ( 1 + O p o s )
The posterior probability of each favorable ore-forming factor was obtained through the above calculation. The posterior probability value is between 0 and 1, and the higher the value, the greater the possibility of bearing ore [30,31].

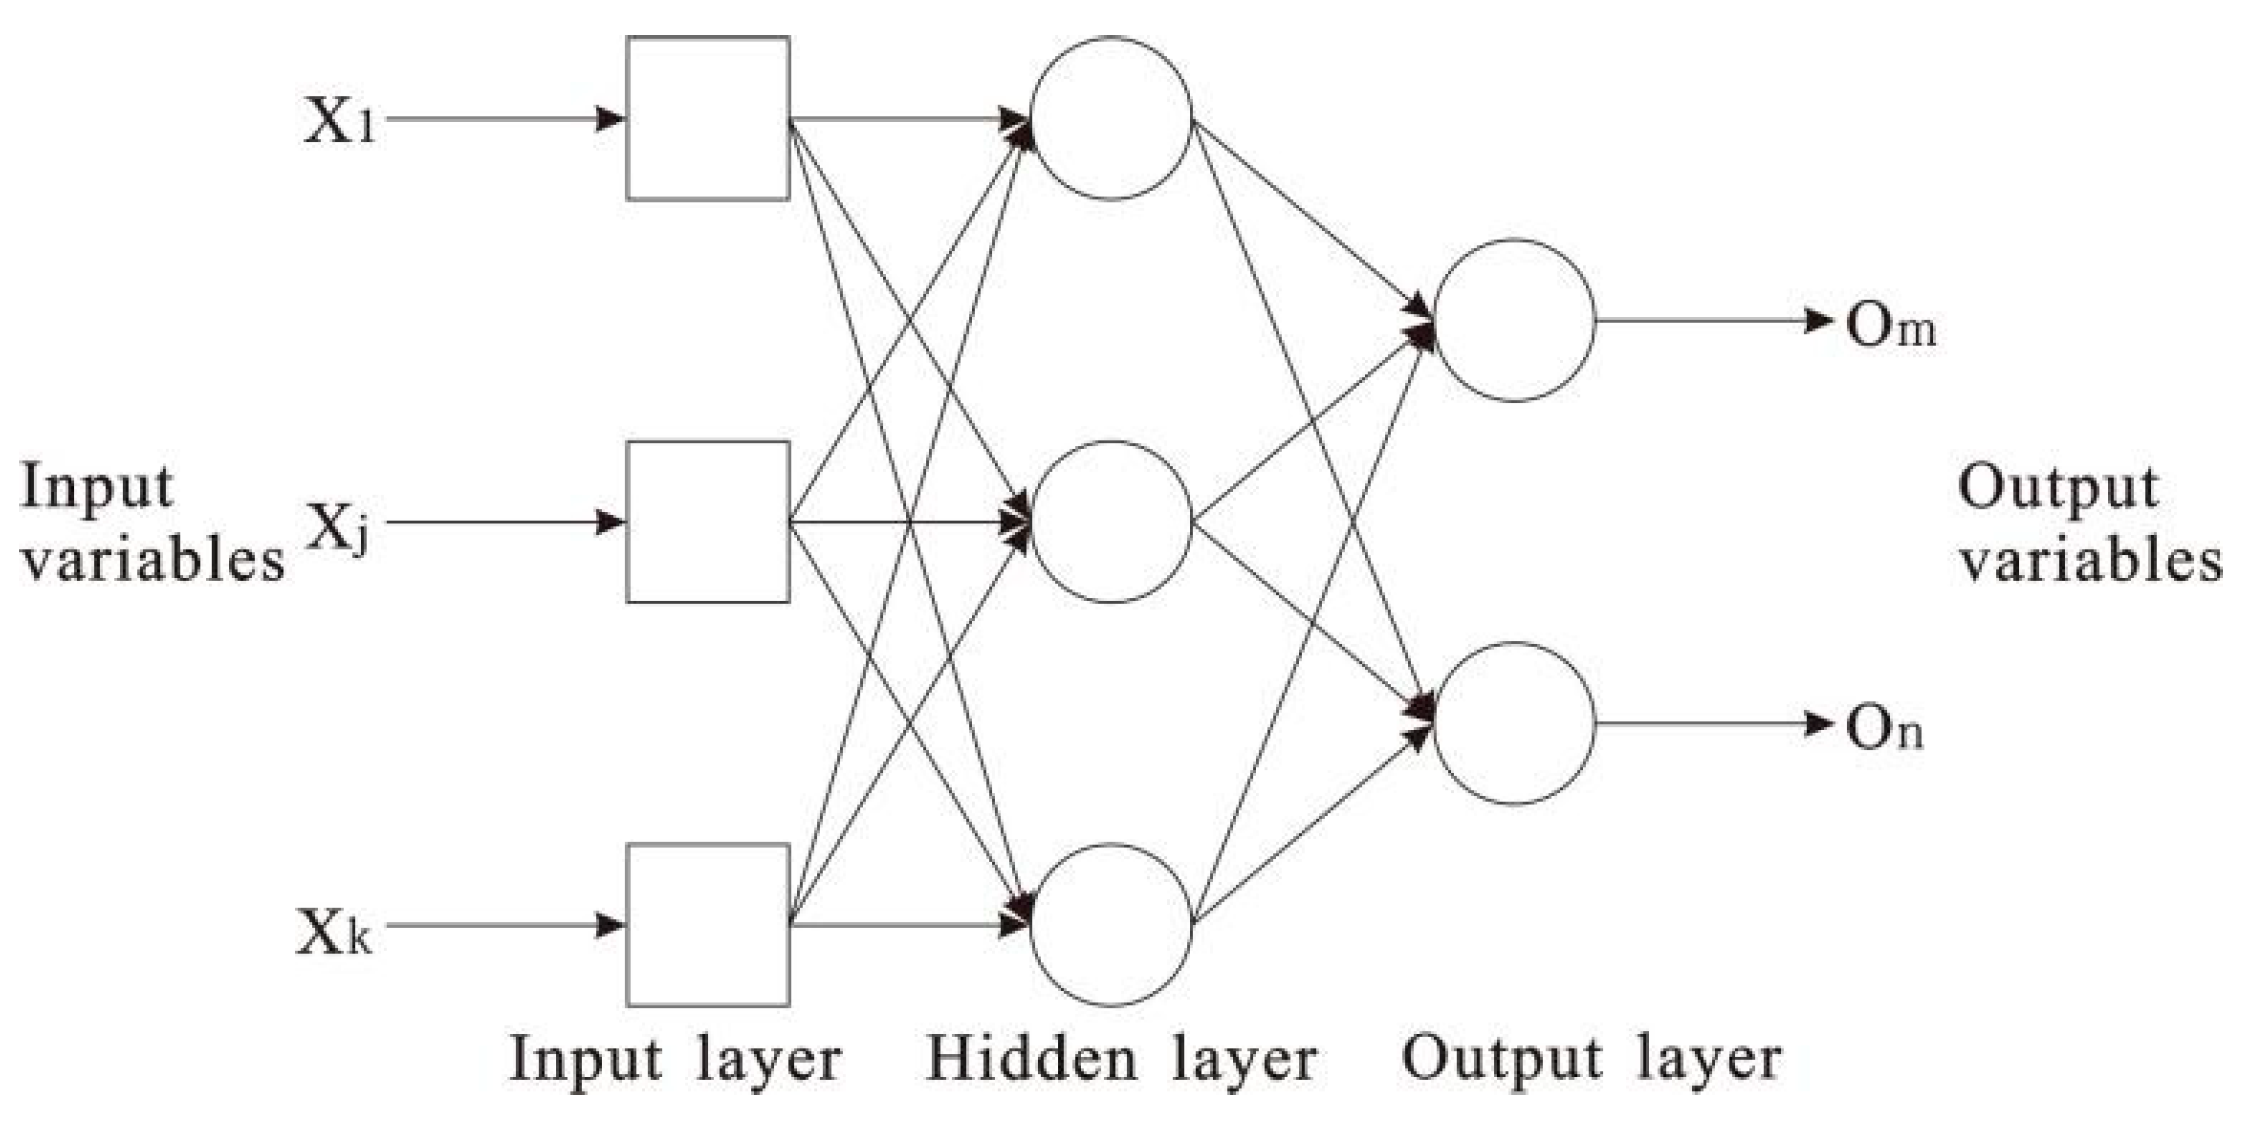
3.2. Artificial Neural Network Method

An artificial neural network (ANN) is a mathematical model composed of highly nonlinear and linear operations and is established by simulating the thinking mode and organizational form of the human brain. ANNs can automatically simulate the natural relationships between variables when they are used to make prediction, carry out global optimization searches, reduce manual interventions, and improve the accuracy of predictions [32,33]. Moreover, ANNs can be divided into feedforward and feedback neural networks, as well as competitive learning networks. At present, the most widely used multilayer perceptron and BP networks are feedforward neural networks.
The multilayer perceptron provided by the SPSS19 software is composed of several perceptron layers and adjustable weight connections, generally including an input layer, one or more hidden layers, and an occurrence layer. The input layer is used to store predictive variables, the hidden layer contains nodes or cells that cannot be observed, and the output layer contains output variables (Figure 3).

3.3. Ore-Controlling Factors and Prediction Variable Selection

The Neoproterozoic Xinzhai Formation (Pt3x), faults (F0 and F1), Cretaceous granite porphyries (K2K), Cretaceous granites (K1H), and Silurian granites (S3L) are geological factors closely related to the ore bodies in the Dulong mining area. The search is from the Xinzhai Formation floor to the interior of the strata, forming the distance attribute (Pt3x distance). The Xinzhai Formation distance attribute ranges from 0 to 350 m and contains all 3752 In-rich cells (Figure 4a). The search is from the fault plane to both sides to determine the distance attributes (F0 and F1 distances, Figure 4b,c). The F0 distance value contains all In-rich cells in the range from 0 to 500 m, and the F1 distance value contains all In-rich cells in the range from 0 to 250 m. The search is from the granite porphyry vein to the periphery to establish the distance attribute (K2K distance, Figure 4d). The K2K distance value ranges from 0 to 750 m, which includes all indium-rich cells. The search is from the granite roof to the outside of the contact zone to determine the distance attributes (K1H and S3L distances) from the peripheral centroid point to the granite roof (Figure 4e,f). The K1H distance ranges from 0 to 650 m, and the S3L distance ranges from 0 to 500 m, including all In-rich cells. The 3D buffer zones were established according to the ore-bearing properties of the peripheral space of each geological factor to represent the influenced space of the strata, structure, and granite on mineralization (Figure 4).

4. 3D Quantitative Metallogenic Prediction

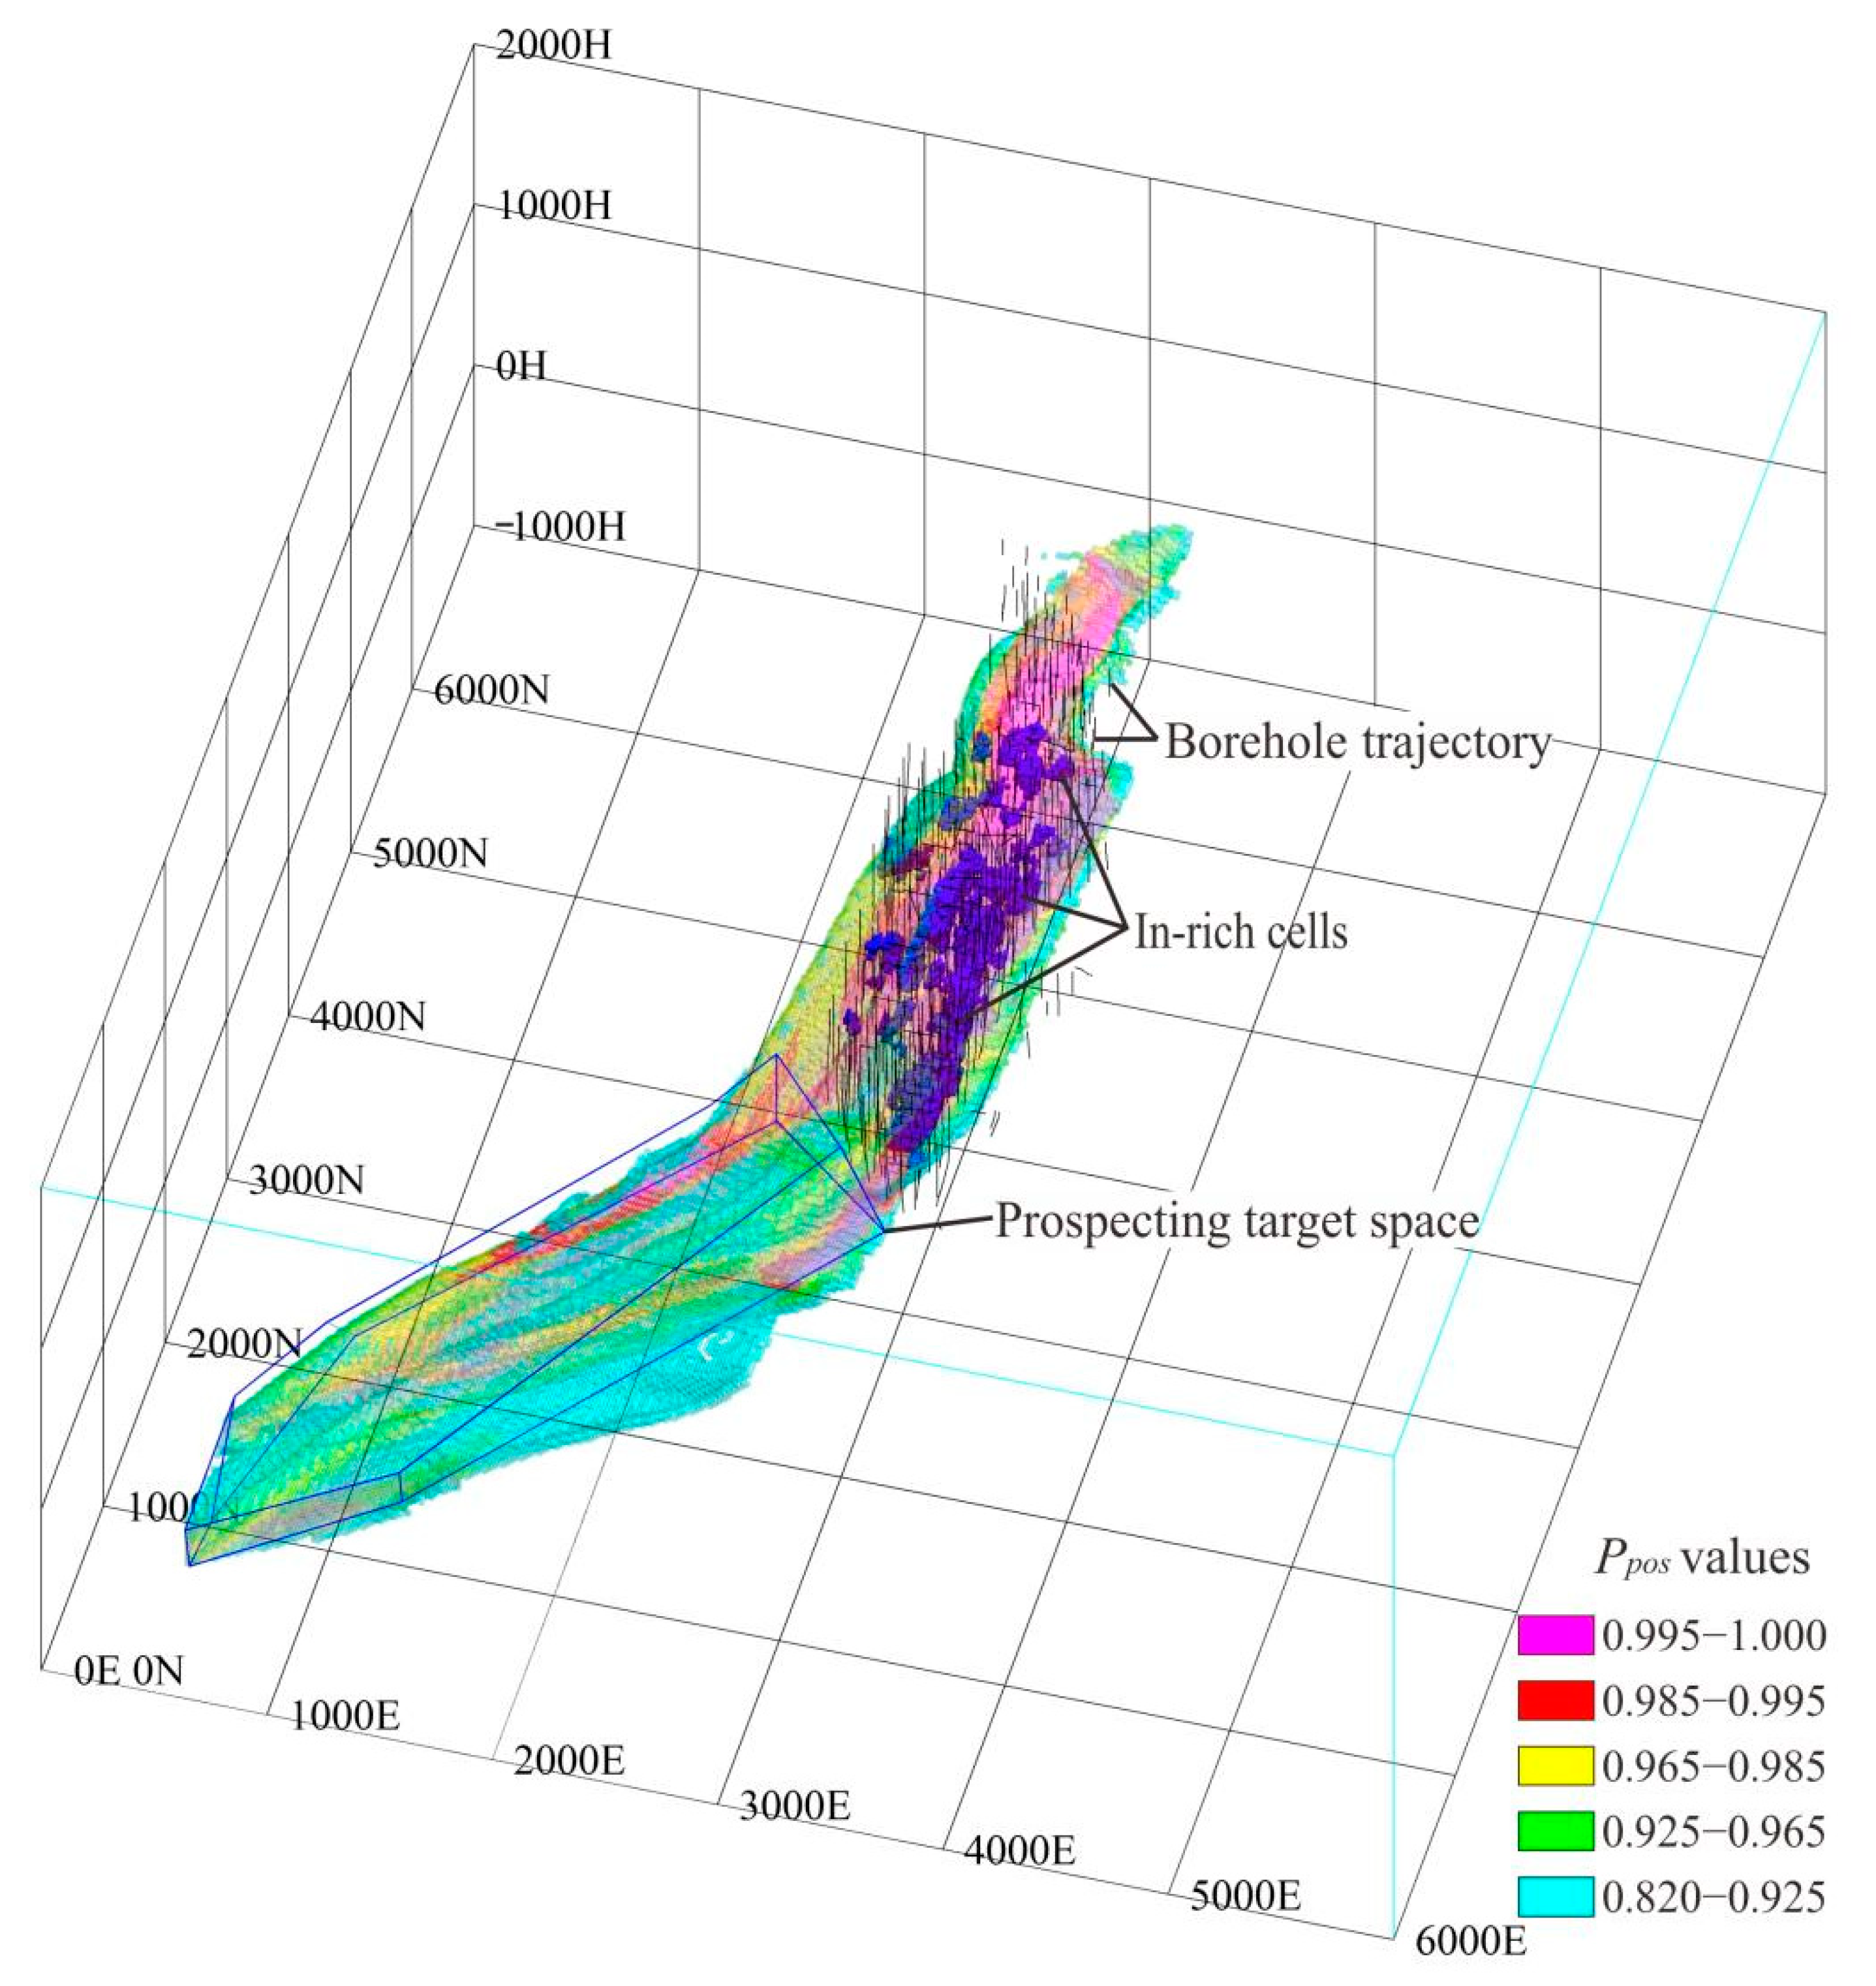
4.1. Metallogenic Prediction by Weight of Evidence Method

The positive W + and negative W weights in the zoning intervals of each geological factor were calculated according to the buffer zone of each geological variable, with 50 m as the basic bandwidth (Table 1).
The contrast C value represents the strength of correlation between ore-controlling geological factors and mineralization [34]. The top 10 geological factors of contrast C values in each zone are mainly the Xinzhai Formation (Pt3x), Silurian granites (S3L), and fault F1. The ore bodies are strictly limited in the Xinzhai Formation (Pt3x), and the C value is high, 100–200 m away from the stratum floor, which is conducive to mineralization. The metamorphic zone that is 150–400 m away from the Silurian granite roof (S3L) has a high C value, which is conducive to mineralization. The C value of the spatial range 0~150 m away from the F1 fault plane is high, which is conducive to mineralization. The positive weight W + value of each geological factor’s zoning interval with a C value was assigned greater than 0 to the cells in the zoning interval and calculated the posterior probability P p o s value of each cell.
The ROC curve can be used to determine the best prediction boundary of the binary classification and to evaluate the prediction ability. The optimal prediction boundary by the “Youden index”, that is, sensitivity-(1-specificity), was determined, and the boundary value corresponding to the maximum value of the index value is the optimal prediction boundary.
A total of 3,086,482 posterior probability P p o s values were obtained through the calculations, the minimum, maximum, and mean values were 0.0011, 0.9999, and 0.1035, respectively, the variance was 0.0756, and the standard deviation was 0.2749. After taking the P p o s value of the cell as the test variable and determining whether it belonged to the In-rich cells as the state variable, our ROC curve analysis showed that the best prediction boundary of the P p o s value for the In-rich ore bodies was 0.820. We obtained a total of 247,555 cells ( P p o s > 0.820) according to the prediction boundary, of which 3665 cells belonged to In-rich cells. The high value of the posterior probability P p o s of the prediction space was mainly distributed in the In-rich cells and the southwest of the mining area. The deep space in the south and west of the mining area can be used as a prospecting target space (Figure 5).

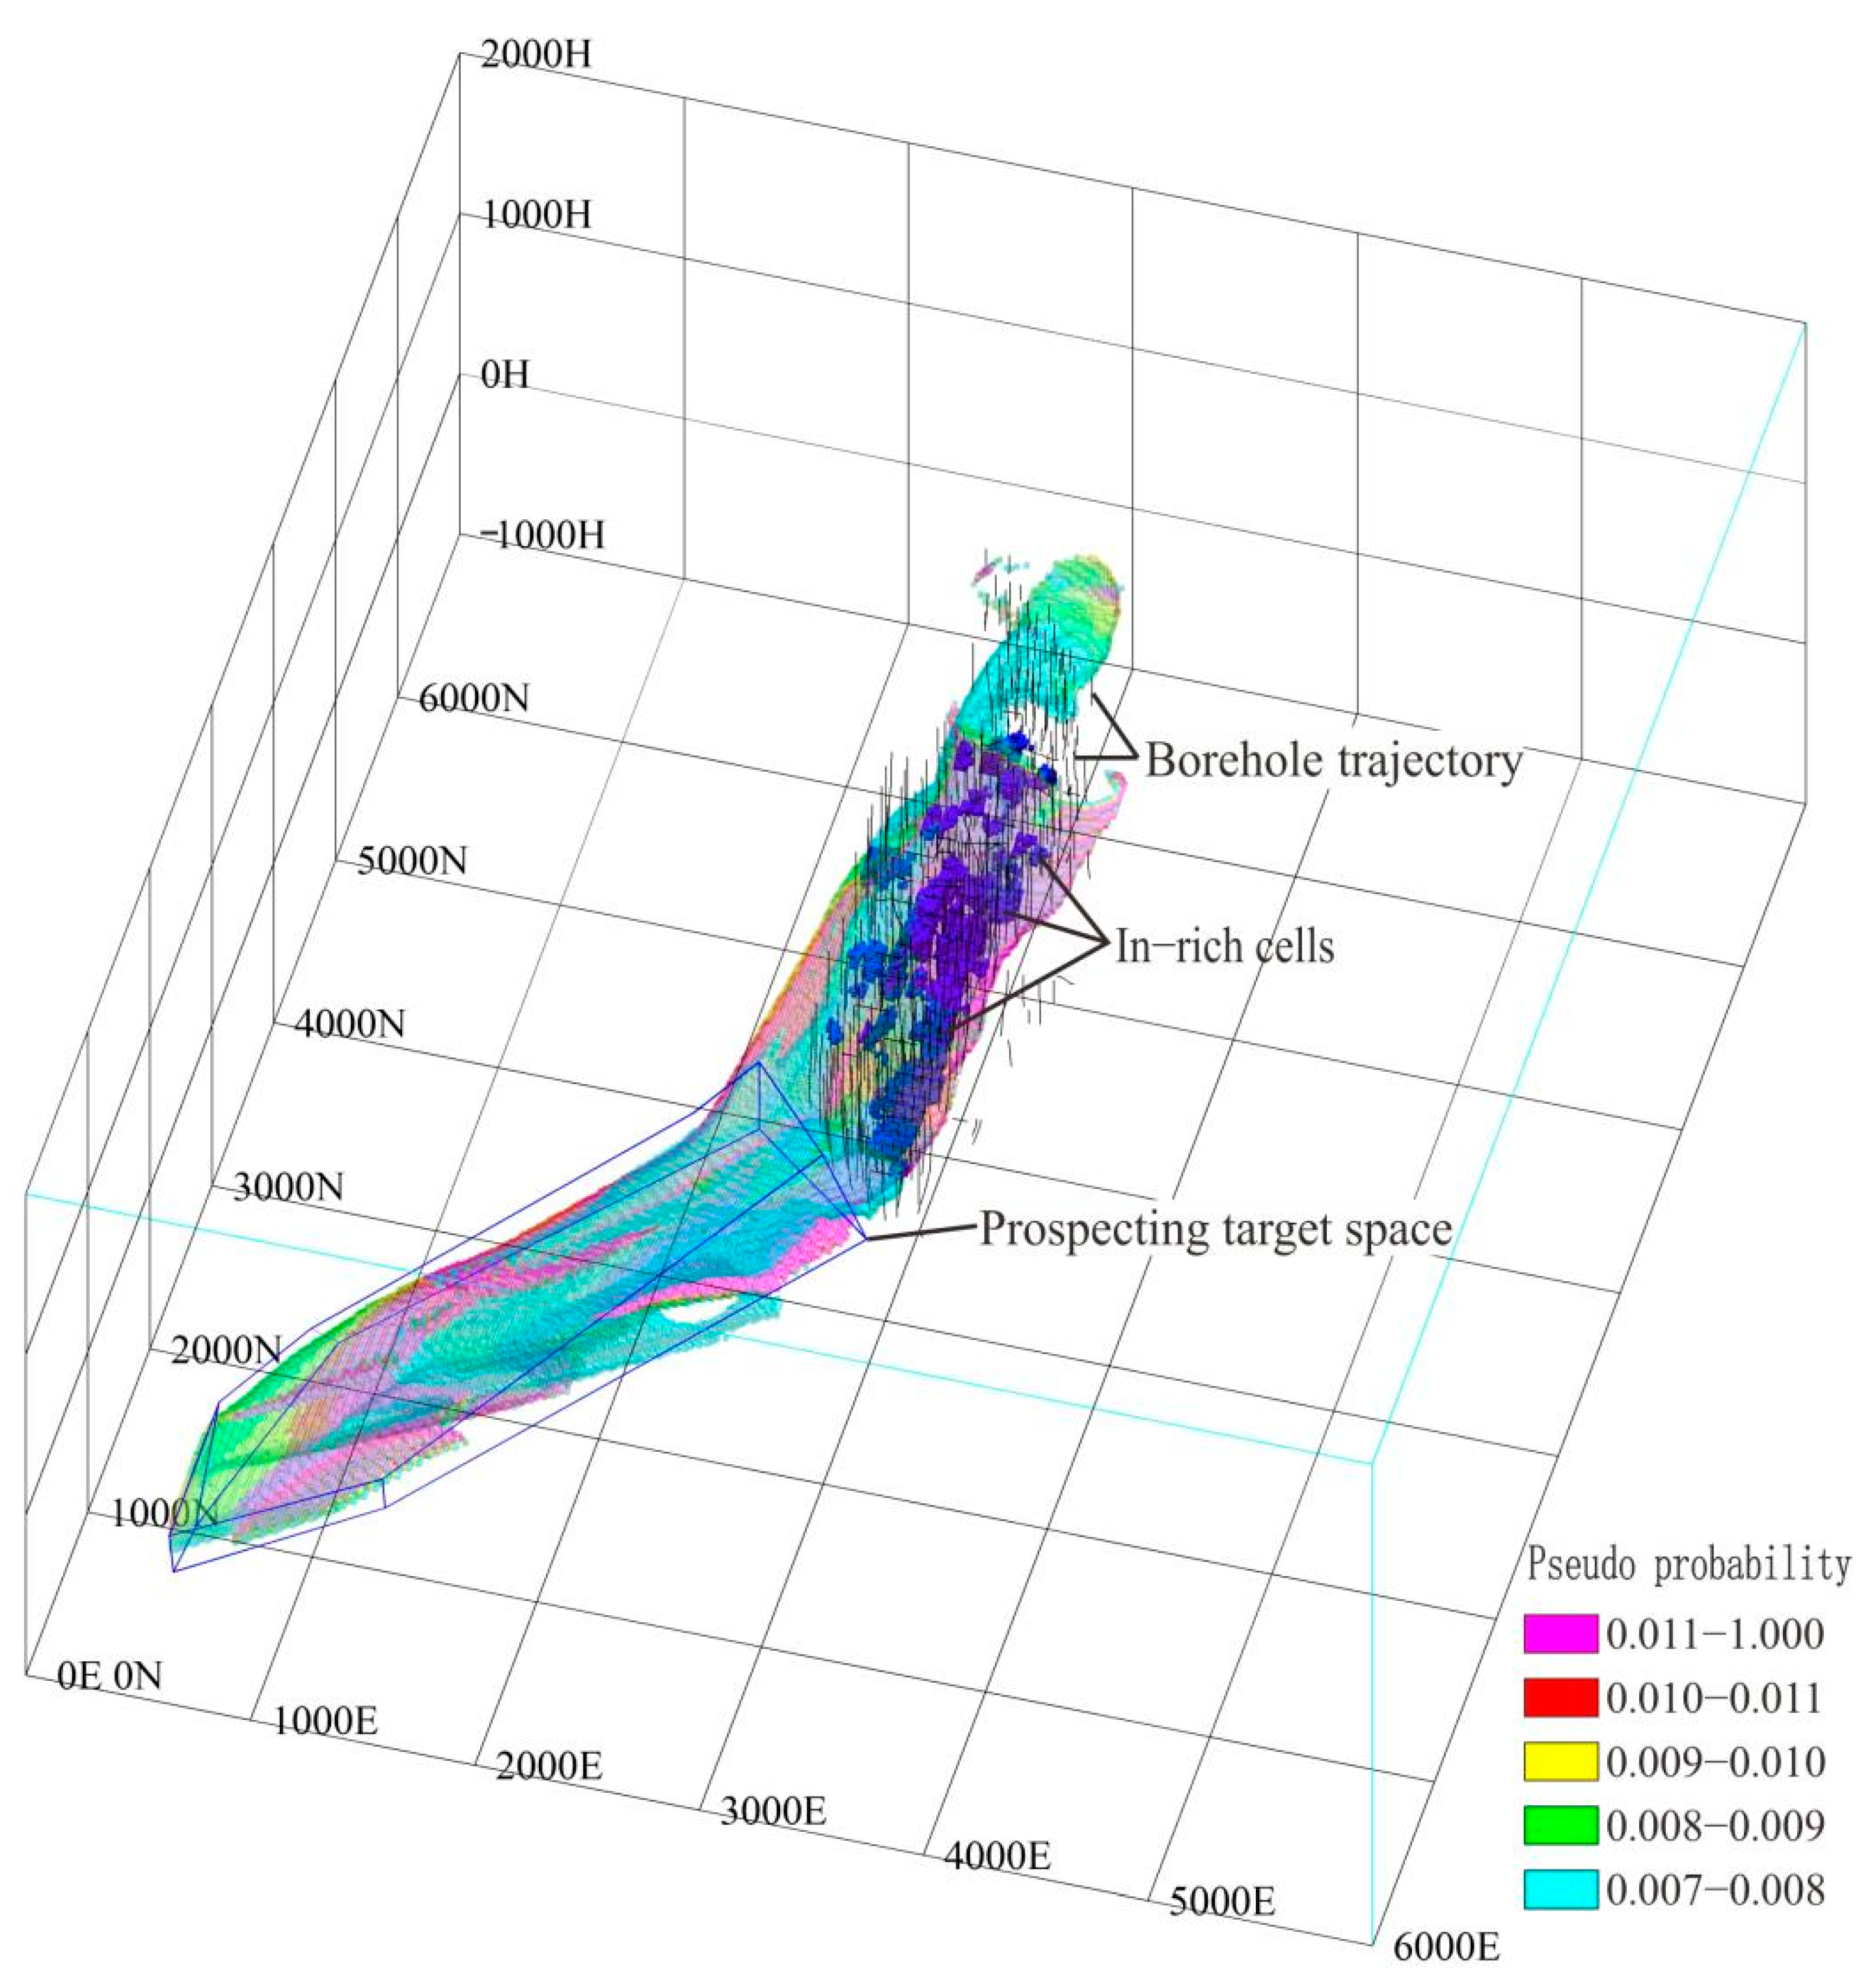
4.2. Metallogenic Prediction by Artificial Neural Network Method

The In-rich attribute of the cell was taken as the dependent variable in the SPSS software, and the distance attribute from the centroid point was taken to the floor surface of the stratum, the fault plane, the granite porphyry, and the granite roof as the covariate. Additionally, the multilayer perceptron was used to predict the mineralization by the artificial neural network method.
The software evaluated the importance of each geological variable when performing the artificial neural network metallogenic prediction (Figure 6). The results show that the faults (F1, 0.349), the Xinzhai Formation (Pt3x, 0.286), and Silurian granites (S3L, 0.199), had a greater impact on the metallogenic prediction.
Because the In-rich attributes of the cells are the categorical dependent variables (1 and 0 represent the In-rich and non-In-rich cells, respectively), the prediction result is the pseudo-probability of the In-rich cell (the In-rich attribute is 1). A total of 379,647 pseudo-probability values were obtained through the calculations, with the minimum, maximum and mean values of 0.000, 0.392, and 0.102, respectively, a variance of 0.000, and a standard deviation of 0.016. Using ROC curve analysis and taking the pseudo-probability as the test variable to determine whether it belonged to the In-rich cell as the state variable suggested that the optimal prediction boundary of the pseudo-probability for the In-rich ore bodies was 0.007. A total of 215,723 unit blocks (pseudo-probability > 0.007) were obtained according to the prediction boundary, among which 3287 unit blocks belonged to indium-rich unit blocks. The high pseudo-probability of In-rich ore bodies in the prediction model was mainly distributed in the In-rich and the southwest cells of the mining area. The deep space in the southwest of the mining area can be used as a prospecting target space (Figure 7).

5. Discussion

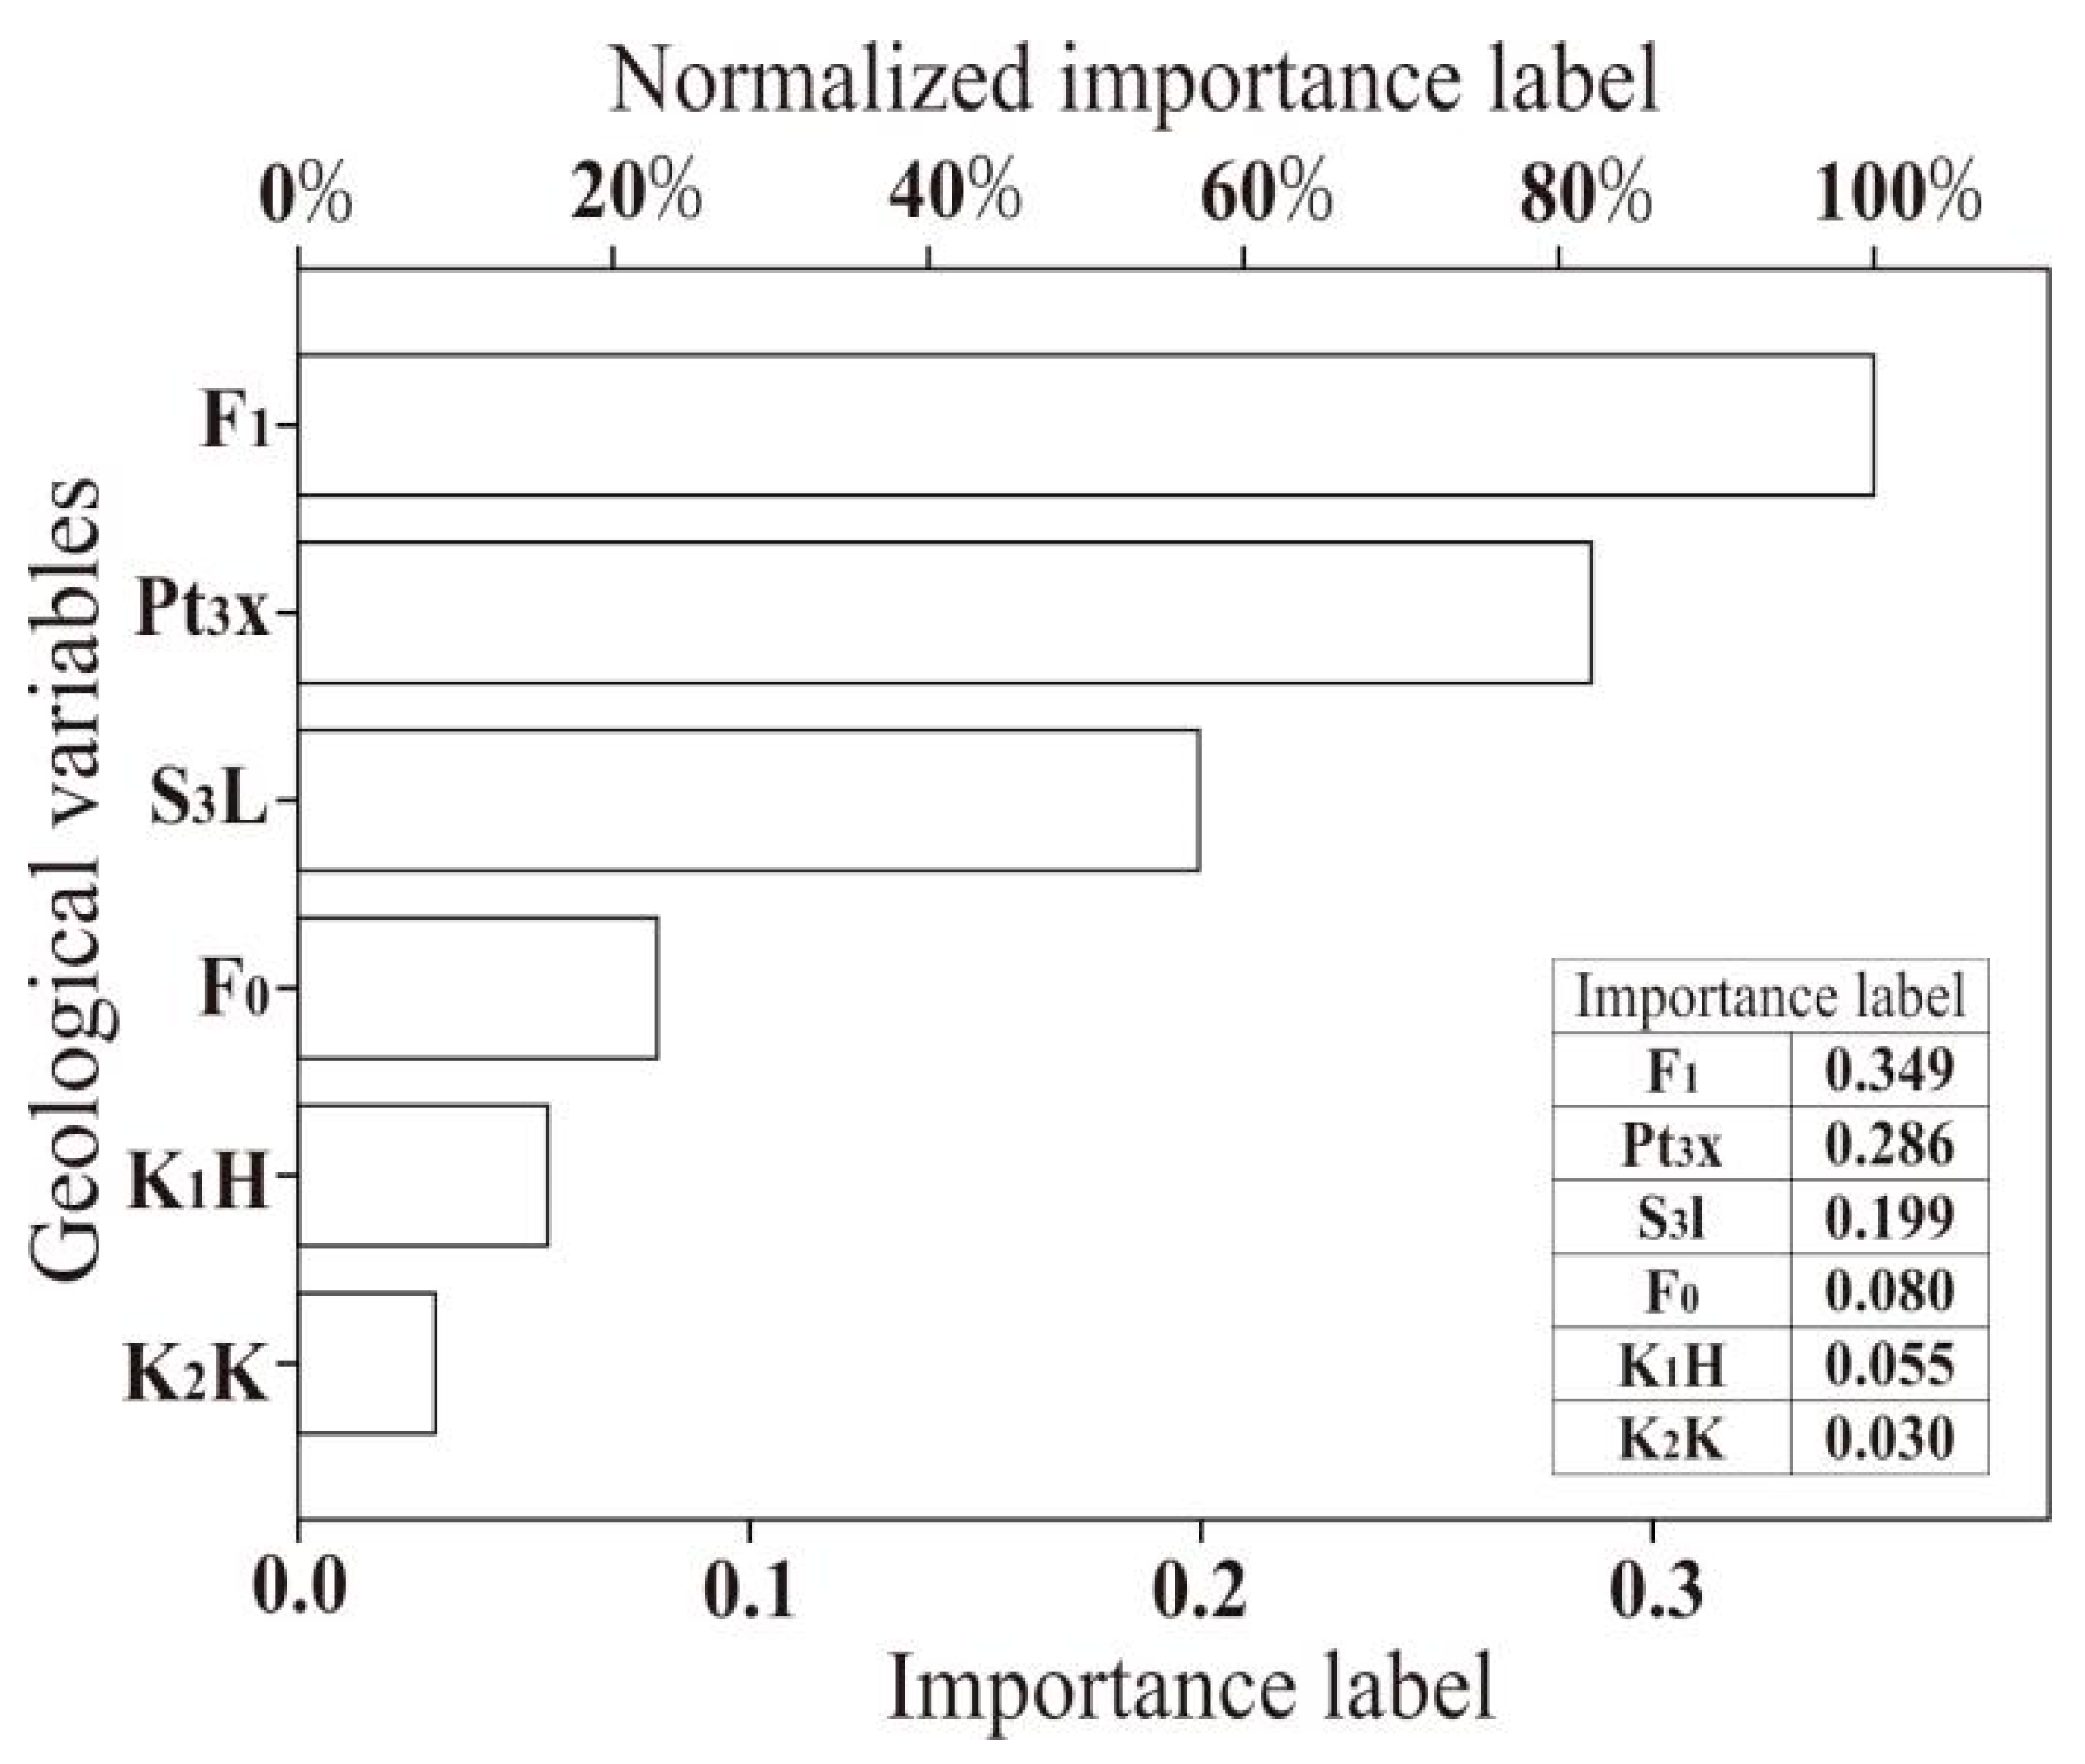
5.1. Considerable Ore-Controlling Geological Factor

The weight of evidence method reflects the importance of geological factors in a given zoning interval through the contrast C value. The artificial neural network method takes the geological factors involved in the prediction as the dependent variable and evaluates its importance. The Neoproterozoic Xinzhai Formation (Pt3x), fault F1, and Silurian granite (S3L) are of great significance for metallogenic predictions based on the evaluation results of this study regarding the importance of the two methods to geological factors.
The main ore bodies of the Dulong Sn-Zn polymetallic deposit are parallel to the strata layers of the Neoproterozoic Xinzhai Formation (Pt3x), and they are prone to skarnization and the formation of industrial ore bodies in the contact zone between carbonate and clastic rocks. Therefore, the control effects of the fixed horizon and lithofacies combination space are conducive to the selective metasomatism and mineralization of ore-bearing hydrothermal fluids.
The hanging wall and footwall of the fault (F1) are the main spaces for ore-body occurrence. Some studies have believed that the fault is an ore-conducting and ore-hosting structure. Therefore, the F1 fault plane and the surrounding space are favorable for metallization.
The results of the evidence weight and artificial neural network methods show that the Silurian granite (S3L) is promising for prospecting, which may be related to the composite of various geological interfaces in the mining area’s Cretaceous granite roof. The interface surface is also the floor of the Xinzhai Formation and the plane of fault (F0). Above, the control effect of the Xinzhai Formation on mineralization was described. The upper part of the fault (F0) is the ore bodies’ occurrence space, and the lower part has no ore. The fault plane acts as a geochemical barrier to the ore-forming fluids. The space above the Cretaceous granite roof is favorable for mineralization.
In addition, the cassiterite U-Pb ages of the deposit are 82.0–96.6 Ma [35], which are close to the ages of Cretaceous granites and granite porphyries (K1H and K2K). Hence, the Cretaceous granites play a considerable role in mineralization. However, there are fewer occurrences of ore bodies in contact zones of the Cretaceous granites and granite porphyries (K1H and K2K). For example, the zoning statistical results of the evidence weight method show that the contrast C value of the zoning interval of Cretaceous granite (K1H) 0–300 m from the granite roof is not high (Table 1), while the most favorable space for mineralization reflected by the contrast is the zoning interval of 400–550 m from the granite roof. Therefore, the evidence and neural network methods mainly consider the spatial position relationship between the geological factors and the ore bodies. The prospecting target areas delineated by these two methods reflect the spatial coupling of various geological factors.

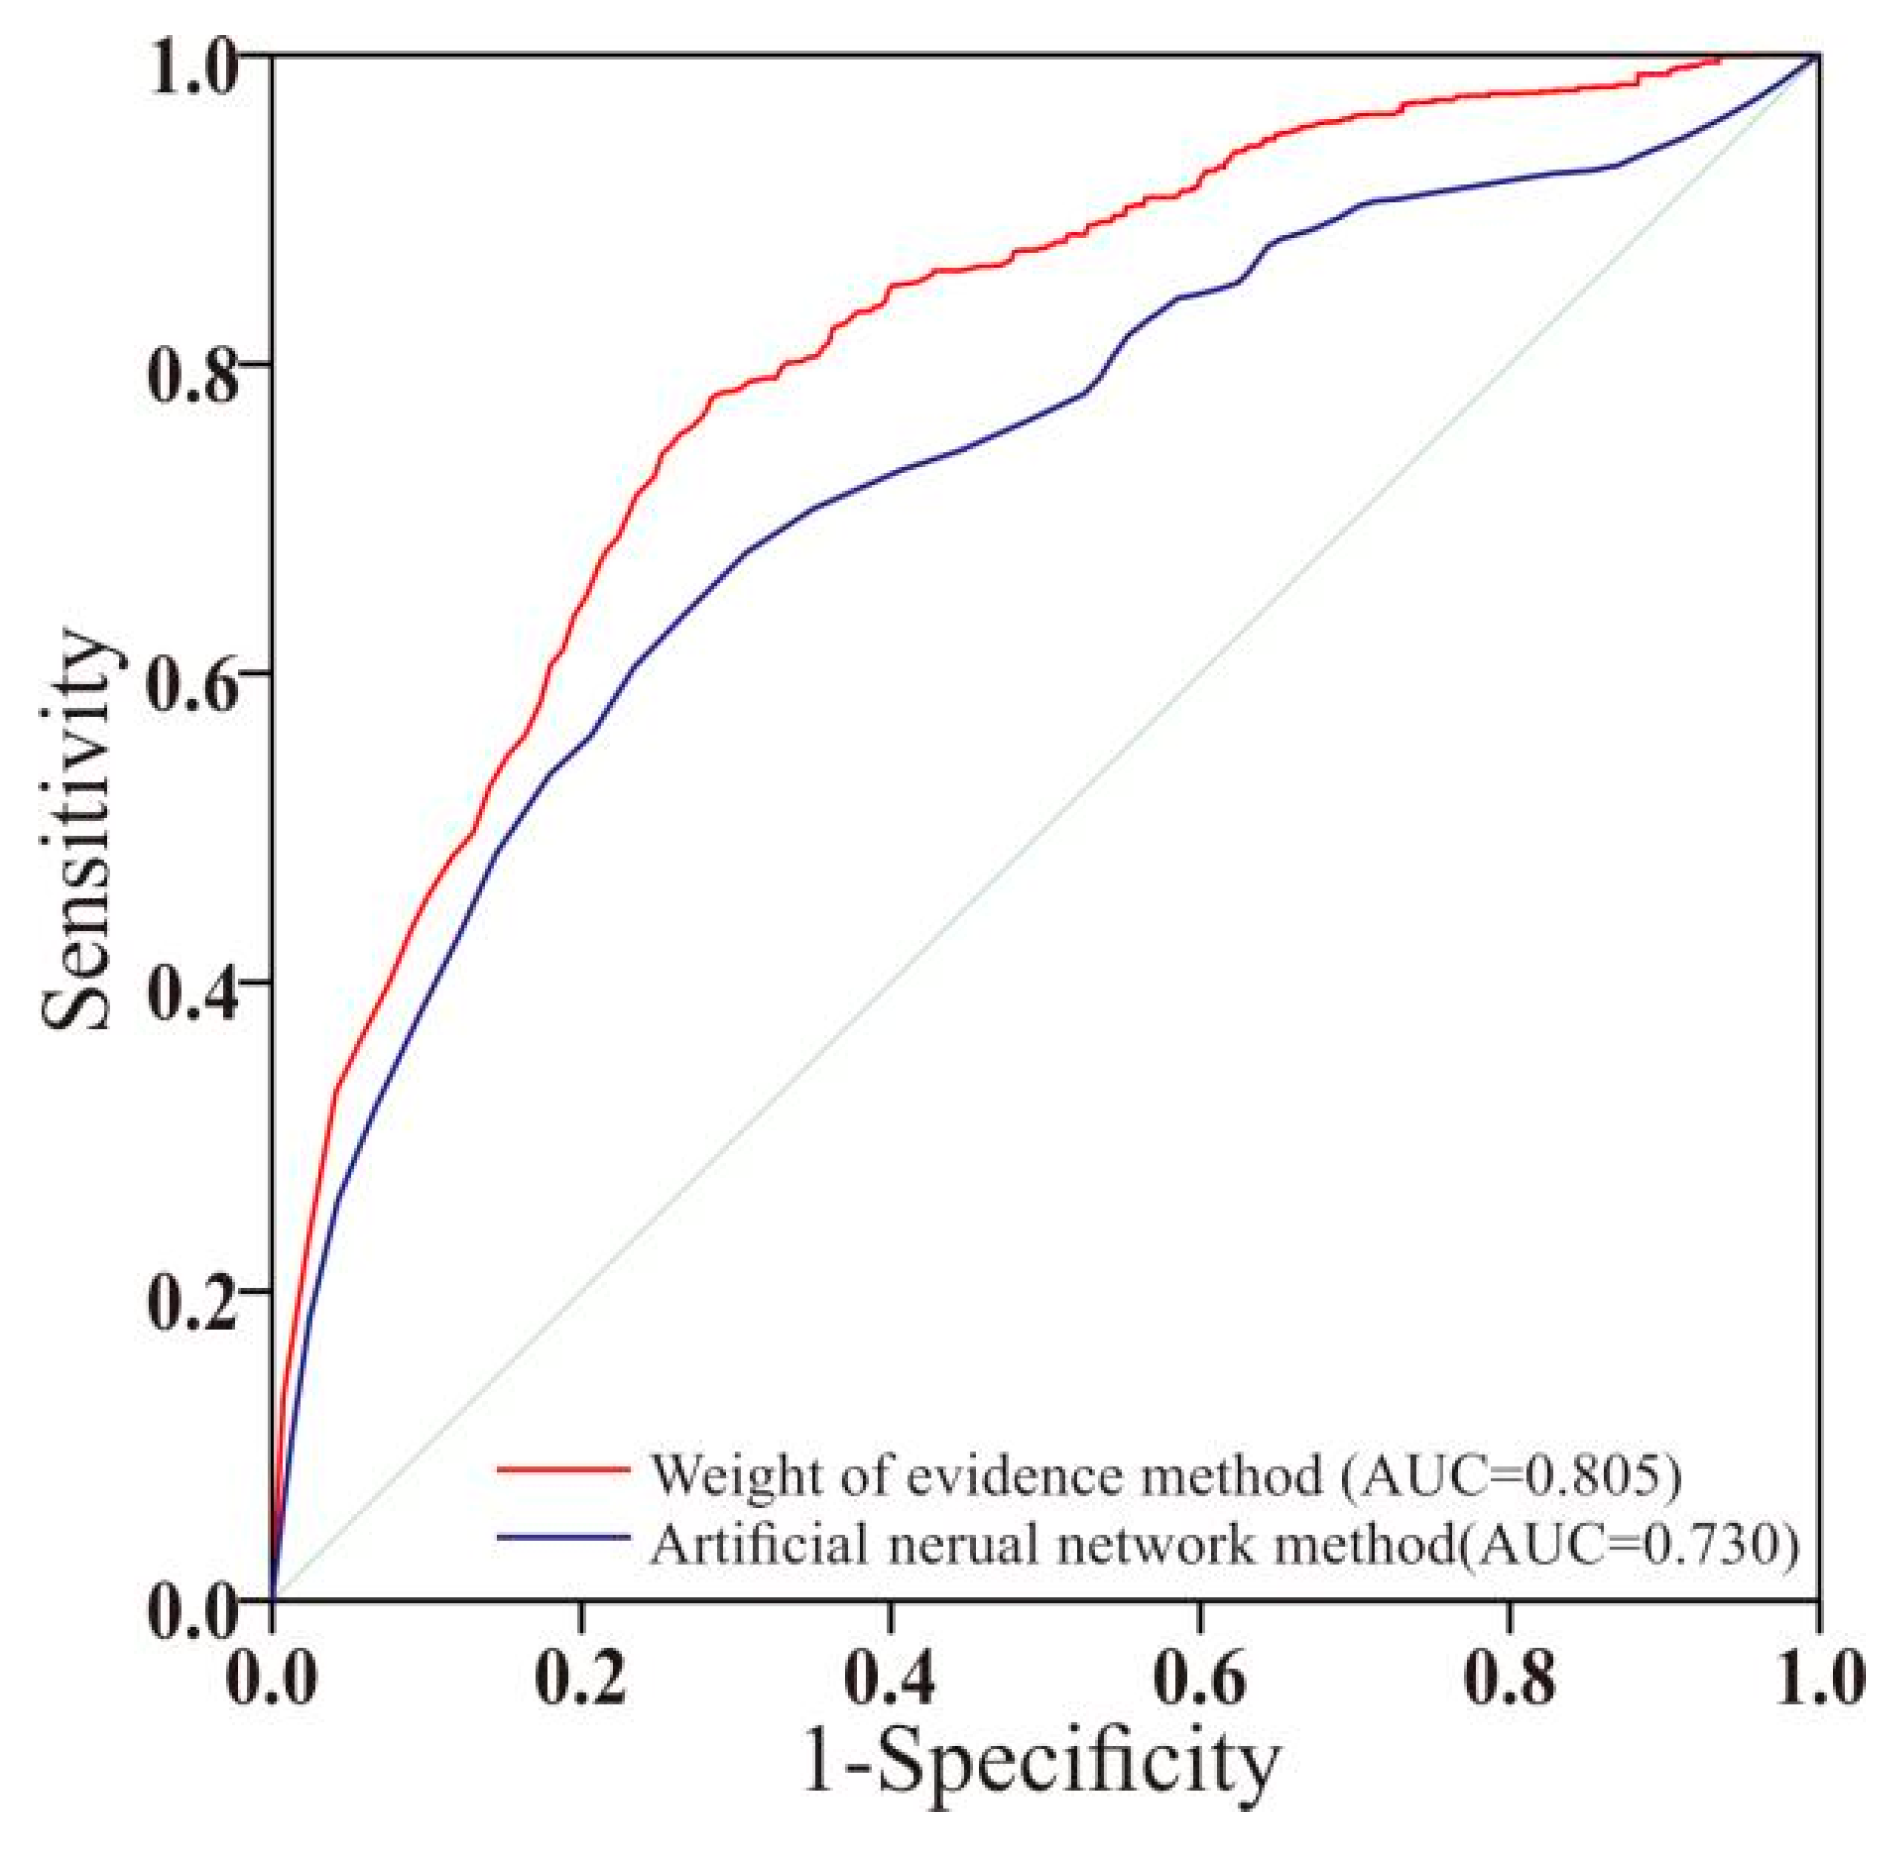
5.2. Comparison of Forecasting Methods

The area under the ROC curve (AUC) is a considerable evaluation index, and its probability value is between 0.00 and 1.00. It can intuitively and quantitatively evaluate the quality of the prediction model by combining it with the shape of the ROC curve. An AUC = 0.50 indicates that the classifier is similar to a random guess with no predictive value, while AUC = 1.0 indicates a perfect classifier [36].
According to the prediction results, the weight of evidence and artificial neural network methods were gathered, the posterior probability P p o s and pseudo-probability values are the test variables, and whether it belongs to the In-rich cell determines its use as the state variable to draw the ROC curve (Figure 8). The results show that the AUC values of the evidence weight and artificial neural network methods are 0.805 and 0.730, respectively. However, the weight of evidence method’s prediction capability is better than that of the artificial neural network method. It is speculated that the weight of evidence method carried out detailed zoning for each geological factor’s buffer zone and excluded the influence of low-contrast zoning on the metallogenic prediction. The prospecting space predicted by the two methods was basically the same (Figure 6 and Figure 7).

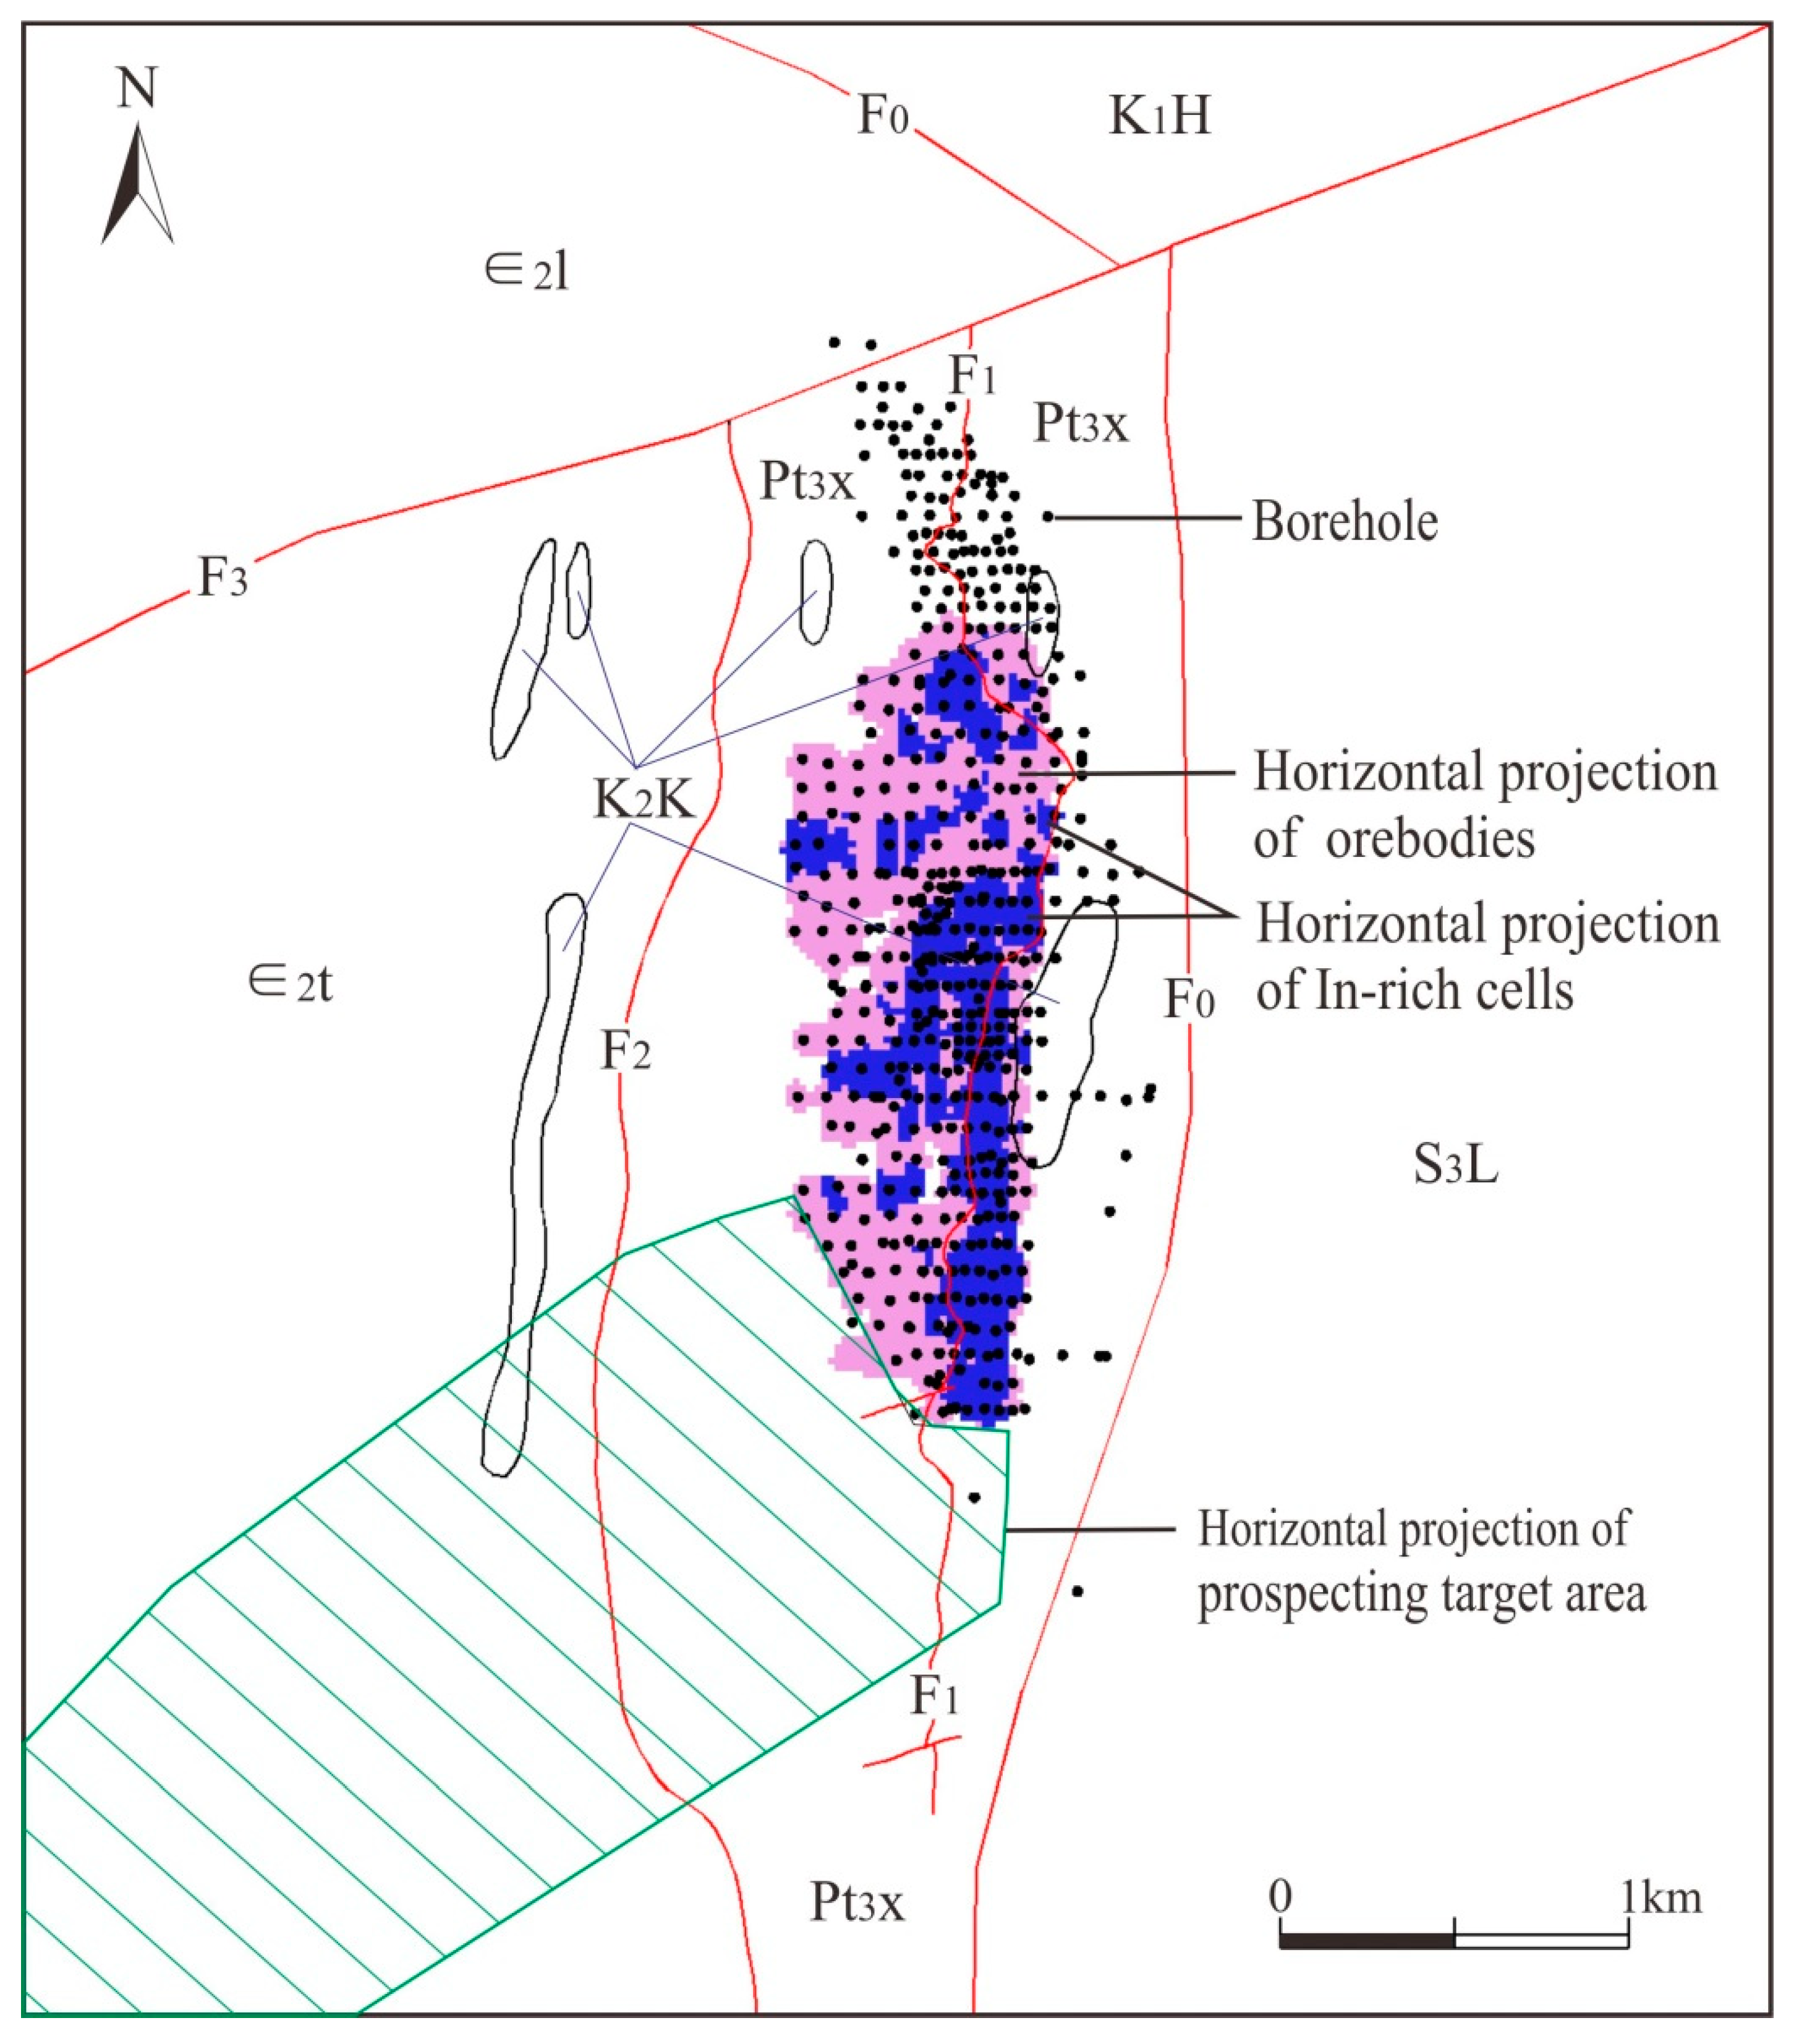
5.3. Prospecting Target Area

The geological variables such as strata, structures, and granites in the evaluation range were included by using the weight of evidence and artificial neural network methods. The units with prospecting potential are mainly distributed in the southwest of the mining area through calculation. Therefore, this area was delineated as the prospecting target area of In-rich ore bodies (Figure 9).

6. Conclusions

The results from evaluating ore-controlling geological factors by the weight of evidence and artificial neural network methods show that the Neoproterozoic Xinzhai Formation (Pt3x), fault (F1), and Silurian granites (S3L) have considerable control effects on the occurrence of In-rich ore bodies. The results of the ROC curve evaluation show that the prediction space delineated by the weight of evidence (AUC = 0.805) and artificial neural network methods (AUC = 0.730) has an indicative value for prospecting. The two target delineation methods reflect the spatial coupling of ore-controlling factors. The prospecting target areas obtained for In-rich ore bodies will be informative for future prospecting work in the Dulong mining area.

Author Contributions

Methodology, F.J., Z.S., G.Y., X.S. and C.Y.; formal analysis, F.J., Z.S., Y.Y., G.Y., X.S. and C.Y.; investigation, H.N., J.Y., S.L., L.L. and F.S.; resources, H.N., J.Y., S.L., L.L. and F.S.; data curation, F.J., Z.S., H.N., Y.Y. and G.Y.; writing—original draft preparation, F.J.; funding acquisition, Y.Y. All authors have read and agreed to the published version of the manuscript.

Funding

The research was funded by the National Natural Science Foundation of China (No. 42072094, No. 42162012) and Development Research Center of China Geological Survey (Grant No: DD20190166-2).

Data Availability Statement

Not applicable.

Acknowledgments

We would like to thank Jiaxi Zhou of Yunnan University for his valuable suggestions.

Conflicts of Interest

The authors declare no conflict of interest.

References

  1. Werner, T.T.; Mudd, G.M.; Jowitt, S.M. The world’s by-product and critical metal resources part III: A global assessment of indium. Ore Geol. Rev. 2017, 86, 939–956. [Google Scholar] [CrossRef]
  2. Li, X.F.; Xu, J.; Zhu, Y.T.; Lv, Y.H. Critical minerals of indium: Major ore types and scientific issues. Acta Petrol. Sin. 2019, 35, 3292–3302. [Google Scholar]
  3. Lerouge, C.; Gloaguen, E.; Wille, G.; Bailly, L. Distribution of In and other rare metals in cassiterite and associated minerals in Sn ± W ore deposits of the western Variscan Belt. Eur. J. Mineral. 2017, 29, 739–753. [Google Scholar] [CrossRef] [Green Version]
  4. Li, T.J.; Zhou, L.; Zhao, Y.K.; Zhu, G.S.; Li, H.L. History and present situation of mineral resources exploitation and utilization in dulong mine. Acta Mineral. Sin. 2016, 36, 463–470. [Google Scholar] [CrossRef]
  5. Carranza, E.J.M. Controls on mineral deposit occurrence inferred from analysis of their spatial pattern and spatial association with geological features. Ore Geol. Rev. 2009, 35, 383–400. [Google Scholar] [CrossRef]
  6. Chen, J.P.; Shi, R.; Chen, Z.P.; Wang, L.M.; Sun, Y. 3D positional and quantitative prediction of the Xiaoqinling gold ore belt in Tongguan, Shaanxi, China. Acta Geol. Sin. 2012, 86, 653–660. (In English) [Google Scholar] [CrossRef]
  7. Payne, C.E.; Cunningham, F.; Peters, K.J.; Nielsen, S.; Puccioni, E.; Wildman, C.; Partington, G.A. From 2D to 3D: Prospectivity modelling in the Taupo Volcanic Zone, New Zealand. Ore Geol. Rev. 2014, 71, 558–577. [Google Scholar] [CrossRef]
  8. Li, X.H.; Yuan, F.; Zhang, M.M.; Jia, C.; Jowitt, S.M.; Ord, A.; Zheng, T.K.; Hu, X.Y.; Li, Y. Three-dimensional mineral prospectivity modeling for targeting of concealed mineralization within the Zhonggu iron orefield, Ningwu Basin, China. Ore Geol. Rev. 2015, 71, 633–654. [Google Scholar] [CrossRef]
  9. Nielsen, S.H.H.; Cunningham, F.; Hay, R.; Partington, G.; Stokes, M. 3D prospectivity modelling of orogenic gold in the Marymia Inlier, Western Australia. Ore Geol. Rev. 2015, 71, 578–591. [Google Scholar] [CrossRef]
  10. Wang, G.W.; Li, R.X.; Carranza, E.J.M.; Zhang, S.T.; Yan, C.H.; Zhu, Y.Y.; Qu, J.N.; Hong, D.M.; Song, Y.W.; Han, J.W.; et al. 3D geological modeling for prediction of subsurface Mo targets in the Luanchuan district, China. Ore Geol. Rev. 2015, 71, 592–610. [Google Scholar] [CrossRef]
  11. Xiao, K.Y.; Li, N.; Porwal, A.; Holden, E.J.; Bagas, L.; Lu, Y.J. Gis-based 3D prospectivity mapping: A case study of Jiama copper-polymetallic deposit in Tibet, China. Ore Geol. Rev. 2015, 71, 611–632. [Google Scholar] [CrossRef]
  12. Mao, X.C.; Zhang, B.; Deng, H.; Zou, Y.H.; Chen, J. Three-dimensional morphological analysis method for geologic bodies and its parallel implementation. Comput. Geosci. 2016, 96, 11–22. [Google Scholar] [CrossRef]
  13. Hu, X.Y.; Yuan, F.; Li, X.H.; Jowitt, S.M.; Jia, C.; Zhang, M.M.; Zhou, T.F. 3D characteristic analysis-based targeting of concealed Kiruna-type Fe oxide-apatite mineralization within the Yangzhuang deposit of the Zhonggu orefield, southern Ningwu volcanic basin, middle-lower Yangtze River metallogenic Belt, China. Ore Geol. Rev. 2018, 92, 240–256. [Google Scholar] [CrossRef]
  14. Li, R.X.; Wang, G.W.; Carranza, E.J.M. GeoCube: A 3D mineral resources quantitative prediction and assessment system. Comput. Geosci. 2016, 89, 161–173. [Google Scholar] [CrossRef]
  15. Yang, F.; Wang, G.W.; Santosh, M.; Li, R.X.; Tang, L.; Cao, H.W.; Guo, N.N.; Liu, C. Delineation of potential exploration targets based on 3d geological modeling: A case study from the laoangou pb-zn-ag polymetallic ore deposit, china. Ore Geol. Rev. 2017, 89, 228–252. [Google Scholar] [CrossRef]
  16. Mao, X.C.; Ren, J.; Liu, Z.K.; Chen, J.; Tang, L.; Deng, H.; Bayless, R.C.; Yang, B.; Wang, M.J.; Liu, C.M. Three-dimensional prospectivity modeling of the Jiaojia-type gold deposit, Jiaodong peninsula, eastern China: A case study of the Dayingezhuang deposit. J. Geochem. Explor. 2019, 203, 27–44. [Google Scholar] [CrossRef]
  17. Zhang, M.M.; Zhou, G.Y.; Shen, L.; Zhao, W.G.; Liao, B.S.; Yuan, F.; Li, X.H.; Hu, X.Y.; Wang, C.B. Comparison of 3D prospectivity modeling methods for Fe-Cu skarn deposits: A case study of the Zhuchong Fe-Cu deposit in the Yueshan orefield (Anhui), eastern China. Ore Geol. Rev. 2019, 114, 103126. [Google Scholar] [CrossRef]
  18. Mohammadpour, M.; Bahroudi, A.; Abedi, M. Three dimensional mineral prospectivity modeling by evidential belief functions, a case study from kahang porphyry cu deposit. J. Afr. Earth Sci. 2021, 174, 104098. [Google Scholar] [CrossRef]
  19. Bonham-Carter, G.F.; Agterberg, F.P.; Wright, D.F. Weights of evidence modeling: A new approach to mapping mineral potential. Stat. Appl. Earth Sci. 1990, 89, 171–183. [Google Scholar]
  20. Agterberg, F.P.; Bonham-Carter, G.F.; Cheng, Q.M.; Wright, D.F. Weights of evidence modeling and weighted logistic regression for mineral potential mapping. Comput. Geol. 1993, 25, 13–32. [Google Scholar] [CrossRef]
  21. Brown, W.M.; Gedeon, T.D.; Groves, D.I.; Barnes, R.G. Artificial neural networks: A new method for mineral prospectivity mapping. J. Aust. Earth Sci. 2000, 47, 757–770. [Google Scholar] [CrossRef]
  22. Porwal, A.; Gonzalez-Alvarez, I.; Markwitz, V.; McCuaig, T.C.; Mamuse, A. Weights-of-evidence and logistic regression modeling of magmatic nickel sulfide prospectivity in the Yilgarn Craton, Western Australia. Ore Geol. Rev. 2010, 38, 184–196. [Google Scholar] [CrossRef]
  23. Yang, G.S.; Wang, K.; Yan, Y.F.; Jia, F.J.; Li, P.Y.; Mao, Z.B.; Zhou, Y. Genesis of the ore-bearing skarns in Laojunshan Sn-W-Zn-In polymetallic ore district, southeastern Yunnan Province, China. Acta Petrol. Sin. 2019, 35, 3333–3354. [Google Scholar] [CrossRef]
  24. Peng, T.P.; Fan, W.M.; Zhao, G.C.; Peng, B.X.; Xia, X.P.; Mao, Y.S. Petrogenesis of the Early Paleozoic strongly peraluminous granites in the western South China Block and its tectonic implications. J. Asinan Earth Sci. 2015, 98, 399–420. [Google Scholar] [CrossRef]
  25. Feng, J.R.; Mao, J.W.; Pei, R.F. Ages and geochemistry of Laojunshan granites in southeastern Yunnan, China: Implications for W-Sn polymetallic ore deposits. Mineral. Petrol. 2013, 107, 573–589. [Google Scholar] [CrossRef]
  26. Yan, D.P.; Zhou, M.F.; Wang, Y.; Wang, C.L.; Zhao, T.P. Structural styles and chronological evidences from Dulong-Song Chay tectonic dome: Earlier spreading of south china sea basin due to late mesozoic to early cenozoic extension of south china block. Earth Sci. 2005, 30, 402–412. [Google Scholar]
  27. Yan, D.P.; Zhou, M.F.; Wang, C.Y.; Xia, B. Structural and geochronological constraints on the tectonic evolution of the Dulong-Song Chay tectonic dome in Yunnan province, SW China. J. Asian Earth Sci. 2006, 28, 332–353. [Google Scholar] [CrossRef]
  28. Murakami, H.; Ishihara, S. Trace elements of Indium-bearing sphalerite from tin-polymetallic deposits in Bolivia, China and Japan: A femto-second LA-ICPMS study. Ore Geol. Rev. 2013, 53, 223–243. [Google Scholar] [CrossRef]
  29. Liu, S.; Xue, L.; Qie, R.; Zhang, X.; Meng, Q. An application of GIS-based weights of evidence for gold prospecting in the northwest of Heilongjiang Province. J. Jilin Univ. (Earth Sci. Ed.) 2007, 37, 889–894. [Google Scholar] [CrossRef]
  30. Schaeben, H. A mathematical view of weights-of-evidence, conditional independence, and logistic regression in terms of Markov random fields. Math. Geosci. 2004, 46, 691–709. [Google Scholar] [CrossRef]
  31. Lindsay, M.D.; Betts, P.G.; Ailleres, L. Data fusion and porphyry copper prospectivity models, southeastern Arizona. Ore Geol. Rev. 2014, 61, 120–140. [Google Scholar] [CrossRef]
  32. Shao, Y.J.; He, H.; Zhang, Y.Z.; Liang, E.Y.; Ding, Z.W.; Chen, X.L.; Liu, Z.F. Metallogenic prediction of Xiangxi gold deposit based on BP neural networks. J. Cent. South Univ. Sci. Technol. 2007, 12, 38-06. [Google Scholar] [CrossRef]
  33. Li, S.M.; Yao, S.Z.; Zhou, Z.G. Research on quantitative prediction of mineral resources. Contrib. Geol. Miner. Resour. Res. 2007, 3, 22-01. [Google Scholar] [CrossRef]
  34. Bonham-Carter, G.F.; Agterberg, F.P.; Wright, D.F. Integration of geological datasets for gold exploration in Nova Scotia. Digit. Geol. Geogr. Inf. Syst. 1988, 10, 15–23. [Google Scholar] [CrossRef] [Green Version]
  35. Wang, X.J.; Liu, Y.P.; Miao, Y.L.; Bao, T.; Ye, L.; Zhang, Q. In-situ LA-MC-ICP-MS cassiterite U-Pb dating of Dulong Sn-Zn polymetallic deposit and its significance. Acta Petrol. Sin. 2014, 30, 867–876. [Google Scholar]
  36. Lee, S.; Dan, N.T. Probabilistic landslide susceptibility mapping in the Lai Chau Province of Vietnam: Focus on the relationship between tectonic fractures and landslides. Environ. Geol. 2005, 48, 778–787. [Google Scholar] [CrossRef]
Figure 1. Geotectonic location and regional geological map (modified using Ref. [23]). (a) The geotectonic location of the Dulong Sn-Zn polymetallic deposit; (b) The regional geological map of the Dulong Sn-Zn polymetallic deposit. 1—Triassic mudstone and tuff; 2—Permian siliceous rocks and mudstones; 3—Devonian carbonate rocks; 4—Upper Cambrian dolomite and limestone; 5—Middle Cambrian dolomite and phyllite; 6—Upper Proterozoic marble and schist; 7—Lower Proterozoic schist and granulite; 8—Cretaceous granite; 9—Silurian gneiss granite; 10—fault; 11—deposit; 12—3D geological modeling area.
Minerals 12 01591 g001
Figure 2. Geology and In-rich ore bodies model in Dulong mining area. (a) Geological model of mining area; (b) Faults and ore bodies model; (c) Indium-grade log–log plot of ore bodies; (d) Faults and In-rich ore bodies model. ∈2l—Middle Cambrian Longha Formation; ∈2t—Middle Cambrian Tianpeng Formation; Pt3x—Neoproterozoic Xinzhai Formation; K1H—Cretaceous granite; K2K—Cretaceous granite porphyry; S3L—Silurian granite; F0-F3—Fault number.
Minerals 12 01591 g002
Figure 3. Feedforward architecture of artificial neural networks (modified using Ref. [21]).
Minerals 12 01591 g003
Figure 4. Ore-controlling geological factors and 3D buffer zone. (a) Buffer zone of Neoproterozoic Xinzhai Formation (Pt3x); (b,c) Buffer zone of faults (F0 and F1); (df) Buffer zone of granite porphyries and granites (K2K, K1H, and S3L).
Minerals 12 01591 g004
Figure 5. Metallogenic prediction map of weight of evidence method ( P p o s > 0.820).
Minerals 12 01591 g005
Figure 6. Evaluation results of geological variables by artificial neural network method.
Minerals 12 01591 g006
Figure 7. Metallogenic prediction map of artificial neural network method (prediction probability of indium-rich cell > 0.007).
Minerals 12 01591 g007
Figure 8. ROC curve graph about prediction results.
Minerals 12 01591 g008
Figure 9. Metallogenic prediction map of indium-rich ore bodies. ∈2l—Middle Cambrian Longha formation; ∈2t—Middle Cambrian Tianpeng formation; Pt3x—Neoproterozoic Xinzhai formation; K1H—Cretaceous granite; K2K—Cretaceous granite porphyry; S3L—Silurian granite.
Minerals 12 01591 g009
Table 1. Statistical table of geological variable weight scores.
Geological VariablesDistance IntervalNumber of Ore Blocks in Zone Number of no Ore Blocks in ZoneNumber of Ore Blocks Outside ZoneNumber of no Ore Blocks Outside Zone W + W Contrast CSort
Xinzhai formation
(Pt3x)
0~5010264,36336507,926,5851.2165 −0.0195 1.2359 39
50~10080266,55029507,924,3983.2452 −0.2321 3.4773 6
100~150135564,91823977,926,0303.7945 −0.4399 4.2344 1
150~20068166,04830717,924,9003.0892 −0.1920 3.2812 9
200~25055767,49631957,923,4522.8665 −0.1522 3.0187 11
250~30024970,51335037,920,4352.0177 −0.0598 2.0775 21
300~350673,40037467,917,548−1.7481 0.0076 −1.7558 58
Fault
(F0)
0~503094,83137227,896,117−0.3949 0.0039 −0.3988 54
50~100141110,66836117,880,2800.9982 −0.0244 1.0226 41
100~150274113,66034787,877,2881.6359 −0.0615 1.6974 30
150~200770119,64029827,871,3082.6179 −0.2146 2.8325 13
200~250837125,07629157,865,8722.6569 −0.2366 2.8936 12
250~300589132,55231637,858,3962.2475 −0.1540 2.4015 18
300~350334138,23134187,852,7171.6382 −0.0758 1.7140 29
350~400445145,11533077,845,8331.8766 −0.1079 1.9845 23
400~450303150,81134497,840,1371.4537 −0.0652 1.5189 34
450~50029158,08137237,832,867-0.9398 0.0122 −0.9520 57
Fault
(F1)
0~5088682,66128667,908,2873.1280 −0.2590 3.3870 7
50~10095293,39728007,897,5513.0777 −0.2809 3.3586 8
100~150117099,85925827,891,0893.2170 −0.3611 3.5782 4
150~200664107,69330887,883,2552.5750 −0.1812 2.7562 16
200~25080114,69136727,876,2570.3958 −0.0071 0.4029 48
Cretaceous granite porphyry
(K2K)
0~5082218,80136707,772,147−0.2254 0.0057 −0.2311 53
50~100346163,91534067,827,0331.5031 −0.0760 1.5791 32
100~150475172,75032777,818,1981.7675 −0.1135 1.8810 24
150~200385198,48433677,792,4641.4186 −0.0831 1.5017 36
200~250333221,36334197,769,5851.1644 −0.0648 1.2292 40
250~300523236,70732297,754,2411.5488 −0.1200 1.6688 31
300~350450230,61333027,760,3351.4245 −0.0985 1.5230 33
350~400263224,86034897,766,0880.9127 −0.0441 0.9568 42
400~450182226,48235707,764,4660.5374 −0.0210 0.5583 45
450~500157229,88135957,761,0670.3747 −0.0136 0.3883 49
500~550190229,62435627,761,3240.5666 −0.0228 0.5894 44
550~600171233,34435817,757,6040.4452 −0.0170 0.4622 47
600~65094233,38736587,757,561−0.1534 0.0043 −0.1577 52
Cretaceous granite
(K1H)
0~5043177,98937097,812,959−0.6645 0.0110 −0.6755 55
50~100108186,99436447,803,9540.2071 −0.0055 0.2126 51
100~150413173,08633397,817,8621.6257 −0.0947 1.7204 28
150~200317162,44734357,828,5011.4246 −0.0677 1.4923 37
200~250136153,94736167,837,0010.6321 −0.0175 0.6495 43
250~300246147,64335067,843,3051.2666 −0.0492 1.3157 38
300~350386142,93733667,848,0111.7495 −0.0905 1.8400 26
350~400382137,89033707,853,0581.7750 −0.0900 1.8650 25
400~450527132,02832257,858,9202.1402 −0.1347 2.2749 20
450~500550124,88432027,866,0642.2386 −0.1428 2.3813 19
500~550391118,22033617,872,7281.9522 −0.0951 2.0473 22
550~600229112,18035237,878,7681.4696 −0.0488 1.5185 35
600~65024106,57437287,884,374−0.7348 0.0070 −0.7418 56
Silurian granite
(S3L)
0~503240,70937207,950,2390.5153 −0.0035 0.5188 46
50~10013046,54936227,944,3991.7830 −0.0294 1.8125 27
100~15026344,56234897,946,3862.5313 −0.0671 2.5984 17
150~20075343,85929997,947,0893.5991 −0.2185 3.8176 3
200~25084643,84229067,947,1063.7159 −0.2500 3.9660 2
250~30060443,98131487,946,9673.3758 −0.1700 3.5458 5
300~35031944,44434337,946,5042.7270 −0.0833 2.8103 15
350~40045144,39433017,946,5543.0744 −0.1225 3.1969 10
400~45032344,45934297,946,4892.7391 −0.0844 2.8235 14
450~5003044,38237227,946,5660.3644 −0.0025 0.3668 50
Publisher’s Note: MDPI stays neutral with regard to jurisdictional claims in published maps and institutional affiliations.

