Article

Interaction between PEO and Kaolinite in Flocculating: An Experimental and Molecular-Simulation Study

1
Department of Mineral Processing Engineering, Taiyuan University of Technology, Taiyuan 030024, China
2
State Key Laboratory of Mineral Processing, Beijing 100160, China
*
Author to whom correspondence should be addressed.
Minerals 2022, 12(12), 1585; https://doi.org/10.3390/min12121585
Submission received: 10 November 2022 / Revised: 5 December 2022 / Accepted: 8 December 2022 / Published: 10 December 2022
(This article belongs to the Section Mineral Processing and Extractive Metallurgy)

Abstract

:
In this paper, the flocculation properties of polyethylene oxide (PEO) on kaolinite and the mechanism of adsorption on kaolinite anisotropic substrates were explored. As revealed by the experimental results, the settling rate and removal rate of kaolinite increased with increasing PEO concentration, but too high PEO concentration would cause the small particles to stabilize and become difficult to settle. Furthermore, to probe deep into the interactions between PEO and kaolinite anisotropic substrates, the morphology of adsorbed PEO, interfacial adsorption structure, and dynamic behavior of water molecules were determined by quartz crystal microbalance with dissipation (QCM-D) and molecular dynamics (MD) simulations. The adsorption amount of PEO on different mineral surfaces is in the order of kaolinite > alumina > silica, and the thickness of the adsorption structure formed by alumina is greater than that of silica. As illustrated by the MD simulation results, the adsorption of PEO reduces the concentration of water molecules attached to the kaolinite surface. The PEO forms a double-layer adsorption structure on the 001 surface, while forming a tight monolayer adsorption structure on the 00 1 ¯ surface, weakening the interaction between the surface and the water molecules. The above results demonstrate that the adsorption of PEO effectively weakened the hydration dispersion of kaolinite and promoted the agglomeration of kaolinite particles.

1. Introduction

According to incomplete statistics, in coal mining washing and processing production, each ton of clean coal products will produce 3 m3 of coal wastewater [1], which contains a large number of ultrafine particles, mainly composed of pulverized coal, clay minerals, and silicon oxide solid particles [2]. After flocculation and sedimentation of these wastewaters by adding flocculants, the production circulating water is treated by solid–liquid separation to achieve the recycling of wastewater [3]. The flocculant used in actual production is generally polyacrylamide [4]. However, with the mechanization of coal mining and the deterioration of coal quality, the clay minerals represented by kaolinite in these wastewater have increased [5]. The easy mudding and dispersion of clay minerals make the flocculation and sedimentation effects of traditional flocculants worse [6], and the slime water is difficult to settle and separate, which seriously affects the production water and production efficiency of subsequent processes [7]. Therefore, it is urgent to find a flocculant that can treat clay minerals in high-muddied coal wastewater.
As a nonionic polymer, polyethylene oxide (PEO) has been used in the papermaking industry for wastewater flocculation and mineral separation because of its non-reactivity, water solubility, and low toxicity [8,9,10,11,12,13]. At the same time, PEO is an efficient flocculant in mineral flotation and oxidized mineral flocculation [14,15], especially for kaolinite flocculation [10]. PEO is adsorbed at the solid–liquid interface by hydrogen bonding due to its non-ionic properties [16,17]. It is believed that the adsorption of PEO requires a certain degree of surface hydroxylation and water repellency on the solid surface [18]. Moreover, PEO has the hydrophobic properties generated by the vinyl group structure, and hydrophobic association is considered to be another mechanism for the interaction between PEO and particles [19,20]. Kaolinite is a layered mineral with a 1:1 aluminum–oxygen octahedron and a silicon–oxygen tetrahedron structure [21]. Studies have shown that PEO can induce a stronger degree of kaolinite face-to-face aggregation during the process of kaolinite flocculating [22]. However, the adsorption mechanism of PEO on kaolinite is still unclear; in particular, the interactions between PEO and the aluminum–oxygen and silicon–oxygen surfaces in the kaolinite structure still needs further studies.
Quartz crystal microbalance with dissipation (QCM−D) technology can provide qualitative and quantitative information on the conformation and density changes of polymers at the solid–liquid interface [23,24]. Zou et al., used QCM−D to study the adsorption of self-made hydrophobically modified polyacrylamide on silica coating (simulated silicon–oxygen base surface) and alumina coating (simulated aluminum–oxygen base surface), so as to distinguish the adsorption difference of kaolinite anisotropic base surfaces [25]. Wang et al., used QCM−D to determine the adsorption kinetics of organic–inorganic hybrid polymers on silica and alumina, as representative of T- and O-basal planes of kaolinite [26]. It is well known that molecular simulation is a method to study the surface properties of polymers and minerals at an atomic level. At present, the research on the structure, hydrodynamic radius, and shape anisotropy of PEO has been completed by molecular dynamics simulation [27,28]. Regarding the research on the microscopic adsorption mechanism of PEO on mineral surfaces, Lee et al., found that the adsorption of PEO on the hydrophobic interface of minerals produced a transition process from mushroom morphology to brush morphology [29], and PEO was easily adsorbed on the edge surface with high hydroxyl content [30]. At present, there are few studies on the anisotropic adsorption of PEO and kaolinite. In the molecular simulation of the adsorption of polymers on the surface of kaolinite, Chen et al., used DFT to study the difference in the adsorption of different PAM structural units on the 001 surface of kaolinite [31]. Ren et al., studied the adsorption behavior of NPAM on kaolinite 001 surface–water interface by experiment and MD [32]. Jacquet et al., studied the adsorption of cationic polymers on kaolinite surfaces by combining experiments with DFT [33]. Luo et al., studied the agglomeration of kaolinite particles in the presence of dodecylamine by force testing and DFT [34]. However, the above studies are still insufficient for the differential adsorption characteristics of polymers on the anisotropic kaolinite substrate. Therefore, in order to further study the effects of the differences in the adsorption structure of PEO on the silicon oxygen surface (00 1 ¯ surface) and aluminum oxygen surface (001 surface) of kaolinite on particle agglomeration, it is necessary to combine the interface adsorption tests with molecular dynamics simulation.
This research was intended to explore the differential adsorption of PEO on the aluminum–oxygen and silicon–oxygen surfaces of kaolinite and the effect of the adsorption mechanism on the flocculation effect of kaolinite suspensions. Macroscopic sedimentation behavior was assessed by conducting flocculation sedimentation experiments. Moreover, images of kaolinite suspension flocs at different concentrations of PEO, trends over time, and particle size distribution were observed by microscopic images, with focused beam reflectance measurements (FBRM). The adsorption of PEO with functional groups on the kaolinite surface was examined by adopting FTIR. The adsorption properties of PEO on kaolinite, alumina, and silica surfaces was also investigated and compared by employing a quartz crystal microbalance (QCM−D). After the above results were obtained, the distinctions in the adsorption conformations of PEO on kaolinite 001 and 00 1 ¯ surfaces in the presence of water molecules were also explored by MD simulations to illustrate the adsorption flocculation mechanism of PEO.

2. Materials and Method
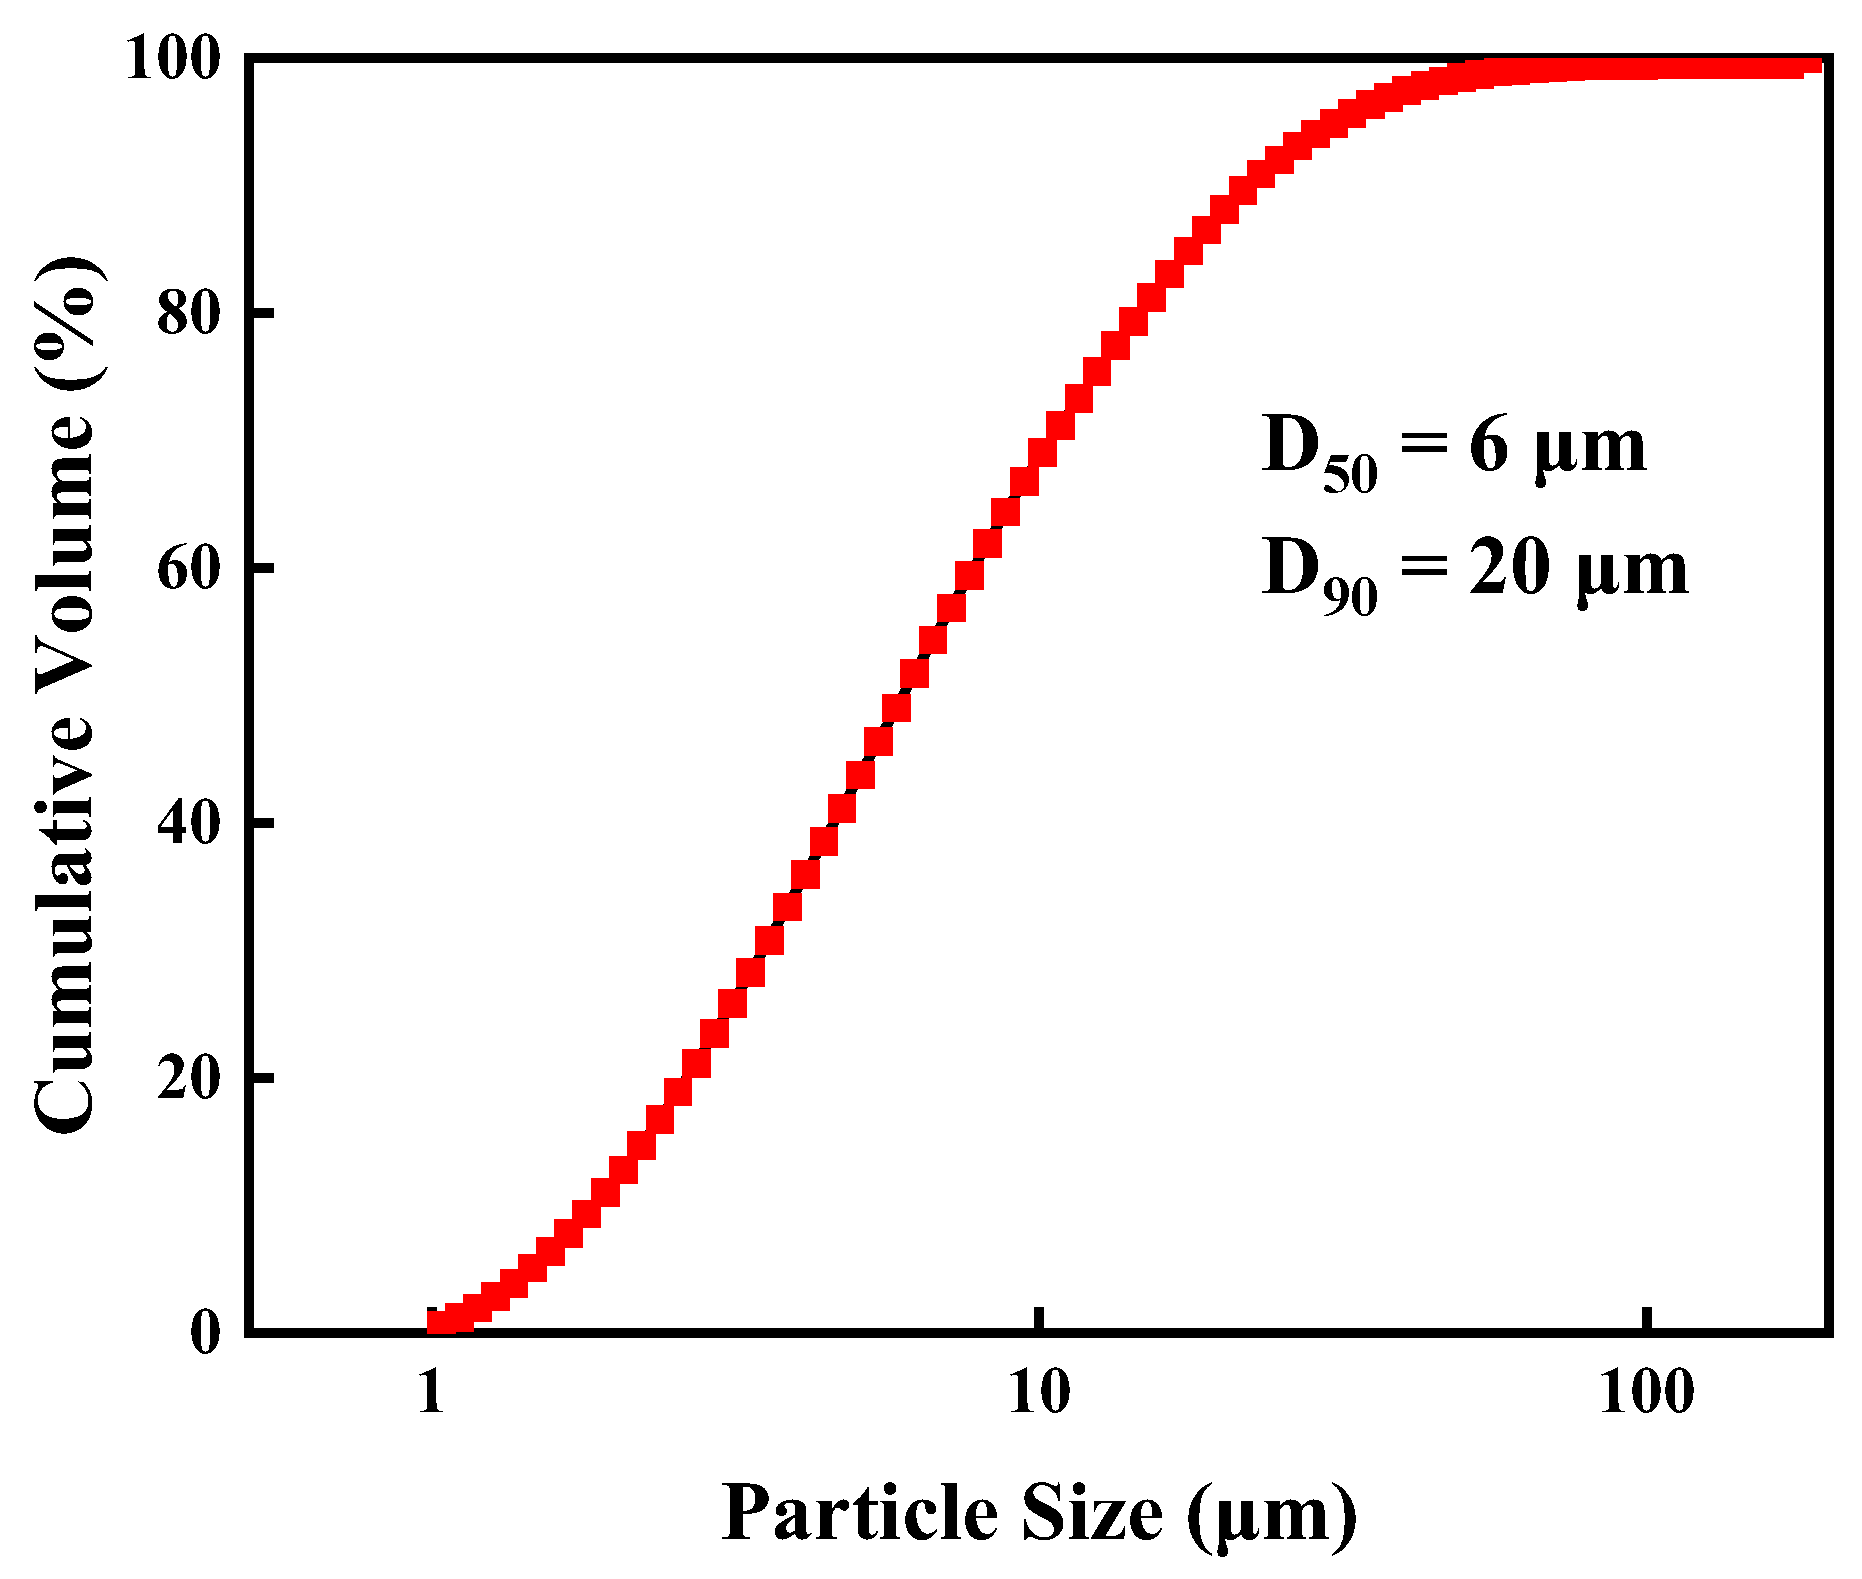
2.1. Materials

In this paper, kaolinite powder (1250 mesh) was purchased from a mineral material company in Henan, China. The particle sizes of kaolinite samples were analyzed with a laser particle analyzer (Microtrac S3500, purchased from Microtrac MRB (USA)), as depicted in Figure 1, with a D50 of 6 μm and D90 of 22 μm. XRD measurement results are depicted in Figure 2. The main mineral composition of the sample was kaolinite. The kaolinite, silica, and alumina coated quartz crystal sensor used for the QCM−D polymer adsorption study was purchased from Biolin Scientific (Chip specifications (300nm thickness, QSX 999), purchased from Nano Science Instruments (AZ, USA)), with a base oscillation frequency of 5 MHz and a particle coating thickness of approximately 15 nm. PEO with 6 million molecular weight was obtained from BASF Biotechnology Co., LTD, Hefei, China, and deionized water was used in all the experiments.

2.2. Flocculation and Sedimentation Experiment of Kaolinite

The flocculation settlement test was performed in a stopper measuring cylinder. A total of 2.5 g of kaolinite was first added to 200 mL deionized water for pre-stirring at 300 rpm for 1 day and then quantitatively poured 250 mL into a stopper measuring cylinder for settlement and reserve. PEO was added to 100 mL deionized water and stirred at 1000 rpm for 1 h at concentrations of 0.4 g/L, 0.6 g/L, 0.8 g/L, 1 g/L, and 1.2 g/L. The test was carried out by adding 1 mL PEO to the kaolinite suspension, turning the measuring cylinder upside down five times, recording observations by static settling and collecting the sediment layer to calculate the percentage of kaolinite removal, and repeating the above experiments at different concentrations.

2.3. Focused Beam Reflectance Measurement (FBRM)

Focused beam reflection measurement (FBRM) is a measurement technology for suspended particles in liquid, which is used to monitor the real-time dynamic trend of suspended particle size and particle size distribution in the environment at a fixed time point. The variation and distribution of flocculated particles in kaolinite suspensions were explored using The Focused Beam Reflectance Measurement (FBRM G400, Mettler Toledo, Switzerland). Kaolinite (2.5 g) was added to 250 mL deionized water and pre-stirred at 300 rpm for 1 day to ensure complete dispersion of the particles. The test was conducted at 300 rpm to keep the particles suspended, and 1 mL PEO was added to the suspension 5 min after the start of the FBRM test. The real-time change in data after the addition of PEO was observed and recorded. The experiment was then repeated at different concentrations.

2.4. Quartz Crystal Microbalance with Dissipation (QCM−D)

Owing to the anisotropy of kaolinite, it is crucial to study the adsorption of PEO on different types of kaolinite substrates. The QCM−D instrument adopted a QSense Analyzer (four channels) from Biolin Scientific as a platform to investigate the differential properties of PEO adsorption on silicon oxide chips (representing silica–oxygen tetrahedra), alumina chips (representing aluminum–oxygen octahedra) and kaolinite chips. In each QCM−D experiment, deionized water was first pumped into the flow module by an IPC−N peristaltic pump at a rate of 0.1 mL/min to establish a stable baseline. To simulate the adsorption of PEO on the solid surface during flocculation, 100 ppm PEO was introduced into the flow module at the same flow rate until the adsorption of PEO reached a new equilibrium. All experiments were carried out at room temperature (25 °C). The QCM−D results presented in this paper were for 3rd overtones as the data under 3rd were more sensitive and stable during the test. At the end of the test, the sorption data were calculated using the Dfind Smartfit model built into the Qtools software.

2.5. Fourier Transform Infrared Spectrometer (FTIR)

The original kaolinite and PEO-treated kaolinite were measured using a Thermo Scientific Nicolet iS20. In a dry environment, a small amount of the samples and an appropriate amount of dried potassium bromide powder were mixed in a KBr: sample ratio of 10:1. After full grinding, the mixture was placed into a tablet press. During the test, the background spectrum was collected first, and then the infrared spectrum of the sample was collected. The resolution was 4 cm−1, the scanning times were 32, and the test wave number range was 400–4000 cm−1.

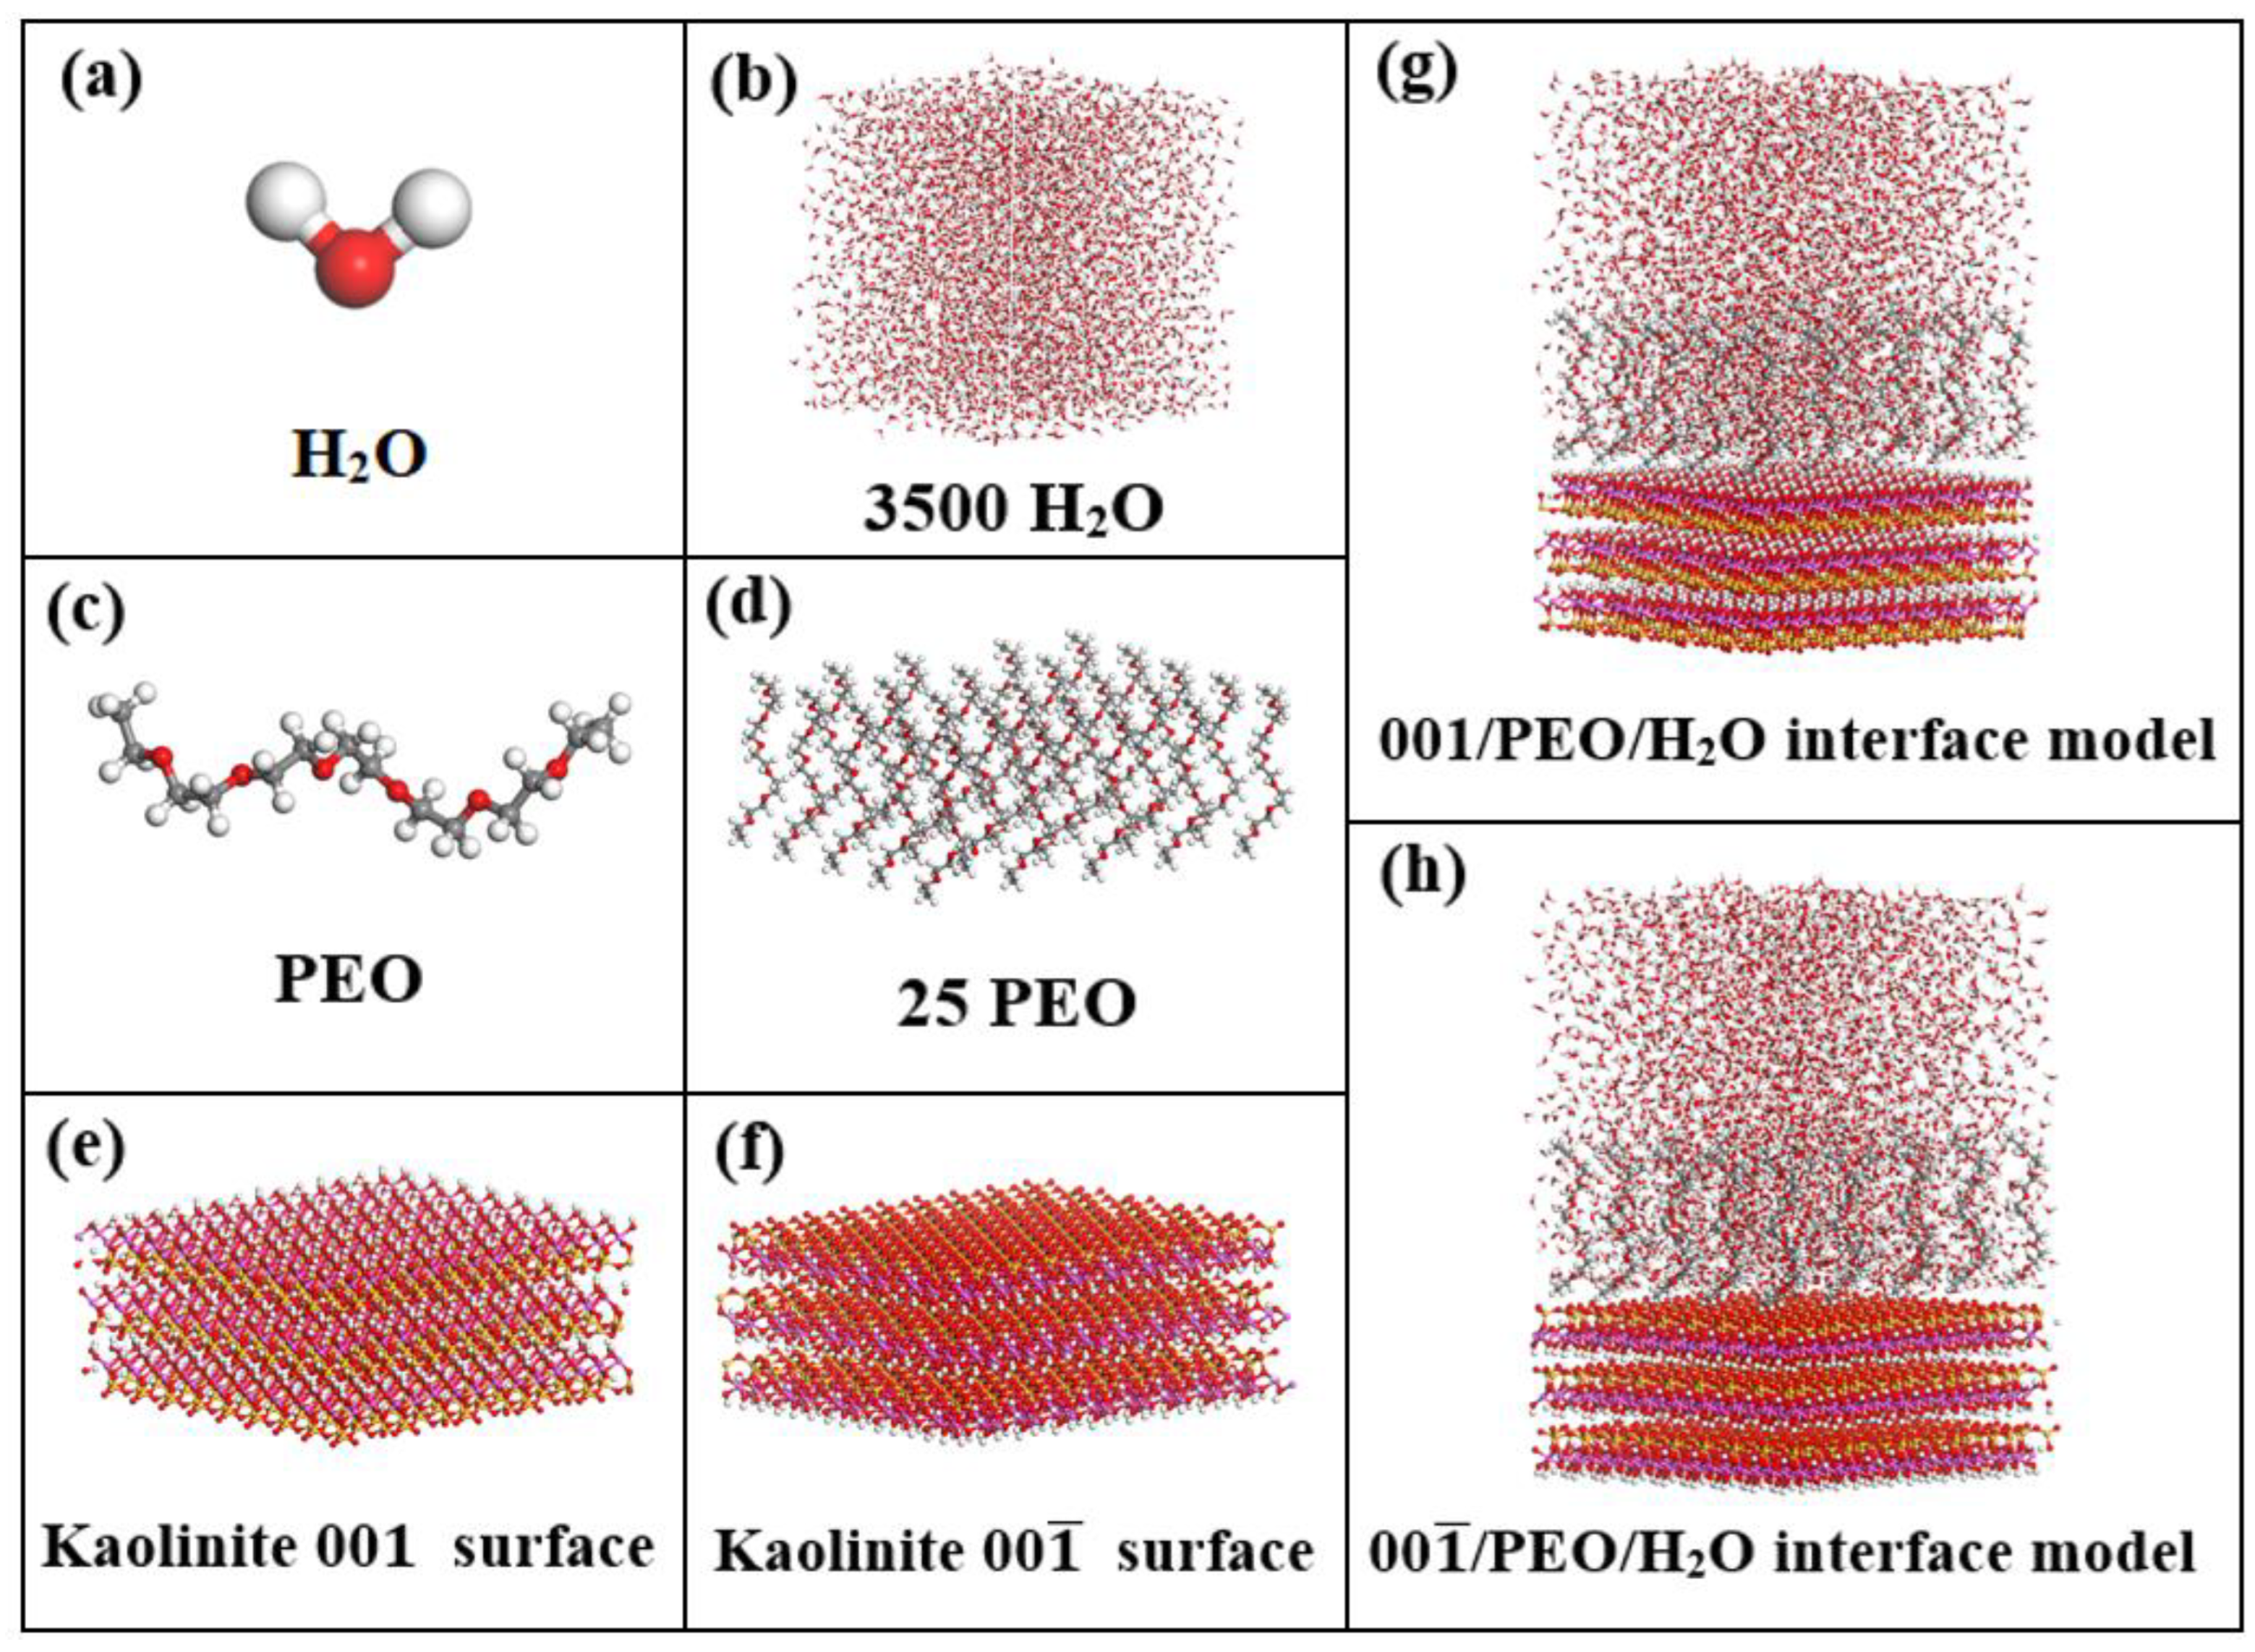
2.6. Molecular Dynamics Simulation Study on the Interaction between PEO and Kaolinite

Molecular dynamics simulations were performed using the Forcite module of Materials Studio 8.0 (BIOVIA Corp., San Diego, CA, USA) with a Clayff forcefield. The molecular structures of kaolinite, PEO, and water after optimization are shown in Figure 3. The optimized kaolinite was packed in a 46.39 Å × 44.70 Å × 134.923 Å (length × width × height) periodic chamber, and 25 PEO molecules were added to 3500 water molecules to generate the PEO/water system. Subsequently, the PEO/aqueous solution was placed on the surface of kaolinite, i.e., the 001 and 00 1 ¯ surfaces, respectively. Finally, a vacuum layer with a thickness of 80 Å was added above each cycle chamber to prevent the interactions between adjacent layers in the Z direction from interfering with the interface adsorption. Figure 3 indicates the interface structure model of the 001 and 00 1 ¯ surfaces of kaolinite with PEO/water molecules. Geometric optimization and MD simulation were carried out under the optimized setting of the software. All simulations were performed under a constant temperature of 298 K. An NVT ensemble was applied under three-dimensional periodic boundary conditions. The nose function was selected for temperature control. Ewald- and Atom-based methods were used to calculate long-range electrostatic action and van der Waals action, respectively, with a truncation radius of 18 Å [35,36,37]. A 1000 ps simulation of the system was conducted with a time step of 1 fs to ensure that the system had reached the equilibrium state. An additional 500 ps output was used to calculate and analyze the adsorption properties of the balanced system.

3. Results and Discussion

3.1. Effect of Dosage on Flocculation Performance of Kaolinite by PEO

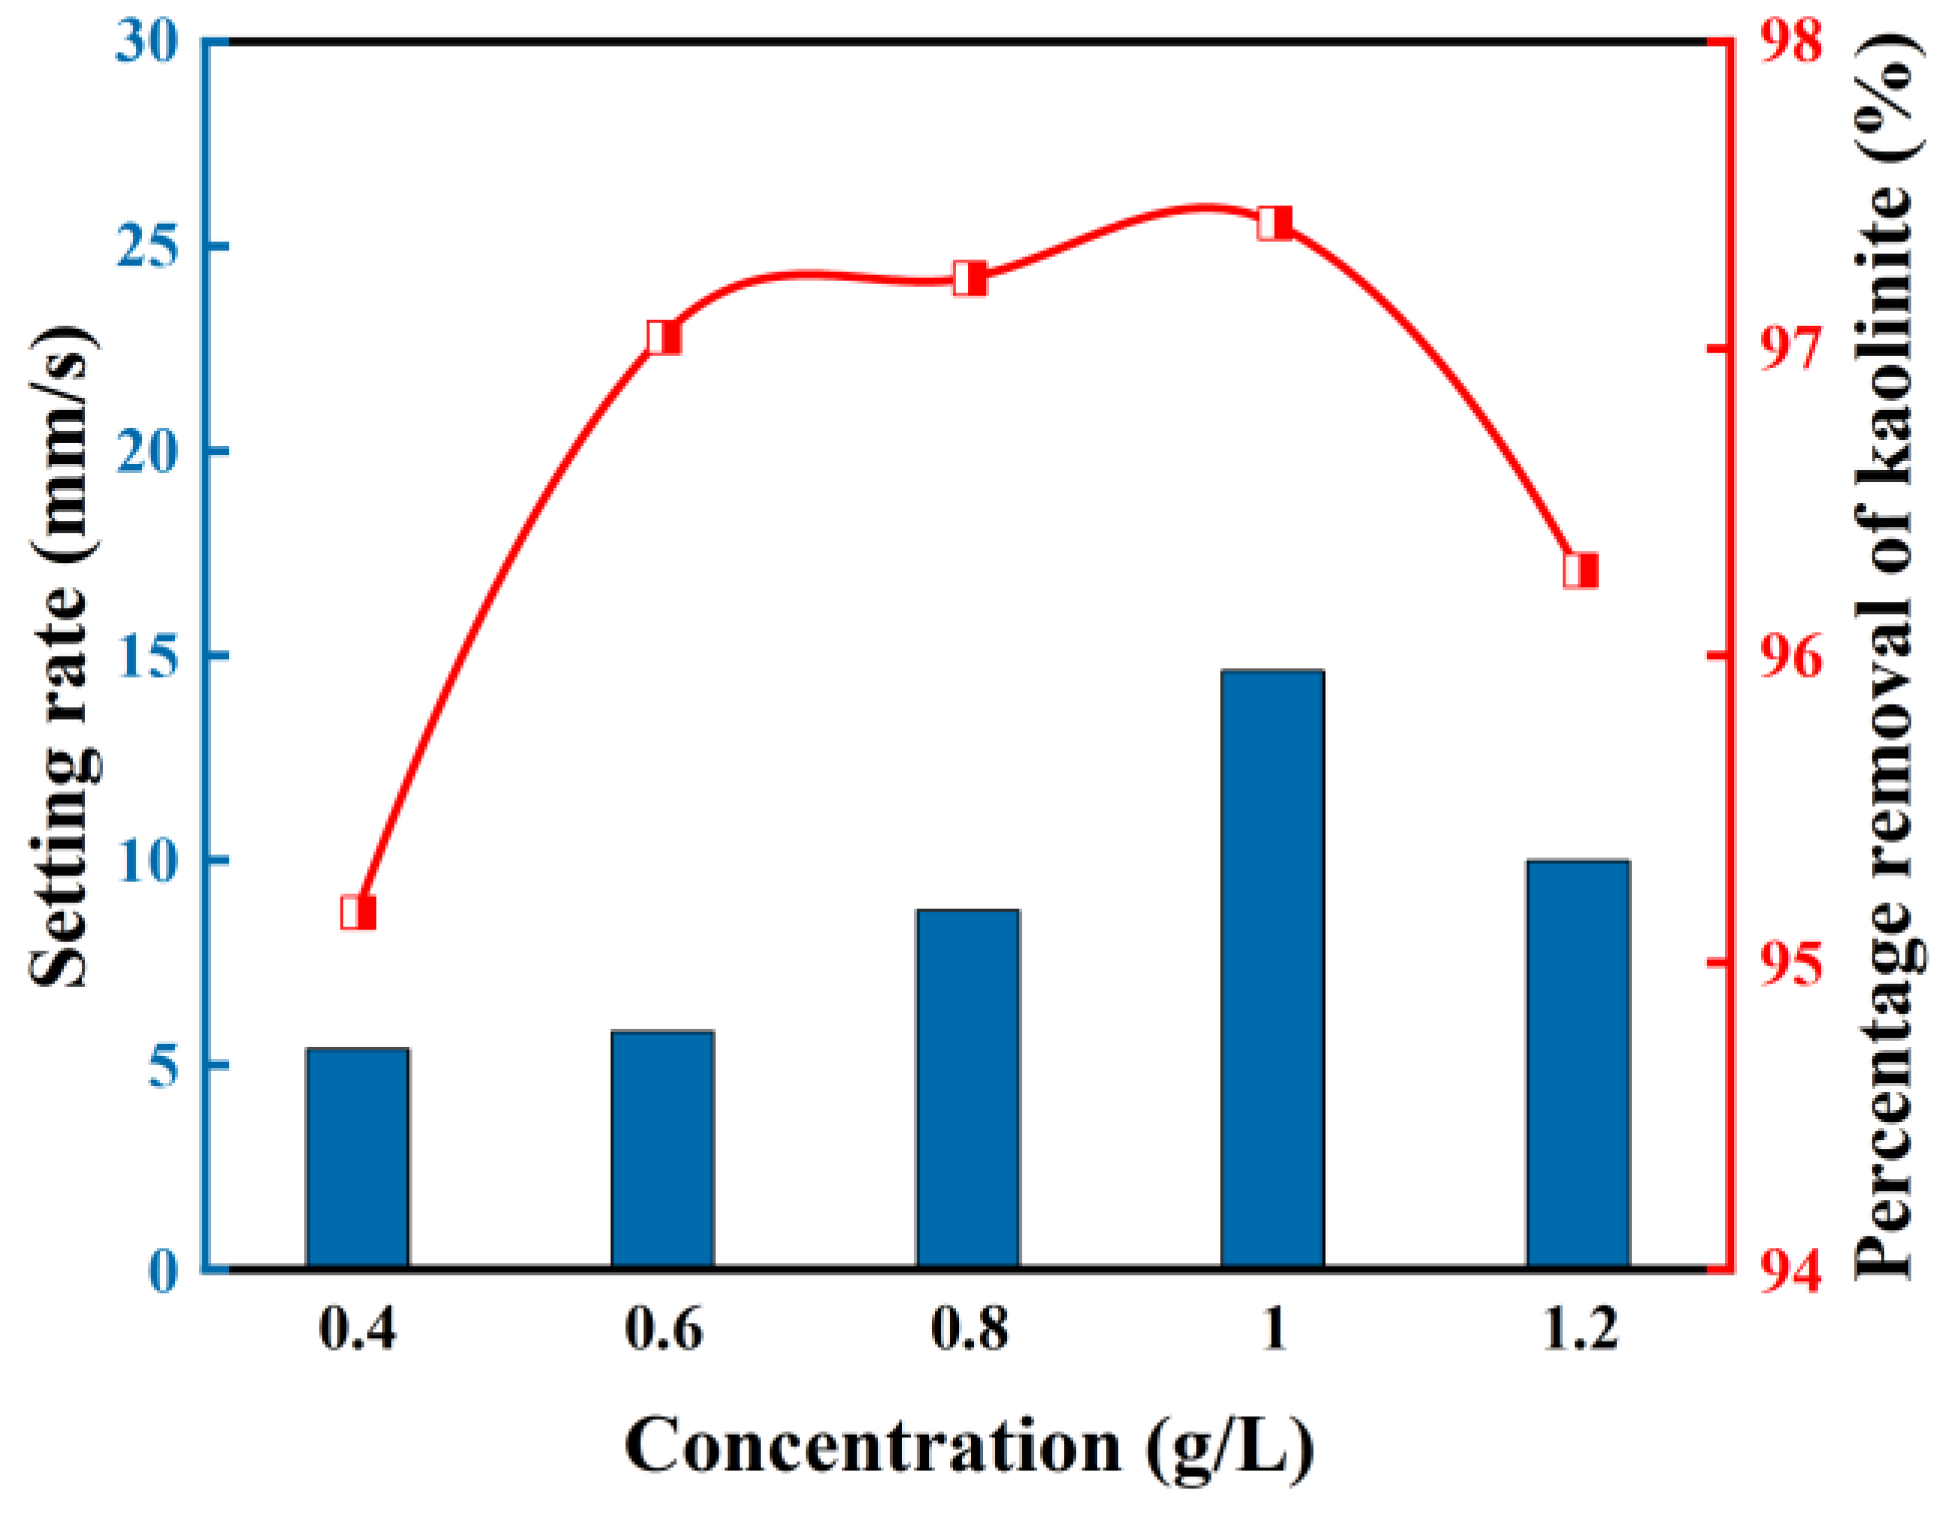
3.1.1. Settlement and Removal Effects

The settling rate and removal percentage of suspended matter are critical parameters to evaluate the flocculation effects. The variation of kaolinite settling rate and removal percentage with different concentrations of the agent is depicted in Figure 4. The removal percentage of kaolinite gradually increased as the concentration of PEO increased, remaining above 96% at concentrations greater than 0.6 g/L and slightly decreasing at 1.2 g/L, with the same settling rate. The settling rate of 1 g/L PEO reached 18.92 mm/s, and the kaolinite removal percentage reached 97.4%. A low concentration of PEO has high dispersion, but the low agent content is not adequate to speedily bridge the particles to form large flocs, while a high concentration of PEO has higher agent content, and when the critical flocculation concentration is exceeded, the supersaturated adsorption of kaolinite and the excess agent in the suspension will hinder flocculation.

3.1.2. Floc Morphology

The morphology of the flocs was observed by stereomicroscopy, and images are shown in Figure 5. When 0.4 g/L PEO was added, the particles were small in size and dispersed without coalescence, and there were almost no large flocs; as the concentration of PEO rose and the bridging effects increased, the particles became agglomerated and produced large flocs. As illustrated in the images of flocs with concentrations of 0.6 g/L and 0.8 g/L, respectively, flocs of enlarged particles are clustered together and appear as flocs of aggregates surrounded by small particles. As clearly revealed in the images of flocs with a concentration of 1 g/L, the small particles had almost completely formed into large flocs and the small particles around the large flocs were remarkably reduced, which indicates that the optimum dose was obtained. When the dose was increased to 1.2 g/L, the already-formed large flocs started to form very large flocs. In this experiment, the sediment layer of the suspension at this concentration appears as a blocky colloid.

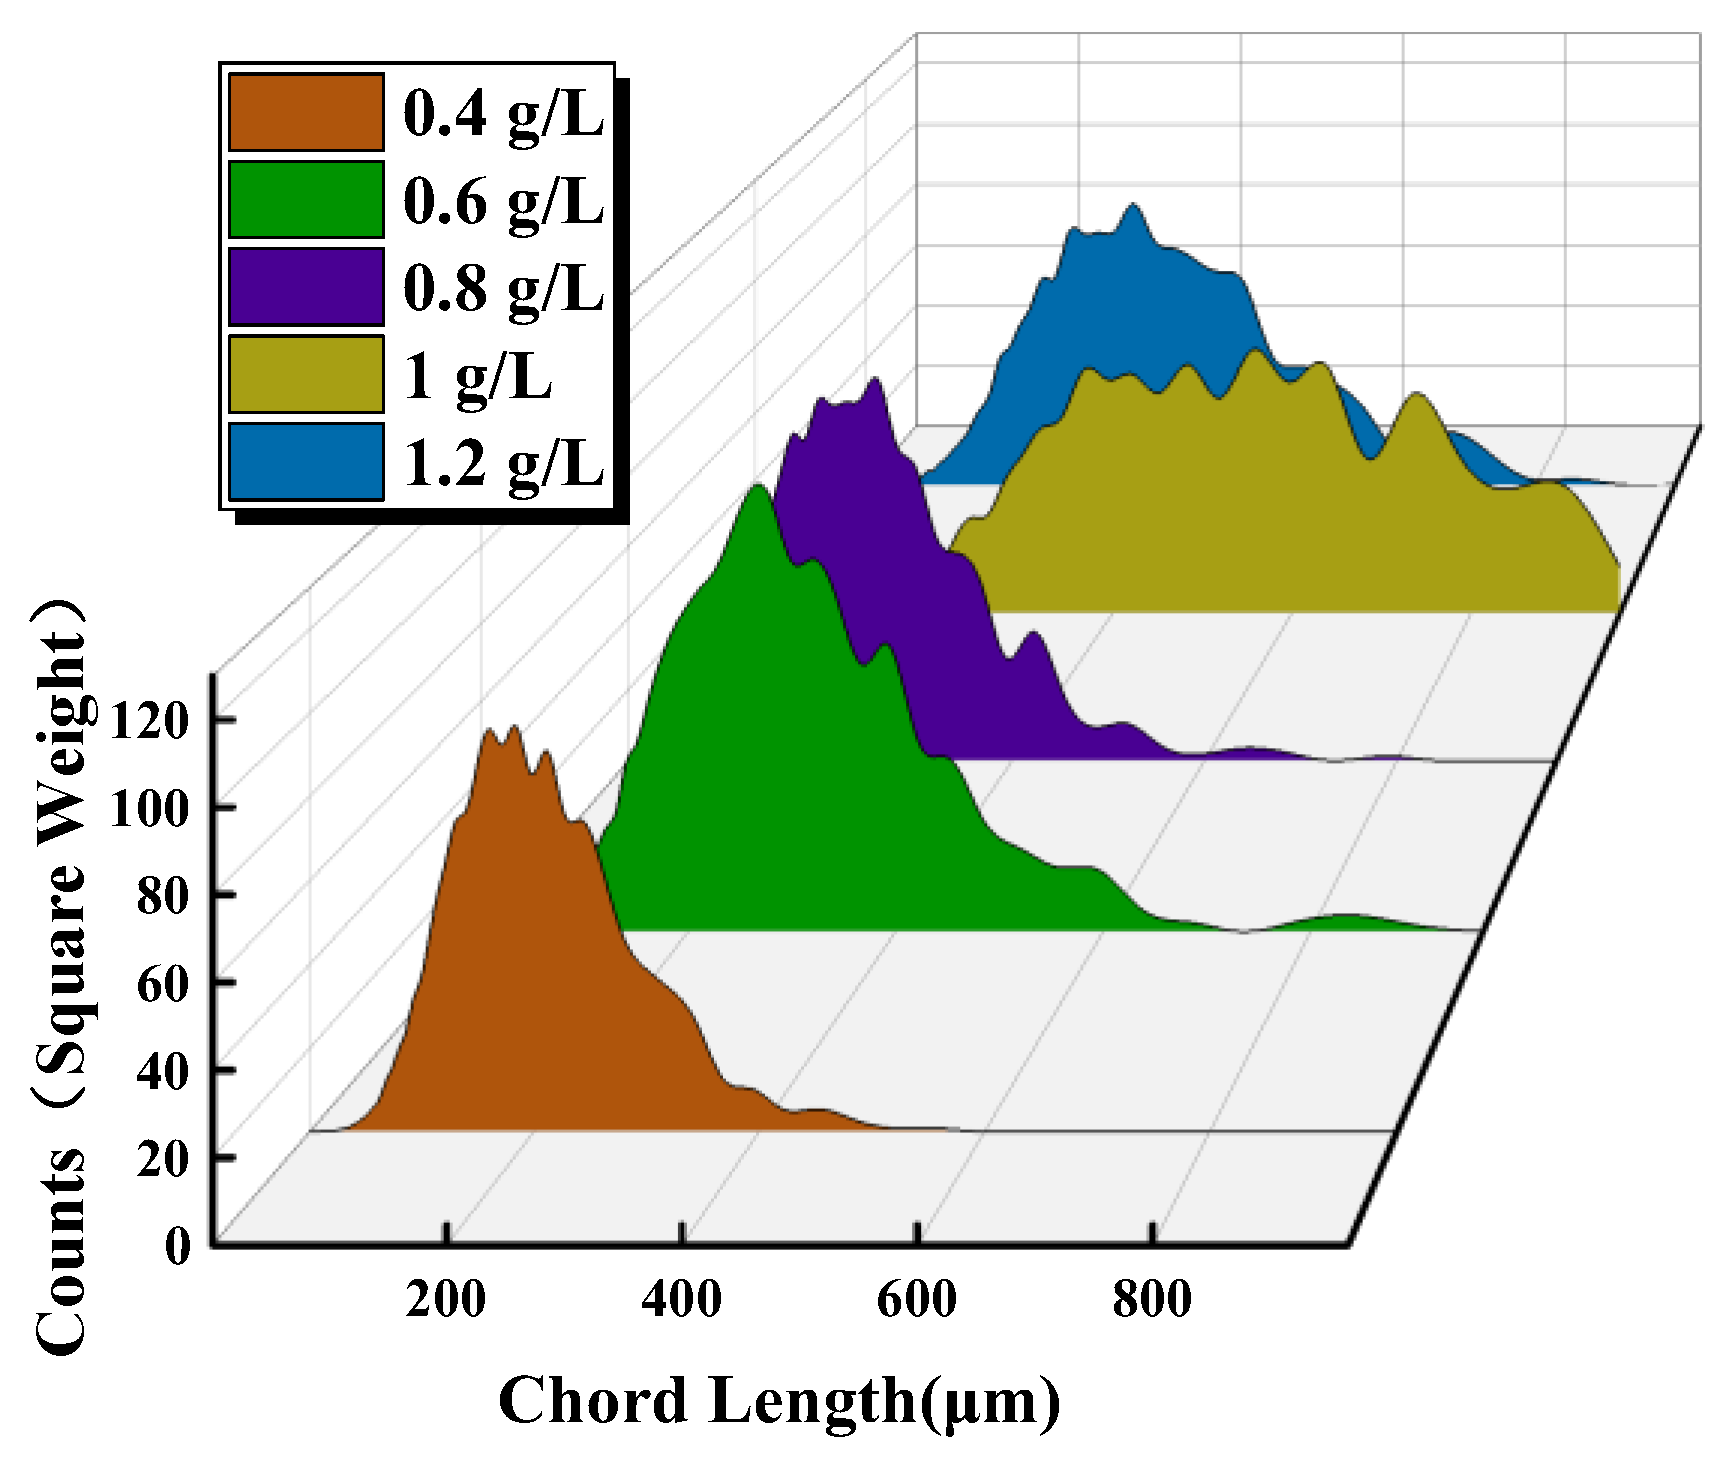
3.1.3. Flocculation Size and Distribution

As shown in Figure 6, the trend of the average weighted diameter at different concentrations reflected the change in the average chord length of flocs with time in the flocculation process. After adding 1 g/L PEO, the particle size increased sharply from 40 μm to 485 μm; when adding 1.2 g/L PEO, it increased to 300 μm, and while adding 0.6 g/L PEO, it increased to 260 μm. After adding 0.8 g/L PEO, the particle size increased to 230 μm, and the minimum concentration of 0.4 g/L PEO also increased to 180 μm. With an augment in the PEO concentration, the chord length increased and the rate of augment in the chord length also heightened, suggesting that the formation rate of flocculation had risen. Furthermore, 1 g/L PEO was strikingly better than other concentrations. Under different agent concentrations, the flocculation effect varied noticeably. The floc diameter of 1 g/L was 1.6 times that of 1.2 g/L and 2.7 times that of 0.4 g/L. An appropriate PEO concentration can effectively promote the agglomeration efficiency of kaolinite.
The flocculation process was analyzed using the chord length and quantity of flocs. FBRM was used to detect the flocculation of the kaolinite suspension at different PEO concentrations and pH values. The weighted (Square Weight) data displayed the detection of large particles, and the unweighted (No Weight) data exhibited the detection of small particles. As indicated in Figure 7, in kaolinite suspensions with different concentrations of PEO, the distribution number of different chord lengths of flocs is as follows. The 1 g/L PEO has the best flocculation effect, the weighted number is the largest, and the peak chord length of the flocs is 550 μm. With PEO concentrations of 1.2 g/L, 0.8 g/L, 0.6 g/L, and 0.4 g/L, the peak chord lengths are 320 μm, 260 μm, 250 μm, and 190 μm, respectively. It can be observed that the peak shape at a low PEO concentration is sharp, the number of chord lengths is extremely different, and the bridging flocculation is weak; thus, larger flocs do not form. The peak shoulder of high concentration is widely distributed, the number of chord lengths varies little, forming a larger flocculant cluster, and bridging flocculation is strong. For the 1 g/L PEO concentration, the chord length distribution of the floccules is mostly to the right. Furthermore, the peak chord length is high. Moreover, the floccule’s diameter and quantity are higher than at other concentrations. The best flocculation effect is achieved at this concentration.
As shown in Figure 8, the unweighted chord length distributions of kaolinite suspensions with different concentrations of PEO flocculation are sensitive to the distribution of fine particle sizes. It can be observed that the number of PEO flocs with a length of 1–10 μm (unflocculated particles) at a low concentration is smaller than that at a high concentration, while the number of flocs with a length greater than 100 μm is higher than that at a high PEO concentration. This indicates that the flocs formed by agents with a low concentration tend to be of medium diameter. Furthermore, the capture percentage of particles with a size of 1–10 μm in the suspension is high, while the capture percentage of agents with a high concentration is low. With an increase in concentration, the chord length of the flocs grows to the right, and the relative number of flocs decreases.

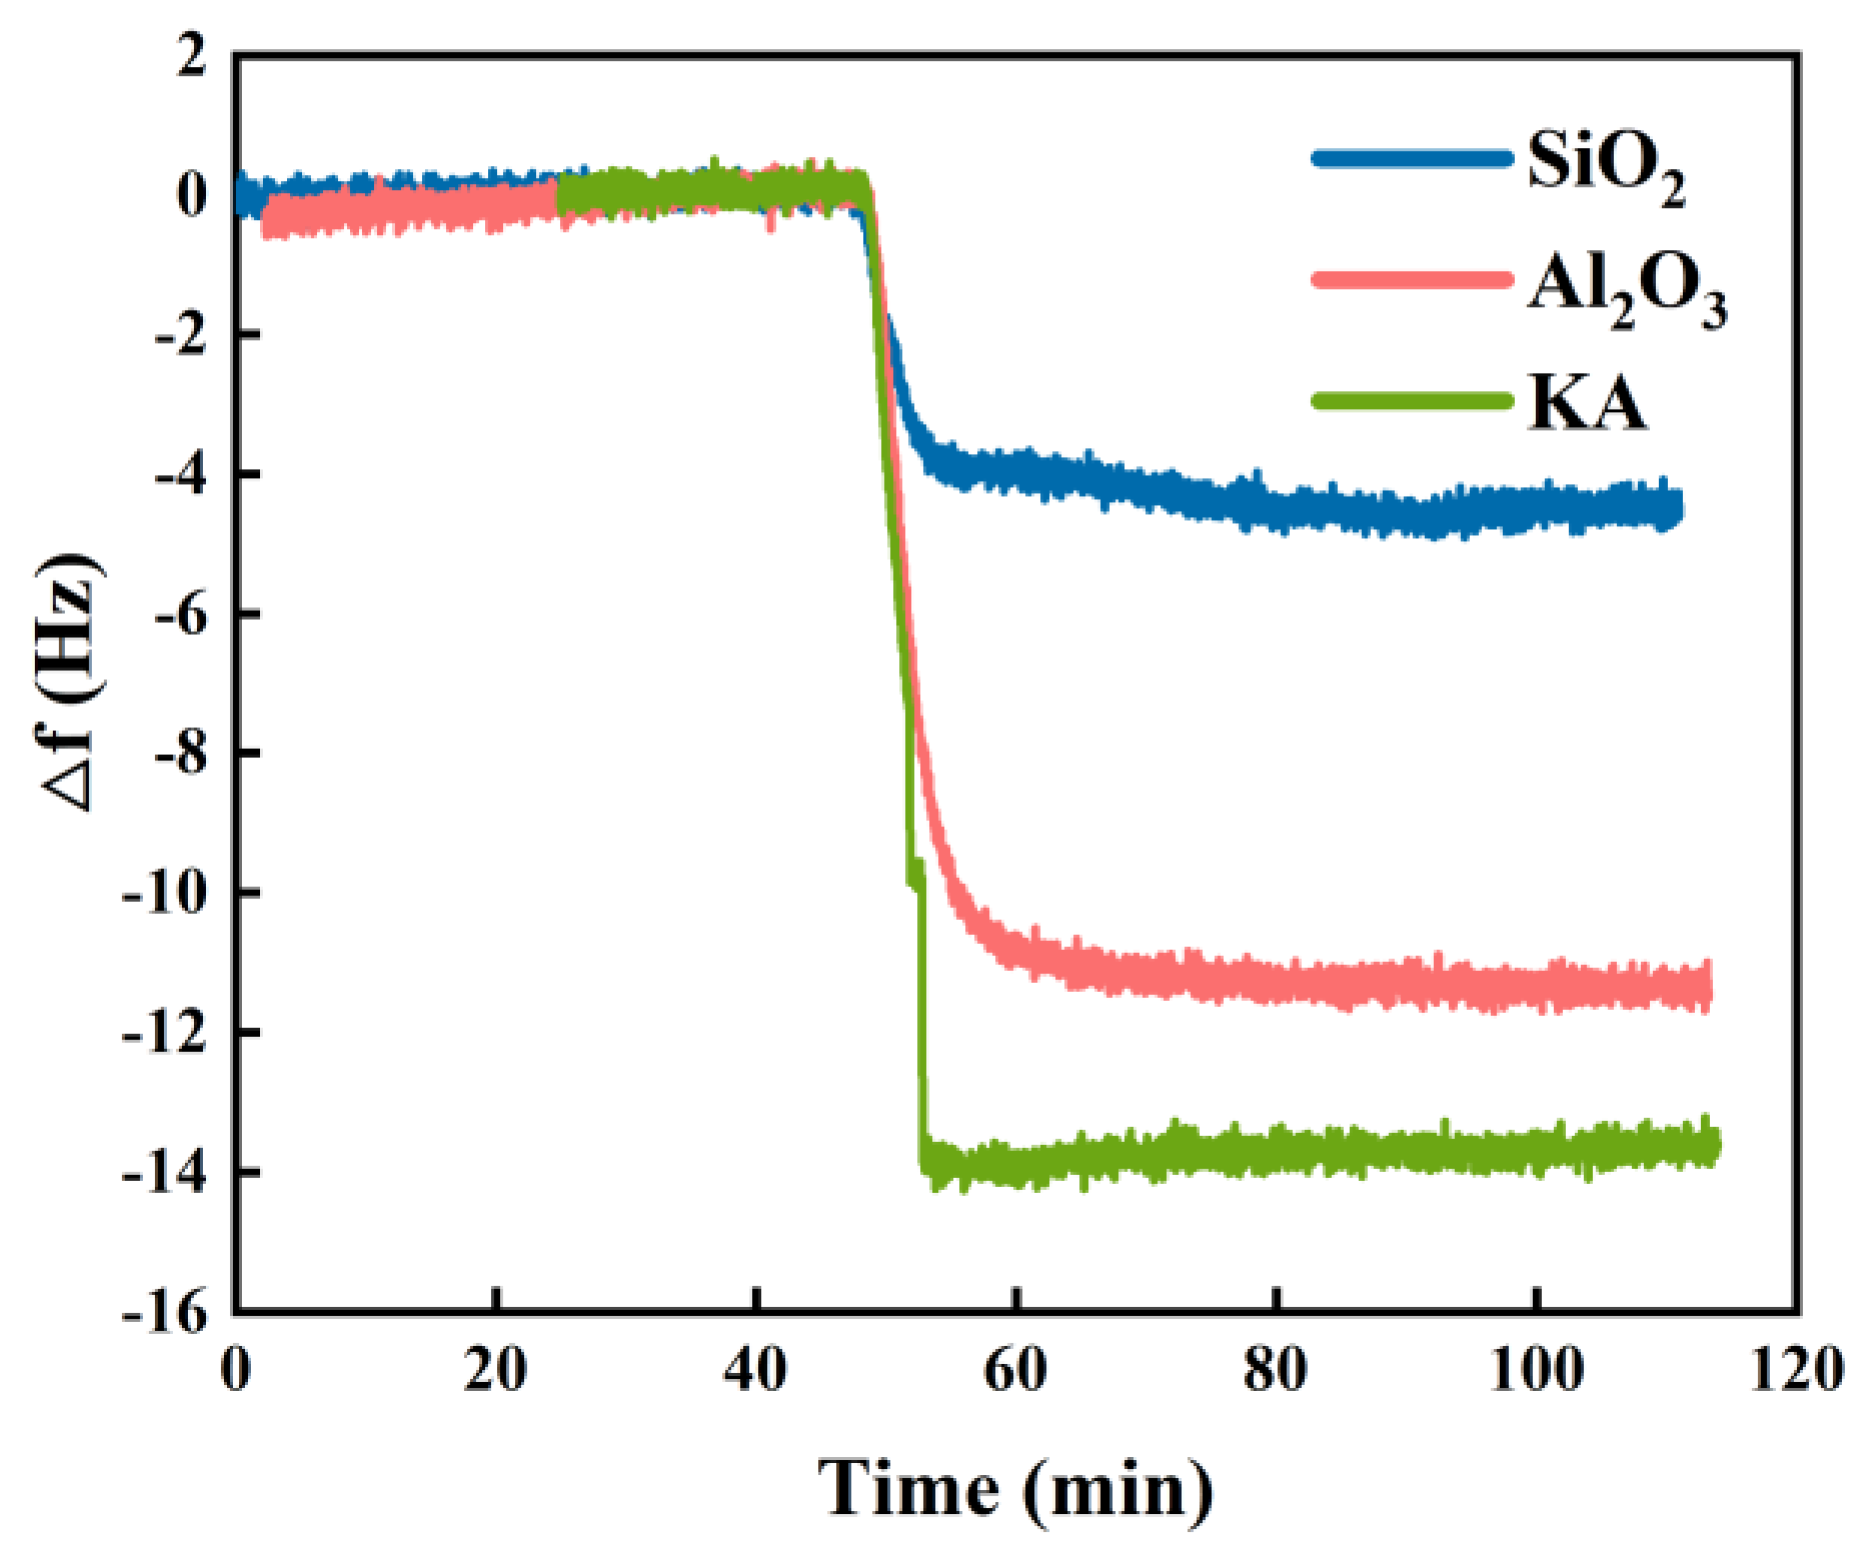
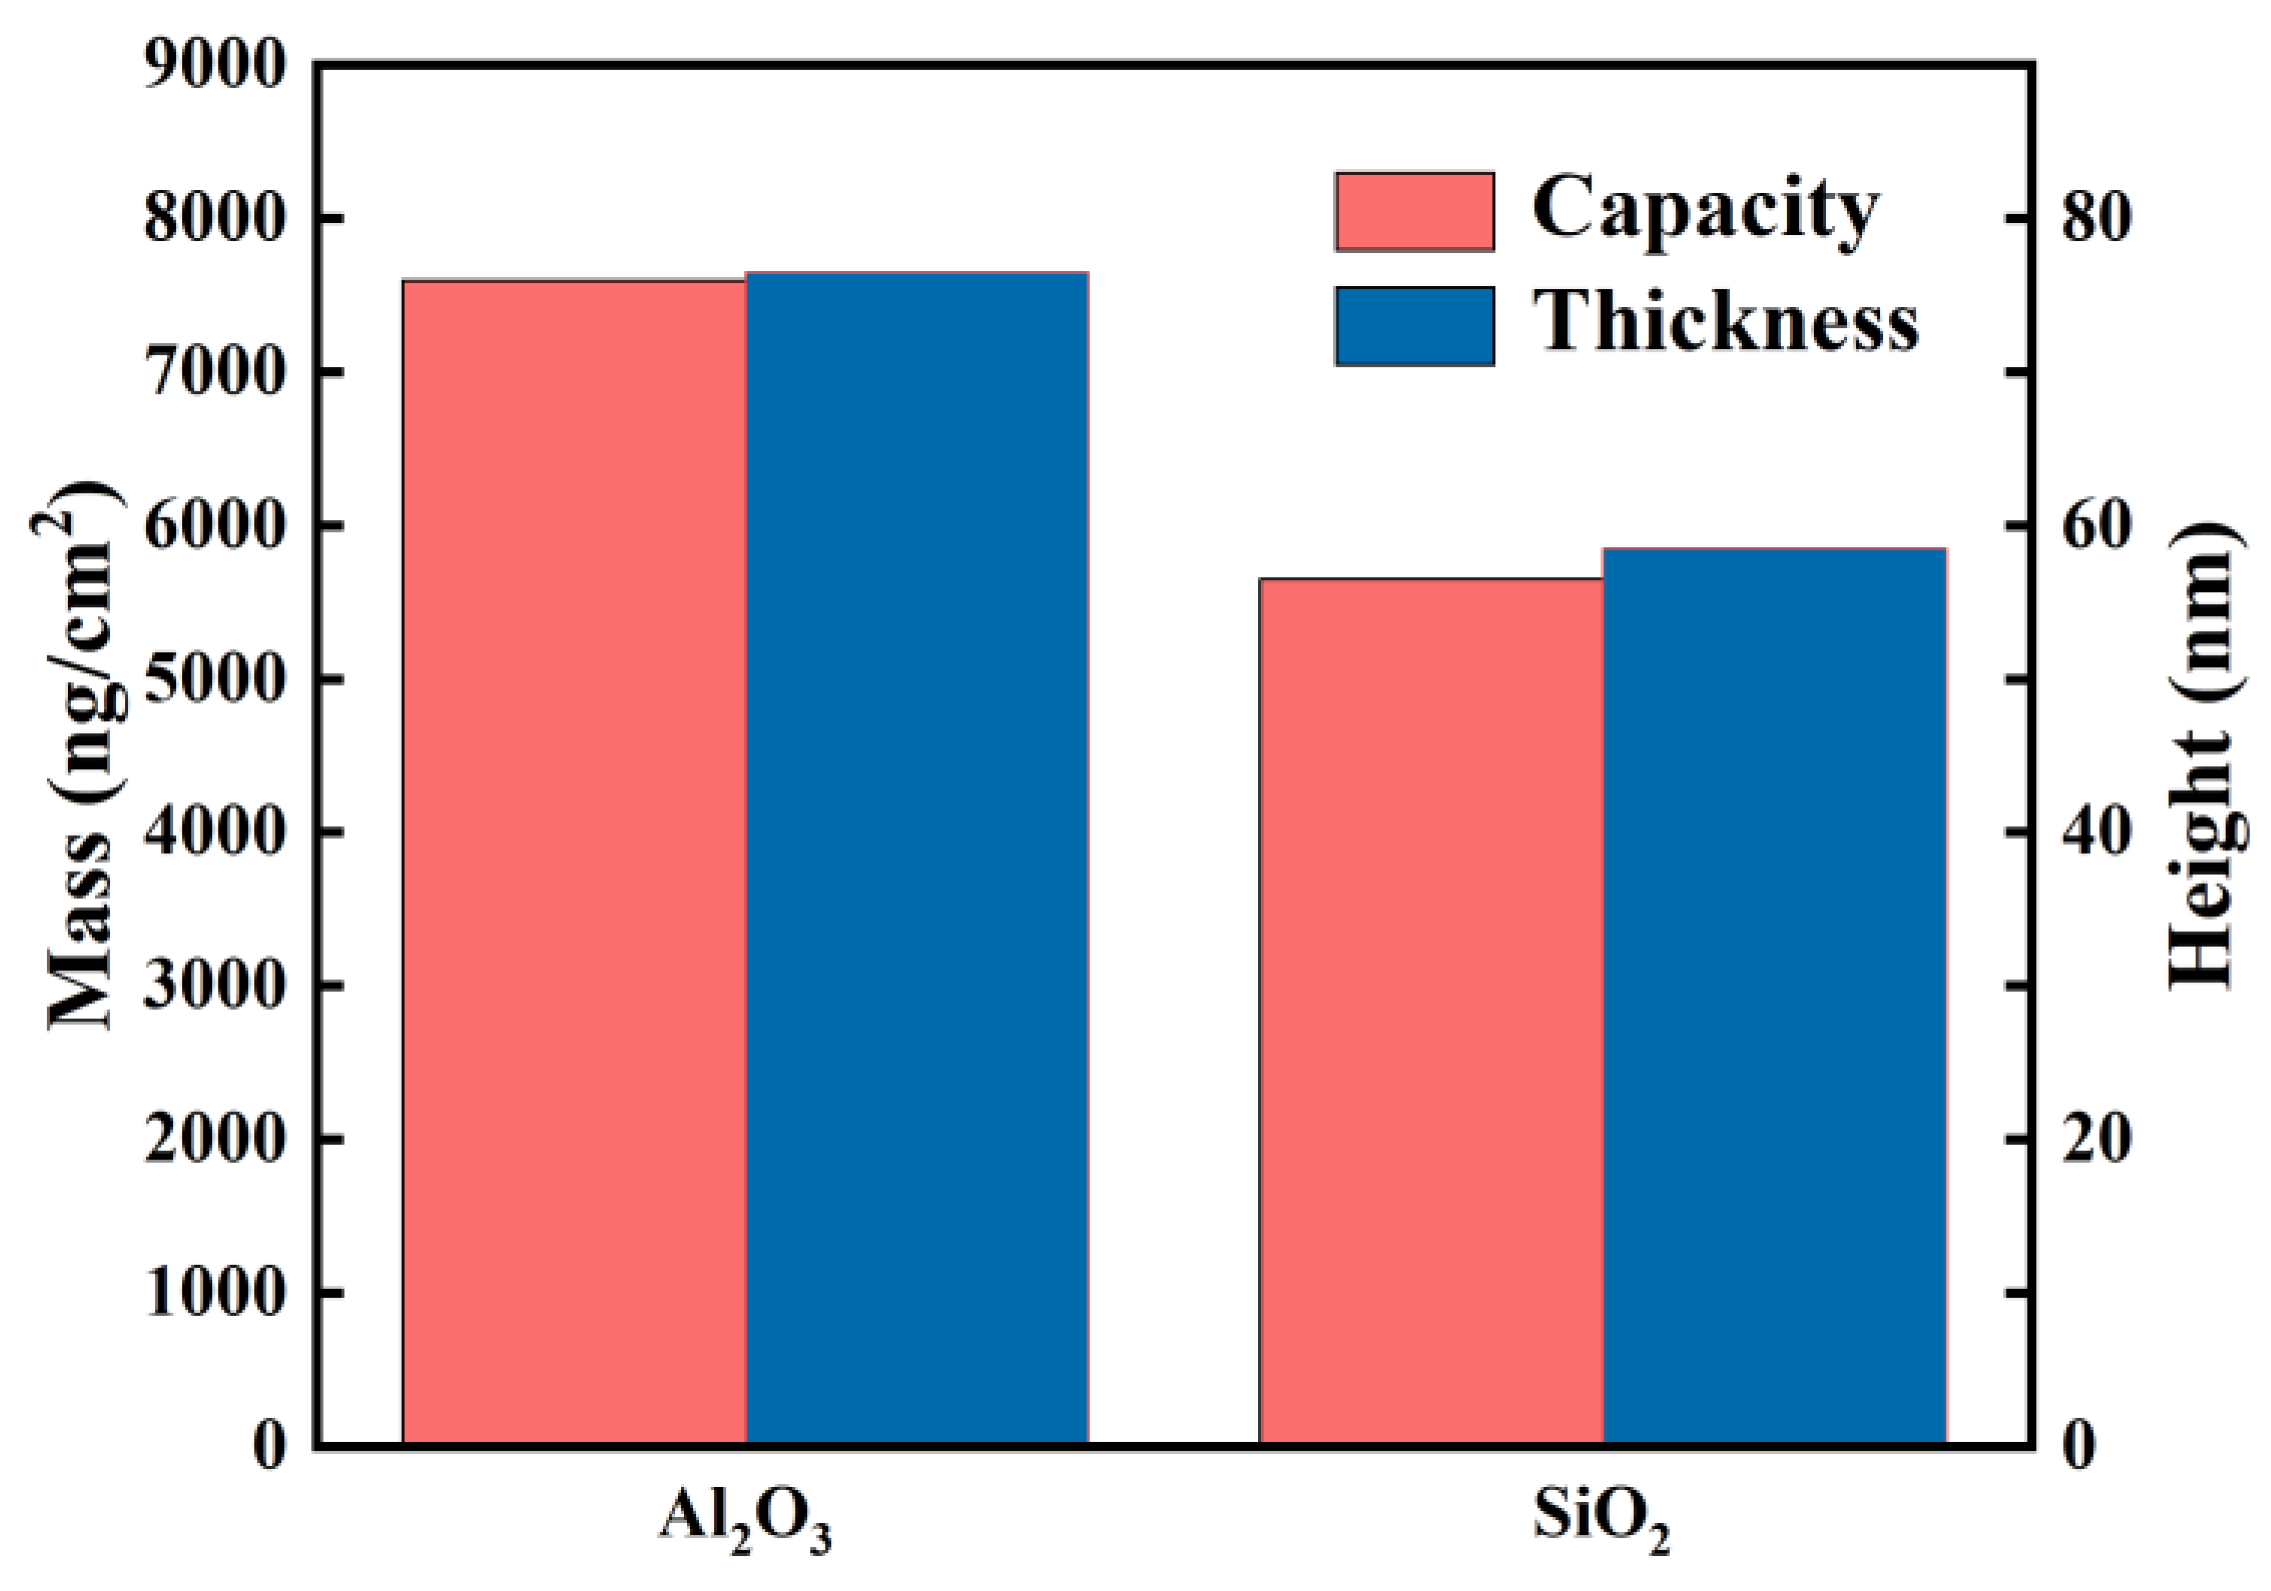
3.2. Adsorption Kinetics and Characteristics of PEO on Kaolinite

Adsorption of PEO on Surface of Kaolinite Alumina and Quartz
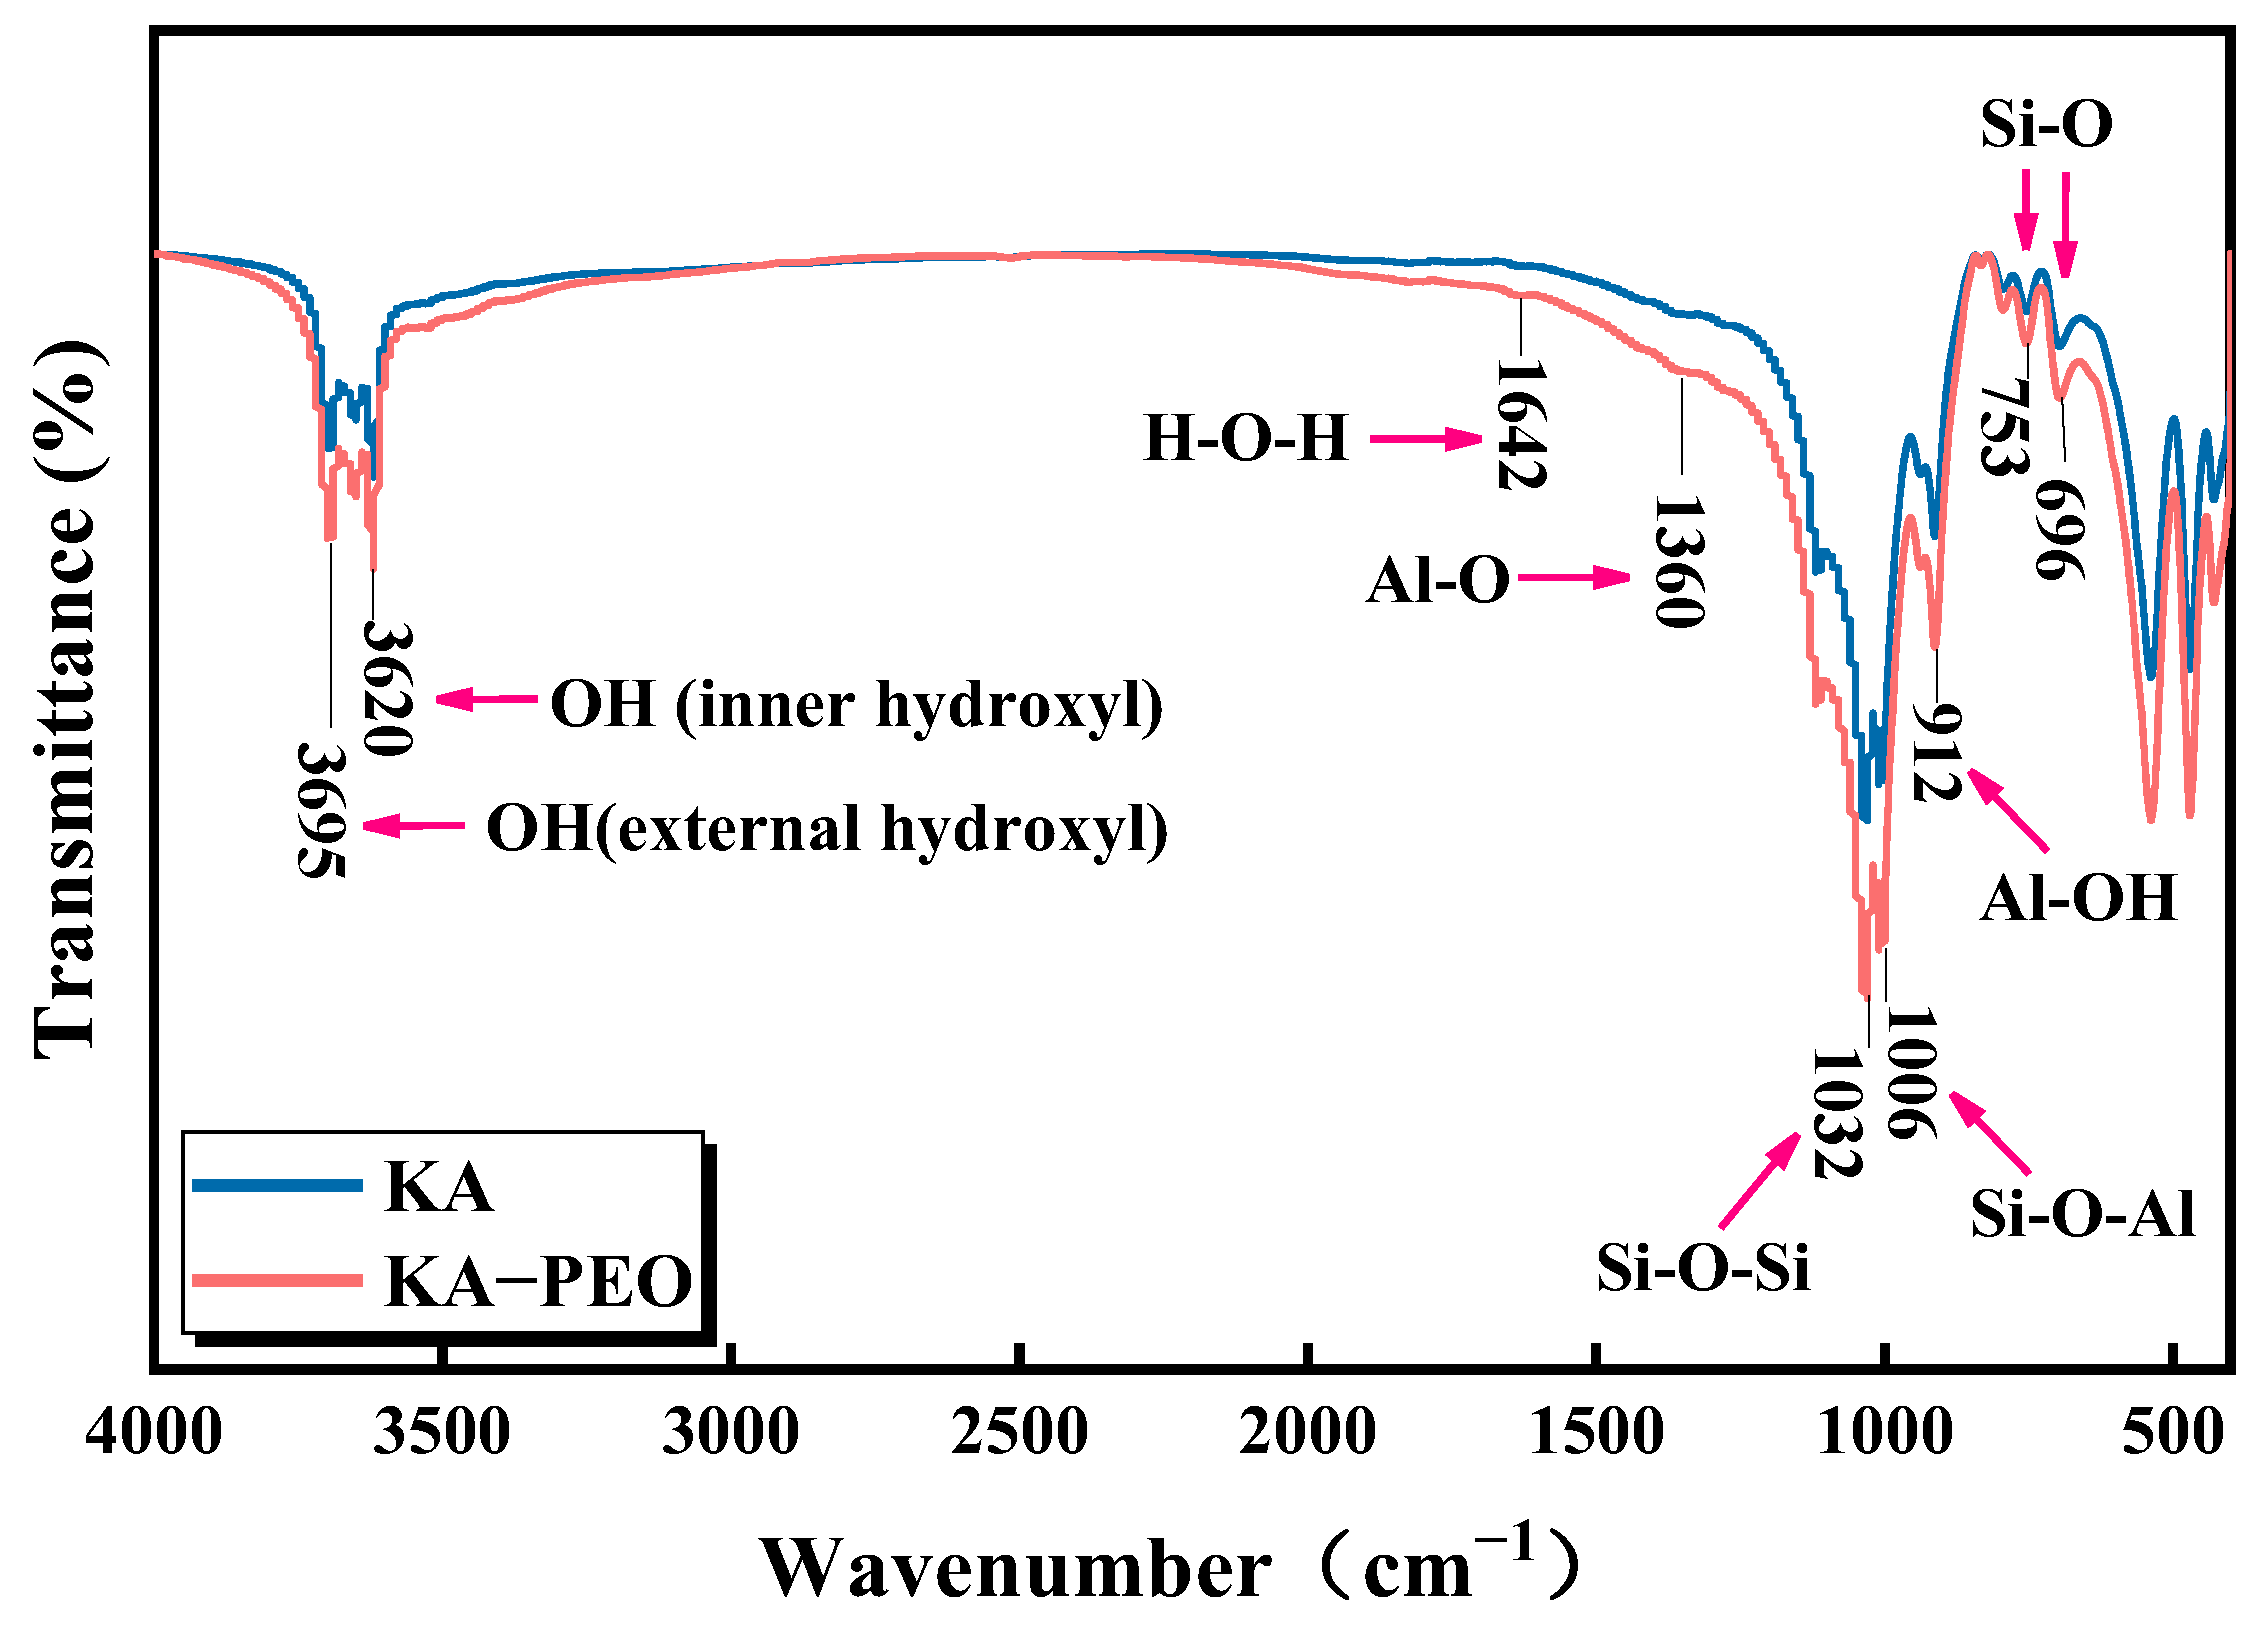
QCM−D technology was adopted to study the frequency variation, adsorption layer thickness, and adsorption capacity of silicon oxide as well as alumina chips before and after the addition of PEO in ionic water (background solution) at pH 8.5. The surface adsorption characteristics of PEO and kaolinite were studied. Due to the anisotropic nature of kaolinite with its edges and basal plane, it consists of a layer of silica–oxygen tetrahedra and a layer of aluminum–oxygen octahedra. As a result, silicon oxide and aluminum oxide chips were used as a substitute for the kaolinite silicon–oxygen and aluminum–oxygen surfaces. The adsorption of PEO on the silicon oxide, alumina, and kaolinite surfaces is displayed in Figure 9. The adsorption on the silicon oxide surface reduces the frequency by 4.7 Hz, the adsorption on the alumina surface reduces the frequency by 11.5 Hz, and the adsorption on the kaolinite chip surface reduces the frequency by 14 Hz. It can be seen that the adsorption of PEO is stronger on the alumina surface than on the silicon oxide surface, but the adsorption on both is lower than on the kaolinite chips. The amount and thickness of PEO adsorbed on the kaolinite surface is depicted in Figure 10. The adsorption amount of PEO on the silicon oxide surface is 6500 ng/cm2 and the thickness of the adsorption layer is 65 nm, while the adsorption amount on the alumina surface is 8000 ng/cm2 and the thickness of the adsorption layer is 80 nm, which is the same trend as the adsorption frequency. The possible reason for this is that the alumina–oxygen surface is hydrophilic and adsorbs PEO with water molecules, so the thickness and adsorption amount is higher than that of the silica–oxygen surface, while the silica–oxygen surface is hydrophobic with no or only a small amount of water molecules adsorbed with PEO mosaic [38].

3.3. FTIR Analysis

The changes in the adsorption of PEO by functional groups on the surface of kaolinite are depicted in Figure 11. Kaolinite is a trigonal crystal system consisting of aluminum–octahedra and silicon–tetrahedra, and the 3694 cm−1 peak in the figure represents the stretching vibration mode of the external surface hydroxyl group located on the surface of the alumina–octahedral sheet. The inner hydroxyl group between the aluminum–oxygen octahedra and the silicon–oxygen tetrahedra is located at 3619 cm−1. The outer hydroxyl group on the single crystal surface and along the fracture edge is located at 3651 cm−1 [39]. The OH bending vibrations at 913 cm−1 are as follows, and these bands are predominantly resulted from the Al-OH group: 1114 cm−1 refers to Si-O stretching vibrations, while the bands at 1032 and 1008 cm−1 are on account of Si-O-Si and Si-O-Al lattice vibrations; 754, 696, and 539 cm−1 are mainly owing to different Si-O and Al-O vibrations [40]. The physiosorbed water is located at 3450 cm−1 (H-O-H stretching vibration) and 1630 cm−1 (H-O-H bending vibration) [41]. The diagram shows that PEO adsorbs on the inner surface hydroxyl group between the kaolinite layers and adsorbs with the inner hydroxyl group. The water and PEO binding layer are adsorbed on the kaolinite aluminum–oxygen surface, while the silicon–oxygen surface only adsorbs PEO.

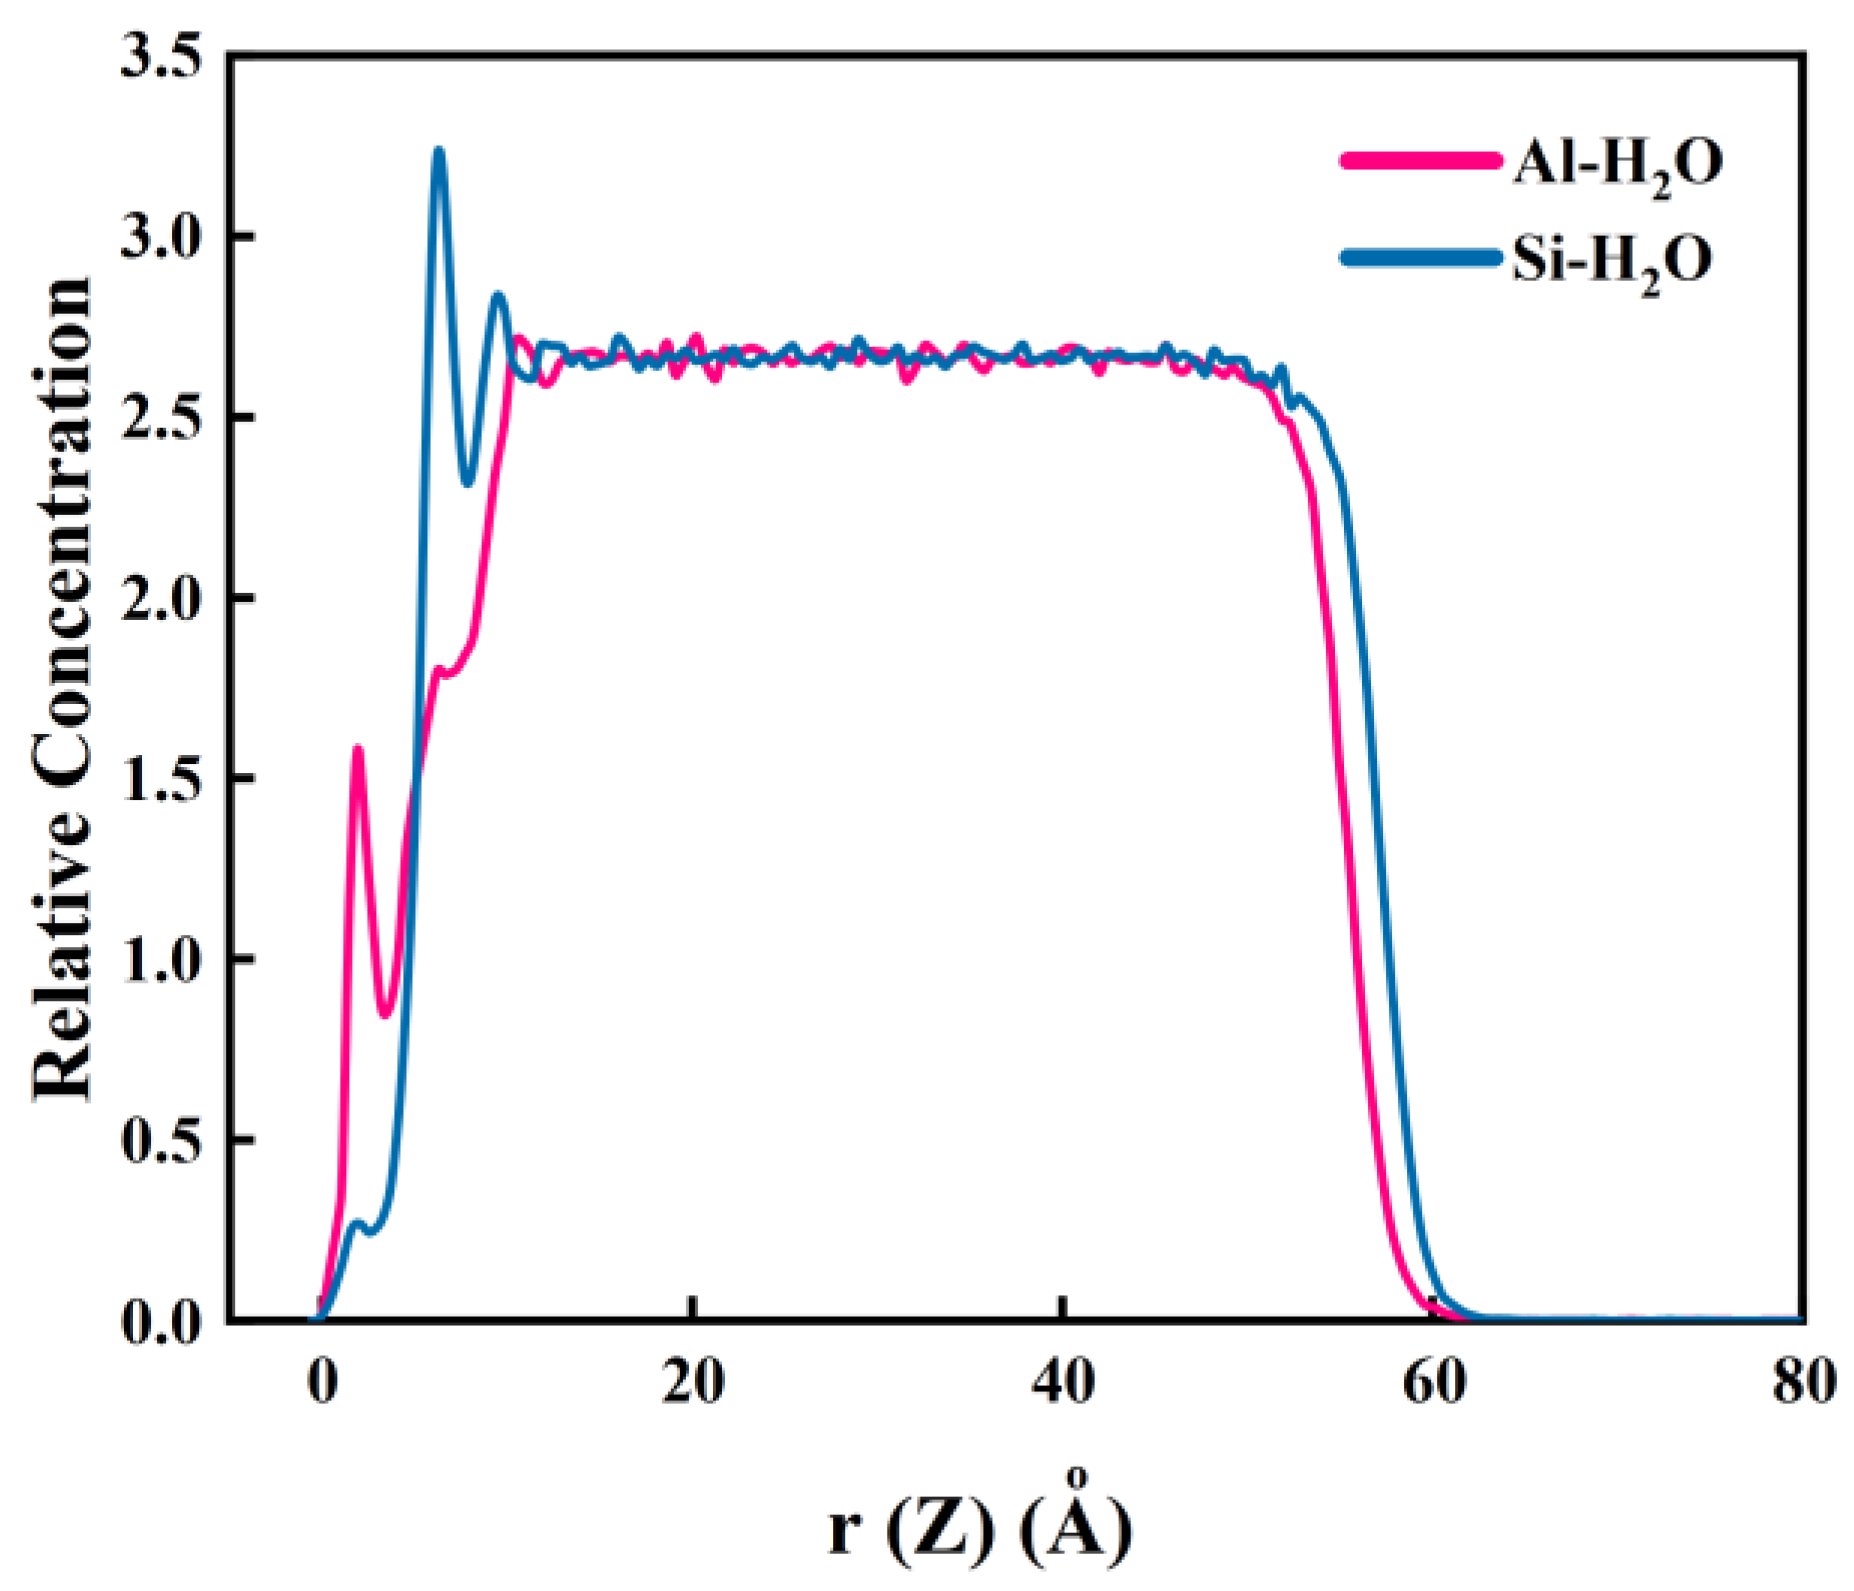
3.4. Interaction between PEO and Kaolinite by MD Simulations

As revealed by the experimental findings, PEO can effectively flocculate kaolinite. Furthermore, the QCM−D results indicate that the adsorption thickness and frequency of PEO on an aluminum–oxygen surface are higher than that on a silicon–oxygen surface. To probe deep into the adsorption behavior of PEO on a kaolinite interface, MD simulation was performed. The adsorption equilibrium configurations of PEO on the kaolinite 001 and 00 1 ¯   surfaces, and the effect of PEO on water molecule attachment, were analyzed by means of a concentration distribution curve, interatomic radial distribution function, and self-diffusion coefficient.
As observed from the spatial equilibrium structure in Figure 12, PEO forms two adsorption layers on the 001 surface and only one on the 00 1 ¯   surface, which is consistent with the QCM−D results because the binding of water molecules makes the mass and thickness of the adsorption layer on the 001 surface greater than that on the 00 1 ¯ surface. Figure 13 displayed the atomic concentration distribution curves of PEO, oxygen atoms of PEO, and carbon atoms of PEO on the 001 and 00 1 ¯   faces of kaolinite. Figure 13a depicts two peaks for PEO on the 001 surface, which is in contrast to Figure 12. The above phenomena indicate that PEO is adsorbed on the 001 surface to form a two-layer structure. The first layer contains water molecules. A hydrogen bond is formed between the 001 surface and the first and second layers. In addition, the peak value of the first layer is 2.54 Å, while the peak value of the second layer is 6.68 Å. In addition, the adsorption concentration decreases with the increase in distance. The maximum concentration of PEO molecules on the 00 1 ¯   side of Figure 13b is 49.41, with a peak value of 2.30 Å, which is higher than that on the 001 side. The oxygen atoms of PEO and the carbon atoms of PEO have a peak value of 2.80 Å, with the maximum concentration of adsorption higher than that on the 001 side. As demonstrated by the above results, the interfacial effect between the PEO and the 00 1 ¯ side is stronger than that on the 001 side, i.e., the adsorption structure is more consistent with higher surface concentration.
The atomic concentration distribution curves of water molecules on the surface of kaolinite 001 and 00 1 ¯ in the presence of PEO are shown in Figure 14. Figure 14 displays the adsorption curves of water molecules on the 001 surface, forming two peaks near the surface, 1.56 at a concentration of 2.01 Å and 1.78 at a concentration of 6.17 Å. Combined with the PEO peak in Figure 13a, this indicates that the PEO/H2O and 001 surface adsorption characteristics are spaced adsorption of PEO and water molecules, i.e., the kaolinite aluminum–oxygen surface adsorbs a layer of water molecules followed by a layer of PEO molecules, and the PEO molecules combine with the water molecules before adsorbing a second layer of PEO molecules. In contrast to the literature, the adsorption of PEO tremendously lessened the concentration of water molecules on the aluminum–oxygen surface and weakened the hydration layer [42]. As can be seen from Figure 14, water is divided into three main layers when adsorbed on the kaolinite 00 1 ¯   surface in the presence of PEO, but a small peak appears at 2.3 Å, which results from the small amount of water molecules trapped between the PEO and 00 1 ¯ surfaces. As comprehensively depicted by the PEO peak in Figure 13b, the silicon–oxygen surface binds closely to the PEO molecule first, and the carbon atoms are closer to the surface, with the hydrogen and oxygen atoms facing outwards, which indicates that the hydroxyl groups are facing outwards, thus forming a hydrated film of three layers of water molecules outside the PEO molecules. As comprehensively illustrated by the PEO peak in Figure 13b, the silicon–oxygen surface is first tightly bound to the PEO molecule and the carbon atoms are closer to the surface, with the hydrogen and oxygen atoms facing outwards, demonstrating that the hydroxyl groups are facing outwards, thus forming a three-layer water molecule structure outside the PEO molecule.
The radial distribution function of the oxygen atom of PEO and carbon atom of PEO on the 001 and 00 1 ¯   surfaces of kaolinite are shown in Figure 15. It can be observed from the curve that PEO-C changes around PEO-O on the two surfaces. The peak position and peak intensity displayed on the curve are almost the same, indicating that the molecular structure changes formed by adsorption on the 001 and 00 1 ¯   surfaces are the same, but the layers are different. As water molecule are more easily adsorbed on the hydroxyl surface than on the aliphatic hydrocarbon chain, the 001 side preferentially absorbs water, and then forms a double-layer structure with phase spacing between the PEO and water molecule. The 00 1 ¯   surface is directly adsorbed with PEO [43,44]. As demonstrated by the above research findings, the coverage of PEO on the silicon–oxygen and aluminum–oxygen surfaces give rise to kaolinite agglomeration and sedimentation, which weakens or isolates the ability of kaolinite to hydrate and disperse. Under such circumstance, the above phenomena weaken the hydrophilicity and strengthen the flocculation bridging effects simultaneously. Furthermore, the adsorption of non-ionic PEO reduces the electrostatic repulsion between the particles and the particles agglomerate and settle.

4. Conclusions

In this study, PEO was used as the flocculant of kaolinite, and the effect of PEO adsorption on the flocculation process of kaolinite was explored. The main observations and conclusions are listed below:
The flocculation and sedimentation test results show that PEO has an obvious flocculation effect in the kaolinite suspension. With the increase in PEO dosage, the speed of kaolinite flocculation to form large flocs becomes faster and the sedimentation speed increases. The flocculation effect of kaolinite reached its best when the amount of PEO was 1 g/L, during which the sedimentation velocity reached 14.6 mm/s and the removal rate of kaolinite reached 97.4%. However, with the PEO concentration further increasing, the reaction time between the agent and kaolinite becomes shorter, and the number of residual fine particles in the supernatant increases.
The results of the QCM−D test show that the adsorption amount of PEO on different mineral base surfaces is kaolinite > alumina > silica. The adsorption equilibrium of PEO on the kaolinite is achieved slightly faster than alumina and silica. Moreover, the thickness of adsorbed PEO structure on the alumina is greater than that on the silica. This is because the hydrophilicity of alumina makes the adsorption of PEO molecules on the alumina surface contain more water molecules. The infrared spectrum results show that PEO adsorbs as a result of the hydroxyls in the kaolinite, which are located outside the aluminum–oxygen surface, inside the interlayer, and outside the edge on the kaolinite.
PEO forms a water-containing double-layer molecular structure on the alumina–oxygen surface of kaolinite, which reduces the density of water molecules on the alumina–oxygen surface and increases the degree of freedom of water molecules on the particle surface. The water molecules in the middle of the PEO and kaolinite molecule layers increase the water content of the flocs. The PEO molecular structure on the alumina–oxygen surface may be the dominant role of flocculation bridging, thereby forming kaolinite surface–surface association. The PEO on the silicon–oxygen surface forms a compact monolayer adsorption, and the carbon atom is closer to the surface than the oxygen atom and the hydrogen atom, which indicates that the vinyl group of PEO forms a hydrophobic association with the silicon–oxygen surface. The adsorbed PEO molecule -OH faces outwards, causing the silicon–oxygen surface to change from hydrophobic to hydrophilic, which helps to form subsequent flocculation bridges with other PEO molecules. The different adsorption structures of PEO molecules on the aluminum–oxygen surface and the silicon–oxygen surface make it easier for the particles to bridge and aggregate to form flocs. The results are helpful to understand the effect of the adsorption structure of PEO on different basal planes of kaolinite on flocculation.

Author Contributions

Conceptualization and methodology, X.T. and X.M.; software, X.M.; validation, formal analysis, data curation, and writing, X.T.; investigation, Y.F., M.C., N.L. and X.D. All authors have read and agreed to the published version of the manuscript.

Funding

This study was supported by National Natural Science Foundation of China (Grant No. 51820105006, 51674174, 51604189), Open Foundation of State Key Laboratory of Mineral Processing (Grant No. BGRIMM-KJSKL-2022-10), and Fund Program for the Scientific Activities of Selected Returned Overseas Professionals in Shanxi Province (Grant No. 20210036).

Data Availability Statement

Not applicable.

Conflicts of Interest

The authors declare no conflict of interest.

References

  1. Fu, Y.; Li, H.; Mei, H.; Feng, Z.; Chen, R.; Li, J.; Wang, Y.; Fu, W.J.F. Organic contaminant removal with no adsorbent recycling based on microstructure modification in coal slime filtration. Fuel 2021, 288, 119630. [Google Scholar] [CrossRef]
  2. Wang, C.; Harbottle, D.; Liu, Q.; Xu, Z. Current state of fine mineral tailings treatment: A critical review on theory and practice. Miner. Eng. 2014, 58, 113–131. [Google Scholar] [CrossRef]
  3. Meng, J.; Niu, J.; Meng, H.; Xia, J.; Zhong, R. Insight on adsorption mechanism of coal molecules at different ranks. Fuel 2020, 267, 117234. [Google Scholar] [CrossRef]
  4. Long, Y.; You, X.; Chen, Y.; Hong, H.; Liao, B.Q.; Lin, H. Filtration behaviors and fouling mechanisms of ultrafiltration process with polyacrylamide flocculation for water treatment. Sci. Total Environ. 2020, 703, 135540. [Google Scholar] [CrossRef] [PubMed]
  5. Xing, Y.; Gui, X.; Cao, Y. Effect of calcium ion on coal flotation in the presence of kaolinite clay. Energy Fuels 2016, 30, 1517–1523. [Google Scholar] [CrossRef]
  6. Khazaie, A.; Mazarji, M.; Samali, B.; Osborne, D.; Minkina, T.; Sushkova, S.; Mandzhieva, S.; Soldatov, A.J.W. A Review on Coagulation/Flocculation in Dewatering of Coal Slurry. Water 2022, 14, 918. [Google Scholar] [CrossRef]
  7. Wang, B.; Peng, Y. The behaviour of mineral matter in fine coal flotation using saline water. Fuel 2013, 109, 309–315. [Google Scholar] [CrossRef]
  8. Wada, R.; Fujimoto, K.; Kato, M. Why Is Poly (oxyethylene) soluble in water? Evidence from the thermodynamic profile of the conformational equilibria of 1, 2-dimethoxyethane and dimethoxymethane revealed by Raman Spectroscopy. J. Phys. Chem. B 2014, 118, 12223–12231. [Google Scholar] [CrossRef]
  9. Cadotte, M.; Tellier, M.E.; Blanco, A.; Fuente, E.; Van De Ven, T.G.; Paris, J. Flocculation, retention and drainage in papermaking: A comparative study of polymeric additives. Can. J. Chem. Eng. 2007, 85, 240–248. [Google Scholar] [CrossRef]
  10. Shi, H.; Fatehi, P.; Xiao, H.; Ni, Y. Optimizing the poly ethylene oxide flocculation process for isolating lignin of prehydrolysis liquor of a kraft-based dissolving pulp production process. Ind. Eng. Chem. Res. 2012, 51, 5330–5335. [Google Scholar] [CrossRef]
  11. Li, S.; Gao, L.; Wang, J.; Zhou, H.; Liao, Y.; Xing, Y.; Gui, X.; Cao, Y.J.M.E. Polyethylene oxide assisted separation of molybdenite from quartz by flotation. Miner. Eng. 2021, 162, 106765. [Google Scholar] [CrossRef]
  12. Castro, S.; Laskowski, J.S. Depressing effect of flocculants on molybdenite flotation. Miner. Eng. 2015, 74, 13–19. [Google Scholar] [CrossRef]
  13. Bruls, D.M.; Evers, T.H.; Kahlman, J.A.H.; Van Lankvelt, P.J.W.; Ovsyanko, M.; Pelssers, E.G.M.; Schleipen, J.J.H.B.; de Theije, F.K.; Verschuren, C.A.; van der Wijk, T.; et al. Rapid integrated biosensor for multiplexed immunoassays based on actuated magnetic nanoparticles. Lab Chip 2009, 9, 3504–3510. [Google Scholar] [CrossRef] [PubMed]
  14. Adachi, Y.; Wada, T. Initial stage dynamics of bridging flocculation of polystyrene latex spheres with polyethylene oxide. J. Colloid Interface Sci. 2000, 229, 148–154. [Google Scholar] [CrossRef]
  15. Wiśniewska, M.; Chibowski, S.; Urban, T. Investigations of flocculation possibilities of the water alumina suspension in the presence of nonionic polymer. J. Ind. Eng. Chem. 2013, 19, 263–271. [Google Scholar] [CrossRef]
  16. Lee, J.H.; Kim, K.O.; Ju, Y.M. Polyethylene oxide additive-entrapped polyvinyl chloride as a new blood bag material. J. Biomed. Mater. Res. Off. J. Soc. Biomater. Jpn. Soc. Biomater. Aust. Soc. Biomater. 1999, 48, 328–334. [Google Scholar] [CrossRef]
  17. Su, C.C.; Shen, Y.H. Adsorption of poly (ethylene oxide) on smectite: Effect of layer charge. J. Colloid Interface Sci. 2009, 332, 11–15. [Google Scholar] [CrossRef]
  18. Koksal, E.; Ramachandran, R.; Somasundaran, P.; Maltesh, C. Flocculation of oxides using polyethylene oxide. Powder Technol. 1990, 62, 253–259. [Google Scholar] [CrossRef]
  19. Wang, D.; Wang, D.; Deng, C.; Wang, K.; Tan, X.; Liu, Q. Flocculation of quartz by a dual polymer system containing tannic acid and poly (ethylene oxide): Effect of polymer chemistry and hydrodynamic conditions. Chem. Eng. J. 2022, 446, 137403. [Google Scholar] [CrossRef]
  20. Geonzon, L.C.; Kobayashi, M.; Sugimoto, T.; Adachi, Y. Study on the kinetics of adsorption of poly (ethylene oxide) onto a silica particle using optical tweezers and microfluidics. Colloids Surf. A Physicochem. Eng. Asp. 2022, 642, 128691. [Google Scholar] [CrossRef]
  21. Mpofu, P.; Addai-Mensah, J.; Ralston, J. Investigation of the effect of polymer structure type on flocculation, rheology and dewatering behaviour of kaolinite dispersions. Int. J. Miner. Process. 2003, 71, 247–268. [Google Scholar] [CrossRef]
  22. Thompson, M.S.; Vadala, T.P.; Vadala, M.L.; Lin, Y.; Riffle, J.S. Synthesis and applications of heterobifunctional poly (ethylene oxide) oligomers. Polymer 2008, 49, 345–373. [Google Scholar] [CrossRef] [Green Version]
  23. Alagha, L.; Wang, S.; Xu, Z.; Masliyah, J. Adsorption kinetics of a novel organic–inorganic hybrid polymer on silica and alumina studied by quartz crystal microbalance. J. Phys. Chem. C 2011, 115, 15390–15402. [Google Scholar] [CrossRef]
  24. Cooper, M.A.; Singleton, V.T. A survey of the 2001 to 2005 quartz crystal microbalance biosensor literature: Applications of acoustic physics to the analysis of biomolecular interactions. J. Mol. Recognit. Interdiscip. J. 2007, 20, 154–184. [Google Scholar] [CrossRef] [PubMed]
  25. Zou, W.; Gong, L.; Huang, J.; Zhang, Z.; Sun, C.; Zeng, H. Adsorption of hydrophobically modified polyacrylamide P (AM-NaAA-C16DMAAC) on model coal and clay surfaces and the effect on selective flocculation of fine coal. Miner. Eng. 2019, 142, 105887. [Google Scholar] [CrossRef]
  26. Wang, S.; Alagha, L.; Xu, Z. Adsorption of organic–inorganic hybrid polymers on kaolin from aqueous solutions. Colloids Surf. APhysicochem. Eng. Asp. 2014, 453, 13–20. [Google Scholar] [CrossRef]
  27. Lee, H.; Venable, R.M.; MacKerell Jr, A.D.; Pastor, R.W. Molecular dynamics studies of polyethylene oxide and polyethylene glycol: Hydrodynamic radius and shape anisotropy. Biophys. J. 2008, 95, 1590–1599. [Google Scholar] [CrossRef] [Green Version]
  28. Johnson, J.A.; Saboungi, M.L.; Price, D.L.; Ansell, S.; Russell, T.P.; Halley, J.W.; Nielsen, B. Atomic structure of solid and liquid polyethylene oxide. J. Chem. Phys. 1998, 109, 7005–7010. [Google Scholar] [CrossRef]
  29. Lee, H.; de Vries, A.H.; Marrink, S.J.; Pastor, R.W. A coarse-grained model for polyethylene oxide and polyethylene glycol: Conformation and hydrodynamics. J. Phys. Chem. B 2009, 113, 13186–13194. [Google Scholar] [CrossRef] [Green Version]
  30. Quezada, G.R.; Leiva, W.; Saavedra, J.H.; Robles, P.; Gálvez, E.; Jeldres, R.I. A Molecular Dynamics Simulation of Polymers’ Interactions with Kaolinite (010) Surfaces in Saline Solutions. Polymers 2022, 14, 3851. [Google Scholar] [CrossRef]
  31. Ren, B.; Min, F.; Liu, L.; Chen, J.; Liu, C.; Lv, K. Adsorption of different PAM structural units on kaolinite (0 0 1) surface: Density functional theory study. Appl. Surf. Sci. 2020, 504, 144324. [Google Scholar] [CrossRef]
  32. Ren, B.; Lv, K.; Min, F.; Chen, J.; Liu, C. A new insight into the adsorption behavior of NPAM on kaolinite/water interface: Experimental and theoretical approach. Fuel 2021, 303, 121299. [Google Scholar] [CrossRef]
  33. Jacquet, A.; Geatches, D.L.; Clark, S.J.; Greenwell, H.C. Understanding cationic polymer adsorption on mineral surfaces: Kaolinite in cement aggregates. Minerals 2018, 8, 130. [Google Scholar] [CrossRef] [Green Version]
  34. Luo, J.; Liu, M.; Xing, Y.; Gui, X.; Li, J. Investigating agglomeration of kaolinite particles in the presence of dodecylamine by force testing and molecular dynamics simulation. Colloids Surf. A Physicochem. Eng. Asp. 2022, 645, 128930. [Google Scholar] [CrossRef]
  35. Underwood, T.R.; Bourg, I.C. Large-scale molecular dynamics simulation of the dehydration of a suspension of smectite clay nanoparticles. J. Phys. Chem. C 2020, 124, 3702–3714. [Google Scholar] [CrossRef] [Green Version]
  36. Gamba, M.; Kovář, P.; Pospíšil, M.; Sánchez, R.M.T. Insight into thiabendazole interaction with montmorillonite and organically modified montmorillonites. Appl. Clay Sci. 2017, 137, 59–68. [Google Scholar] [CrossRef]
  37. Zhang, S.; Liu, Q.; Gao, F.; Ma, R.; Wu, Z.; Teppen, B.J. Interfacial structure and interaction of kaolinite intercalated with N-methylformamide insight from molecular dynamics modeling. Appl. Clay Sci. 2018, 158, 204–210. [Google Scholar] [CrossRef]
  38. Alagha, L.; Wang, S.; Yan, L.; Xu, Z.; Masliyah, J. Probing adsorption of polyacrylamide-based polymers on anisotropic basal planes of kaolinite using quartz crystal microbalance. Langmuir 2013, 29, 3989–3998. [Google Scholar] [CrossRef]
  39. Kristof, J.; Mink, J.; Horvath, E.; Gabor, M. Intercalation study of clay minerals by Fourier transform infrared spectrometry. Vib. Spectrosc. 1993, 5, 61–67. [Google Scholar] [CrossRef]
  40. Saikia, B.J.; Parthasarathy, G. Fourier transform infrared spectroscopic characterization of kaolinite from Assam and Meghalaya, Northeastern India. J. Mod. Phys. 2010, 1, 206–210. [Google Scholar] [CrossRef]
  41. Hoch, M.; Bandara, A. Determination of the adsorption process of tributyltin (TBT) and monobutyltin (MBT) onto kaolinite surface using Fourier transform infrared (FTIR) spectroscopy. Colloids Surf. A Physicochem. Eng. Asp. 2005, 253, 117–124. [Google Scholar] [CrossRef]
  42. Chen, R.; Dong, X.; Fan, Y.; Ma, X.; Dong, Y.; Chang, M. Interaction between STAC and coal/kaolinite in tailing dewatering: An experimental and molecular-simulation study. Fuel 2020, 279, 118224. [Google Scholar] [CrossRef]
  43. Wu, J.; Liu, J.; Yuan, S.; Wang, Z.; Zhou, J.; Cen, K. Theoretical investigation of noncovalent interactions between low-rank coal and water. Energy Fuels 2016, 30, 7118–7124. [Google Scholar] [CrossRef]
  44. Cheng, H.; Zhang, S.; Liu, Q.; Li, X.; Frost, R.L. The molecular structure of kaolinite–potassium acetate intercalation complexes: A combined experimental and molecular dynamic simulation study. Appl. Clay Sci. 2015, 116, 273–280. [Google Scholar] [CrossRef]
Figure 1. Particle size distribution of kaolinite samples.
Minerals 12 01585 g001
Figure 2. XRD pattern of the original kaolinite.
Minerals 12 01585 g002
Figure 3. Molecular structures of different models: (a) Water molecule, (b) 3500 water molecules, (c) PEO molecular, (d) 25 PEO molecules, (e) Kaolinite 001 surfaces, (f) kaolinite 00 1 ¯   surfaces, (g) Kaolinite 001/PEO/H2O interface model, (h) Kaolinite 00 1 ¯ /PEO/H2O interface model. The color representation is as follows: Red—oxygen atoms, white—hydrogen atoms, yellow—silicon atoms, purple—aluminum atoms, and grey—carbon atoms. (For interpretation of the references to color in this figure legend, the reader is referred to the web version of this article.)
Minerals 12 01585 g003
Figure 4. Percentage removal and settling rate of kaolinite at different PEO concentrations.
Minerals 12 01585 g004
Figure 5. Stereomicroscopy images of kaolinite flocculation morphology at different PEO concentrations: (a) 0.4 g/L; (b) 0.6 g/L; (c) 0.8 g/L; (d) 1 g/L; (e) 1.2 g/L.
Minerals 12 01585 g005
Figure 6. Weighted trend of the average diameter of kaolinite suspension with different concentrations of PEO.
Minerals 12 01585 g006
Figure 7. Weighted distribution of kaolinite suspension with different concentrations of PEO.
Minerals 12 01585 g007
Figure 8. Unweighted distribution of kaolinite suspension with different concentrations of PEO.
Minerals 12 01585 g008
Figure 9. Frequency variation of adsorption of PEO by kaolinite, alumina, and silicon oxide chips.
Minerals 12 01585 g009
Figure 10. Adsorption amount and adsorption layer thickness of PEO on alumina and silicon.
Minerals 12 01585 g010
Figure 11. FTIR spectra of kaolinite before and after PEO treatment.
Minerals 12 01585 g011
Figure 12. Spatial equilibrium structure of PEO adsorption on (a) Kaolinite 001 surface and (b) Kaolinite 00 1 ¯ surface.
Minerals 12 01585 g012
Figure 13. The relative concentration distributions of oxygen and carbon atoms of PEO and PEO (a) kaolinite 001 surface and (b) Kaolinite 00 1 ¯ surface.
Minerals 12 01585 g013
Figure 14. Relative concentration distributions of water molecules on kaolinite 001 surface and Kaolinite 00 1 ¯ surface.
Minerals 12 01585 g014
Figure 15. Radial distribution function of the oxygen atom to carbon atom of PEO for kaolinite 001 surface and 00 1 ¯ surface.
Minerals 12 01585 g015
Publisher’s Note: MDPI stays neutral with regard to jurisdictional claims in published maps and institutional affiliations.

