
Crystal Engineering in Antisolvent Crystallization of Rare Earth Elements (REEs)


Crystallization and Precipitation Research Unit, University of Cape Town, Cape Town 7700, South Africa
*
Author to whom correspondence should be addressed.
Minerals 2022, 12(12), 1554; https://doi.org/10.3390/min12121554
Submission received: 31 October 2022
/
Revised: 26 November 2022
/
Accepted: 28 November 2022
/
Published: 1 December 2022
(This article belongs to the Special Issue Recent Developments in Mineral Processing at University of Cape Town)
Abstract
:Antisolvent crystallization is a separation technology that separates the solute from the solvent by the addition of another solvent, in which the solute is sparingly soluble. High yields are achieved by using higher antisolvent-to-aqueous ratios, but this generates higher supersaturation, which causes excessive nucleation. This results in the production of smaller particles, which are difficult to handle in downstream processes. In this work, the effect of varying the organic (antisolvent)-to-aqueous (O/A) ratio and seed loading on the yield, particle size distribution, and morphology of neodymium sulphate product, during its recovery from an aqueous leach solution using antisolvent crystallization, was investigated. A batch crystallizer was used for the experiments, while ethanol was used as an antisolvent. Neodymium sulphate octahydrate [Nd2(SO4)3.8H2O] seeds were used to investigate the effect of seed loading. It was found that particle sizes increased as the O/A ratio increased. This was attributed to the agglomeration of smaller particles that formed at high supersaturation. An O/A ratio of 1.4 resulted in higher yields and particles with a plate-like morphology. The increase in yield was attributed to the increased interaction of ethanol molecules with the solvent, which reduced the solubility of neodymium sulphate. Increasing the seed loading resulted in smaller particle sizes with narrow particle size distribution and improved filtration performance. This was attributed to the promotion of crystal growth and suppression of agglomeration in the presence of seeds.
1. Introduction
Rare Earth Elements (REEs) consist of 15 lanthanides, from lanthanum (La) to lutetium (Lu), including yttrium (Y) and scandium (Sc) [1]. REEs, such as neodymium (Nd), praseodymium (Pr), and dysprosium (Dy), are used in applications, such as Hybrid Electric Vehicles (HEVs), magnets for wind turbines, and fuel cells [2,3,4,5]. The use of REES in these applications has increased their demand significantly. There has been an impetus to develop strategies and ways of recycling REEs due to concerns about the future availability of these elements. One such strategy is to recover REEs from spent Nickel Metal Hydride (NiMH) batteries.
As of 2016, the production of NiMH batteries was one billion cells per year due to their use in HEVs [6], which therefore presents a major source for recycling REEs at the end of life of the NiMH batteries. To recover the REEs from the NiMH battery, the battery is dismantled, and the anode material is leached using a strong acid. The residue is then separated from the leach solution using filtration [7]. Crystallization and precipitation methods have been employed to recover the REEs from the leach solution. Antisolvent crystallization is a potentially novel method in metallurgy that could be used. It involves the addition of a solvent, in which the solute is sparingly soluble, to induce the crystallization or precipitation of the solute [8]. This method has the advantage that the antisolvent can be recovered and recycled. The process can be carried out at ambient temperatures, which, aside from convenience and economic considerations, is important for heat-sensitive compounds [9]. The antisolvent crystallization stage requires less energy than the equivalent in processes, such as evaporative crystallization [10]. The main disadvantage of this method is that the solvent–antisolvent mixture must be subsequently separated to recover and recycle one or both solvents. However, the added cost of the separation operation can be absorbed if invaluable products are recovered [11].
The achievement of high yields in antisolvent crystallization often requires the use of large quantities of the antisolvent. This is necessary to reduce the solubility of the solute significantly. Increasing the amount of antisolvent enhances the interaction between the antisolvent molecules and species in the aqueous phase [12,13,14]. This can potentially increase the degree of supersaturation in the crystallizer, resulting in excessive nucleation and smaller final particle sizes [10,15,16].
In the recovery of scandium using antisolvent crystallization, Peters et al. [17] and Kaya et al. [18] found that using higher quantities of the antisolvent produced smaller crystals of ammonium scandium hexafluoride. This was attributed to a high degree of supersaturation under these conditions. It was recommended, from the study, that controlling supersaturation and seeding can be implemented to control the rate of nucleation and enhance the rate of crystal growth in the antisolvent crystallization of REEs. Therefore, crystal engineering in antisolvent crystallization, through supersaturation control and seeding, offers several options to obtain the desired product. The supersaturation ratio (S) can be calculated using Equation (1):
where γi and νi are the activity coefficient and units of species i, respectively. KSP is the solubility product constant. In order to control the degree of supersaturation in antisolvent crystallization, a suitable antisolvent-to-aqueous (O/A) ratio should be selected. It is, therefore, important to understand the effect of varying the O/A ratio on the yield, particle size, and morphology of the product.
Seeding can also be used in crystal engineering to control spontaneous homogeneous nucleation by promoting either secondary nucleation or crystal growth during crystallization. It has the potential to produce crystals that are easy to handle in downstream processes, such as filtration and drying [19,20,21]. Seeding can induce crystallization at lower supersaturation, within the metastable zone, by providing a sufficient surface area for the consumption of supersaturation [22]. The advantages of seeding include the recovery of products of consistent size and the reduction of batch time of operation at an industrial scale [7].
Seed characteristics, such as size, size distribution, and morphology, as well as the amount of seeds (seed loading) and timing of seed addition, can potentially affect the characteristics of the product crystals [19,23]. In their studies of batch cooling crystallization, Doki et al. [24] concluded that there is a minimum mass of seeds required to minimize secondary nucleation. This quantity of seeds is called the critical seed loading and is calculated as shown in Equation (2).
where CS* is the critical seed loading ratio (-), and LS is the initial mean size of the seeds (µm).
CS* = 2.17 × 10⁻⁶ LS2
The total surface area of the provided seeds must be sufficient to suppress primary nucleation in the crystallizer resulting in a product with a narrow particle size distribution (PSD) [25,26]. Beckmann [27] highlighted that small crystals are recovered when the total surface area of the seeds, in a batch crystallizer, is low and insufficient to consume the supersaturation in a reasonable time (e.g., 20 min).
Eder et al. [28] found that a higher seed loading resulted in smaller final particle sizes and attributed this to the availability of a higher number of individual seed particles, which provided crystallization sites. Sander et al. [29] found that higher seed loadings and bigger seed sizes (greater than 180 µm) broadened the particle size distribution (PSD) of the product. The broader PSD was attributed to increased rates of secondary nucleation (contact breeding) and breakage, which generated smaller particles, and the use of bigger seed sizes, which shifted the PSD to coarser fractions. Loï Mi Lung-Somarriba et al. [19] recommended using smaller seeds as they produced larger bipyramidal crystals, which were easy to filter. The authors also found that using very large seed crystals results in attrition and limited crystal growth, due to secondary nucleation, which agrees with the findings of Sander et al. [29]. The available literature mainly focuses on cooling crystallization and antisolvent crystallization in pharmaceutical industries.
The aim of this study was to investigate and understand the effect of varying the O/A ratios and seed loading on yield, PSD, and morphology of neodymium sulphate crystals. The product was recovered from an aqueous leach solution using antisolvent crystallization.
2. Materials and Methods
2.1. Experimental Design
A 3.5 g/L neodymium sulphate synthetic aqueous solution, mimicking the concentration of neodymium sulphate in leach solutions from NiMH batteries, was used for all the experiments. Ethanol was used as the antisolvent. Experiments were conducted in three phases, and all experiments were conducted in triplicate and randomised. Thermodynamic modelling, to predict theoretical yield of Nd2(SO4)3.8H2O and activity coefficients for neodymium and sulphate ions, was conducted using OLI Stream Analyzer (11.0, OLI Systems, New Jersey, NJ, USA) [30]. The first set of experiments was aimed at investigating the effect of varying the O/A ratios on product yield, PSD, and morphology of Nd2(SO4)3.8H2O in batch antisolvent crystallization. Ethanol and the neodymium sulphate aqueous leach solution were pumped into the crystallizer, simultaneously, to ensure a constant O/A ratio. Table 1 represents the flow rates and the O/A ratios that were used in the experiments.
The second set of experiments was conducted at an O/A ratio of 0.8 and 1.4 to determine the evolution of moments of PSDs at different batch times of 0.25 h, 0.5 h, 1.0 h, and 2.5 h. The aim of these tests was to determine the phenomena causing size enlargement at the O/A ratios of 0.8 and 1.4. The evolution of moments was calculated using Equation (3), where mj is the respective moment. The number density function was calculated using Equation (4), where vol% is the volume of the solids in a size range (L); conc. (vol%) is the total concentration of solids (vol%) as measured by the instrument, and n(L) is the number density function [31].
A volume shape factor (kv) equal to π/6 was used. The total surface area and total volume were obtained by multiplying the second and third moments with the area and volume shape factors (ka and kv), respectively.
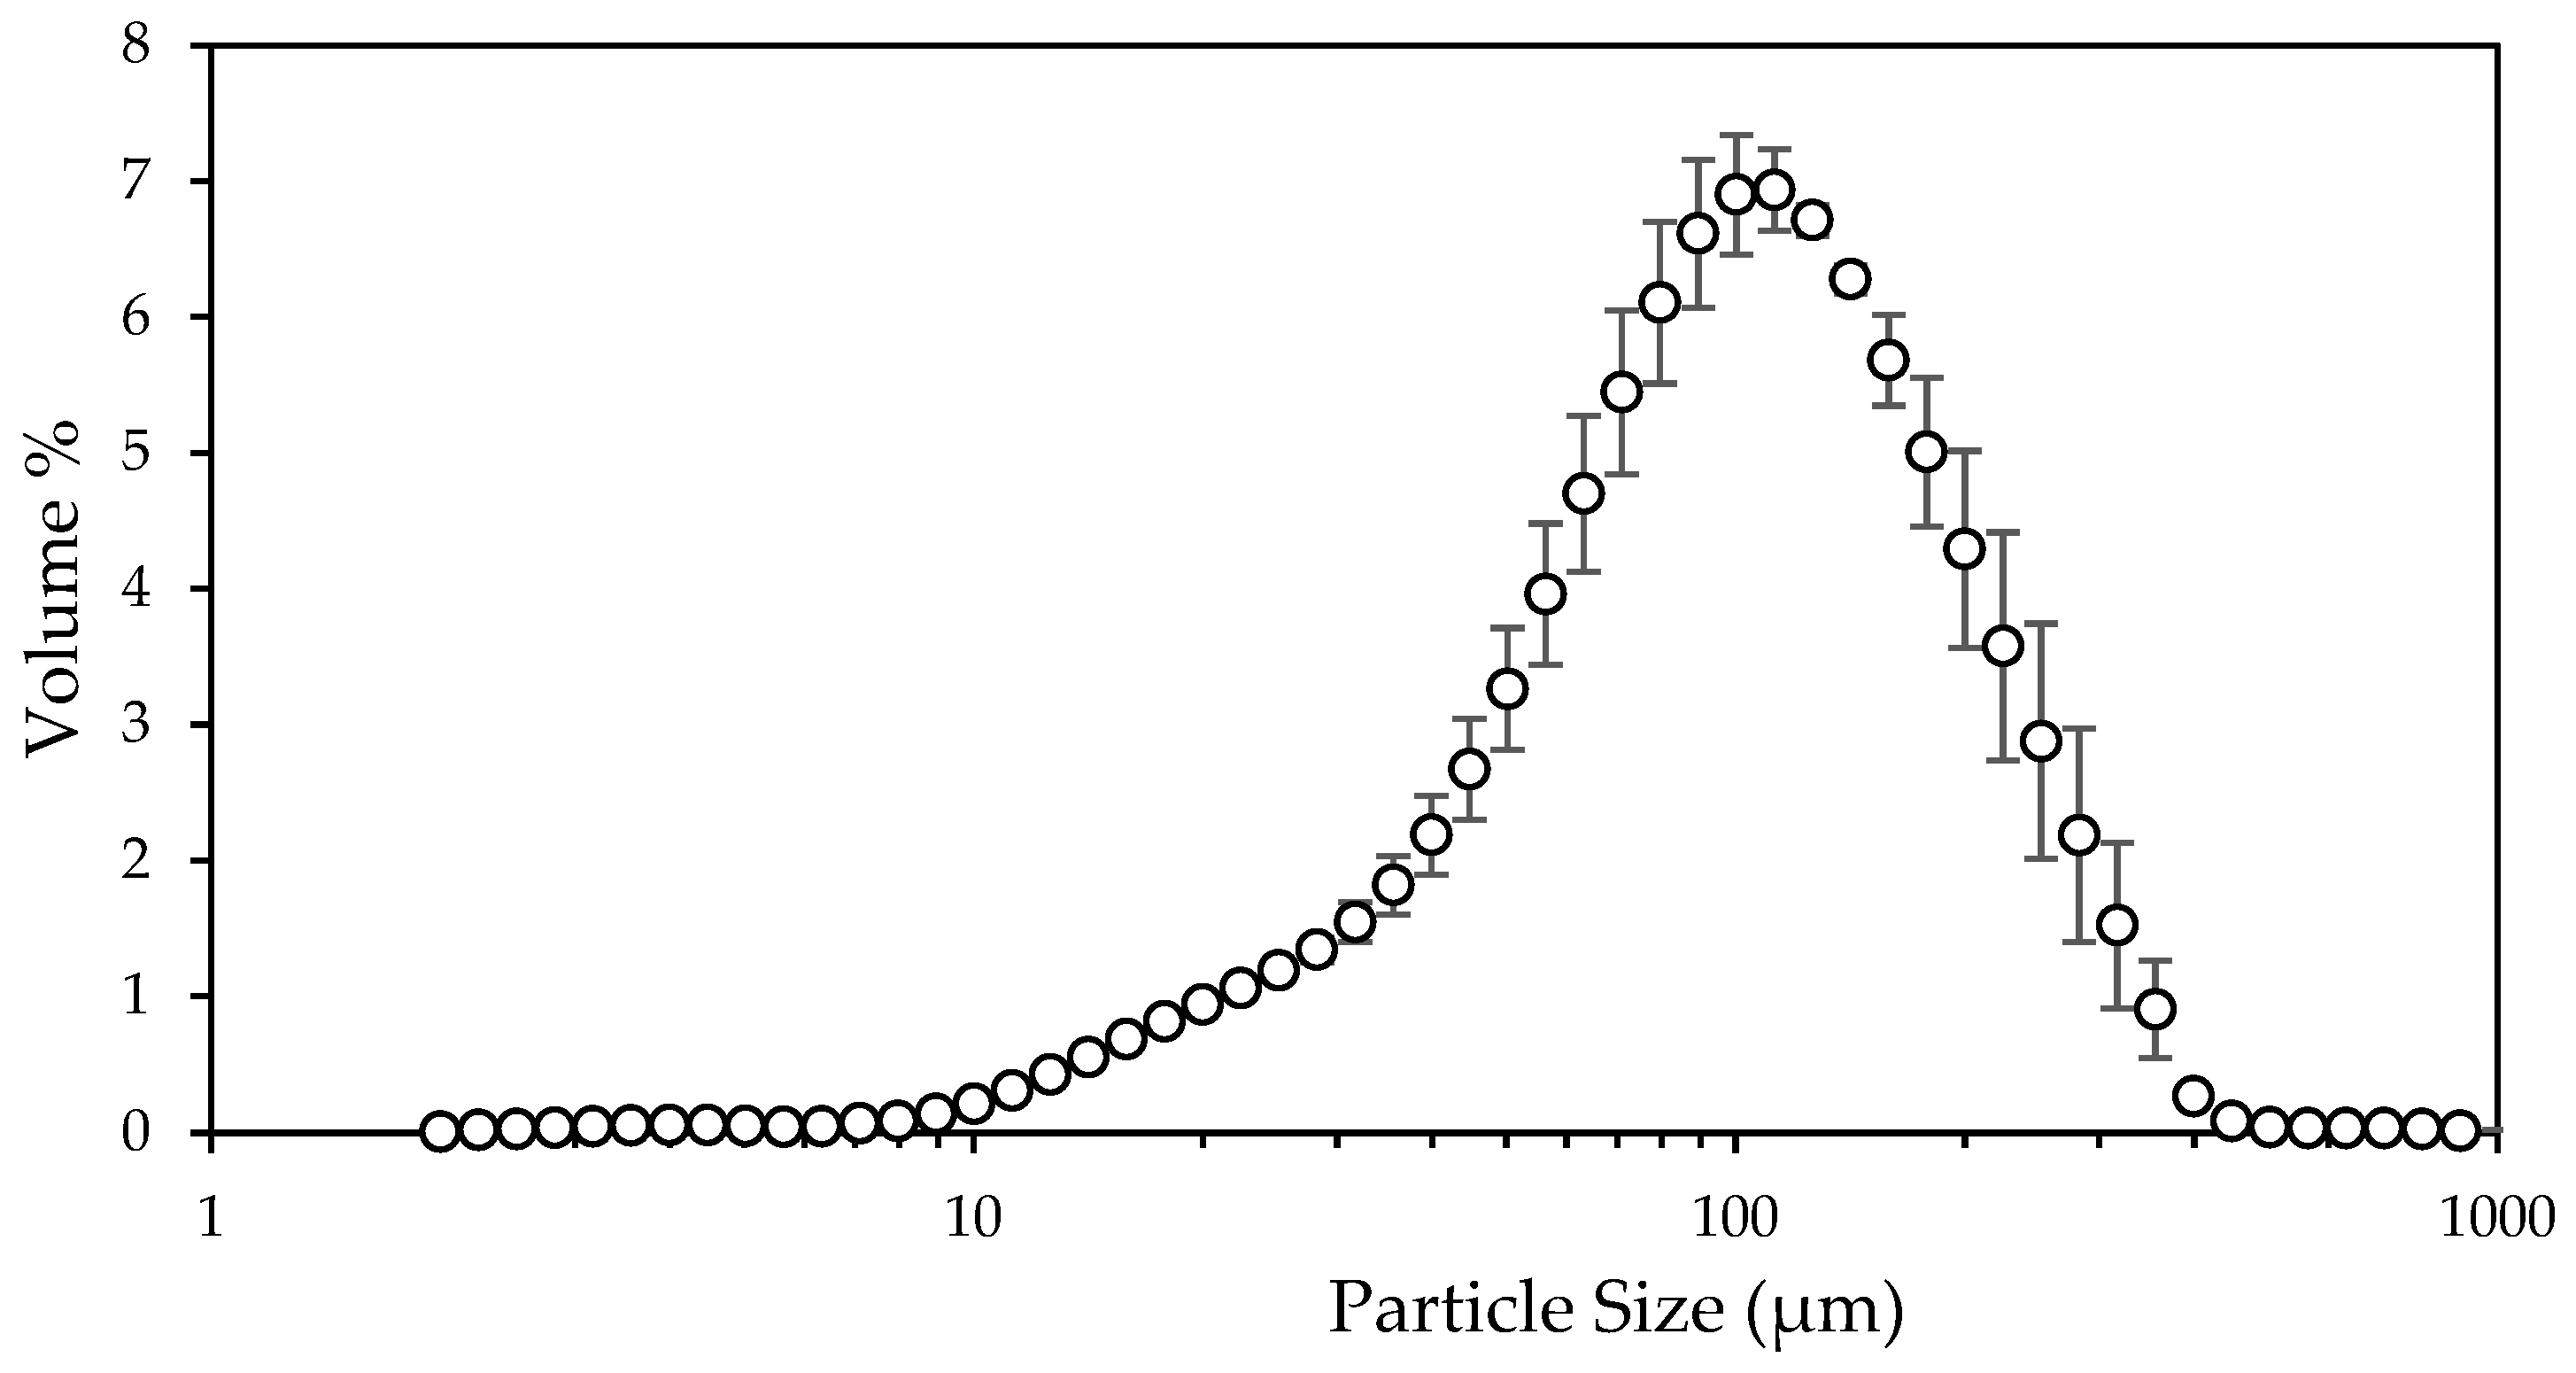
The third set of experiments aimed to investigate the effect of seed loading on the product PSD and morphology of Nd2(SO4)3.8H2O in batch antisolvent crystallization. The PSD of the Nd2(SO4)3.8H2O seeds used in the experiments is shown in Figure 1. Nd2(SO)4.8H2O product recovered from experiments conducted at an O/A ratio of 0.4 was used as seeding material. The effect of seed loading on the PSD and crystal morphology of the product was investigated at the O/A ratio of 1.4. This O/A ratio was selected because maximum yield of the product was obtained at this ratio while the filtration of the product was poor.
The mean size of the seeds was 117.2 µm. The critical seed loading was quantified using Equation (2) and was found to be 2.98% of the theoretical yield. Seeding was then conducted at seed loadings between 0.64% and 20% of the theoretical yield by weight (0.64%, 5%, 10%, and 20%). This range of seed loading covered values below and above the estimated critical seed loading.
2.2. Experimental Equipment
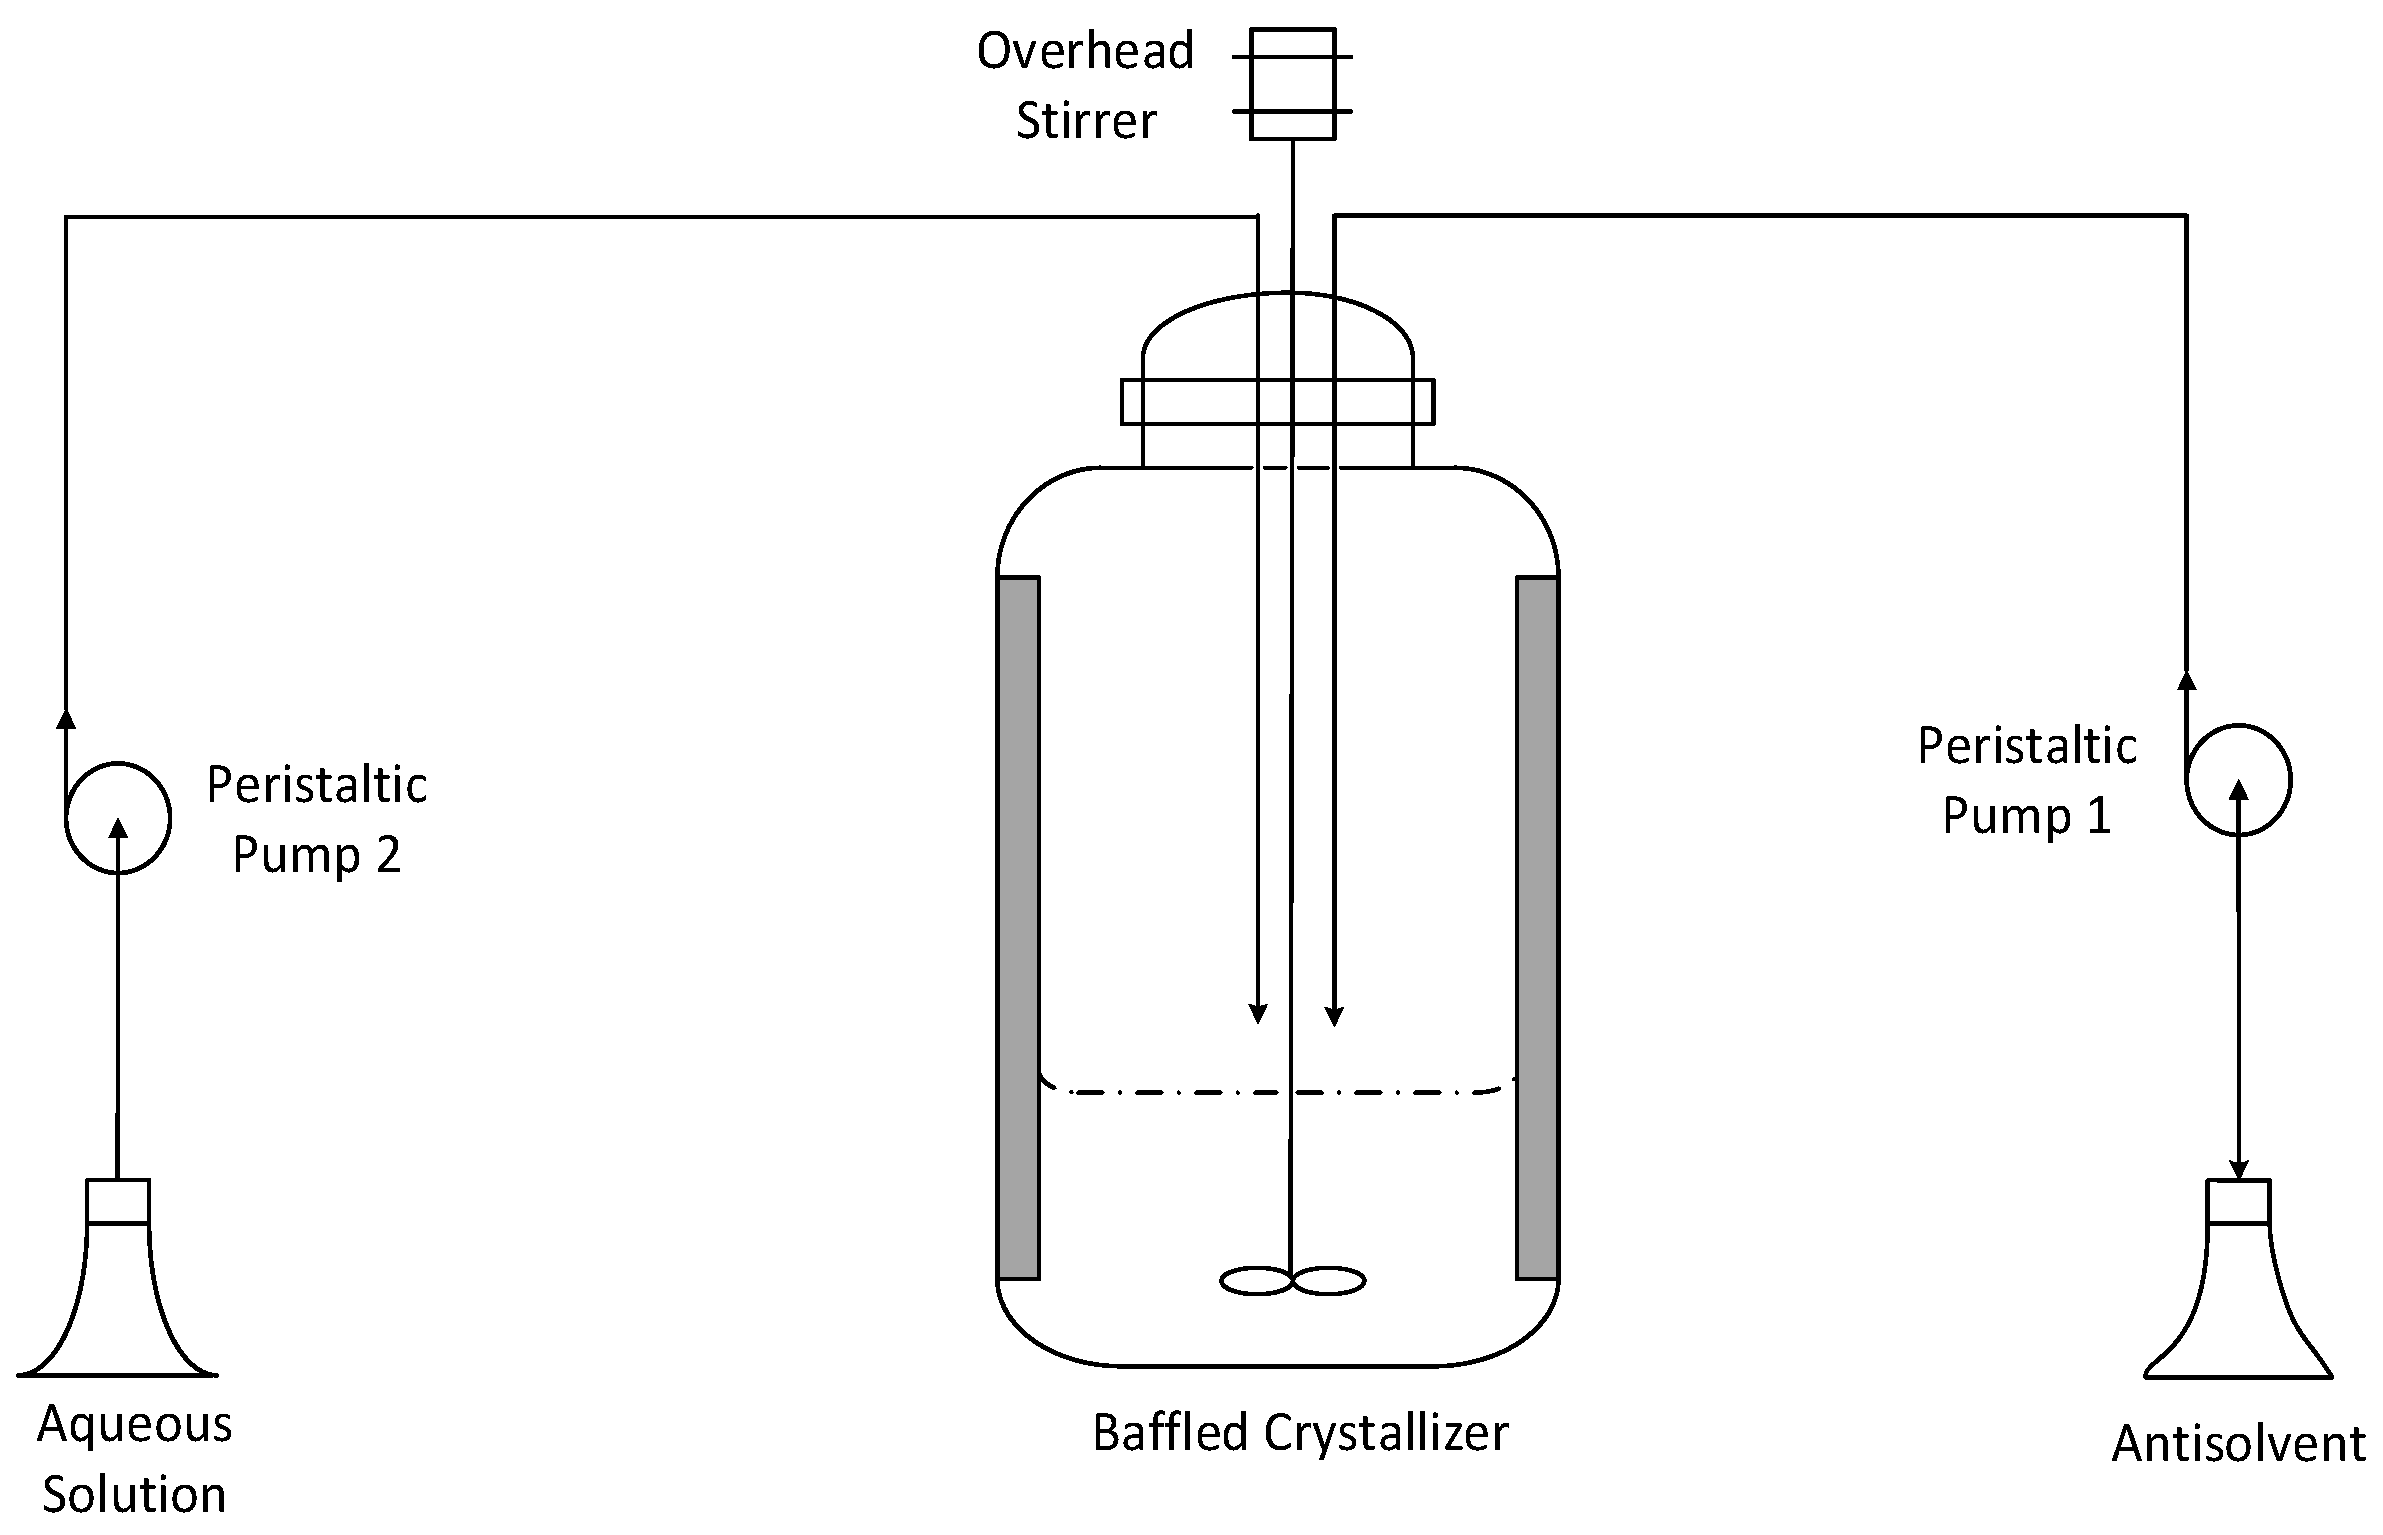
All experiments were conducted in a 500 mL baffled glass batch crystallizer, shown in Figure 2. The crystallizer had 3 baffles, and its diameter was 0.08 m. Two Watson Marlow 520S peristaltic pumps (Watson-Marlow Bredel S.A. (Pty) Ltd., Johannesburg, South Africa) were used to pump the aqueous leach solution and ethanol. A digital overhead stirrer (IKA RW 20, IKA, Staufen, Germany), which was connected to a stainless steel six-blade Rushton turbine impeller, was used to provide mixing at a Reynolds number of 11,000. The impeller diameter was 0.03 m and was placed a third from the bottom of the crystallizer. Glass conical flasks (250 mL) were used for the storage of ethanol and the aqueous solutions as represented in Figure 2.
A laser diffraction particle size analyser (Malvern Mastersizer 2000, Malvern Panalytical, Malvern, UK) was used to measure the PSD. Crystal morphology was determined from images that were acquired using the Tescan MIRA3 Rise Scanning Electron Microscope (SEM, Wirsam Scientific, Johannesburg, South Africa).
2.3. Experimental Procedure
Nd2(SO4)3.8H2O, with 99.9% purity (ThermoFisher GmbH, Kandel, Germany) was weighed on a digital scale (Radwag AS220.R2 Plus, Radwag Electronics, Radom, Poland) and dissolved in deionised water. Nd2(SO4)3.8H2O did not dissolve fully; hence, the aqueous leach solution was filtered through a 0.22 µm nylon membrane filter, which was supported by a Merck Millipore glass holder. A Vacutec oil-less piston vacuum pump, connected to a filter flask, was used for filtration. The residue was left to dry for five days at room temperature (22 ± 2 °C). After five days, the final weight was constant, and it was assumed that drying had been completed.
The filtrate, that is Nd2(SO4)3 aqueous solution, was used as the synthetic leach solution. The synthetic aqueous leach solution and ethanol were then pumped simultaneously into the crystallizer. The O/A ratios adopted in the experiments were between 0.6 and 1.4 (0.6, 0.8, 1.0, 1.2, and 1.4). The stirrer was started before ethanol and the aqueous solution were fed into the crystallizer. The fluid motion was turbulent, and the stirrer rotational speed was enough to suspend seeds and the products at all the O/A ratios. Experiments to determine the effect of varying the O/A ratios on product characteristics were run for batch times between 0.25 h and 2.5 h.
After every experimental run, a sample of the product slurry was collected for PSD measurement. The vacuum pump, connected to the filter flask, was started, and the remaining slurry from the crystallizer was poured into the filter funnel, connected to the filter flask, for filtration. At the same time, a stopwatch was started to measure the duration of filtration. At the end of the filtration, the duration was recorded, and the product was harvested for drying. The recovered product was dried for five days, and its mass was weighed to determine the yield. Equation (5) was used for calculating the yield.
A sample of the dried product was collected for image analysis, and images were obtained at different magnifications of 10,000; 5000; 1000; and 500. At least 30 images were acquired at each set of conditions including repeats (e.g., at an O/A ratio of 0.8) to improve the representativeness of the analysed sample.
Independent experiments were conducted at different batch times to calculate the evolution of moments. The batch times used were 0.25 h, 0.5 h, 1.0 h, and 2.5 h. After every batch cycle, the experiment was stopped, and the procedure described above for PSD analysis was followed.
The effect of seed loading on the size and morphology of the Nd2(SO4)3.8H2O product, recovered using antisolvent crystallization, was investigated by adding Nd2(SO4)3.8H2O seeds before the aqueous leach solution and ethanol were fed into the crystallizer. This was to ensure that the seeds were available in the reactor before the initiation of crystallization. The batch time for these experiments was set at 2.5 h. The procedure in these tests was the same as described above except for the seed addition step.
3. Results and Discussion
3.1. Effect of Varying the O/A Ratios on the Yield of Nd2(SO4)3.8H2O Product
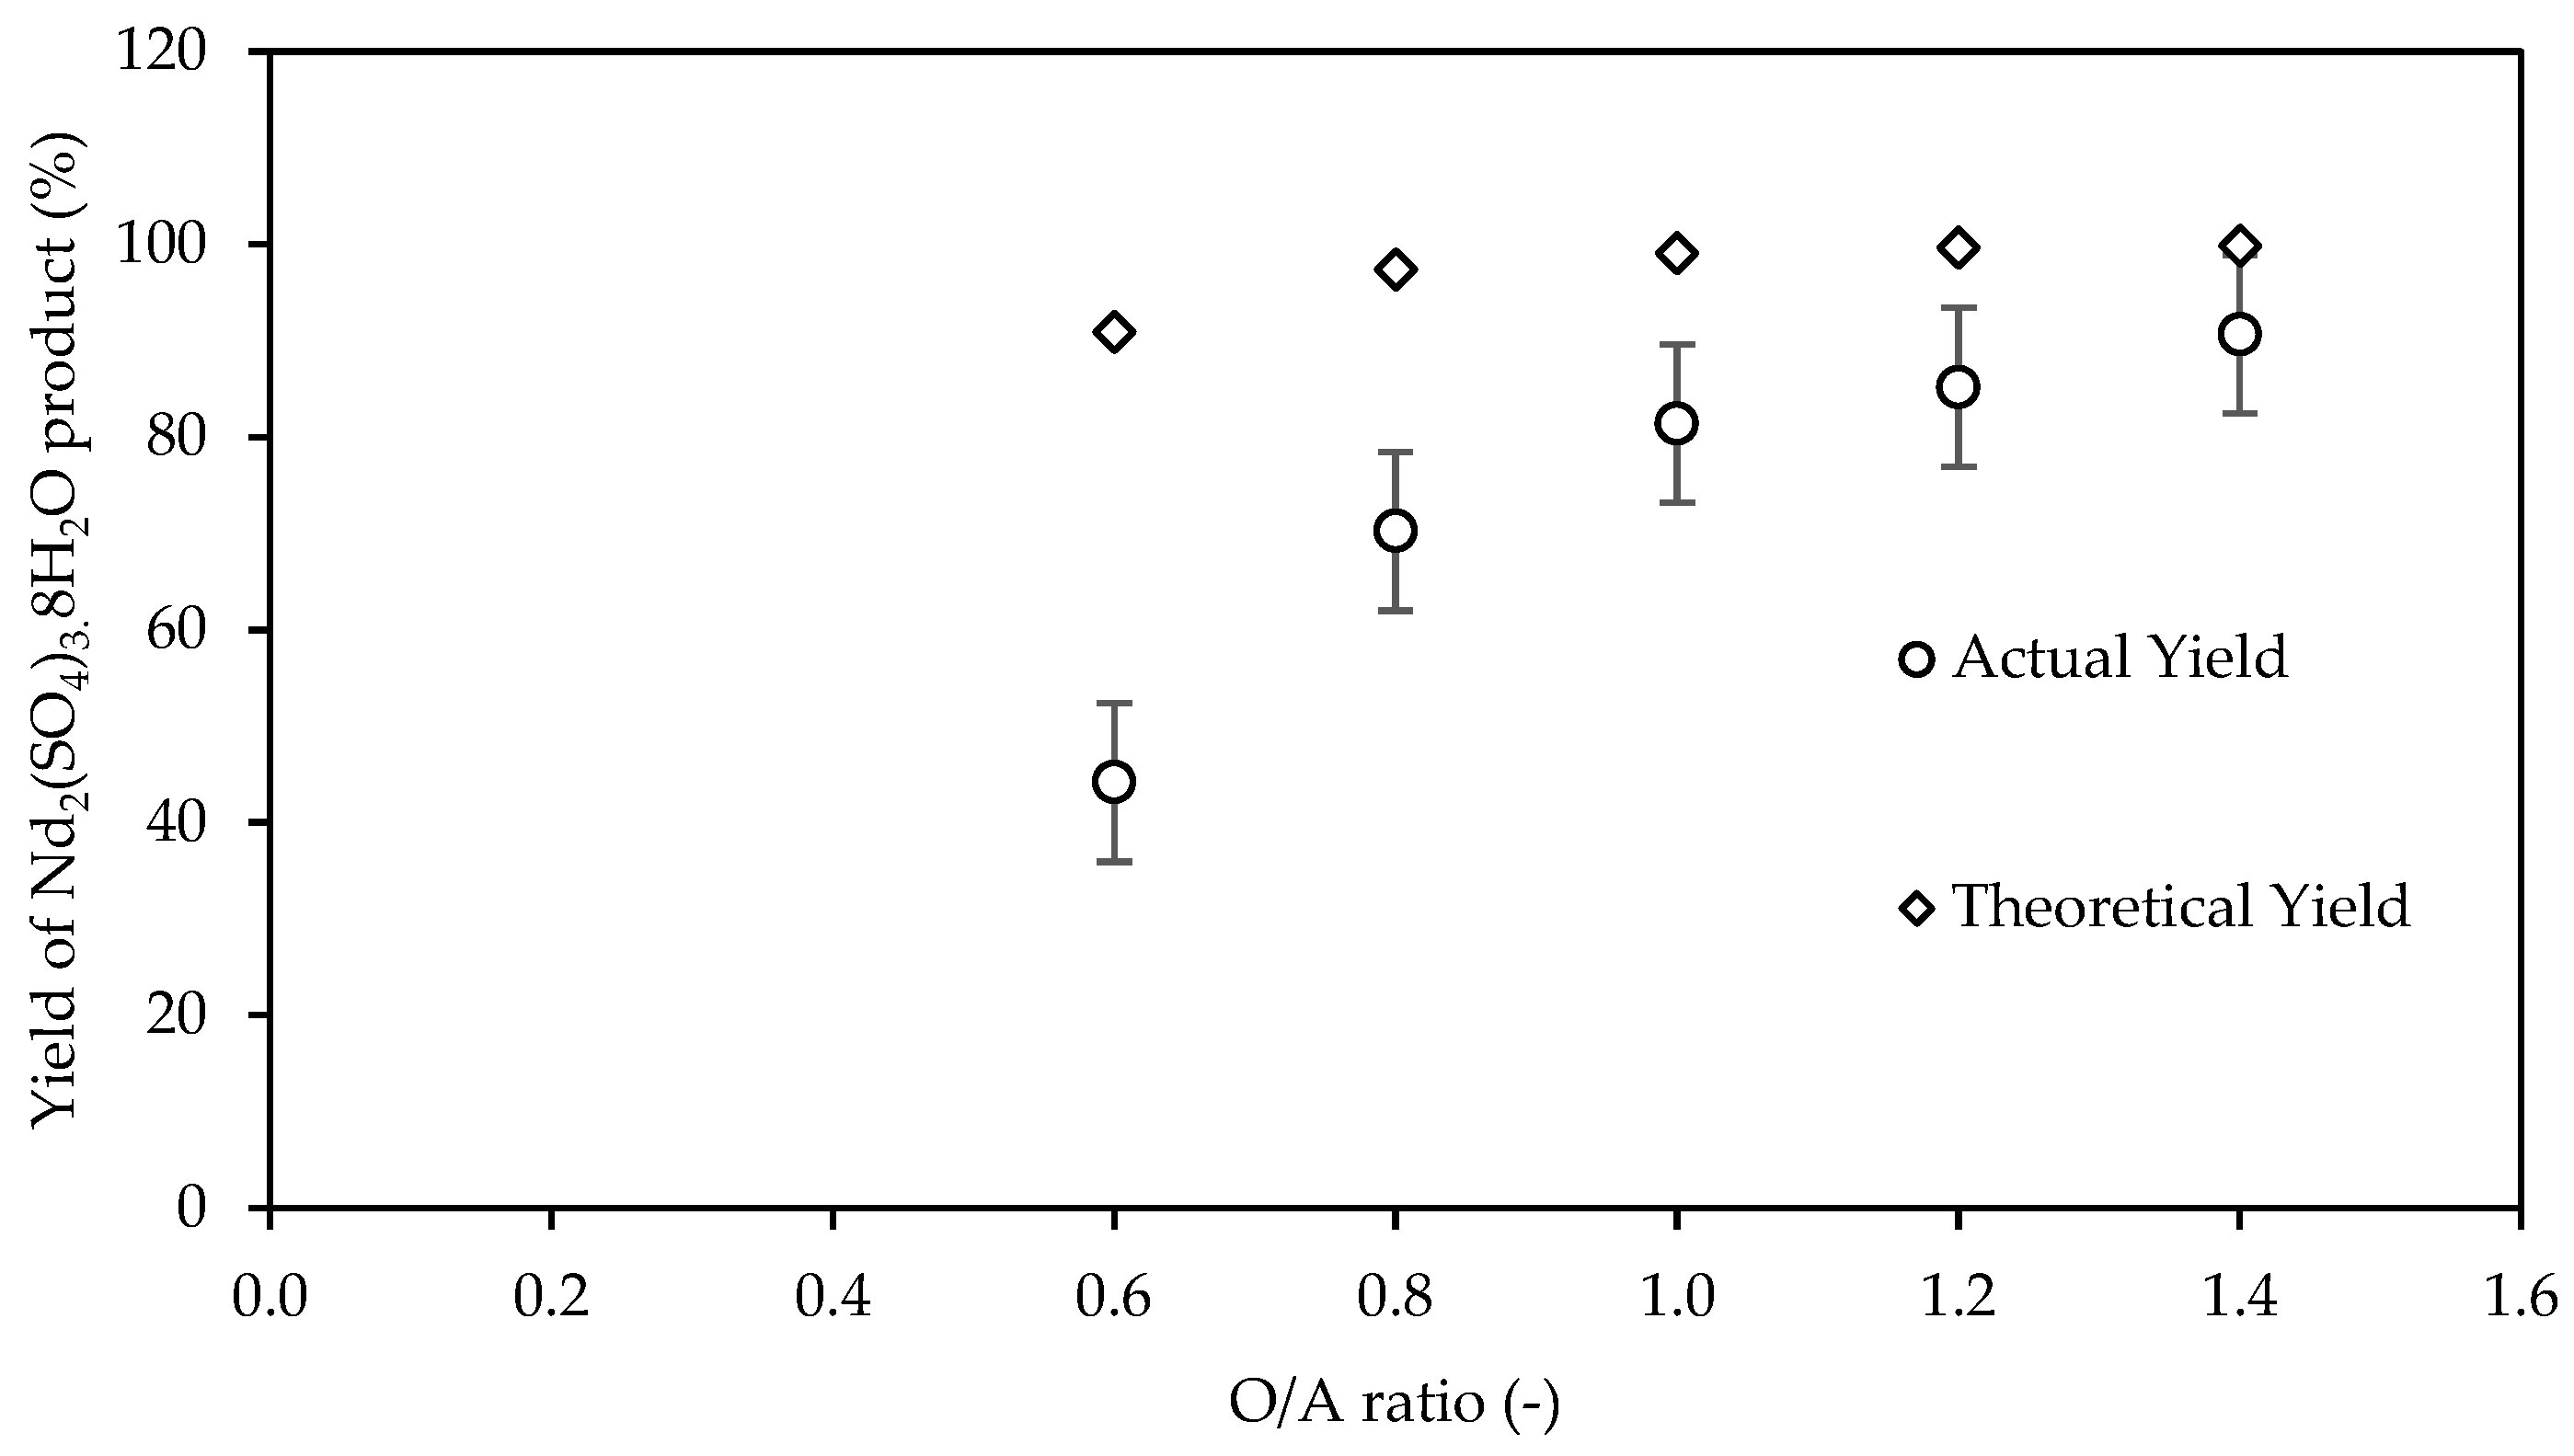
The effect of increasing the amount of ethanol on the yield of the Nd2(SO4)3.8H2O recovered from a synthetic leach solution is shown in Figure 3. The theoretical yield of the solute, when ethanol was added to the aqueous solution, was predicted from thermodynamic modelling using an OLI Stream Analyzer (11.0). The increase in the theoretical yield as the O/A ratio was increased from 0.6 to 1.4 was insignificant.
Increasing the amount of ethanol from an O/A ratio of 0.6 to 1.4 increased the actual yield of Nd2(SO4)3.8H2O. This was due to the reduction in the solubility of neodymium sulphate, which caused its crystallization. A further reduction in solubility occurred as the amount of ethanol increased, causing more Nd2(SO4)3.8H2O to crystallize.
The significant difference between the theoretical yield and actual yield at an O/A ratio of 0.6 can be attributed to the batch time of 2.5 h used in the experiments. The yield increased to more than 80% when the batch time was increased to more than 24 h. The crystallization rate of Nd2(SO4)3.8H2O was faster at a higher O/A ratio resulting in a smaller difference between the theoretical and actual yields. The current study showed that for the antisolvent crystallization of neodymium sulphate, higher yields are obtained at higher O/A ratios. This corroborates findings by Peters et al. [17] and Kaya et al. [18] who found that the yield of ammonium scandium hexafluoride increased with an increase in the O/A ratio. They observed that the optimum ethanol-to-strip liquor ratio was 0.8 and that any further increase above this ratio did not result in any significant increase in yield. This was supported by Korkmaz et al. [7], who also found that at a lower O/A ratio the recovery of REEs was very low. However, the yield of neodymium sulphate increased at O/A ratios higher than 0.8 in this study.
The theoretical yield obtained in this study was higher than the actual yield. This observation supports the work by Peters et al. [17], which showed that the calculated yield was higher than the one obtained through weighing.
3.2. Effect of Varying the O/A Ratio on the Quality of Nd2(SO4)3.8H2O Product
3.2.1. Effect of Varying the O/A ratios on the PSD of Nd2(SO4)3.8H2O Product
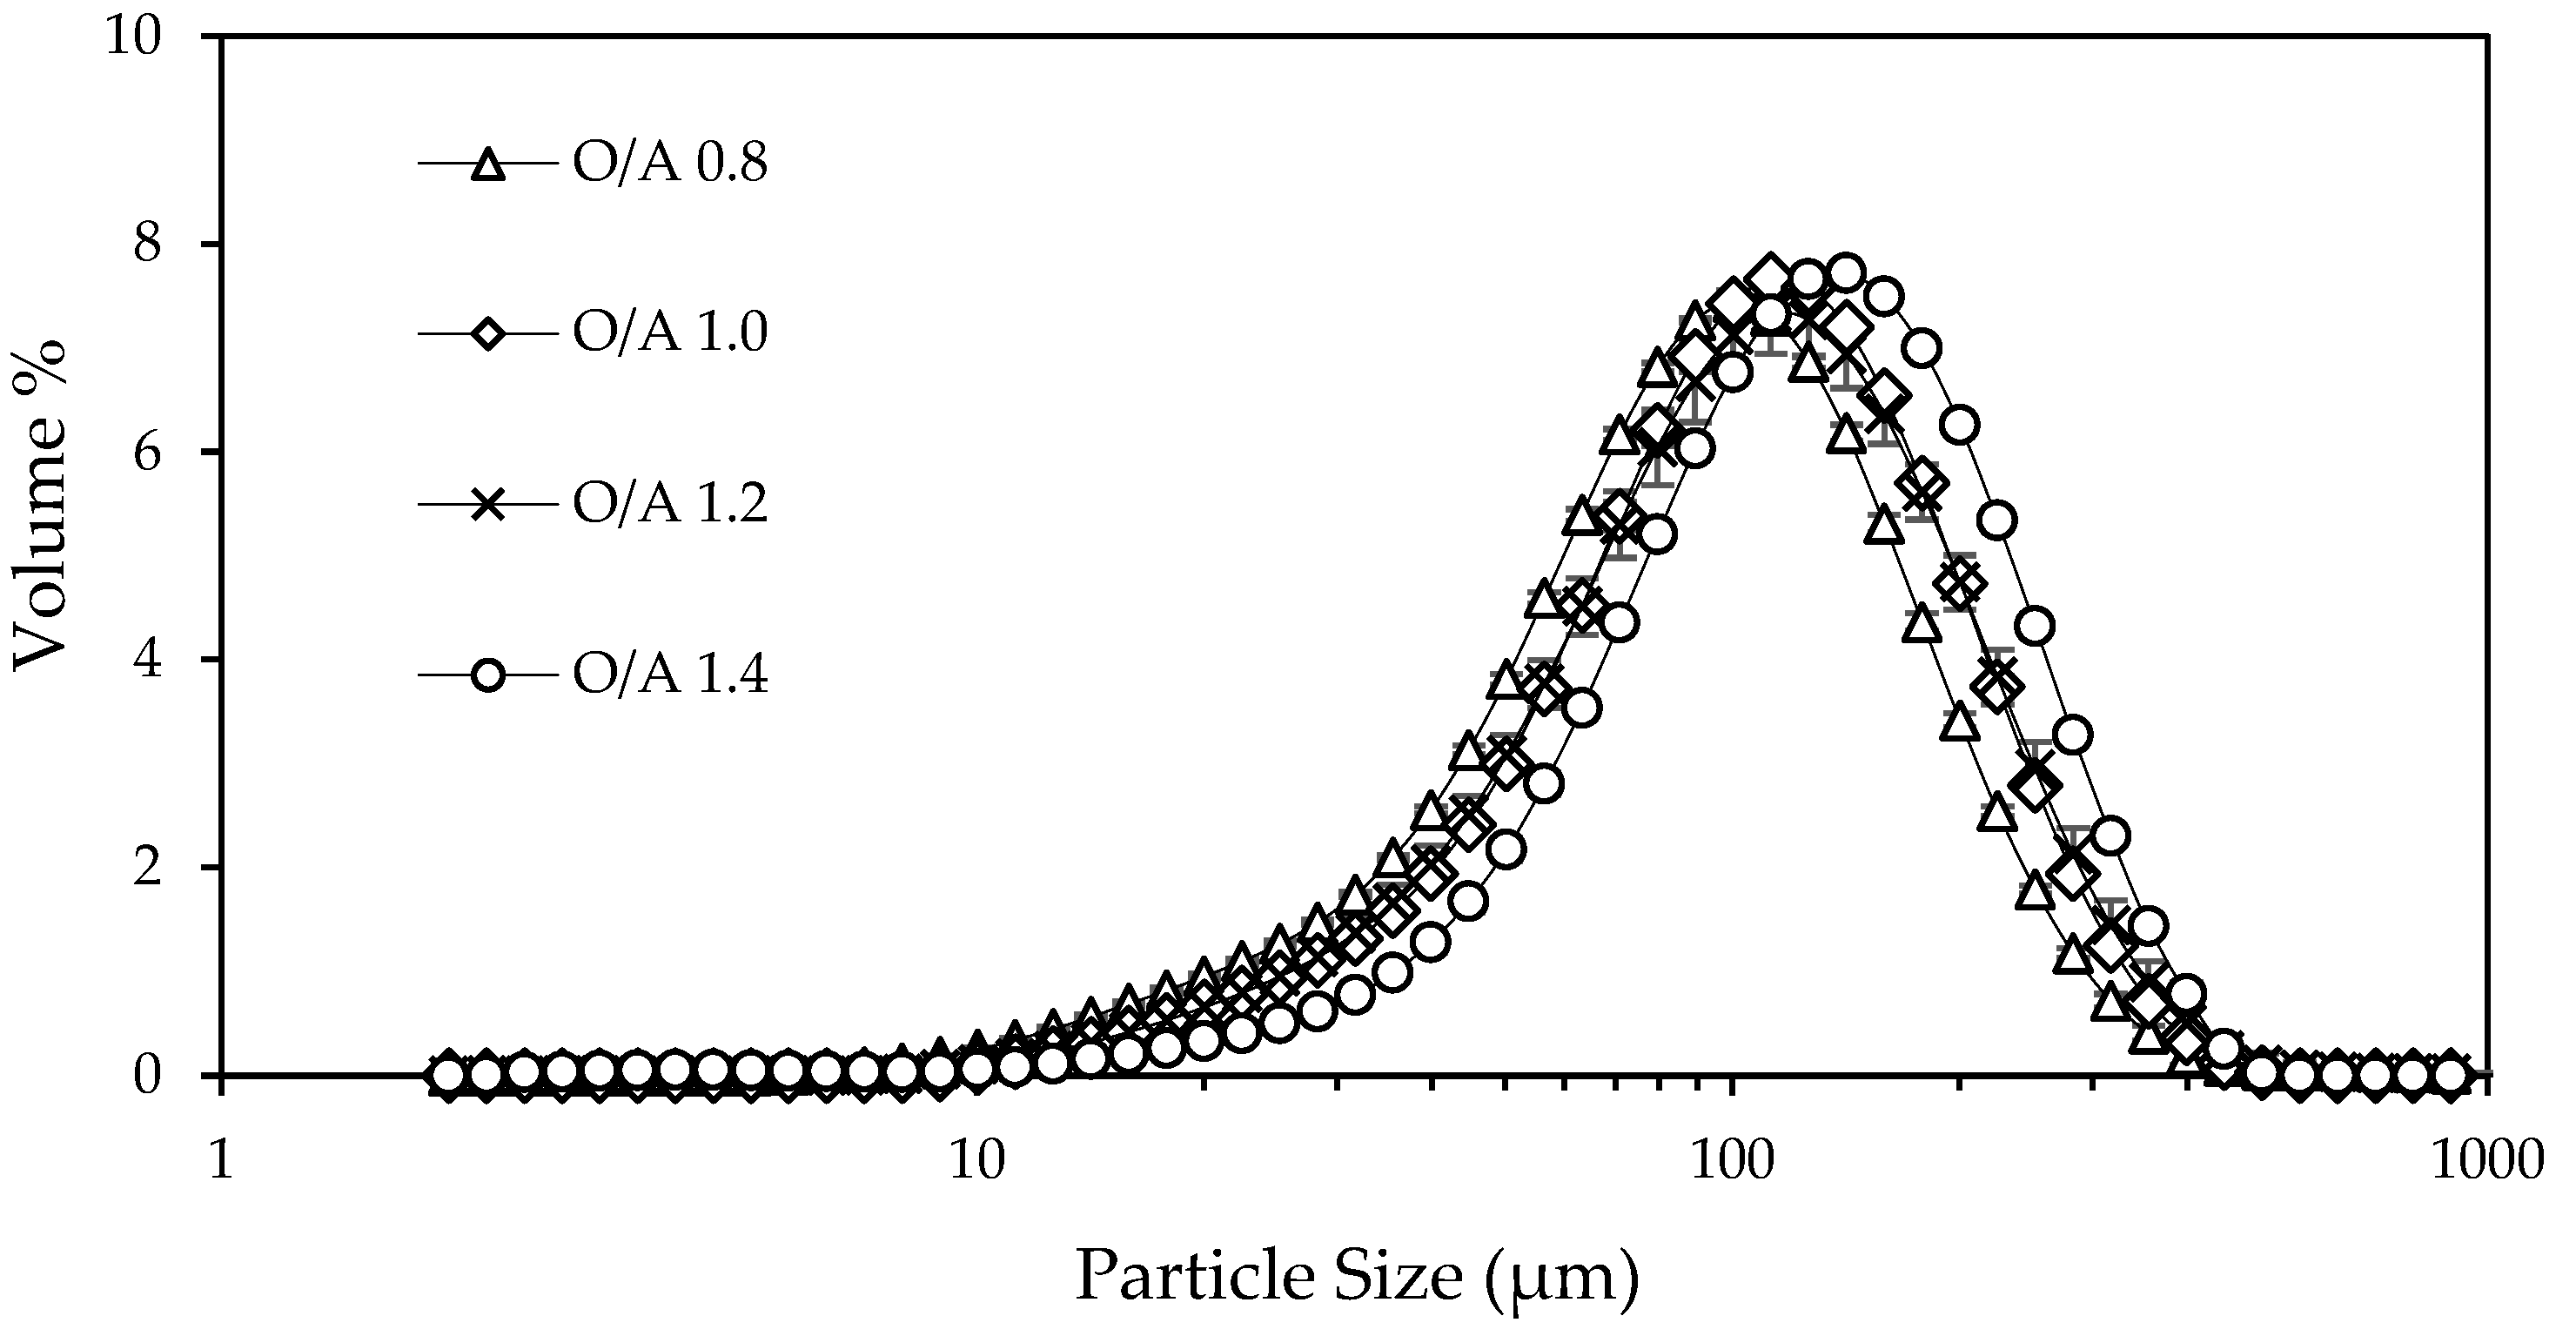
The effect of varying the O/A ratio, by increasing the amount of ethanol, on the particle size of the Nd2(SO4)3.8H2O product recovered from a synthetic leach solution was investigated. The results obtained at O/A ratios of 0.8, 1.0, 1.2, and 1.4 are shown in Figure 4. The PSD at the O/A ratio of 0.6 could not be measured as the yield was insufficient for analysis with laser diffraction.
The peaks of the PSDs in Figure 4 shifted to the right as the O/A ratio increased from 0.8 to 1.4. This showed that increasing the amount of ethanol (i.e., O/A ratio from 0.8 to 1.4) increased particle sizes. However, the increase in the particle sizes, when the O/A ratio was increased from 1.0 to 1.2, was insignificant. This behaviour can be attributed to the supersaturations, which were in the same order of magnitude at these O/A ratios.
The increase in particle sizes as the O/A ratio was increased suggests that size enlargement mechanisms became predominant at higher O/A ratios. This was unexpected as higher O/A ratios increased the degree of supersaturation, which would cause excessive nucleation and produce smaller particles as explained by Kumar et al. [12]. When the O/A ratio was increased from 0.8 to 1.4, the degree of supersaturation, calculated using Equation (1), increased from 901 to 4.62 × 10⁵. The increase in supersaturation was expected to enhance the rate of nucleation of Nd2(SO4)3.8H2O but it appeared as if these conditions promoted size enlargement of the particles.
It was unclear which size enlargement mechanism occurred at the higher supersaturations. Therefore, it was important to determine the mechanism that caused the increase in particle sizes as the O/A increased. The evolution of moments was explored in Section 3.2.3 to identify the mechanisms that influenced the sizes of particles at high O/A ratios.
3.2.2. Effect of Varying the O/A Ratios on Nd2(SO4)3.8H2O Crystal Morphology
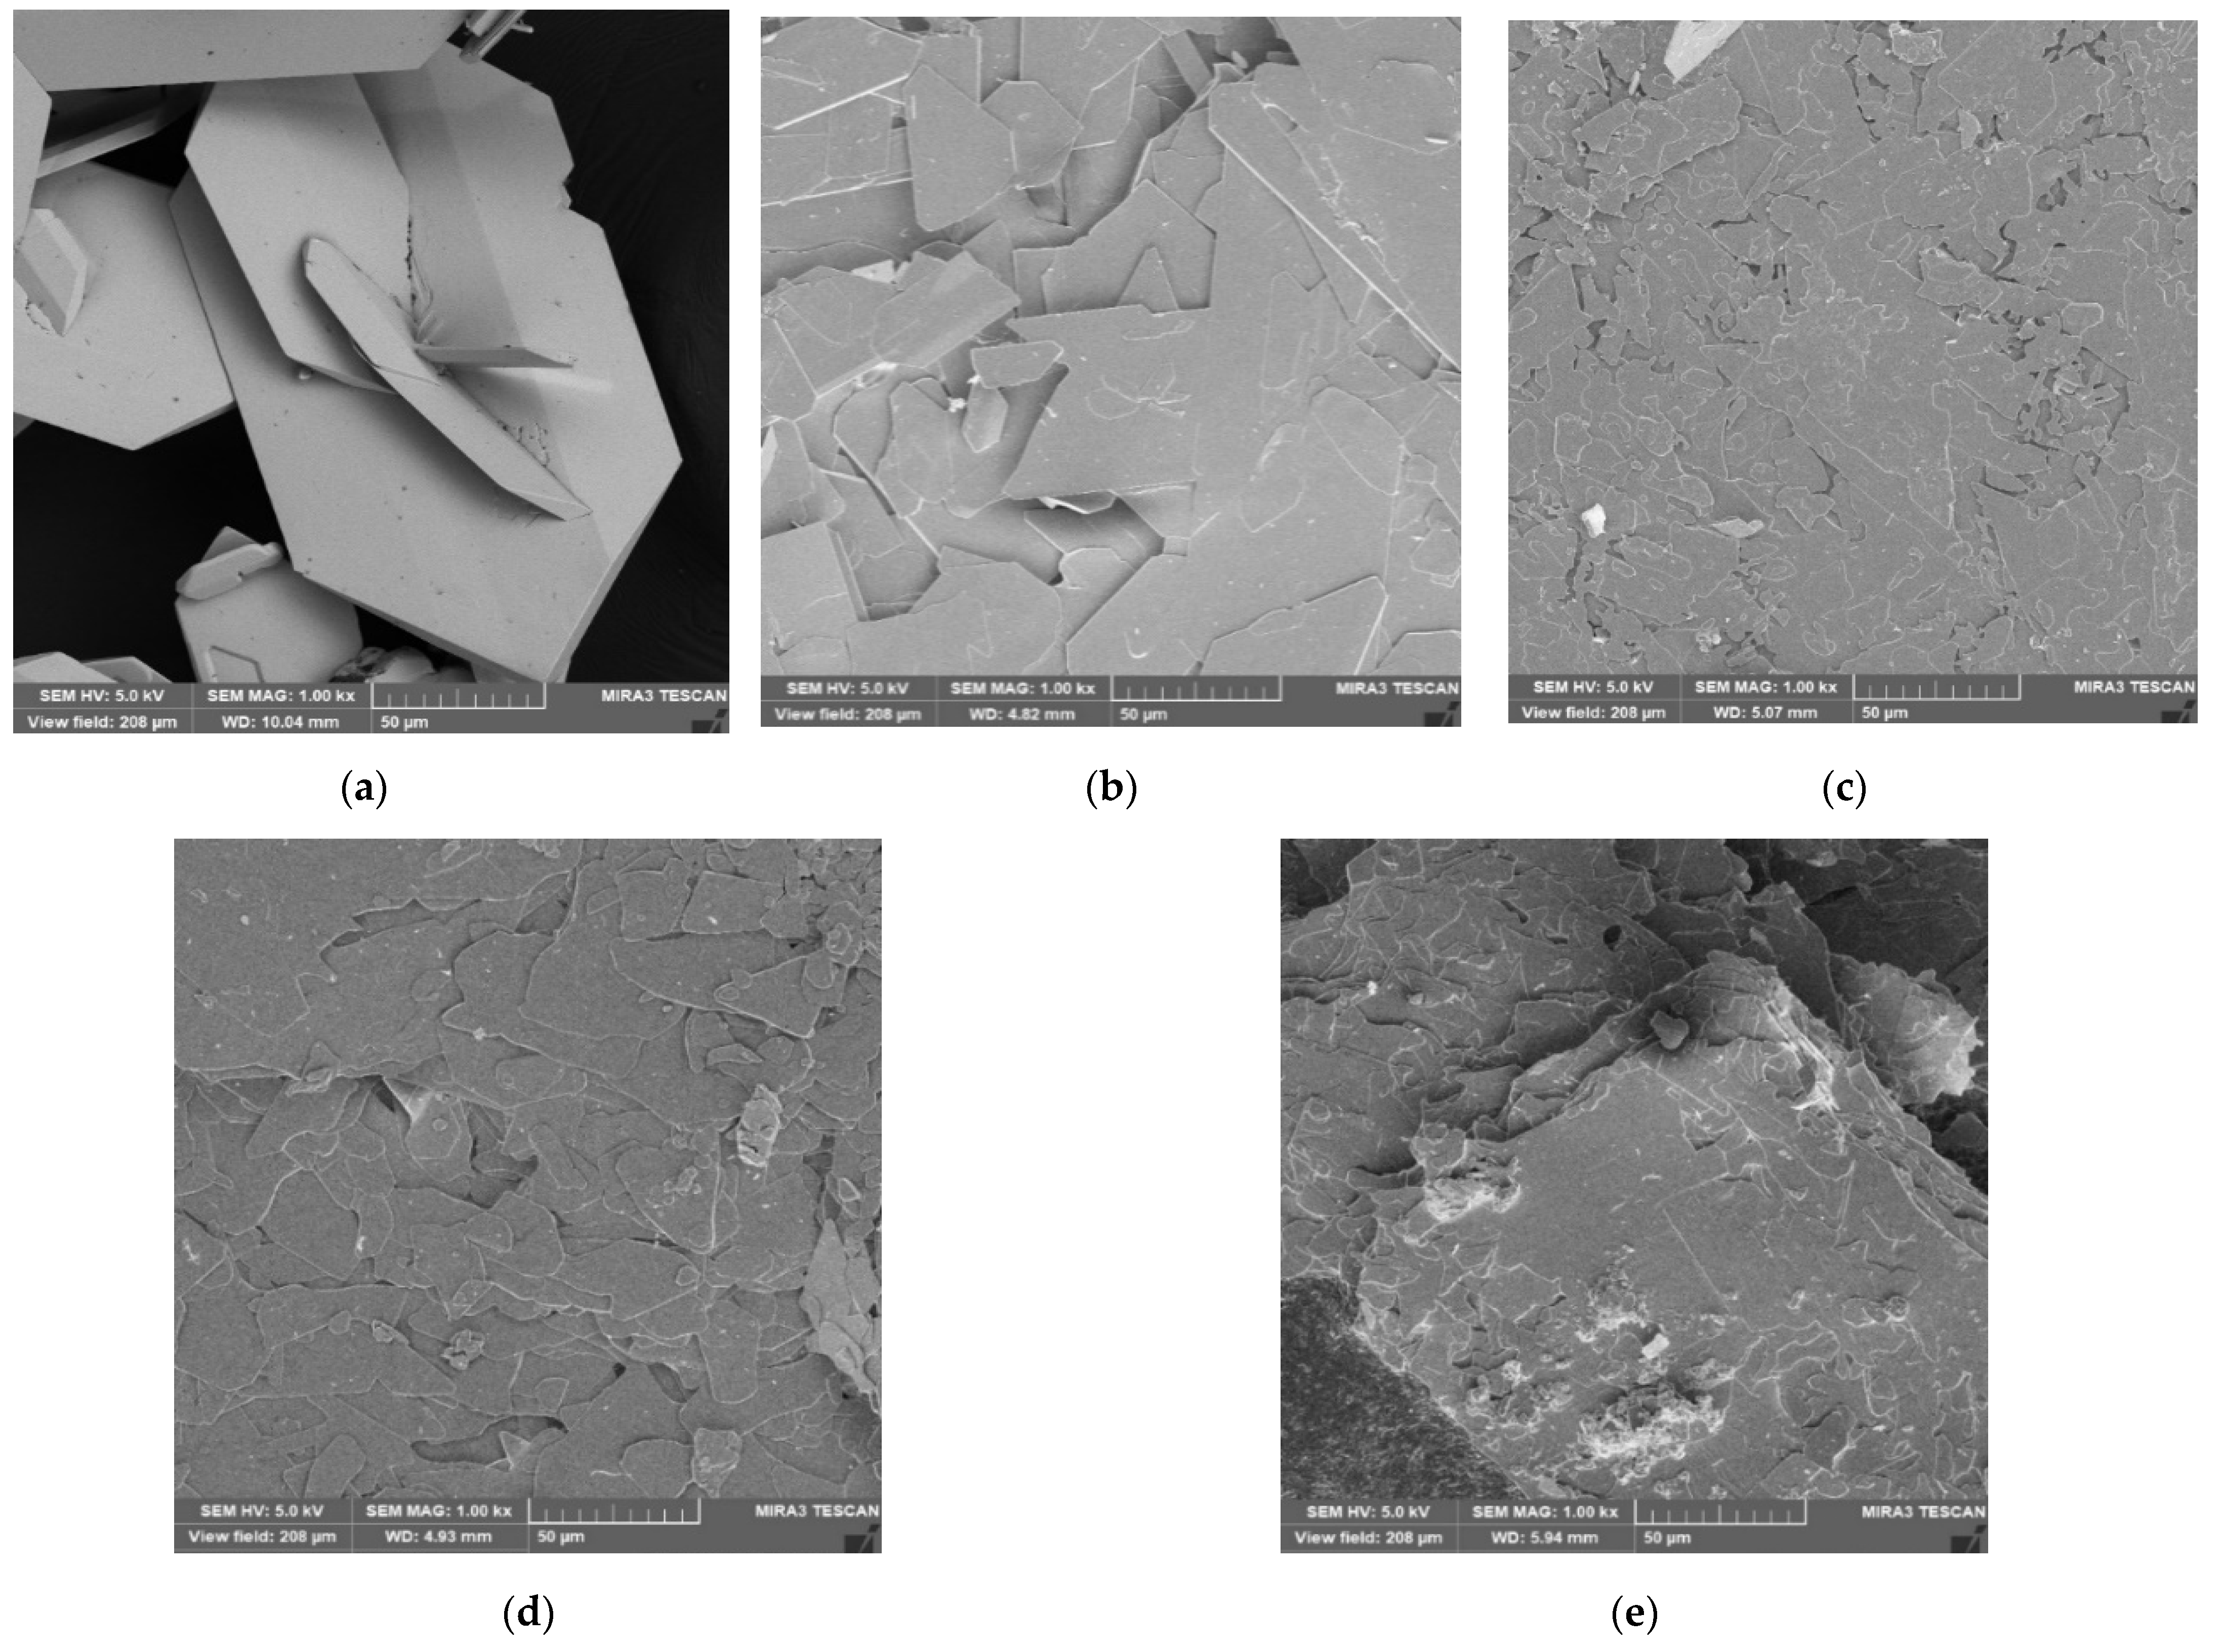
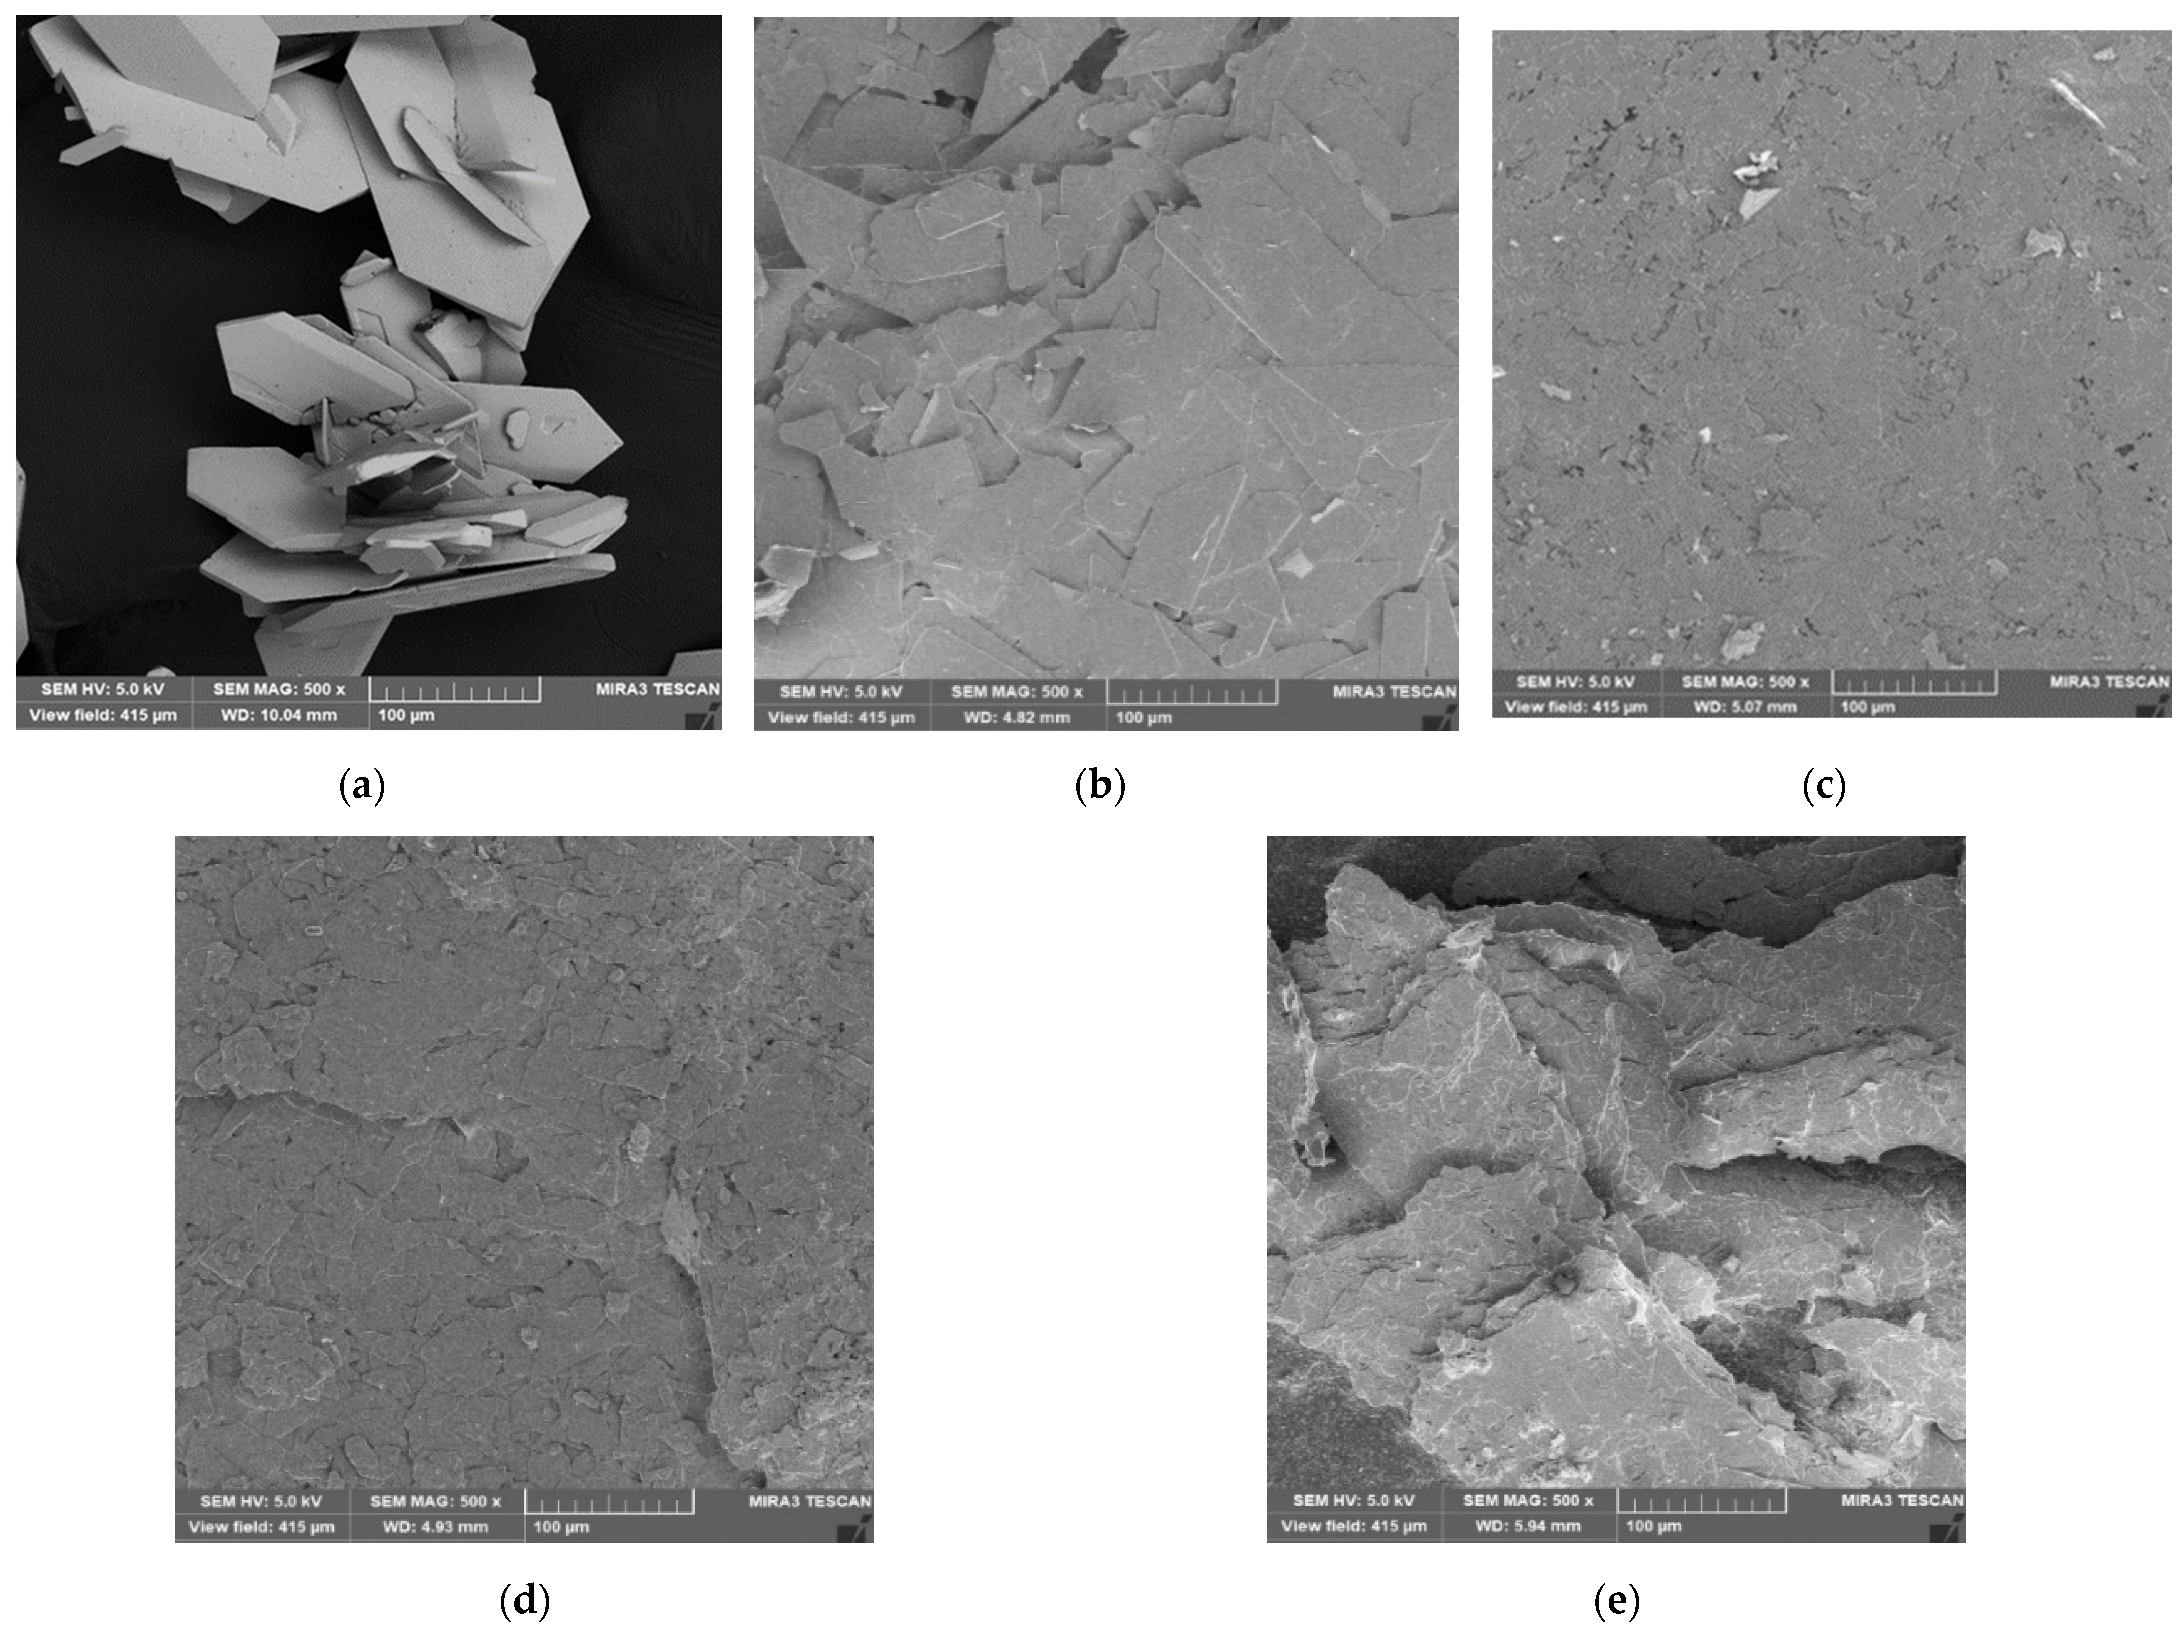
SEM micrographs of the Nd2(SO4)3.8H2O product obtained at different O/A ratios were acquired, and these are presented in Figure 5 and Figure 6. The SEM micrographs show that the product consisted of tabular, plate-like crystals, which became thinner and asymmetric as the O/A ratio was increased from 0.8 to 1.4. For the O/A ratios of 0.6 and 0.8, the crystals were well faceted with more defined morphology than at the O/A ratios of 1.2 and 1.4. At the O/A ratio of 0.6, crystal twinning was evident as crystals were embedded into each other showing that intergrowth occurred. The particles were also clustered together, showing that agglomeration possibly occurred as well. As the O/A ratio was increased, the edges of the crystals became rounded especially at the O/A ratio of 1, and the twinning disappeared. During filtration, the product obtained at the O/A ratio of 1.4 formed a multilayered filter cake shown in Figure 5e.
From the micrographs, it was evident that the plates became thinner and pronounced at higher O/A ratios. This means that preferential growth of crystal faces occurred normal to the c-axis when the O/A ratio increased from 0.6 to 1.2. The observed change in morphology can be attributed to either higher supersaturation or enhanced physical interactions between ethanol and the growing Nd2(SO4)3.8H2O crystals at the higher O/A ratios. Higher supersaturation increases the nucleation rate thereby reducing the growth rate of crystals at the O/A ratio of 1.4 [31].
At higher supersaturations, the crystal surfaces possibly became rough thereby altering the growth mechanism of the crystals. This possibly led to the transition from layered growth at the lower O/A ratio of 0.6 to rough growth at the O/A ratios of 1.0 and above. The occurrence of kinetic roughening at high supersaturation agrees with the findings by Sleutel et al. [32].
However, it was not obvious if this behaviour was caused solely by higher supersaturation because preferential growth was promoted at high O/A ratios. Preferential adsorption of ethanol on the c-axis possibly occurred at high O/A ratios, thereby inhibiting growth along this direction. Increasing the amount of ethanol possibly enhanced the interaction between ethanol and the crystal faces as explained by Kumar et al. [12]. Thus, in addition to reducing the solubility of neodymium sulphate, ethanol possibly acted as an additive that modified the morphology of the recovered product at high O/A ratios. Zhou et al. [14] suggested that the functional groups of different antisolvents influenced the crystal morphology. Different crystal habits, such as clusters, rods, and needles, were observed when different antisolvents were used in the antisolvent crystallization of 2,6-dimaino-3,5-dinitropyrazine-1-oxid, at a constant O/A ratio.
Overall, it was observed in this study that increasing the organic-to-antisolvent ratio resulted in crystals with different crystal morphology. This observation agrees with the findings by Lindenberg et al. [33] that the O/A ratio affects crystal morphology. In their study, acetylsalicylic crystals became elongated at higher O/A ratios in a combined cooling/antisolvent crystallization process.
3.2.3. Evolution of Moments
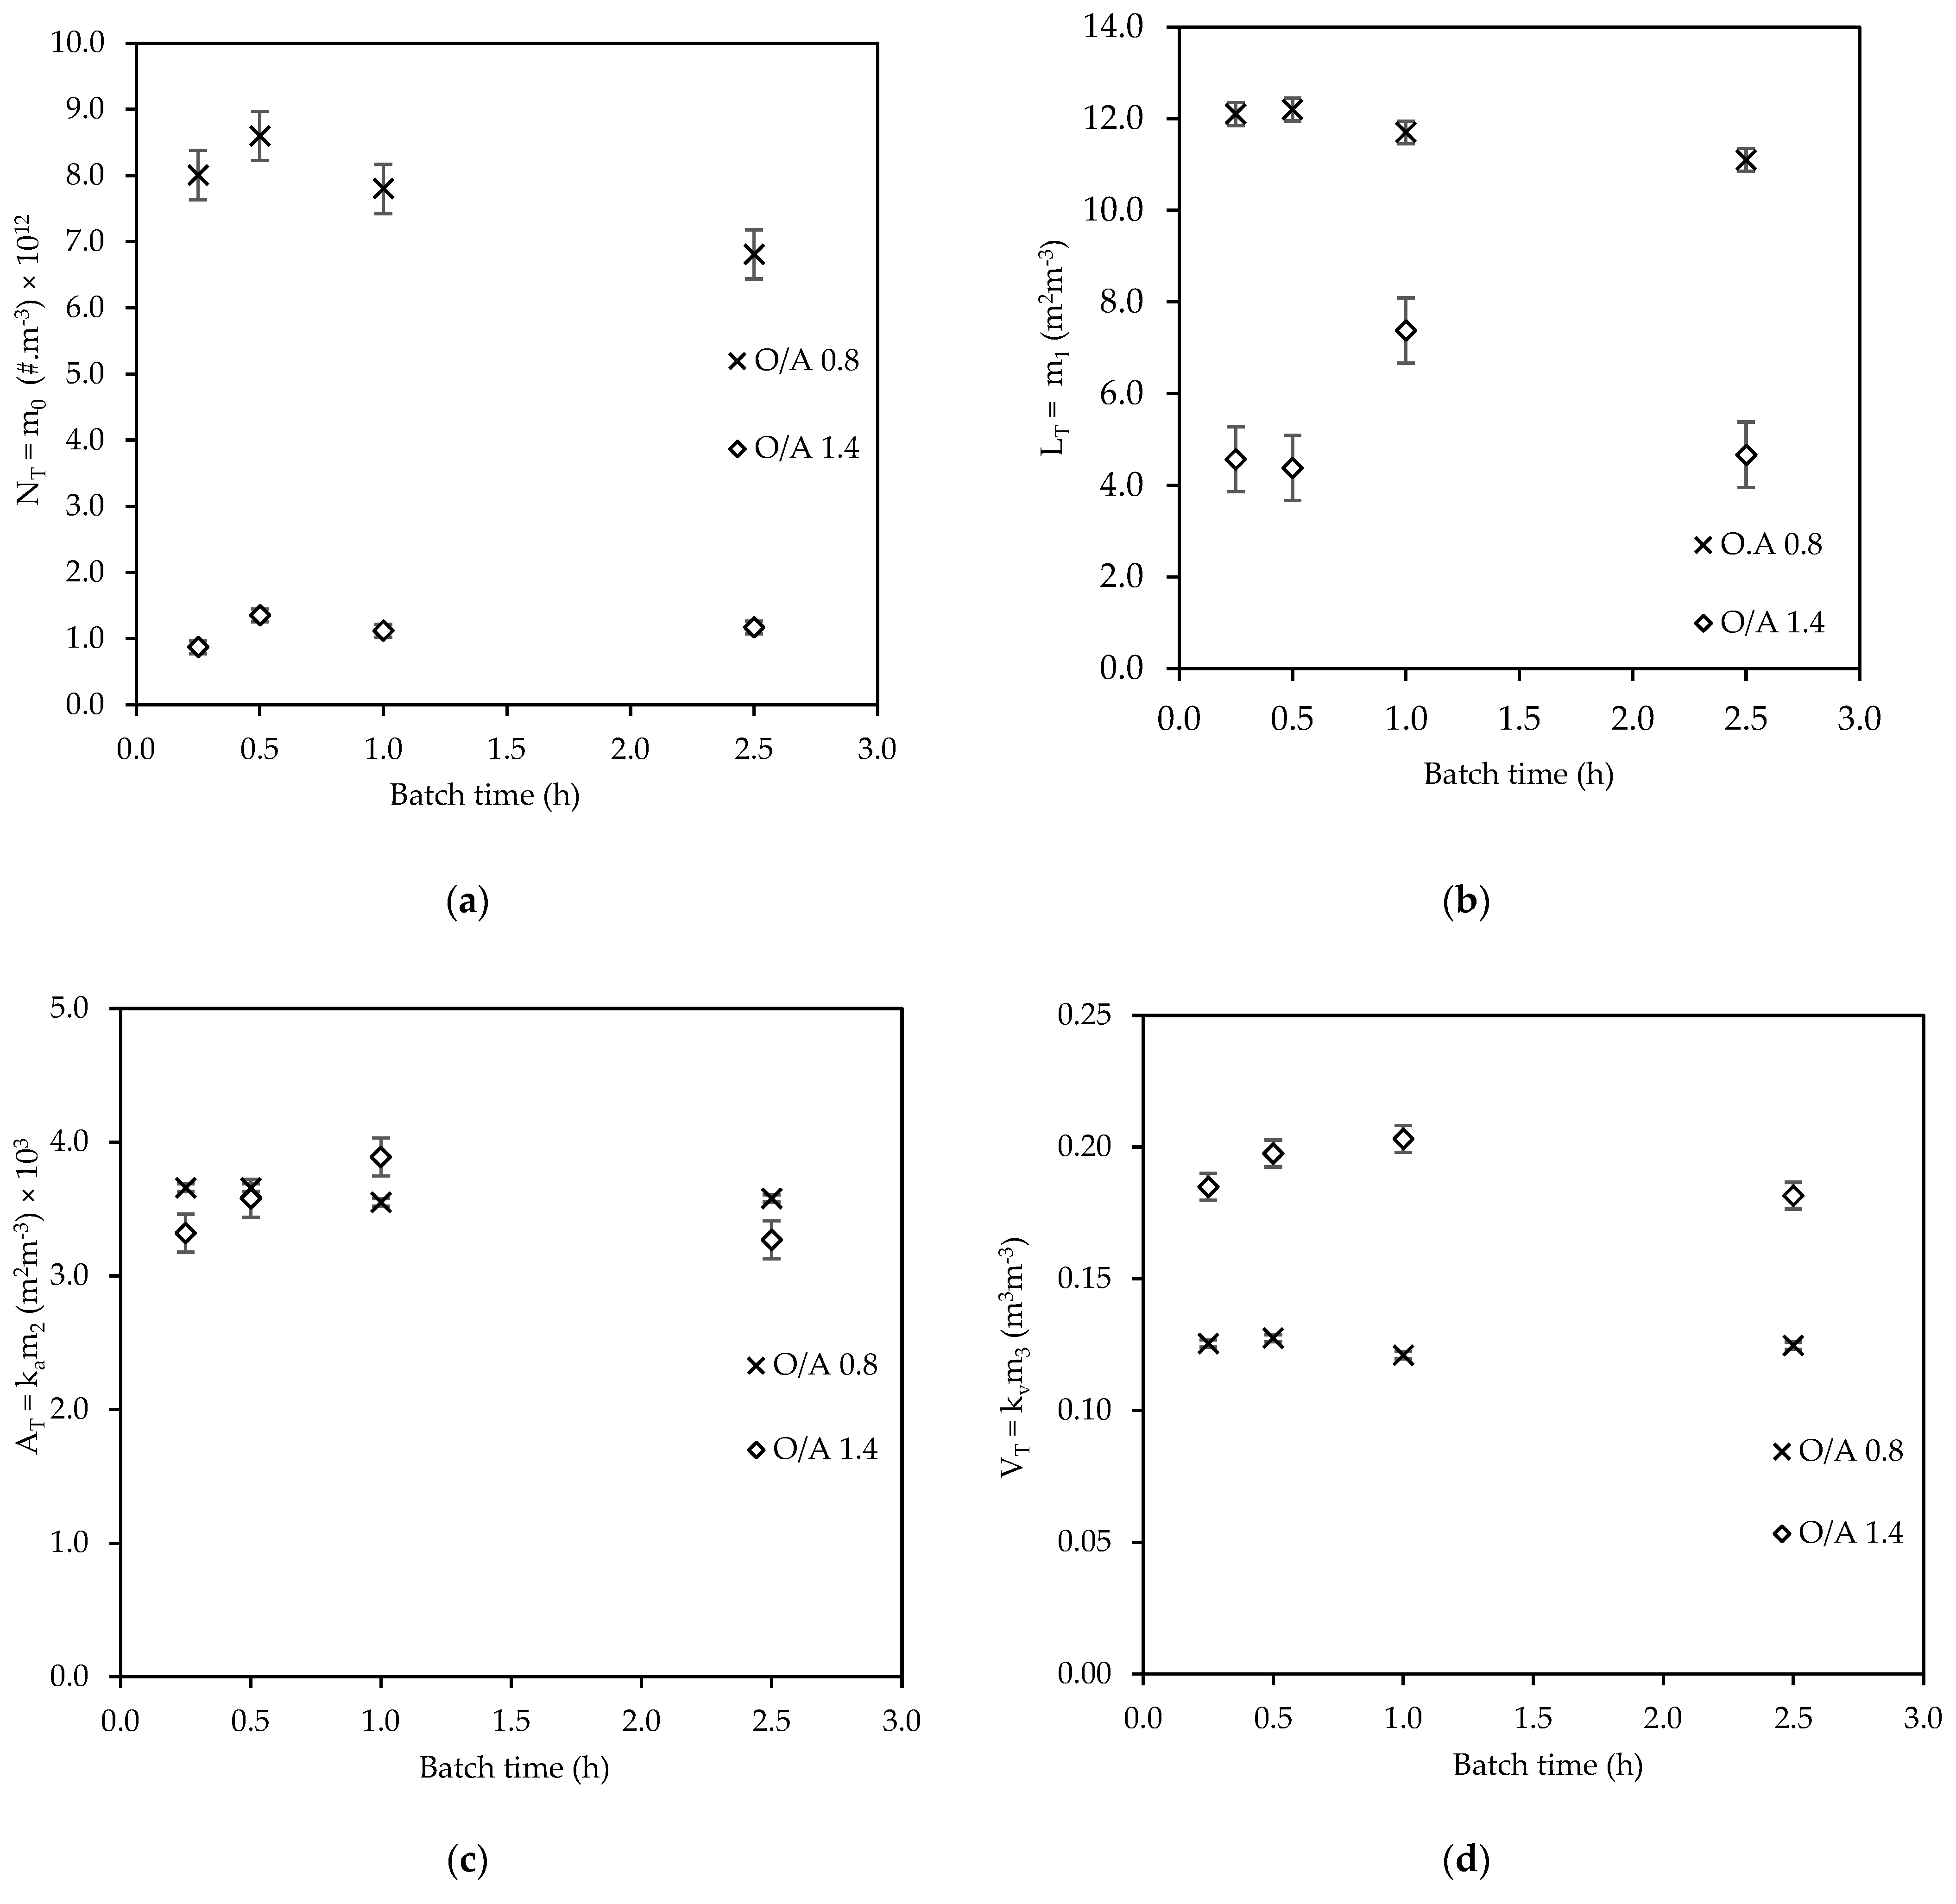
The evolution of normalized zeroth, first, second, and third moments of the PSDs was analysed at the O/A ratios of 0.8 and 1.4 to investigate the cause of the increase in particle size as the O/A ratio increased from 0.8 to 1.4.
The zeroth moment (m0) represents the total number of particles; the first moment (m1) represents the total length; the second moment (m2) represents the total area of particles, and the third moment (m3) represents the total volume of particles per unit volume of solids-free liquid [31]. The particles were assumed to be spherical, and a shape factor of π/6 was used for computational purposes. However, it must be noted that the actual particles were not spherical as shown in the images; hence, this was an approximation.
Figure 7 shows that the total number of particles increased significantly between 0.25 h and 0.5 h at the O/A ratio of 0.8. The increase in the total number of particles concurred with a slight increase in the total length of particles at the O/A ratio of 0.8 in the same period. However, the total surface area and total volume remained almost constant. This was probably due to the nucleation of more particles between 0.25 h and 0.5 h. At the O/A ratio of 1.4, the total length remained constant between 0.25 h and 0.5 h as the total number of particles increased, while the total surface area and the total volume increased significantly. This was also attributed to the nucleation of more particles within the crystallizer.
The total number of particles, the total length, the total surface area, and the total volume all decreased for the O/A ratio of 0.8 between 0.5 h and 1.0 h. This suggests that redissolution of the product occurred under these conditions. Since the solution was still supersaturated at this point, redissolution was potentially an intermediate step of the recrystallization process. However, since the total number of particles decreased, it is possible that the recrystallization step was slower than or lagged the dissolution step. The total number of particles decreased only slightly at the O/A ratio of 1.4, while the total length, the total surface area, and the total volume increased significantly between 0.5 h and 1.0 h. This was probably due to the particles agglomerating to form bigger particles.
At the O/A ratio of 0.8, the total number of particles, the total length, and the total surface area all decreased, while the total volume remained constant between the batch times of 1 h and 2.5 h. This was attributed to redissolution and recrystallization, which occurred in the crystallizer. At the O/A ratio of 1.4, the total number of particles remained almost constant. The total length, the total surface area, and the total volume all decreased at the O/A ratio of 1.4 as the batch time was increased from 1.0 h to 2.5 h. This was attributed to particle size reduction due to bigger particles dissolving and becoming smaller.
Overall, there was a greater number of particles with a higher total length at an O/A ratio of 0.8 than at an O/A ratio of 1.4 with a minimal difference in total surface area between these two O/A ratios. The total volume at an O/A ratio of 1.4 was higher than the total volume at an O/A ratio of 0.8. However, it was expected that the total number of particles for the O/A ratio of 1.4 would be more than for the O/A ratio of 0.8 because of higher supersaturation at the O/A ratio of 1.4 leading to a faster nucleation rate as highlighted by Raj et al. [10].
As noted by Palosaari et al. [34], the degree of supersaturation is the main parameter that determines the rate of nucleation, growth, and agglomeration. Therefore, it determines the size, morphology, and purity of the crystals. Since the supersaturation at the O/A ratio of 1.4 was higher than at 0.8, a faster nucleation rate was expected at the O/A ratio of 1.4. However, the results show that fewer particles of more volume were obtained at the O/A ratio of 1.4 than at 0.8. This suggests that the smaller particles produced at the O/A of 1.4 possibly agglomerated resulting in larger mean particle sizes, hence the shift of the PSD in Figure 4 to the right for this amount of ethanol. Yu et al. [16] in their study, produced fine particles (<2 µm) with defined morphology. The fine particles were attributed to high supersaturation at higher O/A ratios, and these particles agglomerated.
3.3. Effect of Seed Loading on the Quality of Nd2(SO4)3.8H2O Product
The effect of seed loading on the properties of Nd2(SO4)3.8H2O was investigated at the O/A ratio of 1.4.
3.3.1. Effect of Seed Loading on the PSD of Nd2(SO4)3.8H2O Particles
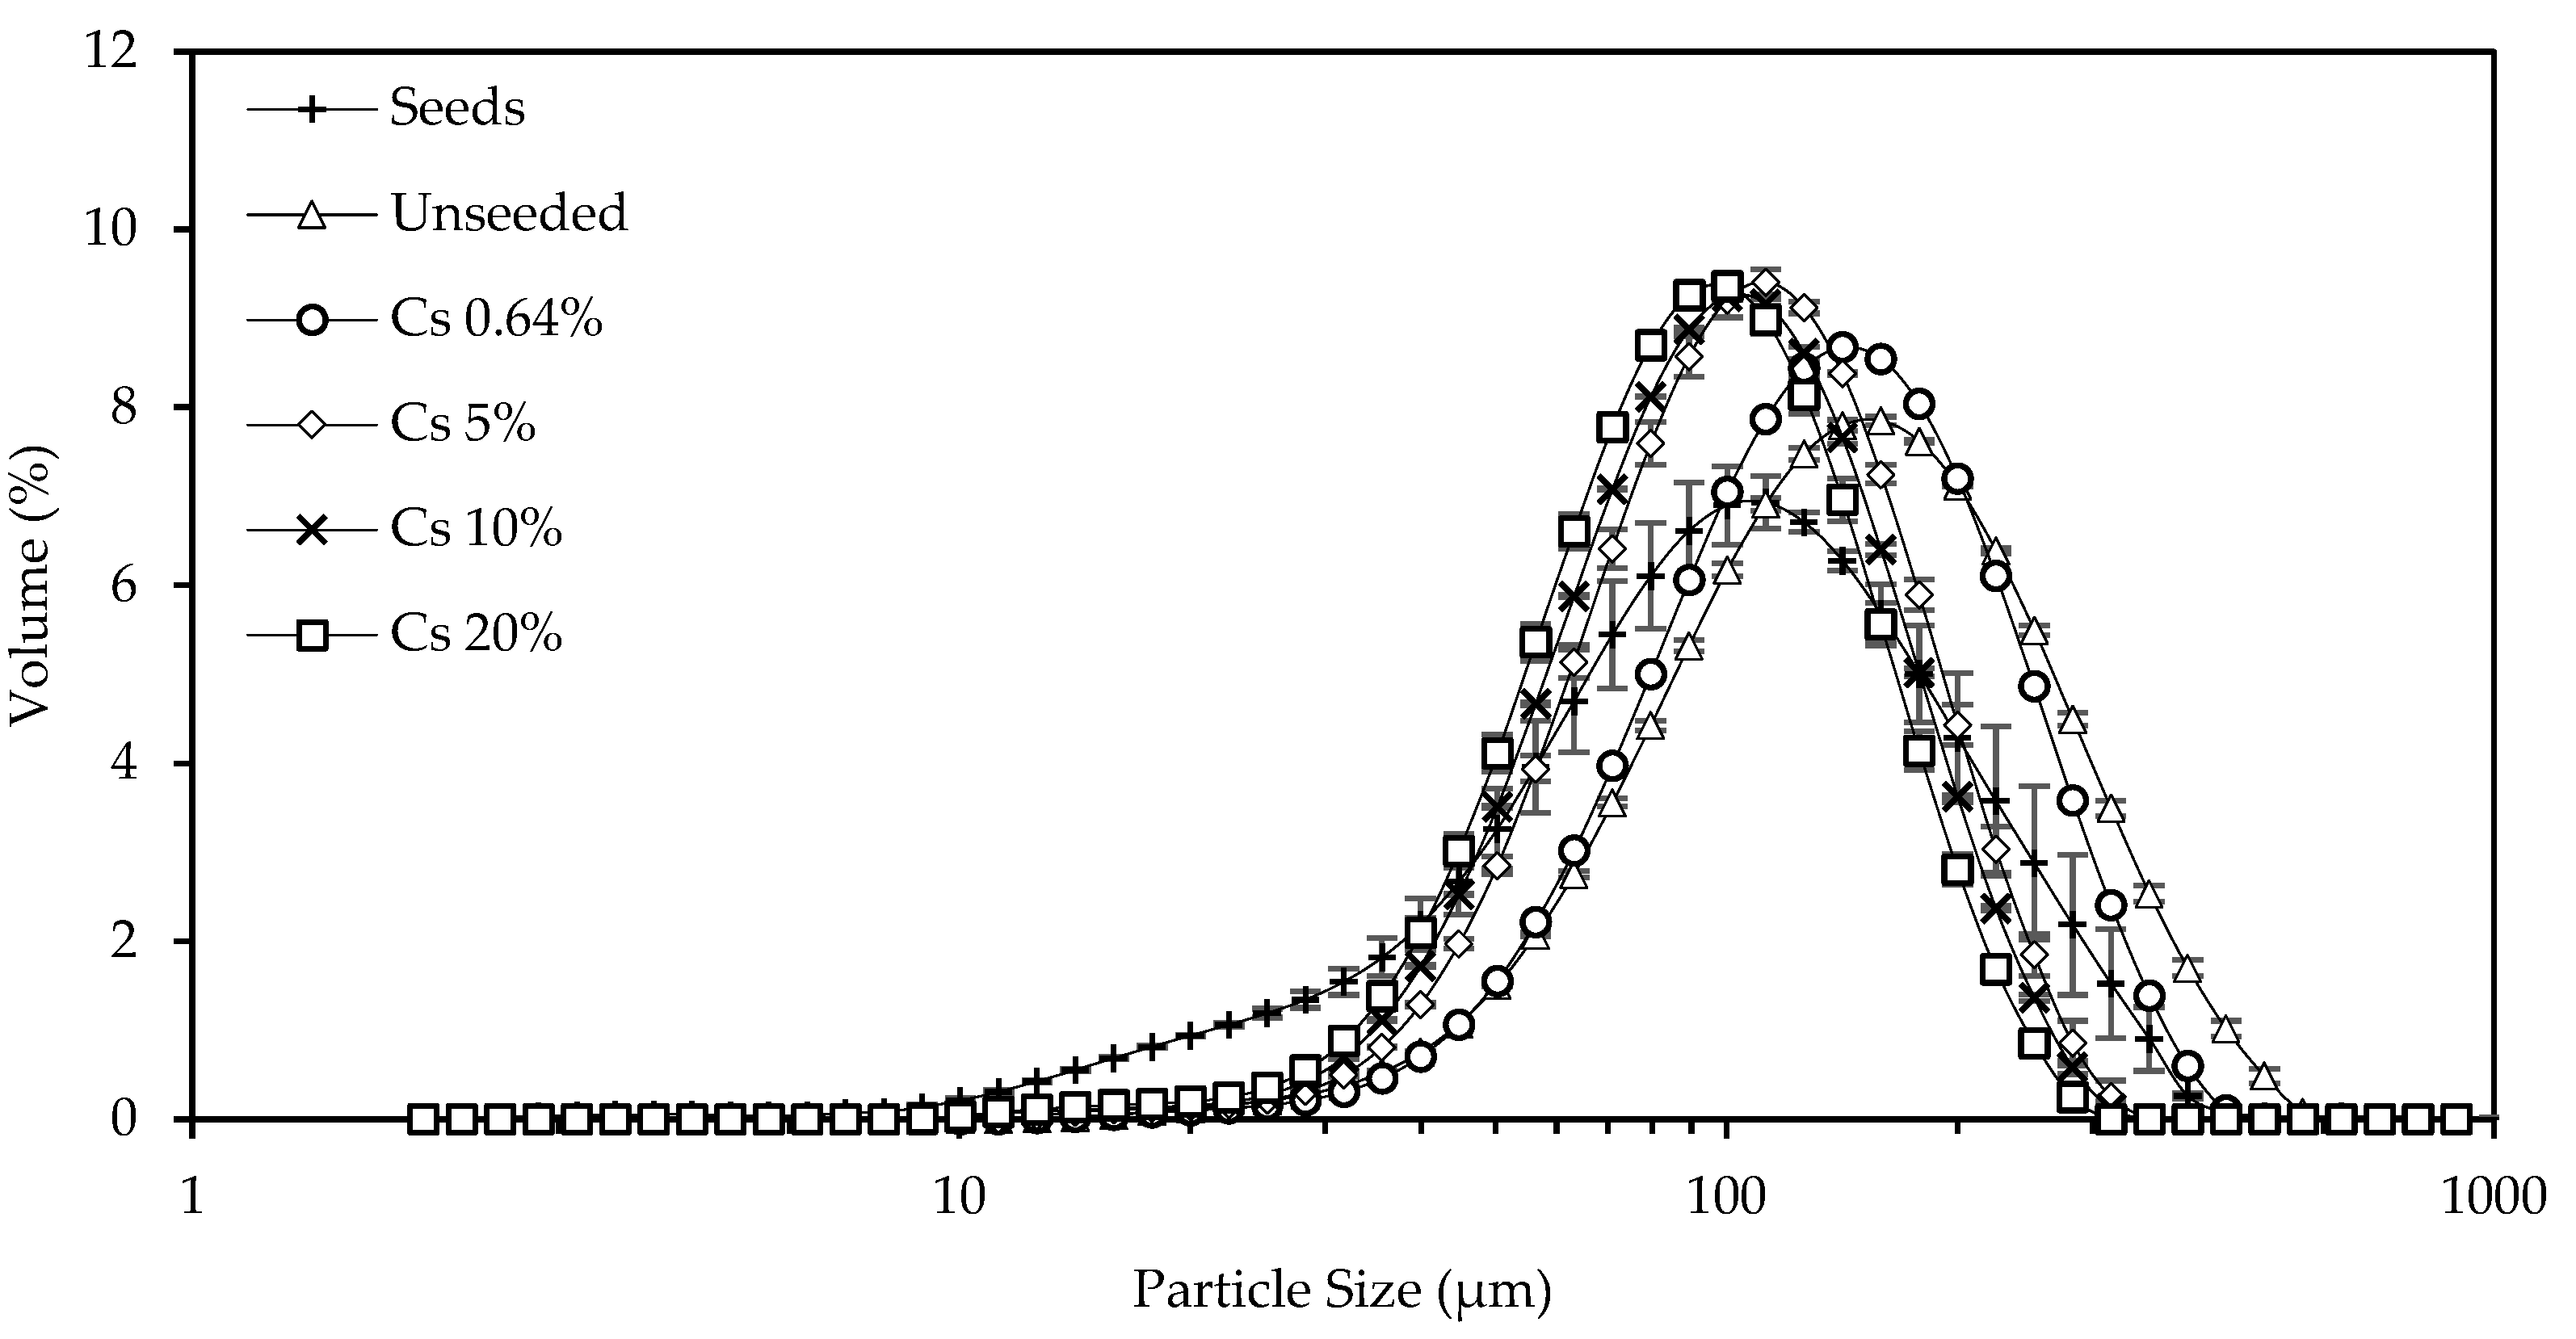
The effect of seed loading on the PSD of Nd2(SO4)3.8H2O particles was investigated at the O/A ratio of 1.4. The results are shown in Figure 8.
The PSD curves shifted to the left and became narrower as the seed loading (CS) was increased. The mean particle sizes of the Nd2(SO4)3.8H2O product, therefore, decreased as the seed loading increased. The span of PSDs for seed loadings of 0 and 0.64% were broader (1.54 and 1.37, respectively) than for the cases where the seed loading was above the critical seed loading (average of 1.28).
For the unseeded case (0%), uncontrolled primary nucleation occurred but, unexpectedly, produced the biggest particles across the range of seed loadings tested. Since primary nucleation tends to produce smaller particles, the smaller particles formed agglomerates as discussed earlier. Introducing seeds into the crystallizer would promote crystal growth, by providing growth sites and sufficient surface area to consume the supersaturation, leading to the formation of bigger particles. It was expected that the PSDs would shift to the right when seeding was conducted because bigger particles were expected. However, it is possible that the introduction of seeds inhibited agglomeration and promoted crystal growth. This is one potential reason for the smaller particles obtained in cases where the seed loading was higher than the critical value.
At seed loadings less than the critical seed loading of 2.98%, the final PSD was almost identical to the final PSD of the unseeded case as expected. This was because, at a seed loading of 0.64%, the amount of seeds was insufficient to suppress primary nucleation and promote growth of the particles into larger sizes. This behaviour is consistent with findings by Doki et al. [24].
Figure 9 represents the different particle sizes at different seed loadings. It can be noted that the particle sizes decreased as the seed loading was increased as shown in the PSDs in Figure 8.
Increasing the seed loading in the antisolvent crystallization of neodymium sulphate resulted in particles with narrower PSDs. This agrees with Zhang et al. [26] and Yu et al. [16], who found that higher seed loadings result in unimodal PSDs.
Peters et al. [25] showed that there is an optimum seed loading between 10 and 20%, above which the modal crystal size became smaller due to competition between the rate of generation and consumption of supersaturation. The optimal seed surface area was between 5 and 10%. In the current study, well-defined crystals were obtained at a seed loading of 5%.
The filtration time was reduced by 32% when the system was seeded at seed loadings above the critical seed loading (i.e., 5%, 10%, and 20%). At the seeding loading of 0.64%, which was below the critical seed loading, the filtration time was the same as in the unseeded case. This shows that the narrow PSD of the recovered Nd2(SO4)3.8H2O product at higher seed loadings improves the filtration kinetics.
3.3.2. Effect of Seed Loading on the Morphology of Nd2(SO4)3.8H2O Particles
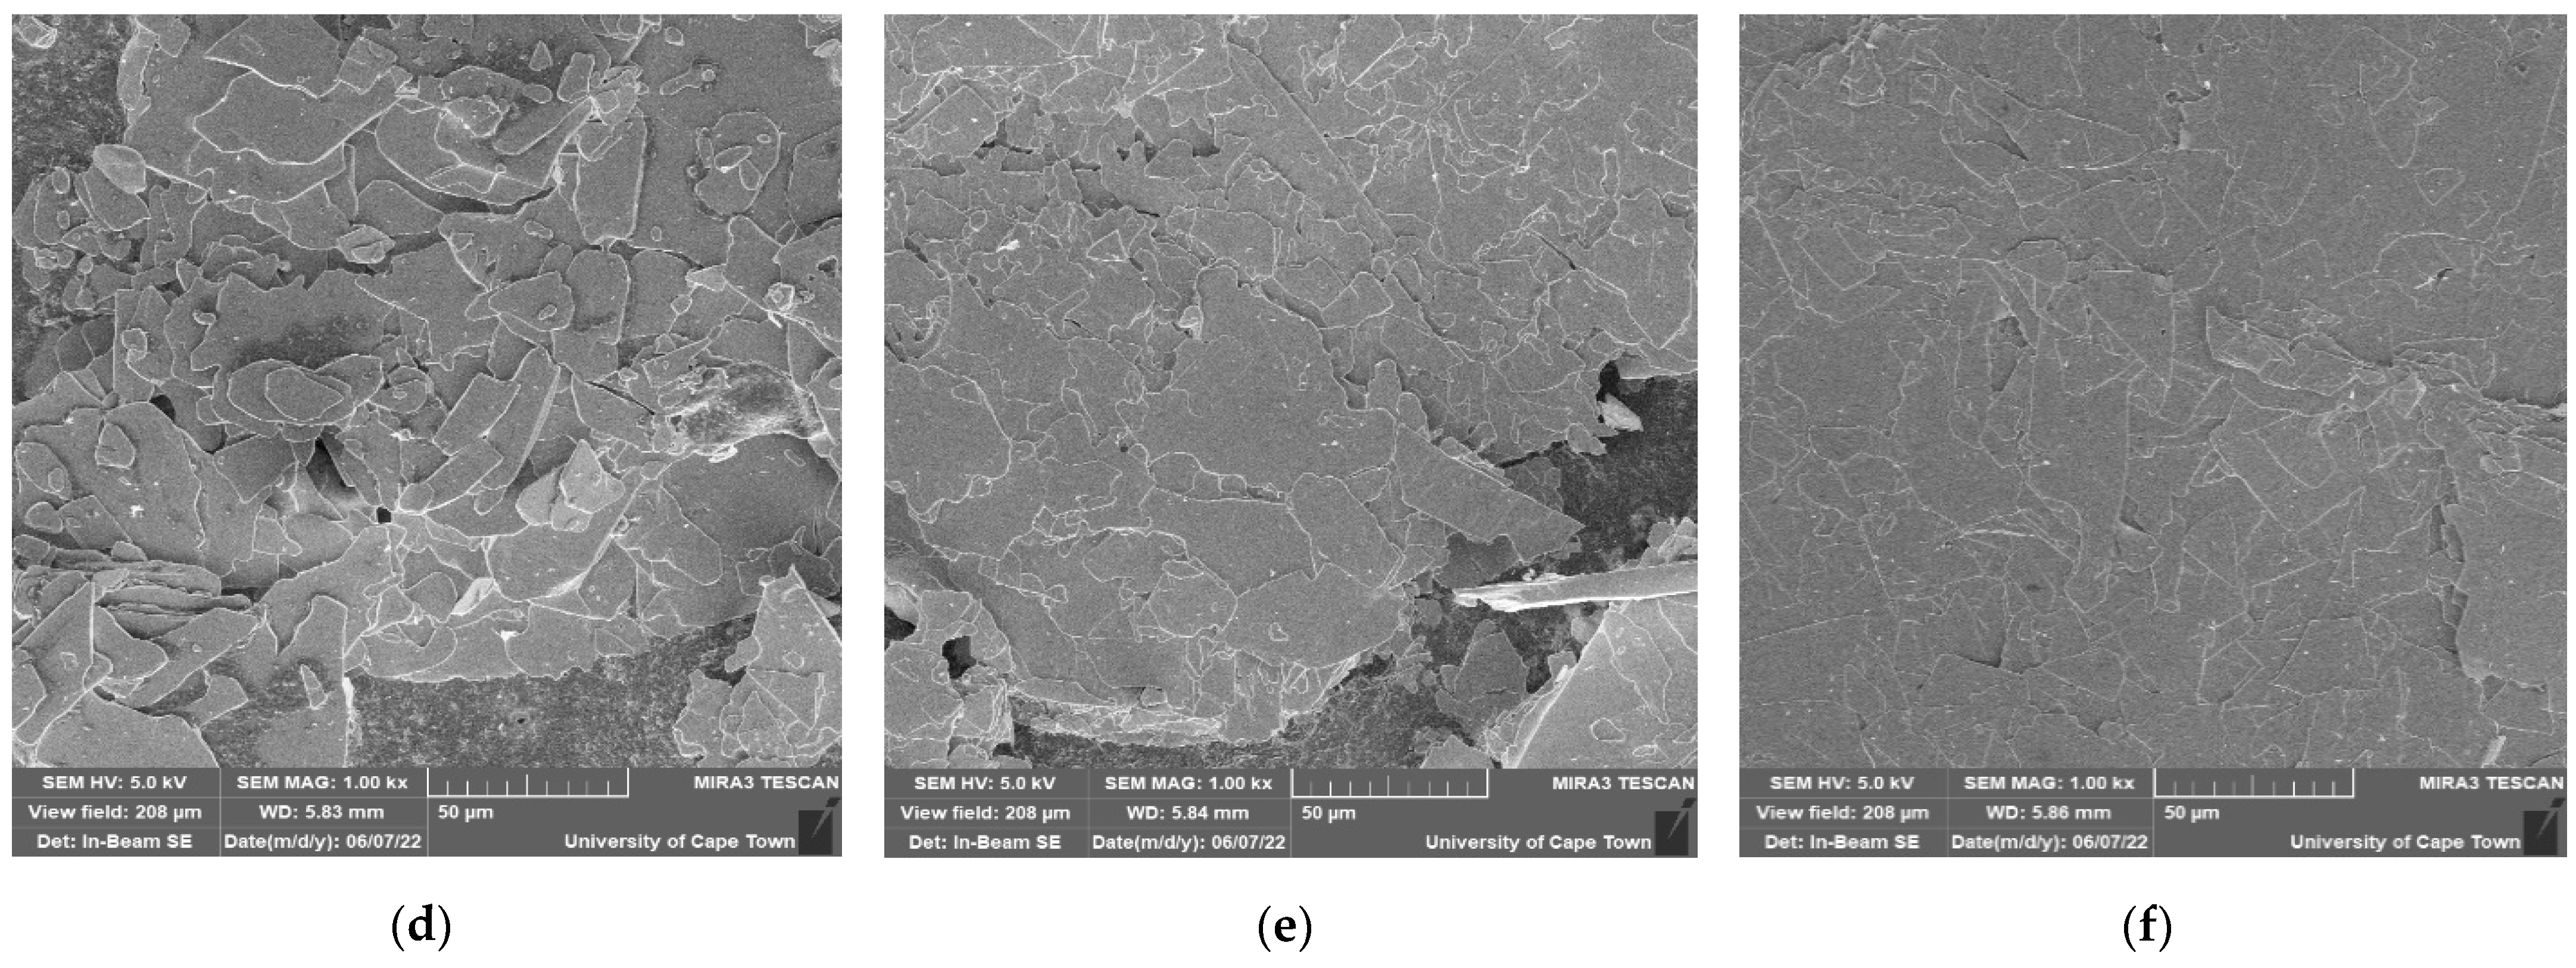
The morphology of crystals obtained at different seed loadings were analysed, and the micrographs are presented in Figure 10. At the seed loading below the critical value, the morphology was the same as for the unseeded system. The morphology was neither well defined nor distinct. As the seed loading was increased, the crystals became flat, well defined, and plate-like, with rounded edges. At a 5% seed loading, the morphology of the individual crystals was more distinct than at other seed loadings.
The results show that seeding at a seed loading more than the critical seed loading had an impact on the crystal morphology of Nd2(SO4)3.8H2O recovered from antisolvent crystallization. This was because the seeds provided surfaces for the integration of the solute, thus allowing the seeds to grow into well-faceted crystals. Below the critical seed loading, the surface area of the seeds was insufficient to suppress nucleation, and hence, the crystal morphology was the same as in the unseeded case. At the seed loading of 5%, the seeds grew into well-faceted, individual crystals.
Table 2 is the summary of the comparison of the findings in this study to selected previous and related studies.
4. Conclusions and Recommendations
This study aimed to investigate and understand the effect of varying the amount of ethanol and seed loading on the yield, PSD, and morphology of Nd2(SO4)3.8H2O during its recovery from the aqueous leach solution, using antisolvent crystallization. The leach solution mimicked the concentration of neodymium sulphate in the leach solution from NiMH batteries.
The results show that increasing the O/A ratio increased both the particle size and yield. The increase in particle size was attributed to agglomeration at higher O/A ratios. At these higher O/A ratios, supersaturation was higher, which caused excessive nucleation and, subsequently, the formation of smaller particles that agglomerated. Therefore, it is recommended that lower O/A ratio of 0.8, or less, should be selected to recover a product that is easier to handle in downstream processes. Furthermore, batch times longer than 2.5 h should be adopted to obtain higher yields at these ratios. The use of ultrasonication, to distinguish between agglomeration and crystal twinning at the lower O/A ratios, is also recommended in future studies.
Increasing the seed loading resulted in progressively smaller particles of Nd2(SO4)3.8H2O compared to the unseeded case. However, seeding with Nd2(SO4)3.8H2O crystals above the critical seed loading (i.e., 2.98%) produced Nd2(SO4)3.8H2O crystals with narrower PSDs and improved the filtration performance compared to the unseeded case. Seeding promoted crystal growth and inhibited agglomeration, thus resulting in smaller particles.
The use of actual leach solutions from NiMH batteries in future studies is recommended. This will allow the development of more insight and increase the chances of industrial implementation of antisolvent crystallization in the recovery of the multiple REEs from these secondary sources. It is also recommended that further investigations be conducted on the filterability of Nd2(SO4)3.8H2O. Finally, the use of various seed sizes, with narrow size distributions, should be considered in future investigations.
Author Contributions
Conceptualization, J.C. and A.E.L.; Data curation, J.S.; Funding acquisition, A.E.L.; Investigation, J.S.; Methodology, J.S., J.C. and A.E.L.; Project administration, J.C. and A.E.L.; Resources, A.E.L.; Supervision, J.C. and A.E.L.; Writing—original draft, J.S.; Writing—review and editing, J.C. and A.E.L. All authors have read and agreed to the published version of the manuscript.
Funding
This research received no external funding.
Data Availability Statement
Data will be available in a publicly accessible repository at the University of Cape Town https://open.uct.ac.za/ under Jonathan Sibanda.
Acknowledgments
The authors would like to thank the Crystallization and Precipitation Research Unit for the research bursary. Special mention goes to Miranda Waldron of the Electron Microscope Unit and colleagues in the Analytical Laboratory of the Chemical Engineering Department at the University of Cape Town.
Conflicts of Interest
The authors declare no conflict of interest.
References
- IUPAC. Nomenclature of Inorganic Chemistry, 3rd ed.; Blackwell Scientific Publications: Oxford, UK, 1990. [Google Scholar]
- Alves Dias, P.; Bobba, S.; Carrara, S.; Plazzotta, B. The Role of Rare Earth Elements in Wind Energy and Electric Mobility; JRC Publications Repository: Luxembourg, 2020. [Google Scholar]
- Lucas, J.; Lucas, P.; Mercier, T.; Rollat, A.; Davenport, W. Chapter 10. Rare Earths in Rechargeable Batteries; Elsevier: Amsterdam, The Netherlands, 2015. [Google Scholar]
- Yoon, H.-S.; Kim, C.-J.; Chung, K.W.; Lee, J.-Y.; Shin, S.M.; Lee, S.-J.; Joe, A.-R.; Lee, S.-I.; Yoo, S.-J. Leaching kinetics of neodymium in sulfuric acid of rare earth elements (REE) slag concentrated by pyrometallurgy from magnetite ore. Korean J. Chem. Eng. 2014, 31, 1766–1772. [Google Scholar] [CrossRef]
- Alonso, E.; Wallington, T.; Sherman, A.; Everson, M.; Field, F.; Roth, R.; Kirchain, R. An assessment of the rare earth element content of conventional and electric vehicles. SAE Int. J. Mater. 2012, 5, 473–477. [Google Scholar] [CrossRef]
- Gras, M. Recycling of Metals from NiMH Batteries: Development of Liquid-Liquid Selective Extractions Based on Ionic Liquids. 2018. Available online: https://tel.archives-ouvertes.fr/tel-01913113/document (accessed on 3 February 2022).
- Korkmaz, K.; Alemrajabi, M.; Rasmuson, Å.C.; Forsberg, K.M. Separation of valuable elements from NiMH battery leach liquor via antisolvent precipitation. Sep. Purif. Technol. 2020, 234, 115812. [Google Scholar] [CrossRef]
- Genck, W. Make the Most of Antisolvent Crystallization. Chem. Process. 2010, 73, 21–25. [Google Scholar]
- Lewis, A.; Seckler, M.; Kramer, H.; van Rosmalen, G. Industrial Crystallization: Fundamentals and Applications; Cambridge University Press: Cambridge, UK, 2015. [Google Scholar]
- Kurup, M.; Raj, R.A. Antisolvent crystallization: A novel approach to bioavailability enhancement. Eur. J. Biomed. Pharm. Sci. 2016, 3, 230–234. [Google Scholar]
- Myerson, A.S.; Erdemir, D.; Lee, A.Y. Handbook of Industrial Crystallization, 3rd ed.; Cambridge University Press: Cambridge, UK, 2019. [Google Scholar]
- Kumar, R.; Siril, P.F.; Soni, P. Preparation of Nano-RDX by Evaporation Assisted Solvent—Antisolvent Interaction. Propellants Explos. Pyrotech. 2014, 39, 383–389. [Google Scholar] [CrossRef]
- Norouzi, M.; Tahernejad, M.; Hosseini, S.G.; Tavangar, S. Taguchi Optimization of Solvent-Antisolvent Crystallization to Prepare Ammonium Perchlorate Particles. Chem. Eng. Technol. 2020, 43, 2215–2223. [Google Scholar] [CrossRef]
- Zhou, X.; Shan, J.; Chen, D.; Li, H. Tuning the Crystal Habits of Organic Explosives by Antisolvent Crystallization: The Case Study of 2,6-dimaino-3,5-dinitropyrazine-1-oxid (LLM-105). Crystals 2019, 9, 392. [Google Scholar] [CrossRef] [Green Version]
- Kakran, M.; Sahoo, N.G.; Tan, I.L.; Li, L. Preparation of nanoparticles of poorly water-soluble antioxidant curcumin by antisolvent precipitation methods. J. Nanopart. Res. 2012, 14, 757. [Google Scholar] [CrossRef]
- Yu, Z.Q.; Chow, P.S.; Tan, R.B.H. Seeding and Constant-Supersaturation Control by ATR-FTIR in Anti-Solvent Crystallization. Org. Process Res. Dev. 2006, 10, 717–722. [Google Scholar] [CrossRef]
- Peters, E.M.; Kaya, Ş.; Dittrich, C.; Forsberg, K. Recovery of Scandium by Crystallization Techniques. J. Sustain. Metall. 2019, 5, 48–56. [Google Scholar] [CrossRef] [Green Version]
- Kaya, Ş.; Peters, E.M.; Forsberg, K.; Dittrich, C.; Stopic, S.; Friedrich, B. Scandium Recovery from an Ammonium Fluoride Strip Liquor by Anti-Solvent Crystallization. Metals 2018, 8, 767. [Google Scholar] [CrossRef]
- Lung-Somarriba, B.L.M.; Moscosa-Santillan, M.; Porte, C.; Delacroix, A. Effect of seeded surface area on crystal size distribution in glycine batch cooling crystallization: A seeding methodology. J. Cryst. Growth 2004, 270, 624–632. [Google Scholar] [CrossRef]
- Demirel, H.S.; Svärd, M.; Uysal, D.; Doğan, Ö.M.; Uysal, B.Z.; Forsberg, K. Antisolvent crystallization of battery grade nickel sulphate hydrate in the processing of lateritic ores. Sep. Purif. Technol. 2022, 286, 120473. [Google Scholar] [CrossRef]
- Bergfors, T. Succeeding with seeding: Some practical advice. In Evolving Methods for Macromolecular Crystallography; Springer: Berlin/Heidelberg, Germany, 2007; pp. 1–10. [Google Scholar]
- He, Y.; Gao, Z.; Zhang, T.; Sun, J.; Ma, Y.; Tian, N.; Gong, J. Seeding Techniques and Optimization of Solution Crystallization Processes. Org. Process Res. Dev. 2020, 24, 1839–1849. [Google Scholar] [CrossRef]
- Hojjati, H.; Rohani, S. Cooling and seeding effect on supersaturation and final crystal size distribution (CSD) of ammonium sulphate in a batch crystallizer. Chem. Eng. Process. 2005, 44, 949–957. [Google Scholar] [CrossRef]
- Doki, N.; Kubota, N.; Yokota, M.; Chianese, A. Determination of Critical Seed Loading Ratio for the Production of Crystals of Uni-Modal Size Distribution in Batch Cooling Crystallization of Potassium Alum. J. Chem. Eng. Jpn. 2002, 35, 670–676. [Google Scholar] [CrossRef]
- Peters, E.M.; Svärd, M.; Forsberg, K. Impact of process parameters on product size and morphology in hydrometallurgical antisolvent crystallization. CrystEngComm 2022, 24, 2851–2866. [Google Scholar] [CrossRef]
- Zhang, C.-t.; Wang, H.-r.; Wang, Y.-l. Internally generated seeding policy in anti-solvent crystallization of ceftriaxone sodium. Chem. Eng. Process. 2010, 49, 396–401. [Google Scholar] [CrossRef]
- Beckmann, W. Crystallization: Basic Concepts and Industrial Applications; Wiley-VCH: Weinheim, Germany, 2013. [Google Scholar]
- Eder, R.J.P.; Schmitt, E.K.; Grill, J.; Radl, S.; Gruber-Woelfler, H.; Khinast, J.G. Seed loading effects on the mean crystal size of acetylsalicylic acid in a continuous-flow crystallization device. Cryst. Res. Technol. 2011, 46, 227–237. [Google Scholar] [CrossRef]
- Sander, A.; Kalšan, M.; Kardum, J.P. Kinetics of the seeded batch cooling crystallization. Chem. Eng. Trans. 2009, 17, 753–758. [Google Scholar]
- OLI-Systems-Inc. OLI Studio 11.0 Morris. 2022. Available online: https://www.olisystems.com/ (accessed on 28 April 2021).
- Randolph, A.D.; Larson, M.A. Theory of Particulate Processes: Analysis and Techniques of Continuous Crystallization, 2nd ed.; Academic Press: San Diego, CA, USA, 1988. [Google Scholar]
- Sleutel, M.; DMaes; Wyns, L.; Willaert, R. Kinetic Roughening of Glucose Isomerase Crystals. Cryst. Growth Des. 2008, 8, 4409–4414. [Google Scholar]
- Lindenberg, C.; Krättli, M.; Cornel, J.; Mazzotti, M. Design and Optimization of a Combined Cooling/Antisolvent Crystallization Process. Cryst. Growth Des. 2009, 9, 1124–1136. [Google Scholar] [CrossRef]
- Palosaari, S.; Louhi-Kultanen, M.; Sha, Z. Industrial Crystallization. In Handbook of Industrial Drying, 4th ed.; CRC Press: Boca Raton, FL, USA, 2006. [Google Scholar]
Figure 1.
PSD of Nd2(SO4)3.8H2O seeds.

Figure 2.
Baffled batch crystallizer with an overhead stirrer held on a stand.

Figure 3.
Yield of Nd2(SO4)3.8H2O crystals at different O/A ratios.

Figure 4.
Effect of varying the O/A ratios on the PSD of Nd2(SO4)3.8 H2O.

Figure 5.
SEM micrographs of Nd2(SO4)3.8H2O product at a magnification of 1000 ×. (a) O/A= 0.6; (b) O/A = 0.8; (c) O/A =1.0; (d) O/A =1.2; and (e) O/A = 1.4.
Figure 5.
SEM micrographs of Nd2(SO4)3.8H2O product at a magnification of 1000 ×. (a) O/A= 0.6; (b) O/A = 0.8; (c) O/A =1.0; (d) O/A =1.2; and (e) O/A = 1.4.

Figure 6.
SEM micrographs of Nd2(SO4)3.8H2O product at a magnification of 500×. Scale bar of 100 µm (a) O/A ratio = 0.6; (b) O/A ratio = 0.8; (c) O/A ratio = 1.0; (d) O/A ratio = 1.2; and (e) O/A ratio = 1.4.
Figure 6.
SEM micrographs of Nd2(SO4)3.8H2O product at a magnification of 500×. Scale bar of 100 µm (a) O/A ratio = 0.6; (b) O/A ratio = 0.8; (c) O/A ratio = 1.0; (d) O/A ratio = 1.2; and (e) O/A ratio = 1.4.

Figure 7.
Evolution of moments at the O/A ratio of 0.8 and 1.4 (a) total number (NT); (b) total length (LT); (c) total surface area (AT); and (d) total volume (VT).
Figure 7.
Evolution of moments at the O/A ratio of 0.8 and 1.4 (a) total number (NT); (b) total length (LT); (c) total surface area (AT); and (d) total volume (VT).

Figure 8.
Effect of seed loading on the PSD of Nd2(SO4)3.8H2O product.

Figure 9.
Effect of seed loading on the particle size of Nd2(SO4)3.8H2O product.

Figure 10.
SEM micrographs of Nd2(SO4)3.8H2O crystals at a magnification of 1000×. Scale bar of 50 µm (a) Nd2(SO4)3.8H2O seeds; (b) Unseeded; (c) CS = 0.64%; (d) CS = 5%; (e) CS = 10%; and (f) CS = 20%.
Figure 10.
SEM micrographs of Nd2(SO4)3.8H2O crystals at a magnification of 1000×. Scale bar of 50 µm (a) Nd2(SO4)3.8H2O seeds; (b) Unseeded; (c) CS = 0.64%; (d) CS = 5%; (e) CS = 10%; and (f) CS = 20%.


Table 1.
Flowrates of reagents at different O/A ratios.
| O/A Ratio | Ethanol Flowrate (mL/min) | Nd2(SO4)3 Aqueous Leach Solution Flowrate (mL/min) |
|---|---|---|
| 0.6 | 60 | 100 |
| 0.8 | 80 | |
| 1.0 | 100 | |
| 1.2 | 120 | |
| 1.4 | 140 |
Table 2.
Comparison of yield, filterability, and physical properties of the product obtained in this study versus previous studies.
Table 2.
Comparison of yield, filterability, and physical properties of the product obtained in this study versus previous studies.
| Research Output | Selected Studies | Current Study/Research |
|---|---|---|
| Yield and filterability | Peters et al. [17] Kaya et al. [18] Korkmaz et al. [7] | Higher yields obtained at high solvent-to-antisolvent ratios in this study corroborate the findings Peters et al. [17], Kaya et al. [18], and Korkmaz et al. [7]. However, this study showed that an increase in yield has a negative impact on product filterability. |
| Particle size and morphology | Zhang et al. [26] Peters et al. [25] Lindenberg et al. [33] Zhou et al. [14] Yu et al. [16] | It was found that increasing the seed loading increased particle sizes and narrowed the PSD of Nd2(SO4)3.8H2O. Varying the O/A ratio in this study altered the morphology of Nd2(SO4)3.8H2O. Although these findings corroborate the results from previous studies, an inorganic product was recovered unlike in Zhang et al. [26], Lindenberg et al. [33], Zhou et al. [14], and Yu et al. [16]. Results in this study support the findings by Peters et al. [25]. |
Publisher’s Note: MDPI stays neutral with regard to jurisdictional claims in published maps and institutional affiliations. |
© 2022 by the authors. Licensee MDPI, Basel, Switzerland. This article is an open access article distributed under the terms and conditions of the Creative Commons Attribution (CC BY) license (https://creativecommons.org/licenses/by/4.0/).
Share and Cite
MDPI and ACS Style
Sibanda, J.; Chivavava, J.; Lewis, A.E. Crystal Engineering in Antisolvent Crystallization of Rare Earth Elements (REEs). Minerals 2022, 12, 1554. https://doi.org/10.3390/min12121554
AMA Style
Sibanda J, Chivavava J, Lewis AE. Crystal Engineering in Antisolvent Crystallization of Rare Earth Elements (REEs). Minerals. 2022; 12(12):1554. https://doi.org/10.3390/min12121554
Chicago/Turabian StyleSibanda, Jonathan, Jemitias Chivavava, and Alison Emslie Lewis. 2022. "Crystal Engineering in Antisolvent Crystallization of Rare Earth Elements (REEs)" Minerals 12, no. 12: 1554. https://doi.org/10.3390/min12121554
Note that from the first issue of 2016, this journal uses article numbers instead of page numbers. See further details here.