
Study on Shear Characteristics and Failure Mechanism of Inclined Layered Backfill in Mining Solid Waste Utilization
1
Faculty of Public Safety and Emergency Management, Kunming University of Science and Technology, Kunming 650093, China
2
Faculty of Land and Resources Engineering, Kunming University of Science and Technology, Kunming 650093, China
3
Yunnan Key Laboratory of Sino-German Blue Mining and Utilization of Special Underground Space, Kunming 650093, China
*
Author to whom correspondence should be addressed.
Minerals 2022, 12(12), 1540; https://doi.org/10.3390/min12121540
Submission received: 15 October 2022
/
Revised: 14 November 2022
/
Accepted: 24 November 2022
/
Published: 29 November 2022
(This article belongs to the Topic Green Low-Carbon Technology for Metalliferous Minerals)
Abstract
:To eliminate the massive accumulation of tailings and promote the recycling of mine solid waste to develop green mining, a two-layered cemented paste backfill (CPB) with layering angles of 5°, 10°, 15°, 20° and 25° and complete CPB were prepared to conduct direct shear experiments; thus, the effect of the layering angle on their shear mechanical properties can be investigated. Meanwhile, the particle flow analysis program PFC 2D was used to simulate the micro-crack propagation law and reveal the damage mechanism. The results showed that the layered structure weakens the integrity of CPB and significantly reduces its shear strength, cohesion and internal friction angle. When the layered angle increased from 20° to 25°, the shear strength under normal stress of 100 kPa was decreased by 35.13% and cohesion by 43.43%. As the layered angle increased from 5° to 25°, the internal friction angle decreased first and then increased and reached the minimum when the layered angle was 15°. With the increase in the layered angle, the layered CPB gradually generated tension cracks along the layered surface, and the number of cracks gradually increased. The failure mode of each specimen is mainly a shear crack through the shear surface failure, crack expansion in the middle of shear surface on the upper and lower sides of the spindle-shaped failure and an inverted Z-shaped conjugate shear failure. This research can provide a substantial reference in the design and application of layered CPB in underground mines.
1. Introduction
The filling mining method means mixing solid wastes, such as surface-stockpiled tailings, with cement and water to make a paste to fill the mining area [1,2], which can reduce surface-stockpiled tailings [3,4] and surface settlement to protect the environment [5]. Moreover, this method is beneficial in controlling the stability of surrounding rocks and improving the utilization rate of mineral resources [6]; therefore, it has become the preferred mining method for the green mining of metal mineral resources in various countries [7,8]. However, the influence of filling capacity and slurry flow characteristics in the actual filling process in mines inevitably causes a nonhorizontal layering phenomenon inside the CPB, which has a great deterioration effect on its strength characteristics and overall stability [9,10].
As an artificial composite matrix, the strength characteristics of the CPB will directly affect mining efficiency. Therefore, much research has been conducted to study the bending behavior [11,12,13,14], uniaxial [15,16,17] and triaxial [18,19] compression properties and shear characteristics [20,21,22] of complete CPB and CPB–rock composite (adding reinforcement materials such as waste rock, fiber and 3D-printing polymer). Xue et al. [23] found that incorporating the appropriate amount of fiber could significantly improve the bending strength of the CPB and the optimal fiber content was 0.6%. With uniaxial compression tests and CT scans, Sun et al. [24] found that the fine structure inside the reinforced CPB with 30% waste rock content was more uniform and denser than the normal CPB and had better mechanical properties. Xiu et al. [25] discovered that under triaxial compression, the failure mode of CPB gradually transformed from tensile failure to tensile-shear failure and compression-shear failure with the gradual increase in the lateral constraint ratio. Besides, Wu et al. [26] clarified that under triaxial compression, the damage modes of CPB–rock assemblies were mainly composite damage and sliding damage along the cohesive interface, and when the confining pressure was lower, the assemblies mainly incurred sliding damage. Fang et al. [27] conducted a shear test study on the adhesive interface of CPB–rock assemblage and found that the high curing temperature could promote the hydration reaction of cement to improve the early shear strength of the assemblage, but the shear strength was reduced in the latter because of the temperature inversion effect.
For the layered CPB, Gao et al. [28] discovered that the number and angle of delamination had a deteriorating effect on the flexural strength of layered CPB, and the flexural strength decreased significantly when the layered angle exceeded 5°. Chen et al. [29] proved that the presence of layered contact surfaces significantly reduced the uniaxial compressive strength and elastic modulus of the layered CPB but enhanced its deformation capacity. Cao et al. [30] reported that the uniaxial compressive strength of the layered CPB was negatively correlated with the interval time of the filling and showed an inverted U-shaped distribution with the increase in the layered angle. Wang et al. [31,32] found that in uniaxial compression, the acoustic emission signal of the layered CPB was characterized by first increasing and then decreasing, and the cracks mainly expanded from the middle layer to both ends during damage, and the failure mode gradually transformed from tensile failure to shear failure as the cement content decreased. Zhang et al. [33] illustrated that the increase in the number of layers weakened the triaxial compressive strength and elastic modulus of the layered CPB but had a promoting effect on the peak strain. Wang et al. [34,35] conducted cyclic loading and unloading tests on layered CPB, and the results showed that when the surrounding pressure was lower, cyclic loading and unloading had an improving effect on the compressive strength of the layered CPB but showed decreasing effect when the surrounding pressure was higher. In addition, through the Hopkins compression bar impact test and numerical simulation, Li et al. [36] and Zhang et al. [37] found that the dynamic compressive strength of the layered CPB increased by 11% to 163% compared with the static compressive strength, and the damage mode of the layered CPB gradually changed from tension damage to shear damage with the increase in the layered angle.
According to the review above, it can be known that the strength properties of CPB have been thoroughly studied and have contributed greatly to the successful application of the filling mining method. However, according to the results of many literature searches, the shear properties of incline-layered CPB have not been reported so far; therefore, in this paper, layered CPB with layering angles of 5°, 10°, 15°, 20° and 25° was prepared for direct shear physical experiments to analyze the influence of layering angle on its shear properties. The numerical model of incline-layered CPB is also established using the discrete element numerical simulation software PFC 2D to visually analyze the evolution of the number and location of cracks inside the CPB under shear with different layering angles, which provides a theoretical basis for the selection of layering angles in the mine filling process.
2. Materials and Method
2.1. Raw Materials
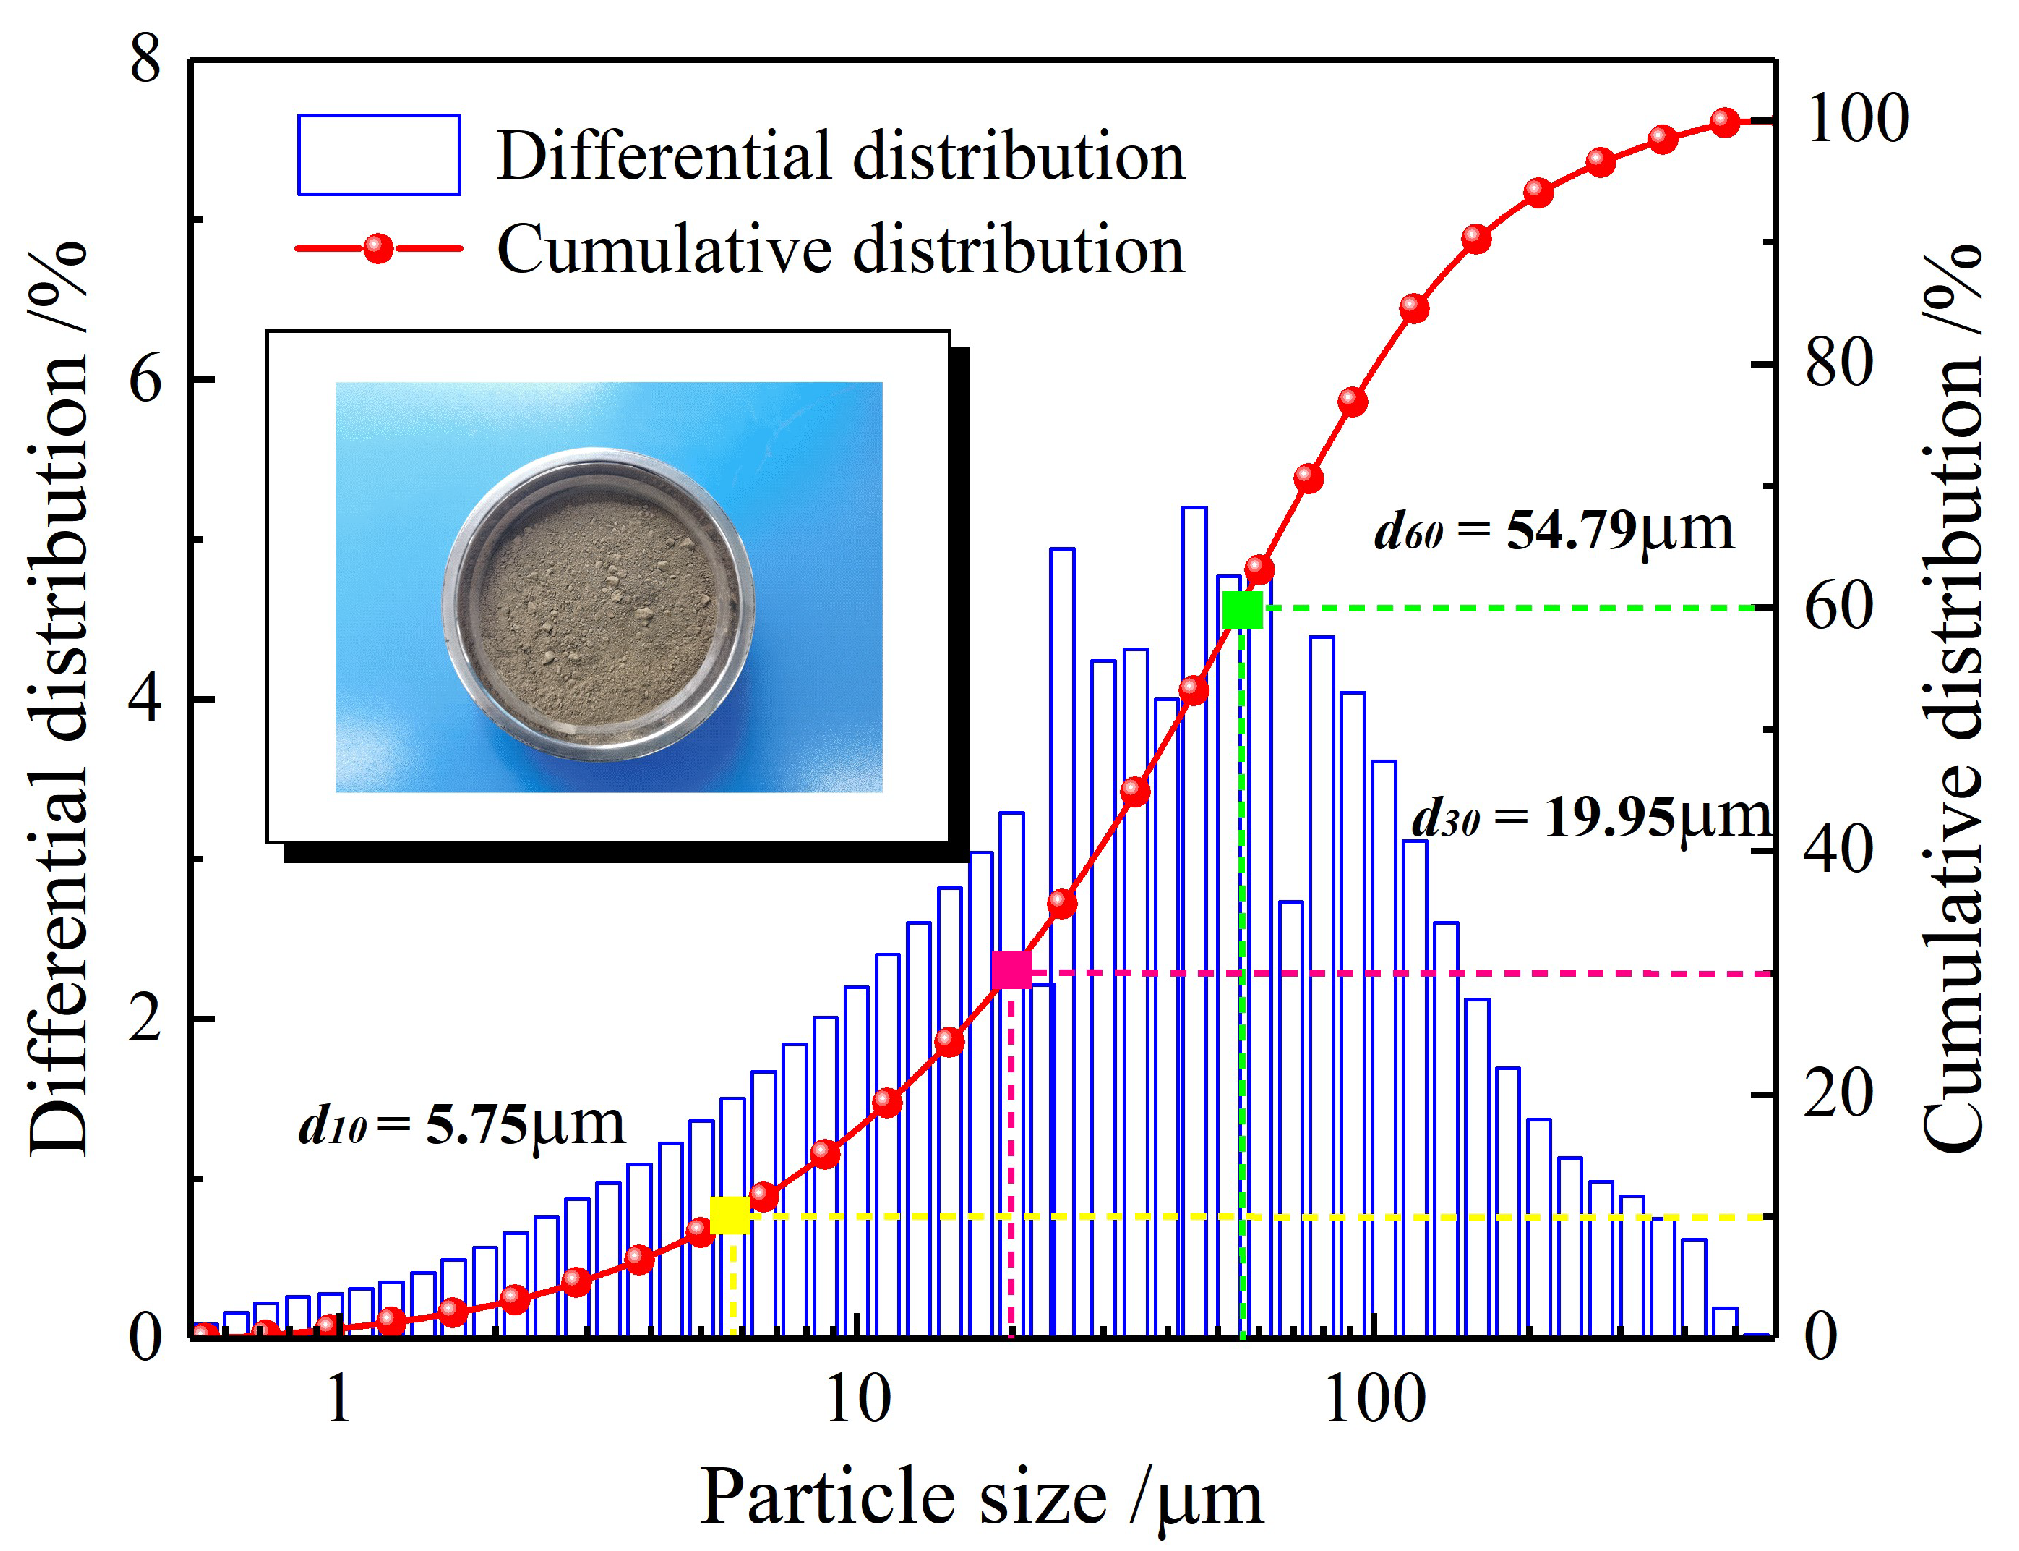
The experimental materials include tailings, cement and water; among them, the tailings were taken from a copper mine in China and had a density of 3.08 t/m3, and their gradation was measured using a Malvern Mastersizer 2000 laser particle-size analyzer; the results are shown in Figure 1. It can be seen that Cu (Cu = d60/d10) and Cc (Cc = d302/(d60 × d10)) are 9.53 and 1.26, respectively, which means that the tailings have good gradation [38]. The chemical composition of tailings is shown in Table 1. P.C42.5 composite Portland cement was used for cementation to mix with tap water to make filling slurry.
2.2. Layered CPB Specimens Preparation
The filler slurry with a mass concentration of 68% and 1:20 ratio of cement to tailings was prepared. The nonlayered and two-layered CPBs with layering angles of 5°, 10°, 15°, 20° and 25° were made and subjected to six working conditions. Each group of working conditions was subjected to four different normal stresses for direct shear tests, and for each normal stress, three parallel tests were conducted separately to reduce the experimental error. The detailed experimental scheme is shown in Table 2.
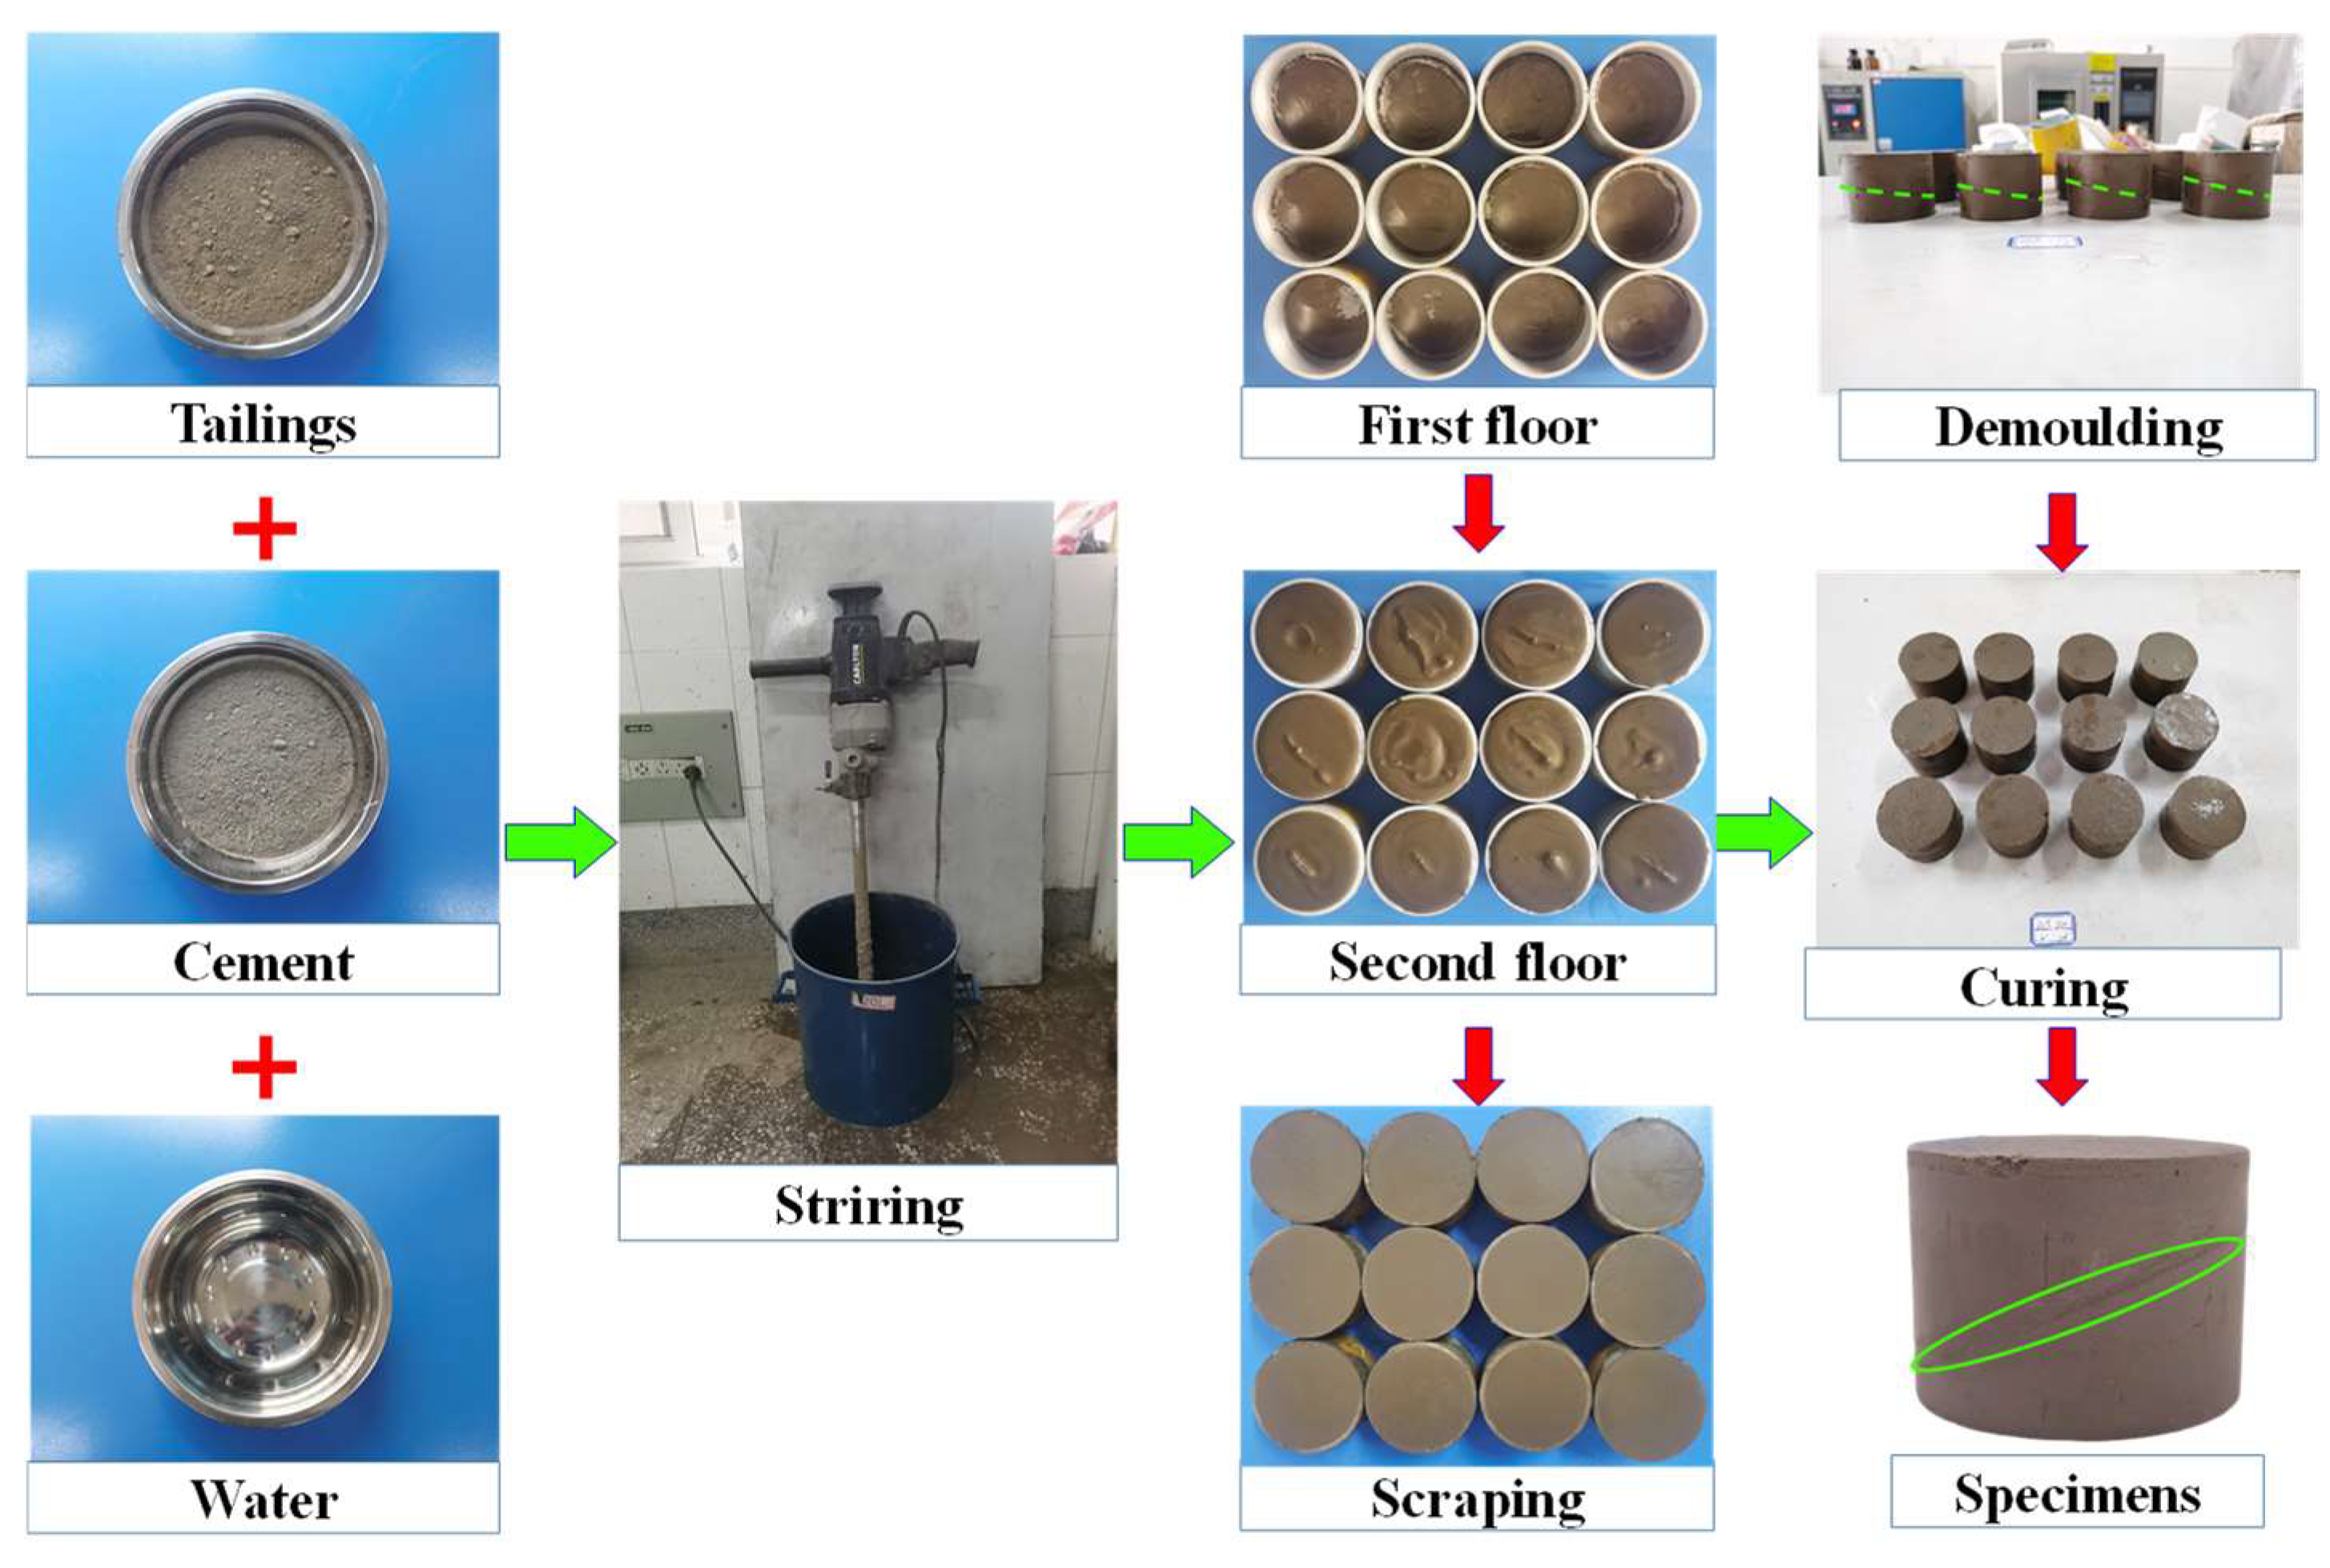
First, the electronic scale was used to weigh the tailings, cement and water, and then the weighed materials were poured into the barrel for mixing. To ensure the filling slurry was mixed evenly, the mixing time was controlled to be more than 3 min [39]. Finally, the uniformly mixed slurry was poured into a mold with a diameter of 61.8 mm and a height of 45 mm for consolidation, in which the complete CPB was poured at one time, and the layered CPB was poured twice at a predesigned layered angle with a fixed interval of 24 h. After 24 h of solidification, the layered CPB was demolded and placed in a curing chamber at a temperature of 20 ± 1 °C and a humidity of 90% ± 5%. After curing for 3 days, a direct shear test was performed. The specific preparation process of the layered CPB specimens is shown in Figure 2.
2.3. Direct Shear Test
The ZJ-4A strain-controlled direct shear apparatus was adopted, and the shear box size is 61.8 mm (diameter) × 45 mm (height), where the upper and lower height of the shear box is 25 mm and 20 mm, respectively. The direct shear test was conducted on the layered CPB under the normal stress of 100 kPa, 200 kPa, 300 kPa and 400 kPa, respectively, and the shear rate was controlled as 0.8 mm/min, as shown in Figure 3.
2.4. Establishment of Numerical Model
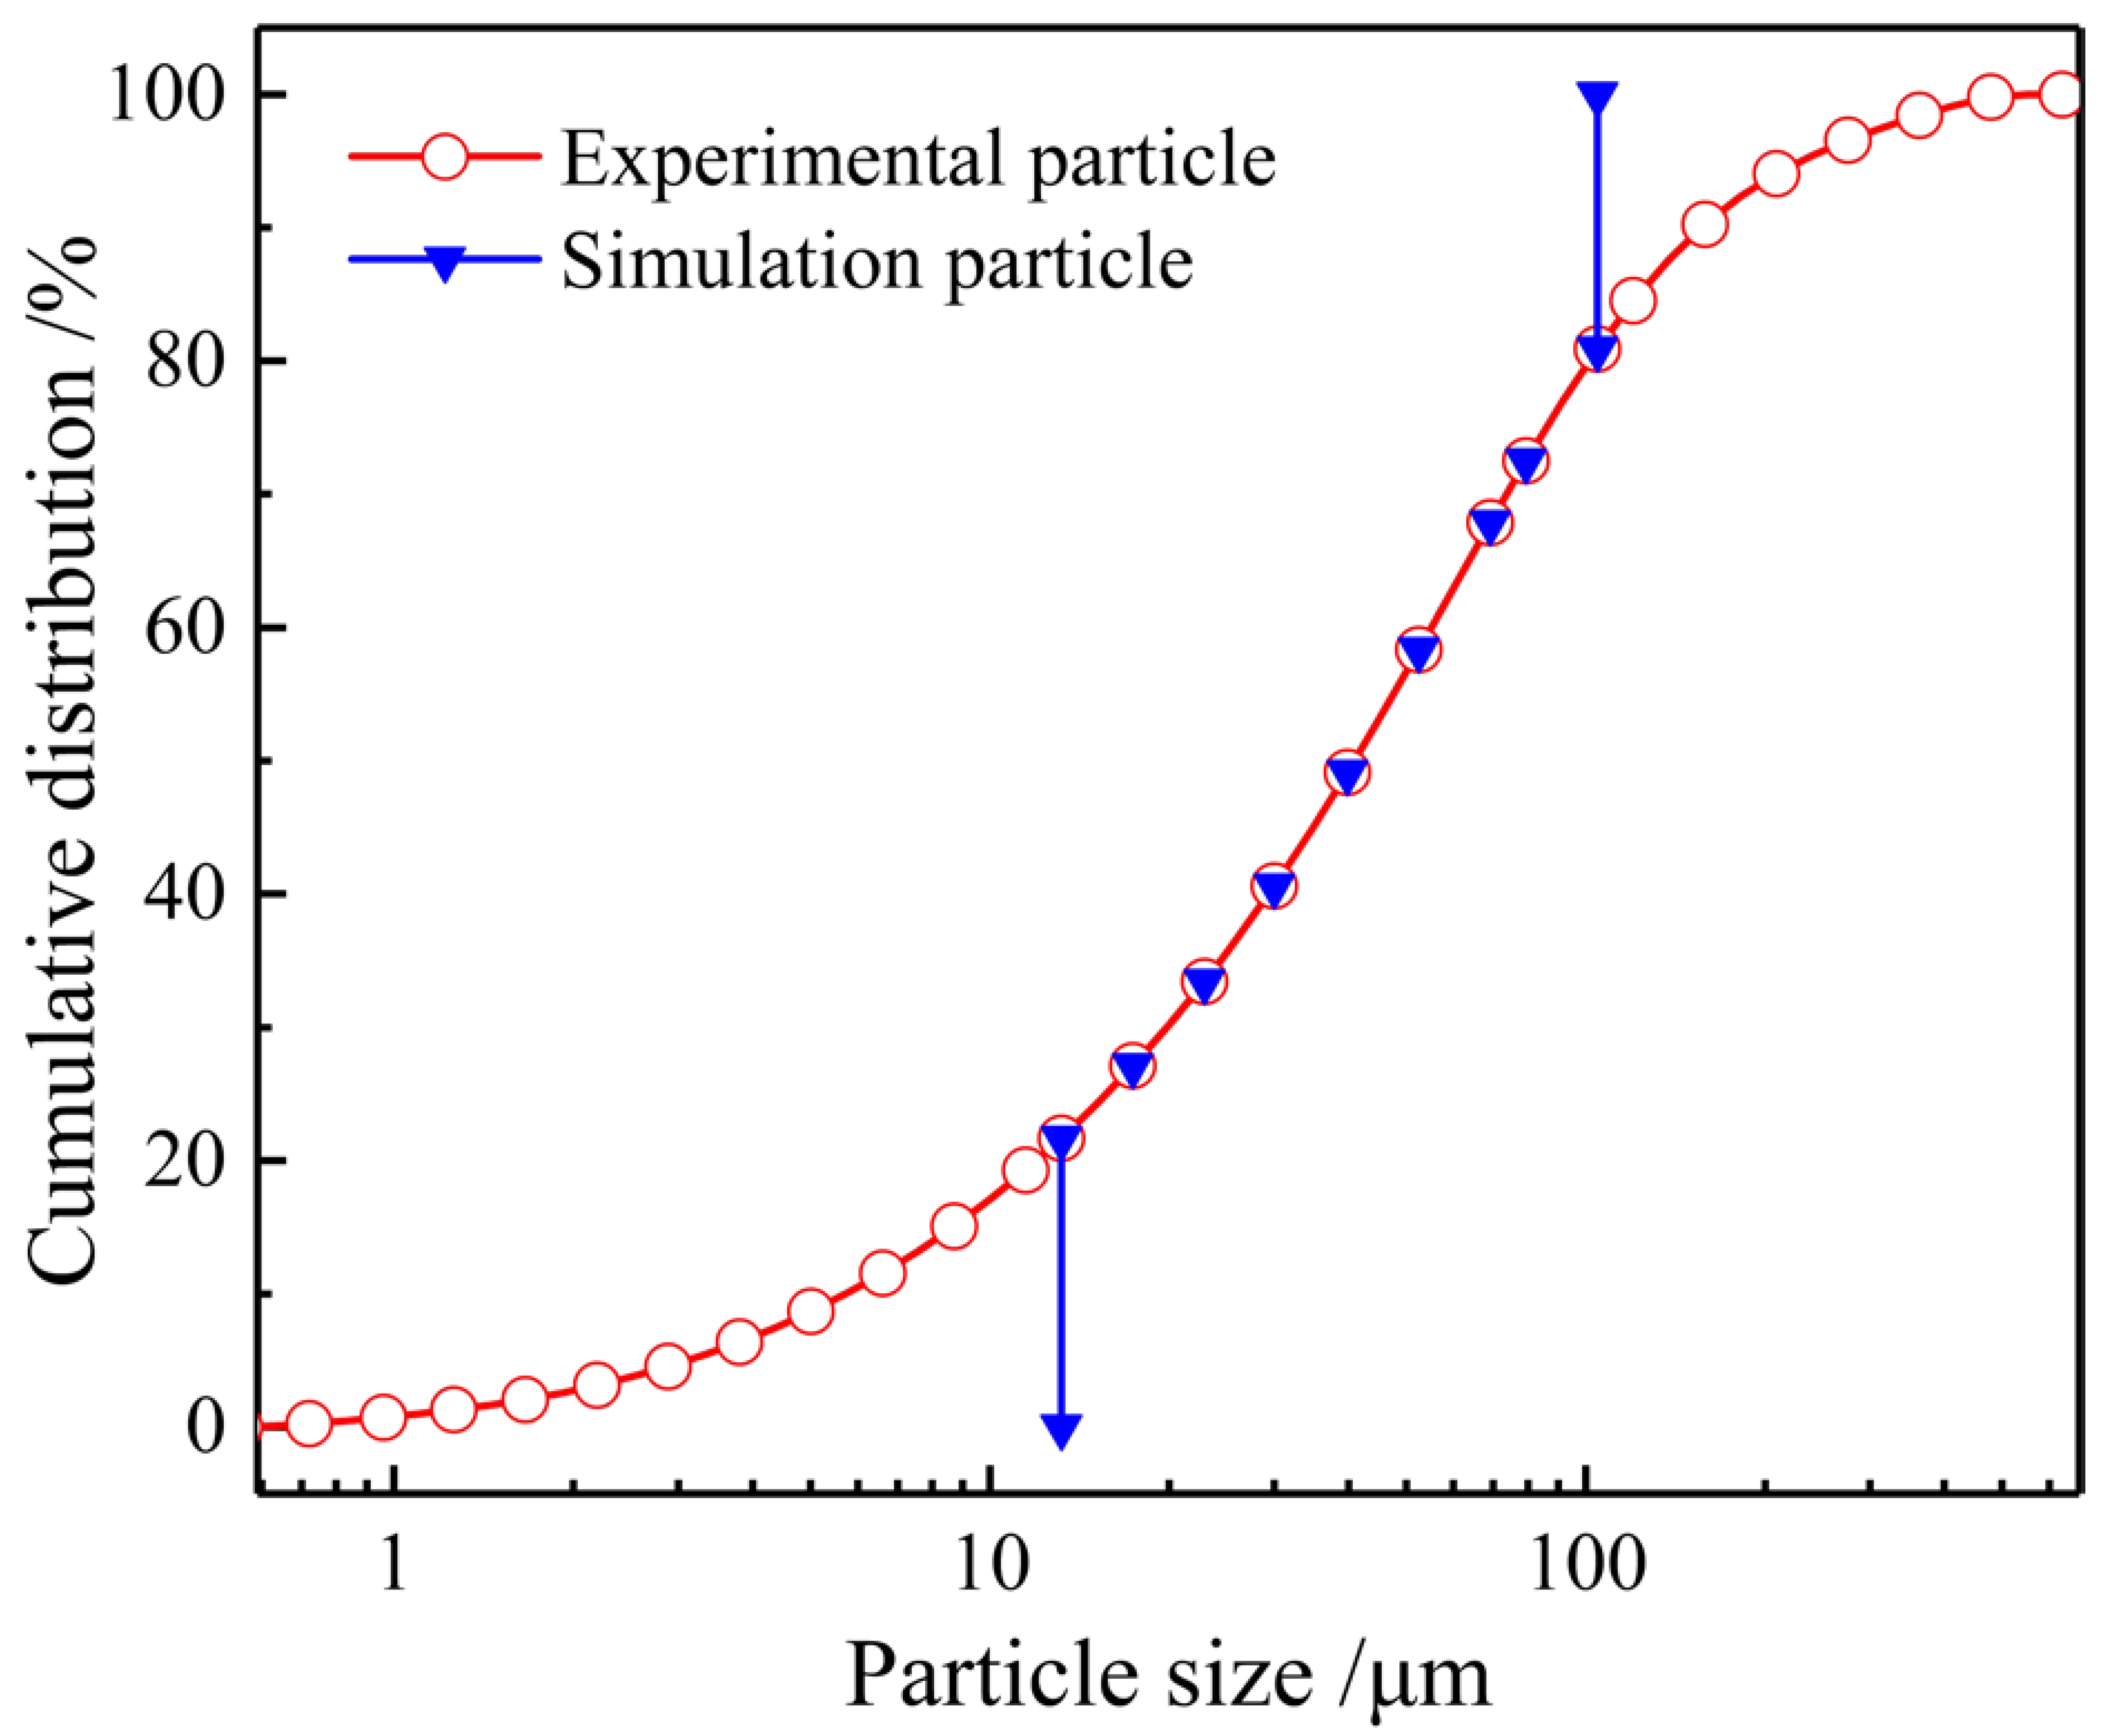
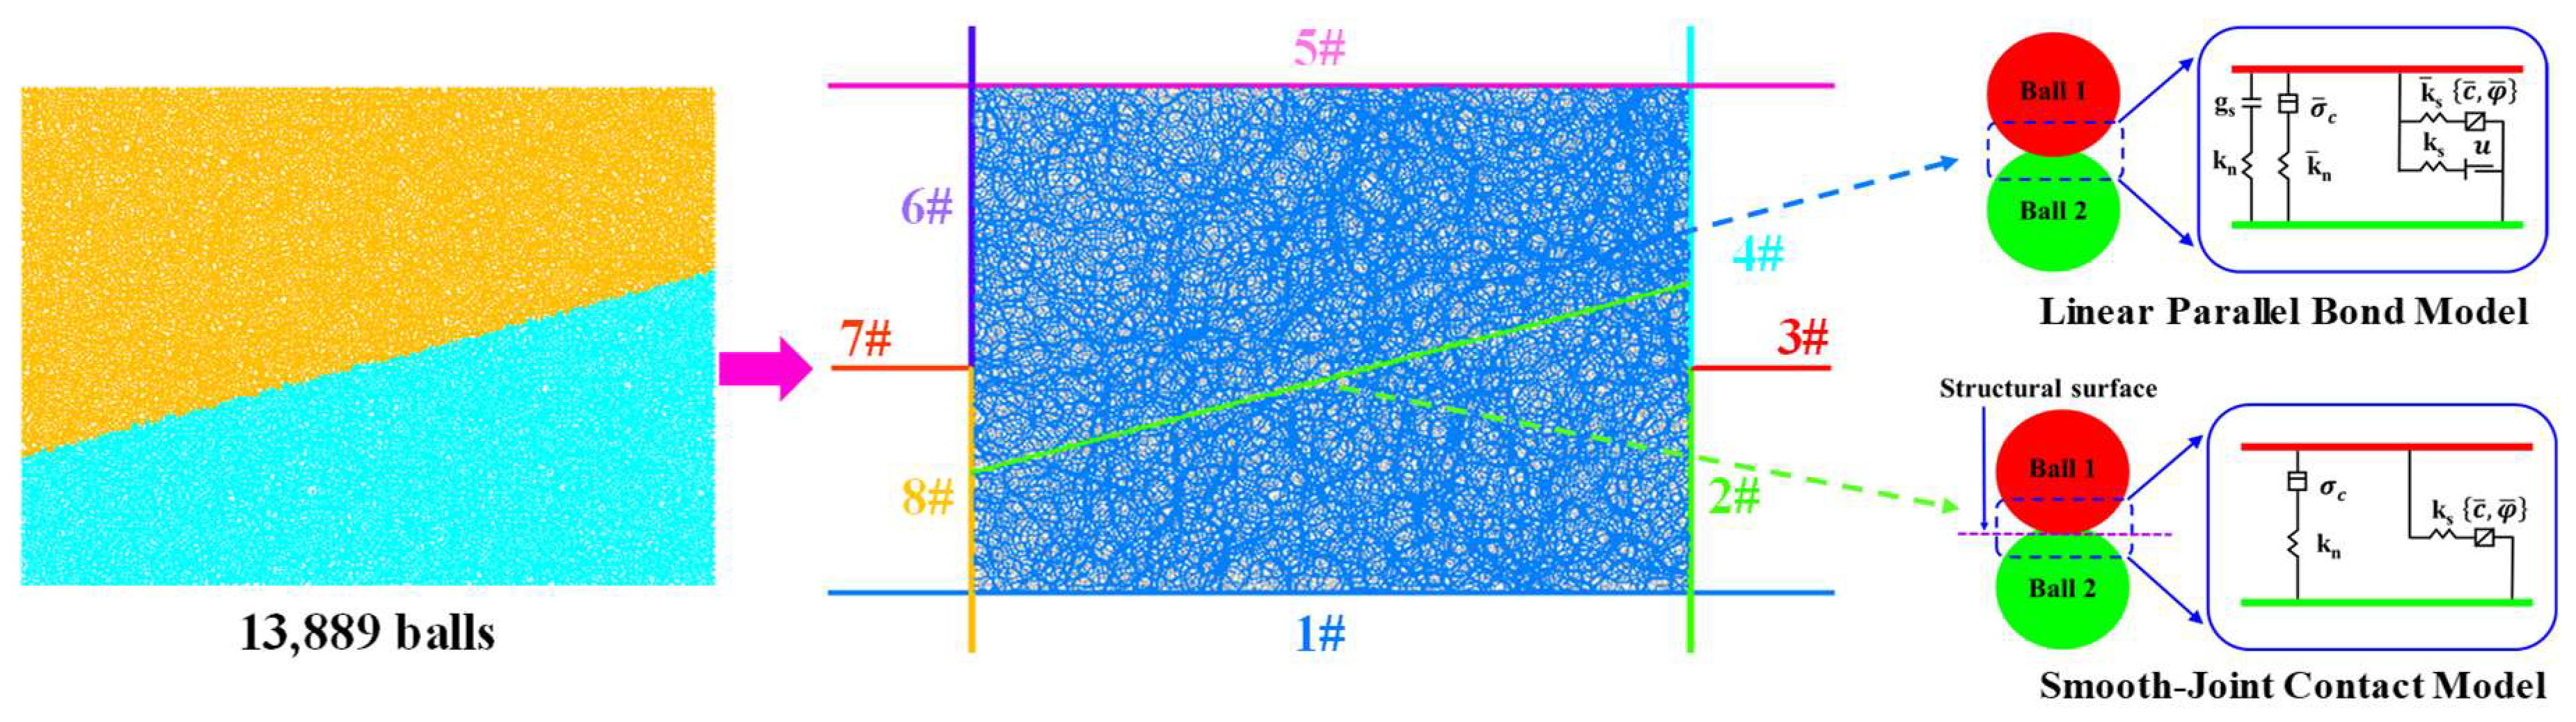
The numerical models of the N-L, 2-L-5, 2-L-15 and 2-L-25 specimens were established using the particle flow numerical analysis software, and the internal micro-crack propagation law and damage mode during shearing were simulated and analyzed. The particle size distribution in the model was consistent with the actual tailings gradation but was simplified, and the data at the end of the actual tailings particle size distribution curve where the percentage was greater than 80% and less than 20% were ignored and replaced by the corresponding maximum and minimum particles. To reduce the calculation time, the particle radius is enlarged by 15 times, and the simulated particle gradation curve is shown in Figure 4.
In this paper, the bonding of cement to tailings was simulated by the linear parallel bond model, which adds the bonding function to the linear contact model and is widely used in dense materials such as rocks, backfills and coal–rock assemblages. The layering phenomenon of layered CPB was simulated by the smooth-joint contact model, and the final numerical model is shown in Figure 5.
3. Result and Discussion
3.1. Shear Stress(τ) and Shear Displacement(δ)
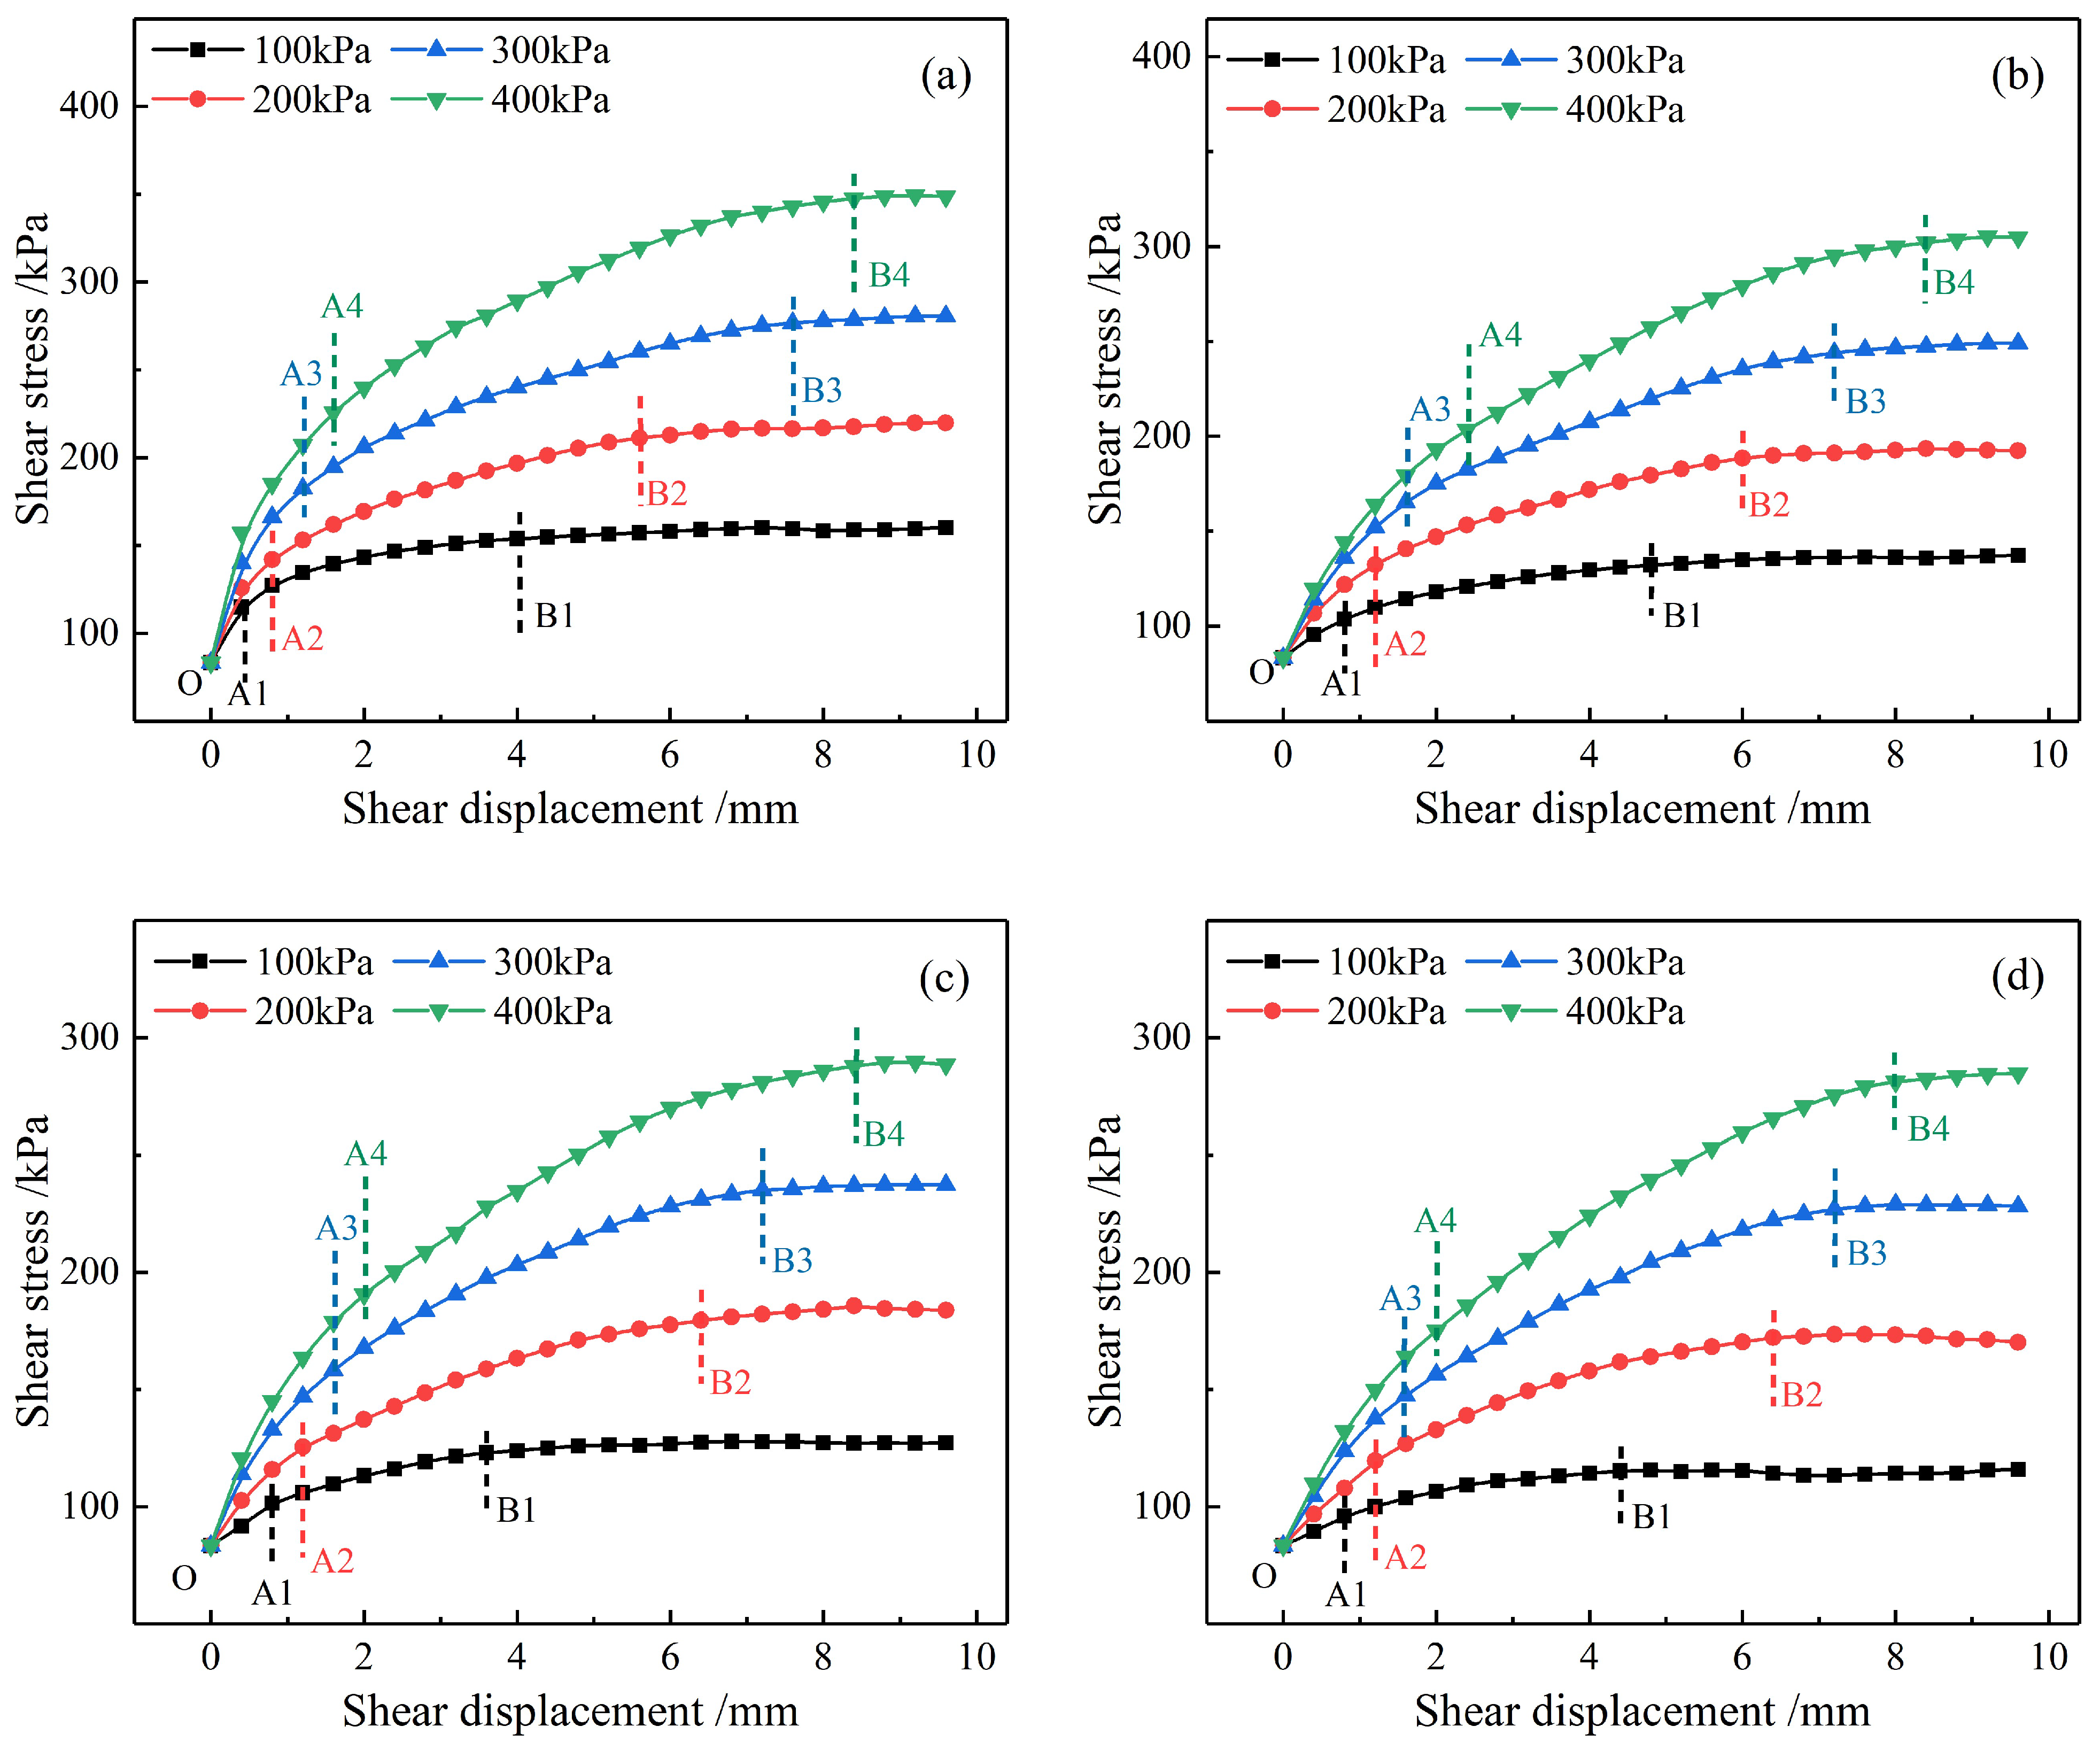
The experimental shear rate was set to 0.8 mm/min, and the data were recorded every 30 s, and then the relationship curves between τ-δ of the CPB was obtained, as shown in Figure 6.
The representative N-L, 2-L-10, 2-L-15 and 2-L-20 CPB were selected to analyze the influence law of normal stress on the τ-δ curves; as shown in Figure 6, it can be seen that the normal stress has an important influence on the changing trend of the τ-δ curve of the CPB. Under the same layered angle, the greater the normal stress, the greater the shear stress, and the slower it reaches shear strength, which also conforms to the Mohr–Coulomb strength criterion.
Under different normal stresses, the trends of the τ-δ curves of each CPB were found to be approximately the same, and they all can be divided into three stages: (1) the linear elastic deformation stage (OA), during which the shear stress increases rapidly and grows approximately linearly; (2) the yield stage (AB), during which the shear stress grows slowly, the slope of the τ-δ curve decreases significantly, and the lower normal stress, the faster the CPB yields; and (3) the plastic shear damage stage (after point B), during which under the action of normal stress the CPB does not fail immediately after reaching the shear strength. Under the lower normal stress (100 kPa, 200 kPa), the tailing particles on the shear plane of the CPB were staggered and tumbled, making the CPB show strain-softening characteristics. In comparison, the higher normal stress (300 kPa and 400 kPa) enhanced the bite contact between the particles of the CPB, further increasing its ability to resist failure, thus showing the plastic failure characteristics of the constant shear stress as the shear displacement increases.
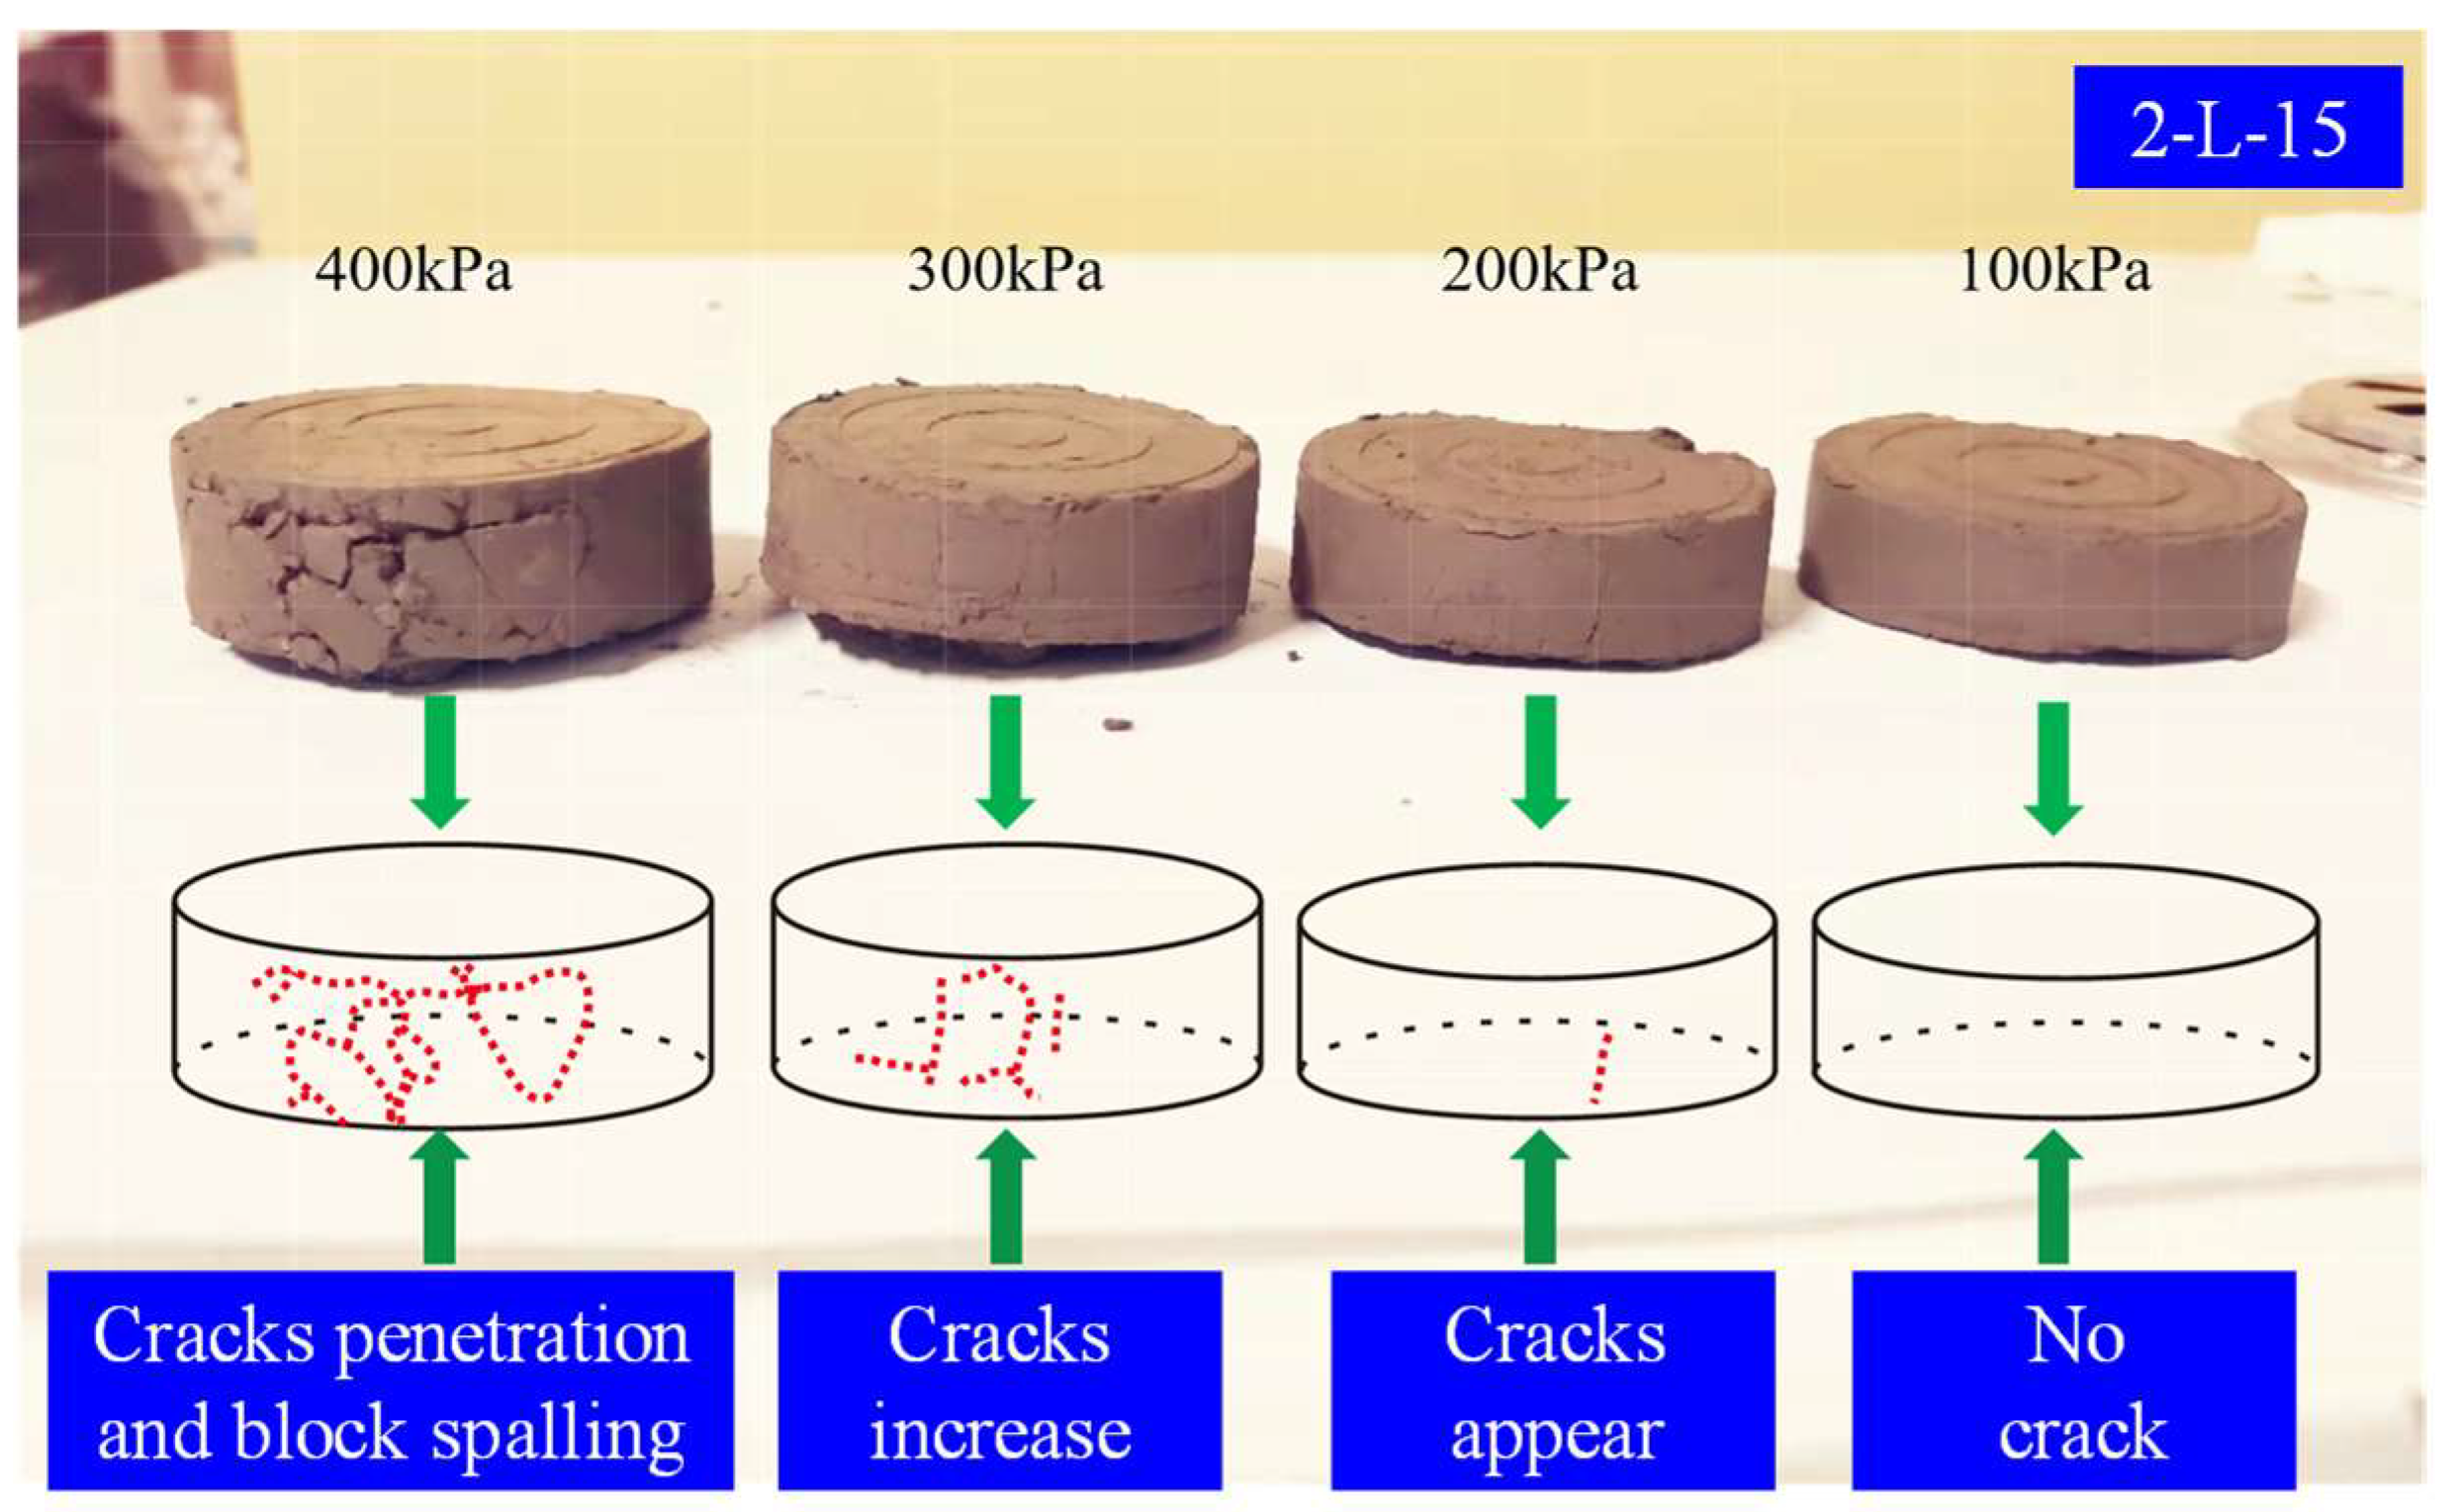
As shown in Figure 7, each CPB was affected by the normal stress in the shearing process, and the stress concentration phenomenon appeared on its shearing plane in different degrees. Taking the 2-L-15 CPB as an example, its stress concentration became more obvious with the gradual increase in the normal stress. When the normal stress was 200 kPa, it initially produced macroscopic cracks, and the number of cracks increased as the normal stress increased to 300 kPa; when the normal stress further increased to 400 kPa, the CPB cracks penetrated and showed the characteristics of local block spalling.
The effect of the layered angle on the τ-δ curve of the CPB is shown in Figure 8; it was analyzed that the layering phenomenon weakened the integrity of the CPB, making the shear stress of the complete CPB greater than the layered CPB. Under the same normal stress, the larger the layered angle, the lower the shear stress; especially when the normal stress was low (100 kPa), the decreasing range of shear stress increased gradually with the increase in the layered angle. With the increase in the normal stress, the decreasing range of shear stress of the layered CPB gradually decreased.
3.2. Shear Strength
The shear strength of the CPB directly influences its stability. In this study, when the shear stress remains unchanged or decreases, the CPB is considered to have sheared off and reached its peak shear strength. Otherwise, the shear stress corresponding to the maximum shear displacement (9.6 mm) is regarded as the shear strength of the CPB, and the results of the tests are shown in Table 3.
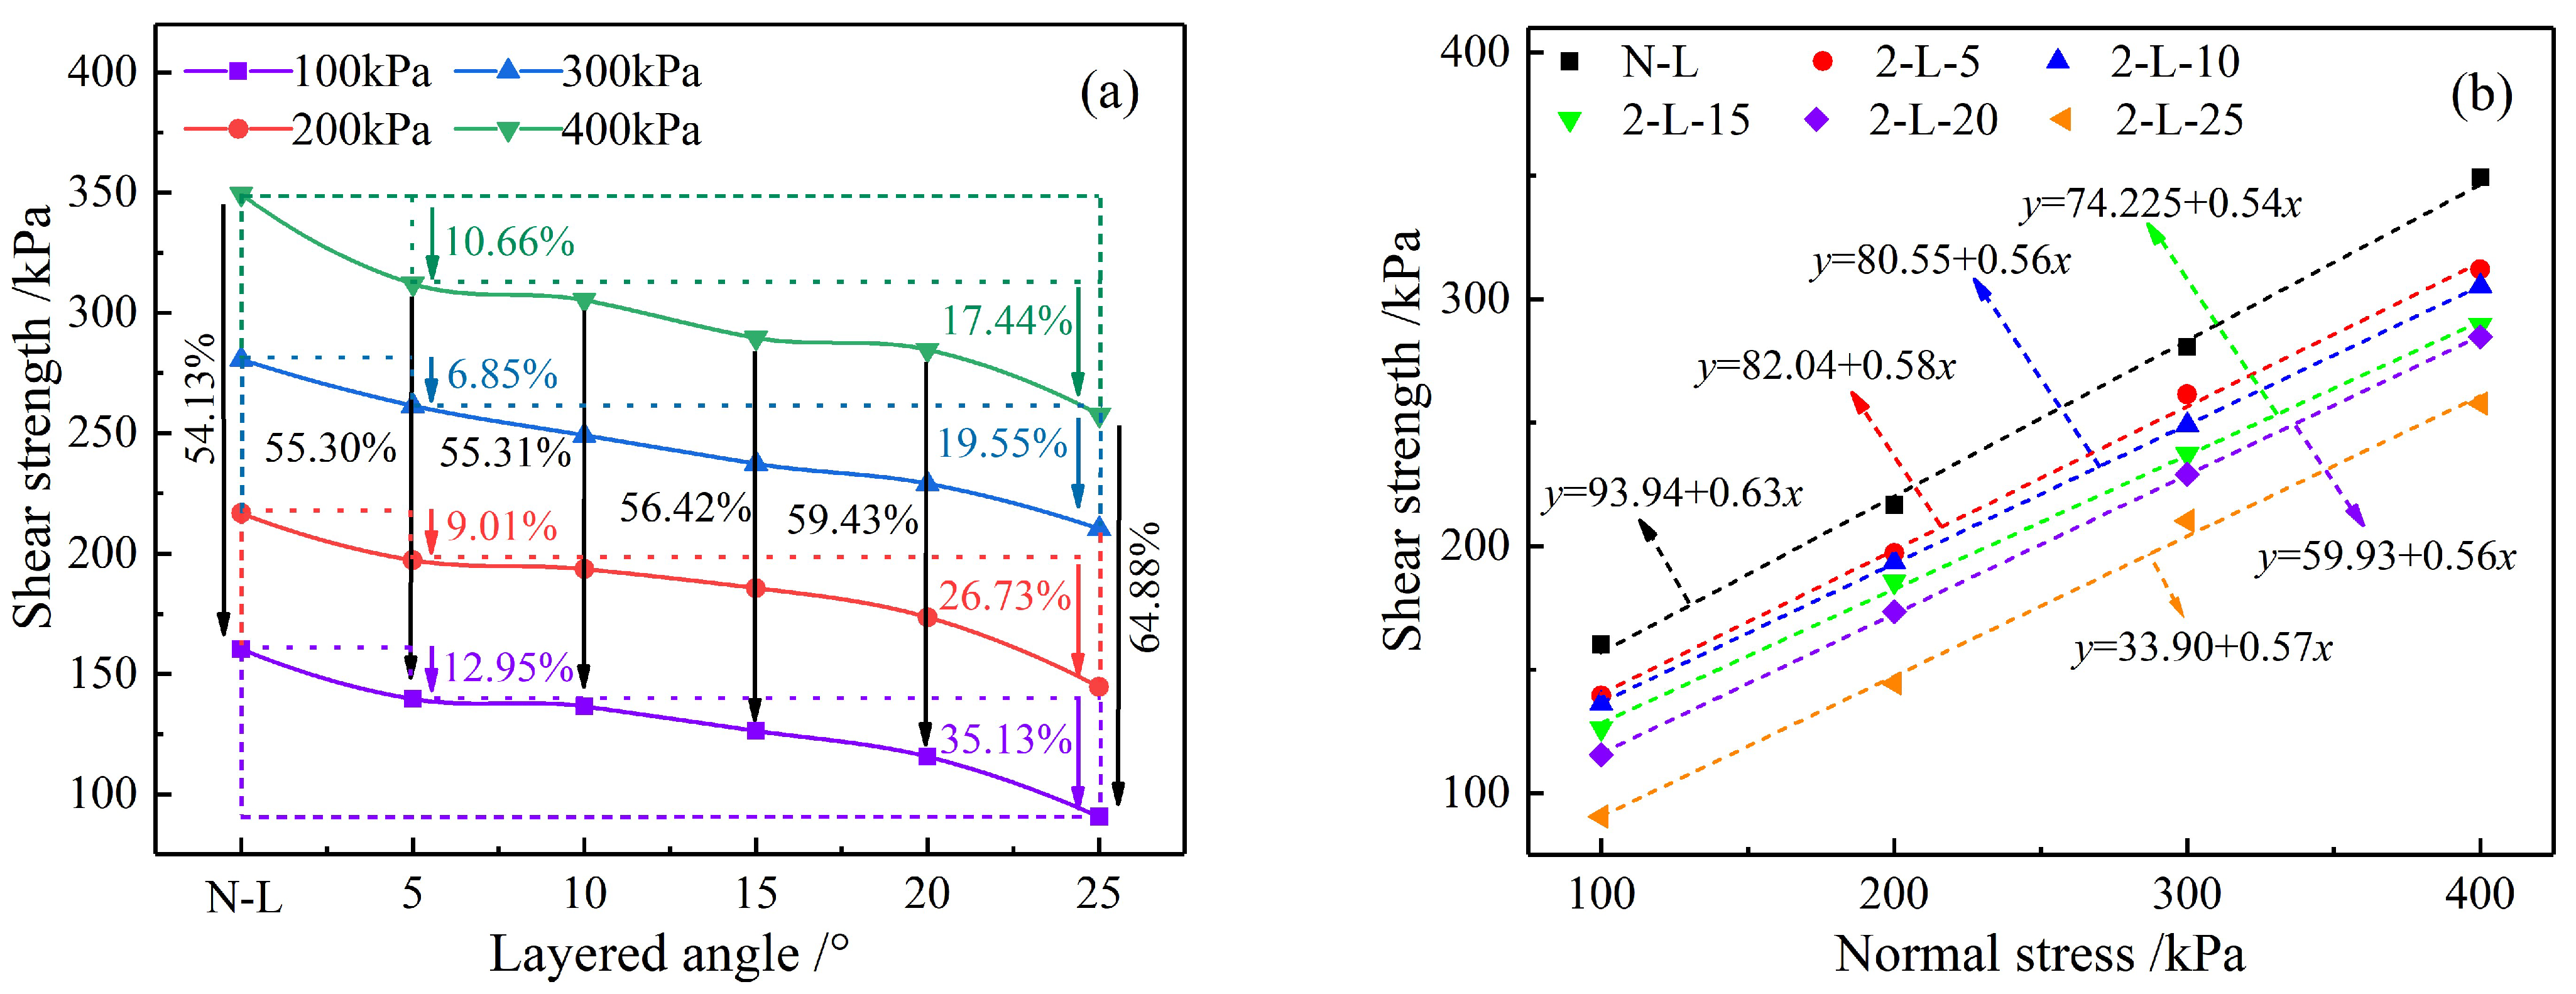
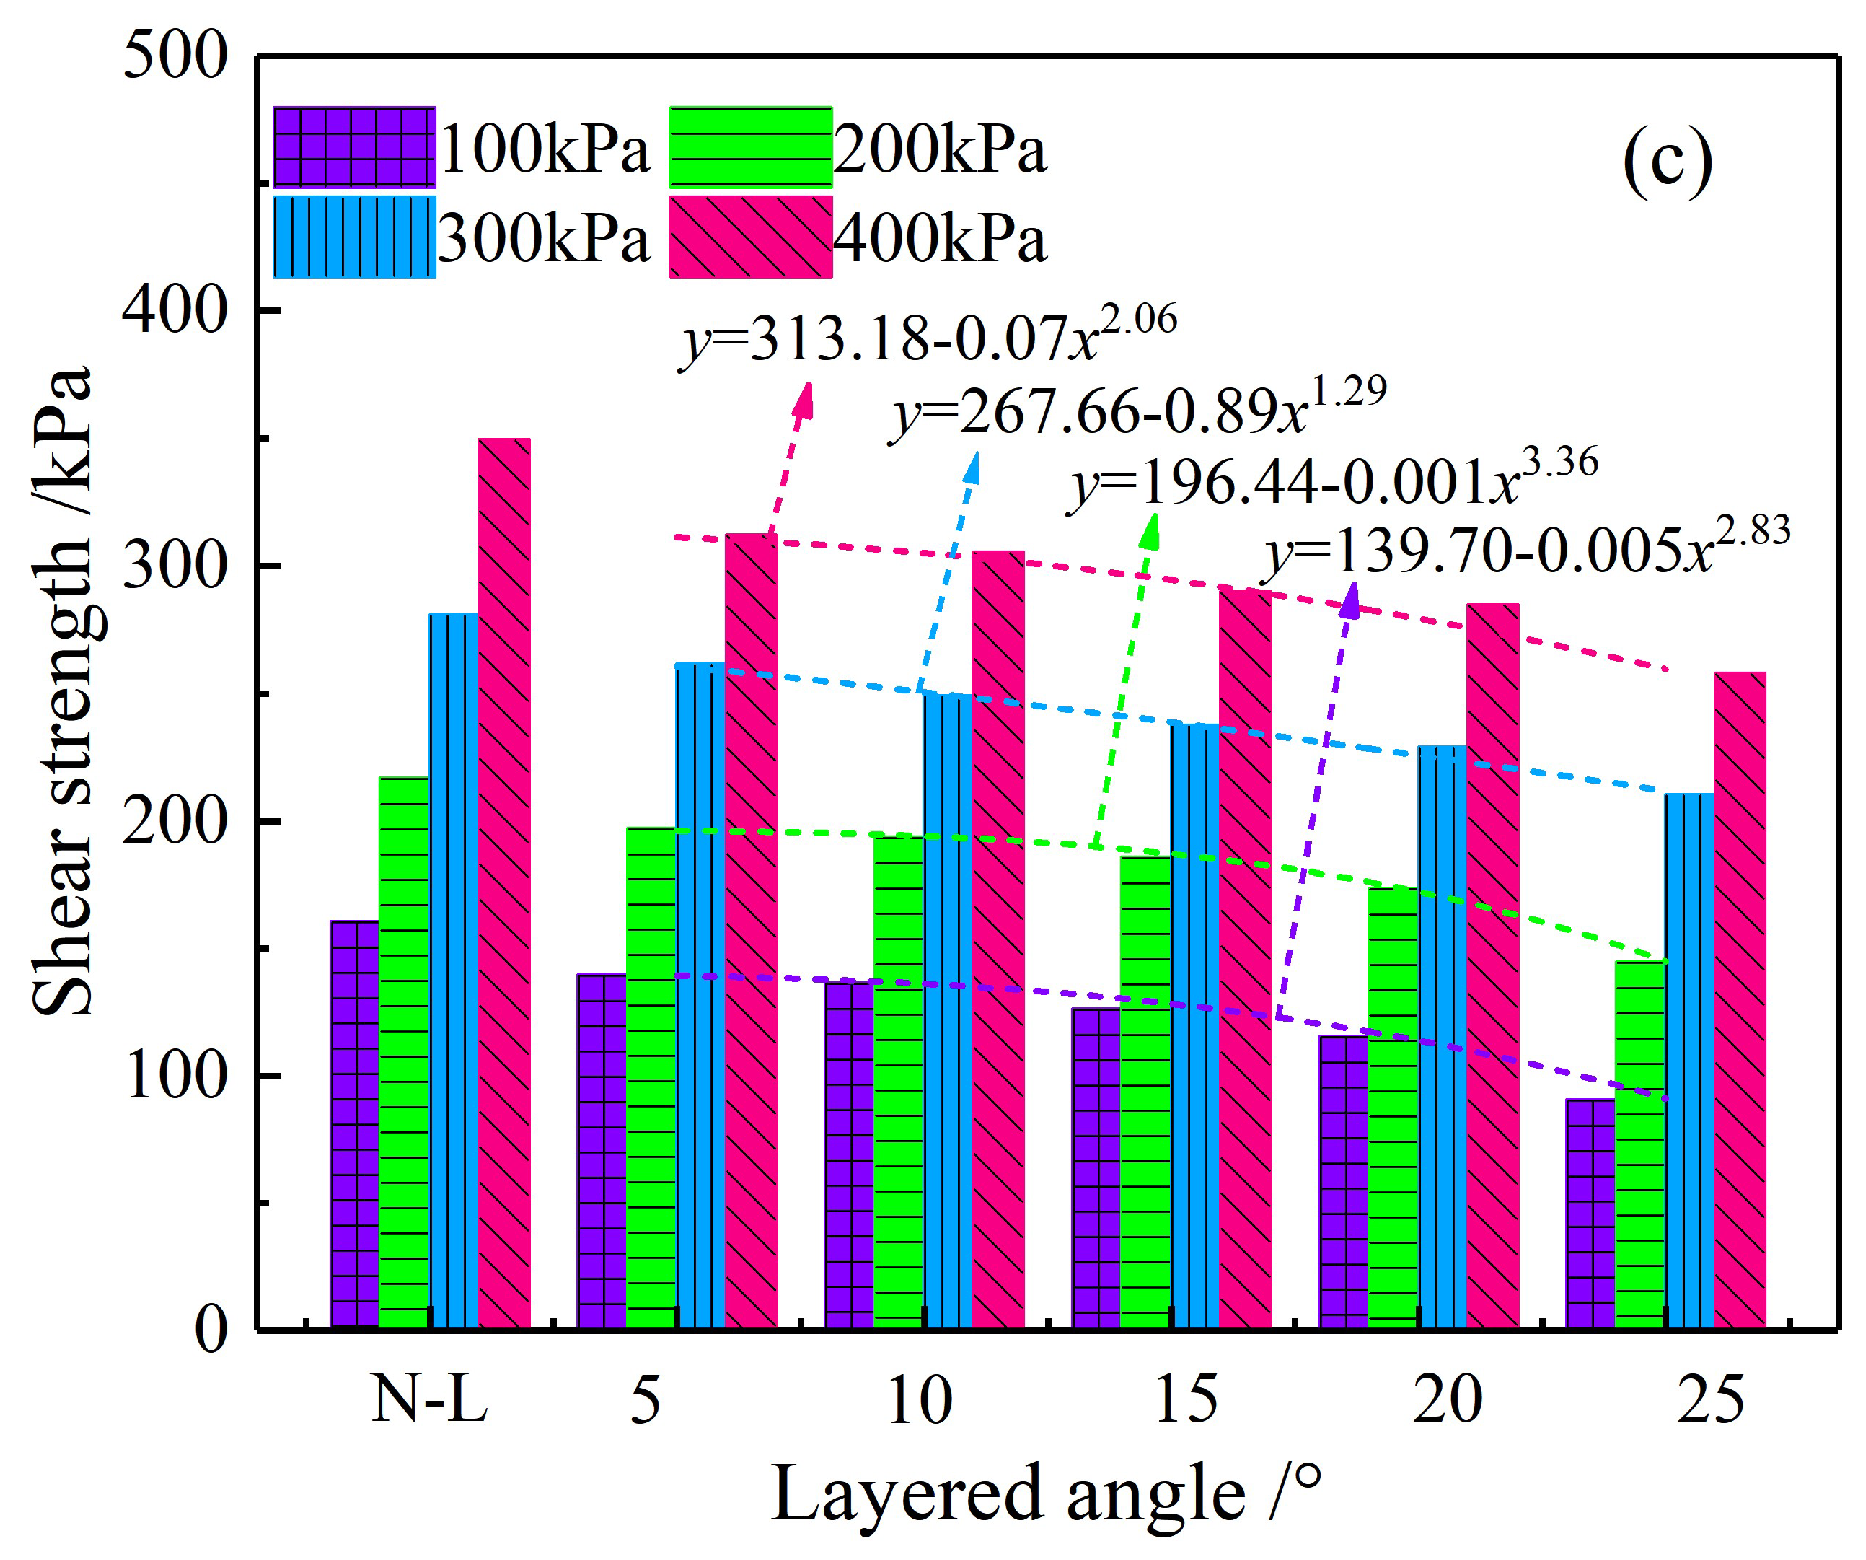
Figure 9 shows the relationship curves between normal stress and layered angle on the shear strength of the CPB. The analysis shows that the shear strength of the CPB was positively correlated with normal stress. When the normal stress decreased from 400 kPa to 100 kPa, the shear strength of the N-L, 2-L-5, 2-L-10, 2-L-15, 2-L-20 and 2-L-25 decreased from 349.4 kPa, 312.17 kPa, 305.28 kPa, 289.67 kPa, 284.72 kPa and 257.72 kPa to 160.28 kPa, 139.53 kPa, 136.42 kPa, 126.25 kPa, 115.25 kPa and 126.25 kPa, respectively; the corresponding decreasing ratios are 54.13%, 55.30%, 55.31%, 56.42%, 59.43% and 64.88%, indicating that the decreasing range of shear strength increases gradually with the increase in the layered angle.
The layering phenomenon weakens the integrity of the CPB and has a large impact on its shear strength. For example, from N-L to 2-L-5, the shear strength of the CPB decreased significantly, and the decreasing ratios were 12.95%, 9.01%, 6.85% and 10.66%, respectively; especially, this ratio reached 12.95% when the normal stress was 100 kPa. The shear strength of the layered CPB was negatively correlated with the layered angle; when the layered angle increased from 5° to 25°, the shear strength corresponding to the normal stresses of 100 kPa, 200 kPa, 300 kPa and 400 kPa decreased from 139.53 kPa, 197.18 kPa, 261.44 kPa and 312.17 kPa to 90.52 kPa, 144.47 kPa, 210.32 kPa and 257.72 kPa, respectively, with the corresponding decreasing ratios of 35.13%, 26.73%, 19.55% and 17.44%, indicating that the decreasing range increases gradually with the decrease in the normal stress.
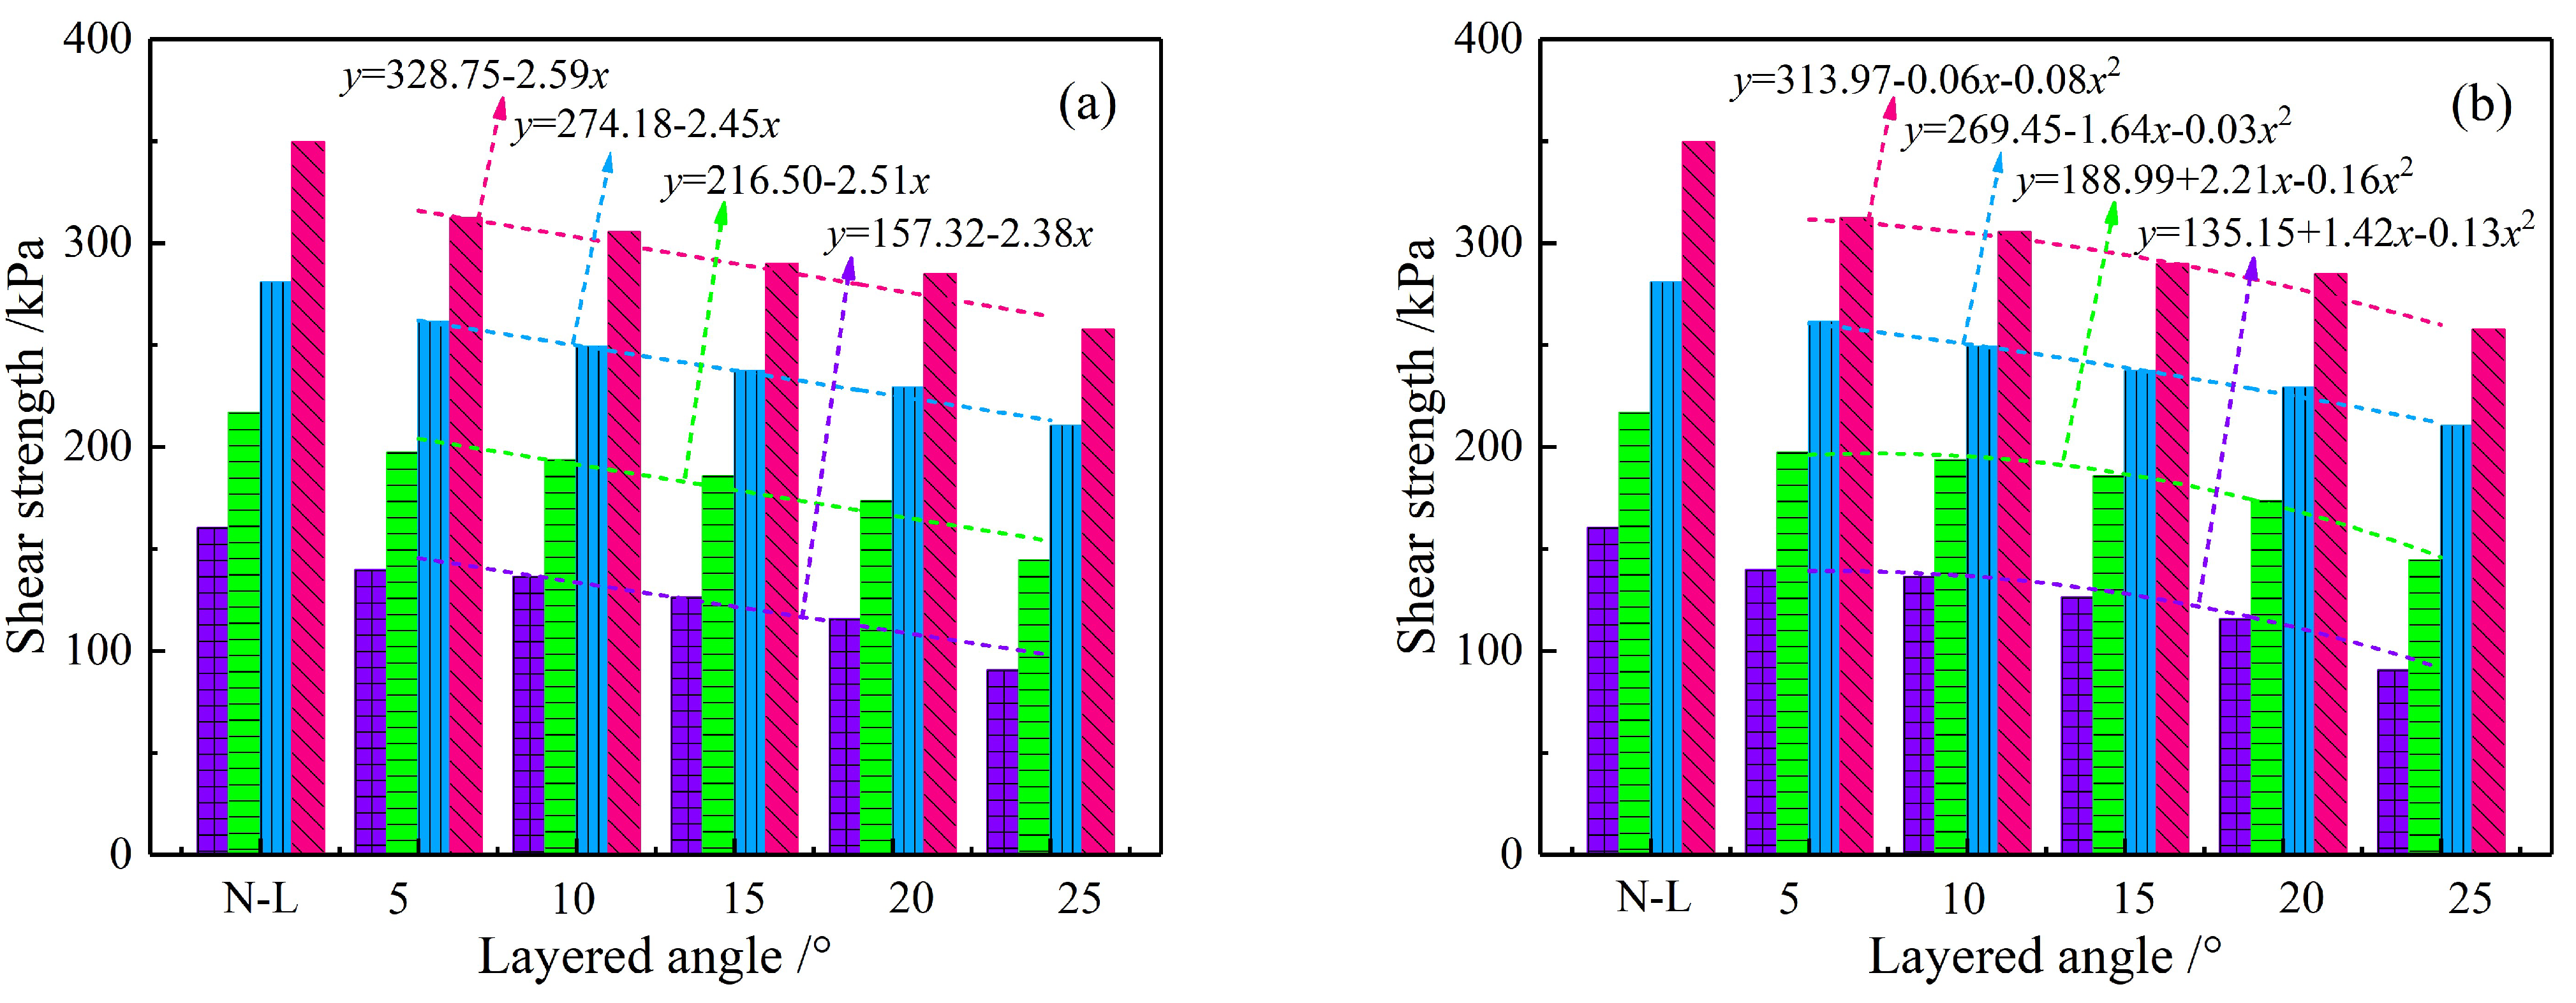
To analyze the internal relationship between the layered angle and the shear strength of the layered CPB, linear function, polynomial function and exponential function were selected to fit this relationship, as shown in Figure 10. The fitting results are shown in Table 4, and it can be known that both the polynomial function and the exponential function can better reflect this relationship, especially the average Raj2 using the exponential function reaching 0.975.
3.3. Cohesion and Internal Friction Angle
The cohesion (C) and internal friction angle (φ) of the CPB are important indicators of its shear mechanical properties. The shear strength of each group of CPB under different normal stresses was linearly fitted using the Mohr–Coulomb strength criterion (); the relationship between the C, φ of the CPB and the layered angle was obtained and is shown in Figure 11.
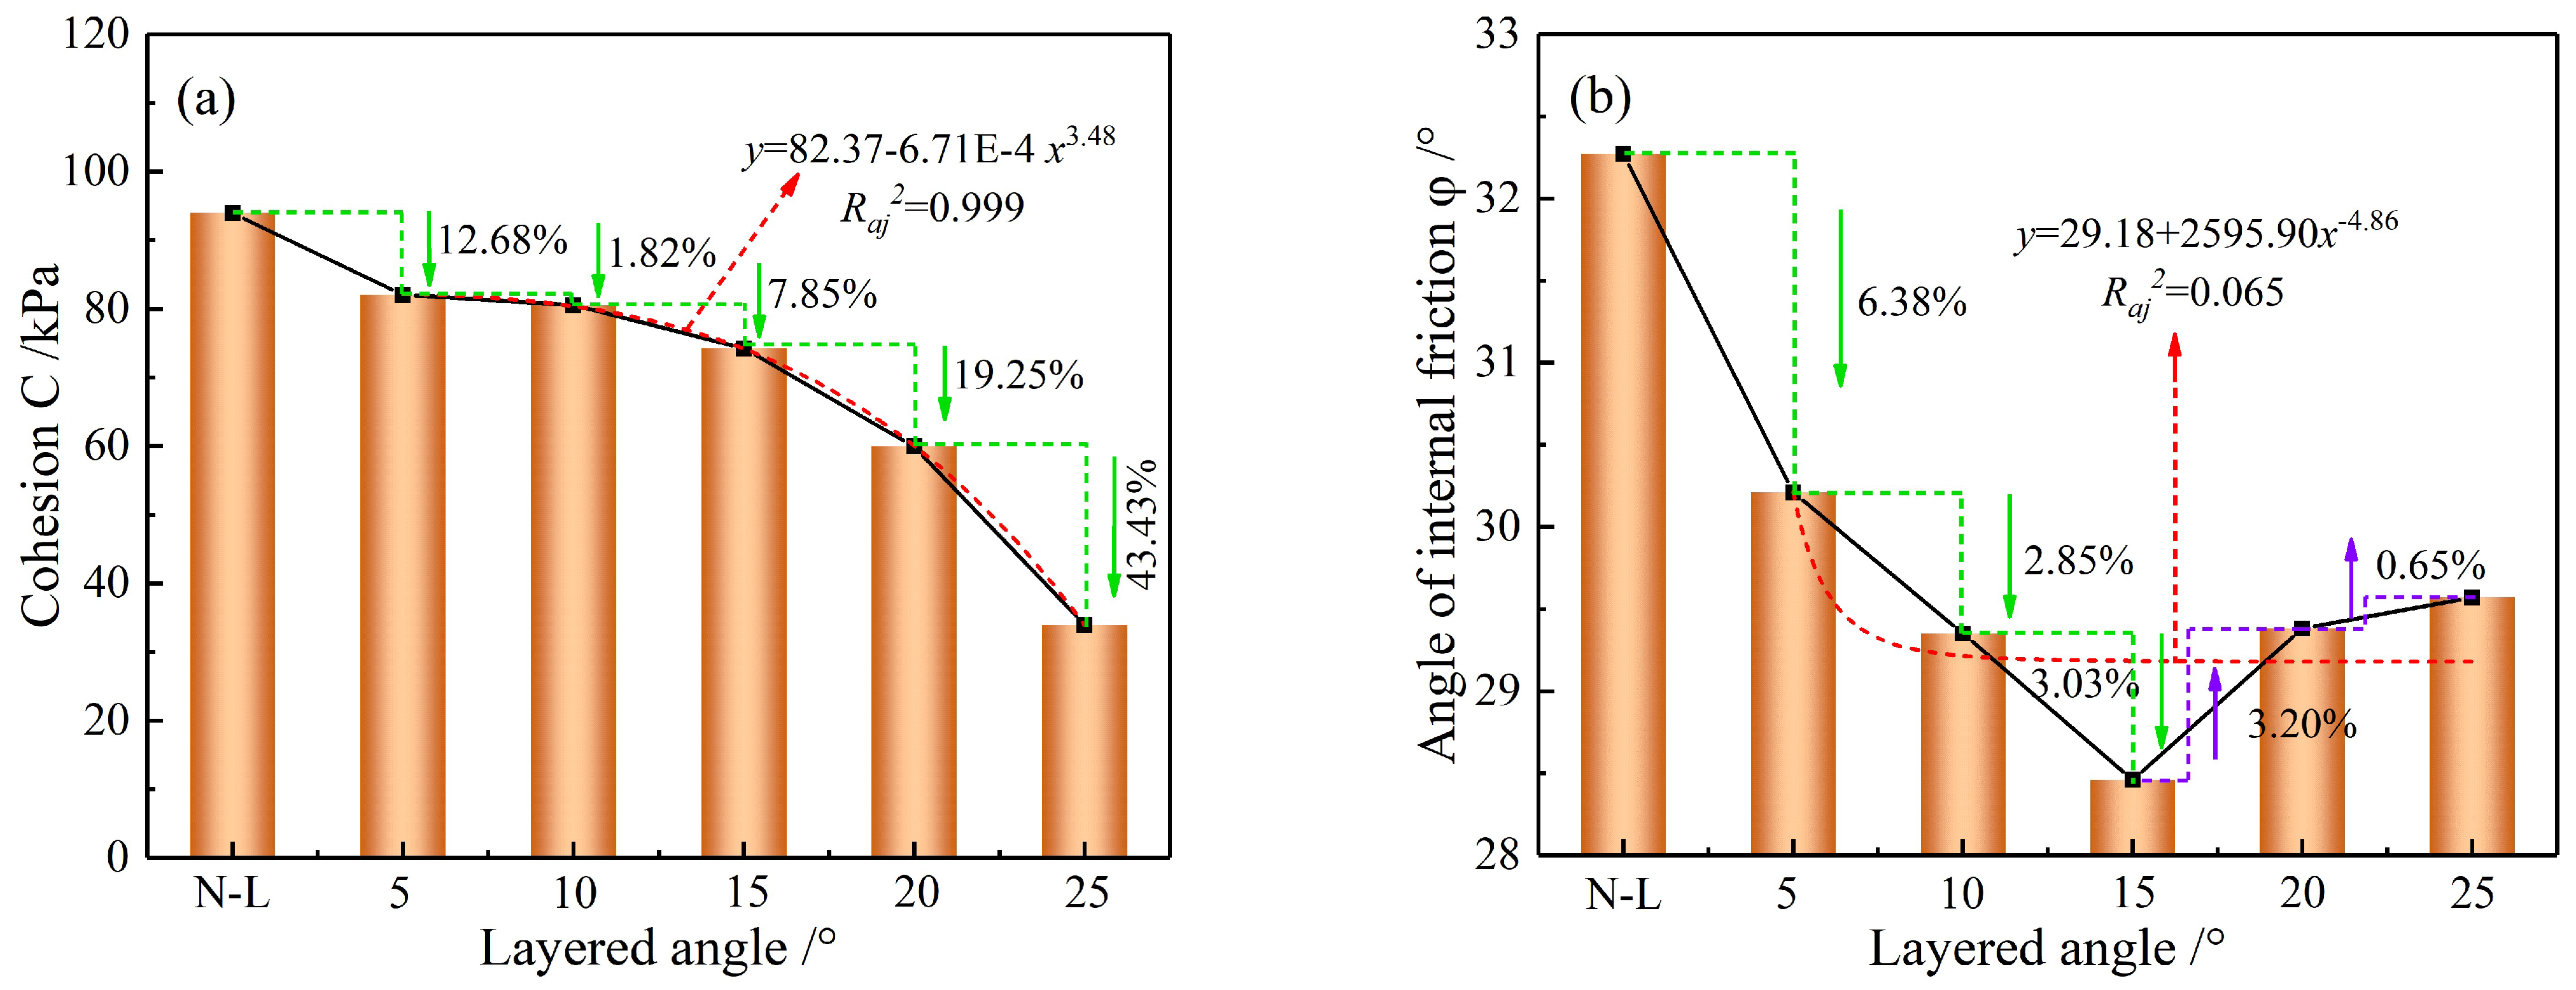
From Figure 11a, it can be seen that the layering phenomenon reduced the C of the CPB, and for the CPB from N-L to 2-L-5 the C decreased from 93.94 kPa to 82.03 kPa, with a decreasing ratio of 12.68%. The C of the layered CPB was negatively correlated with the layered angle, and when the layered angle increased from 5° to 25°, the C decreased continuously with an increasing decrease rate; especially when the layered angle increased from 20° to 25° the C decreased significantly, and the decrease rate reached 43.43%, indicating that the larger the layered angle was, the greater the effect on the C of the layered CPB. The exponential function was used to fit the relationship between the C and the layered angle, and the fitted complex correlation coefficient Raj2 reached 0.999, suggesting that the C of the layered CPB has a good correlation with the layered angle, and the fitted expressions are as follows.
where C is the cohesion of the layered CPB, kPa; α is the layered angle, °.
C = 82.37 − 6.71E − 4α3.48
Figure 11b shows the relationship between the φ and the layered angle of the CPB, and it is analyzed that the layering phenomenon has a great influence on the φ, and the φ of the layered CPB is smaller than the complete CPB. With the continuous increase in the layered angle, the φ showed a trend of first decreasing and then increasing. As the layered angle increased from 5° to 15°, the φ continued to decrease with an increasing ratio; As the layered angle continued to increase from 15° to 25°, the φ began to increase with a decreasing ratio. Their relationship was fitted using the same exponential function, and the fitted complex correlation coefficient Raj2 was only 0.065, which means that the correlation between the φ and the layered angle is low and the regularity is poor.
3.4. Analysis of Shear Strength Mechanism
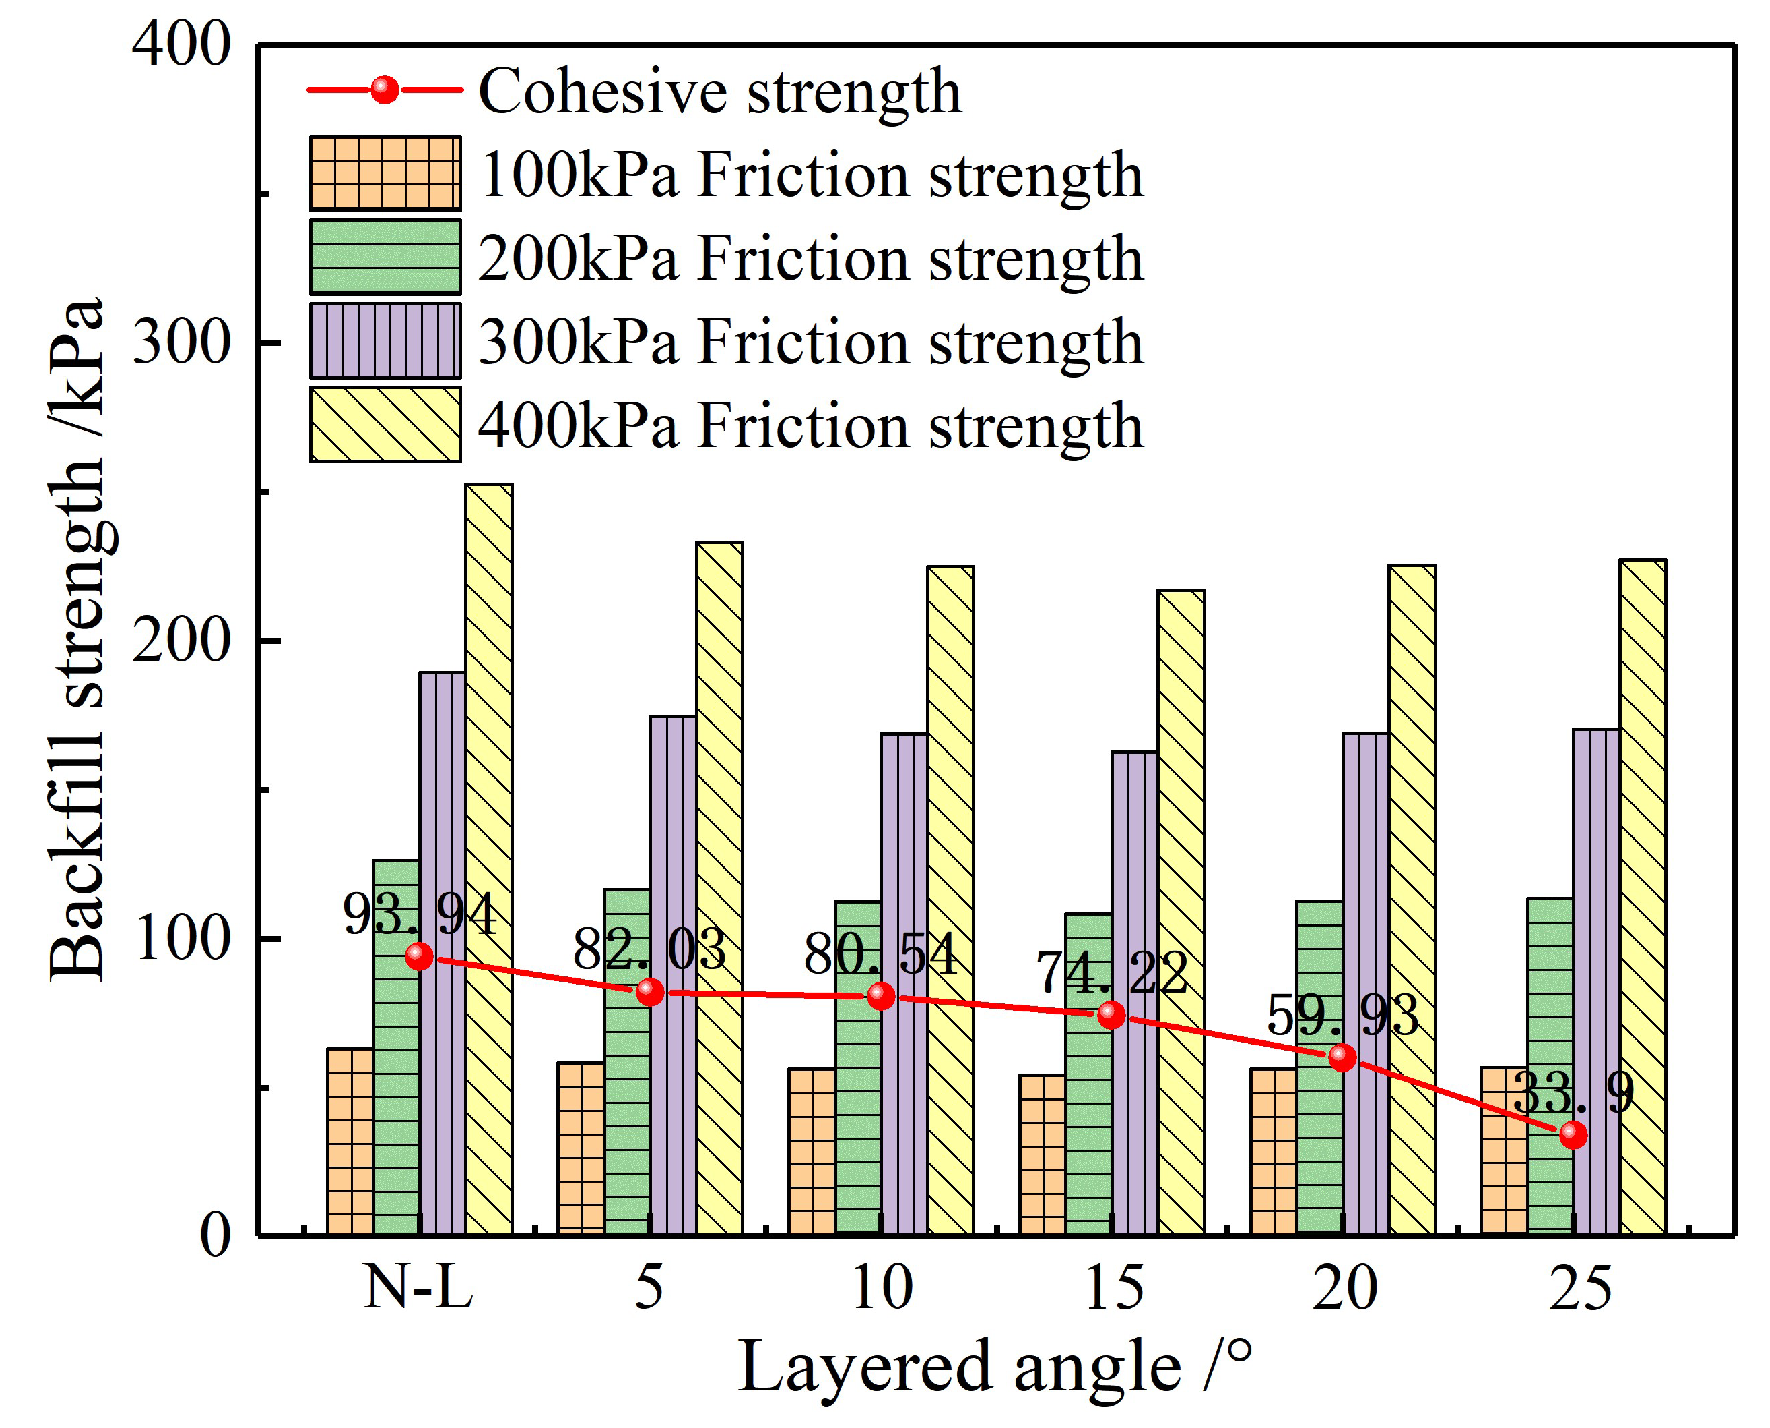
According to the Mohr–Coulomb strength criterion, it is known that the friction force (σtanφ) and the C together determine the shear strength of the CPB. Before the shear stress of the CPB reaches the peak value, the shear strength is determined by the cohesion and friction force; when the cohesion force reaches a critical value, the CPB reaches its peak shear strength; subsequently, as the continues shearing, the cohesion of the CPB breaks down and the shear strength is controlled by the friction force.
The shear strength control relationship of the six groups of CPB in this experiment is shown in Figure 12. It was analyzed that when the normal stress was low (100 kPa), the frictional strength of the N-L, 2-L-5, 2-L-10, 2-L-15 and 2-L-20 CPB was lower than the cohesive strength, and it is considered that the shear strength of these five groups of CPB is controlled by the cohesive force and frictional force together. Under the normal stress of 100 kPa, the cohesive strength of the 2-L-25 CPB was much lower than its frictional strength, which means that the shear strength of the 2-L-25 is mainly controlled by the frictional force. When the normal stress was greater than 200 kPa, the frictional strength of each group of CPB was much greater than its cohesive strength, which means that the cohesion of the CPB reaches the critical value, and the shear strength is mainly controlled by the frictional force.
4. Crack Propagation Law and Damage Mode Analysis
4.1. Numerical Simulation Reliability Verification
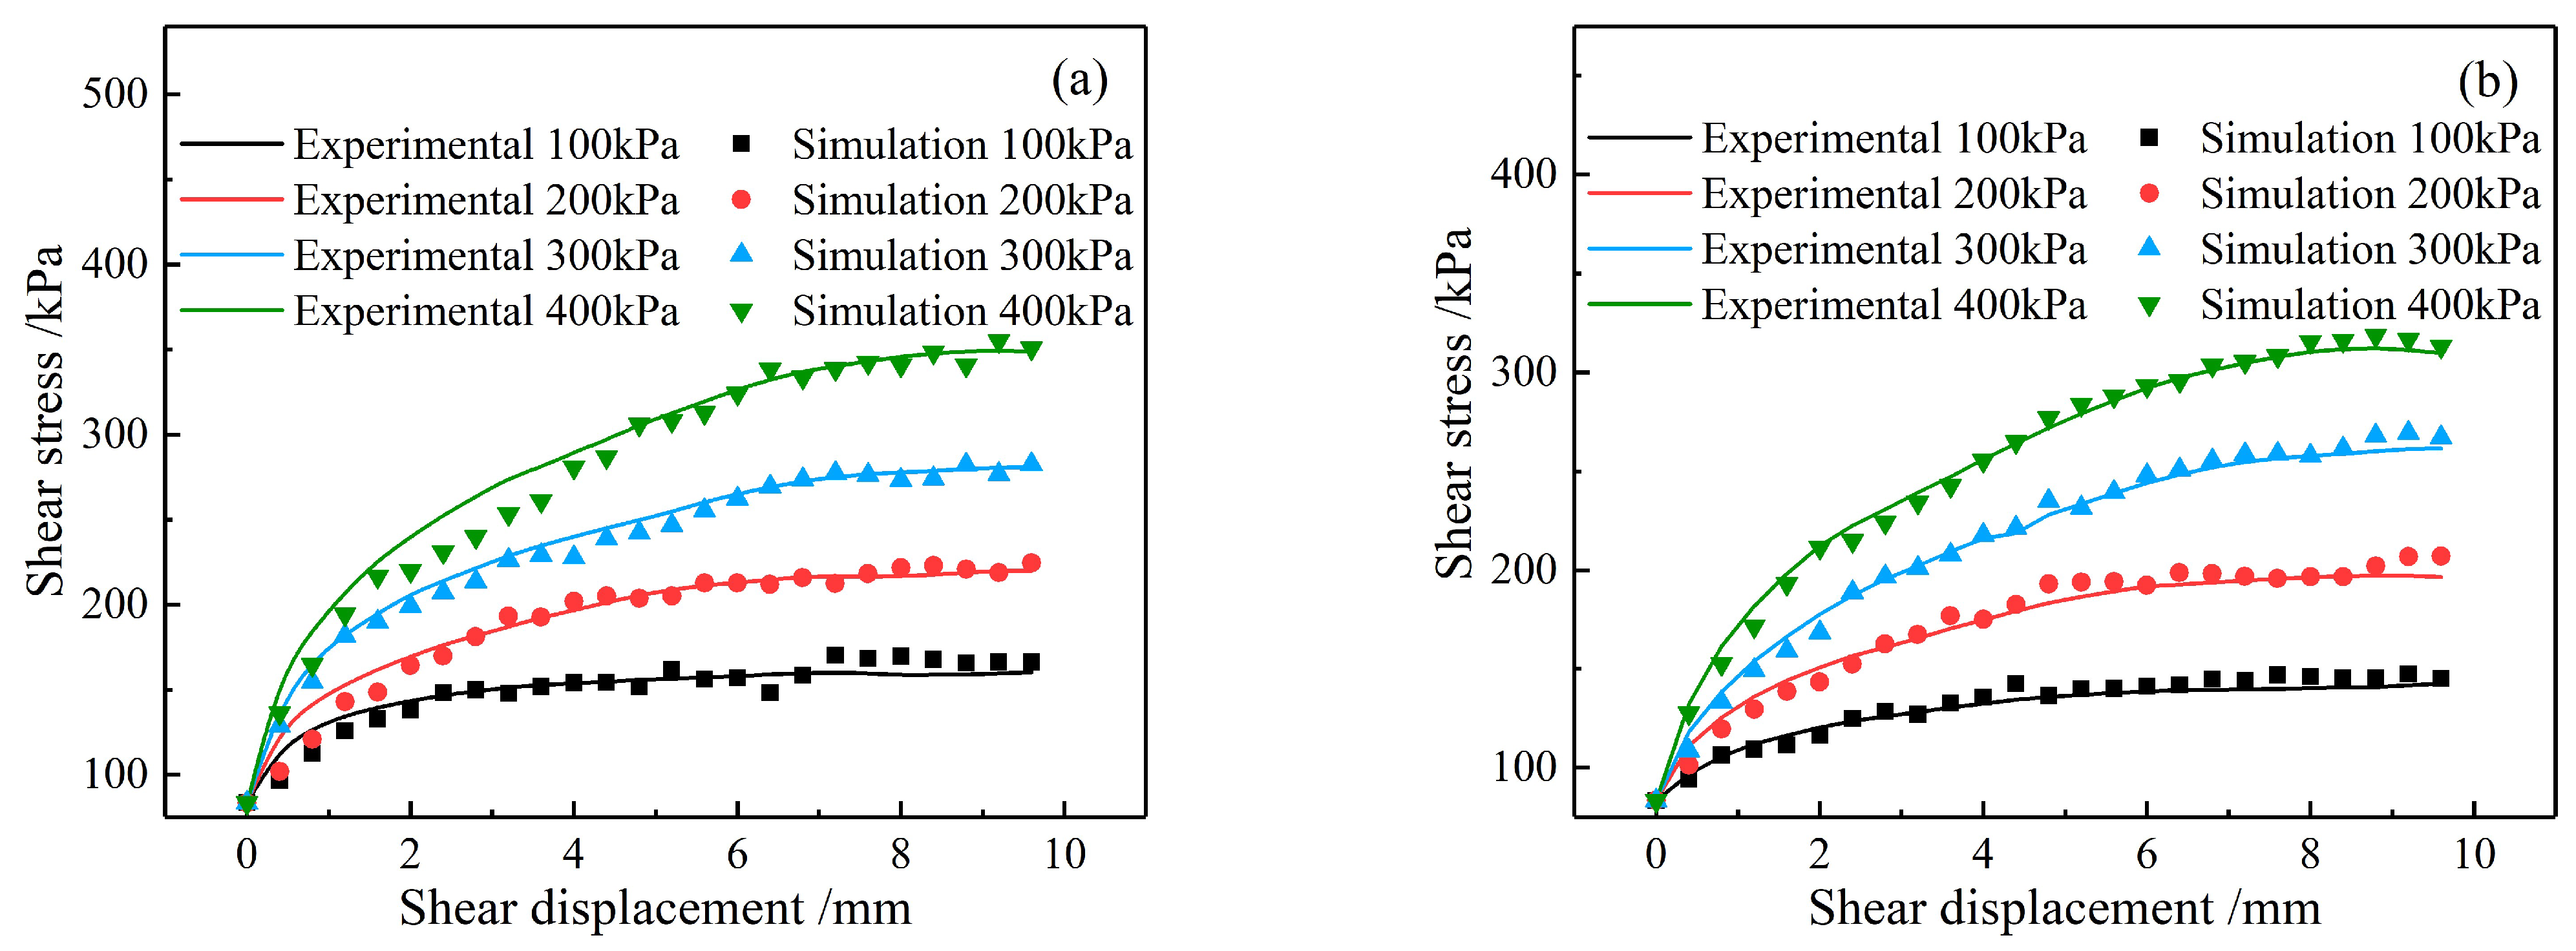
The reasonability of the model’s micro-mechanical parameters directly determines the reliability of the model. In this paper, the macro-mechanical parameters of the CPB were obtained experimentally, and the micro-parameters of the numerical model were calibrated using the trial-and-error method to adjust the parameters and compare with the laboratory experimental τ-δ curve. The model will be considered reliable when the simulated τ-δ curve is in good agreement with the experimental curve. As shown in Figure 13, it can be seen that the simulated curves were in high agreement with the experimental curves, indicating that the model has high accuracy. The specific microscopic parameters of the model are shown in Table 5.
4.2. Analysis of Crack Evolution Law
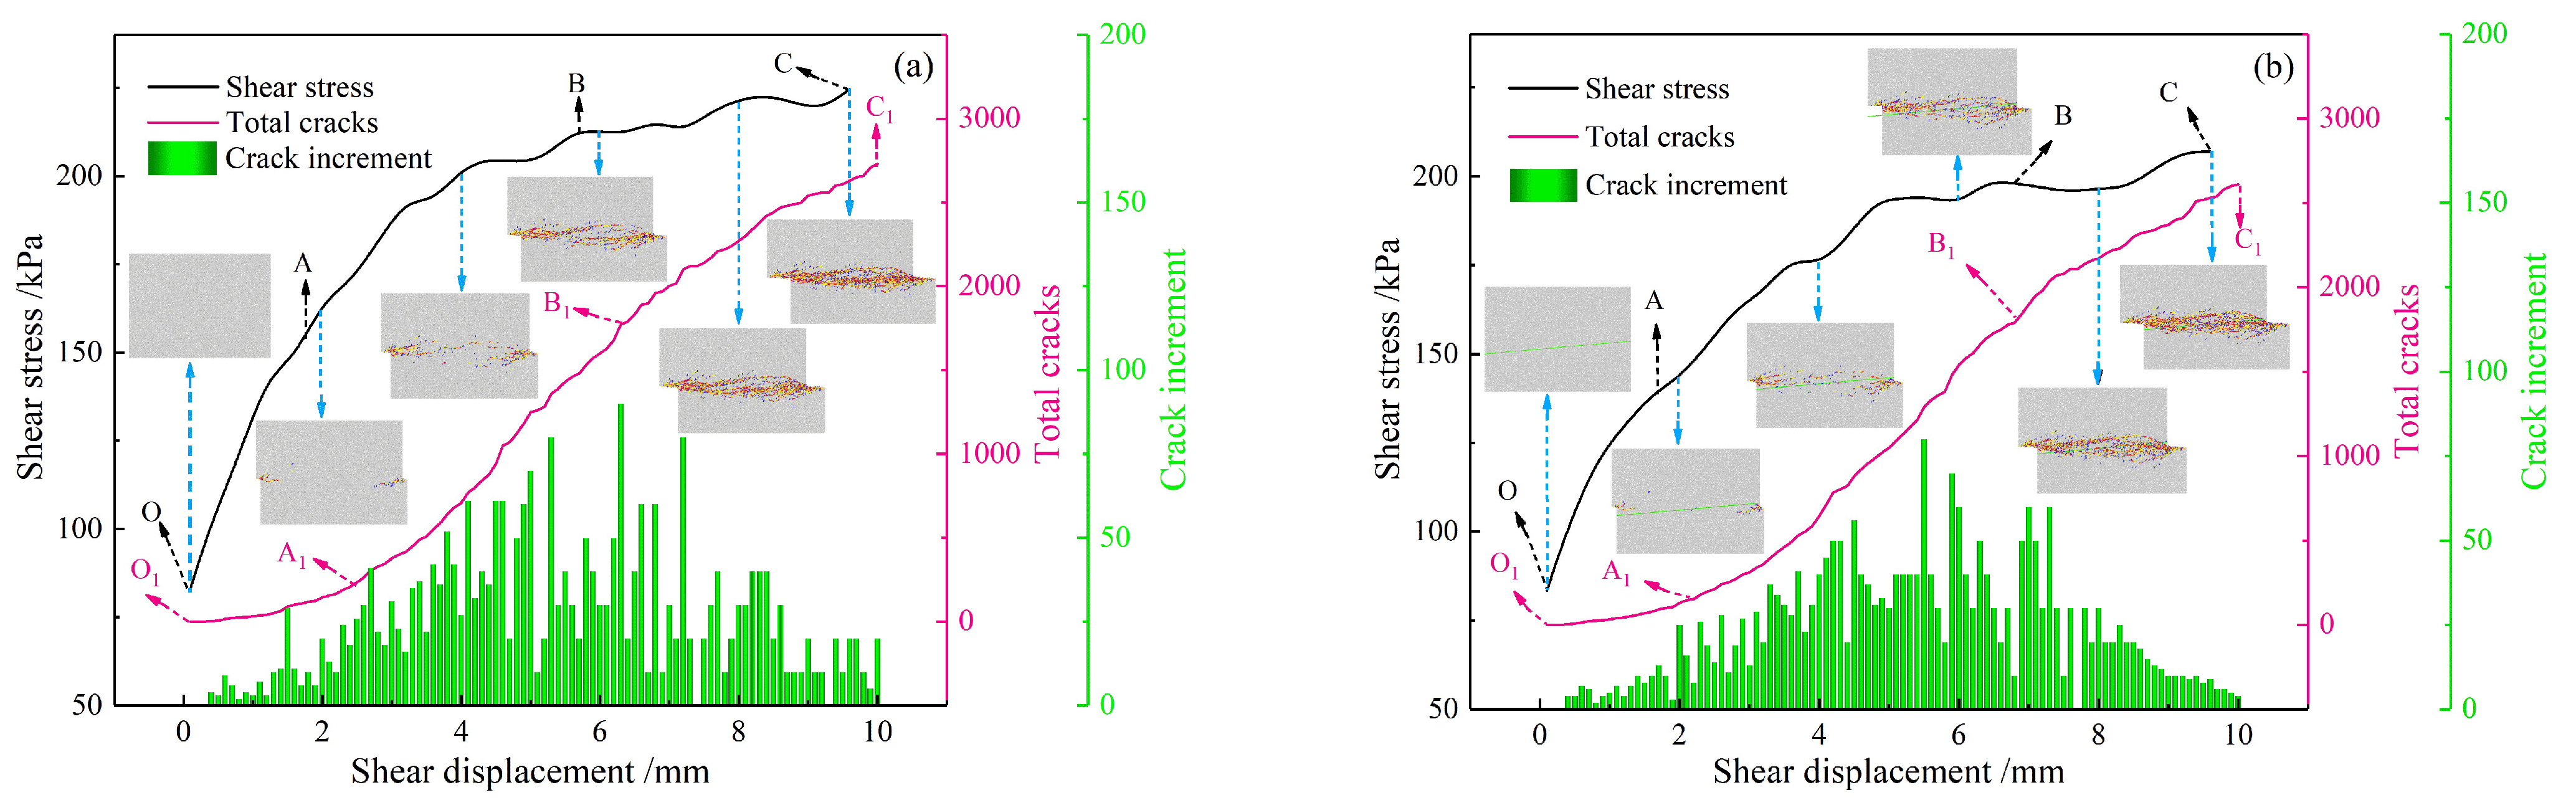
The cause of macroscopic damage of the layered CPB is essentially the gradual generation, expansion and penetration of internal cracks under the action of external loads. Therefore, it is important to visualize the crack evolution inside the CPB. In this paper, the simulation results of N-L and 2-L-5 CPB under normal stress of 200 kPa are analyzed in detail, as shown in Figure 14.
From Figure 14, it can be seen that for the N-L and 2-L-5 CPB, the crack evolution process of the internal cracks was approximately the same, which can be divided into no crack or tiny crack generation stage (O1A1), rapid crack growth stage (A1B1) and slow crack growth stage (B1C1); these three stages respectively correspond to the linear elastic deformation stage (OA), yield stage (AB) and plastic damage stage (BC) of the τ-δ curve in the laboratory test.
- No crack or minimal crack generation stage (O1A1): at the beginning of loading, the CPB was in the linear elastic deformation stage, and the shear stress was lower than the inter-particle bond strength; at this time, although the CPB shear stress increased, there were no cracks generated or the CPB just began to break along the weaker bond at both ends of the shear plane to produce a very small number of micro-cracks with low growth rate.
- Rapid crack growth stage (A1B1): in the middle period of loading, the CPB entered the yielding stage; as the shear stress gradually increased and became greater than the bond strength between the particles, a large number of bonding bonds began to break, resulting in a large number of cracks along the shear surface of the CPB.
- Crack slow growth stage (B1C1): late loading, the CPB into the plastic damage stage, the internal cracks have basically extended and penetrated along the shear surface, and the CPB was substantially destroyed. Due to the action of normal stress, the CPB shear strength was mainly controlled by the inter-particle friction strength, with only a very small number of secondary cracks near the shear surface; therefore, the number of cracks continued to increase in this stage, but the growth rate gradually decreased. Taking the CPB under 2-L-25 and 100 kPa normal stress as an example, the effect of normal stress and layered angle on the crack evolution law is analyzed, as shown in Figure 15.
Figure 15a shows that the effect of normal stress on the total number of cracks was greater when the CPB was damaged. When the CPB was damaged, the total number of cracks was the least under the normal stress of 100 kPa and continued to increase with the normal stress and reached the maximum when the normal stress increased to 400 kPa. Second, when the normal stress was low (100 kPa), the inflection point of the CPB entered the stage of rapid crack growth in the middle stage of loading, and in the late stage of loading, the inflection point in the slow growth stage of cracks appeared earlier; when the normal stress was higher (200 kPa, 300 kPa and 400 kPa), the inflection points had no significant difference.
Figure 15b shows the evolution curve of the total number of cracks for each CPB under the normal stress of 100 kPa, which shows that when the layered CPB was damaged, the total number of cracks was less than complete CPB under the same normal stress; this is because the layering phenomenon significantly destroyed the completeness of the CPB and significantly reduced its shear strength. Under the same normal stress, the crack evolution curve of each layered CPB starts with a crack or very little crack generation stage, followed by a rapid crack growth stage, and finally reaches a slow crack growth stage.
4.3. Analysis of Failure Mode
Table 6 shows the distribution of cracks and blocks when each group of layered CPB was damaged under different normal stresses; it is found that when the normal stress was low (100 kPa), the crack expansion patterns were approximately the same, and it mainly expanded along the shear surface from the two ends to the middle. The complete CPB mainly generated compression shear and tension shear cracks, while the layered CPB gradually produced a certain number of tension cracks along the layered surface, and the number of tension cracks increased with the increase in the layer angle. When the normal stress increased to 200 kPa, the crack expansion area of each group of layered CPB increased and gradually expanded along the middle of the shear surface to the upper and lower sides, forming a spindle-shaped distribution. When the normal stress increased to 300 kPa and 400 kPa, the cracks not only expanded along the upper and lower sides of the shear surface but also caused secondary cracks at both ends of the shear surface, without going through the layered CPB. The secondary cracks produced by the upper-layered CPB mainly extended along the left end of the shear surface to the upper right, and the lower-layered CPB-inducing secondary cracks extended along the right end of the shear surface to the lower left, forming the distribution in an inverted Z-shape.
From the distribution of blocks in Table 6, it can be seen that under the lower normal stress (100 kPa), the crack expansion area of the complete CPB was small and denser, and the blocks were mainly produced on the left side of the lower CPB and the right side of the upper CPB. With the increase of the normal stress, the crack expansion area increased and became looser, and the number of blocks gradually decreased while becoming mainly concentrated near the shear surface. For the layered CPB under low normal stress (100 kPa and 200 kPa), the blocks were mainly generated along the shear surface, and when the normal stress increased to 300 kPa and 400 kPa, the upper and the lower CPB were damaged at the left end and right end of the shear surface produced blocks, respectively. Under the same normal stress, when the layered angle was low, the blocks were mainly generated near the shear surface, and as the layered angle continued to increase, a large number of blocks were also generated at the layering surface.
In general, the normal stress has an important influence on the failure mode of the CPB. When the normal stress is 100 kPa, the failure of the CPB is mainly caused by the shear crack penetration along the shear surface. When the normal stress increases to 200 kPa, the shear crack of the CPB not only penetrates along the shear surface but also expands in the middle of the shear surface on both sides, which leads to the spindle-shaped failure. When the normal stress continues to increase to 300 kPa and 400 kPa, as the crack penetrates along the shear plane, secondary cracks extending to the upper right and lower left are generated at the left and right ends, respectively, resulting in the inverted Z-shaped conjugate shear failure.
5. Conclusions
In this paper, direct shear physical experiments were carried out for layered CPB under different layered angles, and their shear mechanical properties were studied in depth; furthermore, their micro-crack propagation law and damage modes were visualized and simulated through the particle flow numerical analysis software PFC 2D, and the following conclusions can be drawn:
- The τ-δ curves of each group of CPB can be divided into three stages: linear elastic deformation stage, yielding stage and plastic shear failure stage. The normal stress has an important influence on the shear strength of the CPB; the higher the normal stress, the higher the shear strength, and the slower to reach the shear strength. When the normal stress is 100 kPa, the shear strength of CPB is controlled by cohesion and friction, but when the normal stress is greater than 100 kPa, the shear strength is mainly controlled by friction.
- The layering phenomenon weakens the integrity of the CPB; the shear strength and C of layered CPB are negatively correlated with the layer angle. Especially when the layered angle increases from 20° to 25°, the normal bearing structure of layered CPB changes greatly; its shear strength decreases by 35.13% (100 kPa normal stress), and cohesion decreases by 43.43%. With the increase of layer angle, the internal friction angle decreases first and then increases slightly and reaches the lowest when the layered angle is 15°.
- The numerical simulation results of PFC show that the crack evolution law inside the CPB is approximately the same, which can be divided into no crack or tiny crack generation stage, rapid crack growth stage and slow crack growth stage. The total number of cracks during the damage of the CPB is positively correlated with the normal stress, which means the higher the normal stress, the more the total number of cracks. Under the same normal stress, the total number of cracks when the layered CPB is damaged is lower than the complete CPB. With the increase of layer angle, a certain number of tensile cracks were gradually generated along the layered CPB near the layered surface, and the number gradually increased.
- The failure mode of CPB under the normal stress of 100 kPa is caused by shear cracks penetrating along the shear surface. When the normal stress increases to 200 kPa, the CPB shows a spindle-shaped failure. When the normal stress continues to increase to 300 kPa and 400 kPa, the CPB shows inverted Z-shaped conjugate shear failure.
Author Contributions
Investigation, T.G. and W.S.; methodology, T.G.; conceptualization, W.S.; writing—original draft preparation, T.G.; funding acquisition, W.S.; writing—review and editing, Z.L.; supervision, Z.L. and K.F.; visualization, K.F.; validation, M.J.; data curation, H.C. All authors have read and agreed to the published version of the manuscript.
Funding
This research was financially supported by different research funds: the National Natural Science Foundation of China (Grant No. 51964023), the Yunnan Major Scientific and Technological Projects (Grant No. 202202AG050014), the Yunnan Fundamental Research Projects (Grant No. 202101BE070001-038; 202201AT070146), the National Key Research and Development Program (Grant No. 2019YFC1904202), the Yunnan Innovation Team Funding Project (Grant No. 202105AE160023) and the Yunnan Department of Education Science Research Fund Project (Grant No. 2022J0055).
Data Availability Statement
Not Applicable.
Conflicts of Interest
The authors declare no conflict of interest.
References
- Sun, W.; Wang, H.; Hou, K. Control of waste rock-tailings paste backfill for active mining subsidence areas. J. Clean. Prod. 2018, 171, 567–579. [Google Scholar] [CrossRef]
- Kongar-Syuryun, C.H.; Ivannikov, A.; Khayrutdinov, A.; Tyulyaeva, Y. Geotechnology using composite materials from man-made waste is a paradigm of sustainable development. Mater. Today Proc. 2021, 38, 2078–2082. [Google Scholar] [CrossRef]
- Sari, M.; Yilmaz, E.; Kasap, T.; Guner, N. Strength and microstructure evolution in cemented mine backfill with low and high pH pyritic tailings: Effect of mineral admixtures. Constr. Build. Mater. 2022, 328, 127109. [Google Scholar] [CrossRef]
- Li, H.; Wu, A.; Jiang, G.; Wang, X. Effect of operational factors on reproducibility of yield stress measurement based on the vane method for cemented paste backfill. Constr. Build. Mater. 2022, 348, 128709. [Google Scholar] [CrossRef]
- Hefni, M.; Ahmed, H.A.M.; Omar, E.S.; Ali, M.A. The potential re-use of saudi mine tailings in mine backfill: A path towards sustainable mining in Saudi Arabia. Sustainability 2021, 13, 6204. [Google Scholar] [CrossRef]
- Sun, W.; Zhang, S.; Li, J.; Li, Z. Experimental study on energy dissipation of layered backfill under impact load. Constr. Build. Mater. 2022, 347, 128478. [Google Scholar] [CrossRef]
- Fang, K.; Fall, M. Shear Behaviour of Rock–Tailings Backfill Interface: Effect of Cementation, Rock Type, and Rock Surface Roughness. Geotech. Geol. Eng. 2021, 39, 1753–1770. [Google Scholar] [CrossRef]
- Wu, A.; Ruan, Z.; Wang, J. Rheological behavior of paste in metal mines. Int. J. Miner. Metall. Mater. 2022, 29, 717–726. [Google Scholar] [CrossRef]
- Jiao, H.; Chen, W.; Wu, A.; Yang, Y.; Ruan, Z.; Honaker, R.; Chen, X.; Yu, J. Flocculated unclassified tailings settling efficiency improvement by particle collision optimization in the feedwell. Int. J. Miner. Metall. Mater. 2022, 29, 2126–2135. [Google Scholar] [CrossRef]
- Ruan, Z.; Wu, A.; Bürger, R.; Betancourt, F.; Wang, Y.; Wang, Y.; Jiao, H.; Wang, S. Effect of interparticle interactions on the yield stress of thickened flocculated copper mineral tailings slurry. Powder. Technol. 2021, 392, 278–285. [Google Scholar] [CrossRef]
- Huang, Z.; Cao, S.; Yilmaz, E. Investigation on the flexural strength, failure pattern and microstructural characteristics of combined fibers reinforced cemented tailings backfill. Constr. Build. Mater. 2021, 300, 124005. [Google Scholar] [CrossRef]
- Xue, G.; Yilmaz, E.; Feng, G.; Cao, S. Bending behavior and failure mode of cemented tailings backfill composites incorporating different fibers for sustainable construction. Constr. Build. Mater. 2021, 289, 123163. [Google Scholar] [CrossRef]
- Qin, S.; Cao, S.; Yilmaz, E. Employing U-shaped 3D printed polymer to improve flexural properties of cementitious tailings backfills. Constr. Build. Mater. 2022, 320, 126296. [Google Scholar] [CrossRef]
- Xu, W.; Cao, P. Fracture behaviour of cemented tailing backfill with pre-existing crack and thermal treatment under three-point bending loading: Experimental studies and particle flow code simulation. Eng. Fract. Mech. 2018, 195, 129–141. [Google Scholar] [CrossRef]
- Qiu, H.; Zhang, F.; Liu, L.; Huan, C.; Hou, D.; Kang, W. Experimental study on acoustic emission characteristics of cemented rock-tailings backfill. Constr. Build. Mater. 2022, 315, 125278. [Google Scholar] [CrossRef]
- Sun, W.; Hou, K.; Yang, Z.; Wen, Y. X-ray CT three-dimensional reconstruction and discrete element analysis of the cement paste backfill pore structure under uniaxial compression. Constr. Build. Mater. 2017, 138, 69–78. [Google Scholar] [CrossRef]
- Song, X.; Hao, Y.; Wang, S.; Zhang, L.; Liu, W.; Li, J. Mechanical properties, crack evolution and damage characteristics of prefabricated fractured cemented paste backfill under uniaxial compression. Constr. Build. Mater. 2022, 330, 127251. [Google Scholar] [CrossRef]
- Yu, X.; John, K.; Tan, Y.; Song, W.; Huang, K. Mechanical properties and fracturing of rock-backfill composite specimens under triaxial compression. Constr. Build. Mater. 2021, 304, 124577. [Google Scholar] [CrossRef]
- Xue, G.; Yilmaz, E. Strength, acoustic, and fractal behavior of fiber reinforced cemented tailings backfill subjected to triaxial compression loads. Constr. Build. Mater. 2022, 338, 127667. [Google Scholar] [CrossRef]
- Chen, T.; Zhao, K.; Yan, Y.; Zhou, Y.; He, Z.; Guo, L. Mechanical properties and acoustic emission response of cemented tailings backfill under variable angle shear. Constr. Build. Mater. 2022, 343, 128114. [Google Scholar] [CrossRef]
- Libos, L.; Cui, L.; Liu, X. Effect of curing temperature on time-dependent shear behavior and properties of polypropylene fiber-reinforced cemented paste backfill. Constr. Build. Mater. 2021, 311, 125302. [Google Scholar] [CrossRef]
- Xiu, Z.; Wang, S.; Ji, Y.; Wang, F.; Ren, F.; Nguyen, V. The effects of dry and wet rock surfaces on shear behavior of the interface between rock and cemented paste backfill. Powder. Technol. 2021, 381, 324–337. [Google Scholar] [CrossRef]
- Xue, G.; Yilmaz, E.; Song, W.; Cao, S. Mechanical, flexural and microstructural properties of cement-tailings matrix composites: Effects of fiber type and dosage. Compos. Part B 2019, 172, 131–142. [Google Scholar] [CrossRef]
- Sun, W.; Wu, A.; Hou, K.; Yang, Y.; Liu, L.; Wen, Y. Real-time observation of meso-fracture process in backfill body during mine subsidence using X-ray CT under uniaxial compressive conditions. Constr. Build. Mater. 2016, 113, 153–162. [Google Scholar] [CrossRef]
- Xiu, Z.; Wang, S.; Ji, Y.; Wang, F.; Ren, F. Experimental study on the triaxial mechanical behaviors of the Cemented Paste Backfill: Effect of curing time, drainage conditions and curing temperature. Constr. Build. Mater. 2022, 301, 113828. [Google Scholar] [CrossRef] [PubMed]
- Wu, W.; Xu, W.; Zuo, J. Effect of inclined interface angle on shear strength and deformation response of cemented paste backfill-rock under triaxial compression. Constr. Build. Mater. 2021, 279, 122478. [Google Scholar] [CrossRef]
- Fang, K.; Fall, M. Effects of curing temperature on shear behaviour of cemented paste backfill-rock interface. Int. J. Rock. Mech. Min. 2018, 112, 184–192. [Google Scholar] [CrossRef]
- Gao, T.; Sun, W.; Liu, Z.; Cheng, H. Investigation on fracture characteristics and failure pattern of inclined layered cemented tailings backfill. Constr. Build. Mater. 2022, 343, 128110. [Google Scholar] [CrossRef]
- Chen, S.; Jin, A.; Zhao, Y.; Li, H.; Wang, J. Mechanical properties and deformation mechanism of stratified cemented tailings backfill under unconfined compression. Constr. Build. Mater. 2022, 335, 127205. [Google Scholar] [CrossRef]
- Cao, S.; Song, W.; Yilmaz, E. Influence of structural factors on uniaxial compressive strength of cemented tailings backfill. Constr. Build. Mater. 2018, 174, 190–201. [Google Scholar] [CrossRef]
- Wang, J.; Fu, J.; Song, W.; Zhang, Y.; Wang, Y. Mechanical behavior, acoustic emission properties and damage evolution of cemented paste backfill considering structural feature. Constr. Build. Mater. 2020, 261, 119958. [Google Scholar] [CrossRef]
- Wang, J.; Fu, J.; Song, W.; Zhang, Y.; Wu, S. Acoustic emission characteristics and damage evolution process of layered cemented tailings backfill under uniaxial compression. Constr. Build. Mater. 2021, 295, 123663. [Google Scholar] [CrossRef]
- Zhang, C.; Fu, J.; Song, W.; Kang, M.; Li, T.; Wang, N. Analysis on mechanical behavior and failure characteristics of layered cemented paste backfill(LCPB) under triaxial compression. Constr. Build. Mater. 2022, 324, 126631. [Google Scholar] [CrossRef]
- Wang, J.; Song, W.; Cao, S.; Tan, Y. Mechanical properties and failure modes of stratified backfill under triaxial cyclic loading and unloading. Int. J. Min. Sci. Technol. 2019, 29, 809–814. [Google Scholar] [CrossRef]
- Wang, J.; Song, W.; Cao, S.; Tan, Y. Mechanical properties and microstructure of layered cemented paste backfill under triaxial cyclic loading and unloading. Constr. Build. Mater. 2020, 257, 119540. [Google Scholar] [CrossRef]
- Li, J.; Sun, W.; Li, Q.; Chen, S.; Yuan, M.; Xia, H. Influence of Layered Angle on Dynamic Characteristics of Backfill under Impact Loading. Minerals 2022, 12, 511. [Google Scholar] [CrossRef]
- Zhang, Y.; Wang, X.; Wei, C.; Zhang, Q. Dynamic mechanical properties and instability behavior of layered backfill under intermediate strain rates. Trans. Nonferrous Met. Soc. China 2017, 27, 1608–1617. [Google Scholar] [CrossRef]
- Mashifana, T.; Sithole, T. Clean production of sustainable backfill material from waste gold tailings and slag. J. Clean. Prod. 2021, 308, 127357. [Google Scholar] [CrossRef]
- Cao, S.; Yilmaz, E.; Song, W. Damage constitutive model and strength criterion on strength, toughness and microstructure of early age cemented tailings backfill. Constr. Build. Mater. 2019, 223, 44–54. [Google Scholar] [CrossRef]
Figure 1.
Particle size distribution of tested tailings.

Figure 2.
Specimen preparation flow chart.

Figure 3.
Direct shear apparatus in this study.

Figure 4.
Simulated particle size distribution curve.

Figure 5.
Numerical model of 2-L-15.

Figure 6.
τ-δ curve of partial CPB: (a) N-L; (b) 2-L-10; (c) 2-L-15; (d) 2-L-20.

Figure 7.
Stress concentration of the CPB.

Figure 8.
Effect of layered angle on the τ-δ curve: (a) 100 kPa; (b) 200 kPa; (c) 300 kPa; (d) 400 kPa.
Figure 8.
Effect of layered angle on the τ-δ curve: (a) 100 kPa; (b) 200 kPa; (c) 300 kPa; (d) 400 kPa.


Figure 9.
Analysis of shear strength. (a) Influence of layered angle on shear strength (b) Linear fitting of shear strength and normal stress.
Figure 9.
Analysis of shear strength. (a) Influence of layered angle on shear strength (b) Linear fitting of shear strength and normal stress.

Figure 10.
Relationship between layered angle and shear strength of layered CPB: (a) linear fitting; (b) polynomial fitting; (c) exponential fitting.
Figure 10.
Relationship between layered angle and shear strength of layered CPB: (a) linear fitting; (b) polynomial fitting; (c) exponential fitting.


Figure 11.
Analysis of cohesion and internal friction angle: (a) cohesion; (b) internal friction angle.
Figure 11.
Analysis of cohesion and internal friction angle: (a) cohesion; (b) internal friction angle.

Figure 12.
Analysis of shear strength mechanism.

Figure 13.
τ-δ curves: (a) N-L; (b) 2-L-5.

Figure 14.
τ-δ, crack accumulation and crack increment curves: (a) N-L; (b) 2-L-5.

Figure 15.
Total number of micro-cracks: (a) 2-L-25; (b) 100 kPa normal stress.


Table 1.
Chemical composition of tailings.
| Compound | SiO2 | Al2O3 | TFe | CaO | MgO | S | Zn | Cu | Others |
|---|---|---|---|---|---|---|---|---|---|
| Tailings/wt% | 45.9 | 12.3 | 11.1 | 6.0 | 2.1 | 0.5 | 0.07 | 0.04 | 22.1 |
Table 2.
Summary of the test plan.
| Serial Number | Cement/Tailing | Mass Concentration/% | Number of Layers | Angle of Layers/° |
|---|---|---|---|---|
| N-L | 1:20 | 68 | 1 | - |
| 2-L-5 | 1:20 | 68 | 2 | 5 |
| 2-L-10 | 1:20 | 68 | 2 | 10 |
| 2-L-15 | 1:20 | 68 | 2 | 15 |
| 2-L-20 | 1:20 | 68 | 2 | 20 |
| 2-L-25 | 1:20 | 68 | 2 | 25 |
Note: N-L in the table represents the complete cemented paste backfill, 2-L-5 represents two-layered cemented paste backfill and the layering angle is 5°.
Table 3.
The results of shear strength test.
| Specimen ID | Shear Strength /kPa | C/kPa | φ/° | |||
|---|---|---|---|---|---|---|
| 100 | 200 | 300 | 400 | |||
| N-L | 160.28 | 216.71 | 280.67 | 349.4 | 93.94 | 32.27 |
| 2-L-5 | 139.53 | 197.18 | 261.44 | 312.17 | 82.03 | 30.21 |
| 2-L-10 | 136.42 | 193.54 | 249.16 | 305.28 | 80.54 | 29.35 |
| 2-L-15 | 126.25 | 185.62 | 237.38 | 289.67 | 74.22 | 28.46 |
| 2-L-20 | 115.52 | 173.53 | 229.05 | 284.72 | 59.93 | 29.38 |
| 2-L-25 | 90.52 | 144.47 | 210.32 | 257.72 | 33.90 | 29.57 |
Note: The values of C and φ are the cohesion and internal friction angle of the CPB, respectively.
Table 4.
Fitting results.
| Function Type | Normal Stress/kPa | Raj2 Average | |||
|---|---|---|---|---|---|
| 100 | 200 | 300 | 400 | ||
| Linear | y = 157.32 − 2.38x | y = 216.50 − 2.51x | y = 274.18 − 2.45x | y = 328.75 − 2.59x | 0.898 |
| Polynomial | y = 135.15 + 1.42x − 0.13x2 | y = 188.99 + 2.21x − 0.16x2 | y = 269.45 − 1.64x − 0.03x2 | y = 313.97 − 0.06x − 0.08x2 | 0.970 |
| Exponential | y = 139.70 − 0.005x2.83 | y = 196.44 − 0.001x3.36 | y = 267.66 − 0.89x1.29 | y = 313.18 − 0.07x2.06 | 0.975 |
Table 5.
Micro-mechanical parameters of numerical model.
| Type | Parameter | Value |
|---|---|---|
| Particles | density/(kg·m−3) | 2.7e3 |
| porosity | 0.12 | |
| fric | 0.5 | |
| radius of particles/m | 9.885e−5~7.853e−4 | |
| damp | 0.7 | |
| Linear Model | emod/Pa | 5e6 |
| kratio | 2.0 | |
| fric | 0.1 | |
| Linear Parallel Bond Model | pb_emod/Pa | 1e5 |
| kratio | 2.0 | |
| pb_coh/Pa | 3e4 | |
| pb_ten/Pa | 3e4 | |
| pb_fa/° | 30 | |
| pb_radius/m | 1.0 | |
| Smooth-Joint Contact Model | sj_kn/(N·m−1) | 1e7 |
| sj_ks/(N·m−1) | 1e7 | |
| sj_fric | 0.1 | |
| sj_large | 1.0 |
Table 6.
Failure modes analysis of the CPB.
| Specimen ID | Picture Type | Normal Stress /kPa | |||
|---|---|---|---|---|---|
| 100 | 200 | 300 | 400 | ||
| N-L | Cracks |  |  |  |  |
| blocks | |||||
| 2-L-5 | Cracks |  |  |  |  |
| blocks | |||||
| 2-L-15 | Cracks |  |  |  |  |
| blocks | |||||
| 2-L-25 | Cracks |  |  |  |  |
| blocks | |||||
Note: crack distribution chart in red for compression shear cracks, yellow for tension shear cracks and blue for tensile cracks. In the block distribution diagram, particles of the same color together form one block resulting from the destruction of CPB.
Publisher’s Note: MDPI stays neutral with regard to jurisdictional claims in published maps and institutional affiliations. |
© 2022 by the authors. Licensee MDPI, Basel, Switzerland. This article is an open access article distributed under the terms and conditions of the Creative Commons Attribution (CC BY) license (https://creativecommons.org/licenses/by/4.0/).
Share and Cite
MDPI and ACS Style
Gao, T.; Sun, W.; Li, Z.; Fan, K.; Jiang, M.; Cheng, H. Study on Shear Characteristics and Failure Mechanism of Inclined Layered Backfill in Mining Solid Waste Utilization. Minerals 2022, 12, 1540. https://doi.org/10.3390/min12121540
AMA Style
Gao T, Sun W, Li Z, Fan K, Jiang M, Cheng H. Study on Shear Characteristics and Failure Mechanism of Inclined Layered Backfill in Mining Solid Waste Utilization. Minerals. 2022; 12(12):1540. https://doi.org/10.3390/min12121540
Chicago/Turabian StyleGao, Tong, Wei Sun, Zhaoyu Li, Kai Fan, Minggui Jiang, and Haiyong Cheng. 2022. "Study on Shear Characteristics and Failure Mechanism of Inclined Layered Backfill in Mining Solid Waste Utilization" Minerals 12, no. 12: 1540. https://doi.org/10.3390/min12121540
Note that from the first issue of 2016, this journal uses article numbers instead of page numbers. See further details here.