Article

Mineralogical and Fluid Inclusion Evidence for Reworking of Au Mineralization by Ag-Sb-Base Metal-Rich Fluids from the Bytíz Deposit, Příbram Uranium and Base-Metal Ore District, Czech Republic

1
Department of Mineralogy and Petrology, National Museum, Cirkusová 1740, 193 00 Prague, Czech Republic
2
Institute of Geochemistry, Mineralogy and Mineral Resources, Faculty of Science, Charles University, Albertov 6, 128 43 Prague, Czech Republic
3
Vladimír Šrein, Mříčná 154, 512 04 Mříčná, Czech Republic
4
Mining muzeum Příbram, Hynka Kličky Place 293, 261 01 Příbram VI, Czech Republic
*
Author to whom correspondence should be addressed.
Minerals 2022, 12(12), 1539; https://doi.org/10.3390/min12121539
Submission received: 31 October 2022 / Revised: 20 November 2022 / Accepted: 27 November 2022 / Published: 29 November 2022
(This article belongs to the Special Issue Geochemistry and Genesis of Hydrothermal Ore Deposits)

Abstract

:
This mineralogical and fluid inclusion study was conducted on an Au-bearing quartz–sulfide vein encountered in the deep parts of the Bytíz deposit in the Příbram uranium and base-metal district, Bohemian Massif, Czech Republic. The samples were taken where the Au-bearing vein is crosscut by the common base-metal Zn-Pb ore vein Bt23C. The early mineralization of the Au-bearing vein is composed mainly of quartz (Q-1 to Q-3), illite–muscovite, Fe-Mg chlorite, arsenopyrite, and Au-Ag alloys, showing a wide range of compositions (4–69 at. % Ag) and a decrease in Au/(Au + Ag) ratios during vein evolution. Younger hydrothermal processes led to the crystallization of nests and veinlets composed of late quartz (Q-4), carbonates (siderite, dolomite–ankerite and calcite), base-metal sulfides (galena, sphalerite, chalcopyrite, and tetrahedrite), a suite of Ag and Bi-tellurides, and acanthite. The input of Sb is manifested by the partial to complete replacement of some gold grains by aurostibite and an unnamed (Ag,Au)-Sb oxide with a composition close to AuSbO3. The fluid inclusion study, combined with chlorite thermometry and arsenopyrite thermometry, showed that the early mineralization crystallized from progressively cooled (from 300 to 400 °C down to ca. 180 °C), diluted (1.2–7.0 wt. % NaCl eq.) aqueous solutions. The late portion of the mineralization formed from aqueous fluids with highly variable salinity (0.2–23.4 wt. % NaCl eq.) and homogenization temperatures decreasing from ca. 250 °C to < 50 °C, which compare well with the base-metal mineralization of the vein Bt23C and other base-metal veins of the Příbram ore area. Our study illustrates the nature and intensity of the processes of the reworking of the early gold mineralization mediated by the younger Ag,Sb-rich base-metal fluids, giving rise to Příbram’s typical late-Variscan vein Zn-Pb mineralization.

1. Introduction

The Příbram uranium and base-metal ore district is remarkable for numerous reasons: it is one of the most significant ore districts in the Czech Republic, with more than 2500 hydrothermal ore veins (1641 with uranium mineralization, 35 with Pb-Zn, and finally 19 with monometallic silver mineralizations), with an exposed vertical extent of more than 1800 m from 26 main shafts—forming altogether 23 km of vertical shafts, more than 2100 km of horizontal adits, and 300 km of chutes in an area of 57.6 km2 [1]. The total production of 48,432 t of pure U metal represented 49% of the Czechoslovak production in the period from 1947 to 1991. The parallel mining of base metals and silver from veins produced more than 6100 tons of Pb, 2400 tons of Zn, and 28 of tons Ag [2]. These data make the Příbram uranium district comparable with the most important ones on a worldwide scale. It is also marked by wide mineralogical diversity (more than are 300 species known so far—https://www.mindat.org/loc-779.html, accessed on 15 October 2022), reflecting the occurrence of various types of mineralization—from the earliest gold-bearing veins and the main uranium and base-metal veins, with locally rich selenide mineralization as well as Ag, Ag-Sb, Sb, or As bonanzas, to the post-ore zeolite mineralizations. These remarkable facts render detailed studies of this ore district scientifically relevant as they contribute to the understanding of the origin and subsequent overprint of a complex, polyphase, hydrothermal system.
The ore veins of the Příbram ore area originated during multiple mineralizing stages. A common feature is the repeated dissolution of some vein minerals and/or their replacement by younger hydrothermal mineral phases, even leading to the completely re-worked vein fabric as well as the mineral assemblage of the original vein. Kutina [3] described the formation of fine-grained “hard ores”, dominated by a mosaic of quartz and sulfides, which originated by the stepwise replacement of the old siderite vein. He documented up to three cycles of replacement operating in the same portion of the vein. Widespread features of vein dissolution and replacement, especially in the case of the siderite, dolomite-ankerite, galena, and Pb-Sb sulfosalts, were also found during recent investigations of the Pb-Zn ore veins from the Příbram uranium district [4,5,6]. The reason for these phenomena was identified in the temporal but repeated activity of corrosive fluids [5].
It is not known whether the mentioned hypogene corrosive processes took place only in the base-metal veins of the Příbram ore area or whether they could also influence the other types of older hydrothermal mineralizations occurring in this area. In this paper, we present a detailed description of the ore textures and paragenetic sequence of the unique occurrence of Au(-Bi) and Ag-Sb mineralizations hosted in the same vein structure of the Bytíz deposit and discuss the observed mineralogical variations as well as the redistribution processes, using microscopy, electron microprobe, and fluid inclusion analyses.

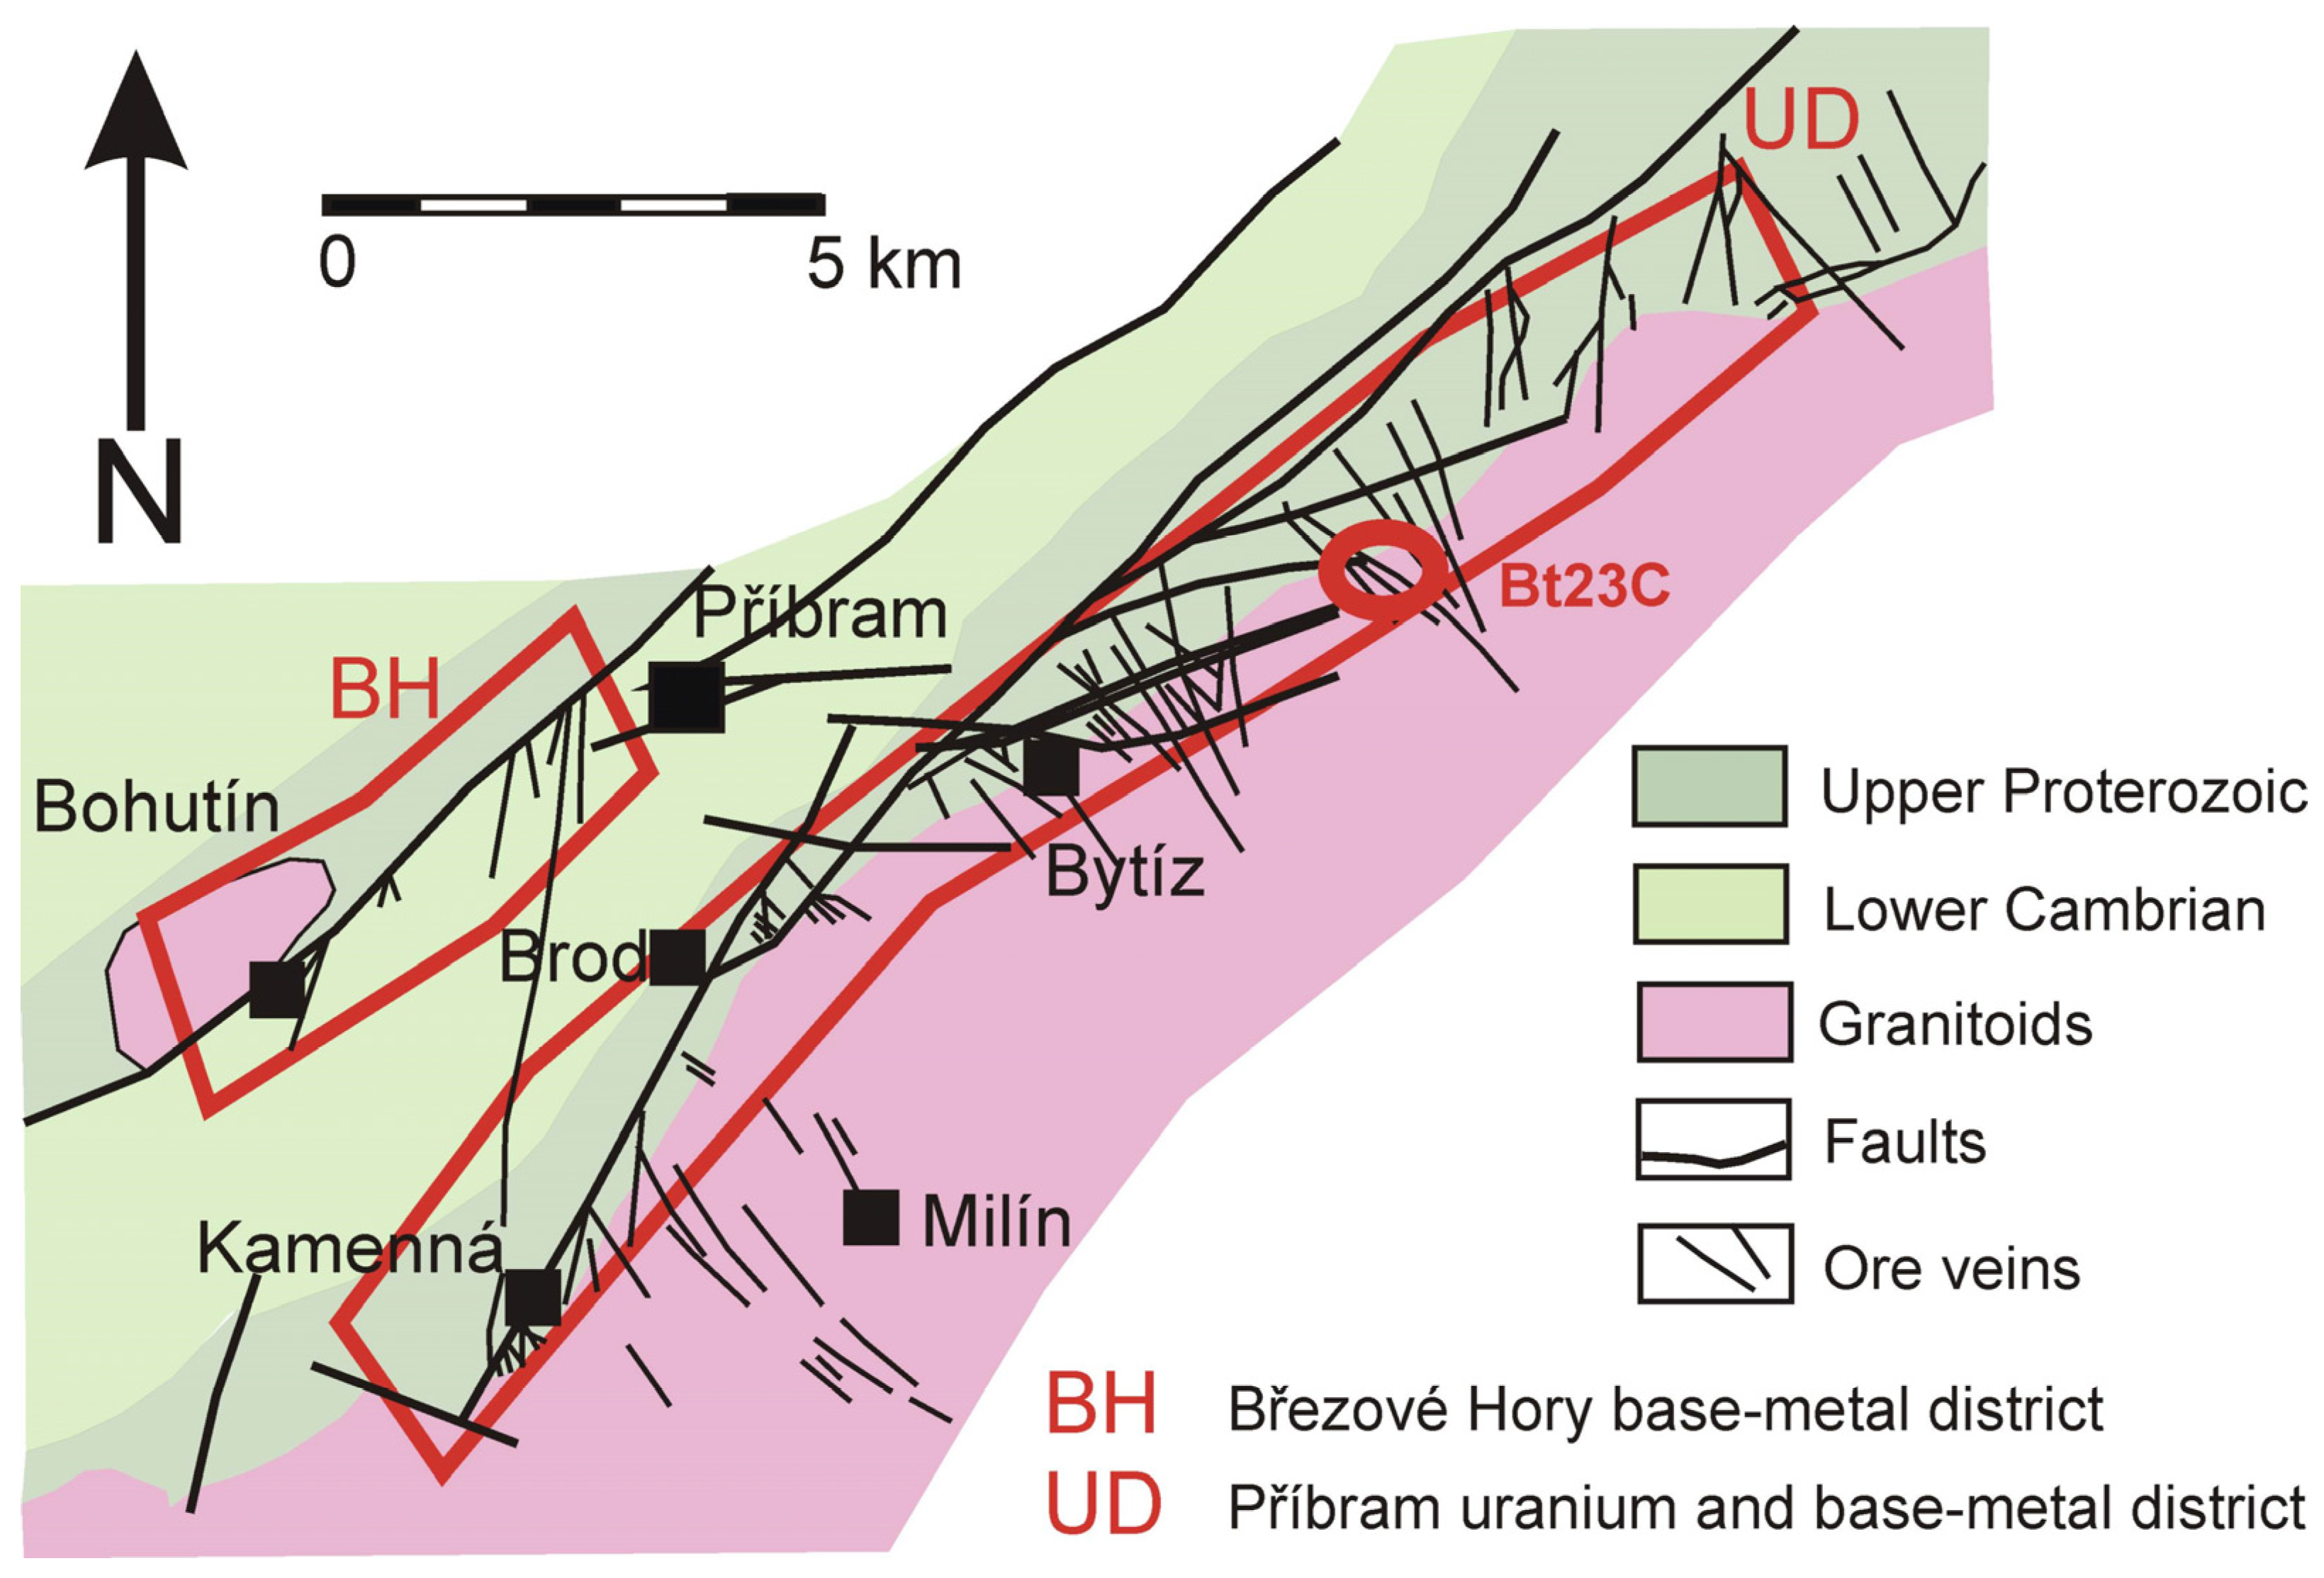
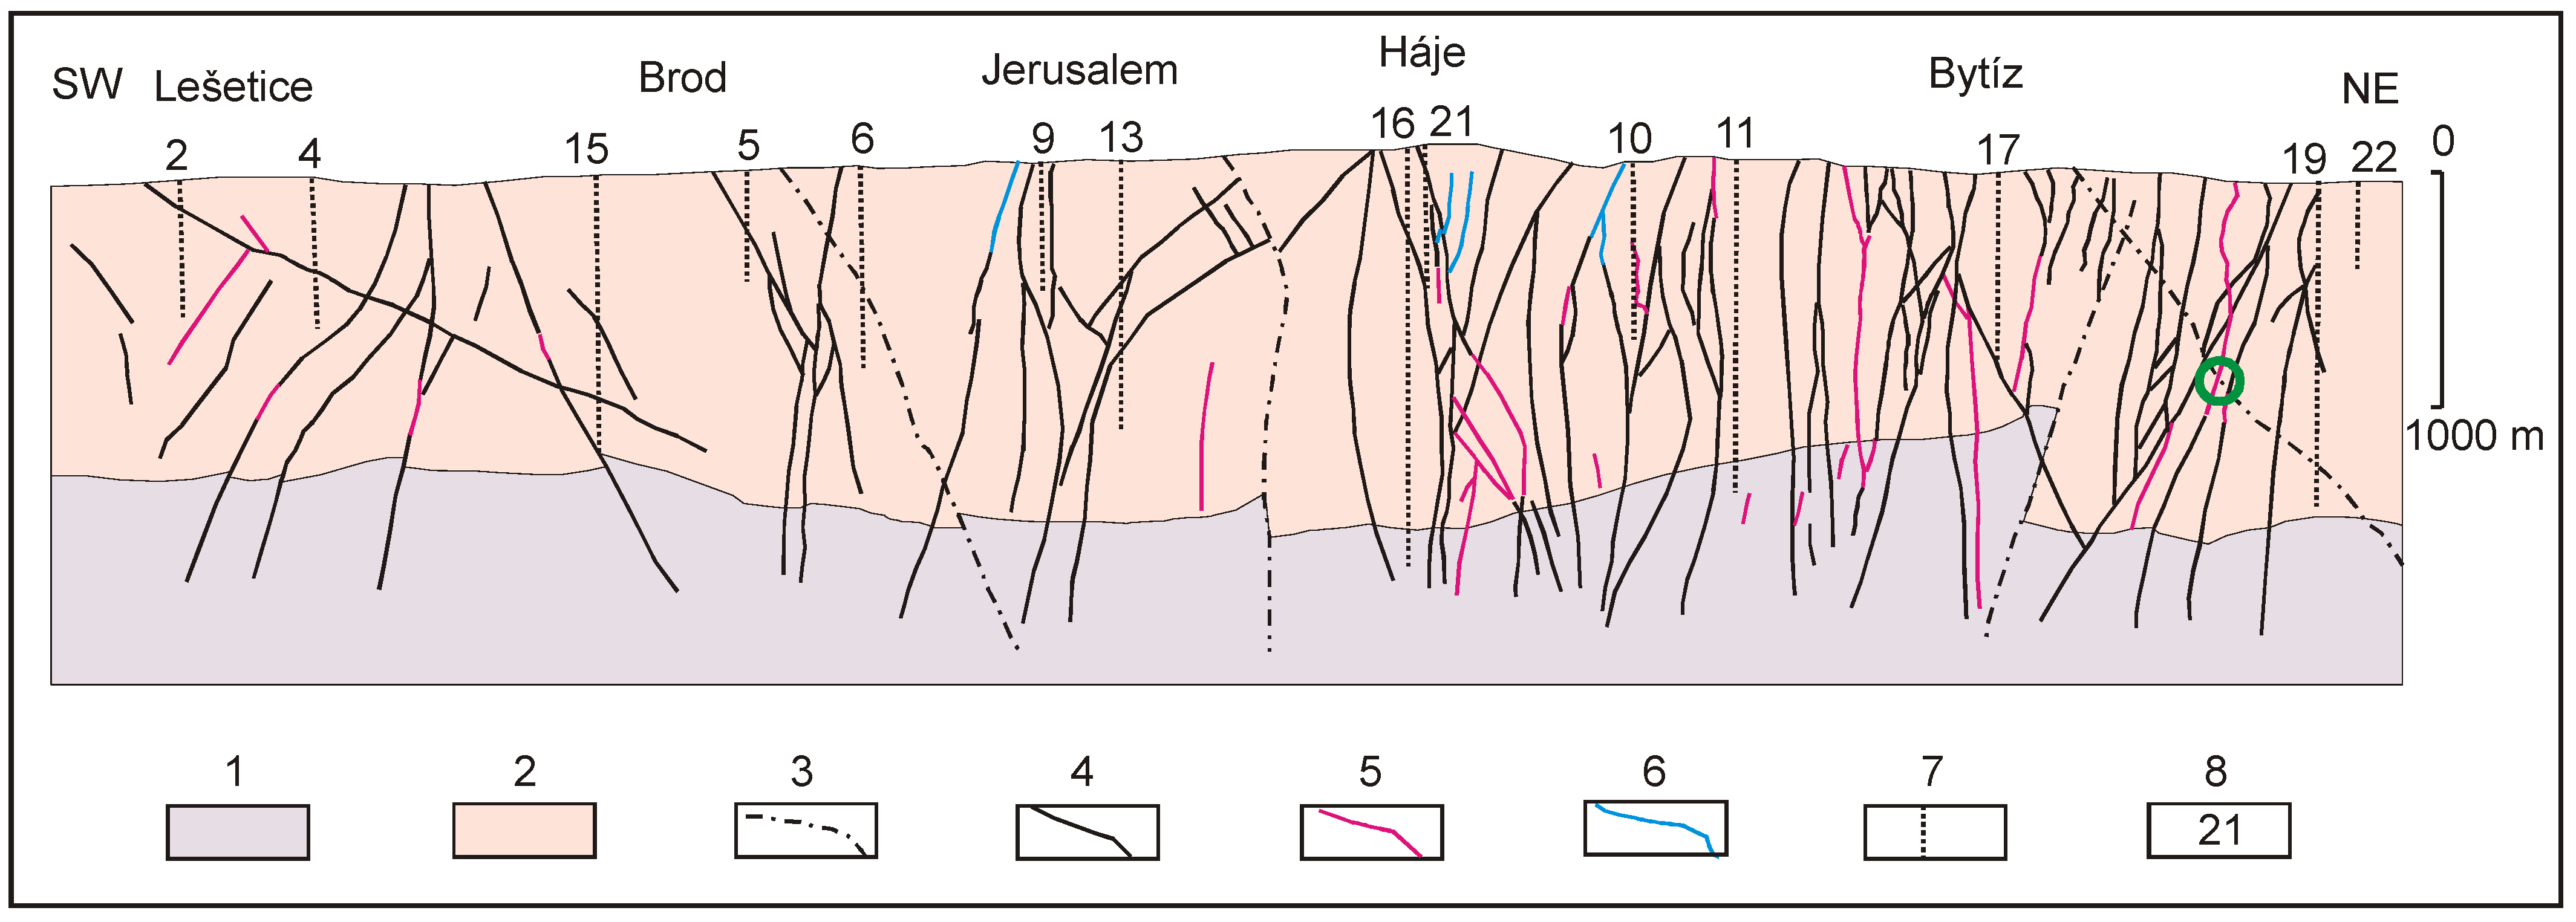
2. Geological Setting

Two main ore districts are known in the Příbram ore area (central Bohemia, Czech Republic), including the Březové Hory base-metal district and the Příbram uranium and base-metal district. The Březové Hory base-metal district, located in the western part of the area, was known from at least the 13th century, but the main mining activity took place from 1810 to 1978. A total of 22 million tons of extracted ore contained 3837 tons of Ag, 517,961 tons of Pb, and 70,300 tons of Sb [1]. The complex Příbram uranium and base-metal district mined between 1947 and 1991 represents the largest accumulation of vein-type hydrothermal U ores in the Czech Republic (see above) and is comparable to world-class deposits of this type.
Both of the main ore districts are tied to the southeastern contact of the Barrandian sedimentary rocks of the Neoproterozoic and Lower Cambrian age with the western margin of the granitoids of the Central Bohemian Plutonic Complex. The Příbram uranium district is located tightly in the exocontact of the Central Bohemian Plutonic Complex in the metasedimentary rocks of the Teplá-Barrandian Unit. The uranium hydrothermal veins are located in a 1–2 km wide and 25 km long zone of tectonically deformed Neoproterozoic rocks (Figure 1), including the Příbram antiform [2]. A predominant part of the uranium mineralization (96%) occurred in veins located in the Dobříš Group of the Neoproterozoic age (Figure 2) with a predominance of claystones, siltstones, and sandstones. The underlying Davle Group, composed of tuffs and tuffites, was encountered by two structural boreholes and by the deep levels of the mines in the Bytíz area.
The Lower Cambrian sediments, including the conglomerates overlying the Dobříš Group, were penetrated by numerous mines. This concerns the upper parts of the central and northeastern parts of the ore district and (at greater depth) the northern part of the vein Bt4. All the rock types are affected by the contact metamorphism caused by the granitoids of the Central Bohemian Plutonic Complex [7]. The granitoids are represented here by the so-called marginal type and the Blatná type granitoids. The mineralized veins wedge out when reaching the plutonic rocks.
The gold-bearing ore mineralization represents the earliest and the relatively widespread type of hydrothermal mineralization in this ore district. Its economic importance, however, was marginal to submarginal only. The wavy quartz to quartz-sulfide veins with a thickness in the range cm–dm form coulisse-like arranged systems of NW–SE to E–W directions with a variable dip (40°–75°) from SW to S or NE to N in the rock of the Barrandian Neoproterozoic and in the granitoids of the NW margin of the Central Bohemian Plutonic Complex. In the central part of this ore district, the gold-bearing mineralization was verified by mining works down to the depth of about 1400 m. Some ore veins are locally characterized by high metal content (about 100 ppm Au) and variable mineral associations containing Bi, Te, Ag, Sb, Pb, Cu, Fe, As, and S [8,9,10].
The most economically important uranium and base-metal mineralization originated during four main mineralization stages: (I) siderite–sulfidic, (II) calcite, (III) calcite–uraninite, and IV) calcite–sulfidic [7]. The oldest siderite–sulfidic stage (I) is developed on a smaller scale in comparison with that of the neighboring Březové Hory district. The younger calcite stages, characterized by notably lower formation temperatures, are more abundant; the calcite generations were used in separating the mineralization stages. For the calcite stage, (II) the pre-ore calcite DK and the calcite K1 are characteristic. In the calcite–uraninite stage (III), carrying the main part of the economic uranium mineralization (uraninite, coffinite, and U-bearing anthraxolite), are the present calcite types K2–K4. In the last calcite–sulfidic stage (IV), the post-ore calcite K5 appears. An extremely diverse (more than 25 mineral species) selenide mineralization appears locally around the boundary of stages III and IV [11]. The origin of the Ag, Ag-Sb, Sb, and As-Sb bonanza-type accumulations [12,13,14] is probably connected with the calcite–sulfidic stage IV. The age of the uranium mineralization, obtained by the U-Pb radiometric dating of two uraninite samples, is Permian, 275 ± 4 and 278 ± 4 Ma [15].
The youngest post-ore zeolite mineralization is bound to the independent calcite veins or occurs in drusy cavities of uranium-bearing veins. It is represented by occurrences of harmotome, laumontite, stilbite, natrolite, thomsonite, etc. [9,16], with local occurrences whewellite [17,18].
Our research concentrated on the Au-bearing quartz–sulfide vein of the U and Pb-Zn deposit of Bytíz (the vein cluster Bt17B-Bt22). This vein was found during the mining of the base-metal ores above the 20th level (at a depth of 900–950 m) of mine No. 19 (Bytíz). The NW–SE trending vein had a wavy character with a thickness ranging between 3 and 25 cm and was located in close proximity to the younger base-metal vein Bt23C. According to chip sampling at the length of 18 m, the Au-bearing vein may be characterized by variable contents of Au from 0.43 to 111 ppm (Figure 3). The vein filling is represented by grey-white to grey massive quartz with abundant arsenopyrite and younger tiny veins of carbonates and at some places with fine-grained gold (0.X mm) and grey aggregates of associated minerals with the size of about 1 mm.

3. Analytical Methods

The studied samples were prepared for optical investigation and measurements of the chemical composition using standard diamond polishing techniques. The ore minerals and their relationships and textures were first studied in reflected light using a Nikon Eclipse ME600 polarizing microscope (National Museum, Prague, Czech Republic).
The chemical analyses of the Au, Ag, Pb, Zn, Sb, Cu, Bi, and Hg in the bulk ore were performed using atomic absorption spectroscopy (AAS) in the lab of GEMATEST Ltd. in Černošice.
The chemical analyses of minerals were performed using a Cameca SX-100 electron microprobe (National Museum, Prague, Czech Republic), operating in the wave-dispersive (WDS) mode. For most of the sulfide minerals, tellurides, and native metals, the following conditions, standards, and X-ray lines were used to minimize line overlaps: 25 kV, 20 nA, 0.7 μm wide beam; Ag (AgLα), apatite (CaKα, PKα), Au (AuMα), baryte (BaLα), Bi2Se3 (BiMβ), CdTe (CdLα), Co (CoKα), CuFeS2 (CuKα, SKα), FeS2 (FeKα), GaAs (GaLα), Ge (GeLα), HgTe (HgLα), InAs (InLα), Mn (MnKα), NaCl (ClKα), NiAs (AsLβ), Ni (NiKα), PbS (PbMα), PbSe (SeLβ), PbTe (TeLα), sanidine (KKα), Sb2S3 (SbLα), Sn (SnLα), and ZnS (ZnKα). Acanthite was measured at 4 nA and with a 5 μm wide beam. Part of the arsenopyrite analyses was taken with a special setup to increase the sensitivity to Au. These data were collected at 60 nA, with a 5 μm wide beam, and with a long counting time for the Au peak (120 s). With the exception of Au, whose detection limit was about 330 ppm, the contents of As, Co, Cu, Fe, Mn, Ni, Pb, S, and Sb were determined. For gangue minerals, 15 kV, 5–10 nA, and 2–5 μm wide beams were used. In feldspar, the contents of Al, Ba, Ca, Cs, Cu, F, Fe, Mg, Mn, K, Na, P, Pb, Rb, Si, Sr, and Zn; in TiO2 mineral, Al, As, Ca, Cr, Fe, Mg, Mn, Mo, Na, Nb, P, Pb, S, Sc, Si, Sn, Ta, Ti, U, V, W, Y, and Zr; in chlorite and white mica, Al Ba, Ca, Cl, Co, Cr, Cs, Cu, Fe, K, Mg, Mn, Na, Ni, P, Pb, Rb, Si, Ti, V, and Zn; in monazite, Al, As, Ba, Bi, Ca, Ce, Cl, Cu, Dy, Eu, Er, F, Fe, Gd, Hf, Ho, K, La, Lu, Mg, Mn, Na, Nd, P, Pb, Pr, S, Sc, Si, Sm, Sr, Tb, Th, Ti, Tm, U, V, Y, Yb, and Zr; and in carbonates, Ba, Ca, Cu, Fe, Mg, Mn, Na, P, Pb, S, Si, Sr, and Zn were measured, respectively. The following standards and lines were used: albite (Na), almandine (Al, Fe), apatite (P), baryte (Ba), Bi (Bi), celestite (S, Sr), CePO4 (Ce), chalcopyrite (Cu), clinoclase (As), Cr2O3 (Cr), CrTa2O6 (Ta), Cs-glass (Cs), diopside (Mg), DyPO4 (Dy), ErPO4 (Er), EuPO4 (Eu), GdPO4 (Gd), halite (Cl), hematite (Fe), Hf (Hf), HoPO4 (Ho), LaPO4 (La), LiF (F), LuPO4 (Lu), Nb (Nb), NdPO4 (Nd), Ni (Ni), PrPO4 (Pr), Rb-Ge-glass (Rb), rhodonite (Mn), sanidine (K, Si, Al), ScVO4 (Sc), scheelite (W), SmPO4 (Sm), Sn (Sn), stibnite (Sb), TbPO4 (Tb), Th (Th), TiO2 (Ti), TmPO4 (Tm), UO2 (U), V (V), vanadinite (Pb), wollastonite (Ca, Si), wulfenite (Mo), YbPO4 (Yb), YVO4 (Y), zinkite (Zn), and zircon (Zr). The peak counting times were between 10 and 30 s; those of both backgrounds were half of the peak counting time. Raw intensities were converted to the concentrations of elements using the automatic “PAP” matrix-correction procedure [19]. The amount of oxygen in the oxygen-bearing minerals was calculated by stoichiometry. The contents of the above-listed elements, which are not included in the tables, were analyzed quantitatively, but their contents were below the detection limit (ca. 0.03–0.05 wt. % for most elements, around 0.2 wt. % for Ho-Lu). The collected data were corrected for the overlaps P vs. Ca, La vs. Dy, Eu vs. Dy, F vs. Ce, Bi vs. Ce, and Th vs. U.
The contents of REE were normalized on C1 chondrite with the data given by Anders and Grevesse [20]. The numerical values of the Ce and Eu anomalies were calculated using the equations given by McLennan [21].
The fluid inclusions in the quartz and carbonates were studied in standard doubly polished ~100 μm thick plates mounted by the Canada balsam. The fluid inclusion petrography was conducted using a Leica DMPL polarizing microscope (magnification up to 1000x) (Leica Microsystems, Wetzlar, Germany) and fluid inclusion microthermometry using a Linkam THMSG 600 heating–freezing stage (Linkam Scientific Instruments, Surrey, United Kingdom) mounted on an Olympus BX-50 microscope (Olympus Co., Tokyo, Japan) with 20× and 50× long-working-distance objectives. The stage was calibrated using synthetic and natural standards at –56.6 °C (CO2), 0 °C (H2O), +31.1 °C (CO2), and +307 °C (NaNO3). The precision of the measurements was ± 0.1 °C in the temperature span between 0 °C and +50 °C. Where possible, the microthermometric data were collected for homogeneous fluid inclusion associations only, such as individual growth zones, three-dimensional clusters, or well-defined fluid inclusion trails. The measured phase transitions included the freezing temperature (Tf), the temperature of the initial melting (Ti), the melting temperature of the last ice crystal (Tm-ice), and the homogenization temperature (Th). The degree of fill (F) is estimated as the L/(V+L) ratio at room temperature. The salinities were calculated as wt. % NaCl eq. using the equation of Bodnar [22]. Isochores were calculated in the ISOC software [23], with calibration by Knight and Bodnar [24].

4. Results

4.1. Bulk Chemical Composition of the Studied Ore

The samples for this study were prepared from the richest Au-mineralized quartz-sulfide gangue with the following bulk contents—Au: 183–232; Ag: up to 41.9; Pb: 70.5–643; Zn: 297–719; Sb: 37.2–270; Cu: up to 93.4; and Bi and Hg below 10 (all contents in ppm, three samples).

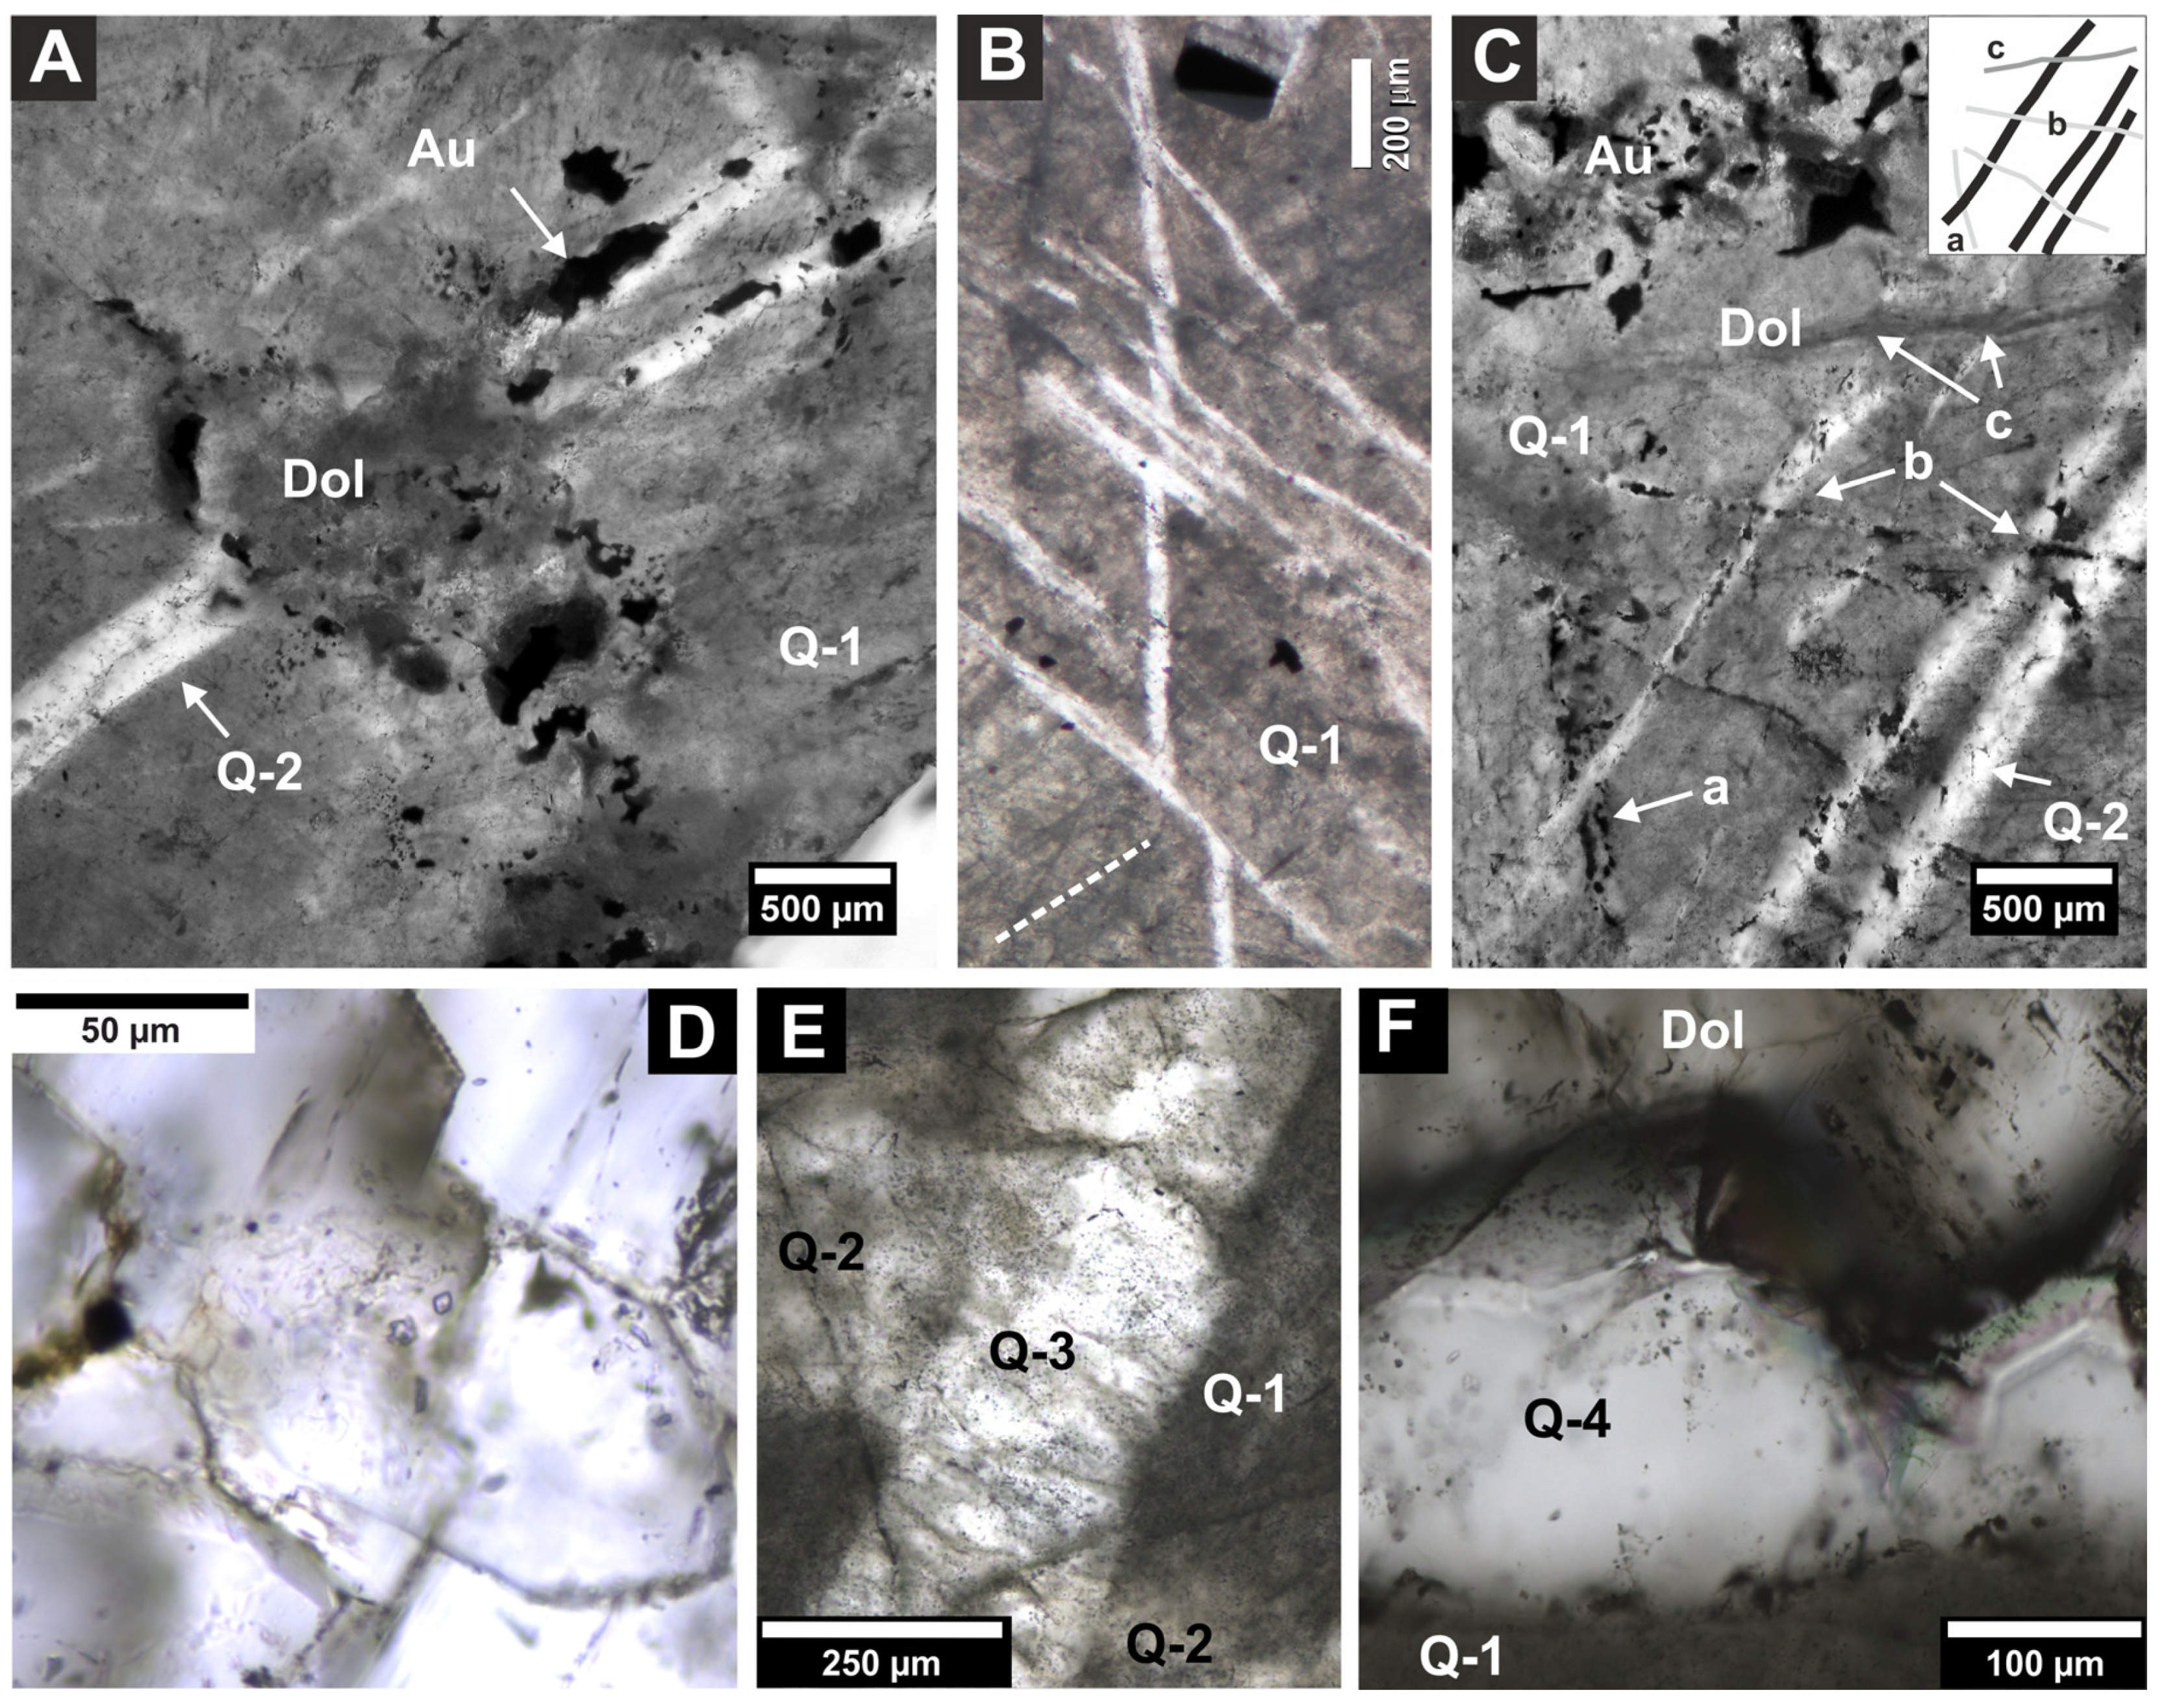
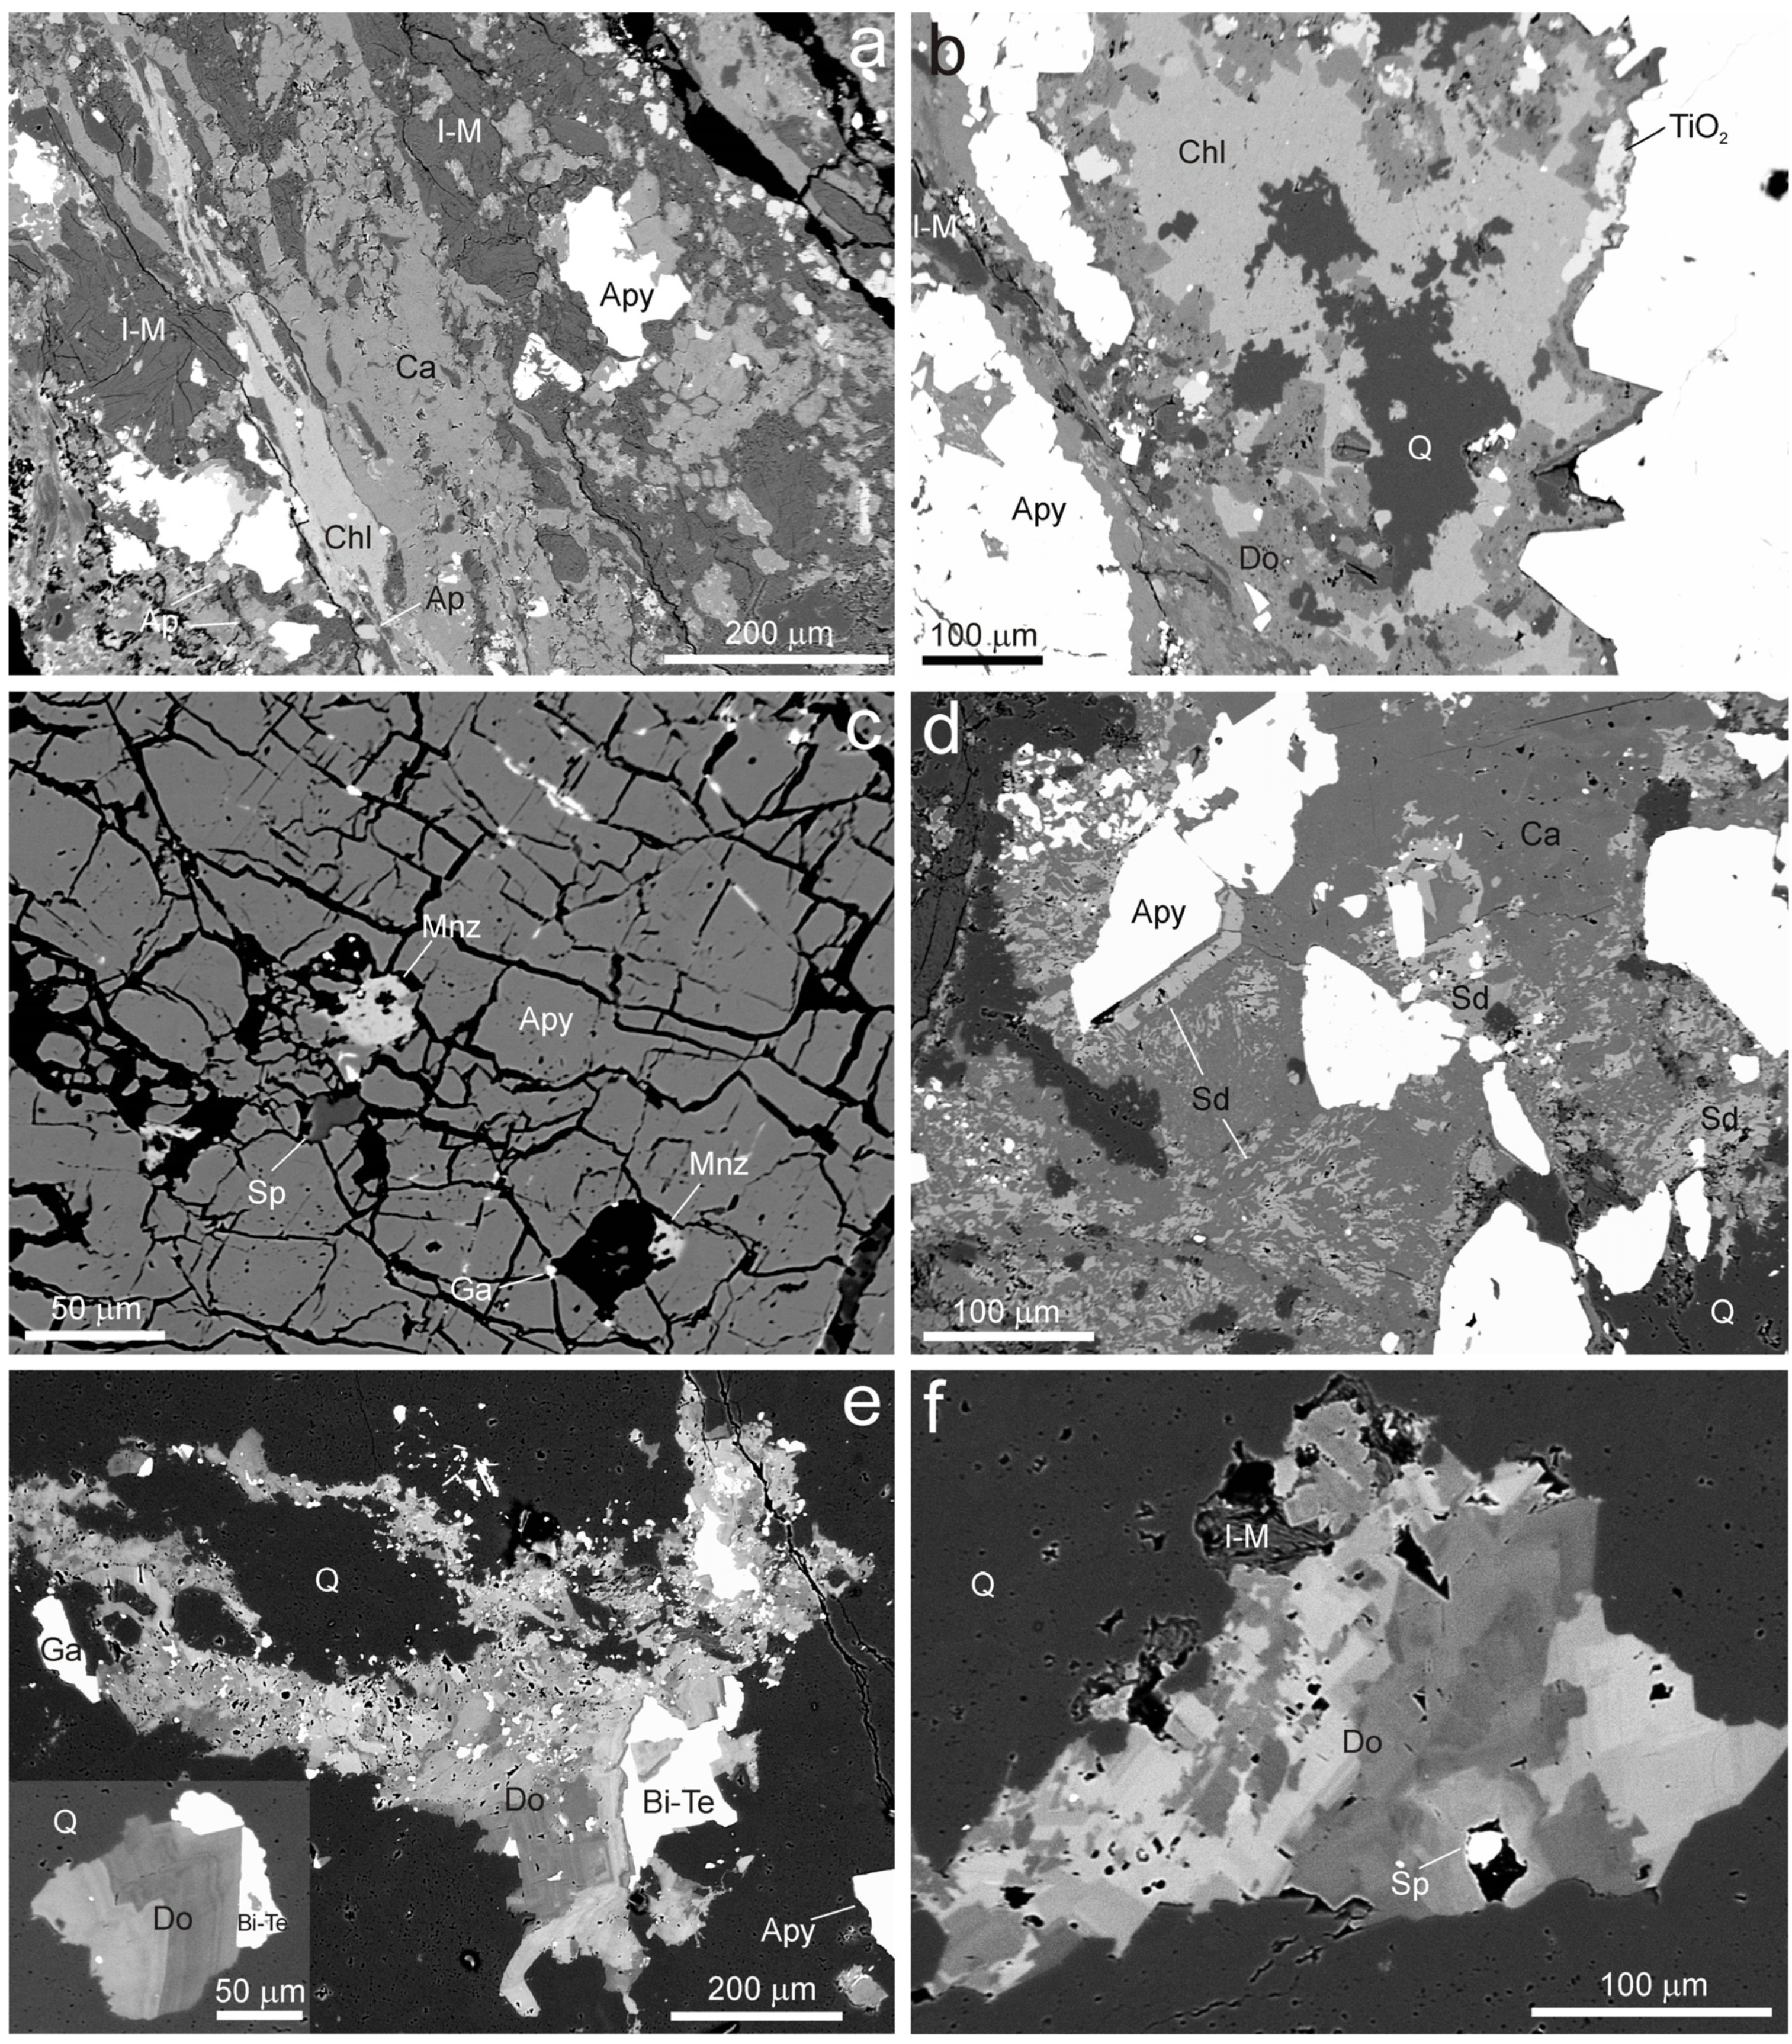
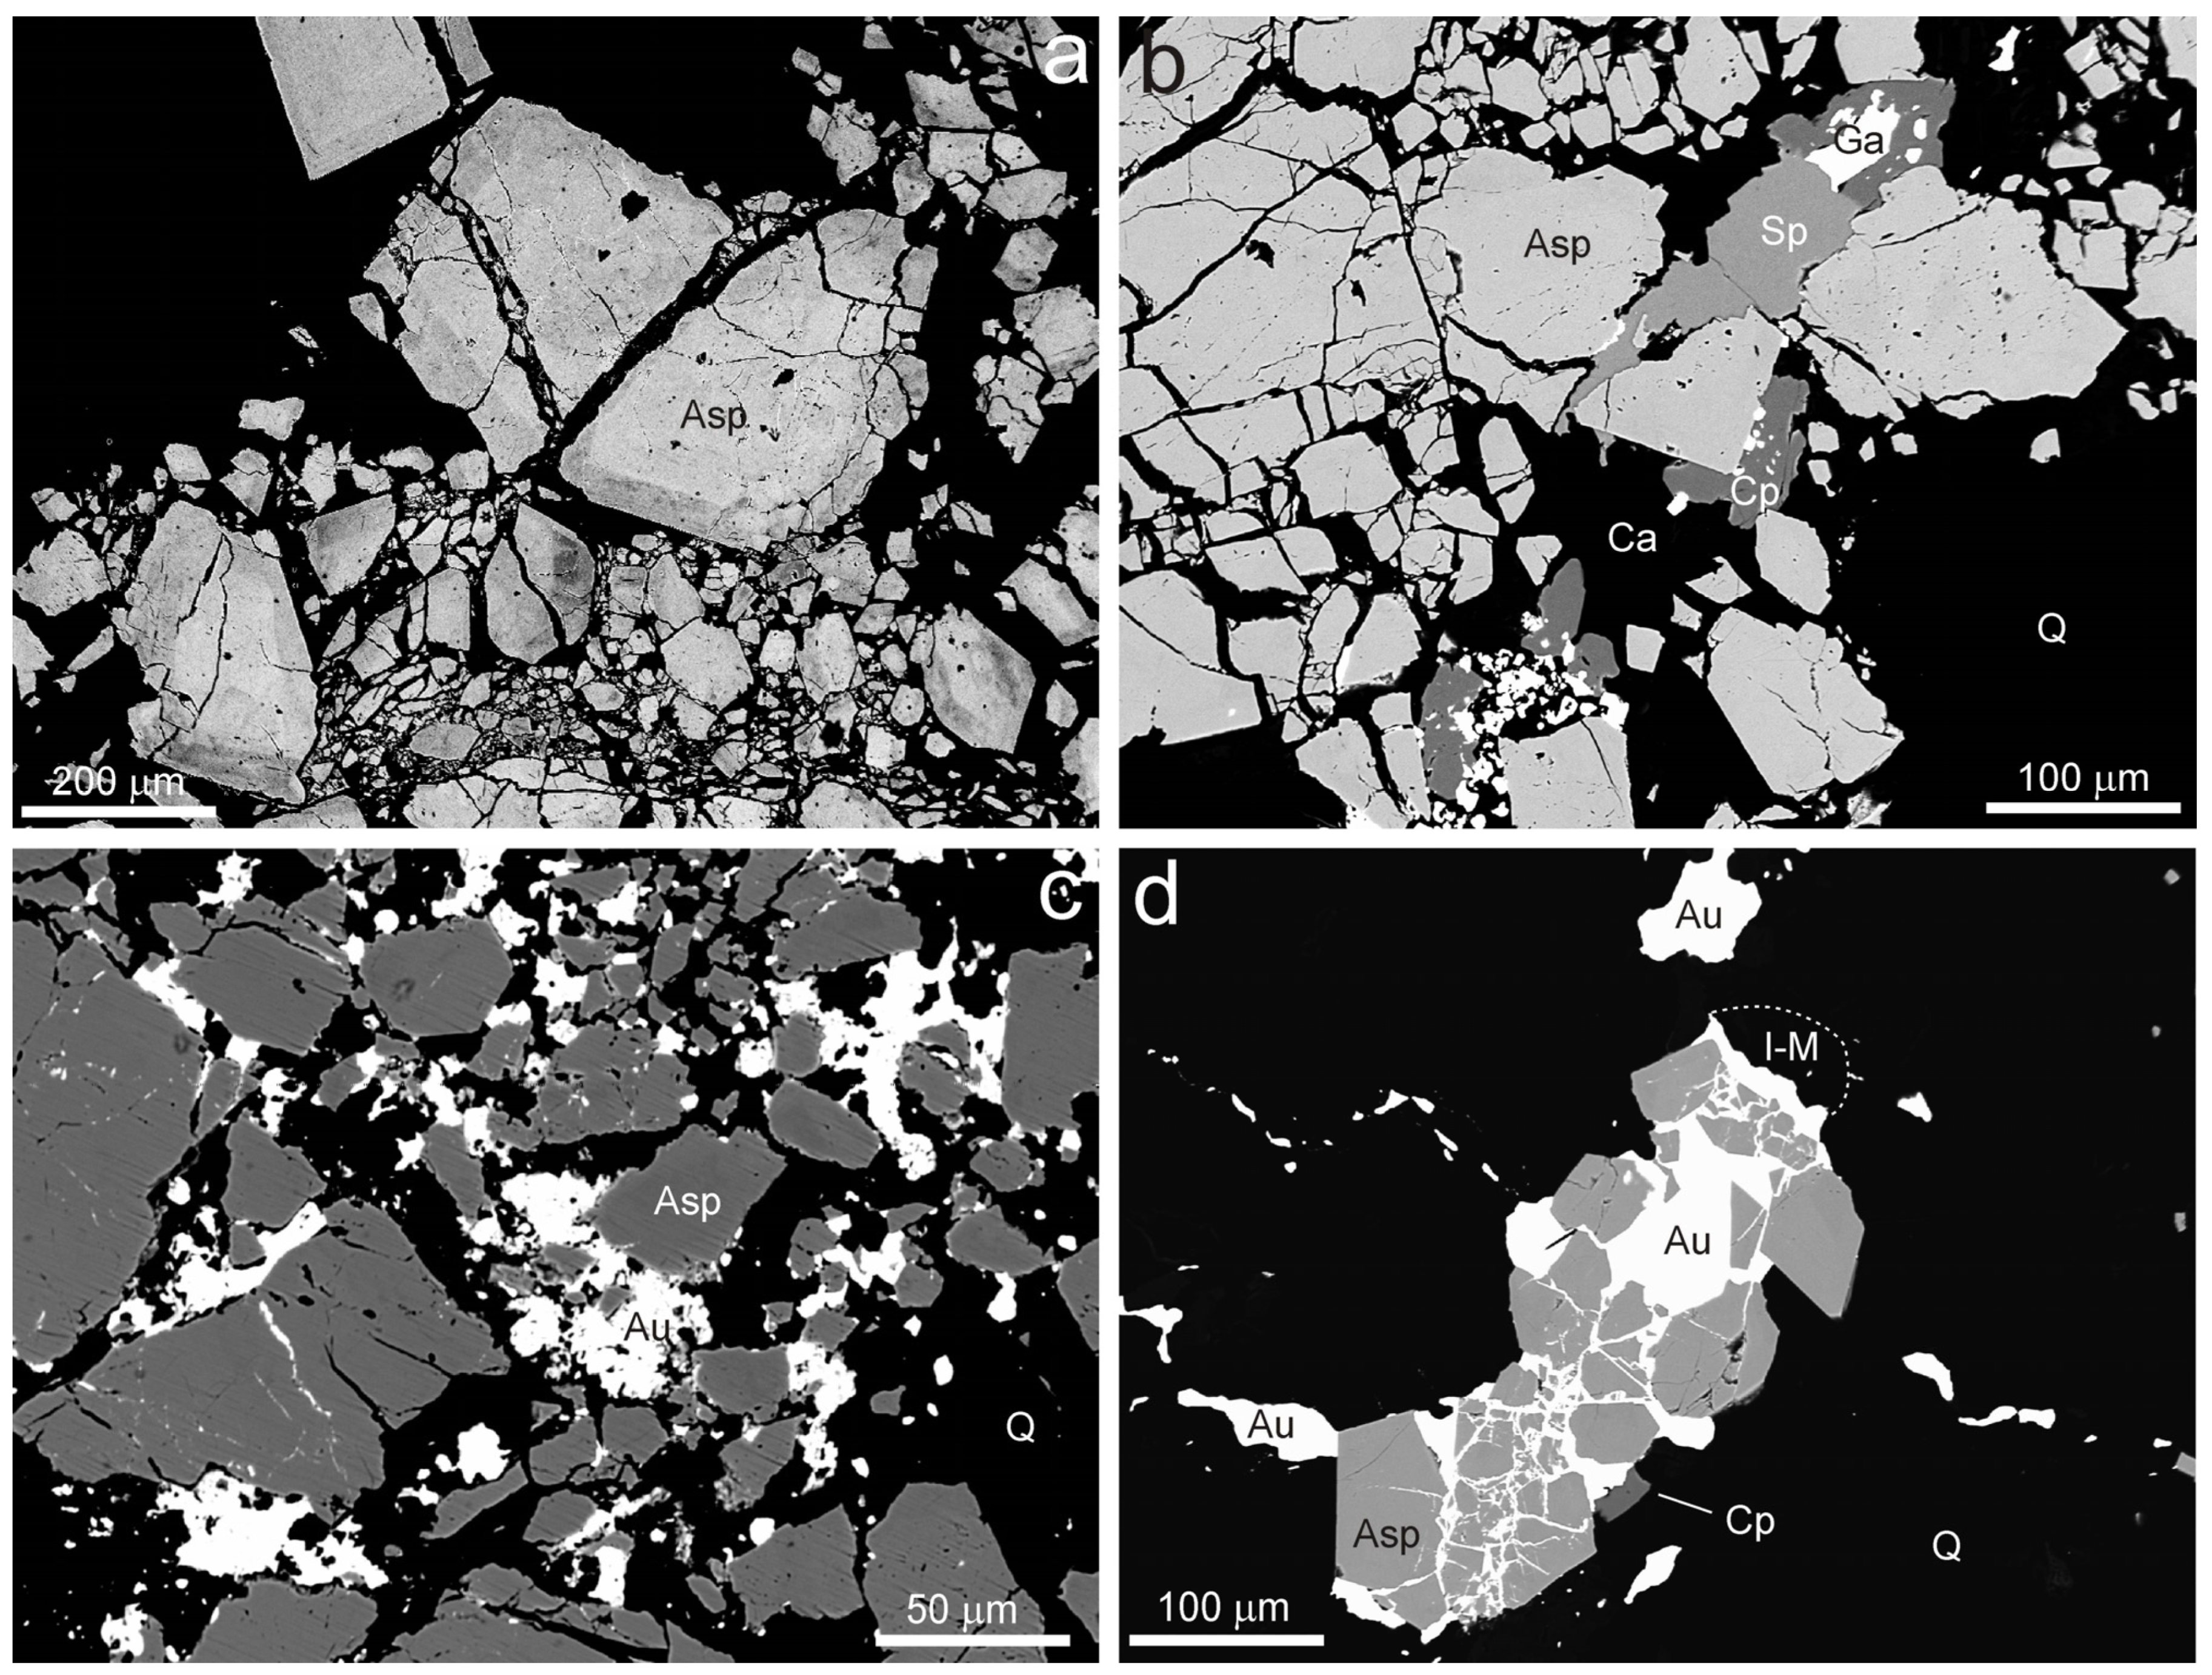
4.2. Mineral Description

Quartz is the predominating mineral of the studied gold-bearing vein. Four generations of quartz (Q-1, Q-2, Q-3, and Q-4) were distinguished. The Q-1 constitutes the bulk of the gangue. It is poorly transparent due to the great amount of submicroscopic (<2 µm) fluid inclusions and ductile to semi-ductile deformation overprint. The deformation resulted in the formation of quartz porphyroclasts floating in a fine-grained matrix. Locally, the relics of less-deformed grains and grain clusters can be also identified. While the quartz deformed largely in a ductile manner, the arsenopyrite deformed mainly in a brittle manner. We suggest that both minerals crystallized coevally. The Q-1 is crosscut by numerous quartz (Q-2, Q-3) and carbonate veinlets, typically 20–70 µm (and, exceptionally, up to 1 mm) thick (Figure 4A–F). Some of these veinlets host Au-Bi-Te-(S) phases. They are well transparent and free of ductile deformation. Complex crosscutting relationships confirm several episodes of tectonic reactivation. Quartz Q-3 crosscuts Q-2 and is even more transparent. The undeformed crystals of late quartz Q-4 (Figure 4F) were also found. These comprise euhedral crystals growing into a cavity in the Q-1 or growing on the edge of the dolomite veinlets crosscutting the Q-1.
Fine-grained white mica is the main constituent of the early arsenopyrite-rich vein (Figure 5a). It is concentrated especially in ore-rich portions of the vein, whereas in the quartz-rich, arsenopyrite-poor domains it can even be completely missing. The tiny flakes of white mica often show hypo-parallel arrangement and belong to the oldest compounds of the vein. It is especially spatially related with the aggregates of chlorite, quartz (Q-2, -3), siderite, and dolomite, whereas it is missing in the younger carbonate–sulfide–telluride veinlets.
Chlorite is one of major constituents of the arsenopyrite-rich vein. It forms massive irregularly shaped aggregates of up to 0.3 mm in size, which do not exhibit any internal texture in the BSE images (Figure 5a,b). Exceptionally, chlorite veinlets cutting the older aggregates of white mica, quartz (Q-1), or arsenopyrite were observed. Chlorite is usually intimately intergrown with xenomorphic siderite or calcite; the dolomite seems to be always younger.
Monazite is an accessory phase of the arsenopyrite-rich vein, where it occurs either in cracks of arsenopyrite (Figure 5c) in association with chlorite, in younger aggregates of quartz (Q-2, -3) and carbonates, or in the ore-poor quartz-rich portion of the vein. It forms isometric, xenomorphic, sometimes slightly porous grains of up to 10 μm in size.
The TiO2 mineral, K-feldspar, and apatite are relatively scarce phases, occurring as irregularly shaped isometric to slightly elongated xenomorphic grains up to 50 μm in size (Figure 5a,b), enclosed in white mica, chlorite, quartz (Q-2, -3), and/or dolomite in the spaces among the crystals of arsenopyrite. No compositional zoning is observed in the BSE images of these phases.
Carbonates are frequent minerals of gangue. Siderite is the least frequent carbonate, which occurs either in intergrowths with chlorite or is intimately intergrown with calcite (Figure 5d). The relationship of calcite and siderite in these intergrowths is not unified. Some parts show clear signs of the replacement of the older siderite by younger calcite along the grain boundaries and/or cleavage, but in other cases, based on textural criteria only, one cannot exclude the cogenetic nature of the homogeneously distributed xenomorphic inclusions of siderite enclosed in the calcite. Carbonates of the dolomite–ankerite series are a major constituent of the vein. They form both the gangue of the telluride-bearing and barren veinlets as well as nests in the older quartz–phyllosilicate–arsenopyrite vein (Figure 5e,f). The equigranular aggregates of the isometric, xenomorphic grains occur together with the automorphic rhombohedral crystals. In the BSE images, patchy and/or detailed oscillatory zoning is often observed, usually with older brighter parts and younger darker ones (Figure 5e,f). Calcite occurs in a quantity comparable to that of dolomite–ankerite. In addition to the above-mentioned intergrowths with siderite (Figure 5d), there also occur aggregates of calcite in the oldest portions of the vein, which are associated with the chlorite (Figure 5a). Finally, tiny calcite veinlets containing base-metal sulfides are also frequent. Corrosion or even replacement of the carbonate of the dolomite–ankerite series by calcite was also observed.
Arsenopyrite is the oldest and most prevalent (>95 vol. %) ore mineral of the vein. Typically, it forms isometric to slightly elongated idiomorphic crystals up to 1 mm in size and crystalline aggregates hosted by quartz, carbonate, and phyllosilicate-rich gangue. The individual crystals often exhibit patchy or oscillatory zoning in the BSE images, usually with brighter cores and darker rims (Figure 6a). Arsenopyrite always shows signs of intense cataclasis manifested by abundant brecciated textures cut by numerous veinlets of other ore and gangue minerals (Figure 6b–d).
Galena is common but minor phase of the studied mineralization. It occurs in the same positions as the Au-Ag alloys, i.e., as individual isometric grains in cracks of arsenopyrite (Figure 6b) that are clearly younger than the grains of the Au-Ag alloy. In addition, it is a younger component of the aggregates of tellurides and base-metal sulfides, where it postdates sphalerite but predates chalcopyrite.
Sphalerite is a rather common mineral of the young sulfide-bearing carbonate veinlets and nests (Figure 5f and Figure 6b). It typically forms isolated isometric grains up to 150 μm in size, enclosed in carbonate, or irregular grains associated with galena and chalcopyrite. No inclusions of other ore minerals (i.e., chalcopyrite “desease”) were observed.
Pyrite is minor component of the sulfide paragenesis of the young carbonate veinlets cutting the vein, as well as an accompanying phase in the arsenopyrite-rich portions of the vein. It usually forms irregularly shaped to idiomorphic grains up to 0.3 mm in size, which do not show any zonality in the ore microscope or BSE images.
Chalcopyrite is rare component, whose occurrence is mostly restricted to younger sulfide-bearing carbonate veinlets (Figure 6b,d). It forms irregular aggregates in association with the older galena, sphalerite, and pyrite. No signs of anisotropy were observed in the ore microscope. In the BSE image, it is mostly homogeneous, but in one case, a heterogeneous aggregate with elevated contents of silver was found.
Tetrahedrite and gudmundite were observed as single grains only. Isometric tetrahedrite grain, 20 μm in size, occurs as enclosed in Ag-rich chalcopyrite, whereas gudmundite grows in a detachment fissure developed around an arsenopyrite crystal, healed by siderite.
The Au-Ag alloys form frequent isometric irregularly shaped grains from 1 to 20 μm in size, which are either present within hair-thin veinlets hosted by the arsenopyrite (Figure 6c,d) or disseminated in the quartz in the vicinity of the arsenopyrite grains (Figure 4A and Figure 6d). The spatial distribution of the Au-Ag grains is irregular. They are usually arranged in clusters of small grains, sprayed in some domains of the vein, whereas the neighboring areas of the gangue, though exhibiting identical mineral composition, are completely free of them. Exceptionally, in the richest parts, the Au-Ag alloy cements the brecciated arsenopyrite (Figure 6d). In reflected light, the Au-Ag alloys show different colors (deep yellow and light yellow to almost white hues) due to the variations in their fineness. In most cases, the Au-Ag alloys with different fineness form individual grains without mutual contact, even in a single cluster (Figure 7a). Only in exceptional cases is it observed that the high-fineness gold is older and overgrown or cut by tiny veinlets of younger low-fineness Au-Ag alloy (Figure 7b,c). These younger silver-rich veinlets are spatially restricted only to the area of the grain itself and never continue into the surrounding gangue. Most of the Au-Ag alloy grains are rimmed and replaced by aurostibite (Figure 7d) and (to a much lesser extent) galena.
Aurostibite overgrows and sometimes completely replaces the grains of Au-Ag alloys (Figure 7d). It forms irregular grains up to 10–40 μm in size, which are spatially associated with grains of non-transformed Au-Ag alloy and are often from rims replaced by the unnamed (Au,Ag)Sb oxide phase (Figure 7e,f). In some parts of the vein, the quantity of grains of aurostibite clearly prevails over that of the Au-Ag alloys. A part of the aurostibite grains is zoned in the BSE images due to the increased content of Bi in their margins.
The unnamed (Au,Ag)Sb oxide phase replaces the aurostibite in its contacts with the surrounding gangue. It forms thin rims around the aurostibite (Figure 7f and Figure 8a) and exceptionally complete pseudomorphs after its grains. In reflected light, it is grey to grey-brown with a reflectance similar to that of sphalerite. In BSE images, it is often zoned due to variations in the water contents, Au/Ag ratio, and/or Fe contents (Figure 8a). Typically, darker (in BSE) zones are situated on the outer margin along the contact with the gangue. It is sometimes overgrown by acanthite (Figure 7e).
Dyscrasite forms aggregates up to 50 μm in size, overgrowing, and in places also partly replacing, the grains of the Au-Ag alloys (especially those with a prevalence of Ag over Au; Figure 7c) and/or aurostibite. Isometric grains of dyscrasite are xenomorphic and sometimes show compositional zonality in the BSE images due to variations in the Ag/Au ratios.
Acanthite occurs in relatively large aggregates (up to 100 μm in size), overgrowing the grains of gold, aurostibite, and the unnamed (Au,Ag)Sb oxide phase (Figure 7c). No zoning is observed in the BSE images.
The Bi-tellurides are characteristic accessory constituents of tiny carbonate (zoned dolomite–ankerite) veinlets or small nests in the quartz–arsenopyrite vein (Figure 5e). Tsumoite is the prevailing telluride, forming isolated irregularly shaped individual grains up to 80 μm in size (Figure 8b,c). It intensively replaces tetradymite, Fe-sulphotsumoite, tellurobismutite, pilsenite, and hedleyite, which are sometimes present in the center of the tsumoite aggregates and do not exceed 30 μm in size (Figure 8b–d). Typically, only simple binary telluride assemblages occur in a single grain of tsumoite, although neighboring grains can contain different telluride assemblages. A more complex assemblage, tetradymite + Fe-sulphotsumoite + tsumoite, was found once only (Figure 8c). Isolated monomineral grains of these tellurides, not exceeding 20 μm in size, can also occur sporadically in the dolomite–ankerite gangue. In addition, sporadic, small, and isolated grains of unnamed Bi2Te were found in spatial association but not in direct contact with these tellurides. Unlike the other mentioned tellurides, the latter phase was in one case observed in direct contact with a grain of the Au-Ag alloy (Figure 8e). Bi-tellurides are in places corroded and replaced by hessite.
Hessite forms rare irregularly shaped grains and aggregates up to 60 μm in size, which are always associated with Bi-tellurides. Hessite (in places together with native bismuth) partly replaces or overgrows hedleyite and/or tsumoite (Figure 8d). In the BSE images, hessite appears to be homogeneous.
Native antimony was observed sporadically, sometimes together with small grains or overgrowths of Sb oxide. Both phases overgrow small grains of galena, native gold, or arsenopyrite. No zoning is visible in the BSE images (Figure 8f).
Native bismuth is very rare and was observed in two different positions. The first grain, 5 μm × 15 μm in size, was found to be enclosed in a grain of Au-Ag alloy. Another irregular aggregate of native bismuth was associated with hessite, both partly replacing an aggregate of hedleyite (Figure 8d).

4.3. Mineral Composition

4.3.1. Base-Metal Sulfides
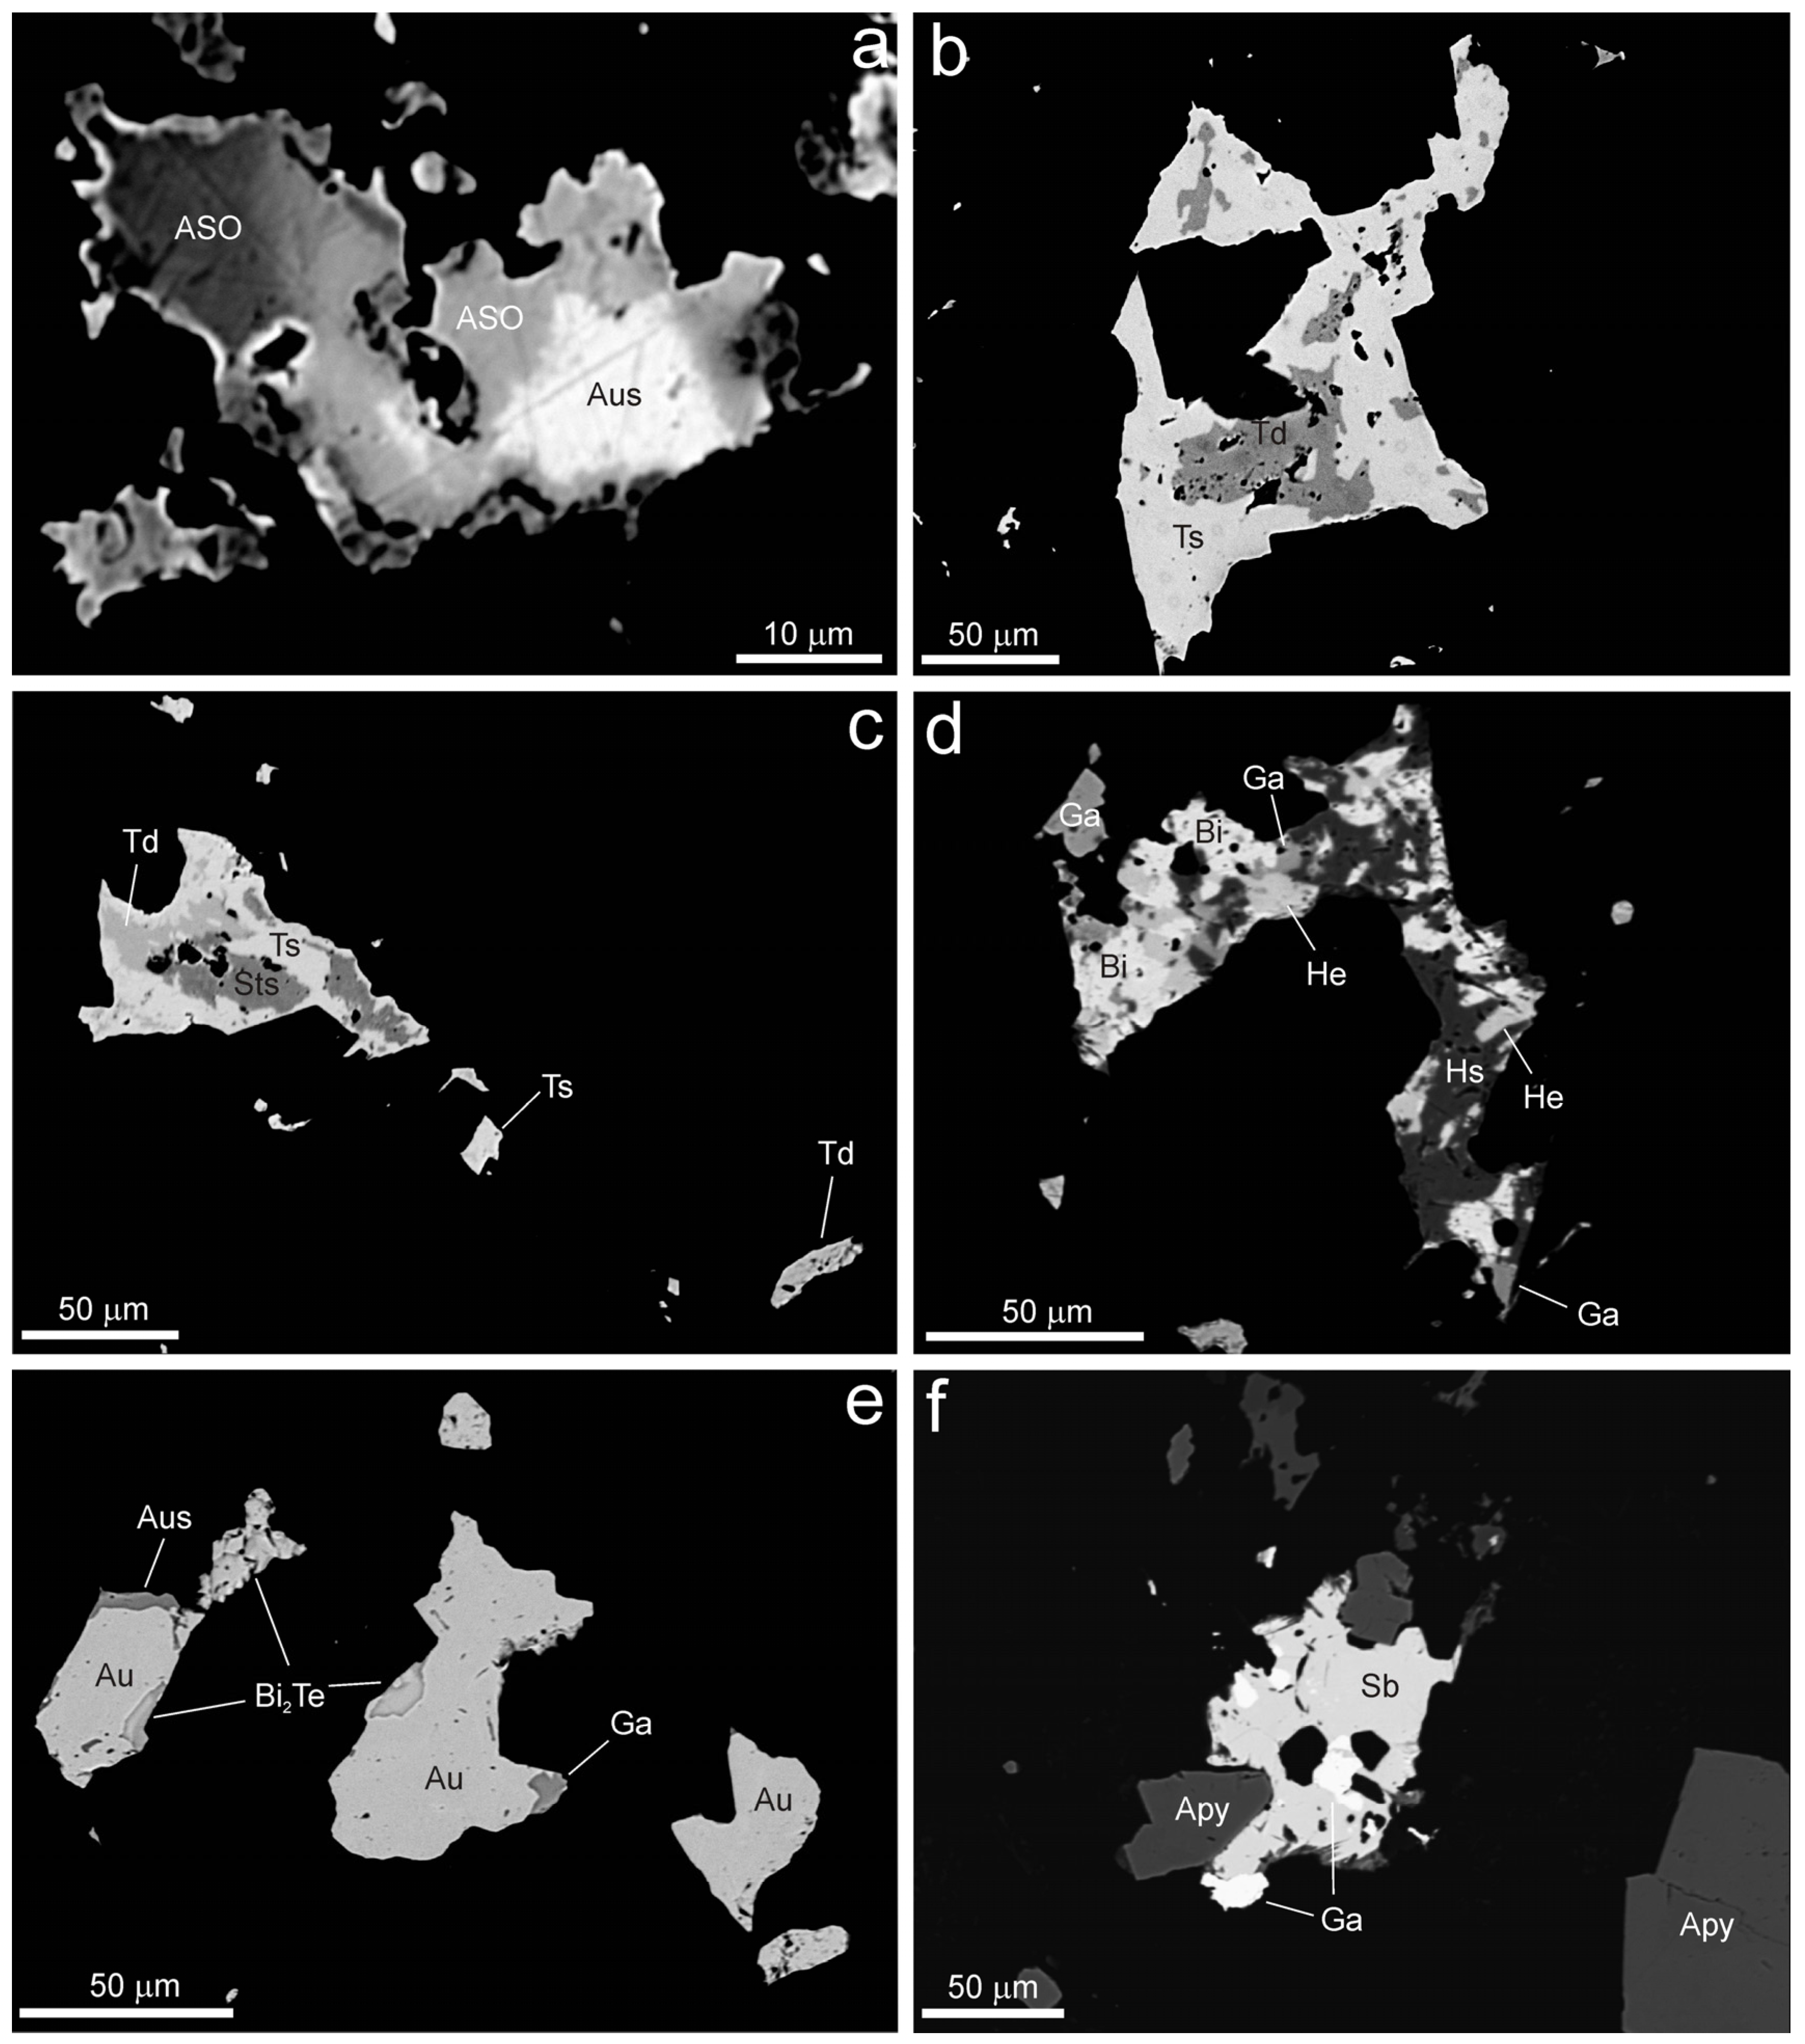
During the study of the chemical composition of arsenopyrite (See Supplementary Materials, Table S1a,b), we observed, in addition to the main elements (Fe, As, S), only irregular minor traces of Co and Sb, not exceeding 0.004 and 0.001 apfu, respectively. A part of the arsenopyrite grains shows distinct chemical zoning in the BSE images (Figure 6a), caused by AsS-1 substitution: in the BSE, the brighter cores are richer in As than the darker rims. All arsenopyrite aggregates are relatively As-poor (Figure 9). The determined range of this substitution (1.02–1.17 apfu S) is slightly larger than that published by Kretschmar and Scott [25] or Sharp et al. [26], but it corresponds to that of the arsenopyrite from some other gold deposits (see, e.g., Mikulski [27]; Andráš, Chovan [28]). The cation position of arsenopyrite shows a slight deficiency (0.98–1.00 apfu Fe + Co), which does not correlate with the As/S ratio. A similarly slight iron deficiency is usual for both natural and synthetically grown arsenopyrites [25]. The contents of gold range rather uniformly between 0.00041 and 0.00066 apfu.
The chemical composition of galena is close to the ideal formula (Table S2); only traces of Ag (up to 0.004 apfu), Sb (up to 0.012 apfu), and Bi (up to 0.004 apfu) were determined; the measured contents of Fe (up to 1.49 wt. %) probably come from the surrounding pyrite. Pyrite is stoichiometric without the other elements, including As. Sphalerite shows varying chemical composition (Table S3); the most abundant minor elements are Fe, Cd, Mn, and Cu. Iron and cadmium are always present with contents up to 0.06 and 0.003 apfu, respectively; their contents positively correlate. The presence of Mn and Cu is irregular and does not reach 0.005 apfu. The chemical composition of chalcopyrite (Table S4) corresponds to the ideal formula with traces of Mn and Pb; part of its grains contains minor Ag in the range of 0.04–0.09 apfu. Tetrahedrite is almost As-free (Table S5), with determined Ag contents in the range of 1.11–1.32 apfu; Zn (1.11–1.25 apfu) is the dominant Me2+ element and, according to the recently approved nomenclature of the tetrahedrite group [29], must be named tetrahedrite-(Zn). The chemical composition of bournonite agrees well with the ideal stoichiometry (Table S6); Mn and Fe were observed only as traces. The chemical analyses of gudmundite (Table S7) show a composition close to the ideal end member, with only a minimal arsenopyrite component (up to 0.004 apfu As) and traces of Mn (0.002–0.007 apfu).

4.3.2. Tellurides

In the course of the study of the chemical composition of Bi-(sulpho)tellurides, seven mineral phases (Figure 10) were encountered: tellurobismuthite, tetradymite, tsumoite, sulphotsumoite, pilsenite, unnamed Bi2Te, and hedleyite. The chemical composition of tellurobismuthite (Table S8) is near the ideal composition of this mineral (Figure 10). Minor Sb and Pb corresponds to up to 0.12 and 0.01 apfu, respectively; S and Se were not detected.
Tetradymite is close to the ideal stoichiometry (Table S8) with Bi partly replaced by Sb up to 0.25 apfu (Figure 11) and minor contents of Pb (up to 0.01 apfu) and Se (up to 0.09 apfu). The range of the Te:(S+Se) ratio of 1.87–2.16 is near the theoretical 2:1.
The chemical analyses of tsumoite show a wide range of the Me:X ratio (Table S9), with contents of Te(+S+Se) from 45.6 to 56.4 at. % (Figure 11 and Figure 12). Abrikosov and Bankina [30] reported in the Bi-Te system a wide solid-solution (γ-phase) from 45 to 55 at. % Te; Shelimova et al. [31] published for this phase the range from 44.7 to 58.1 at. % Te; and Yusa et al. [32] from 43 to 57 at. % Te at 400 oC. These solid-solutions, centered on tsumoite, may help to explain the extensive non-stoichiometry in these parts of the Bi–Te system [33]. A part of the analyzed points (Figure 12) is already close to the composition of Pb-poor rucklidgeite [33,34], but we do not assume the presence of this phase due to the total extent of the tsumoite solid-solution. Tsumoite usually contains some Sb and Pb (up to 0.06 apfu); some grains with increased Pb contents in the range of 0.11–0.22 apfu were also observed (Figure 11 and Figure 12). In the anion part of the tsumoite, minor contents of Se (up to 0.02 apfu) and S (up to 0.15 apfu) were found (Figure 10); the sulfur and lead contents correlate positively.
One homogeneous grain shows a composition close to sulfotsumoite, with increased Fe contents in the range 0.91–0.96 apfu (Table S10) and minor contents of Pb and Sb (up to 0.06–0.07 apfu). The iron contents in the Bi-(sulpho)tellurides are unusual; due to the grain dimensions and the constant contents of Fe, the influence of the surrounding material is not probable. It is possible that this is a new mineral species with the empirical formula Fe0.93(Bi1.81Pb0.06Sb0.06)Σ1.93Te2.02S1.12, which is close to the ideal one of FeBi2Te2S.
Pilsenite is close to the ideal composition (Table S11) with minor contents of Pb up to 0.57 apfu (Figure 12) and Sb up to 0.09 apfu; traces of S are exceptional. Similarly increased Pb contents were published, e.g., by Ferenc [35] and Mikulski [36]. The chemical composition of the unnamed Bi2Te (Table S12) is near the ideal composition (Figure 10). Minor Pb and Sb correspond to up to 0.22 and 0.15 apfu, respectively (Figure 11); Se was not detected, and traces of S were exceptional. An unnamed phase with the formula Bi2Te has been published by Gamanyin et al. [37,38], Goncharov et al. [39], Huang et al. [40], Luukkonen [41], Gu et al. [42], Cook et al. [33], and Houzar et al. [43]. Phase Bi2Te was also observed during synthetic studies [30,44], and Shelimova et al. [31] reported a solid-solution (β-phase) in a Bi-Te system with a range from 33.3 to 36.6 at. % Te, which corresponds to ~Bi2Te. Hedleyite is consistent to a 7:3 stoichiometry (Table S13), and the determined contents of Sb up to 0.71 apfu and Pb up to 0.49 apfu (Figure 11) are higher than those which have been published by Cook et al. [34]. In the anion part of hedleyite, minor contents of S (up to 0.26 apfu) were found.
Silver telluride, hessite, is close to the ideal composition of this mineral (Table S14); minor contents of Pb, Bi (up to 0.02 apfu) and Au, Hg, and Sb (up to 0.01 apfu) were sometimes found. In the anion part of hessite, the dominant Te is partly replaced by S (up to 0.08 apfu).

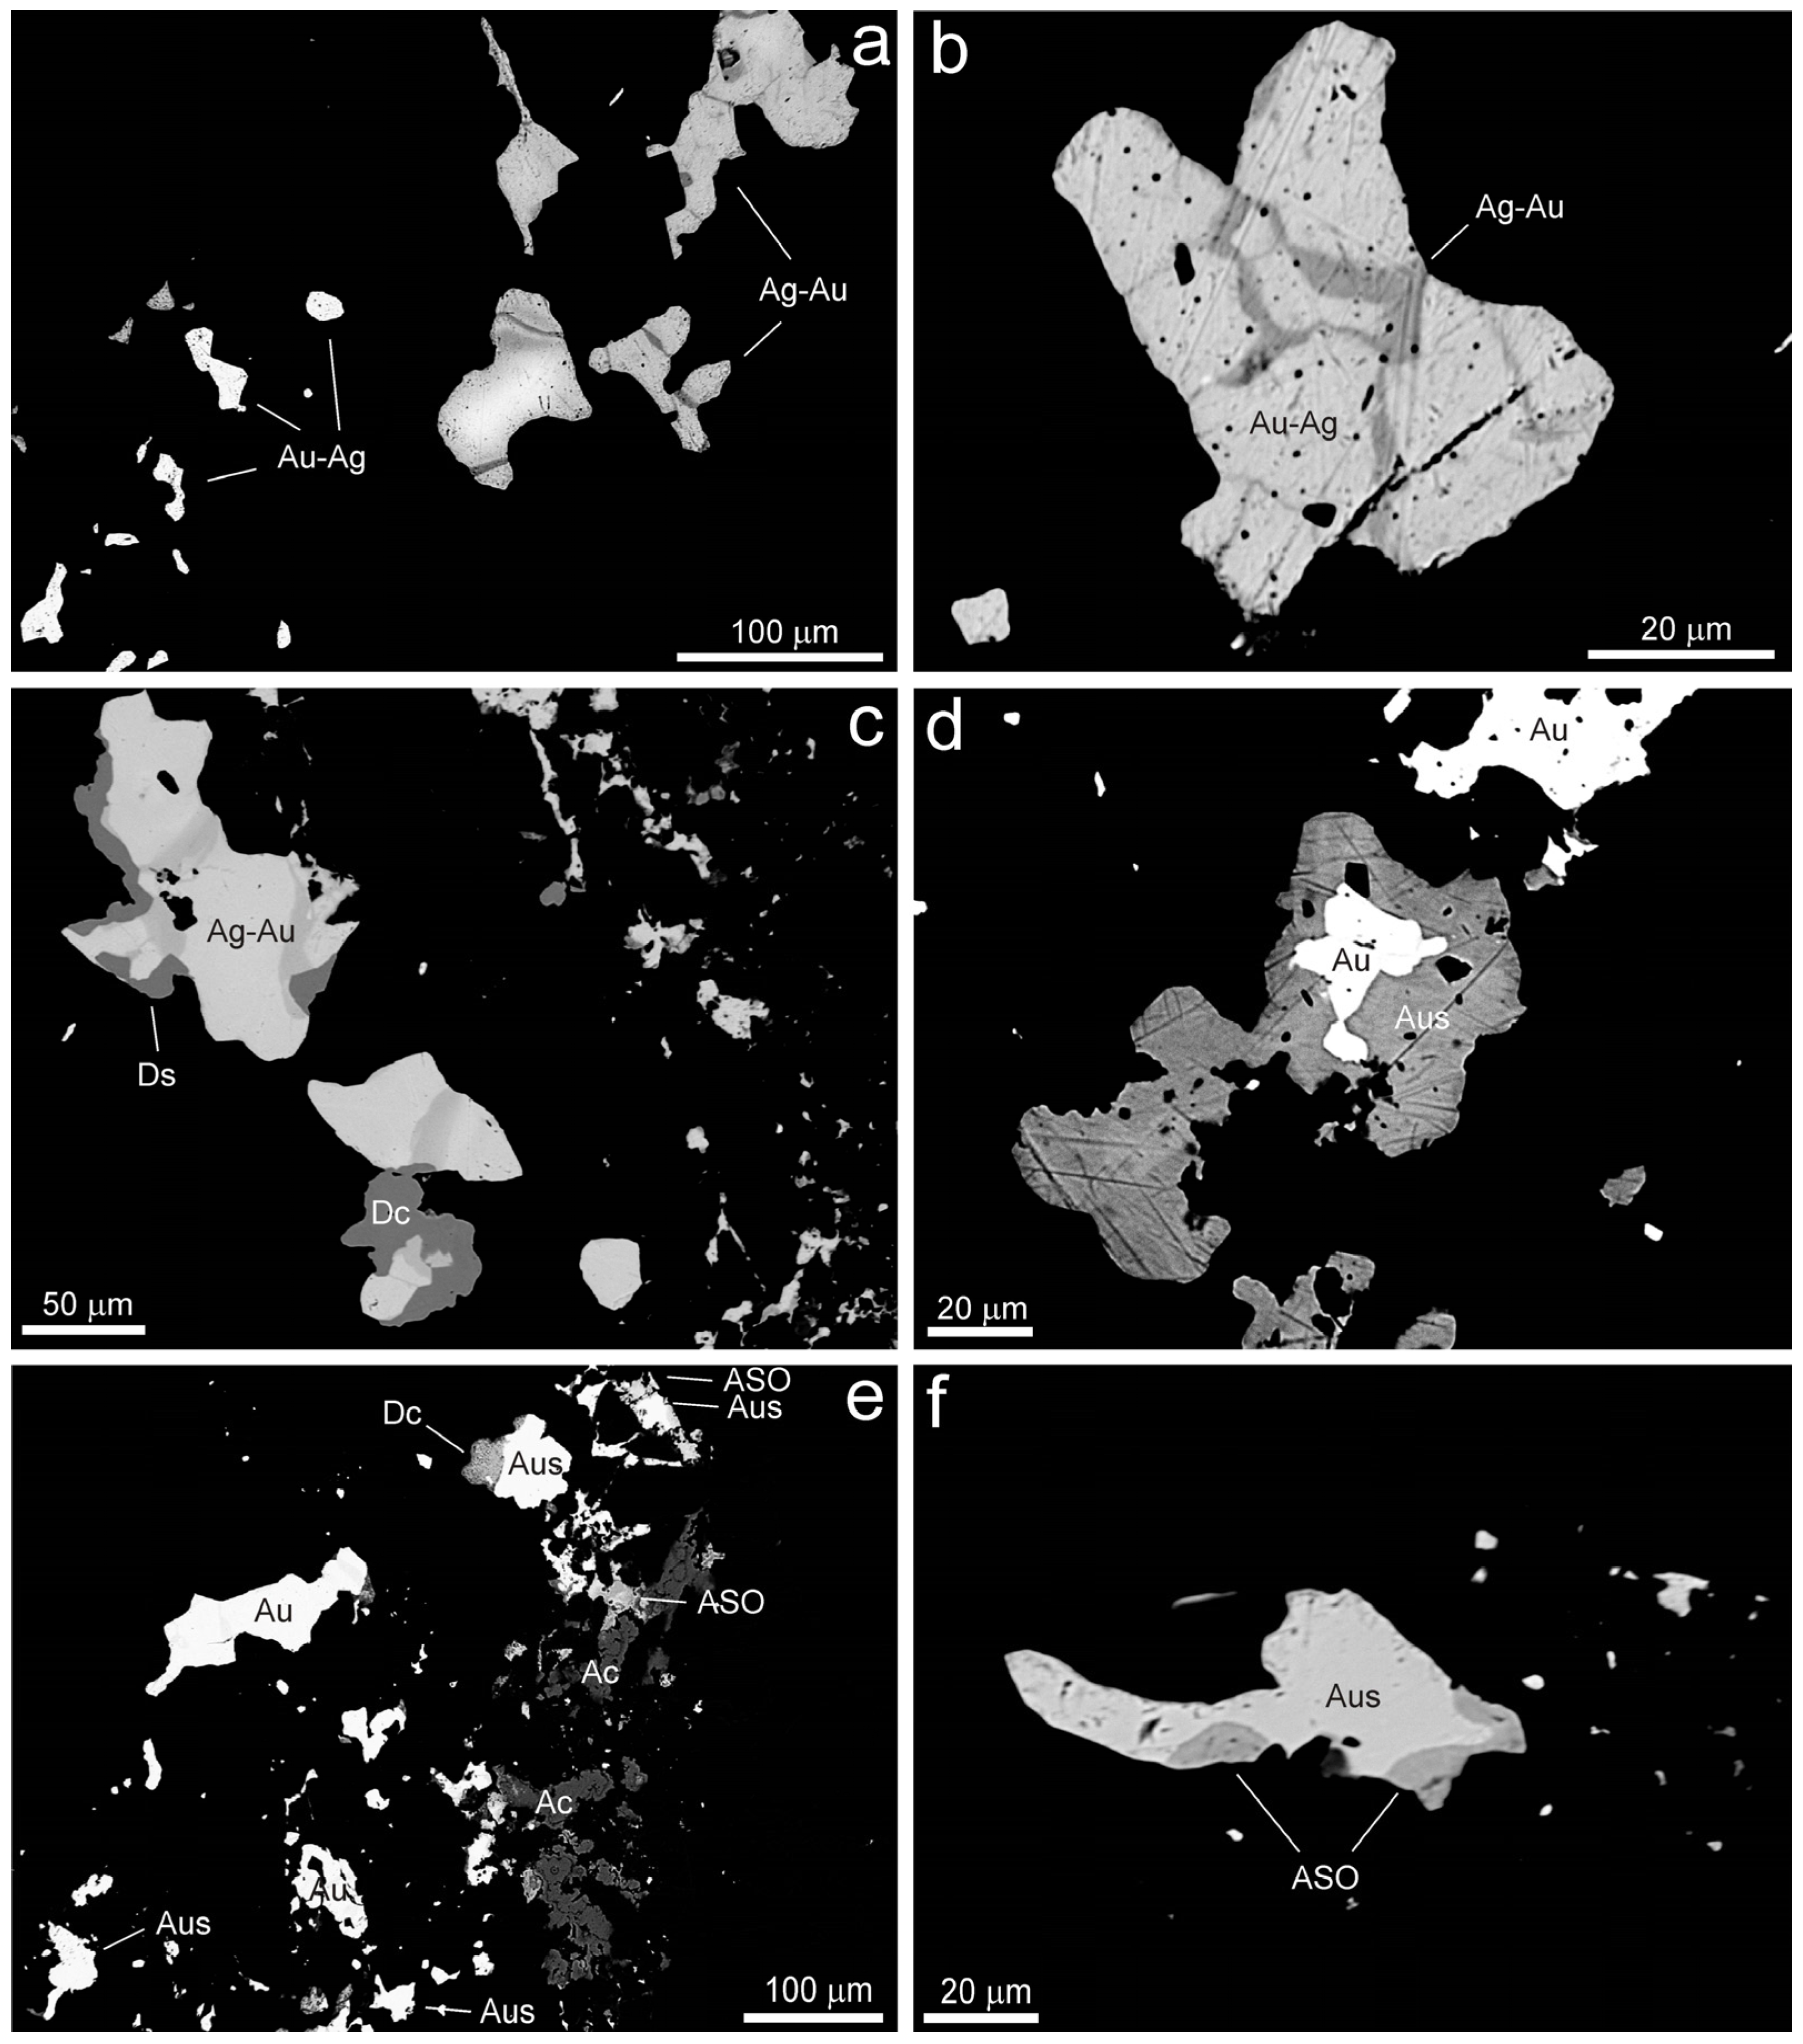
4.3.3. Elements and Alloys

The chemical composition of the minerals of the Au-Ag solid-solution (Table S15) covers a wide range, from almost pure native gold (4–7 at. % Ag) to Au-rich silver (up to 69 at. % Ag). There can be distinguished two groups of composition (Figure 13 and Figure 14); the first comprises paragenetically early gold with Ag contents in the range of 4–27 at. % (96–73 at. % Au); the second comprises paragenetically late low-fineness Au-Ag alloys (Ag-rich gold, Au-rich silver) with 32–69 at. % Ag (68–30 at. % Au). In addition to the major components (Au and Ag), the minor contents of Hg and Sb were also observed. The determined contents of Hg for both types of Au-Ag are similar (Figure 14), up to 3.7 and 2.6 at. %, respectively. In contrast, increased Sb contents (up to 1.9 at. %) are concentrated only in low-fineness Au-Ag alloys, especially in Au-rich silver (Figure 15).
The found wide range of the composition of the minerals of the Au-Ag solid-solution is uncommon; a similar range (0–70 at. % Ag) is known only for the Krásná Hora deposit [45,46]. Kalinin et al. [47] described samples from the Oleninskoe deposit comprising two groups of Au-Ag alloys with 5–22 and 53–75 at. % Ag, respectively. From the vein deposits in the Teabaeksan district, Korea, Au-Ag alloys with 36–97 at. % Ag were described [48], but high-fineness Au is not known there.
The chemical analyses of the native antimony (Table S16) show, in addition to the dominant Sb, only traces of As and Hg up to 0.006 and 0.004 apfu, respectively. Native bismuth (Table S16) contains regular contents of Sb in the range of 0.10–0.13 apfu.

4.3.4. Au-Ag-Sb Minerals

Aurostibite is usually homogeneous, and its chemical composition corresponds to the ideal AuSb2 formula (Table S17), with traces of Fe (up to 0.05 apfu) and locally Hg up to 0.02 apfu. Sporadic increased Bi contents (up to 0.05 apfu) were found in the marginal parts of some of its aggregates. A complete absence of Ag is characteristic for studied aurostibite, which is similar to that which was stated by Zachariáš and Němec [45] for aurostibite from Krásná Hora (with Ag up to 0.5 wt. %, only).
The chemical analyses of acanthite (Table S18) agree with the stoichiometry of this mineral, with minor contents of Fe (up to 0.06 apfu) and traces of As, Te, and Au up to 0.009, 0.005, and 0.003 apfu, respectively.
Dyscrasite is Sb-deficient with a ratio of (Ag+Au)/(Sb+Hg+As) in the range of 3.83–4.25 (Table S19); a similar situation is well known for this mineral phase, with a proposed ideal formula of Ag3+xSb1-x(x ≤ 0.2, [49,50]). The substantial contents of gold (0.25–0.30 apfu) are characteristic for the studied dyscrasite; the found Au contents correlate negatively with Ag (Figure 16). The analogical Au contents are published only for the dyscrasite from the Krásná Hora deposit (0.27–0.32 apfu [45] and are comparable with the maximum amount of Au (~0.33 apfu) determined in the synthetic phase ɛ corresponding to dyscrasite [51].
An unnamed (Au,Ag)Sb oxide mineral phase with a (Au+Ag)/(Sb+Bi+As+Fe+Hg+Zn) ratio in the range of 0.68–1.50 (mean 1.12), the low microprobe totals of 82.54–95.67 wt. % (Table S20), and a negative Au-Ag correlation (Figure 17) can correspond to the not-approved mineral “auroantimonate” [52,53] or AuSbO3 oxide [54]. It is also possible (Figure 18) that it can be close to the so-called mustard gold [55,56], but its usual microporous character is not observed in our samples; moreover, the presence of oxygen in this phase was confirmed by the EDS spectra.

4.3.5. Gangue Minerals

The chemical composition of white mica (Table S21) corresponds mostly to illite and less frequently to muscovite, with respect to the sum of the interlayer cations in the range of 0.58 to 0.92 apfu (Figure 19), which are dominated by potassium with small amounts of Na (up to 0.05 apfu) and/or Ca (up to 0.04 apfu). The typical features include an excess of Si above the theoretical value of 3 (3.19–3.38 apfu), coupled with increased amounts of Mg (0.03–0.13 apfu) and Fe (0.02–0.17 apfu). Al is to a small extent substituted by V and Cr (up to 0.01 apfu each). Exceptionally, slightly elevated Zn and Mn contents occurred (up to 0.03 and 0.02 apfu, respectively). A pronounced shift of the compositions of white mica towards an illitic composition can be stated in comparison with the other gold deposits, where the presence of regular muscovite is typical (Figure 19).
Chlorite (Table S22) belongs to the trioctahedral Fe-Mg-Al chlorites. Based on 14 atoms of oxygen, the Si contents range between 2.76 and 3.16 apfu, and the Fe/(Fe+Mg) ratio is between 0.72 and 0.90. In the classification scheme of Bayliss [64], they all belong to chamosite; in those of Melka [65], most of them are chamosites and two outliers fall to delessite (Figure 20). A high content of Fe is also manifested in the empirical Liardʼs diagram, where the projection points of chlorites from Bytíz fall into the fields of chlorites of the iron formations and ooidal ironstone (Figure 20). The contents of Mn, V, and Zn do not exceed 0.05, 0.02, and 0.12 apfu, respectively. In ca. 20 analyses, the elevated contents of Na and/or K occurred, pointing to the presence of an admixture of illite/smectite, supported by the positive correlation of the contents of the alkalis and Si (R2 = 0.65). In contrast, a correlation between the contents of Ca (up to 0.27 apfu) and Si does not exist (R2 = 0.01), implying that the Ca is bound in chlorite and not in the admixtures of Ca-smectite. When compared with the typical vein of gold deposits (Figure 20), the chlorites from Bytíz belong to the iron- and illite-richest compositions.
The chemical composition of monazite (Table S23) belongs to monazite-(Ce). A part of the phosphorus is substituted by minor Si (up to 0.09 apfu) and trace As (up to 0.015 apfu) and S (up to 0.007 apfu). The REEs are slightly altered, especially by Al (up to 0.10 apfu), Ca (up to 0.05 apfu), Y (up to 0.03 apfu), and Fe (up to 0.025 apfu). The contents of Th in monazite are low (up to 0.004 apfu), which is in accordance with its hydrothermal origin. Chondrite-normalized REE patterns show a gradual decrease from La to heavier REEs (Figure 21). No tetrad effect is observed in REE patterns in the area of the first tetrad (Figure 21). The Ce anomaly is essentially missing (Ce/Ce* = 0.96–1.11); the Eu anomaly is highly variable (negative, missing, or positive; Eu/Eu = 0.16–1.48). The variable Eu anomaly was observed even within the various domains of a single grain. The LaCN/SmCN ratios are mostly within the range of 3.9–7.5, but three outliers also show significantly higher values up to 23.9 (Figure 21). In comparison with the available literature data on hydrothermal monazites, the samples from Bytíz show a rather wide range of both the REE fractionation and the variability of the Eu anomaly (Figure 21).
The chemical composition of apatite (Table S24) is compatible with fluorapatite, containing 0.0–24.7 mol. % hydroxylapatite and 0.0–1.8 mol. % chlorapatite. The excess of fluorine, reported in part of the collected data (the maximum value is 1.27 apfu), may be attributed to an overestimation of the fluorine content due to its diffusion during the microprobe analysis of the grains with unsuitable spatial orientation [83]. Phosphorus is substituted by traces of As (up to 0.013 apfu) and S (up to 0.007 apfu) only; no elevated content of carbon is suggested from the well-balanced stoichiometry of this mineral (P+As+S = 2.99–3.05 apfu). The calcium is substituted by minor Fe (up to 0.05 apfu) and Mn (up to 0.016 apfu).
The WDS analyses of the TiO2 mineral (Table S25) yielded only minor admixtures of Ca (0.006–0.013 apfu) and Fe (0.001–0.010 apfu) and much lower contents of Cr, V, W, and Zr (up to 0.001 apfu each).
The K-feldspar (Table S26) is dominated by orthoclase, with minor albite, anorthite, celsian, and slawsonite components (Or91.4–97.1Ab1.3–3.5An0.3–2.5Cn0.9–2.3Sl0.0–0.5), including the slightly elevated Fe (up to 0.005 apfu).
The calcite (Table S27) contains, in addition to the dominating Ca, 0.002–0.142 apfu Fe, 0.005–0.125 apfu Mn, and up to 0.054 apfu Mg. Both the calcite from matrix of the arsenopyrite-rich vein and the calcite from the younger veinlets show largely similar chemical compositions (Figure 22).
The chemical composition of siderite (Table S28), from the different modes of occurrence, is also characterized by a rather uniform trend. The iron is substituted mainly by Mn (0.111–0.265 apfu) and, to a lesser extent, also by Mg (0.054–0.158 apfu) and Ca (0.005–0.152 apfu). The chemical composition of siderite from the Bytíz deposit corresponds to siderite and Mn-rich siderite (Figure 22) and is comparable to the pre-ore siderite I from the Jerusalem deposit (Příbram uranium and base-metal district) rather than to the post-ore siderite II (cf. Figure 22).
The carbonates of the dolomite–ankerite series (Table S29) exhibit a wide range of compositions (Dol7.5–94.0Ank3.3–60.7Ktn0.7–31.8), covering the classification fields from the dolomite via Fe-rich dolomite and Mg-rich ankerite up to Mn-rich ankerite in the classification scheme by Trdlička and Hoffman [84]. The almost linear distribution of data in the triangular plot (Figure 23) illustrates the coupled behavior of Fe and Mn. Although significant fluctuations can occur, the early portions of carbonate crystals are in general enriched in Fe and Mn, whereas the younger zones are richer in the dolomite component. This is the opposite trend to that observed by Sejkora et al. [85] in the ore vein from the Brod deposit (Příbram uranium and base-metal district), where, in addition, distinct chemical trends were detected in the two respective generations (Figure 23). The youngest recorded growth zone neighboring with the drusy cavity was found to contain elevated contents of Zn (0.016 apfu) in the studied mineralization from Bytíz. It is noteworthy that the carbonates of the dolomite–ankerite series from the matrix of the arsenopyrite–quartz–phyllosilicate vein and those from the younger veinlets cutting the above-mentioned vein do not exhibit any remarkable differences in their chemical compositions (Figure 23).

4.4. Fluid Inclusion Study

Fluid inclusions were studied in five specimens. Because of the small size of the fluid inclusions and the poor transparency of most of the studied samples, the microthermometric measurements were complicated. Suitably sized measurable fluid inclusions were found in quartz Q1-Q4, in the calcite from the veinlets, and in the carbonates of the dolomite–ankerite series from the veinlets only.

4.4.1. Fluid Inclusions in Quartz

The fluid inclusions in the quartz Q-1 were difficult to study due to their small size (up to 8 µm) and the poor transparency of the host mineral; therefore, only a few isolated fluid inclusions of uncertain origin (most probably secondary) were measured. These two-phase (F ≈ 0.85–0.9) inclusions homogenized to liquid in a wide range between 112 and 226 °C, and the last crystal of ice melted in between −0.8 and −2.2 °C; these values correspond to a salinity of 1.4–3.7 wt. % NaCl eq. We cannot exclude the possibility that these inclusions can contain, at least in part, younger fluids which are common in younger populations of quartz and exhibit the same microthermometric parameters (see below; Table 1).
The fluid inclusions in the quartz Q-2 (Figure 24a–c) were studied in thin veinlets and euhedral crystals, where they were situated mostly on short trails and in three-dimensional clusters, suggesting, in the latter case, their primary nature. They were all two-phase and liquid-rich at room temperature (F ≈ 0.85–0.9), with sizes up to 23 µm (mostly between 1 and 6 µm). They homogenized to liquid mostly in between 120 and 248 °C and, exceptionally, up to 361 °C (Table 1). The data below 120 °C very likely represent late (i.e., secondary) inclusions. This idea seems to be supported by subtle differences in their salinities (primary inclusions: 1.2–5.3 wt. % NaCl eq. based on Tm-ice = −0.7 to −3.2 °C; supposed secondary inclusions: 0.2 to 2.2 wt. % NaCl eq. equal to Tm-ice = −0.1 to −1.0 °C). A wide interval of homogenization temperatures (Figure 25a) and a narrow interval of salinities suggests the long-term evolution of one fluid of unchanged composition or the re-filling of part of the fluid inclusions by late fluids with comparably low salinities.
The fluid inclusions in quartz Q-3 (Figure 24d) were measured in a single veinlet only, fortunately crosscutting the Q-1 and Q-2 veins. Their morphology, size, and occurrence are similar to those of Q-2; however, their homogenization temperatures (mostly 245–324 °C) and salinities (2.1–7.0 wt. % NaCl eq.; Tm-ice = −1.2 to −4.4 °C; Table 1) are higher than those of most primary inclusions in the Q-2.
The temperature of initial melting (Ti) was recognized in none of fluid inclusions from the three above-mentioned generations of quartz. The inclusions in Q-1, -2, -3 had frozen on cooling down to −46 °C. This suggests Ti > −46 °C and rules out the presence of dissolved CaCl2 in the aqueous fluid. The inclusions contain low-salinity H2O-NaCl(±MgCl2±FeCl2) fluid.
The fluid inclusions in the late quartz Q-4 (Figure 24e) were mostly monophase. Those which were two-phase and liquid-rich (F ≈ 0.95; up to 20 µm in size) were occasionally identified in the form of discontinuous planes (pseudo-secondary inclusions) or three-dimensional clusters (primary inclusions). Two types of fluids were distinguished: low-salinity (0.2–0.7 wt. % NaCl eq.; Tm-ice = −0.1 to −0.4 °C), with TF ≈ −40 °C and a homogenization temperature (Th) in between 104 and 161 °C, and high-salinity (14.1–18.9 wt. % NaCl eq.; Tm-ice = −10.1 to −15.2 °C) with Th = 76–123 °C (Table 1). The freezing temperatures (−52/−65 °C) of the high-salinity inclusions suggest the presence of dissolved CaCl2 in the aqueous fluid. In one case, the low- and high-salinity inclusions occurred as spatially associated in a single relatively large three-dimensional cluster situated around the center of the crystal without clear evidence of the relative chronology of both types of fluids; another quartz crystal contained only high-salinity inclusions. This suggests two separate hydrothermal episodes involving two different types of fluids with contrasting compositions. The monophase fluid inclusions exhibited identical salinities to those of the neighboring two-phase fluid inclusions.

4.4.2. Fluid Inclusions in Carbonate Minerals

The primary fluid inclusions in dolomite–ankerite (Figure 24f,g) were situated on the growth zones or uniformly distributed in the crystals as solitary inclusions. They were mostly two-phase and liquid-rich (F ≈ 0.85–0.9) and less often all-liquid, with mostly regular morphology and sizes up to 35 µm. The L+V inclusions homogenized to liquid mostly in the wide range of 84–216 °C; two higher values (235 and 256 °C) probably represent partially leaked inclusions. Their salinities also have a range with a wide interval (1.6–23.4 wt. % NaCl eq. based on Tm-ice = −0.9/−21.3 °C; Table 1). The Ti = −56 °C observed in one high-salinity inclusion indicates the presence of H2O-NaCl-CaCl2 fluid, which is supported by the low freezing temperatures of most of the inclusions (TF = −58 to −67 °C). Few of the low-salinity (≤5.3 wt. % NaCl eq.) inclusions froze out at −46 °C, which points to the absence of CaCl2. Within a single growth zone, there occurred inclusions with a limited range of salinities within up to ~5 wt. %. A continuous change of fluid salinity was documented across various growth zones in a single grain of dolomite–ankerite, which is consistent with the evidence on the compositional changes of host mineral phase visible in the BSE images. The available fluid inclusion data suggest the mixing of at least two fluids with contrasting temperatures, salinities, and salt compositions during the crystallization of the dolomite–ankerite (Figure 25a).
The calcite-hosted fluid inclusions (Figure 24h) were mostly two-phase (F ≈ 0.85–0.9) and liquid-rich and sometimes monophase all-liquid, with sizes between 8 and 60 µm. They had mostly regular, three-dimensional morphology sometimes close to negative crystal shape and were situated on growth zones (primary inclusions) or within short trails (pseudo-secondary inclusions). They homogenized mostly in the range of 62–127 °C; two higher values (143 and 178 °C) probably represent partially leaked inclusions. The last crystal of ice melted between −1.5 and −3.2 °C, which corresponds to salinities of 2.6–5.4 wt. % NaCl eq. (Table 1). The temperature of the initial melting was not observed; however, freezing temperatures down to −48 °C rule out the presence of dissolved CaCl2 in the aqueous fluid.

5. Discussion

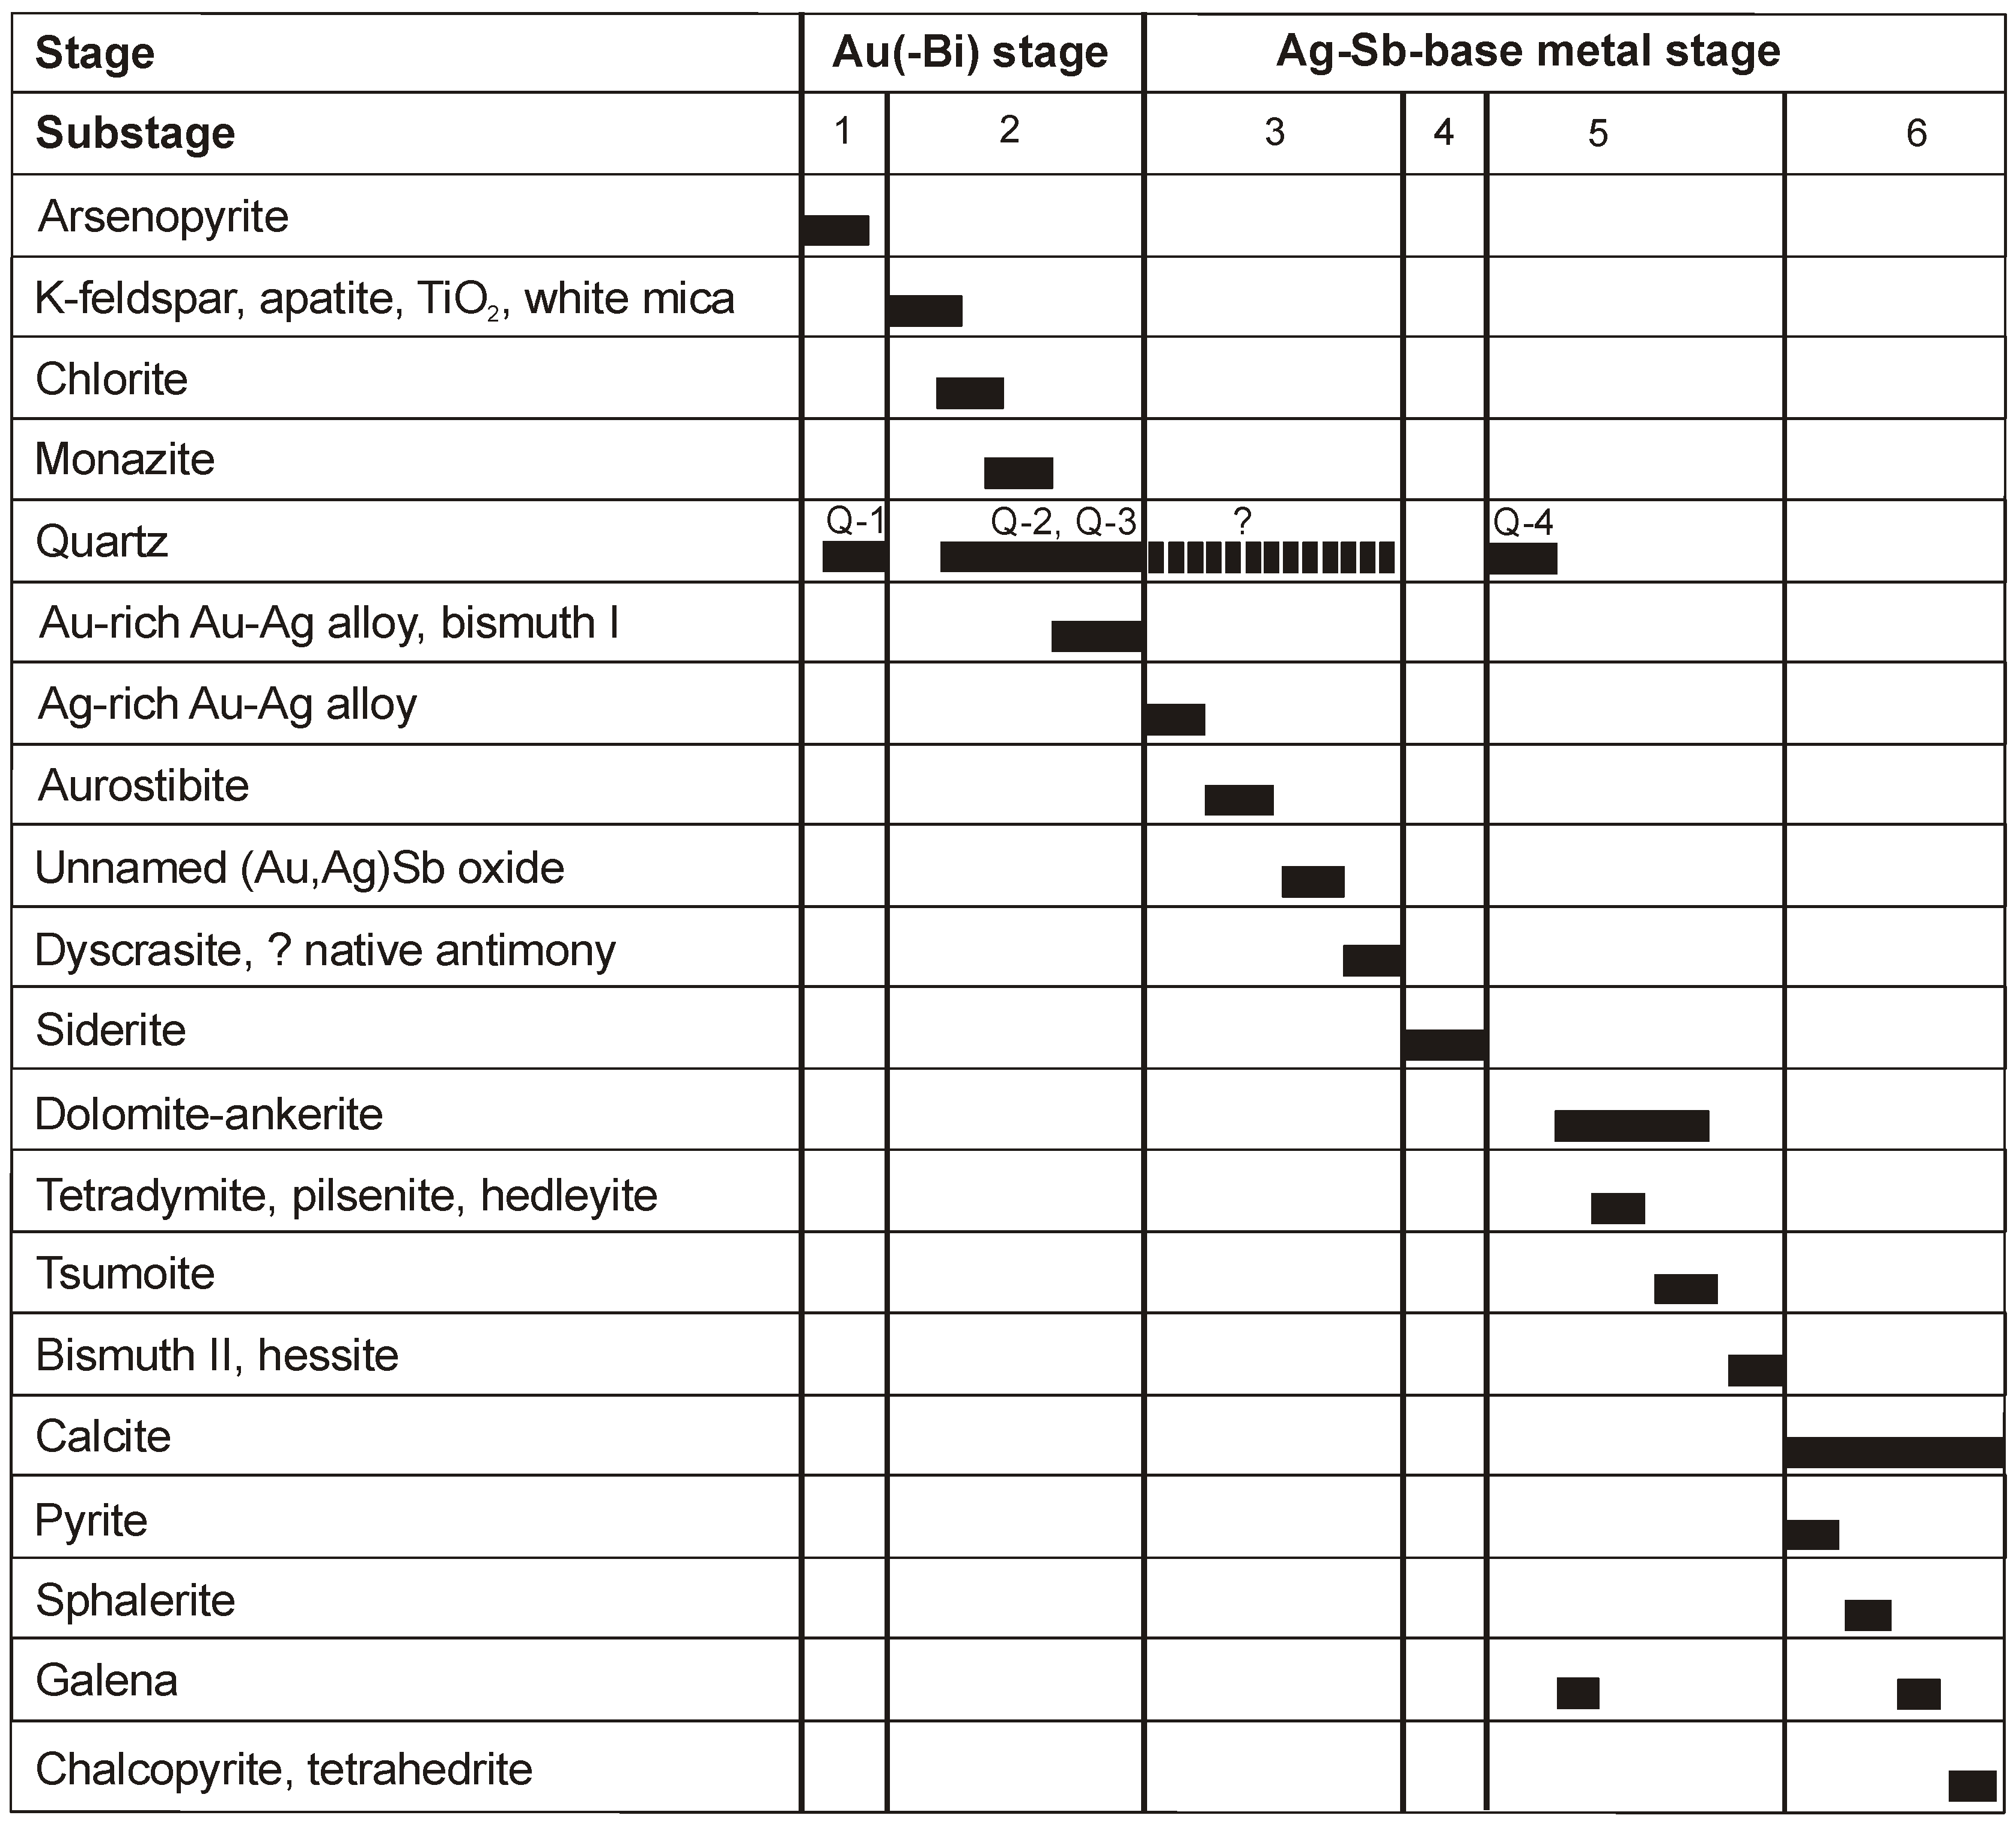
5.1. Paragenetic Sequence

A multistage origin of the studied mineral assemblage is clearly indicated from the textural relationship of the ore and gangue minerals, although the construction of a paragenetic scheme is difficult due to the frequent presence of isolated grains of many phases and thus the absence of mutual contacts among many minerals. The situation is also complicated by frequent replacement of older mineral phases by younger ones, which took place especially in the case of the pairs: Au-Ag alloys→aurostibite, Au-Ag alloys→galena, aurostibite→unnamed (Au,Ag)Sb oxide, tsumoite/hedleyite→hessite, or tellurides→tsumoite. The detailed studies of the chemical compositions of the carbonates present in the various (often complicated) textural positions showed the fully comparable ranges of the chemical compositions of matrix- and veinlet-hosted carbonates, suggesting the presence of only a single generation of each carbonate. This finding stressed the role of the replacement processes involving gangue minerals during the younger stages of the evolution of the studied vein hydrothermal system. Based on the textural relationships, the overall carbonate sequence siderite→dolomite-ankerite→calcite took place. The generalized paragenetic sequence is illustrated in Figure 26.
The available data suggest the presence of two main mineralization events: the older Au(-Bi) stage and the younger Ag-Sb-base metal one. The early Au(-Bi) mineralization comprises two substages; the earlier one is characterized by the crystallization of arsenopyrite and quartz Q-1, which is followed after its cataclasis by bismuth I and Au-rich gold associated with the gangue composed of quartz Q-2 and Q-3, white mica, chlorite, apatite, TiO2 mineral, monazite, and K-feldspar. The later Ag-Sb-base metal stage was initiated by the invasion of the Ag-Sb-rich fluids, which partly reacted with the native metals deposited during the Au(-Bi) stage, resulting in the formation of Ag-rich Au-Ag alloys, aurostibite, and probably also unnamed (Au,Ag)Sb oxide. Because the formation of these phases is spatially restricted only to the grains of pre-existing Au-rich Au-Ag alloys, the relationship of these ore phases to the oldest carbonate, represented by siderite, remains texturally unconfirmed. However, with respect to the completely absent signs of the alteration of siderite, which is expected to occur during the high-Eh episode associated with the formation of the unnamed (Au,Ag)Sb oxide (see below or Tolstykh et al. [54]), we suggest that siderite postdates the formation of (Au,Ag)Sb oxide. The remobilization of native bismuth, which occurred during the following substage, characterized by the overall formation of quartz (Q-4) and dolomite–ankerite gangue, led to the crystallization of the rare earlier Bi-tellurides (tetradymite, Fe-sulphotsumoite, tellurobismutite, pilsenite, hedleyite), followed by the more abundant tsumoite. The Bi-tellurides were later partly replaced by the assemblage hessite+bismuth II. The last substage is characterized by the formation of calcite gangue containing grains of base-metal sulfides. The position of acanthite and native antimony, which are very scarce in the vein fill, remains unresolved. They could be potentially related to either the activity of Ag-Sb-rich fluids initializing the Ag-Sb-base metal stage or the formation of the late calcite-hosted polymetallic sulfidic assemblage. Similarly, the formation of Sb oxide might be associated with the increase in redox potential associated with the formation of unnamed (Au,Ag)Sb oxide, but the textural evidence for coeval formation of both phases is missing.

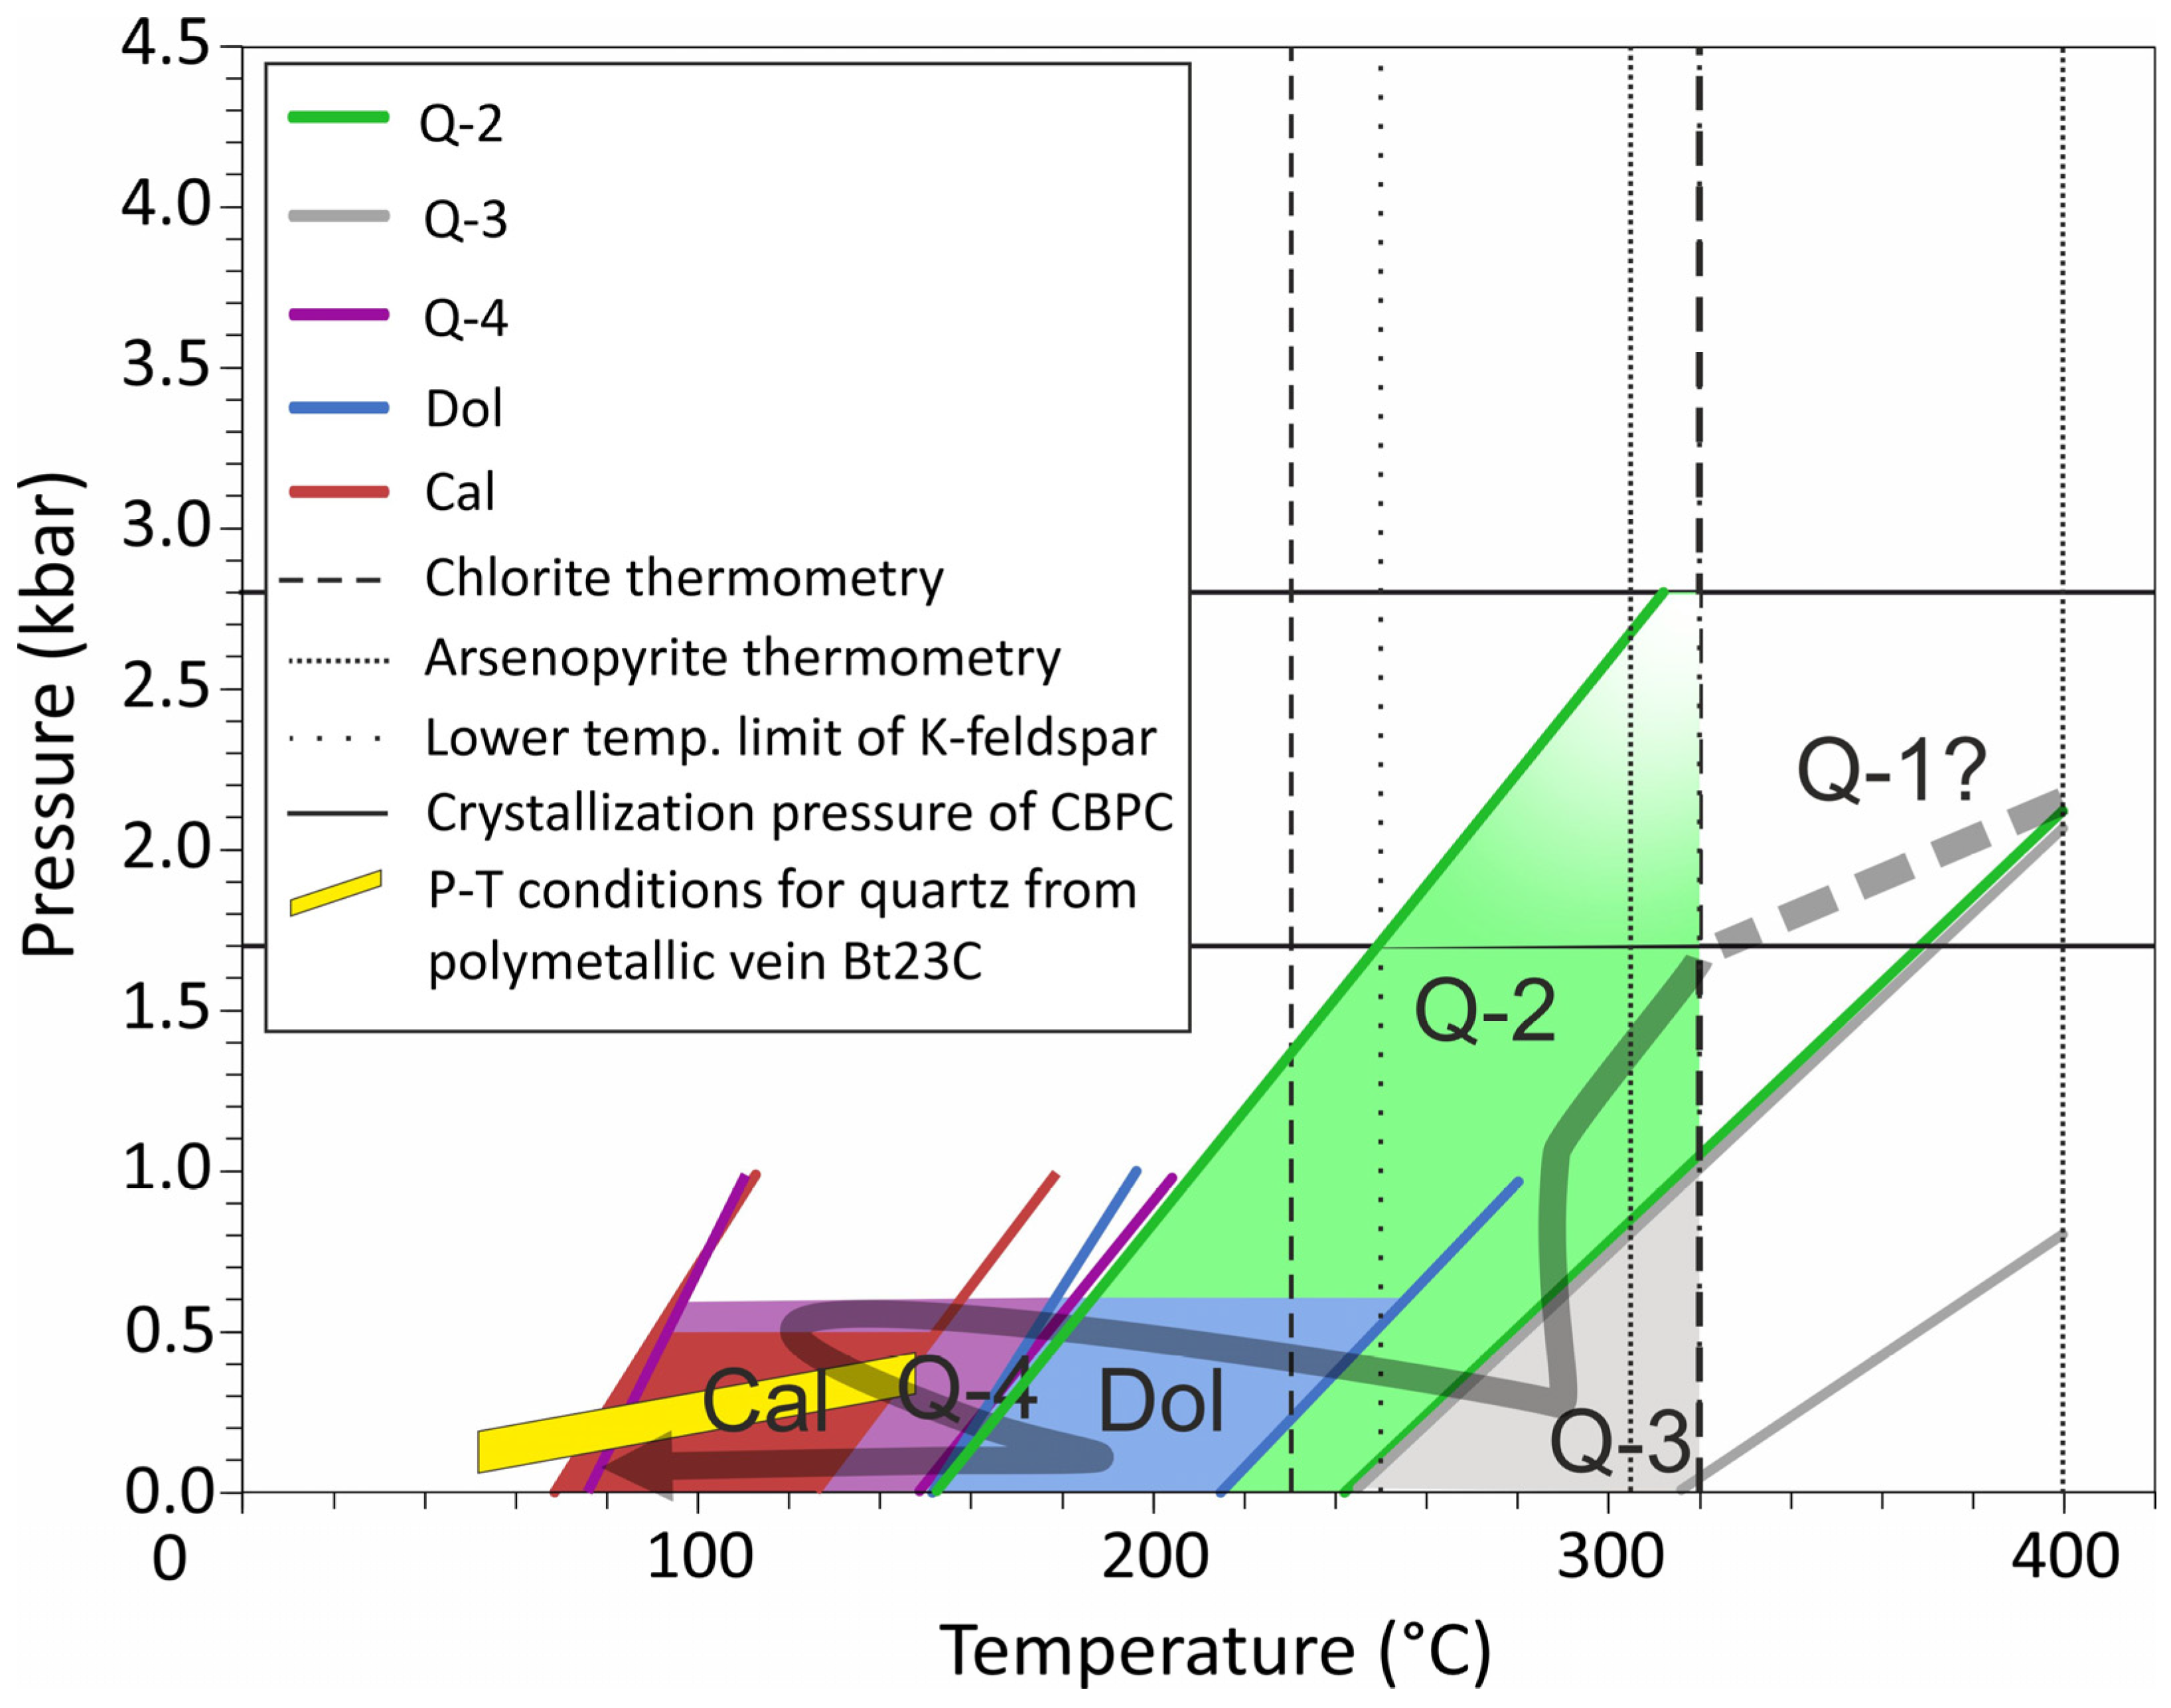
5.2. Formation Conditions

All the fluid inclusions present in the studied host minerals show (i) rather stable phase proportions, (ii) limited ranges of homogenization temperatures, and (iii) only a liquid homogenization mode, indicating that the fluids were trapped from homogeneous aqueous solutions. In such a situation, the P–T conditions of the studied mineralization can be interpreted using a combination of the isochores of the fluid inclusions and independent estimates of the temperature and/or pressure (see, e.g., Morishita [88]; Morishita and Nishio [89]).

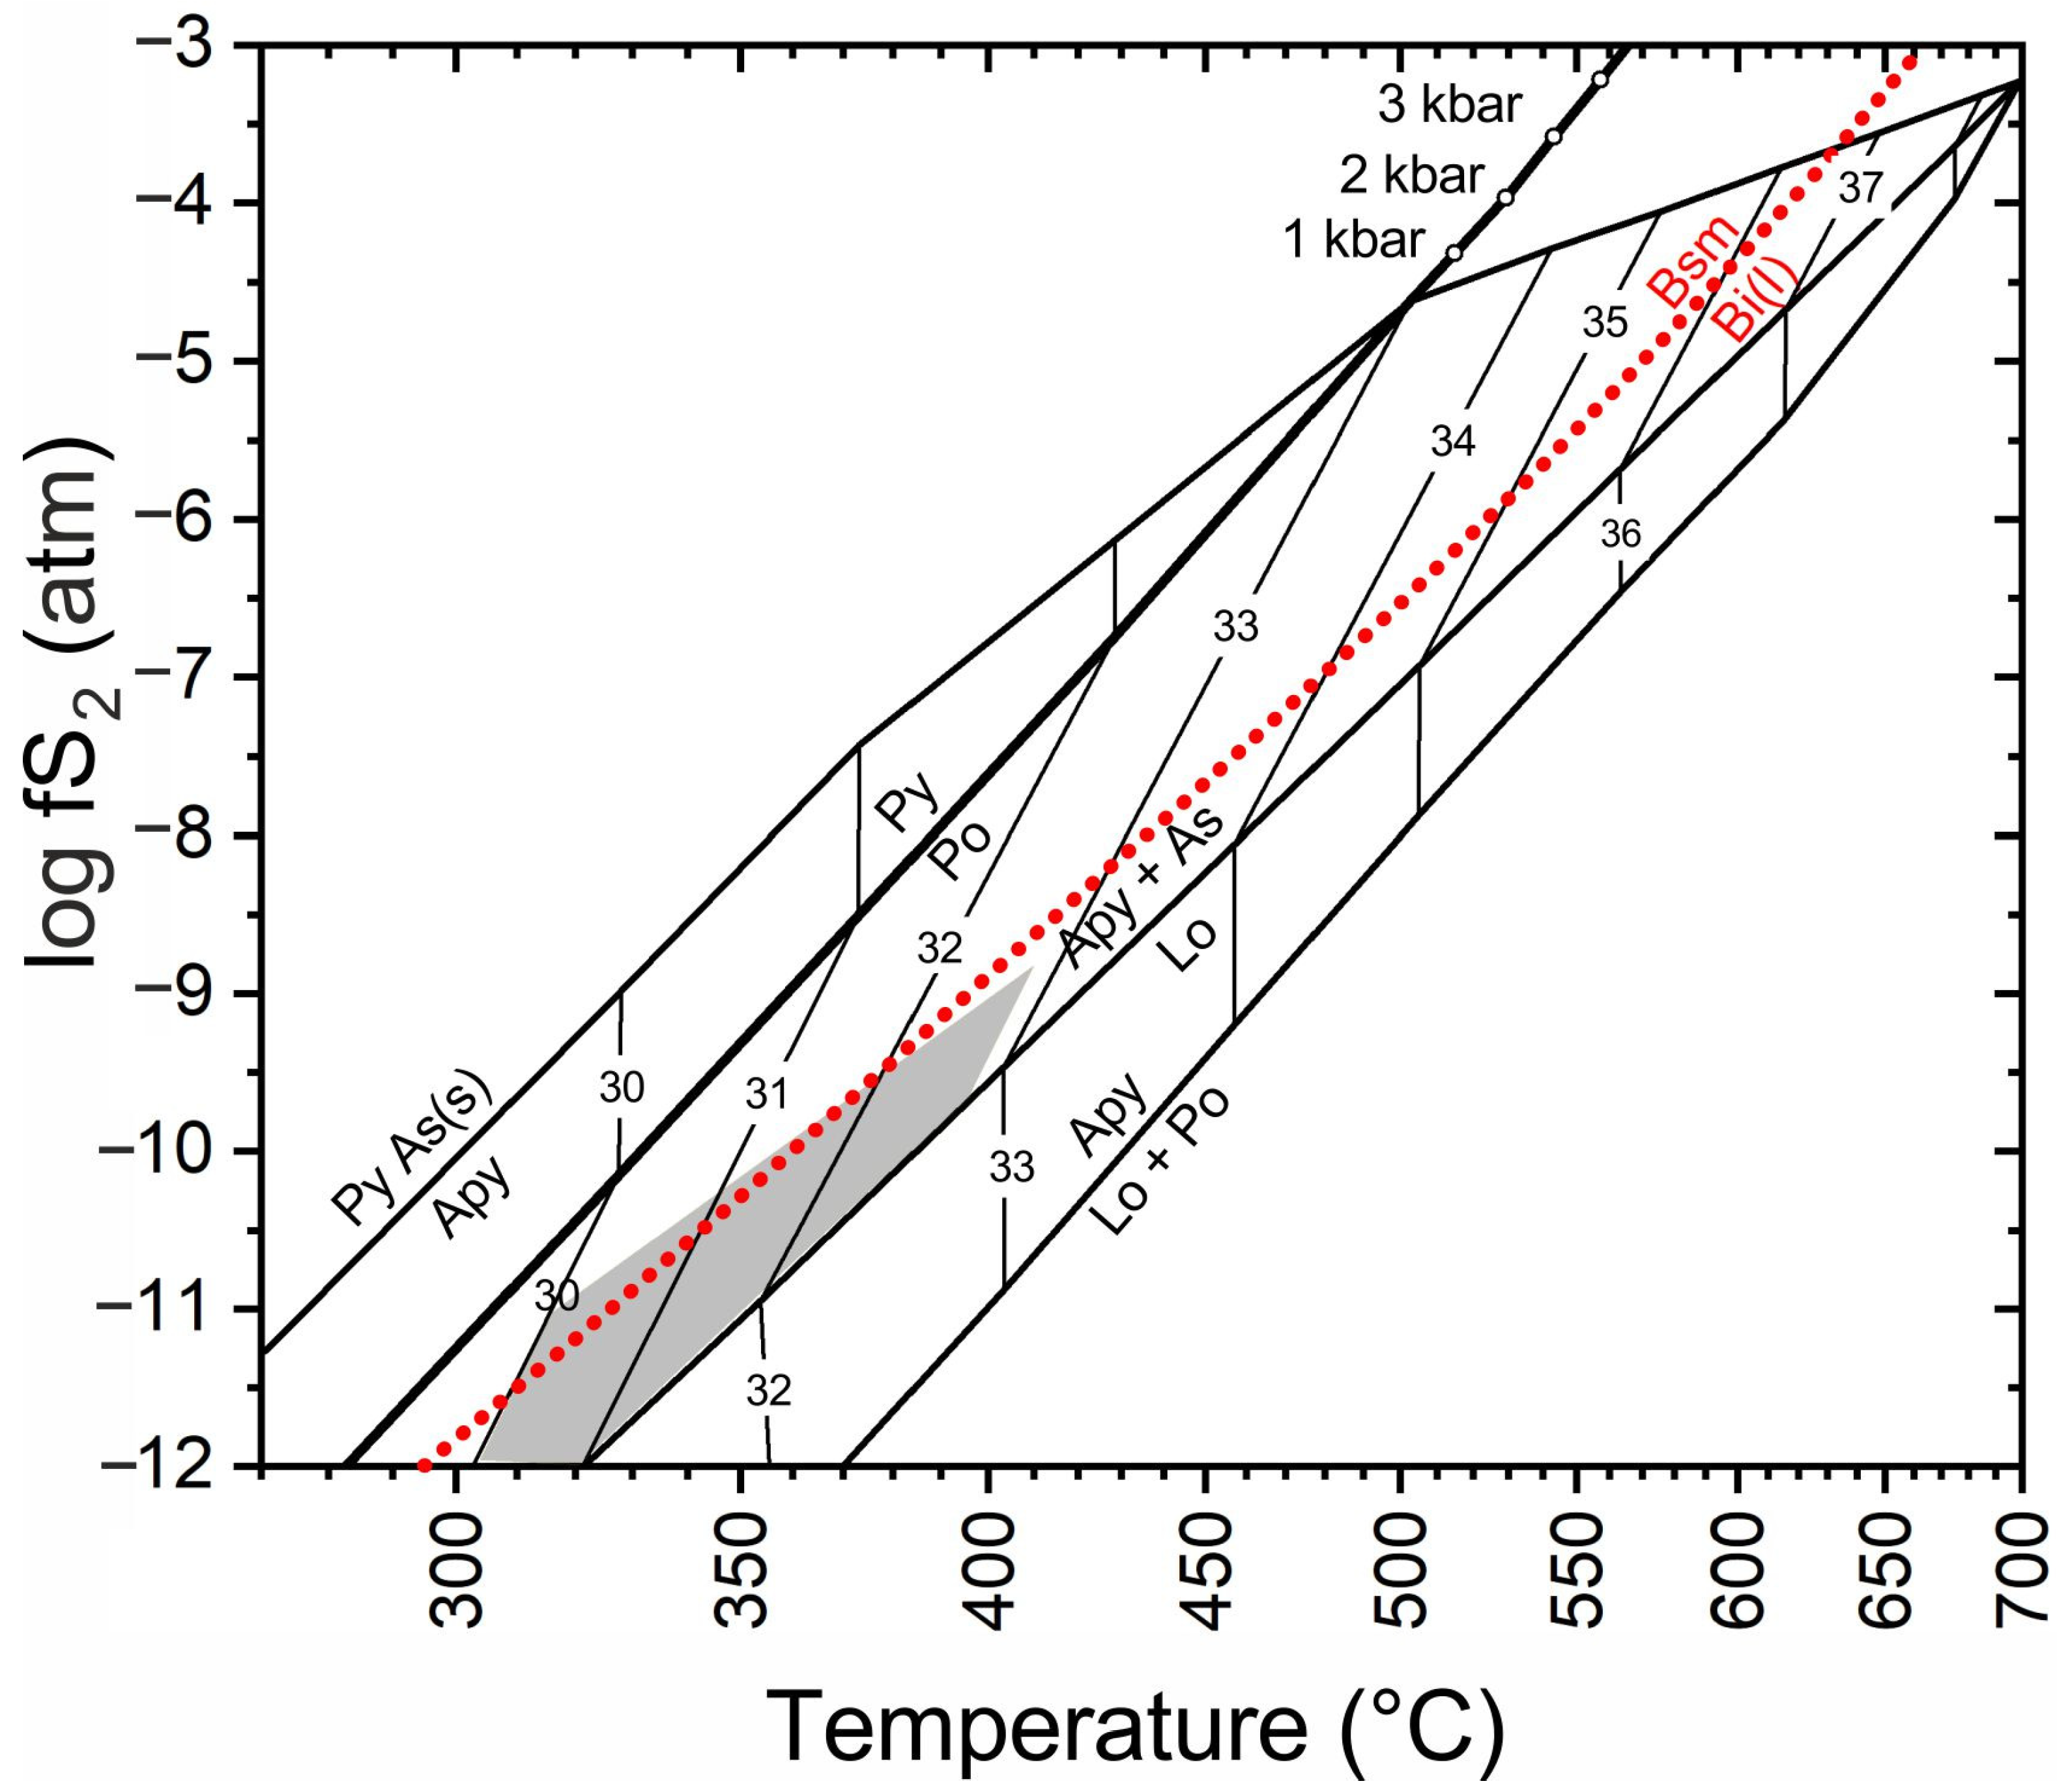
5.2.1. Au(-Bi) Stage

The earliest portion of the studied vein is composed of arsenopyrite and quartz Q-1. The As content of the arsenopyrite from the gold-bearing quartz veins at Bytíz varies from 28.3 up to 32.7 at. % As (Table S1). Its apparently bimodal distribution with peaks at ~30 and ~32 at. % As may indicate two episodes of arsenopyrite formation. For the application of arsenopyrite thermometry [25,26], knowledge of sulfur fugacity is required. This may represent a difficult task in the absence of coexisting phases such as löllingite, pyrrhotite, or pyrite. We can therefore rely only on the presence of native Bi and on analogy with other gold deposits in the region (e.g., Krásná Hora, Němec, and Zachariáš [46]). This suggests an arsenopyrite formation at temperatures of 400–300 °C (Figure 27). This range is analogous to the formation temperature of early quartz veins with arsenopyrite from the Krásná Hora deposit (28.2–30.7 at. % As [46]). The two deposits thus show significantly lower As contents in the arsenopyrite than in the ”intrusion-related gold deposits“ of the regions of the Mokrsko (31.0–36.5 at. % As; Zachariáš et al. [53]) and Petráčkova Hora (35.9–38.3 at. % As; Zachariáš et al. [90]) deposits, where the arsenopyrite crystallized at significantly higher temperatures. As the temperatures obtained by arsenopyrite thermometry can be sometimes overestimated (e.g., [25,91,92]), an additional comparison with the available temperature data is necessary. It is evident from the geological situation that the studied Au-bearing vein is a Variscan mineralization, which was formed after the emplacement of the granitic rocks of the Central Bohemian Plutonic Complex (Figure 3). The regional Variscan thermal overprint of Neoproterozoic sediments is poorly constrained, but the available data suggest that it was comparable or slightly above 100–310 °C, which is suggested by the overlying Paleozoic sediments (Suchý et al. [93]). However, the much more intensive local thermal overprint of Neoproterozoic rocks is documented in an up to 2 km wide area adjacent to the intrusion of the Central Bohemian Plutonic Complex [94], which also includes the study site (Figure 3). Moreover, there are present hydrothermal veins in the Neoproterozoic sediments of the Teplá-Barrandian unit, which crystallized from fluids, whose temperature was higher than the temperature of the regional Variscan thermal overprint (see, e.g., Žák and Dobeš [87]; Dolníček et al. [95]). Hence, it can be concluded that the temperature estimates based on arsenopyrite thermometry need not be necessarily unrealistic. Because the character of the content of the fluid inclusions hosted by the quartz Q-1 associated with arsenopyrite is questionable, the P–T formation conditions of this mineralizing event cannot be checked by this technique. In any case, it is probable that the pressure during this early stage was comparably high or lower than the pressures calculated for the crystallization of the granitoids of the adjacent part of the Central Bohemian Plutonic Complex (1.7–2.8 kbar; Janoušek et al. [96]).
There are several lines of evidence that show that the younger portion of the Au(-Bi) stage formed at lower temperatures. A temperature range between 210 and 320 °C is indicated from chlorite compositional thermometry, based on the amount of tetrahedral Al [77]. We have excluded from this estimate the temperatures obtained from the alkali-enriched chlorite analyses, in which the amount of Si is shifted by the admixture of illite and/or smectite, giving rise to underestimated temperature values (Figure 20). In accordance with this temperature range is also the presence of K-feldspar in the vein paragenesis, which is stable at temperatures of at least ca. 250 °C under hydrothermal conditions [97]. A temperature variability during this younger portion of the Au(-Bi) stage may be also indicated by the highly variable Eu anomaly [98] in monazite. The negative Eu anomaly is typical for a high-temperature environment and/or reducing conditions, in which Eu is present in a divalent state (Eu2+), which has, in comparison with Eu3+, too large size to be incorporated into the crystal structure of many hydrothermal minerals. The evolution towards the positive Eu anomaly may thus suggest a decrease in the temperature of the hydrothermal fluid below the value, under which the thermochemical oxidation of Eu2+ to Eu3+ occurs. The exact temperature depends on the chemical composition of the fluid, but for common (non-extreme) fluid compositions, it is close to ca. 200 °C [99,100,101], which is in line with the lower temperature limit suggested by chlorite thermometry. Alternatively, a change in the character of the Eu anomaly can be explained by an increase in the redox potential of the initially low-Eh fluids (see, e.g., Lee et al. [102]), which can also be compatible with the elevated contents of the redox-sensitive elements present in the high oxidation state (i.e., S6+ and As5+) in some of the studied monazites. Nevertheless, the available data suggest a long-lasting evolution of the hydrothermal system at this stage, associated with a progressive cooling from ca. 320 °C to ca. 180 °C (Figure 28). This interpretation is also supported by the fluid inclusion data from the contemporaneous Q-2 and Q-3 quartz: the distinct sub-horizontal data distribution in the Th-Tm plot (Figure 25a) can be associated with the changes in temperature, pressure, or both variables during the long-lasting evolution of a single fluid. The pressure conditions were estimated using the above-mentioned independent thermometers and isochors of the fluid inclusions present in the associated quartz (Figure 28). At this substage, we again presuppose that the formation pressure did not exceed those attained during the crystallization of the granitoids, which seems reasonable in the context of the late-Variscan evolution of the area commonly characterized by rapid uplift and erosion (Dörr and Zulauf [103]).
The unusually large spread of the LaN/SmN ratios of monazite, exceeding those of most occurrences of hydrothermal monazites (Figure 21), suggests a wide range of the fractionation of REE. This is possible to achieve in hydrothermal fluids enriched in strong REE-fractionating ligands, especially fluoride, hydroxide, or carbonate anions, which form, according to the experimental works, the strongest complexes with REE, having thus the best potential for fractionation of REE (see, e.g., Wood [104]; Bau and Möller [101]; Migdisov and Williams-Jones [105]). The mineral composition of the studied mineralization together with the chemical composition of the fluid inclusions indicate that hydroxide and carbonate anions were probably not the case as they are stable in strongly alkaline environment only. By contrast, the fluoride anions may be suitable candidates since elevated contents of F were present in the parent fluids, as is suggested by the chemical composition of apatite.
The ultimate primary source of gold for the discussed early mineralization remains unclear. Arsenopyrite contains an elevated content of gold in the range between 0.00041 and 0.00066 apfu. Such rather homogeneous values suggest that Au atoms are bound in the structure of arsenopyrite (i.e., ”refractory gold“) and not as (sub)microscopic inclusions of the native metal. The Au-bearing arsenopyrite may thus be potentially suggested as a source of Au for the subsequent deposition of the relatively coarse-grained, high-fineness native metal, assuming the remobilization of Au from arsenopyrite by younger fluids. Although the arsenopyrite was the subject of intense fracturing and cataclasis, there are observed no marks of a pronounced dissolution of this mineral phase by the younger fluids. Therefore, it seems probable that the Au for the precipitation of high-fineness Au-Ag alloys was brought by hydrothermal fluid. The clear spatial association of the arsenopyrite and the grains of high-fineness Au-Ag alloys might thus be explained by arsenopyrite as a suitable geochemical (or electrochemical) substrate for Au precipitation from Au-bearing fluid.

5.2.2. Ag-Sb-Base Metal Stage

Although the variations in the chemical composition of Au-Ag alloys can be caused by changes in some parameters (Au/Ag ratio, temperature, sulfur fugacity, pH, Eh, chloride concentration) of a single fluid (Shikazono and Shimizu [106]; Morrison et al. [107]; Gammons and Williams-Jones [108]), we suggest that our mineralogical and chemical evidence suggests the participation of another fluid with a contrasting composition. The formation of the early portion of the younger Ag-Sb-base metal stage (Figure 26) was initiated by the infiltration of Sb-rich fluids, which altered the grains of the early Au-Ag alloy, giving rise to replacement rims or total pseudomorphs formed by aurostibite. The increase in Ag content in fluids due to leaching of silver from dissolved high-fineness Au-Ag grains and the precipitation of virtually Ag-absent aurostibite, possibly combined with the primary high content of Ag in the Sb-rich fluids, led to the crystallization of the younger population of Au-rich dyscrasite and Au-Ag alloys with lower fineness and sometimes also increased the content of Sb. The end of this episode was characterized by an increase in the oxygen fugacity of the fluid, allowing the formation of unnamed (Au,Ag)Sb oxide (Tolstykh et al. [54]) and possibly also native antimony and an Sb oxide. The direct evidence of temperature conditions during this early portion of the Ag-Sb-base metal stage is missing.
The mineral composition of the younger portion of the Ag-Sb-base metal stage can be largely parallelized with the typical vein base-metal mineralization of the Příbram ore district. The base-metal mineralization is usually characterized by the predominance of carbonates over quartz in the vein fill, with the typical carbonate sequence siderite→dolomite-ankerite→calcite and the presence of common Pb-Zn(-Cu-Ag) sulfides. The only difference is in the presence of tellurides in the dolomite gangue from the studied Au-bearing vein. Nevertheless, accessory tellurides locally appeared in the earlier gold-bearing vein mineralization of this district [8,9,10], from which they could be potentially remobilized. The chemical composition of the carbonates and sulfides also follows identical trends in both the studied Au mineralization and the typical base-metal ore veins of the Příbram ore district. Genetic similarities confirmed the data from the fluid inclusion study by Ulmanová et al. [5], which included samples from base-metal vein Bt23C crosscutting the studied Au-bearing vein, which yielded broadly overlapping data clusters (Figure 25). There is also the coincidence with the data published by Žák and Dobeš [87] for base-metal ore mineralization from other localities in the Příbram ore district (Figure 25b). Taken together, the paragenetic, chemical, and fluid inclusion data clearly indicate that the younger portion of the mineral assemblage of the studied Au-bearing vein originated from fluids giving rise to the base-metal mineralization of the Příbram ore district. The temperature conditions decreased from ca. 250 to 50 °C during the paragenetic evolution of the base-metal mineralization (cf. Žák and Dobeš [87]; Dolníček et al. [6]), which is consistent with our fluid inclusion data (Figure 28). The uppermost temperature limit at 250 °C is in accordance with the nature of assemblage of the native bismuth and hedleyite (Figure 8d), whose textural arrangement is far from those indicating their crystallization from the melt, which is stable above 266 °C [75]. The pressure conditions were below ca. 0.5 kbar during this stage (Žák and Dobeš [87]; Ulmanová et al. [5]).

5.2.3. Origin of Fluids

The composition of the fluids involved in the formation of the early Au(-Bi) stage at Bytíz is different from those characterizing the gold-bearing veins in the wider area, in which the circulation of aqueous solutions postdates the activity of the aqueous-carbonic fluids (see, e.g., Zachariáš et al. [90,109,110]). The source of low-salinity, gas-absent aqueous fluids was likely not in the magmatogenic fluids exsolved during the crystallization of the granitoids of the Central Bohemian Plutonic Complex (see, e.g., Zachariáš et al. [90]; Žák et al. [110]), but such fluids can be potentially generated by the thermal alteration of the host Neoproterozoic sediments caused by the intrusion of granitoid rocks. Such a scenario would also be consistent with the relatively high temperatures inferred from arsenopyrite thermometry. Nevertheless, future specialized (i.e., isotopic) investigations are needed to test this hypothesis.
The origin of base-metal fluids is better constrained by the previous fluid inclusion and stable isotope studies. In this case, the participation of three fluid endmembers is suggested in the Příbram ore area. The early base-metal mineralization of the siderite–sulfidic stage crystallized from the aqueous fluids characterized by high temperatures (200–300 °C), high salinities (14–23 wt. % NaCl eq.), strongly positive δ18O values (+6 to +10 ‰ V-SMOW), and a well-mixed δ13C signature (−16 to −15 ‰ V-PDB), which are interpreted to be sourced from the deep circulation in the hot crustal rocks [5,6,87]. The superimposed uranium mineralization was formed from low-temperature (<150 °C), low-salinity (<5 wt. % NaCl eq.), near-zero δ18O (−3 to +3 ‰ V-SMOW) fluids, which were dominated by shallowly circulating surficial waters [5,6,87]. Finally, the participation of low-temperature (<150 °C), high-salinity (up to 30 wt. % NaCl eq.) Ca-Na-Cl solutions was found during the late stages of hydrothermal activity, representing either external brines of marine provenance or locally produced “shield brines” [5,6,87].

6. Conclusions

(1)
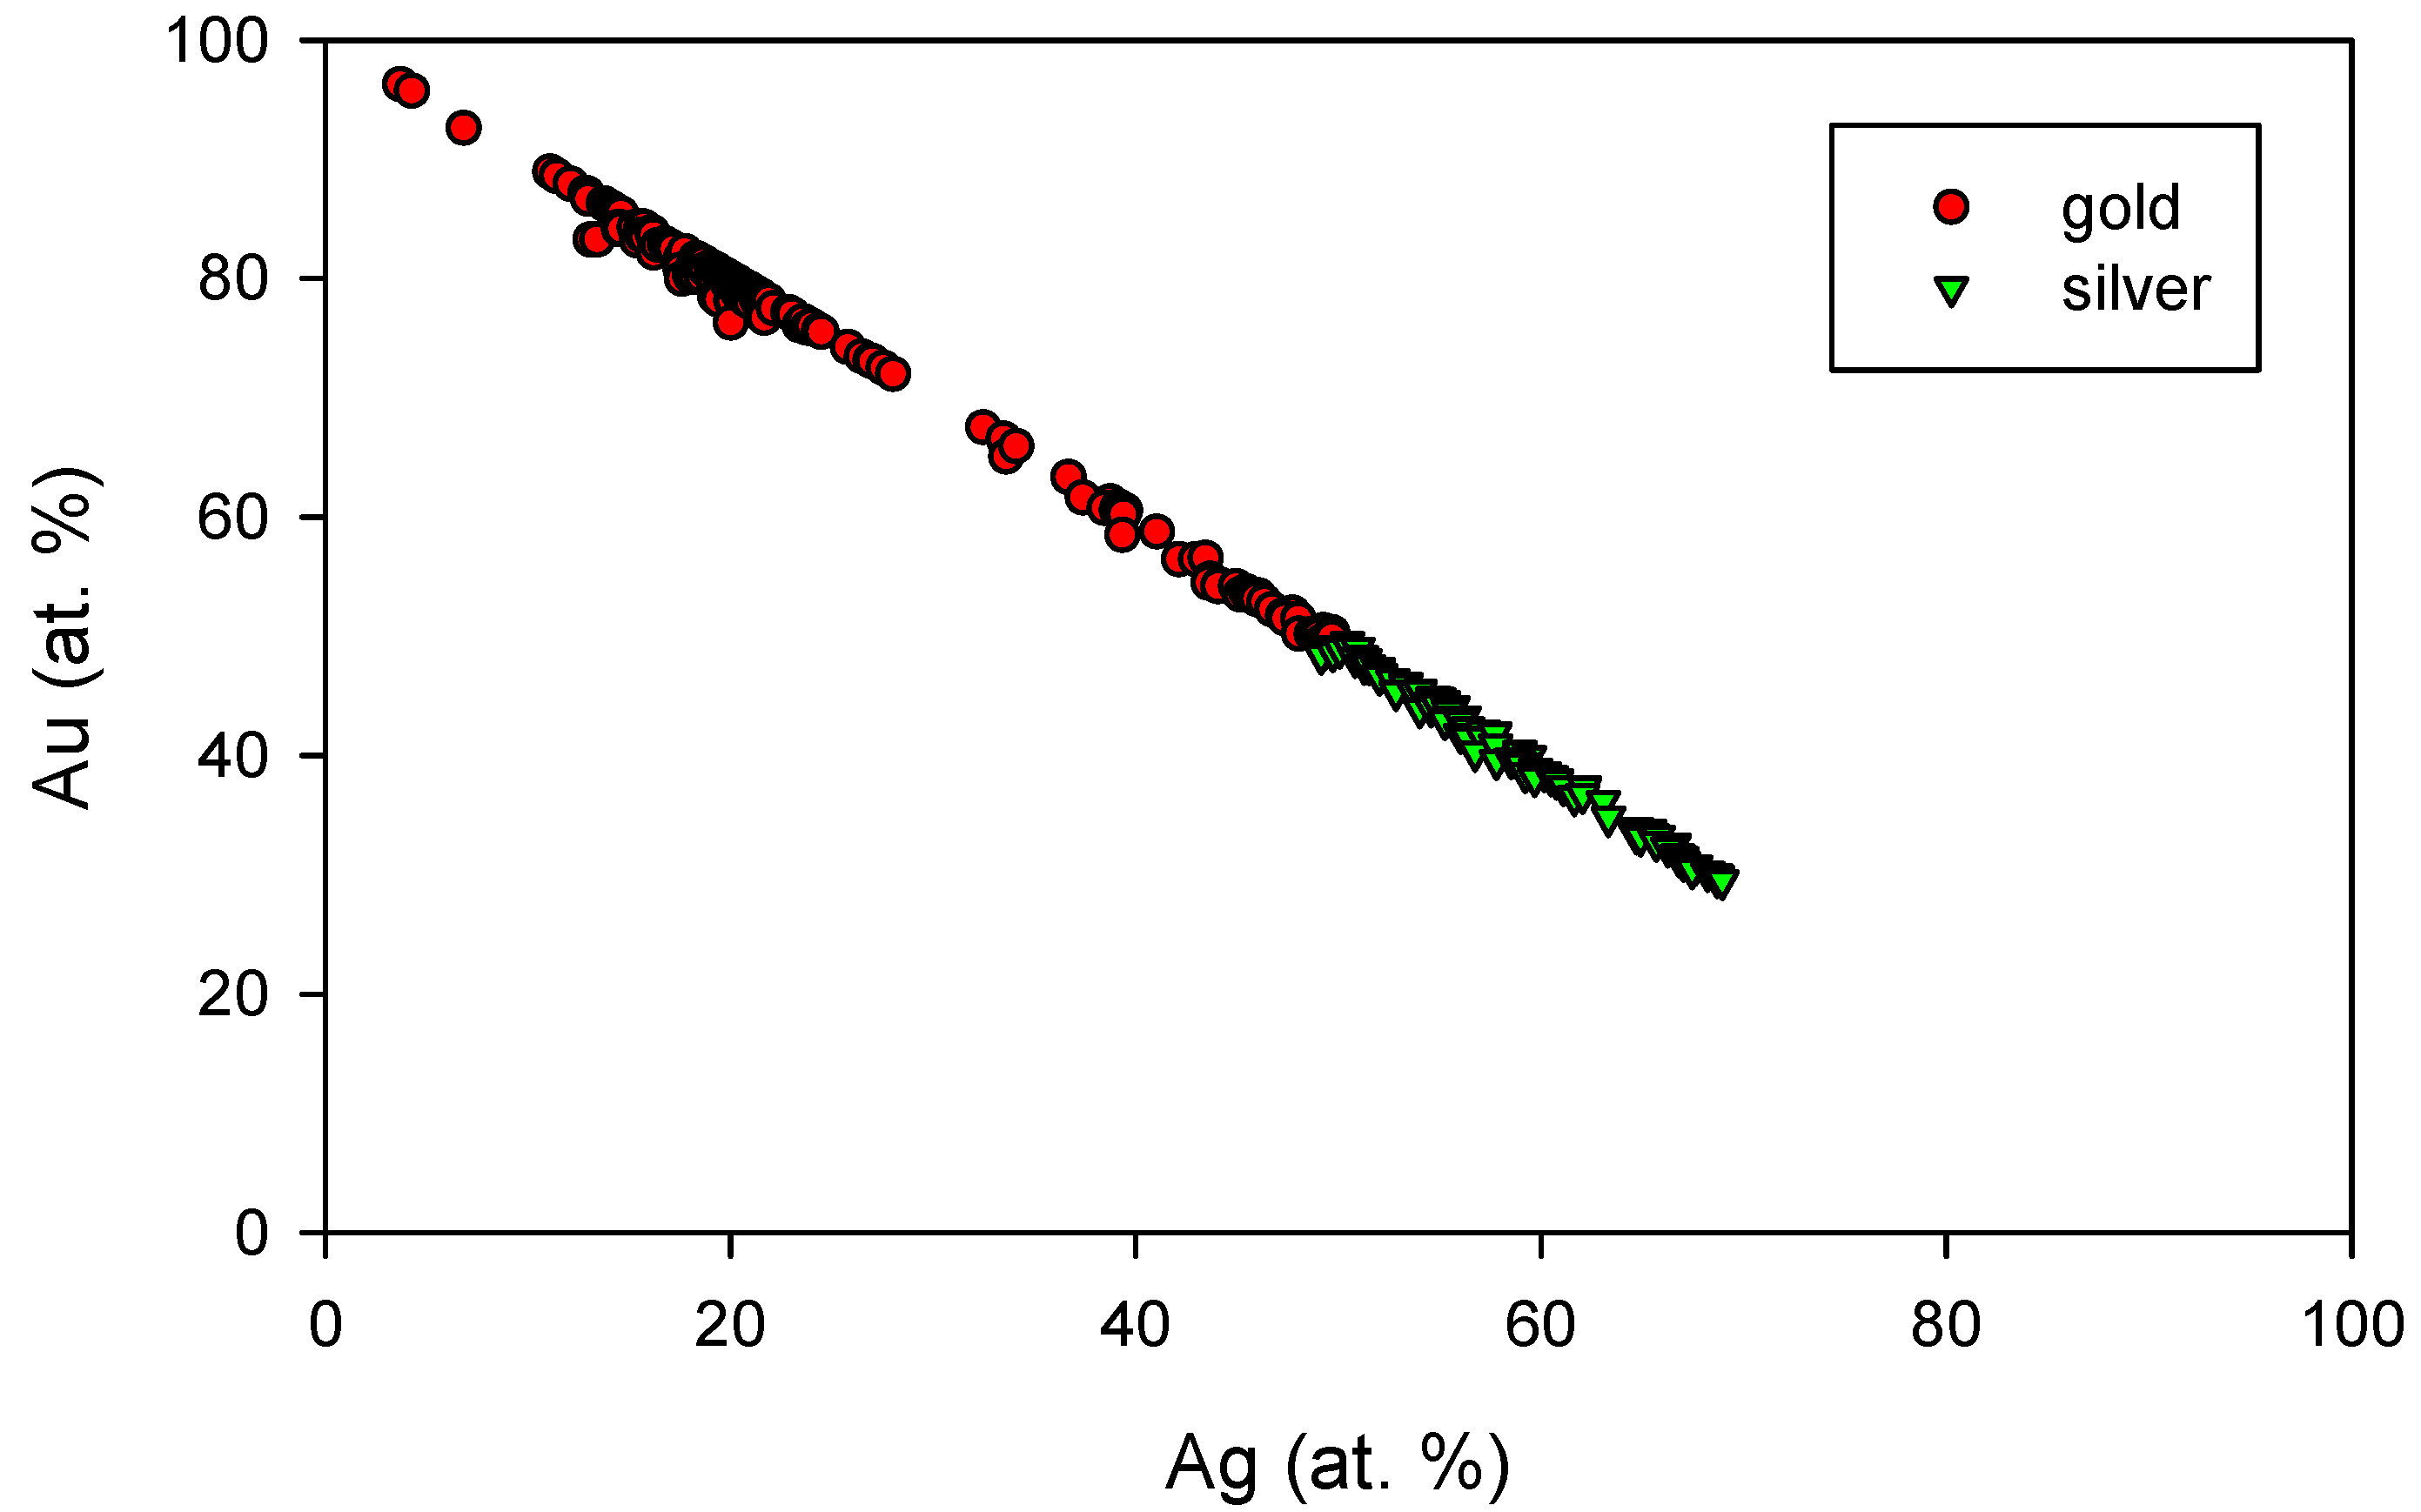
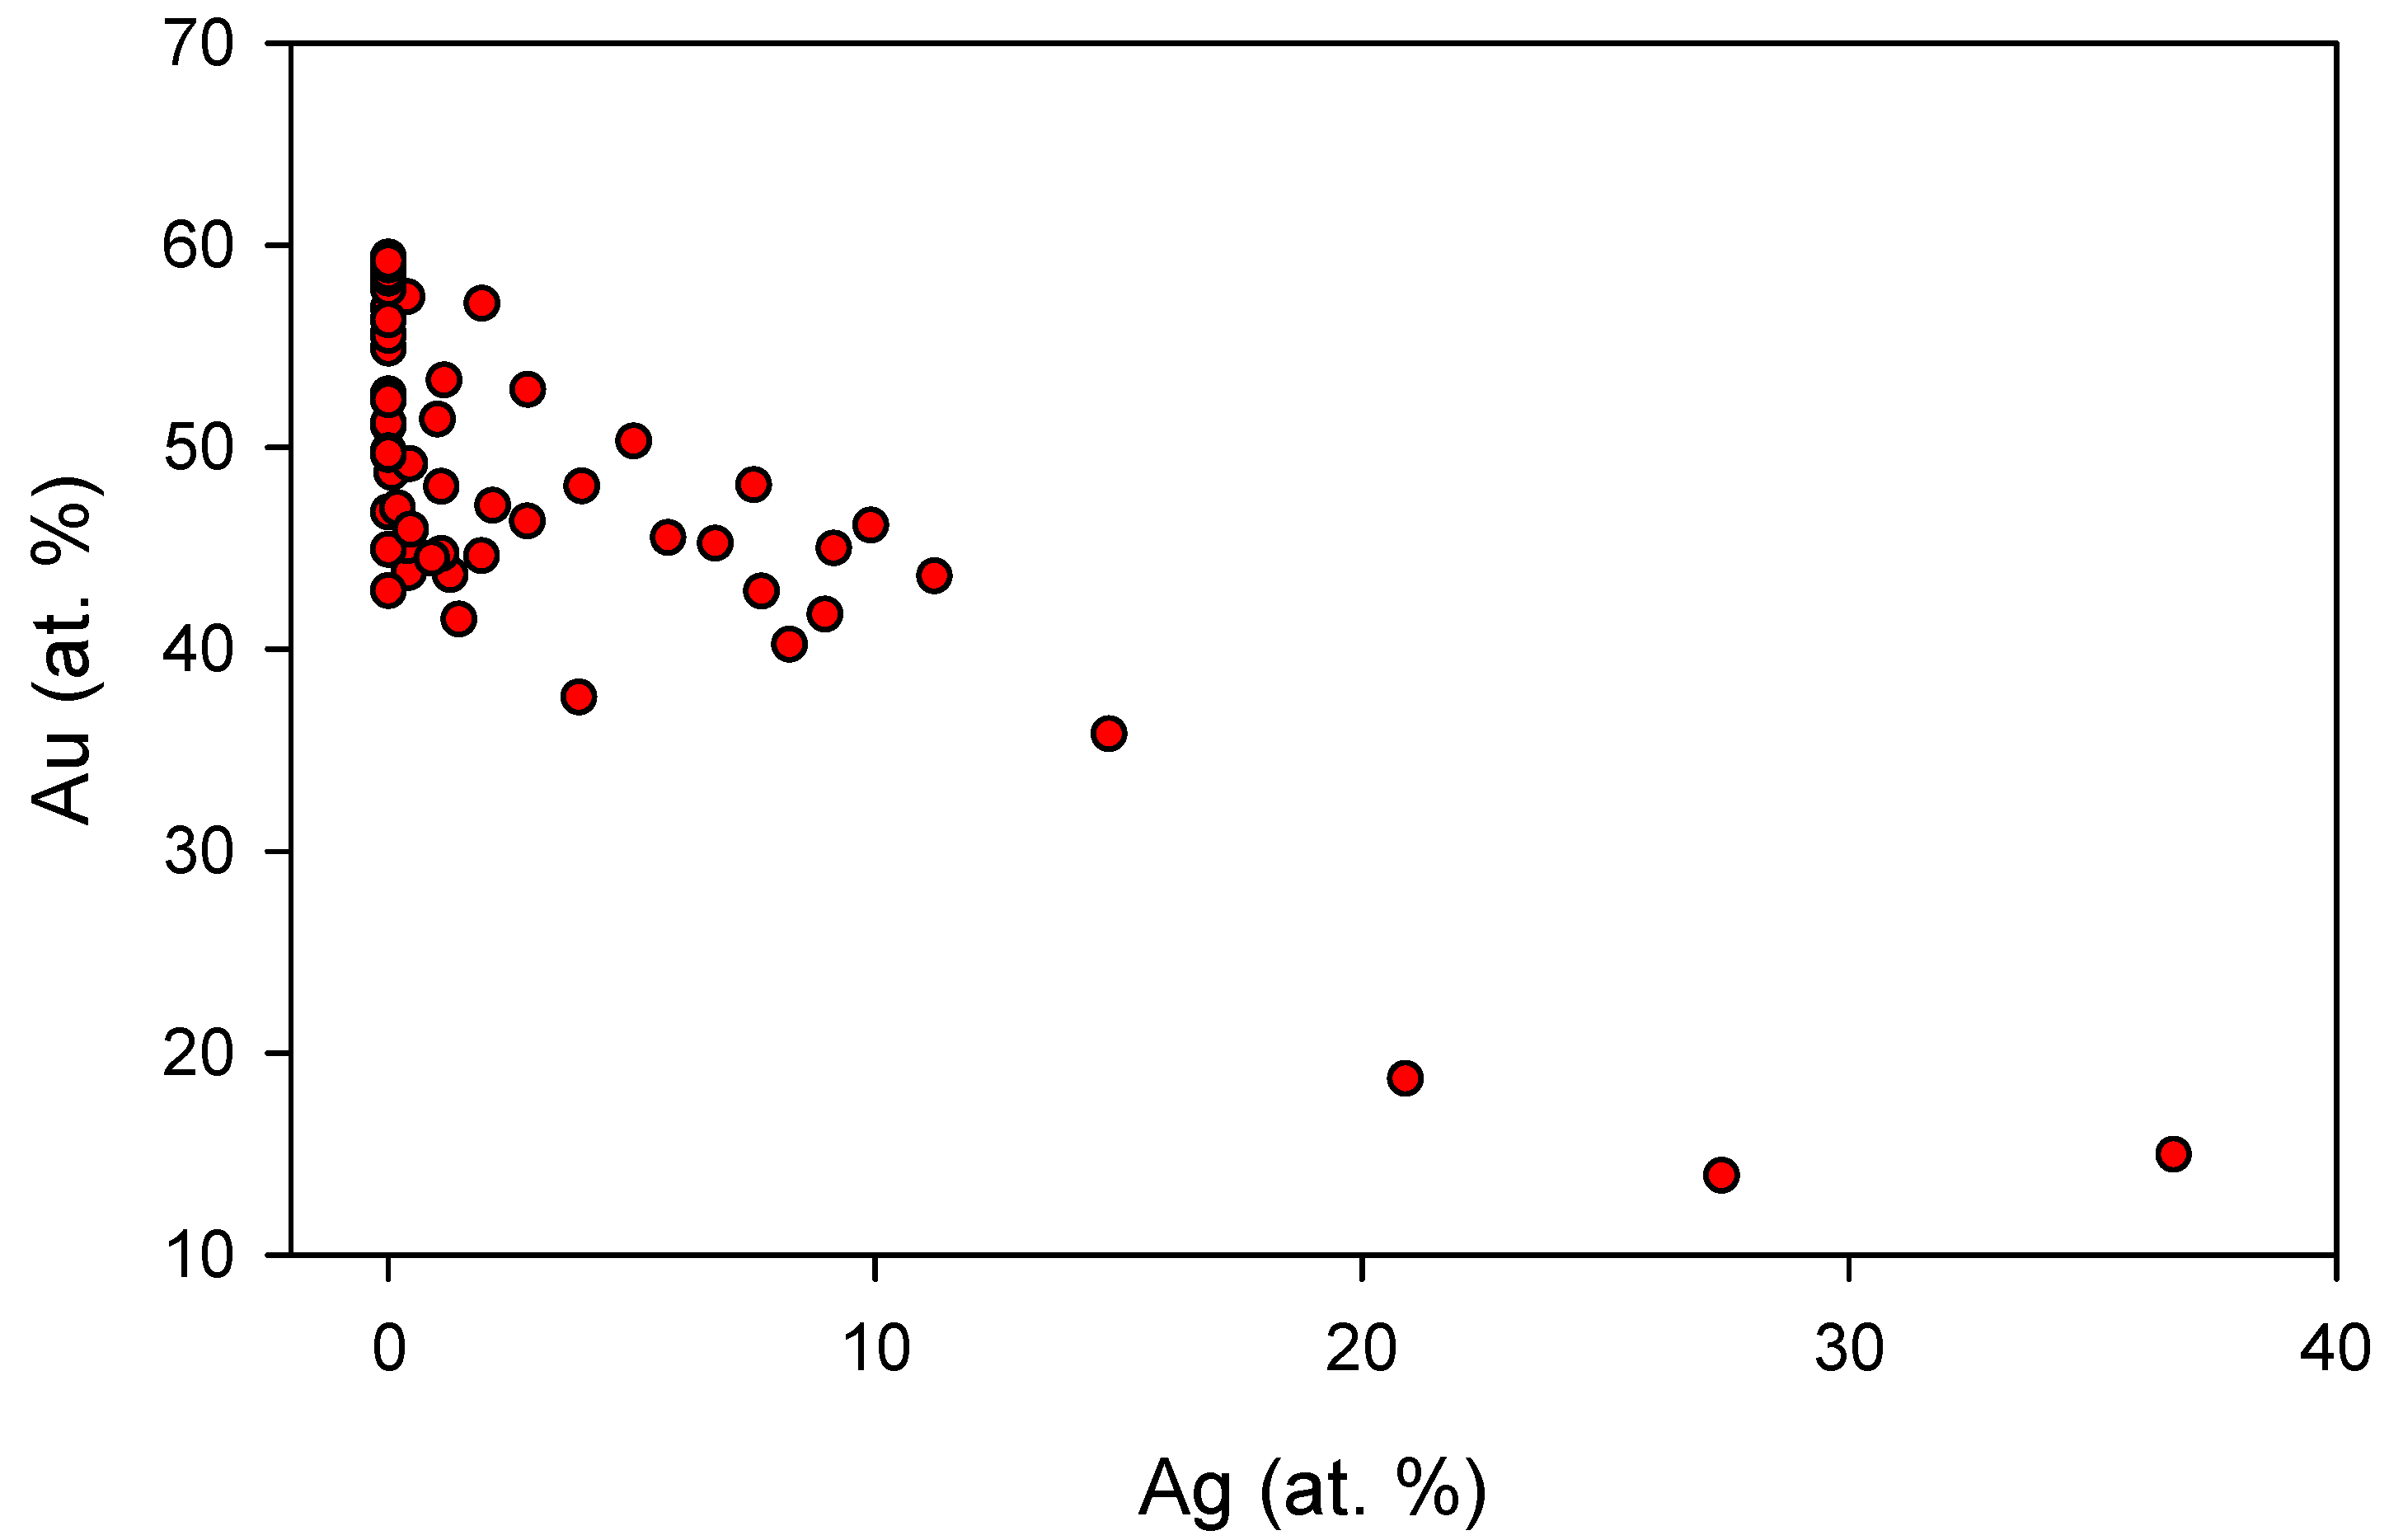
The studied gold-bearing quartz–sulfide vein encountered in the deep mine works of the Bytíz deposit shows several anomalous features when compared with the typical gold-bearing veins in the wider area: (i) an extremely wide range of composition of gold (4–69 at. % Ag); (ii) the presence of Bi-tellurides bound to younger dolomite–ankerite veinlets; (iii) anomalously high amounts of base metals, Ag, and Sb bound especially to the younger portion of the vein fill; and (iv) the contrasting characteristics of the fluid inclusions from early and late portions of the given vein mineralization.
(2)
The commonly observed disequilibrium textures, manifesting various stages of replacement of older ore and gangue minerals by younger ones, are consistent with an idea of the intense re-working of old gold-bearing veins by younger Ag,Sb-rich fluids in distinct physico-chemical conditions. The most common is the replacement of gold by aurostibite and an unnamed (Au,Ag)-Sb oxide, Bi-tellurides by hessite, and siderite by calcite. Such textures recorded at paragenetically distinct phases are indicative of the repeated dissolution and/or re-mobilization of previously deposited ores.
(3)
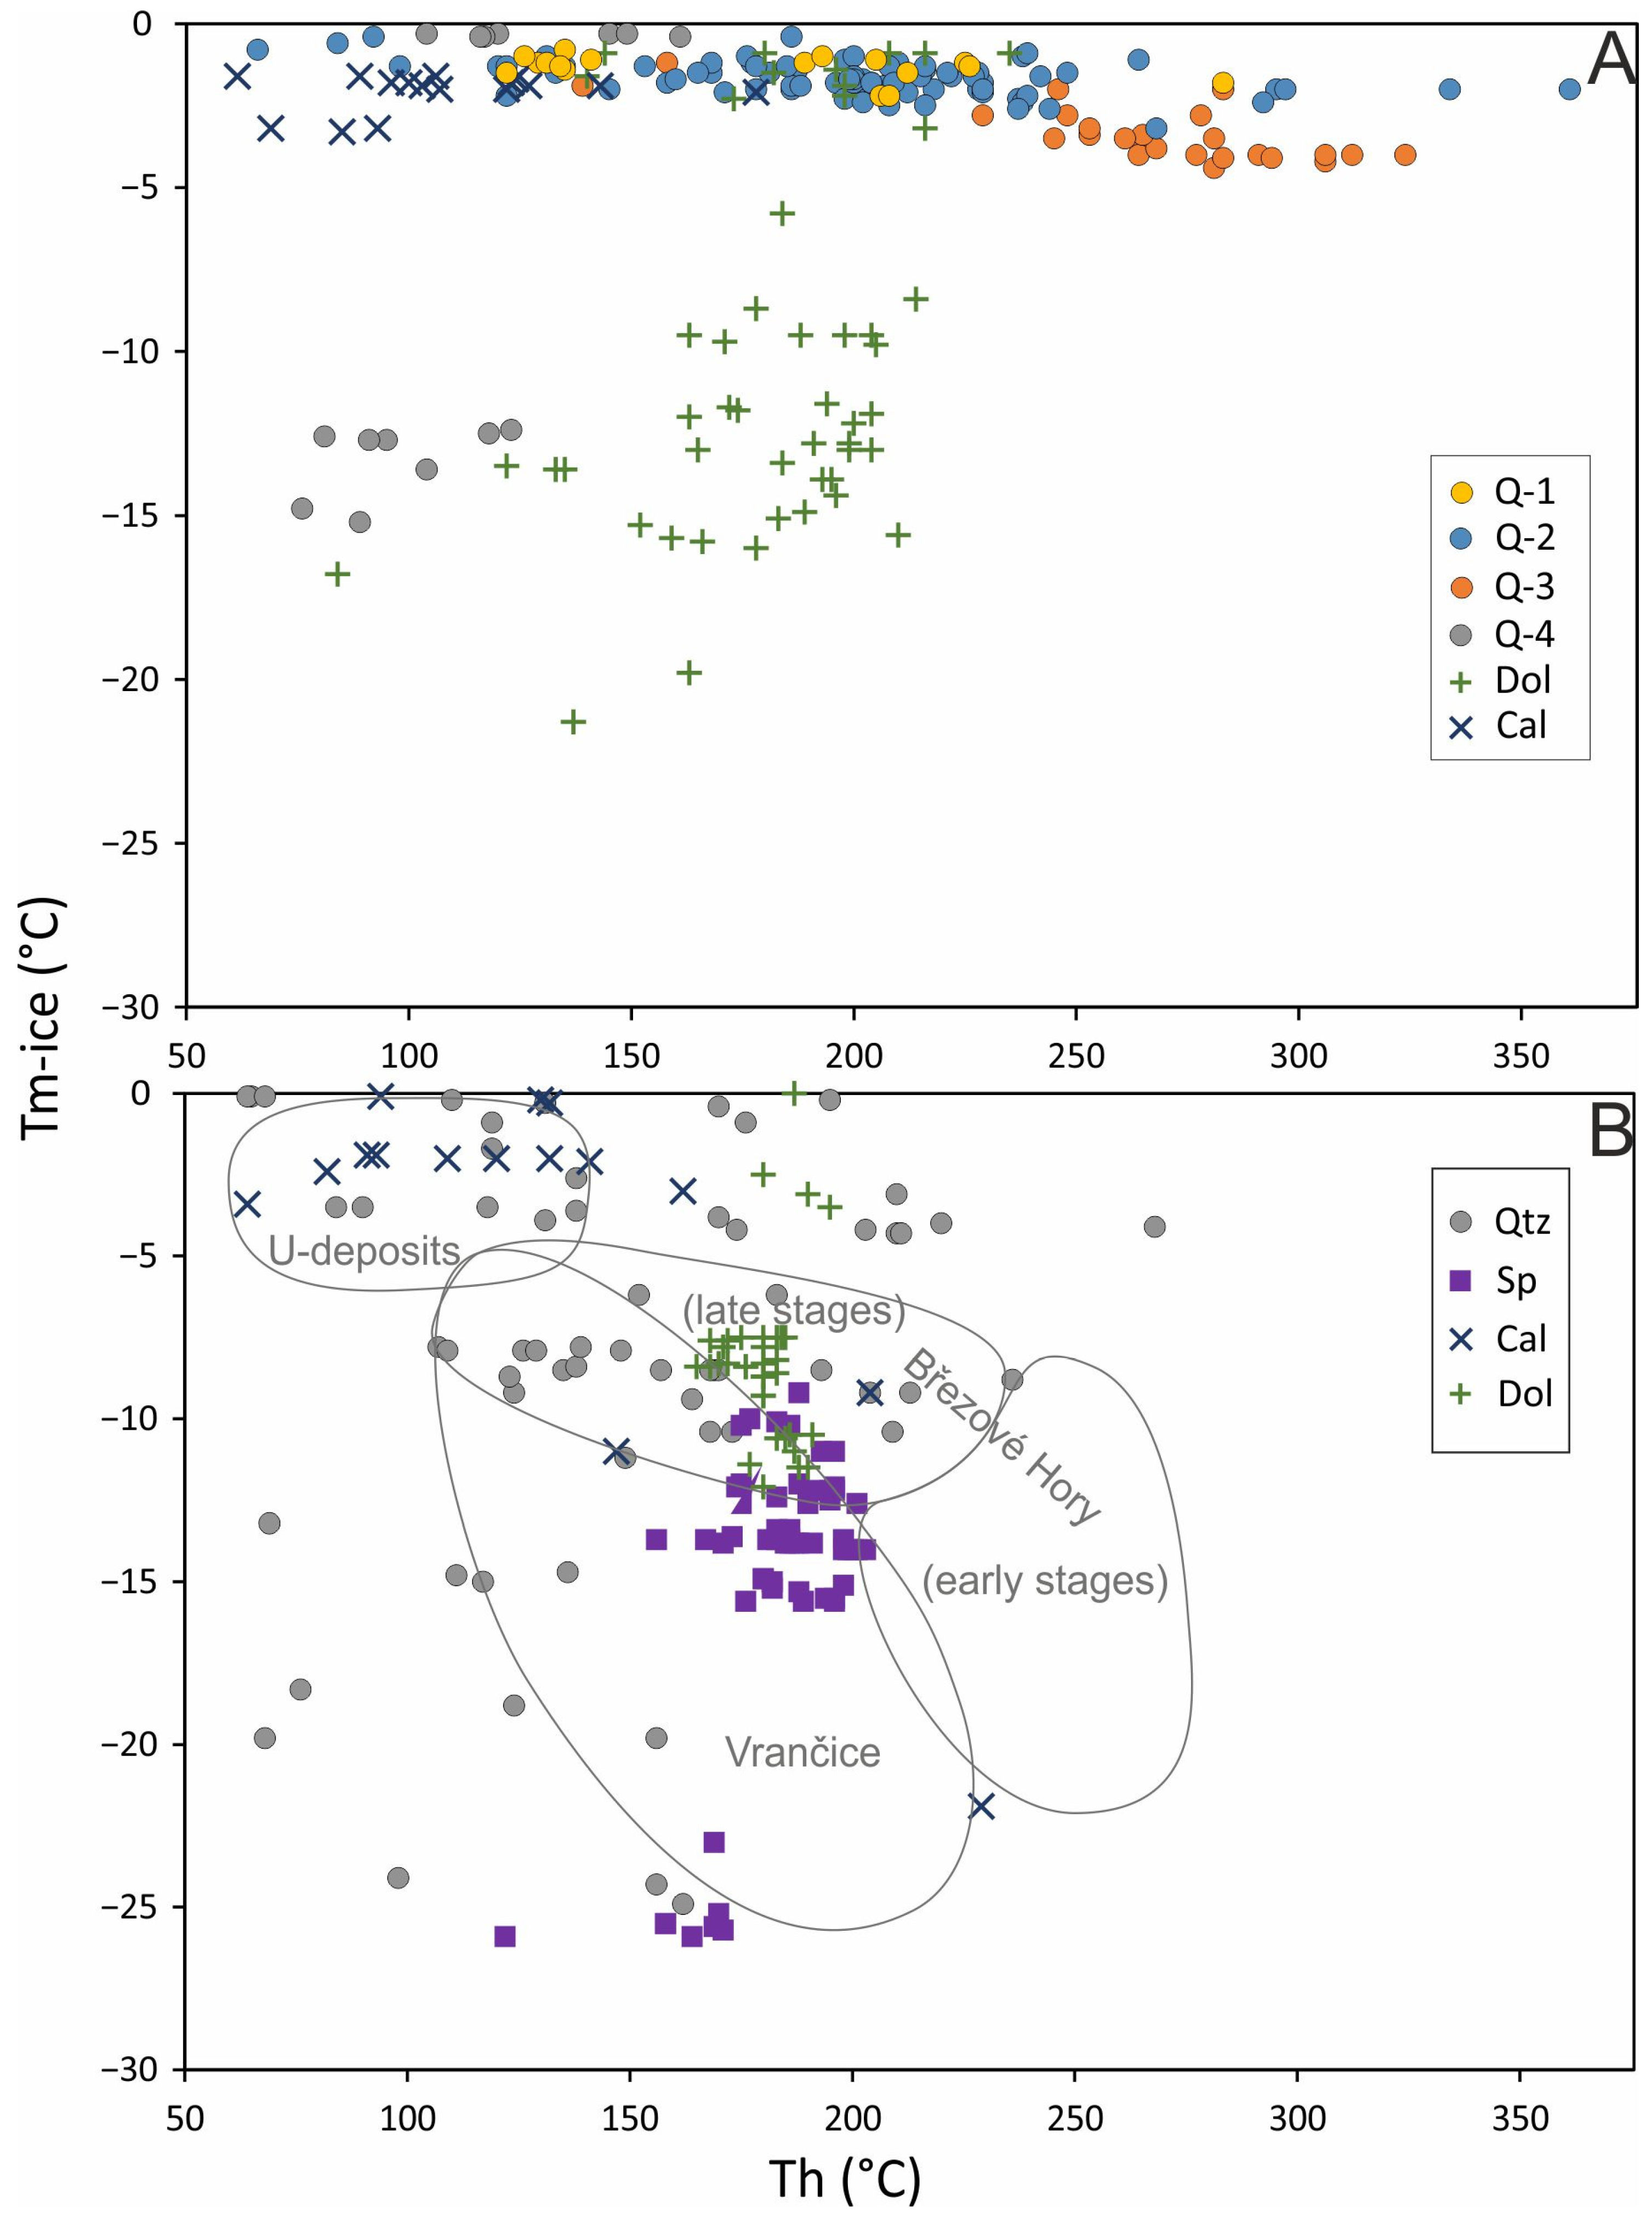
The fluid inclusion study confirmed the differences in the composition and temperatures of fluids from the older and younger portion of mineralization. Whereas the early mineralization originated from progressively cooled high-temperature (ca. 400 to ca. 180 °C), low-salinity (1.2–7.0 wt. % NaCl eq.) aqueous fluids, the younger portion of mineralization formed from aqueous fluids with highly variable salinity (0.2–23.4 wt. % NaCl eq.) and homogenization temperatures decreasing from ca. 250 °C to <50 °C.
(4)
The fluid characteristics of the late mineralization of the studied Au-bearing vein compare well to those of the base-metal mineralization of the vein Bt23C, which crosscut the Au-bearing vein at the sampling site. The data also fit those from other base-metal veins of the Příbram ore area. Hence, it is evident that the observed mineralogical changes were associated with activity of the fluids, giving rise to the common late-Variscan base-metal vein mineralization of the Příbram area.

Supplementary Materials

The following supporting information can be downloaded at: https://www.mdpi.com/article/10.3390/min12121539/s1, Tables S1–S29: chemical composition of individual mineral phases.

Author Contributions

Conceptualization, J.S. and Z.D.; methodology, J.S., Z.D. and P.Š.; investigation, J.S., Z.D., J.Z., J.U. and V.Š.; resources, V.Š. and P.Š.; writing—original draft preparation, J.S. and Z.D.; writing—review and editing, J.S. All authors have read and agreed to the published version of the manuscript.

Funding

This research was financially supported by grant GAČR 19-16218S (Czech Science Foundation) and by the Ministry of Culture of the Czech Republic (long-term project DKRVO 2019–2023/1.I.d; National Museum, 00023272).

Data Availability Statement

All data are contained in this work and Supplementary Materials.

Acknowledgments

The authors thank Jaroslav Jindra (Příbram) for providing research samples. We must also thank Jiří Litochleb (deceased, National Museum, Praha) for his cooperation in the ore microscopy and succession studies. The referees as well as the academic editor Yuichi Morishita are acknowledged for comments and suggestions that helped to improve the early version of the manuscript.

Conflicts of Interest

The authors declare no conflict of interest. The funders had no role in the design of the study; in the collection, analyses, or interpretation of data; in the writing of the manuscript; or in the decision to publish the results.

References

  1. Ettler, V.; Sejkora, J.; Drahota, P.; Litochleb, J.; Pauliš, P.; Zeman, J.; Novák, M.; Pašava, J. Příbram and Kutná Hora mining districts—From historical mining to recent environmental impact. Acta Miner.–Petr. Field Guide Ser. 2010, 7, 1–23. [Google Scholar]
  2. Litochleb, J.; Černý, P.; Litochlebová, E.; Sejkora, J.; Šreinová, B. The deposits and occurrences of mineral raw materials in the Střední Brdy Mts. and the Brdy piedmont area (Central Bohemia). Bull. Mineral.–Petrol. Oddělení Národního Muz. V Praze 2003, 12, 57–86. (In Czech) [Google Scholar]
  3. Kutina, J. Genetische Diskussion der Makrotexturen bei der geochemischen Untersuchung des Adalbert-Hauptganges in Příbram. Chem. Erde 1955, 17, 241–323. [Google Scholar]
  4. Sejkora, J.; Škácha, P.; Plášil, J.; Dolníček, Z.; Ulmanová, J. Hrabákite, Ni9PbSbS8, a new member of the hauchecornite group from Příbram, Czech Republic. Mineral. Mag. 2021, 85, 189–196. [Google Scholar] [CrossRef]
  5. Ulmanová, J.; Dolníček, Z.; Škácha, P.; Sejkora, J. Fluid inclusions in Zn-Pb mineralization of the vein Bt23C, Bytíz deposit, Příbram uranium and base-metal ore district, Czech Republic: The role of immiscible aqueous-carbonic fluids. Mineral. Depos. submitted 2022.
  6. Dolníček, Z.; Ulmanová, J.; Sejkora, J.; Knížek, F.; Škácha, P. Mineralogy and genesis of the Pb-Zn-Sb-Ag vein H32A in the Příbram uranium and base-metal district, Bohemian Massif, Czech Republic. Ore Geol. Rev. 2022. submitted. [Google Scholar]
  7. Komínek, J. Geology of the Wide Surroundings and of the Deposit, Part I and II; Final Report on the uranium district Příbram; Unpublished Report DIAMO; DIAMO: Příbram, The Czech Republic, 1995; 418p. (In Czech) [Google Scholar]
  8. Litochleb, J.; Knížek, F.; Šrein, V. Gold-bearing mineralization in the Příbram uranium deposit. Sbor. konf. Hornická Příbram ve vědě a Tech. Sekce Ložisková Geol. 1986, 318–325. (In Czech) [Google Scholar]
  9. Litochleb, J.; Černý, P.; Šrein, V.; Lantora, M.; Sejkora, J. Mineralogy of the gold-bearing mineralization in the underground gas reservoir at Háje near Příbram (central Bohemia). Bull. Mineral.-Petrolog. Odd. Nár. Muz. 2000, 8, 195–201. (In Czech) [Google Scholar]
  10. Litochleb, J.; Šrein, V. The chemical composition of bismuth and tellurium minerals from the gold-bearing veins of the Příbram uranium deposit. Acta Univ. Carol. Geol. 1989, 4, 511–519. (In Czech) [Google Scholar]
  11. Škácha, P.; Sejkora, J.; Plášil, J. Selenide mineralization in the Příbram uranium and base-metal district (Czech Republic). Minerals 2017, 7, 91. [Google Scholar] [CrossRef] [Green Version]
  12. Knížek, F.; Litochleb, J.; Šrein, V. Dyscrasite and allargentum from the Háje vein bundle of the Příbram uranium deposit. Věst. Ústř. Úst. Geol. 1990, 65, 321–328. [Google Scholar]
  13. Sejkora, J.; Litochleb, J.; Knížek, F.; Škácha, P. The characteristic of the Ag-occurrences on the H61Z vein under the 6th level, shaft No. 21, Příbram uranium and base-metal district. Bull. Mineral.-Petrolog. Odd. Nár. Muz. 2007, 14–15, 107–113. (In Czech) [Google Scholar]
  14. Škácha, P.; Sejkora, J.; Knížek, F.; Slepička, V.; Litochleb, J.; Jebavá, I. The occurrences of the unique monometallic silver ores on the vein H14F3 between 7th and 9th level of the shaft No. 21 Háje, Příbram uranium and base-metal district (Czech Republic). Bull. Mineral.-Petrolog. Odd. Nár. Muz. 2012, 20, 230–254. (In Czech) [Google Scholar]
  15. Anderson, E.B. Isotopic-Geochronological Investigation of the Uranium Mineralization of Czechoslovakia; Unpublished Czechoslovak Uranium Industry Report; Archiv of the State Enterprise Diamo: Příbram-Bytíz, Czech Republic, 1987; pp. 1962–1987. [Google Scholar]
  16. Řídkošil, T.; Knížek, F. Zeolite mineralization and occurrence of whewellite at the Příbram uranium deposit. Sbor. Semin. "Miner. uránovych a s nimi súvisiacich nerastných surovín" Čingov 1987, 126–130. (In Czech) [Google Scholar]
  17. Žák, K.; Skála, R. Carbon isotopic composition of whewellite (CaC2O4· H2O) from different geological environments and its significance. Chem. Geol. 1993, 106, 123–131. [Google Scholar] [CrossRef]
  18. Knížek, F.; Litochleb, J. Calcite drusy cavities with whewellite on the Bytíz uranium deposit (the Příbram uranium-polymetallic district, central Bohemia). Bull. Mineral.-Petrolog. Odd. Nár. Muz. 2005, 13, 73–77. (In Czech) [Google Scholar]
  19. Pouchou, J.L.; Pichoir, F. “PAP” (φρZ) procedure for improved quantitative microanalysis. In Microbeam Analysis; Armstrong, J.T., Ed.; San Francisco Press: San Francisco, CA, USA, 1985; pp. 104–106. [Google Scholar]
  20. Anders, E.; Grevesse, N. Abundances of the elements: Meteoritic and solar. Geochim. Cosmochim. Acta 1989, 53, 197–214. [Google Scholar] [CrossRef]
  21. McLennan, S.M. Rare earth elements in sedimentary rocks: Influence of provenance and sedimentary processes. Rev. Mineral. 1989, 21, 169–200. [Google Scholar]
  22. Bodnar, R.J. Revised equation and table for determining the freezing point depression of H2O-NaCl solutions. Geochim. Cosmochim. Acta 1993, 57, 683–684. [Google Scholar] [CrossRef]
  23. Bakker, R.J. Package FLUIDS 1. Computer programs for analysis of fluid inclusion data and for modelling bulk fluid properties. Chem. Geol. 2003, 194, 3–23. [Google Scholar] [CrossRef]
  24. Knight, C.L.; Bodnar, R.J. Synthetic fluid inclusions: IX. Critical PVTX properties of NaCl-H2O solutions. Geochim. Cosmochim. Acta 1989, 53, 3–8. [Google Scholar] [CrossRef]
  25. Kretschmar, U.; Scott, S.D. Phase relations involving arsenopyrite in the system Fe-As-S and their application. Can. Mineral. 1976, 14, 364–386. [Google Scholar]
  26. Sharp, Z.D.; Essene, E.J.; Kelly, W.C. A re-examination of the arsenopyrite geothermometer: Pressure considerations and applications to natural assemblages. Can. Mineral. 1985, 23, 517–534. [Google Scholar]
  27. Mikulski, S.Z. The arsenopyrite geothermometer—A difficult application to arsenopyrite from the Radzimowice abandoned Au-As-Cu deposit (Kaczawa Mountains). Mineral. Polonica Spec. Papers 2005, 26, 209–212. [Google Scholar]
  28. Andráš, P.; Chovan, M. Gold incorporation into sulphide minerals from the Tatric Unit, the Western Carpathians, with respect to their chemical composition. J. Czech Geol. Soc. 2005, 50, 143–155. [Google Scholar] [CrossRef]
  29. Biagioni, C.; George, L.G.; Cook, N.J.; Makovicky, E.; Moëlo, Y.; Pasero, M.; Sejkora, J.; Stanley, C.J.; Welch, M.D.; Bosi, F. The tetrahedrite group: Nomenclature and classification. Am. Mineral. 2020, 105, 109–122. [Google Scholar] [CrossRef]
  30. Abrikosov, N.C.; Bankina, V.F. Study of phase diagram of the system Bi–Te. Zh. Neorg. Chim. 1958, 3, 659–667. (In Russian) [Google Scholar]
  31. Shelimova, L.E.; Karpinsky, O.G.; Kosyakov, V.I.; Shestakov, V.A.; Zemskov, V.S.; Kuznetsov, F.A. Homologous series of layered tetradymite-like compounds in Bi–Te and GeTe–Bi2Te3 systems. J. Struct. Chem. 2000, 41, 81–87. [Google Scholar] [CrossRef]
  32. Yusa, K.; Kitakaze, A.; Sugaki, A. Synthesized bismuth—Tellurium—Sulfur system minerals—Synthetic sulfide minerals (IX). Sci. Rep. Tohoku Univ. 3rd Ser. 1979, 14, 121–133. [Google Scholar]
  33. Cook, N.J.; Ciobanu, C.L.; Wagner, T.; Stanley, C.J. Minerals of the system Bi-Te-Se-S related to the tetradymite archetype: Review of classification and compositional variation. Can. Mineral. 2007, 45, 665–708. [Google Scholar] [CrossRef]
  34. Cook, N.J.; Ciobanu, C.L. Bismuth tellurides and sulphosalts from the Larga hydrothermal system, Metaliferi Mts., Romania: Paragenesis and genetic significance. Mineral. Mag. 2004, 68, 303–321. [Google Scholar] [CrossRef] [Green Version]
  35. Ferenc, Š. New occurrences of Te minerals in the western part of the Slovenské rudohorie Mts. Mineral. Slov. 2004, 36, 317–322. (in Slovak). [Google Scholar]
  36. Mikulski, S.Z. Te-Bi-Au-Ag-Pb-S mineral assemblages within the late Hercynian polymetallic deposit in the western Sudetes (Poland). In Guidebook of the International Field Workshop of IGCP-486; Alba Iulia, Romania, 2004; pp. 242–244. [Google Scholar]
  37. Gamyanin, G.N.; Leskova, N.V.; Vyalsov, L.N.; Laputina, I.P. Bismuth tellurides—Bi2Te and BiTe—in deposits of northeastern USSR. Zap. Vses. Mineral. Obshchest. 1980, 109, 230–235. (In Russian) [Google Scholar]
  38. Gamyanin, G.N.; Leskova, N.V.; Vyalsov, L.N.; Laputina, I.P. Bismuth tellurides—Bi2Te and BiTe—in the deposits of the northeast USSR. Int. Geol. Rev. 1982, 24, 451–456. [Google Scholar] [CrossRef]
  39. Goncharov, V.I.; Alshevskiy, A.V.; Vortsepenev, V.V.; Sergeyeva, N.Y.; Savva, N.Y. New discovery of the bismuth telluride Bi2Te in northeastern USSR. Dokl. Akad. Nauk SSSR 1984, 275, 717–720. (In Russian) [Google Scholar]
  40. Huang, D.; Ding, X.; Wu, C.; Zhang, C. Mineral characteristics and occurrence of gold, silver and bismuth of the Caijaying lead—zinc—silver deposit, Hebei Province. Acta Geol. Sin. 1991, 65, 127–140. (In Chinese) [Google Scholar]
  41. Luukkonen, A. Main geological features, metallogeny and hydrothermal alteration phenomena of certain gold and gold—tin—tungsten prospects in southern Finland. Geol. Surv. Finl. Bull. 1994, 377, 1–153. [Google Scholar]
  42. Gu, X.P.; Watanabe, M.; Hoshino, K.; Shibata, Y. Mineral chemistry and associations of Bi–Te(S,Se) minerals from China. Neues Jahrbuch für Mineralogie–Monatshefte. 2001, 289–309. [Google Scholar]
  43. Houzar, S.; Litochleb, J.; Sejkora, J.; Cempirek, J.; Cicha, J. Unusual mineralization with niobian titanite and Bi-tellurides in scheelite skarn from Kamenné doly quarry near Písek, Moldanubian Zone, Bohemian Massif. J. Geosci. 2008, 53, 1–16. [Google Scholar] [CrossRef] [Green Version]
  44. Okamoto, K.; Tanner, L.E. Bi–Te (bismuth–tellurium). In Binary Alloy Phase Diagrams; Massalski, T.B., Ohamoto, K., Eds.; ASM International: Materials Park, OH, USA, 1990; pp. 800–801. [Google Scholar]
  45. Zachariáš, J.; Němec, M. Gold to aurostibite transformation and formation of Au-Ag-Sb phases: The Krásná Hora deposit, Czech Republic. Mineral. Mag. 2017, 81, 987–999. [Google Scholar] [CrossRef]
  46. Němec, M.; Zachariáš, J. The Krásná Hora, Milešov, and Příčovy Sb-Au ore deposits, Bohemian Massif: Mineralogy, fluid inclusions, and stable isotope constraints on the deposit formation. Mineral. Depos. 2018, 53, 225–244. [Google Scholar] [CrossRef]
  47. Kalinin, A.A.; Savchenko, Y.E.; Selivanova, E.A. Mustard Gold in the Oleninskoe Gold Deposit, Kolmozero–Voronya Greenstone Belt, Kola Peninsula, Russia. Minerals 2019, 9, 786. [Google Scholar] [CrossRef] [Green Version]
  48. Pak, S.J.; Choi, S.G.; Choi, S.H. Systematic mineralogy and chemistry of gold-silver vein deposits in the Taebaeksan district, Korea: Distal relatives of a porphyry system. Mineral. Mag. 2004, 68, 467–487. [Google Scholar] [CrossRef]
  49. Scott, J.D. Refinement of the crystal structure of dyscrasite, and its implications for the structure of allargentum. Can. Mineral. 1976, 14, 139–142. [Google Scholar]
  50. Cipriani, C.; Corazza, M.; Mazzetti, G. Reinvestigation of natural silver antimonides. Eur. J. Mineral. 1997, 8, 1347–1350. [Google Scholar] [CrossRef] [Green Version]
  51. Zoro, E.; Servant, C.; Legendre, B. Thermodynamic modeling of the Ag-Au-Sb ternary system. J. Phase Equilibr. Diffus. 2007, 28, 250–257. [Google Scholar] [CrossRef]
  52. Gamyanin, G.N.; Nekrasov, I.J.; Zhdanov, J.J.; Leskova, N.V. Auroantimonate, a new natural compound of gold. Dokl. Akad. Nauk SSSR 1988, 301, 947–950. (In Russian) [Google Scholar]
  53. Zachariáš, J.; Morávek, P.; Gadas, P.; Pertoldová, J. The Mokrsko-West gold deposit, Bohemian Massif, Czech Republic: Mineralogy, deposit setting and classification. Ore Geol. Rev. 2014, 58, 238–263. [Google Scholar] [CrossRef]
  54. Tolstykh, F.N.; Vymazalová, A.; Tuhý, M.; Shapovalova, M. Conditions of formation of Au–Se–Te mineralization in the Gaching ore occurrence (Maletoyvayam ore field), Kamchatka, Russia. Mineral. Mag. 2018, 82, 649–674. [Google Scholar] [CrossRef]
  55. Dill, H.G.; Weiser, T.; Bernhardt, I.R.; Kilibarda, C.R. The composite gold-antimony vein deposit at Kharma (Bolivia). Econ. Geol. 1995, 90, 51–66. [Google Scholar] [CrossRef]
  56. Makovicky, E.; Chovan, M.; Bakos, F. The stibian mustard gold from the Kriváň Au deposit, Tatry Mts., Slovak Republic. Neues Jahrbuch für Mineralogie–Abhandlungen 2007, 184, 207–215. [Google Scholar] [CrossRef]
  57. Johan, Z.; Šrein, V. Un nouvel oxyde naturel de Au et Sb. Comptes Rendus De L’académie Des Sci. -Ser. IIA-Earth Planet. Sci. 1998, 326, 533–538. [Google Scholar] [CrossRef]
  58. Maydagán, L.; Franchini, M.; Impiccini, A.; Lentz, D. Phyllosilicates geochemistry and distribution in the Altar porphyry Cu-(Au) deposit, Andes Cordillera of San Juan, Argentina: Applications in exploration, geothermometry, and geometallurgy. J. Geoch. Explor. 2016, 167, 83–109. [Google Scholar] [CrossRef]
  59. Rieder, M.; Cavazzini, G.; D´yakonov, Y.S.; Kamenetskii, V.A.F.; Gottardi, G.; Guggenheim, S.; Koval´, P.V.; Mueller, G.; Neiva, A.M.R.; Radoslovich, E.W.; et al. Nomenclature of micas. Can. Mineral. 1998, 36, 905–912. [Google Scholar] [CrossRef]
  60. de Siqueira Corrêa, R.; Oliveira, C.G.; Vidotti, R.M.; da Silva Souza, V. Regional-scale pressure shadow-controlled mineralization in the Príncipe Orogenic Gold Deposit, Central Brazil. Ore Geol. Rev. 2015, 71, 273–304. [Google Scholar] [CrossRef]
  61. Klein, E.L.; Harris, C.; Giret, A.; Moura, C.A.V. The Cipoeiro gold deposit, Gurupi Belt, Brazil: Geology, chlorite geochemistry, and stable isotope study. J. S. Am. Earth Sci. 2007, 23, 242–255. [Google Scholar] [CrossRef]
  62. Demange, M.; Pascal, M.-L.; Raimbault, L.; Armand, J.; Forette, M.C.; Serment, R.; Touil, A. The Salsigne Au-As-Bi-Ag-Cu deposit, France. Econ. Geol. 2006, 101, 199–234. [Google Scholar] [CrossRef]
  63. Dolníček, Z.; Nepejchal, M.; Kapusta, J.; Ulmanová, J.; Fojt, B. Primary gold mineralization in the Andělské údolí Valley near Staré Město pod Sněžníkem (Czech Republic). Bull. Mineral. Petrolog. 2018, 26, 12–27. (In Czech) [Google Scholar]
  64. Bayliss, P. Nomenclature of the trioctahedral chlorites. Can. Mineral. 1975, 13, 178–180. [Google Scholar]
  65. Melka, K. A proposal to classification of chlorite minerals. Věst. Ústř. Úst. Geol. 1965, 40, 23–27. (In Czech) [Google Scholar]
  66. Moura, M.A.; Botelho, N.F.; Olivo, G.M.; Kyser, T.K. Granite-related Paleoproterozoic, Serrinha gold deposit, southern Amazonia, Brazil: Hydrothermal alteration, fluid inclusion and stable isotope constraints on genesis and evolution. Econ. Geol. 2006, 101, 585–605. [Google Scholar] [CrossRef]
  67. Buchholz, P.; Oberthür, T.; Lüders, V.; Wilkinson, J. Multistage Au-As-Sb mineralization and crustal-scale fluid evolution in the Kwekwe District, Midlands Greenstone Belt, Zimbabwe: A combined geochemical, mineralogical, stable isotope, and fluid inclusion study. Econ. Geol. 2007, 102, 347–378. [Google Scholar] [CrossRef]
  68. Klein, E.L.; Ribeiro, J.W.A.; Harris, C.; Moura, C.A.V.; Giret, A. Geology and fluid characteristics of the Mina Velha and Mandiocal orebodies and implications for the genesis of the orogenic Chega Tudo gold deposit, Gurupi Belt, Brazil. Econ. Geol. 2008, 103, 957–980. [Google Scholar] [CrossRef]
  69. Zoheir, B.A.; El-Shazly, A.K.; Helba, H.; Khalil, K.I.; Bodnar, R.J. Origin and evolution of the Um Egat and Dungash orogenic gold deposits, Egyptian Eastern Desert: Evidence from fluid inclusions in quartz. Econ. Geol. 2008, 103, 405–424. [Google Scholar] [CrossRef] [Green Version]
  70. Zoheir, B.A. Controls on lode gold mineralization, Romite deposit, South Eastern Desert, Egypt. Geosci. Front. 2012, 3, 571–585. [Google Scholar] [CrossRef] [Green Version]
  71. Zachariáš, J.; Novák, T. Gold-bearing quartz veins of the Bělčice ore district, Bohemian Massif: Evidence for incursion of metamorphic fluids into a granodiorite body and for isothermal mixing between two types of metamorphic fluids. J. Geosci. 2009, 54, 57–72. [Google Scholar] [CrossRef] [Green Version]
  72. Zoheir, B.A.; Akawy, A. Genesis of the Abu Marawat gold deposit, central Eastern Desert of Egypt. J. Afr. Earth. Sci. 2010, 57, 306–320. [Google Scholar] [CrossRef]
  73. Crispini, L.; Federico, L.; Capponi, G.; Talarico, F. The Dorn gold deposit in northern Victoria Land, Antarctica: Structure, hydrothermal alteration, and implications for the Gondwana Pacific margin. Gondw. Res. 2011, 19, 128–140. [Google Scholar] [CrossRef]
  74. Dora, M.L.; Randive, K.R. Chloritisation along the Thanewasna shear zone, Western Bastar Craton, Central India: Its genetic linkage to Cu–Au mineralisation. Ore Geol. Rev. 2015, 70, 151–172. [Google Scholar] [CrossRef]
  75. Fuertes-Fuente, M.; Cepedal, A.; Lima, A.; Dória, A.; dos Anjos Ribeiro, M.; Guedes, A. The Au-bearing vein system of the Limarinho deposit (northern Portugal): Genetic constraints from Bi-chalcogenides and Bi–Pb–Ag sulfosalts, fluid inclusions and stable isotopes. Ore Geol. Rev. 2016, 72, 213–231. [Google Scholar] [CrossRef]
  76. Liard, J. Chlorites: Metamorphic petrology. Rev. Mineral. 1988, 19, 405–447. [Google Scholar]
  77. Cathelineau, M. Cation site occupancy in chlorites and illites as a function of temperature. Clay Miner. 1988, 23, 471–485. [Google Scholar] [CrossRef]
  78. Zhu, X.K.; O’Nions, R.K. Monazite chemical composition: Some implications for monazite geochronology. Contrib. Mineral. Petrol. 1999, 137, 351–363. [Google Scholar] [CrossRef]
  79. Schandl, E.S.; Gorton, M.P. A textural and geochemical guide to the identification of hydrothermal monazite: Criteria for selection of samples for dating epigenetic hydrothermal ore deposits. Econ. Geol. 2004, 99, 1027–1035. [Google Scholar] [CrossRef]
  80. Števko, M.; Uher, P.; Ondrejka, M.; Ozdín, D.; Bačík, P. Quartz–apatite–REE phosphates–uraninite vein mineralization near Čučma (eastern Slovakia): A product of early Alpine hydrothermal activity in the Gemeric Superunit, Western Carpathians. J. Geosci. 2014, 59, 209–222. [Google Scholar] [CrossRef] [Green Version]
  81. Taylor, R.D. Orogenic gold formation and tectonic evolution of the Grass Valley gold district and temporal correlations of gold deposits in California. Ph.D. Thesis, Colorado School of Mines, Golden, CO, USA, 2015; p. 149, unpublished. [Google Scholar]
  82. Dolníček, Z.; Ulmanová, J. Mineralogy of two types of hydrothermal veins containing REE minerals from the quarry near Vrbčany (Kutná Hora Crystalline Complex). Bull. Mineral. Petrolog. 2019, 27, 331–345. (In Czech) [Google Scholar]
  83. Stormer, J.C., Jr.; Pierson, M.J.; Tacker, R.C. Variation of F and Cl X-ray intensity due to anisotropic diffusion of apatite during electron microprobe analysis. Am. Mineral. 1993, 78, 641–648. [Google Scholar]
  84. Trdlička, Z.; Hoffman, V. Untersuchungen der chemischen Zusammensetzung der Gangkarbonate von Kutná Hora (ČSSR). Freib. Forsch. 1975, 6, 29–81. [Google Scholar]
  85. Cílek, V.; Prokeš, S.; Škubal, M.; Hladíková, J.; Šmejkal, V.; Žák, K. Geochemistry of hydrothermal carbonates of the Příbram uranium deposit. Vlast. Sbor. Podbrdska 1984, 26, 79–102. (In Czech) [Google Scholar]
  86. Žák, K.; Dobeš, P. Stable isotopes and fluid inclusions in hydrothermal deposits: The Příbram ore region. Rozpr. ČSAV 1991, 101, 1–109. [Google Scholar]
  87. Morishita, Y. Fluid evolution and geobarometry on the Ohtani and Kaneuchi tungsten-quartz vein deposits, Japan: Oxygen and carbon isotopic evidence. Mineral. Depos. 1991, 26, 40–50. [Google Scholar] [CrossRef]
  88. Morishita, Y.; Nishio, Y. Ore genesis of the Takatori tungsten–quartz vein deposit, Japan: Chemical and isotopic evidence. Minerals 2021, 11, 765. [Google Scholar] [CrossRef]
  89. Zachariáš, J.; Pertold, Z.; Stein, H.; Markey, R.; Pudilová, M.; Pertoldová, J.; Stein, H.; Markey, R. Geology and genesis of Variscan porphyry-style gold mineralization, Petráčkova hora deposit, Bohemian Massif, Czech Republic. Mineral. Depos. 2001, 36, 517–541. [Google Scholar] [CrossRef]
  90. Bortnikov, N.S. On the reliability of arsenopyrite and arsenopyrite-sphalerite geothermometers. Geol. Ore Depos. 1993, 35, 159–172. [Google Scholar]
  91. Kerestedjian, T. Chemical and morphological features of arsenopyrite, concerning its use as a geothermometer. Miner. Petrol. 1997, 60, 231–243. [Google Scholar] [CrossRef]
  92. Suchý, V.; Sandler, A.; Slobodník, M.; Sýkorová, I.; Filip, J.; Melka, K.; Zeman, A. Diagenesis to very low-grade metamorphism in lower Palaeozoic sediments: A case study from deep borehole Tobolka 1, the Barrandian Basin, Czech Republic. Int. J. Coal Geol. 2015, 140, 41–62. [Google Scholar] [CrossRef]
  93. Žák, J.; Holub, F.V.; Verner, K. Tectonic evolution of continental magmatic arc from transpression in the upper crust to exhumation of mid-crustal orogenic root recorded by episodically emplaced plutons: The Central Bohemian Plutonic Complex, Bohemian Massif. Int. J. Earth Sci. 2005, 94, 385–400. [Google Scholar] [CrossRef]
  94. Dolníček, Z.; Stöhr, P.; Ulmanová, J.; Vrtiška, L.; Malíková, R. Dickite-bearing hydrothermal mineralization in Ordovician claystones of the Bohdalec Formation from the tunnel of subway Line D in Prague-Pankrác. Bull. Mineral. Petrolog. 2020, 28, 116–125. (In Czech) [Google Scholar] [CrossRef]
  95. Janoušek, V.; Braithwaite, C.J.R.; Bowes, D.R.; Gerdes, A. Magma-mixing in the genesis of Hercynian calc-alkaline granitoids: An integrated petrographic and geochemical study of the Sázava intrusion, Central Bohemian Pluton, Czech Republic. Lithos 2004, 78, 67–99. [Google Scholar] [CrossRef]
  96. Deer, W.A.; Howie, R.A.; Zussman, J. Rock-Forming Minerals: Feldspars; Volume 4A, Geological Society of London: London, UK, 2001. [Google Scholar]
  97. Liu, W.; Etschmann, B.; Migdisov, A.; Boukhalfa, H.; Testemale, D.; Müller, H.; Hazemann, J.-L.; Brugger, J. Revisiting the hydrothermal geochemistry of europium (II/III) in light of new in-situ XAS spectroscopy results. Chem. Geol. 2017, 459, 61–74. [Google Scholar] [CrossRef]
  98. Sverjensky, D.A. Europium redox equilibria in aqueous solution. Earth Planet. Sci. Lett. 1984, 67, 70–78. [Google Scholar] [CrossRef]
  99. Bau, M. Rare-earth element mobility during hydrothermal and metamorphic fluid-rock interaction and the significance on the oxidation state of europium. Chem. Geol. 1991, 93, 219–230. [Google Scholar] [CrossRef]
  100. Bau, M.; Möller, P. Rare earth element fractionation in metamorphogenic hydrothermal calcite, magnesite and siderite. Mineral. Petrol. 1992, 45, 231–246. [Google Scholar] [CrossRef]
  101. Lee, S.G.; Lee, D.H.; Kim, Y.; Chae, B.G.; Kim, W.Y.; Woo, N.C. Rare earth elements as indicators of groundwater environment changes in a fractured rock system: Evidence from fracture—Filling calcite. Appl. Geoch. 2003, 18, 135–143. [Google Scholar] [CrossRef]
  102. Dörr, W.; Zulauf, G. Elevator tectonics and orogenic collapse of a Tibetan-style plateau in the European Variscides: The role of the Bohemian shear zone. Int. J. Earth Sci. (Geol. Rundsch.) 2010, 99, 299–325. [Google Scholar] [CrossRef]
  103. Wood, S.A. The aqueous geochemistry of rare earth elements and yttrium. 2. Theoretical predictions of speciation in hydrothermal solutions to 350 °C at saturated water pressure. Chem. Geol. 1990, 88, 99–125. [Google Scholar] [CrossRef]
  104. Migdisov, A.; Williams-Jones, A.E. Hydrothermal transport and deposition of the Rare Earth Elements by fluorine-bearing aqueous liquids. Mineral. Depos. 2014, 49, 987–997. [Google Scholar] [CrossRef]
  105. Shikazono, N.; Shimizu, M. The Ag/Au ratio of native gold and electrum and the geochemical environment of gold vein deposits in Japan. Miner. Depos. 1987, 22, 309–314. [Google Scholar] [CrossRef] [Green Version]
  106. Morrison, G.W.; Rose, W.J.; Jaireth, S. Geological and geochemical controls on the silver content (fineness) of gold in gold-silver deposits. Ore Geol. Rev. 1991, 6, 333–364. [Google Scholar] [CrossRef]
  107. Gammons, C.H.; Williams-Jones, A.E. Hydrothermal geochemistry of electrum: Thermodynamic constraints. Econ. Geol. 1995, 90, 420–432. [Google Scholar] [CrossRef]
  108. Zachariáš, J.; Paterová, B.; Pudilová, M. Mineralogy, fluid inclusion and stable isotope constraints on the genesis of the Roudný Au-Ag deposit, Bohemian Massif. Econ. Geol. 2009, 104, 53–72. [Google Scholar] [CrossRef]
  109. Zachariáš, J.; Žák, K.; Pudilová, M.; Snee, L.W. Multiple fluid sources/pathways and severe thermal gradients during formation of the Jílové orogenic gold deposit, Bohemian Massif, Czech Republic. Ore Geol. Rev. 2013, 54, 81–109. [Google Scholar] [CrossRef]
  110. Žák, K.; Svojtka, M.; Breiter, K.; Ackerman, L.; Zachariáš, J.; Pašava, J.; Veselovský, F.; Litochleb, J.; Ďurišová, J.; Haluzová, E. Padrť Stock (Teplá-Barrandian Unit, Bohemian Massif): Petrology, geochemistry, U-Pb zircon dating of granodiorite, and Re-Os age and origin of related molybdenite mineralization. J. Geosci. 2014, 59, 351–366. [Google Scholar] [CrossRef]
Figure 1. Geological position of the Příbram ore area and studied vein Bt23C, modified from Ettler et al. [1].
Minerals 12 01539 g001
Figure 2. The SW–NE section of the Příbram uranium ore district (modified from Komínek [7]); localization of described ore stope is marked by green circle; 1—tuffs and tuffites of the Davle Group (Neoproterozoic); 2—claystones, siltstones, and sandstones of the Dobříš Group (Neoproterozoic); 3—faults; 4—hydrothermal veins with uranium mineralization; 5—hydrothermal veins with base-metal mineralization; 6—hydrothermal veins with monometallic Ag mineralization; 7—shafts; 8— shaft numbers.
Minerals 12 01539 g002
Figure 3. The geological situation of the described ore stope, modified according to the documentation of the Správa uranových ložisek, o.z., Příbram. 1—metamorphosed sediments of the Dobříš Group; 2—granodiorite porphyrite; 3—hydrothermal vein with base-metal mineralization; 4—hydrothermal vein with Au-bearing mineralization with determined Au contents (ppm); 5—small dislocations.
Minerals 12 01539 g003
Figure 4. Microphotographs of gold-bearing quartz gangue: (AC) Poorly transparent quartz (Q-1) crosscut by carbonate (Dol) and quartz (Q-2) veinlets. The black opaque phases largely correspond to gold and Bi-Te phases. Note that some quartz-2 veinlets host the gold (Au). (C) Complex crosscutting relationships between the quartz-2 and dolomite (Dol) veinlets. (D) Detailed image of a veinlet crosscutting oldest quartz (Q-1) composed of subhedral crystals of quartz-2. (E) Crosscutting relationship between the quartz Q-1, Q-2, and Q-3. (F) Euhedral crystals of the latest quartz (Q-4) on the edge of dolomite–ankerite (Dol) veinlet.
Minerals 12 01539 g004
Figure 5. Gangue minerals of the studied Au-bearing vein in BSE images: (a) The oldest portion of vein fill composed of illite–muscovite (I–M), chlorite (Chl), calcite (Ca), apatite (Ap), and arsenopyrite (Apy). (b) Zonal aggregate composed of chlorite (Chl) and dolomite–ankerite (Do) developed around quartz (Q) with minor TiO2 phase (TiO2) and illite–muscovite (I–M). (c) Cracked arsenopyrite (Apy) with crack-hosted grains of monazite (Mnz), sphalerite (Sp), and galena (Ga). (d) Siderite (Sd) and quartz (Q) strongly corroded by calcite (Ca). (e) Nest of strongly zoned dolomite–ankerite (Do) hosted by quartz (Q) and containing aggregates of Bi-tellurides (Bi-Te), which are sometimes clearly younger than euhedral crystals of dolomite–ankerite (inset). (f) Nest of complexly zoned dolomite–ankerite (Do) hosted by quartz (Q) and illite–muscovite (I–M) gangue. The vug in dolomite–ankerite contains a grain of sphalerite (Sp).
Minerals 12 01539 g005
Figure 6. Textures of arsenopyrite-rich portions of the studied Au-bearing vein in BSE images: (a) Compositional zoning of fractured arsenopyrite (Asp). (b) Arsenopyrite (Asp) hosted by calcite (Ca) and quartz (Q) gangue cut by younger ore veinlet composed of sphalerite (Sp), galena (Ga), and chalcopyrite (Cp). (c) Crushed arsenopyrite (Asp) cemented by quartz (Q) with abundant gold (Au) grains. (d) Crushed arsenopyrite (Asp) cemented by gold (Au) only. Note the gold veinlet continuing into the host quartz (Q) gangue. I–M—illite–muscovite, Cp—chalcopyrite.
Minerals 12 01539 g006
Figure 7. Textures of gold-rich portions of the studied Au-bearing vein in BSE images: (a) A group of gold grains with contrasting fineness. The central grain shows diffuse internal zonality with increasing Ag towards the margin and dark veinlets richest in Ag. (b) Veinlets of Ag-rich Ag-Au alloy (Ag-Au) cutting the Au-rich Ag-Au alloy (Au-Ag). (c) Zoned Ag-Au alloy partly rimmed by dyscrasite (Dc). (d) Gold grain (Au) partly replaced by aurostibite (Aus). (e) A group of gold grains (Au) partly or completely replaced by aurostibite (Aus), an unnamed (Au,Ag)-Sb oxide (ASO) and acanthite (Ac). (f) Grain of aurostibite (Aus) partly replaced by an unnamed (Au,Ag)-Sb oxide (ASO).
Minerals 12 01539 g007
Figure 8. Textures of some ore minerals of the studied Au-bearing vein in BSE images: (a) Relic of aurostibite (Aus) replaced by an unnamed strongly zoned (Au,Ag)-Sb oxide (ASO). (b) An aggregate of Bi-tellurides composed of tetradymite (Td) rimmed by tsumoite (Ts). (c) An aggregate of Bi-tellurides composed of sulphotsumoite (Sts), tetradymite (Td), and tsumoite (Ts). (d) Mineralogically rich ore aggregate composed of native bismuth (Bi) rimmed by hedleyite (Hs), galena (Ga), and hessite (He). (e) High-fineness gold (Au) grains slightly replaced by aurostibite (Aus), galena (Ga), and an unnamed Bi2Te (Bi2Te). (f) Intergrowth of galena (Ga) and native antimony (Sb) growing over arsenopyrite (Apy).
Minerals 12 01539 g008
Figure 9. Compositional variation of zonal arsenopyrite in an As versus S (apfu) plot.
Minerals 12 01539 g009
Figure 10. Chemical composition of Bi-(sulpho)tellurides in a Te versus S + Se (at. %) plot; numbers show Me:X ratio.
Minerals 12 01539 g010
Figure 11. The Pb and Sb contents (at. %) in Bi-(sulpho)tellurides.
Minerals 12 01539 g011
Figure 12. Chemical composition of tsumoite and pilsenite in a Pb (at. %) versus Me/X ratio plot.
Minerals 12 01539 g012
Figure 13. Chemical composition of members of Au-Ag solid-solution in an Ag versus Au (at. %) plot.
Minerals 12 01539 g013
Figure 14. Chemical composition of members of Au-Ag solid-solution in an Au versus Hg (at. %) plot.
Minerals 12 01539 g014
Figure 15. Chemical composition of members of Au-Ag solid-solution in an Au versus Sb (at. %) plot.
Minerals 12 01539 g015
Figure 16. Chemical composition of dyscrasite in an Ag versus Au (apfu) plot.
Minerals 12 01539 g016
Figure 17. Chemical composition of Au-Sb oxide in an Ag versus Au (apfu) plot.
Minerals 12 01539 g017
Figure 18. Chemical composition of Au-Sb oxides and mustard gold in a ternary Ag-Sb*-Au (atomic per cent) plot (Sb* = Sb+Bi+As+Te+Fe+Hg+Zn) [52,54,55,56,57].
Minerals 12 01539 g018
Figure 19. Chemical composition of white mica and its comparison with those of other gold deposits. Diagram is adopted from Maydagán et al. [58], with boundaries for illite modified from Rieder et al. [59]. Note that the low amount of comparative data is caused by the lack of primary analytical data in many publications. Comparative data are from Maydagán et al. [58], de Siqueira Corrêa et al. [60], Klein et al. [61], Demange et al. [62], and Dolníček et al. [63].
Minerals 12 01539 g019
Figure 20. (a) Chemical composition of chlorite in the classification scheme by Melka [65] and its comparison with those of other gold deposits. Comparative data are from Demange et al. [62]; Moura et al. [66]; Buchholz et al. [67]; Klein et al. [61,68]; Zoheir et al. [69,70]; Zachariáš and Novák [71]; Zoheir and Akawy [72]; Crispini et al. [73]; de Siqueira Corrêa et al. [60]; Dora and Randive [74]; Fuertes-Fuente et al. [75], and Dolníček et al. [63]. (b) Position of chlorite in the empirical diagram of Liard [76]. (c) Histogram of temperatures derived from chlorite compositional thermometry by Cathelineau [77].
Minerals 12 01539 g020
Figure 21. (a) Chondrite-normalized REE patterns of monazite. (b) The Eu/Eu* vs. LaCN/SmCN plot for monazite from Bytíz in comparison with other hydrothermal monazites. Comparative data are from Zhu and OʼNions [78]; Schandl and Gorton [79]; Števko et al. [80]; Taylor [81]; Dolníček et al. [63] and Dolníček and Ulmanová [82].
Minerals 12 01539 g021
Figure 22. Chemical composition of calcites and siderites from Bytíz in the Mg-Fe-Mn plot and the Ca-Fe-Mn plot (modified from Trdlička, Hoffman [84]. Comparative data are from Sejkora et al. [4].
Minerals 12 01539 g022
Figure 23. Chemical composition of carbonates of the dolomite–ankerite series from Bytíz in the Mg-Fe-Mn plot (modified from Trdlička and Hoffman [84]). Comparative data are from Cílek et al. [86] and Sejkora et al. [85].
Minerals 12 01539 g023
Figure 24. Examples of fluid inclusions from quartz Q-2 (ac), quartz Q-3 (d), quartz Q-4 (e), dolomite (f,g), and calcite (h) from the studied gold-bearing vein.
Minerals 12 01539 g024
Figure 25. Total homogenization (Th) versus melting temperature of the last crystal of ice (Tm-ice) plot of fluid inclusions. (A) Data from the studied Au-bearing vein. (B) Comparative data from base-metal and uranium veins of the Příbram ore area. Symbols—data from base-metal vein Bt23C (Ulmanová et al. [5]) cutting the studied Au-bearing vein; fields—published data [87].
Minerals 12 01539 g025
Figure 26. Generalized paragenetic sequence of the studied Au-bearing vein from Bytíz.
Minerals 12 01539 g026
Figure 27. Phase diagram of the Fe-As-S system showing the correlation between the As content of arsenopyrite (at. %) and temperature and sulfur fugacity. The red dotted line shows the stability of bismuthinite (Bsm) and liquid bismuth (Bi (l)). The shaded field indicates estimated conditions of formation of arsenopyrite from the studied vein, based on the most typical range of As (at. %) content.
Minerals 12 01539 g027
Figure 28. Estimated P–T conditions for the studied Au-bearing vein based on a combination of isochors of fluid inclusions and independent temperature/pressure estimates. Thick grey curve illustrates possible evolution trend. The P–T field for late quartz from base-metal vein Bt23C is based on fluid inclusions containing immiscible aqueous-carbonic fluids (Ulmanová et al. [5]).
Minerals 12 01539 g028
Table 1. Microthermometric data from fluid inclusions hosted by the studied Au-bearing vein from Bytíz. Temperature parameters in °C, salinity in wt. % NaCl eq. Numbers in parentheses refer to number of measurements.
SampleMineralGenesisPhase CompositionThTfTiTm–IceSalinity
By-1Q-2P/PSL+V150–256 (26)−35 −0.7/−1.6 (18)1.2–2.7
Q-2SL+V121–126 (4)−35 −0.1/−0.2 (2)0.2–0.4
By-2Q-2P/PSL+V122–361 (48)−42/−45 −1.1/−3.2 (41)1.9–5.3
Q-3P/PSL+V139–324 (28)−43/−46 −1.2/−4.4 (26)2.1–7.0
Q-4P/PSL+V, L76–104 (4)−55/−58 −12.1/−15.2 (7)16.1–18.9
DolPL+V, L84–214 (25)−47/−63–56 (1)−1.0/−16.8 (23)1.7–20.1
By-3Q-4PL+V, L81–123 (8)−52/−65 −10.1/−14.9 (9)14.1–18.6
Q-4PL+V, L104–161 (7)−40/−42 −0.1/−0.4 (14)0.2–0.7
DolPL+V, L156–178 (4)−67 −15.7/−16.0 (4)19.3–19.5
By-4Q-2P/PSL+V126–255 (42)−42/−45 −1.0/−2.4 (29)1.7–4.0
DolPL+V, L122–256 (30)−46/−72 −0.9/−21.3 (29)1.6–23.4
By-5Q-1?L+V112–226 (23)−40/−46 −0.8/−2.2 (17)1.4–3.7
Q-2P/PSL+V120–239 (8)−40/−45 −0.9/−2.0 (7)1.6–3.4
Q-2PS/SL+V66–135 (7)−40/−41 −0.4/−1.0 (5)0.7–2.2
CalP/PSL+V, L62–178 (19)−41/−48 −1.5/−3.3 (19)1.5–3.3
Publisher’s Note: MDPI stays neutral with regard to jurisdictional claims in published maps and institutional affiliations.

