
Seismic Wave Finite-Difference Forward Modeling for Orogenic Gold Deposits

Abstract
:1. Introduction
2. Method
2.1. Governing Equations
2.2. Numerical Implementation
3. Forward Modeling for Factors
3.1. Petrophysical Property
3.2. Dimensions
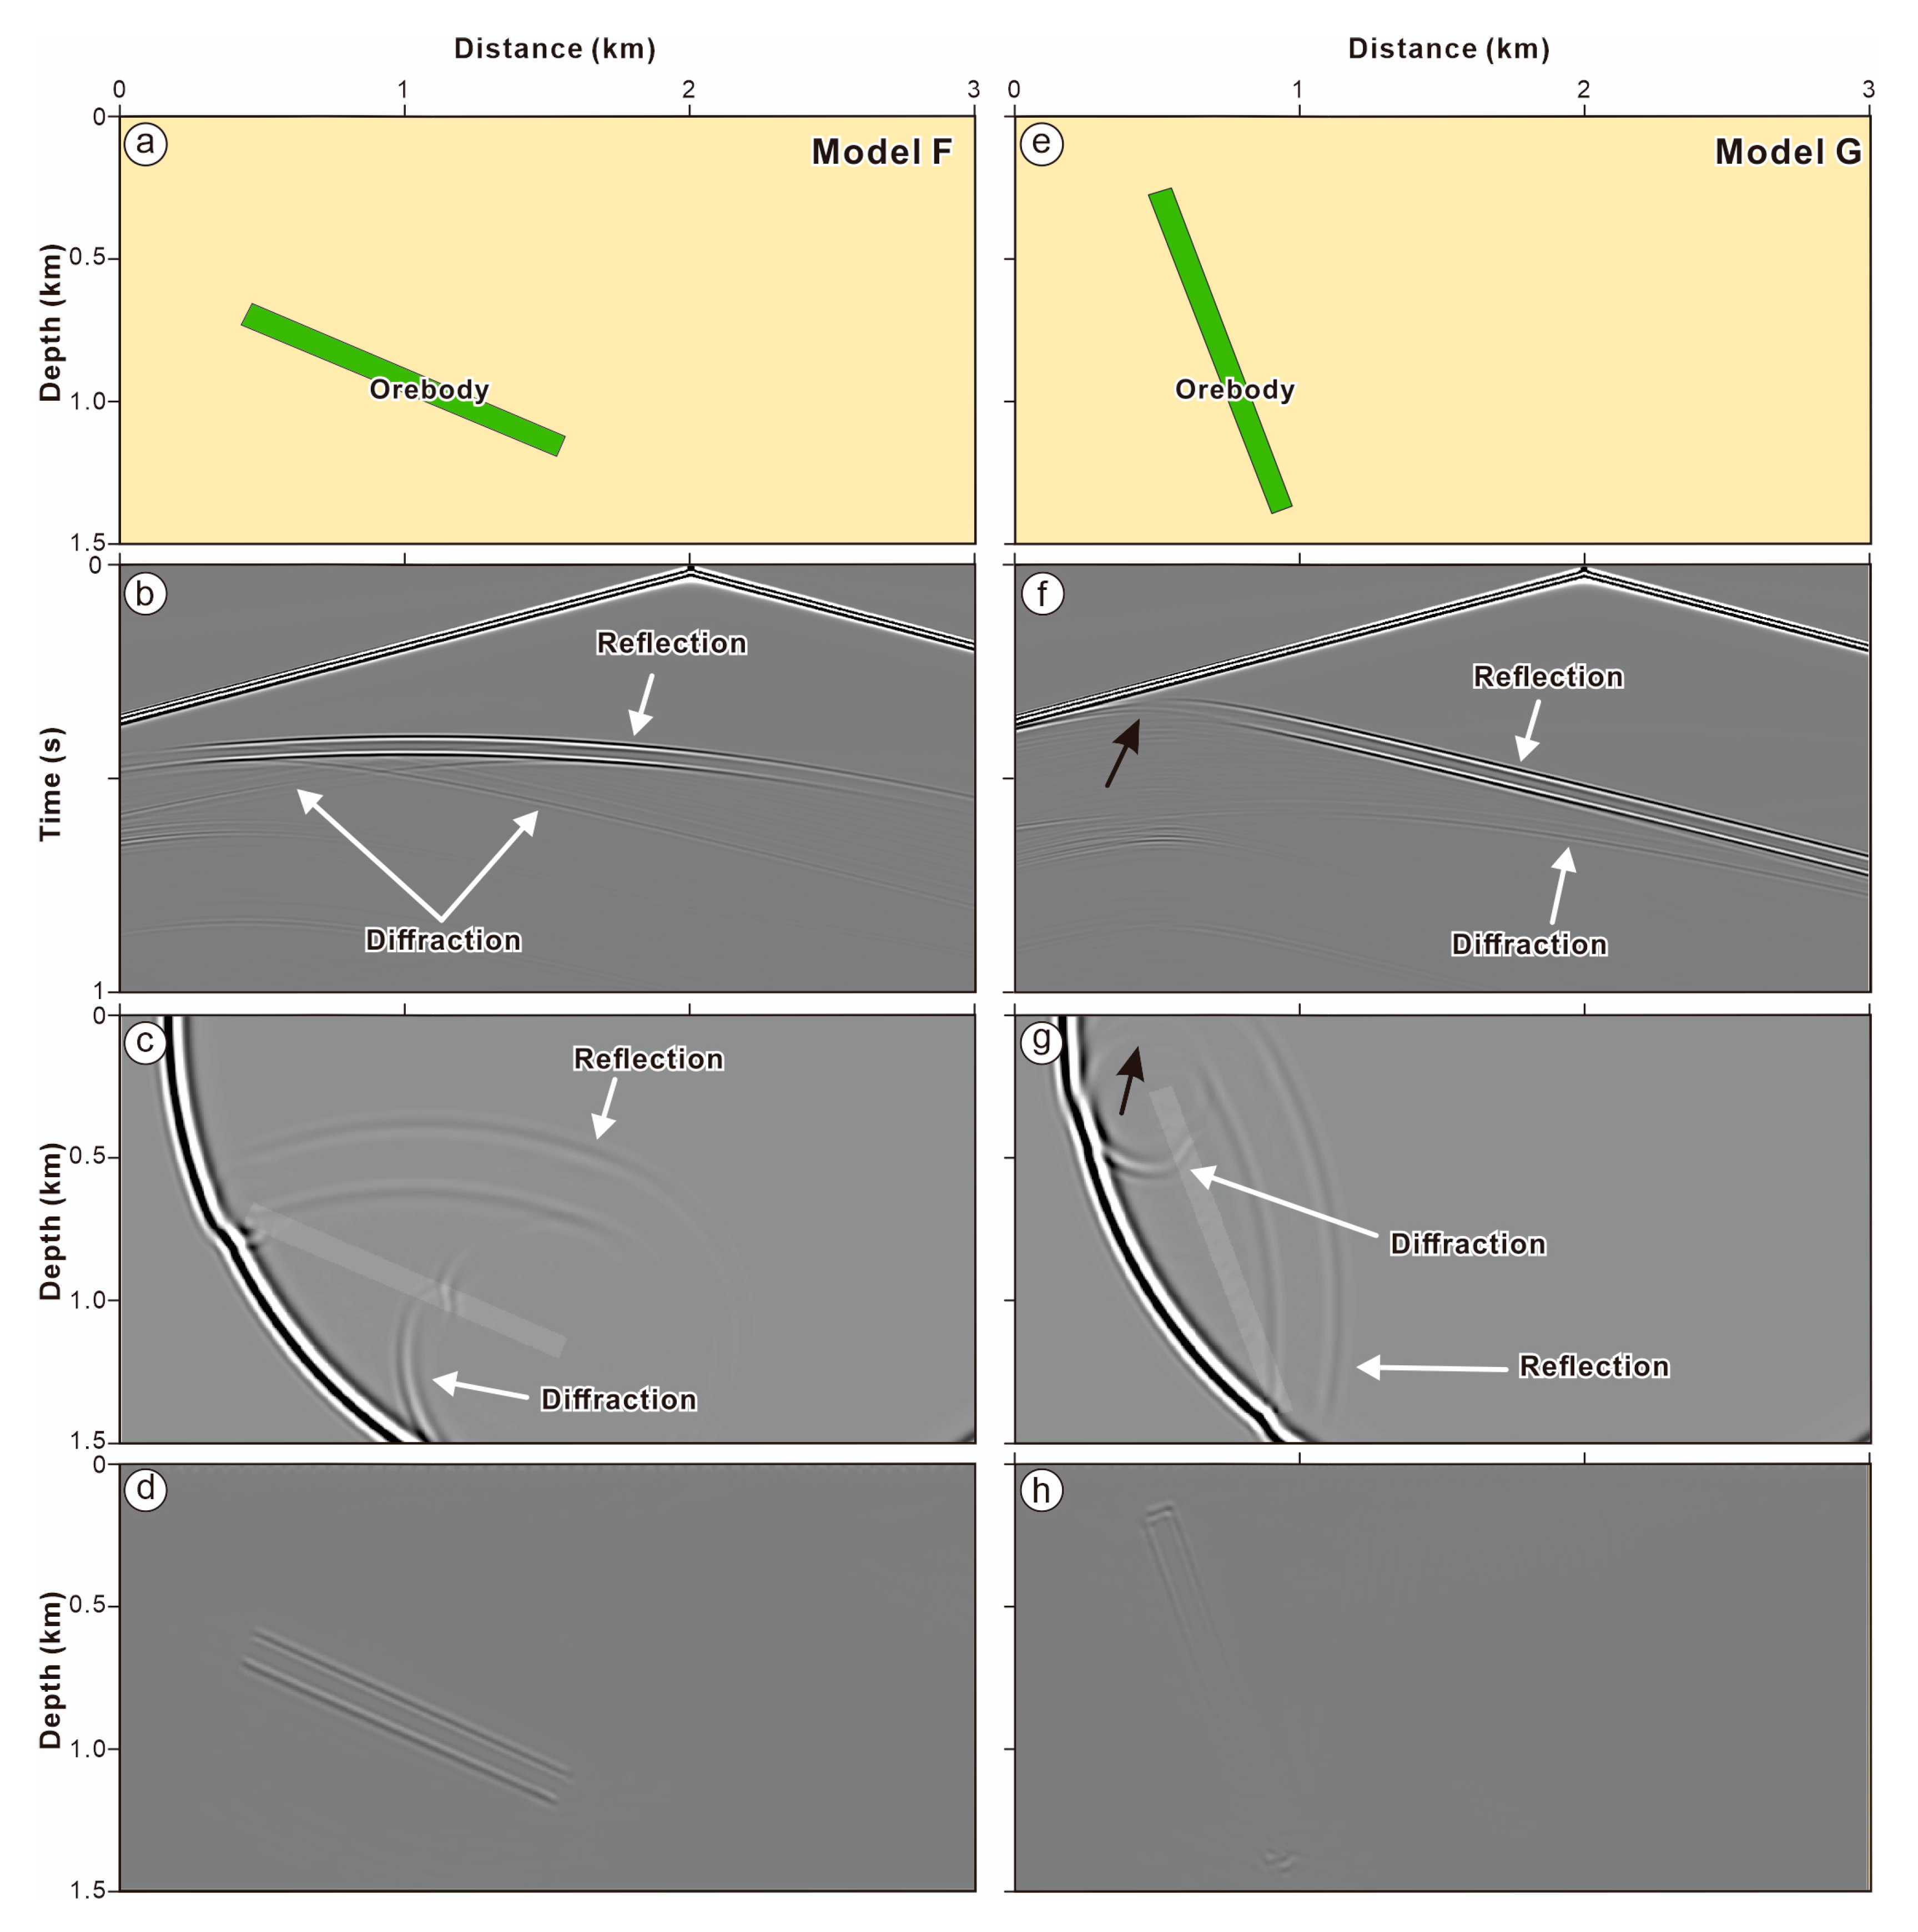
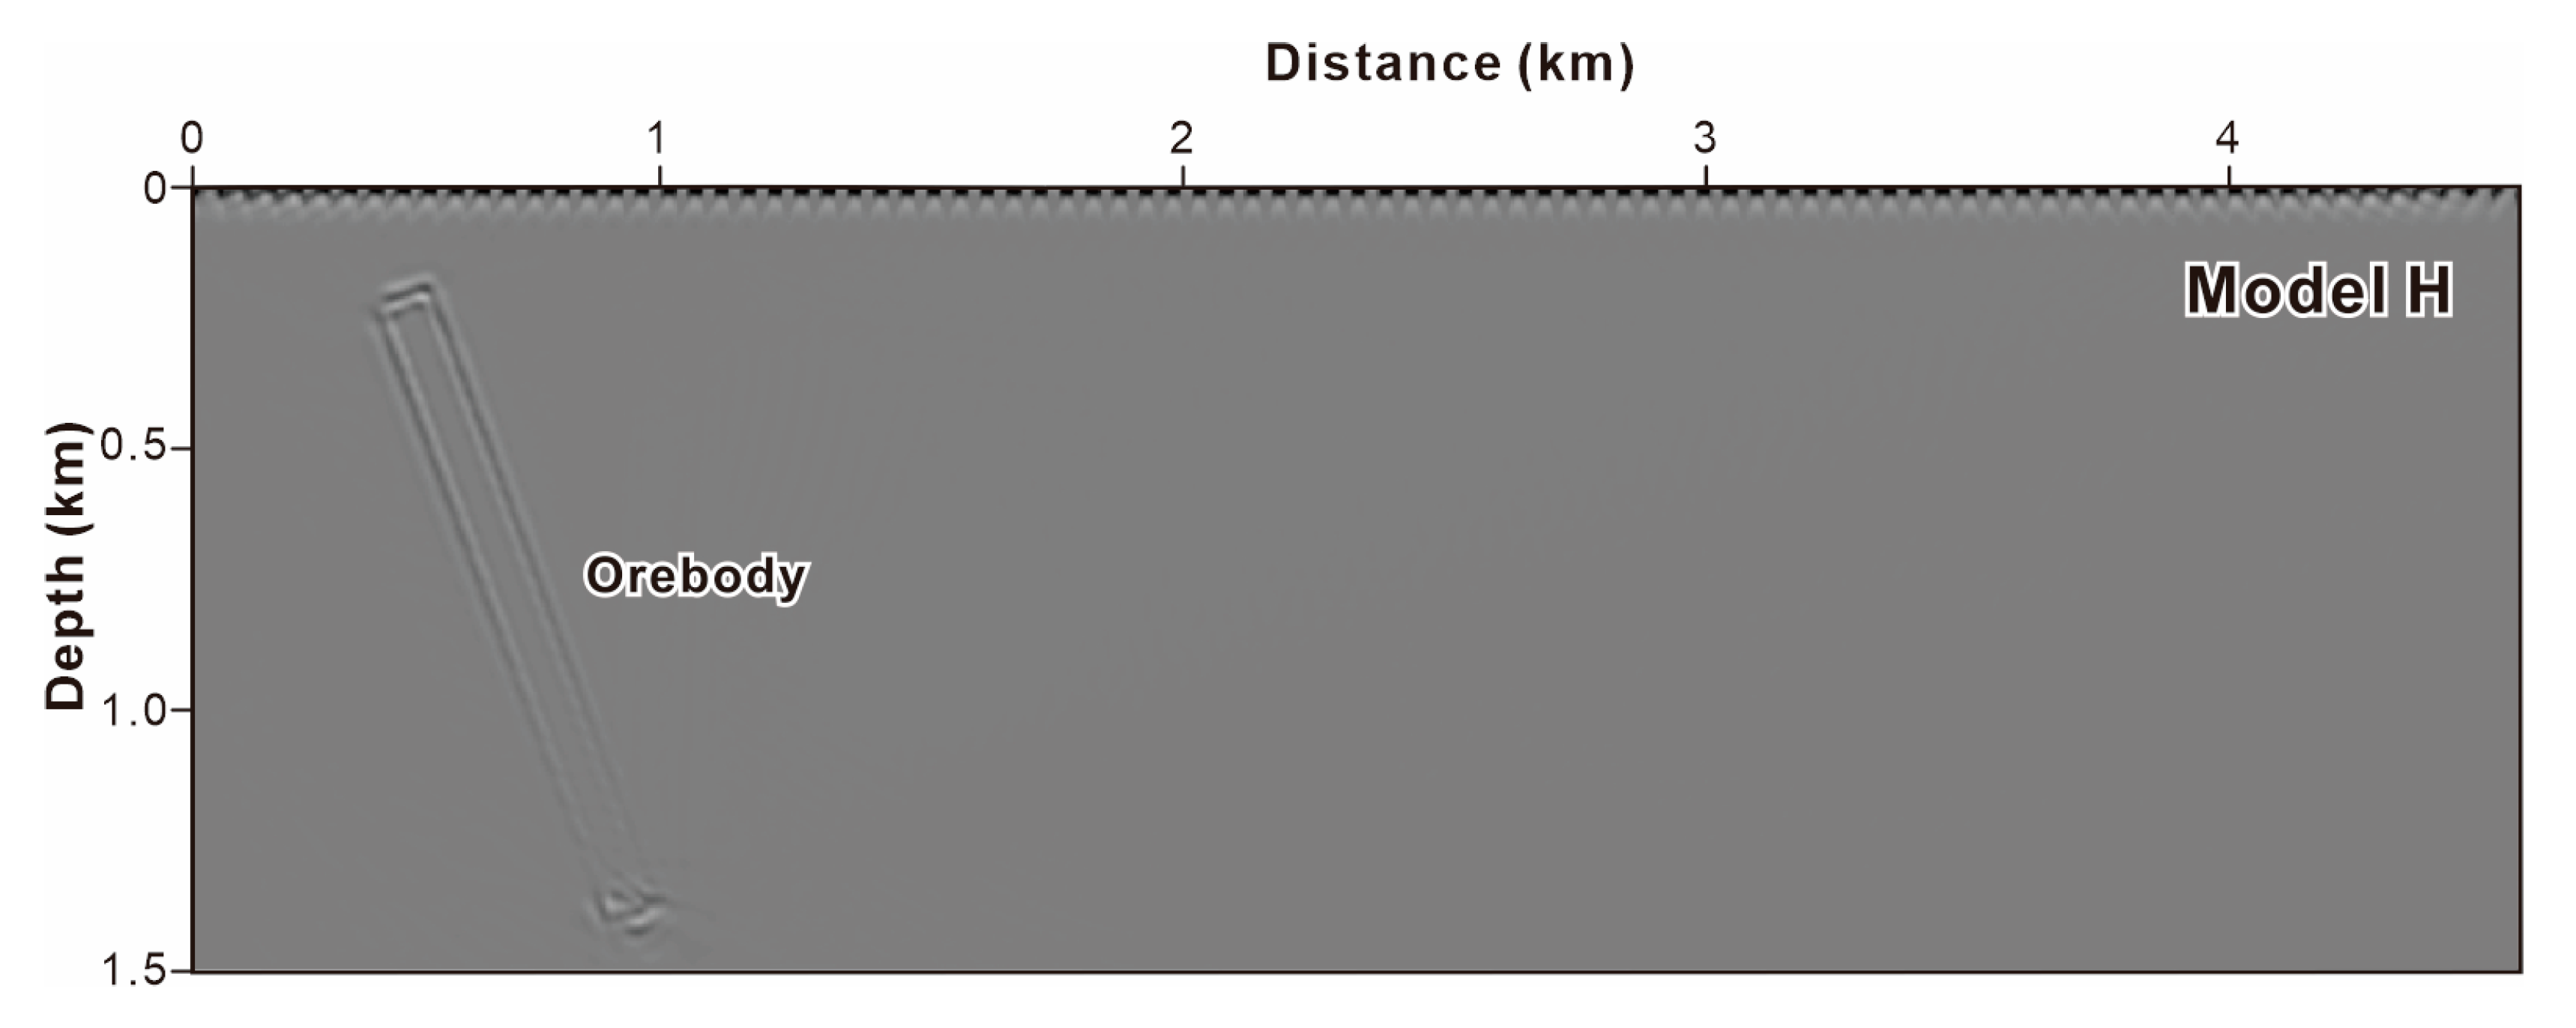
3.3. Dip
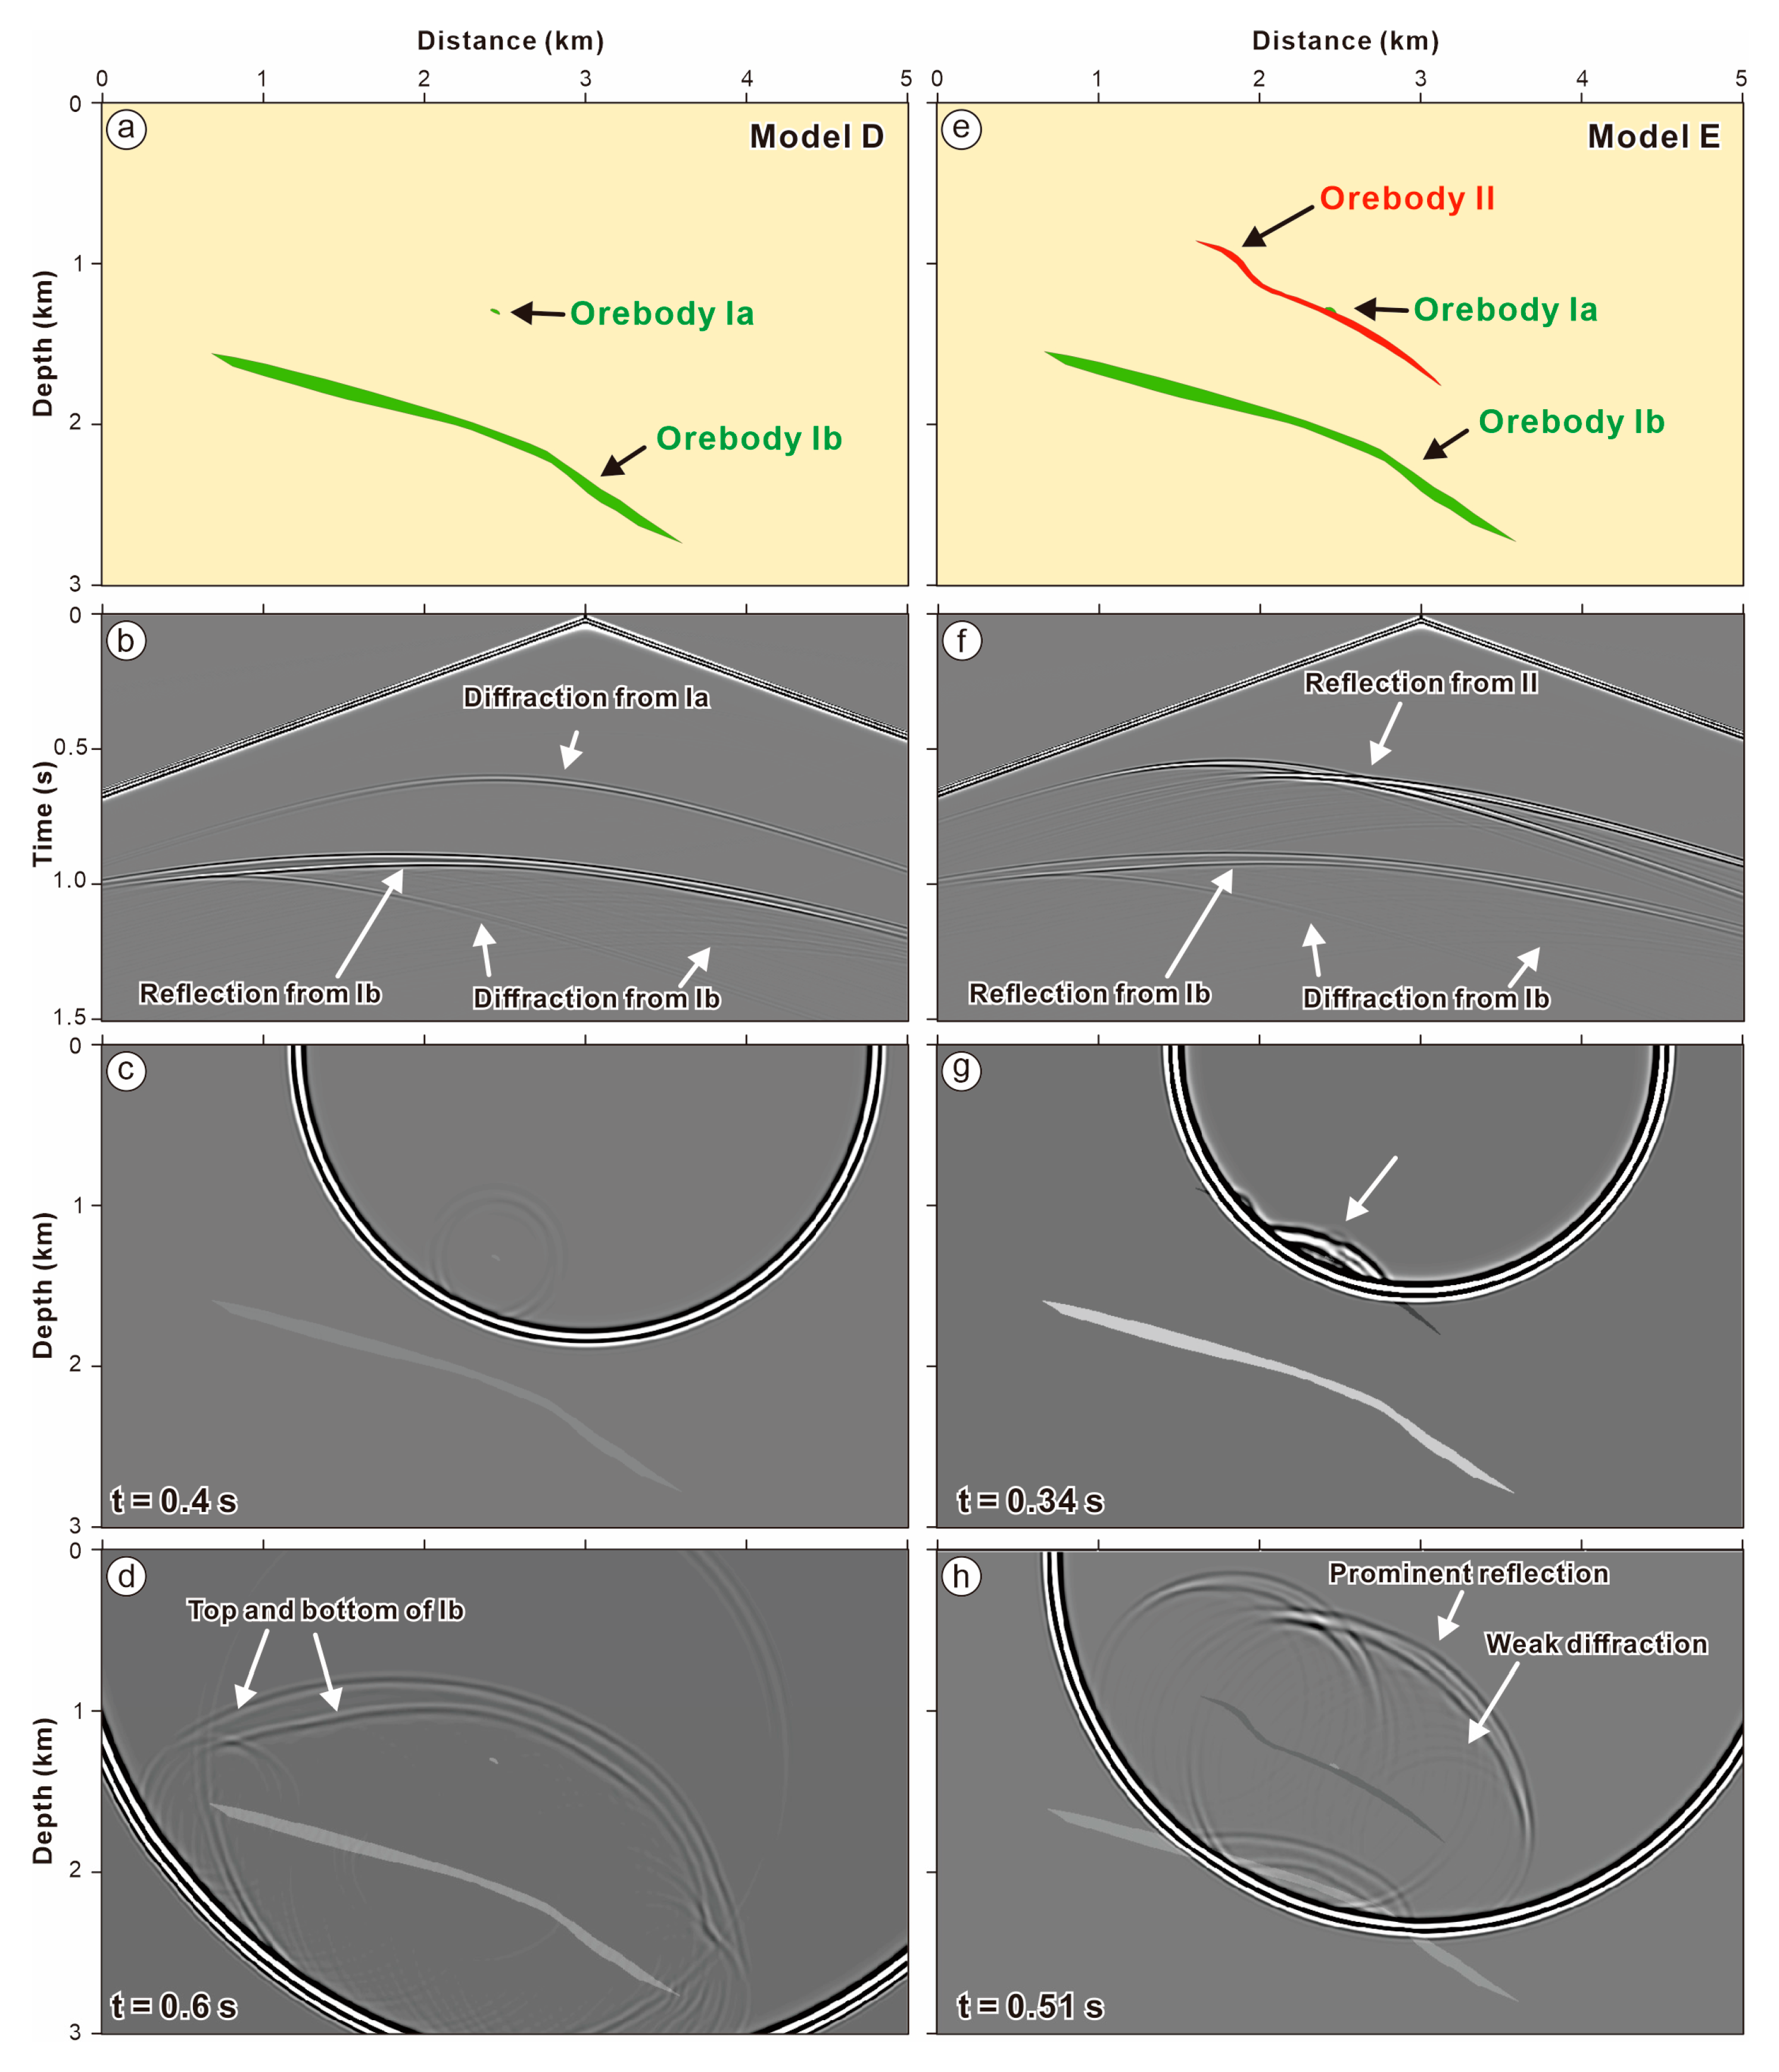
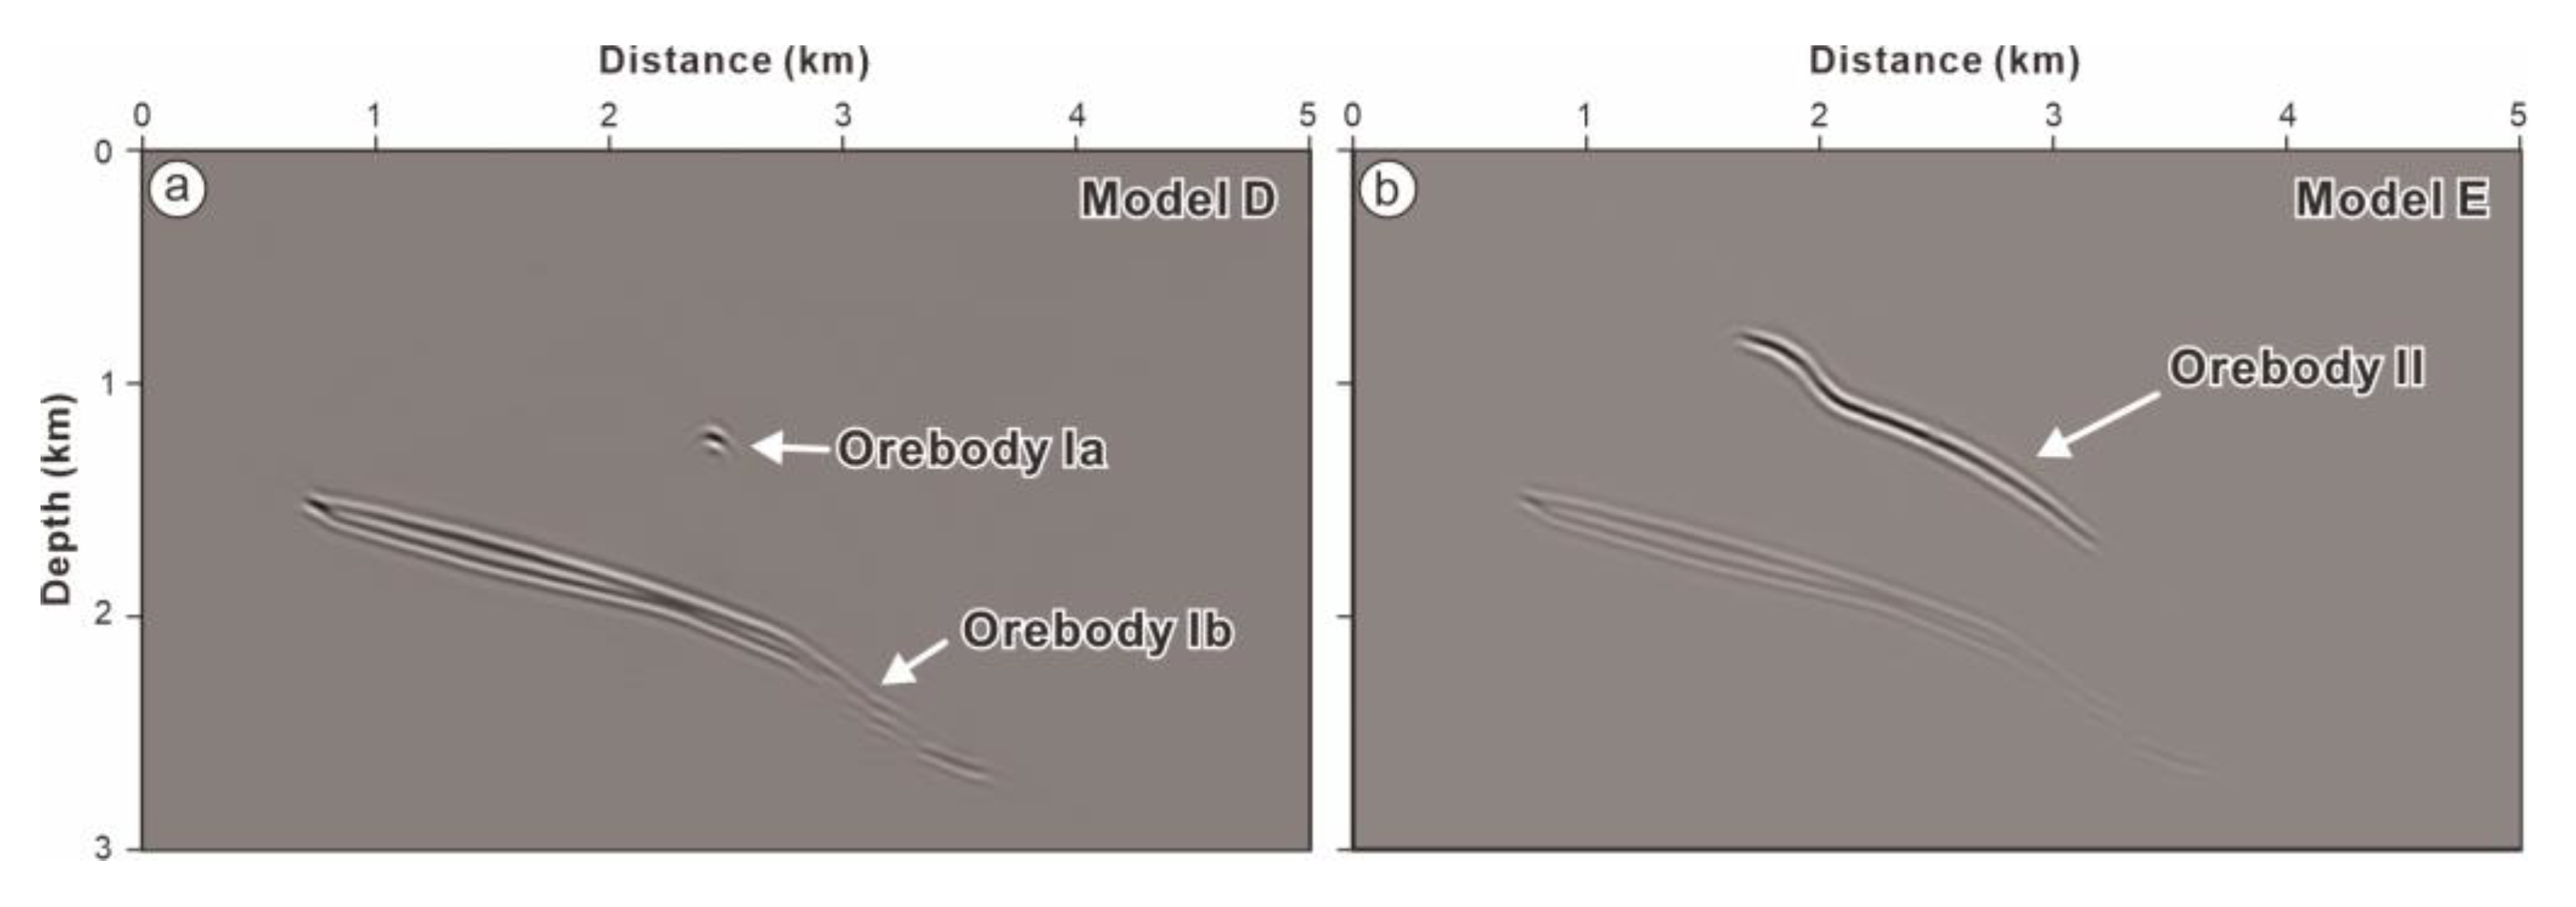
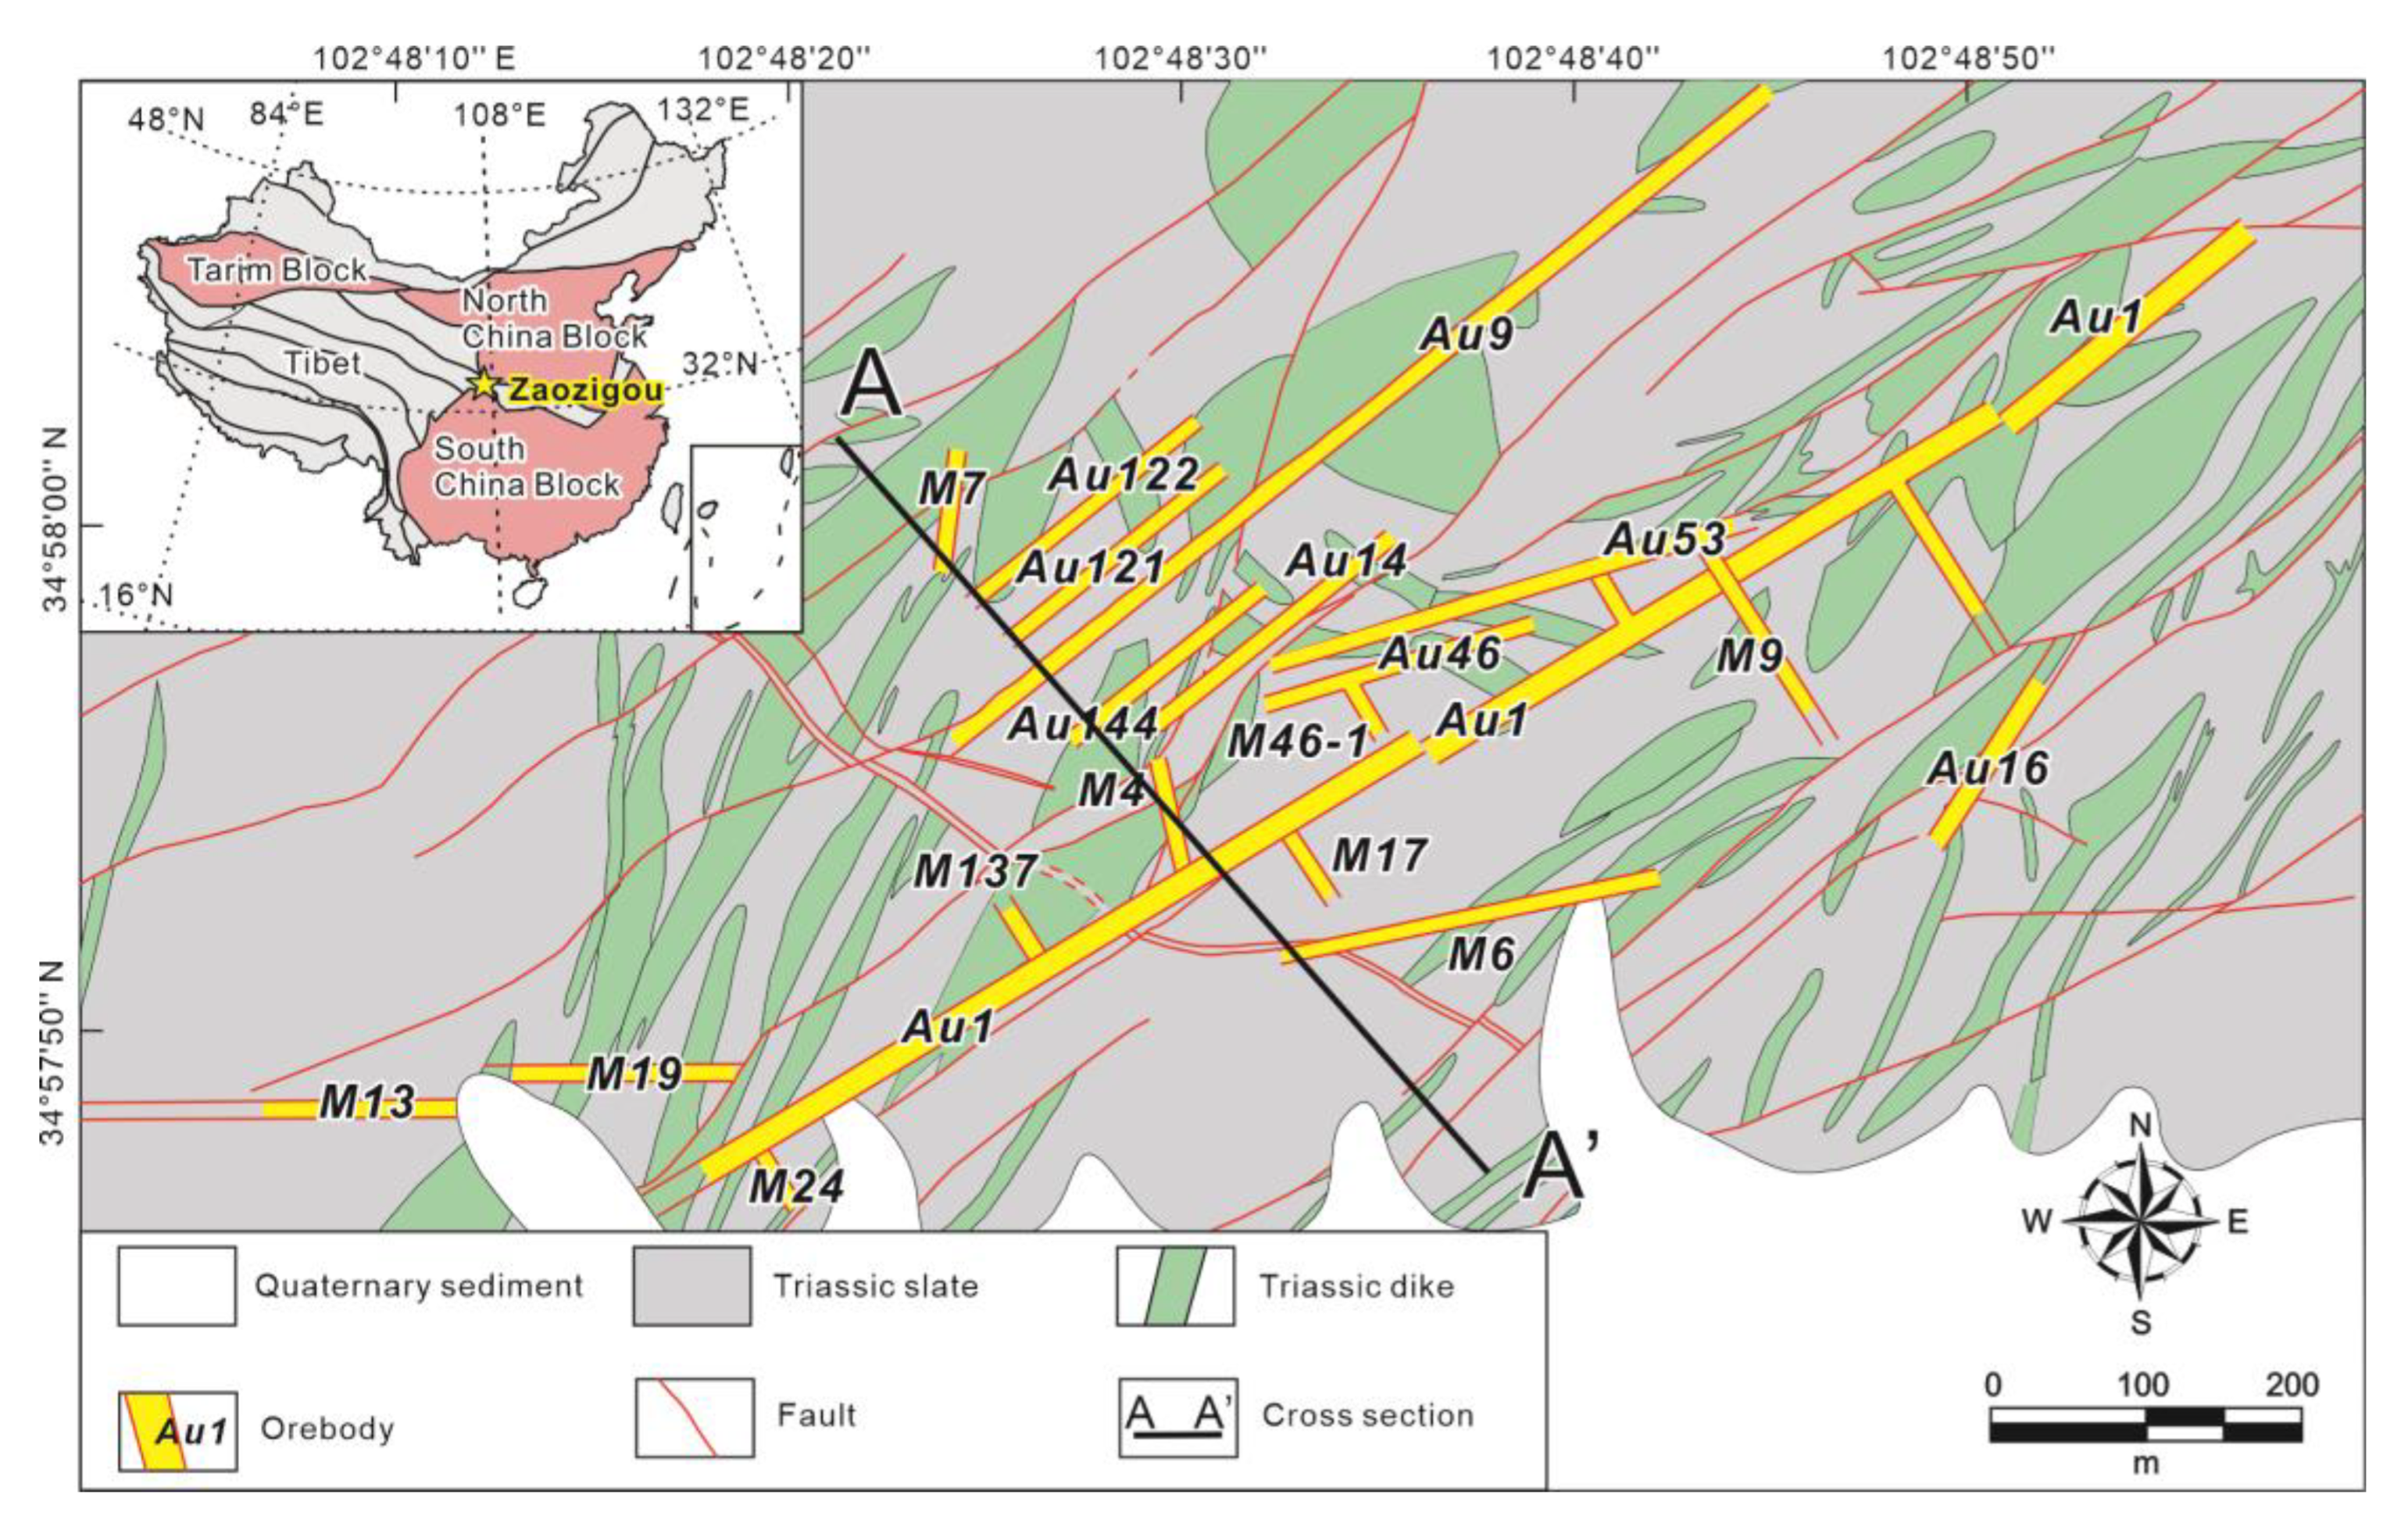
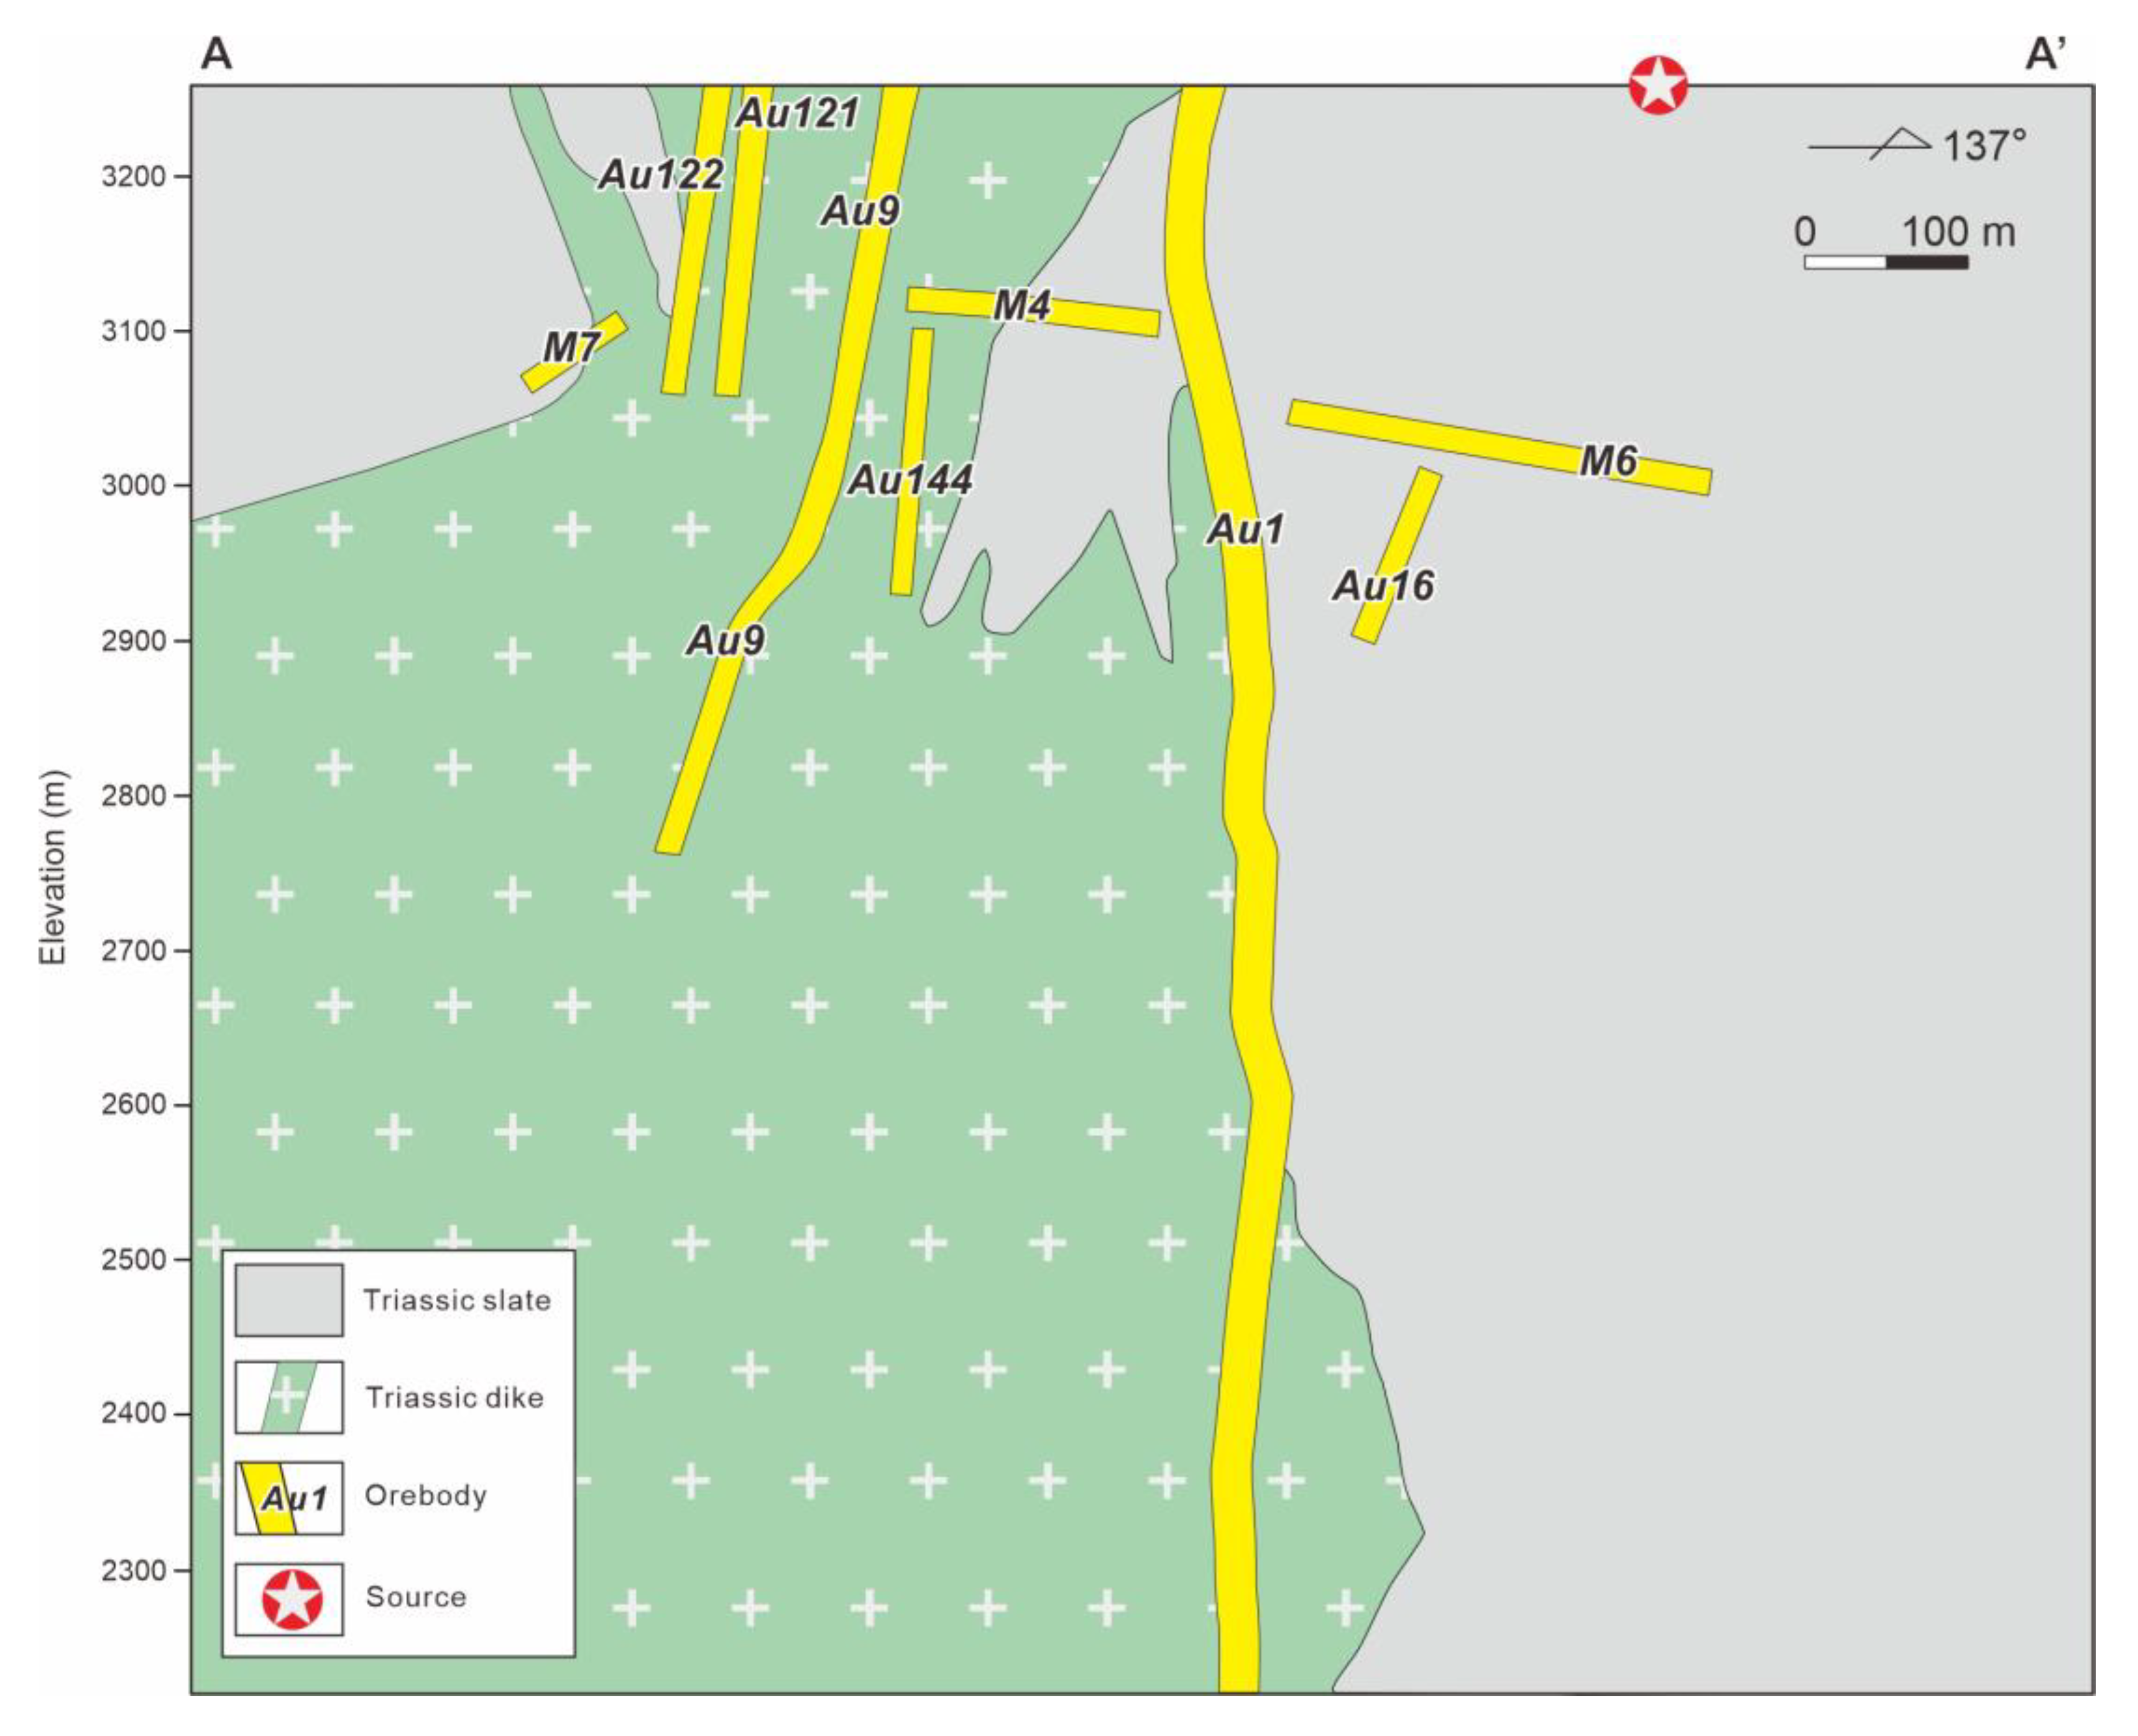
4. Forward Modeling for the Zaozigou Deposit
4.1. Geology and 2D Model
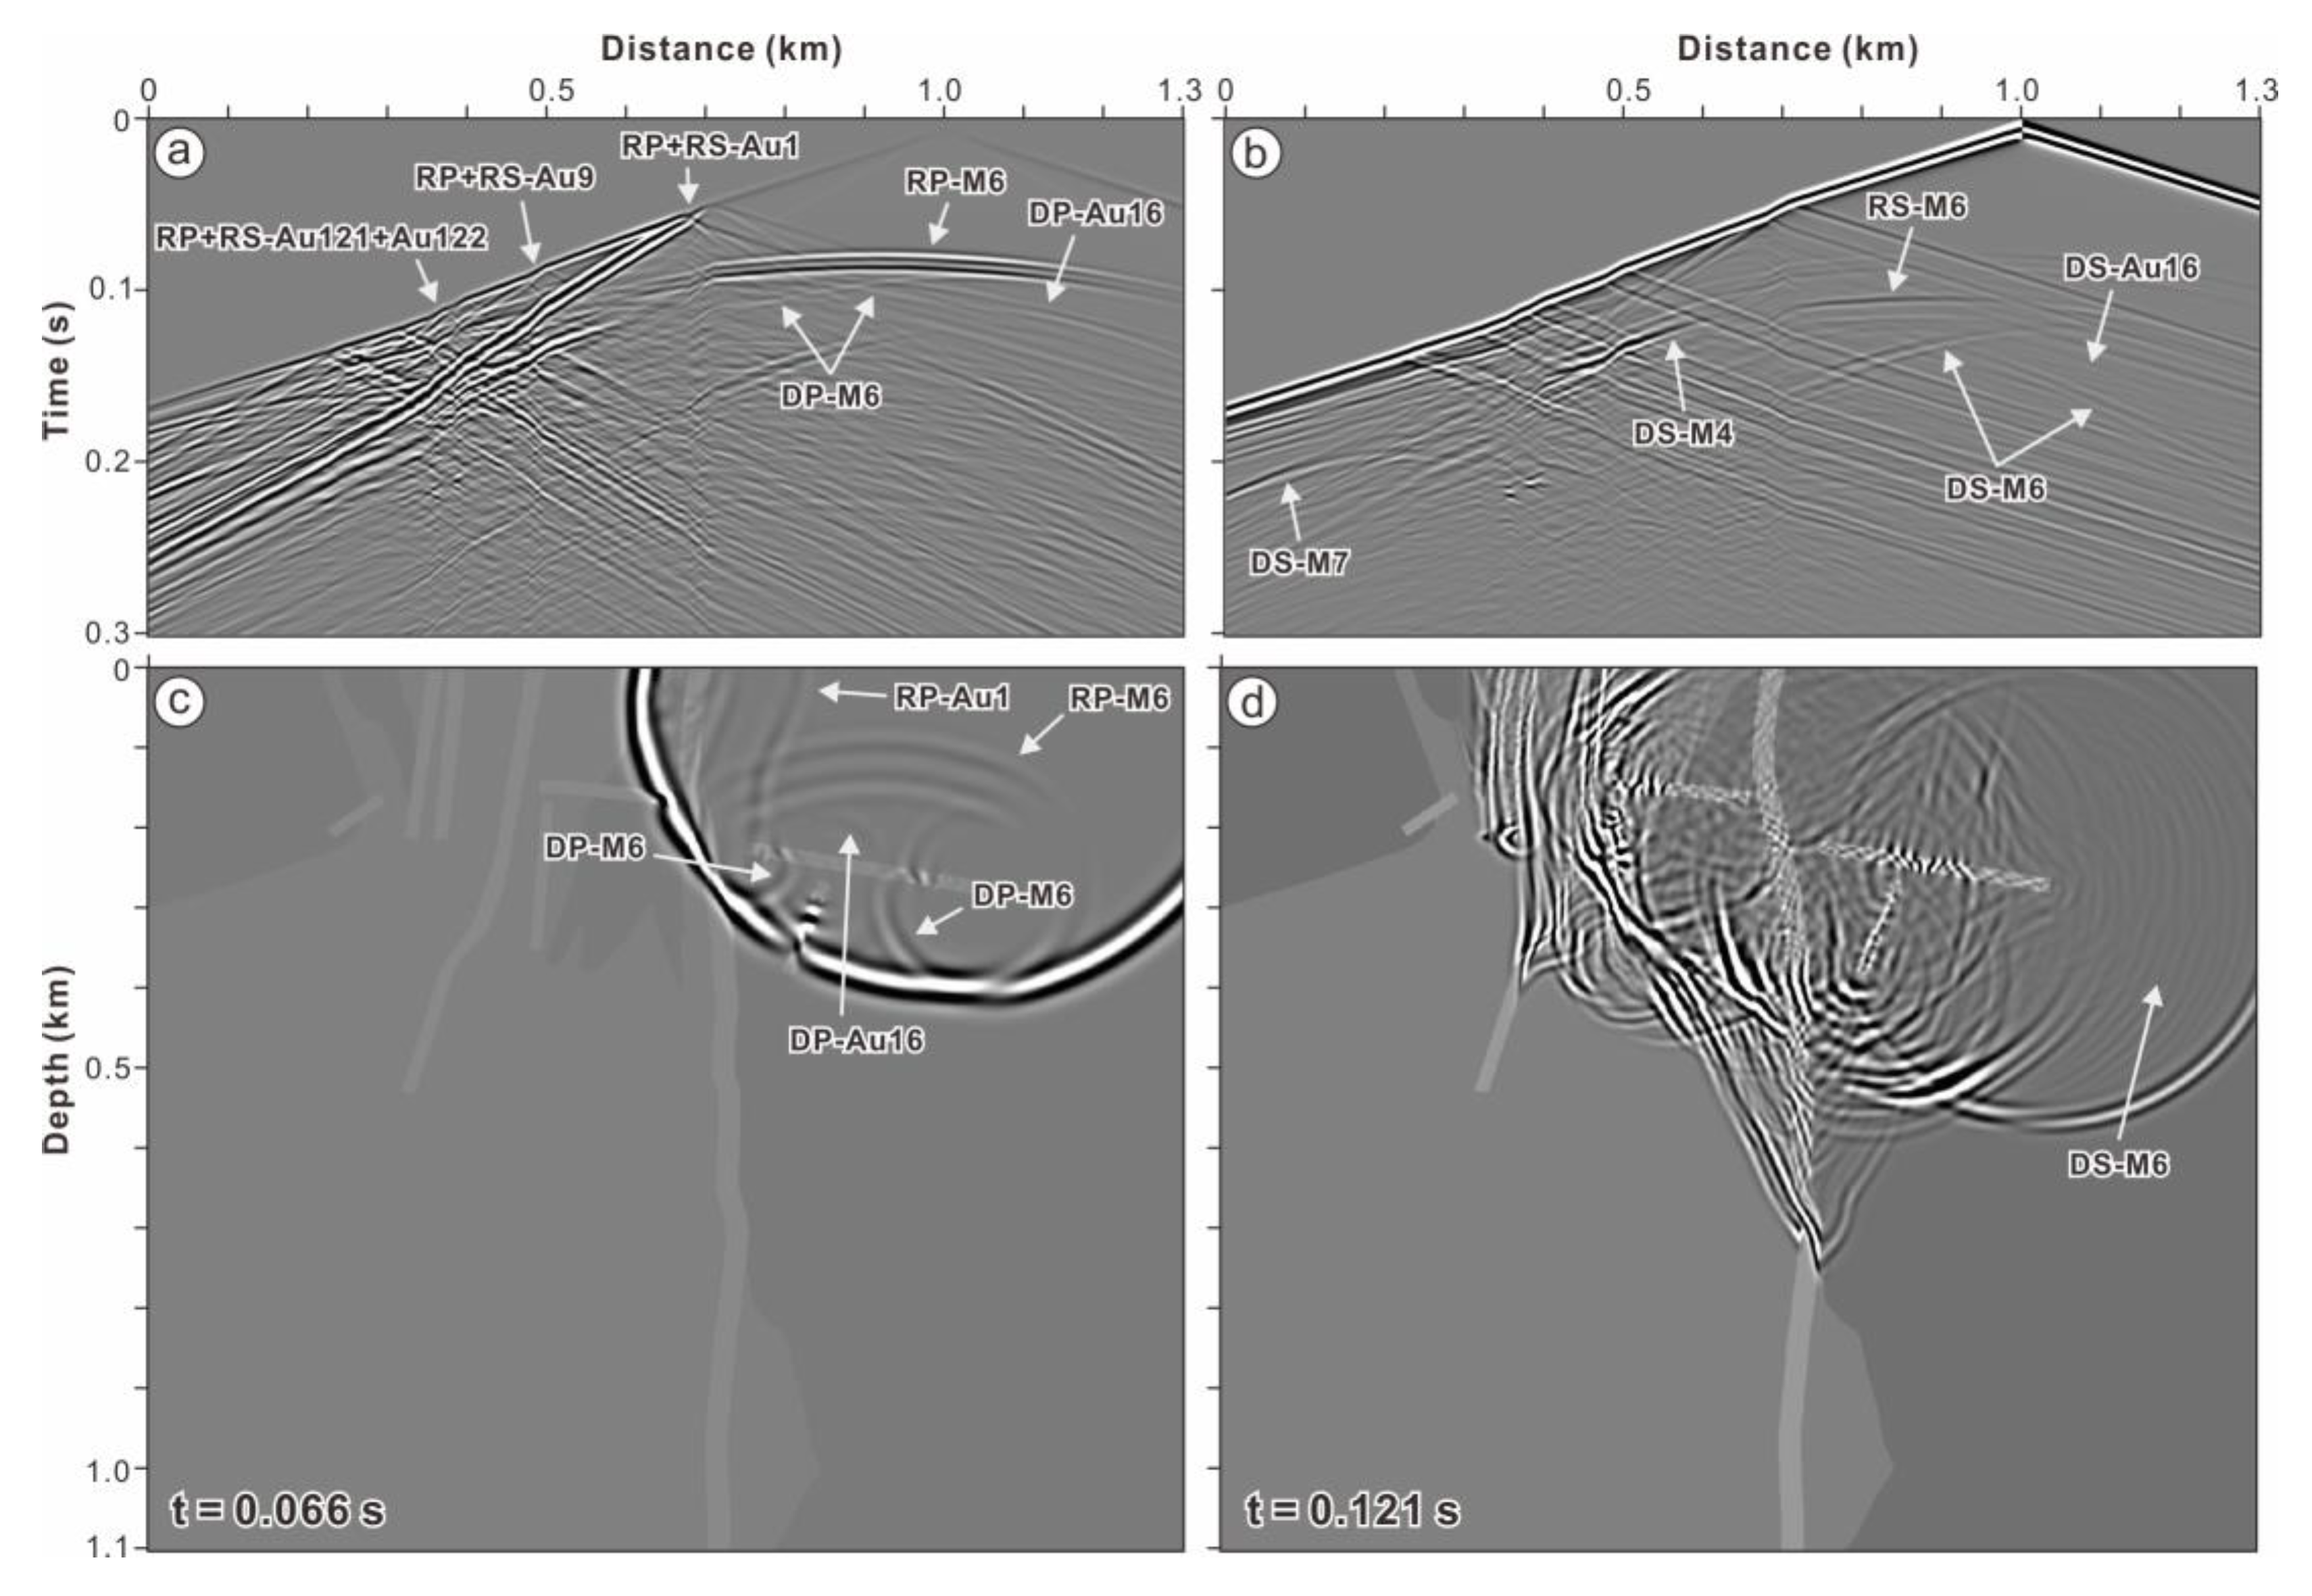
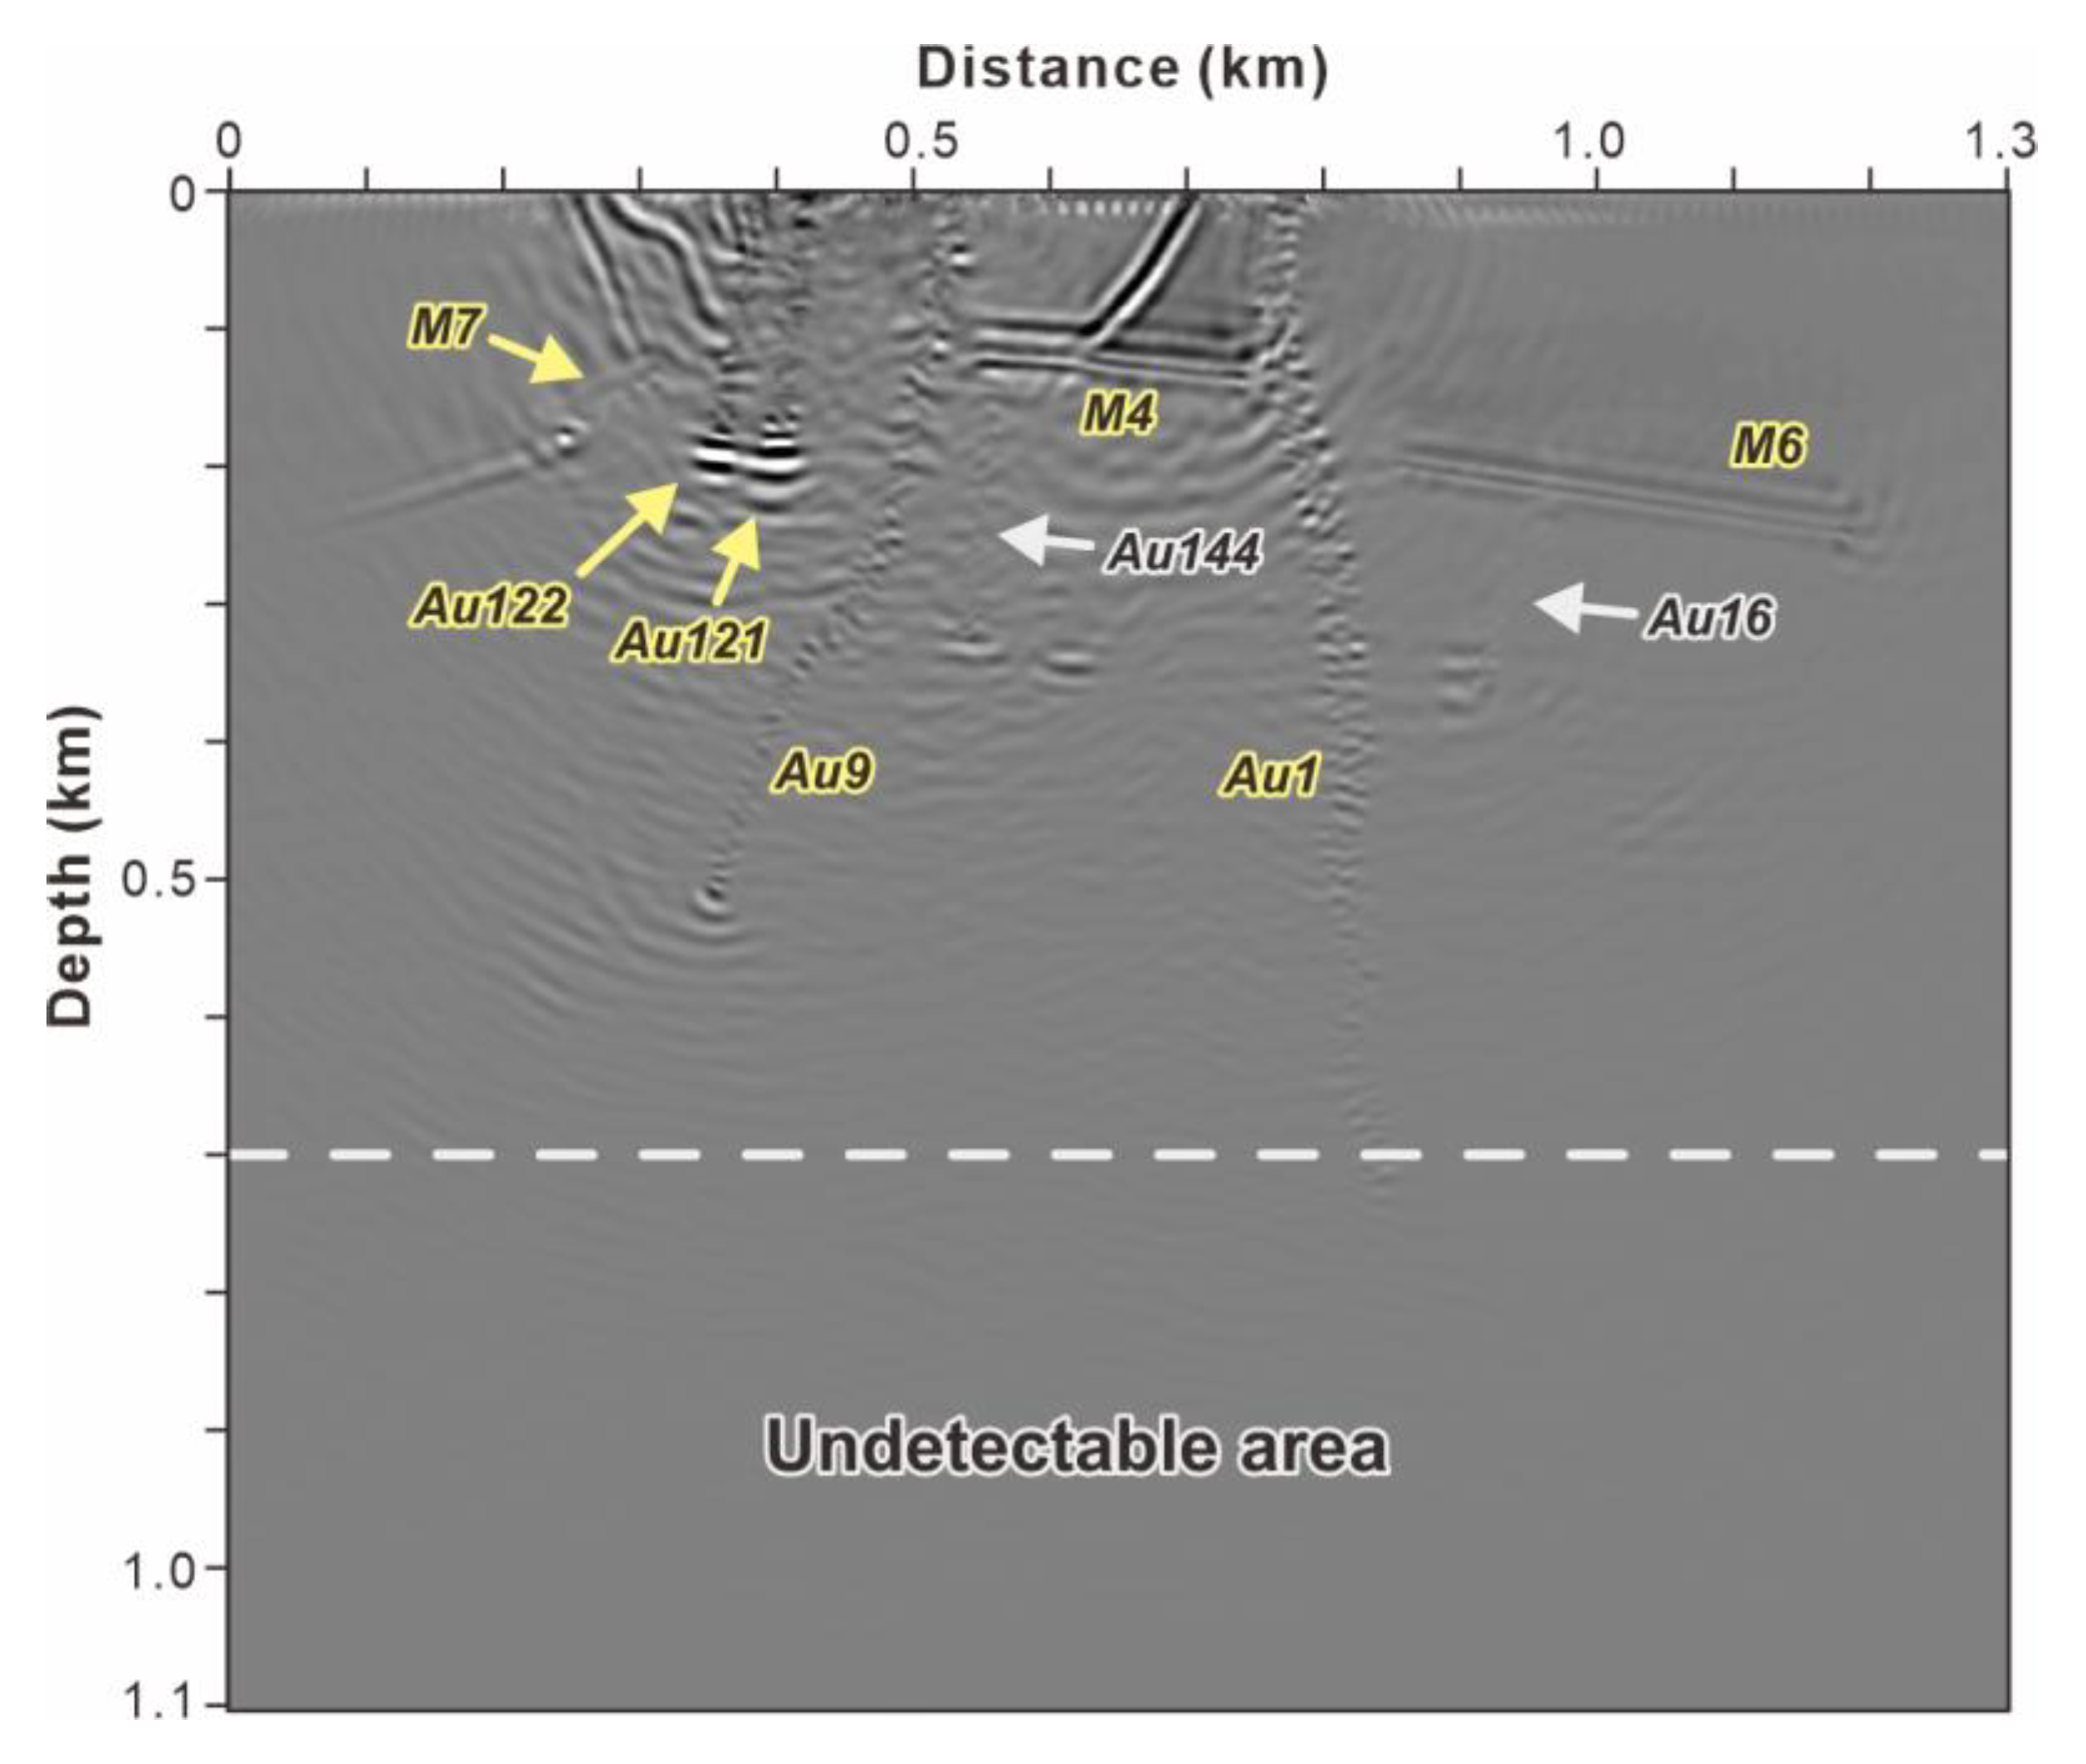
4.2. Finite-Difference Modeling Resultes
5. Discussion
5.1. Effects of Factors
5.2. Implications for the Reflection Seismology Method on Orogenic Gold Deposits
6. Conclusions
Supplementary Materials
Author Contributions
Funding
Data Availability Statement
Acknowledgments
Conflicts of Interest
References
- Witherly, K. The evolution of minerals exploration over 60 years and the imperative to explore undercover. Lead. Edge 2012, 31, 292–295. [Google Scholar] [CrossRef]
- Kerr, R.A. Is the world tottering on the precipice of peak gold? Science 2012, 335, 1038–1039. [Google Scholar] [CrossRef]
- Zhou, P.; Shi, J. Review on Seismic Methods for Mineral Exploration. Adv. Earth Sci. 2008, 23, 120–128. [Google Scholar]
- Lv, Q.-T.; Dong, S.-W.; Tang, J.-T.; Shi, D.-N.; Chang, Y.-F. Multi-scale and integrated geophysical data revealing mineral systems and exploring for mineral deposits at depth: A synthesis from SinoProbe-03. Chin. J. Geophys. 2015, 58, 4319–4343. [Google Scholar]
- Bellefleur, G.; Malinowski, M.; Urosevic, M. Editorial for Special Issue “Seismic Methods in Mineral Exploration”. Minerals 2019, 9, 630. [Google Scholar] [CrossRef] [Green Version]
- Lv, Q.; Zhang, X.; Tang, J.; Jin, S.; Liang, L.; Niu, J.; Wang, X.; Lin, P.; Yao, C.; Gao, W. Review on advancement in technology and equipment of geophysical exploration for metallic deposits in China. Chin. J. Geophys. 2019, 62, 3629–3664. [Google Scholar]
- Liu, G.; Meng, X.; Ni, J.; Chen, Z.; Zhang, D. Evaluation of the 2D reflection seismic method toward the exploration of thrust-controlled mineral deposits in southwestern Fujian Province, China2D reflection seismic in Fujian, China. Geophysics 2018, 83, B209–B220. [Google Scholar] [CrossRef]
- Schetselaar, E.; Bellefleur, G.; Hunt, P. Elucidating the Effects of Hydrothermal Alteration on Seismic Reflectivity in the Footwall of the Lalor Volcanogenic Massive Sulfide Deposit, Snow Lake, Manitoba, Canada. Minerals 2019, 9, 384. [Google Scholar] [CrossRef] [Green Version]
- Kearey, P.; Brooks, M.; Hill, I. An Introduction to Geophysical Exploration; John Wiley & Sons: Hoboken, NJ, USA, 2002; Volume 4, p. 257. [Google Scholar]
- Farfour, M.; Yoon, W.J. A review on multicomponent seismology: A potential seismic application for reservoir characterization. J. Adv. Res. 2016, 7, 515–524. [Google Scholar] [CrossRef] [Green Version]
- Howe, J.R. Tectonics, Sedimentation, and Hydrocarbon Potential or Reelfoot Aulacogen; University of Oklahoma: Norman, OK, USA, 1984. [Google Scholar]
- Robertson, J.D.; Pritchett, W.C. Direct hydrocarbon detection using comparative P-wave and S-wave seismic sections. Geophysics 1985, 50, 383–393. [Google Scholar] [CrossRef]
- Ebraheem, M.; Ibrahim, H.; Ewida, H.; Senosy, A. Identification of hydrocarbon-bearing zones within the early cretaceous reservoir rocks using well logging and seismic reflection data in Al-Baraka field, West Komombo, Egypt. J. Pet. Sci. Eng. 2022, 218, 111037. [Google Scholar] [CrossRef]
- Li, Y.; Liu, H.; Wu, Y. Recalling the process of the research of terrestrial reservoir geophysics in China. Prog. Geophys. 2007, 22, 1280–1284. [Google Scholar]
- Bellefleur, G.; Riedel, M.; Brent, T. Seismic characterization and continuity analysis of gas-hydrate horizons near Mallik research wells, Mackenzie Delta, Canada. Lead. Edge 2006, 25, 599–604. [Google Scholar] [CrossRef] [Green Version]
- Meng, X.; Wang, J.; Liu, G.; Chen, Z.; Ni, J.; Zhang, D.; Tan, H.; Li, S.; Fang, Y.; Zheng, S. Geophysical response characteristics of the Dapai polymetallic mining area in Southwestern Fujian Province and its prospecting implications. Chin. J. Geophys. 2021, 64, 949–964. [Google Scholar]
- Liu, G.; Meng, X.; Tan, H.; Chen, Z.; Ni, J.; Liu, L. Case study: Joint seismic reflection and CSAMT data interpretation for mineral explorations in Fujian, China. Acta Geophys. 2020, 68, 1373–1385. [Google Scholar] [CrossRef]
- Liu, G.; Meng, X.; Sea, J.G. Case study: Improving the quality of the seismic reflection image for a Fujian mineral exploration data set with offset-domain common-image gathers. Geophysics 2021, 86, B277–B289. [Google Scholar] [CrossRef]
- Malehmir, A.; Bellefleur, G. Reflection seismic imaging and physical properties of base-metal and associated iron deposits in the Bathurst Mining Camp, New Brunswick, Canada. Ore Geol. Rev. 2010, 38, 319–333. [Google Scholar] [CrossRef]
- Malehmir, A.; Wang, S.; Lamminen, J.; Brodic, B.; Bastani, M.; Vaittinen, K.; Juhlin, C.; Place, J. Delineating structures controlling sandstone-hosted base-metal deposits using high-resolution multicomponent seismic and radio-magnetotelluric methods: A case study from Northern Sweden. Geophys. Prospect. 2015, 63, 774–797. [Google Scholar] [CrossRef]
- Bellefleur, G.; de Kemp, E.; Goutier, J.; Allard, M.; Adam, E. Seismic Imaging of the Geologic Framework and Structures Related to Volcanogenic Massive Sulfide Deposits in the Archean Rouyn-Noranda District, Quebec, Canada. Econ. Geol. 2014, 109, 103–119. [Google Scholar] [CrossRef] [Green Version]
- Lv, Q.T.; Han, L.G.; Yan, J.Y.; Lian, Y.G.; Yan, T.J. Seismic imaging of volcanic hydrothermal iron-sulfur deposits and its hosting structure in Luzong ore district. Acta Petrol. Sin. 2010, 26, 2598–2612. [Google Scholar]
- Koivisto, E.; Malehmir, A.; Heikkinen, P.; Heinonen, S.; Kukkonen, I. 2D reflection seismic investigations at the Kevitsa Ni-Cu-PGE deposit, northern Finland. Geophysics 2012, 77, WC149–WC162. [Google Scholar] [CrossRef]
- Bräunig, L.; Buske, S.; Malehmir, A.; Bäckström, E.; Schön, M.; Marsden, P. Seismic depth imaging of iron-oxide deposits and their host rocks in the Ludvika mining area of central Sweden. Geophys. Prospect. 2019, 68, 24–43. [Google Scholar] [CrossRef] [Green Version]
- Naghizadeh, M.; Snyder, D.; Cheraghi, S.; Foster, S.; Cilensek, S.; Floreani, E.; Mackie, J. Acquisition and Processing of Wider Bandwidth Seismic Data in Crystalline Crust: Progress with the Metal Earth Project. Minerals 2019, 9, 145. [Google Scholar] [CrossRef] [Green Version]
- Heinonen, S.; Malinowski, M.; Hloušek, F.; Gislason, G.; Buske, S.; Koivisto, E.; Wojdyla, M. Cost-Effective Seismic Exploration: 2D Reflection Imaging at the Kylylahti Massive Sulfide Deposit, Finland. Minerals 2019, 9, 263. [Google Scholar] [CrossRef] [Green Version]
- Cichostępski, K.; Dec, J.; Kwietniak, A. Simultaneous Inversion of Shallow Seismic Data for Imaging of Sulfurized Carbonates. Minerals 2019, 9, 203. [Google Scholar] [CrossRef] [Green Version]
- Yan, J.; Shi, D.; Dong, S.; Tang, J.; Wu, M.; Chang, Y. Reflection seismic imaging of the Lujiang–Zongyang volcanic basin, Yangtze Metallogenic Belt: An insight into the crustal structure and geodynamics of an ore district. Tectonophysics 2013, 606, 60–77. [Google Scholar]
- Yan, J.-Y.; Teng, J.-W.; Lv, Q.-T. Geophysical exploration and application of deep metallic ore resources. Prog. Geophys. 2008, 23, 871–891. [Google Scholar]
- Willman, C.; Korsch, R.; Moore, D.H.; Cayley, R.; Lisitsin, V.; Rawling, T.; Morand, V.J.; O’Shea, P.J. Crustal-scale fluid pathways and source rocks in the Victorian gold province, Australia: Insights from deep seismic reflection profiles. Econ. Geol. 2010, 105, 895–915. [Google Scholar] [CrossRef]
- L’Heureux, E.; Milkereit, B.; Vasudevan, K. Heterogeneity and seismic scattering in exploration environments. Tectonophysics 2009, 472, 264–272. [Google Scholar] [CrossRef]
- Leach, D.L.; Sangster, D.F.; Kelley, K.D.; Large, R.R.; Garven, G.; Allen, C.R.; Gutzmer, J.; Walters, S. Sediment-hosted lead-zinc deposits: A global perspective. In SEG One Hundredth Anniversary Volume; Hedenquist, J.W., Thompson, J.F.H., Goldfarb, R.J., Richards, J.P., Eds.; Society of Economic Geologists: Littleton, CO, USA, 2005; pp. 561–607. [Google Scholar]
- Leach, D.L.; Bradley, D.; Lewchuk, M.T.; Symons, D.T.; de Marsily, G.; Brannon, J. Mississippi Valley-type lead–zinc deposits through geological time: Implications from recent age-dating research. Mineral. Depos. 2001, 36, 711–740. [Google Scholar] [CrossRef]
- Sangster, D. Toward an integrated genetic model for vent-distal SEDEX deposits. Mineral. Depos. 2018, 53, 509–527. [Google Scholar] [CrossRef]
- Goldfarb, R.; Qiu, K.-F.; Deng, J.; Chen, Y.; Yang, L. Orogenic gold deposits of China. Soc. Econ. Geol. Spec. Publ. 2019, 22, 263–324. [Google Scholar]
- Groves, D.I.; Goldfarb, R.J.; Gebre-Mariam, M.; Hagemann, S.G.; Robert, F. Orogenic gold deposits: A proposed classification in the context of their crustal distribution and relationship to other gold deposit types. Ore Geol. Rev. 1998, 13, 7–27. [Google Scholar] [CrossRef]
- Tomkins, A.G. On the source of orogenic gold. Geology 2013, 41, 1255–1256. [Google Scholar] [CrossRef] [Green Version]
- Deng, J.; Qiu, K.-F.; Wang, Q.-F.; Goldfarb, R.; Yang, L.-Q.; Zi, J.-W.; Geng, J.-Z.; Ma, Y. In situ dating of hydrothermal monazite and implications for the geodynamic controls on ore formation in the Jiaodong gold province, eastern China. Econ. Geol. 2020, 115, 671–685. [Google Scholar] [CrossRef]
- Biryukov, V.A.; Miryakha, V.A.; Petrov, I.B.; Khokhlov, N.I. Simulation of elastic wave propagation in geological media: Intercomparison of three numerical methods. Comput. Math. Math. Phys. 2016, 56, 1086–1095. [Google Scholar] [CrossRef]
- Liu, H.W.; Li, B.; Liu, H.; Tong, X.L.; Liu, Q. The algorithm of high order finite difference pre-stack reverse time migration and GPU implementation. Chin. J. Geophys. 2010, 53, 600–610. [Google Scholar] [CrossRef]
- Liu, H.; Luo, Y. An explicit method to calculate implicit spatial finite differences. Geophysics 2022, 87, T157–T168. [Google Scholar] [CrossRef]
- Bohlen, T.; Müller, C.; Milkereit, B.; Eaton, D.; Salisbury, M. Elastic seismic wave scattering from massive sulfide orebodies: On the role of composition and shape. Hardrock Seism. Explor. SEG 2003, 70, 89. [Google Scholar]
- Bellefleur, G.; Malehmir, A.; Müller, C. Elastic finite-difference modeling of volcanic-hosted massive sulfide deposits: A case study from Half Mile Lake, New Brunswick, Canada. Geophysics 2012, 77, WC25–WC36. [Google Scholar] [CrossRef]
- Dehghannejad, M.; Malehmir, A.; Juhlin, C.; Skyttä, P. 3D constraints and finite-difference modeling of massive sulfide deposits: The Kristineberg seismic lines revisited, northern Sweden. Geophysics 2012, WC69–WC79. [Google Scholar] [CrossRef]
- Hammer, P.T.; Clowes, R.M.; Ramachandran, K. High-resolution seismic reflection imaging of a thin, diamondiferous kimberlite dyke. Geophysics 2004, 69, 1143–1154. [Google Scholar] [CrossRef]
- Abolghasemifar, S.A.; Monfared, M.S.; Aghajani, H. Acoustic wave propagation in strongly heterogeneous media: A lattice boltzmann approach. Int. Multidiscip. Sci. Geoconf. SGEM 2009, 1, 643. [Google Scholar]
- Landau, L.D.; Lifšic, E.M. Theory of Elasticity; Elsevier: Amsterdam, The Netherlands, 1986; Volume 7, p. 185. [Google Scholar]
- Nečas, J.; Hlaváček, I. Studies in Applied Mechanics; Elsevier: Amsterdam, The Netherlands, 1981; Volume 3, p. 342. [Google Scholar]
- Koene, E.F.M.; Robertsson, J.O.A.; Broggini, F.; Andersson, F. Eliminating time dispersion from seismic wave modeling. Geophys. J. Int. 2018, 213, 169–180. [Google Scholar] [CrossRef]
- Strikwerda, J.C. Finite Difference Schemes and Partial Differential Equations; SIAM: Philadelphia, PA, USA, 2004; p. 435. [Google Scholar]
- Engquist, B.; Majda, A. Absorbing boundary conditions for numerical simulation of waves. Proc. Natl. Acad. Sci. USA 1977, 74, 1765–1766. [Google Scholar] [CrossRef] [PubMed] [Green Version]
- Nakata, N.; Tsuji, T.; Matsuoka, T. Acceleration of computation speed for elastic wave simulation using a Graphic Processing Unit. Explor. Geophys. 2011, 42, 98–104. [Google Scholar] [CrossRef] [Green Version]
- Liu, G.-F.; Meng, X.-H.; Liu, H. Accelerating finite difference wavefield-continuation depth migration by GPU. Appl. Geophys. 2012, 9, 41–48. [Google Scholar] [CrossRef]
- Liu, G.; Liu, Y.; Ren, L.; Meng, X. 3D seismic reverse time migration on GPGPU. Comput. Geosci. 2013, 59, 17–23. [Google Scholar] [CrossRef]
- Liu, H.W.; Liu, H.; Li, B.; Wang, X.; Tong, X.L.; Liu, Q. Pre-Stack Reverse Time Migration for Rugged Topography and GPU Acceleration Technology. Chin. J. Geophys. 2011, 54, 526–536. [Google Scholar] [CrossRef]
- Liu, G.; Yu, Z.; Wang, J.; Li, B. Accelerating Kirchhoff Pre-stack depth migration on a GPU by overlapping ray tracing and imaging. Comput. Geosci. 2019, 128, 79–86. [Google Scholar] [CrossRef]
- Weiss, R.M.; Shragge, J. Solving 3D anisotropic elastic wave equations on parallel GPU devices. Geophysics 2013, 78, F7–F15. [Google Scholar] [CrossRef]
- Salisbury, M.H.; Harvey, C.W.; Matthews, L.; Eaton, D.; Milkereit, B. The acoustic properties of ores and host rocks in hardrock terranes. Hardrock Seism. Explor. SEG 2003, 9–19. [Google Scholar]
- Helbig, K. Seismic Impedance. First Break 1983, 1, 25–32. [Google Scholar] [CrossRef]
- Zhang, H.; Krooswyk, S.; Ou, J. Transmission line fundamentals. In High Speed Digital Design; Zhang, H., Krooswyk, S., Ou, J., Eds.; Morgan Kaufmann: Boston, MA, USA, 2015; pp. 1–26. [Google Scholar]
- Goldfarb, R.J.; Mao, J.-W.; Qiu, K.-F.; Goryachev, N. The great Yanshanian metallogenic event of eastern Asia: Consequences from one hundred million years of plate margin geodynamics. Gondwana Res. 2021, 100, 223–250. [Google Scholar] [CrossRef]
- Salisbury, M.H.; Milkereit, B.; Bleeker, W. Seismic imaging of massive sulfide deposits; Part I, Rock properties. Econ. Geol. 1996, 91, 821–828. [Google Scholar] [CrossRef]
- Qiu, K.F.; Yu, H.C.; Hetherington, C.; Huang, Y.Q.; Yang, T.; Deng, J. Tourmaline composition and boron isotope signature as a tracer of magmatic-hydrothermal processes. Am. Mineral. J. Earth Planet. Mater. 2021, 106, 1033–1044. [Google Scholar] [CrossRef]
- Yu, H.C.; Qiu, K.F.; Hetherington, C.J.; Chew, D.; Huang, Y.Q.; He, D.Y.; Geng, J.Z.; Xian, H.Y. Apatite as an alternative petrochronometer to trace the evolution of magmatic systems containing metamict zircon. Contrib. Mineral. Petrol. 2021, 176, 1–19. [Google Scholar] [CrossRef]
- Qiu, K.F.; Yu, H.C.; Deng, J.; Mcintire, D.; Goldfarb, R. The giant Zaozigou Au-Sb deposit in West Qinling, China: Magmatic- or metamorphic-hydrothermal origin? Mineral. Depos. 2020, 1–18. [Google Scholar]
- Yu, H.C.; Qiu, K.F.; Deng, J.; Zhu, R.; Mathieu, L.; Sai, S.X.; Sha, W.J. Exhuming and preserving epizonal orogenic Au-Sb deposits in rapidly uplifting orogenic settings. Tectonics 2022, 41, e2021TC007165. [Google Scholar] [CrossRef]
- Yu, H.C.; Guo, C.A.; Qiu, K.F.; McIntire, D.; Jiang, G.P.; Gou, Z.Y.; Geng, J.Z.; Pang, Y.; Zhu, R.; Li, N.B. Geochronological and geochemical constraints on the formation of the giant Zaozigou Au-Sb deposit, West Qinling, China. Minerals 2019, 9, 37. [Google Scholar] [CrossRef] [Green Version]
- Yu, H.C.; Qiu, K.F.; Pirajno, F.; Zhang, P.C.; Dong, W.Q. Revisiting Phanerozoic evolution of the Qinling Orogen (East Tethys) with perspectives of detrital zircon. Gondwana Res. 2022, 103, 426–444. [Google Scholar] [CrossRef]
- Long, Z.Y.; Qiu, K.F.; Santosh, M.; Yu, H.C.; Jiang, X.Y.; Zou, L.Q.; Tang, D.W. Fingerprinting the metal source and cycling of the world’s largest antimony deposit in Xikuangshan, China. GSA Bull. 2022; in press. [Google Scholar] [CrossRef]
- Yu, H.C.; Qiu, K.F.; Simon, A.; Wang, D.; Mathur, R.; Wan, R.Q.; Jiang, X.Y.; Deng, J. Telescoped boiling and cooling mechanisms triggered hydrothermal stibnite precipitation: Insights from the world’s largest Xikuangshan antimony deposit. Am. Mineral. 2022; in press. [Google Scholar] [CrossRef]
- Qiu, K.F.; Deng, J.; Yu, H.C.; Wu, M.Q.; Wang, Y.; Zhang, L.; Goldfarb, R. Identifying hydrothermal quartz vein generations in the Taiyangshan porphyry Cu-Mo deposit (West Qinling, China) using cathodoluminescence, trace element geochemistry, and fluid inclusions. Ore Geol. Rev. 2021, 128, 103882. [Google Scholar] [CrossRef]
- Liu, W.; Gan, Y.-D.; Liu, F.-S.; Tang, B.; Zhu, S.-H.; Liu, Q.-J. First-Principles Study of Structural, Electronic, and Elastic Properties of Sb2S3 under Pressure. Phys. Status Solidi (b) 2022, 259, 2100234. [Google Scholar] [CrossRef]
- Deng, J.; Yang, L.-Q.; Groves, D.I.; Zhang, L.; Qiu, K.-F.; Wang, Q.-F. An integrated mineral system model for the gold deposits of the giant Jiaodong province, eastern China. Earth Sci. Rev. 2020, 208, 103274. [Google Scholar] [CrossRef]
- Riedel, M.; Cosma, C.; Enescu, N.; Koivisto, E.; Komminaho, K.; Vaittinen, K.; Malinowski, M. Underground Vertical Seismic Profiling with Conventional and Fiber-Optic Systems for Exploration in the Kylylahti Polymetallic Mine, Eastern Finland. Minerals 2018, 8, 538. [Google Scholar] [CrossRef] [Green Version]
- Bellefleur, G.; Müller, C.; Snyder, D.; Matthews, L. Downhole seismic imaging of a massive sulfide orebody with mode-converted waves, Halfmile lake, New Brunswick, Canada. Geophysics 2004, 69, 318–329. [Google Scholar] [CrossRef]
- Rabbel, W.; Beilecke, T.; Bohlen, T.; Fischer, D.; Frank, A.; Hasenclever, J.; Borm, G.; Kück, J.; Bram, K.; Druivenga, G.; et al. Superdeep vertical seismic profiling at the KTB deep drill hole (Germany): Seismic close-up view of a major thrust zone down to 8.5 km depth. J. Geophys. Res. Solid Earth 2004, 109, B09309. [Google Scholar] [CrossRef] [Green Version]
- Davis, T.L. Multicomponent seismology—The next wave. Geophysics 2001, 66, 49. [Google Scholar] [CrossRef]
- Snyder, D.B.; Cary, P.; Salisbury, M. 2D-3C high-resolution seismic data from the Abitibi Greenstone Belt, Canada. Tectonophysics 2009, 472, 226–237. [Google Scholar] [CrossRef]


| Lithology | Vp (km/s) | Vs (km/s) | Density (g/cm3) | R |
|---|---|---|---|---|
| Orebody | 5.3 | 2.9 | 4.1 | - |
| Gabbro | 6.9 | 3.8 | 3.0 | 0.017 |
| Anorthosite | 6.8 | 3.7 | 2.8 | 0.064 |
| Quartz-mica schist | 6.3 | 3.6 | 2.8 | 0.105 |
| Lithology | Vp (km/s) | Vs (km/s) | Density (g/cm3) |
|---|---|---|---|
| Type I orebody (green) | 4.0 | 2.3 | 3.6 |
| Type II orebody (red) | 5.0 | 2.9 | 3.5 |
| Wall rock | 4.7 | 2.7 | 2.7 |
| Lithology | Vp (km/s) | Vs (km/s) | Density (g/cm3) |
|---|---|---|---|
| Orebody | 4.5 | 2.6 | 4.1 |
| Wall rock | 5.8 | 3.4 | 2.6 |
| Lithology | Vp (km/s) | Vs (km/s) | Density (g/cm3) |
|---|---|---|---|
| Orebody | 4.0 | 2.3 | 4.3 |
| Slate | 6.9 | 4.0 | 2.9 |
| Dacite | 5.8 | 3.3 | 2.6 |
Publisher’s Note: MDPI stays neutral with regard to jurisdictional claims in published maps and institutional affiliations. |
© 2022 by the authors. Licensee MDPI, Basel, Switzerland. This article is an open access article distributed under the terms and conditions of the Creative Commons Attribution (CC BY) license (https://creativecommons.org/licenses/by/4.0/).
Share and Cite
Pang, Y.; Yan, L.; Liu, Y.; Tang, L.; Zhu, R.; Liu, G. Seismic Wave Finite-Difference Forward Modeling for Orogenic Gold Deposits. Minerals 2022, 12, 1465. https://doi.org/10.3390/min12111465
Pang Y, Yan L, Liu Y, Tang L, Zhu R, Liu G. Seismic Wave Finite-Difference Forward Modeling for Orogenic Gold Deposits. Minerals. 2022; 12(11):1465. https://doi.org/10.3390/min12111465
Chicago/Turabian StylePang, Yao, Lijun Yan, Yuan Liu, Lin Tang, Rui Zhu, and Guofeng Liu. 2022. "Seismic Wave Finite-Difference Forward Modeling for Orogenic Gold Deposits" Minerals 12, no. 11: 1465. https://doi.org/10.3390/min12111465