Article

Evaluation of Different Dispersants on the Dispersion/Sedimentation Behavior of Halloysite, Kaolinite, and Quartz Suspensions in the Enrichment of Halloysite Ore by Mechanical Dispersion

1
Department of Mining Engineering, Faculty of Engineering, Istanbul University-Cerrahpasa, Buyukcekmece, Istanbul 34500, Turkey
2
Can Vocational School, Canakkale Onsekiz Mart University, Canakkale 17400, Turkey
3
Department of Mining Engineering, Faculty of Engineering, Canakkale Onsekiz Mart University, Canakkale 17000, Turkey
4
Kaleseramik Research and Development Center, Canakkale 17400, Turkey
*
Authors to whom correspondence should be addressed.
Minerals 2022, 12(11), 1426; https://doi.org/10.3390/min12111426
Submission received: 16 October 2022 / Revised: 4 November 2022 / Accepted: 7 November 2022 / Published: 10 November 2022
(This article belongs to the Special Issue Nanotubular and Nanofibrous Clay Minerals)

Abstract

:
In this study, the dispersion properties of pure halloysite, kaolinite, and quartz minerals in halloysite ore were determined in the absence and presence of dispersants (sodium silicate, STPP, SHMP). First of all, the samples were characterized by chemical, mineralogical, BET, FTIR, and TEM analyses. Afterward, the physico-chemical properties of these minerals were investigated by zeta potential measurements and dispersion/sedimentation experiments in the absence and presence of the dispersants. The zeta potential measurements showed that the surface charges of all minerals changed from negative to positive as the PH changed from basic to acidic. The presence of dispersants at natural pHs indicated that the mineral surface charges tended to become more negative as the concentration increased in the zeta potential measurements. SHMP showed the most effect on the zeta potential. In the dispersion/sedimentation experiments, settling was slowed down with the use of dispersants. Finally, the dispersion properties of halloysite ore in the presence of dispersants were explored using mechanical dispersion and pulp viscosity experiments based on the amount of material passing to <38 μm size and the chemical changes in the materials. As a result of the mechanical dispersion tests carried out in the presence of dispersants (sodium silicate, STPP, SHMP), 71.3% of the material with 30.8% Al2O3 and 50.5% SiO2 content passed to <38 μm size without using dispersant, and 73.2% of <38 μm sized material with 35.5% Al2O3 and 46.1% SiO2 content was gained in the use of 7.5 kg/ton SHMP, which was determined as the optimum within the scope of the study. In conclusion, dispersant use enhanced the mechanical dispersion effect for plastic clay mineral separation from hard minerals in an aqueous medium.

1. Introduction

Progressive analysis techniques and numerical methods have allowed humanity to expand its knowledge about the molecular and atomic properties of clay minerals. With the development of clay science and the emergence of the functional properties of clays, it has become even more important for people to understand the distribution and roles of clay minerals in the world.
Nano-sized tubular halloysite minerals refer to hollow clay minerals with a size between 1–100 nm [1]. Previously, it was known that there were minerals with a cylindrical structure in nature, but the tubular structure of halloysite was first determined in 1950 by microscopic and spectroscopic methods [2]. The concept of nanotechnology entered our lives in the 1970s [3]. In the context of materials science, the concept of “nano” and the term “nanotube” became popular after the 1990s with the synthesis of materials such as carbon nanotubes [4]. Due to the time-consuming production of synthetic nanotubes and high material costs, people have turned to research for the use of naturally occurring nanotubes. Interest in nano-sized tubular clay minerals has resulted from the growing demand for advanced nanomaterials, as well as the need to understand the geological and environmental impacts of these minerals. The use of nanoclay minerals as an environmentally low-cost adsorbent due to their large surface area and high reactivity is among the reasons for this interest [5]. Continuing and increasing research interest in academic and industrial terms has expanded knowledge about the formation, structure, properties, and applications of clay minerals in nanotube form. The increase in the number of publications on halloysite minerals in recent years is an important indicator of this [6].
Halloysite is a type of clay mineral found in the kaolin group together with kaolinite, dickite, and nacrite minerals. Kaolinite is the most common mineral in this group. Dickite, nacrite, and halloysite are rarer than kaolinite. Halloysite is a nano-sized, dioctahedral 1:1 layered natural clay mineral of the kaolin group with a tubular structure [7]. It is chemically similar to kaolinite, but the unit layers in halloysite are separated by a water molecule; therefore, halloysite has the formula Al2(OH)4Si2O5.nH2O. Halloysite is generally formed from various rocks by hydrothermal alteration or surface weathering [8]. The multi-layered tubular structure of halloysite mineral is formed by the coiling of the tetrahedral layer formed by the Si-O structure on the outer surface and the octahedral layer formed by Al(OH)3 on the inner side. The mineral has been named halloysite, metahalloysite, hydrated halloysite, and endellite by different researchers due to its morphological structure and chemical properties [9,10,11].
Currently, halloysite mineral is classified as hydrated halloysite (10 Å) with chemical formula Al2Si2O5(OH)4.2H2O and dehydrated halloysite (7 Å) with chemical formula Al2Si2O5(OH)4 according to basal X-ray Diffraction (XRD) peaks [12,13,14]. The basal (d001) spacing of the minerals is 10 Å and 7 Å. Basal spacing is expressed as the sum of the spacing between layers of aluminosilicate minerals and the thickness of a layer. Since dehydrated halloysites (7 Å) have the same chemical composition as kaolinite and give the same XRD peaks in mineralogical analysis, they should be characterized by intercalation method and/or Scanning Electron Microscope (SEM) images to be identified from each other in terms of analysis. In the intercalation method, dehydrated halloysite (7 Å) is hydrated (10 Å) by undergoing various processes, and thus the change in XRD peaks makes it possible to distinguish it from kaolinite in terms of mineralogical analysis [15,16,17]. Halloysite is characteristically white, but can also have different shades of white (yellowish, reddish, brownish, greenish-white). Its specific gravity can vary between 2.55 and 2.65 g/cm3, depending on the mineral deposit and mineralogy. Its hardness is 2 on the Mohs scale, which is the same as gypsum.
Although halloysite is primarily used in the field of ceramics, the increasing use in industry branches such as medicine, cosmetics, and paint due to its perceived value causes it to gain technological and economic value. The use of halloysite is determined by the purity of the mineral and the properties of its tubular structure at the nanoscale [18]. Naturally obtained halloysite mineral has an important place in the field of nanotechnology due to its unique physico-chemical properties that depend on its tubular structure. Halloysite mineral is more economical when compared to artificially produced nanomaterials due to its reserve in many parts of the world [19]. Due to these features, it finds many different application areas. Halloysite is a non-toxic natural mineral with high biocompatibility, unlike nanotube materials with hazardous side effects [20]. There is a growing interest in using halloysite in various applications such as clay polymer nanocomposite, catalysis, and adsorption. This unique nanoclay mineral is used as advanced functional material due to its one-dimensional tubular structure and its properties that can be changed by modification of inner/outer surfaces.
The lengths of halloysite nanotubes are requested to be as long as possible before the mineral beneficiation process in the preparation step. That is why the dispersion process in a wet medium should be used instead of the grinding method, and the dispersion characteristics can be improved with suitable chemicals [21]. Halloysite mineral needs to be separated from the gangue minerals such as kaolinite and quartz in finer particle size, and it is important to know the physico-chemical properties of minerals for fine size separation. In this study, the fine-size separation mechanisms of halloysite, kaolinite, and quartz minerals were investigated with zeta potential measurements and dispersion/sedimentation experiments in the absence and presence of dispersants at different pHs. Afterward, halloysite ore was dispersed with sodium silicate, STPP (sodium tripolyphosphate), and SHMP (sodium hexametaphosphate) to see the effect of dispersant types on mechanical dispersion.

2. Materials and Methods

2.1. Materials

In this study, the dispersion/sedimentation studies for the pure minerals that were mostly included in a halloysite ore [22], namely halloysite, kaolinite, and quartz, in the absence and presence of dispersants, were performed in detail. For this purpose, halloysite pure mineral was obtained from a private facility in Balikesir/Gönen, Türkiye. Kaolinite pure mineral, kaolin, was supplied by Quarzwerke company, Ukraine. Additionally, quartz pure mineral was obtained from the quarry of Pomza company in Manisa, Türkiye. The size of halloysite and kaolinite samples was less than 10 mm, and that of quartz was less than 100 µm.
Sodium silicate with a molecular weight of 184.04 g/mol and a density of 1.526 g/cm3 obtained from Zag Kimya, sodium tripolyphosphate (STPP) of 94% purity, and extra-pure sodium hexameta phosphate (SHMP) with a total phosphate content of 65–70%, supplied from Kimya, were used for dispersion purposes of pure halloysite, kaolinite, and quartz minerals according to dispersant types in mechanical dispersion experiments.
Oxalic acid dihydrate and potassium hydroxide (KOH) were used for pH adjustment in the case of zeta potential experiments for acidic medium and alkaline medium, respectively. Both chemicals were analytical and technical grades, respectively, and purchased from TEKKIM, Türkiye.

2.2. Methods

2.2.1. Sample Characterization

The chemical and mineralogical analyses of the pure samples were carried out with Panalytical Brand Axios Max Model X-ray Spectrophotometer device (XRF, PANalytical, The Netherlands) and Panalytical Brand X’pert Pro MPD X-ray Diffractometer (XRD, PANalytical, The Netherlands) between 3–70°, 2θ (Cu), respectively. Rietveld method was used to determine the quantitative XRD results, and scan parameters were as start angle: 2.998° 2θ, end angle: 70.000° 2θ, step size: 0.0167° 2θ, time per step: 40.00 s, scan speed 0.053052°/s. High score evaluation program, COD, and PDF-2 databases were used to determine the XRD diagrams of the samples. Duplicate analysis was performed for each sample, and the average values were taken into account.
For the particle size distribution analysis of the suspensions obtained from the experiments, the Malvern Brand Mastersizer Micro Plus device with laser scattering, and a measuring range between 0.03 and 555 µm, was used.
JEOL JEM-1400 Plus transmission electron microscopy (TEM) was used in the morphological examination of halloysite, kaolinite, and quartz minerals. Before imaging, the sample was mixed in an aqueous medium as a solution, and then kept in an ultrasonic bath for 5 min, and 5 mL of solution was drawn and dropped onto a carbon film-supported copper grid. After the solvent evaporated, the samples were visualized by operating at 80 kV voltage.
Using the BET device, isotherms in the range of 0.01–0.9 P/P0 were obtained depending on the physical adsorption technique with nitrogen (N2) gas in a liquid nitrogen environment at 77° K using the Brunauer, Emmet, and Teller (BET) method in solid or powder samples. The Quantachrome Quadrasorb SI device was used in the BET analysis.
FTIR plots of halloysite, kaolinite, and quartz minerals were measured with a BRUKER Brand ALPHA ATR model FTIR spectrometer.

2.2.2. Zeta Potential Measurements

The zeta potential measurements were carried out at a 0.1% and 1% solids ratio for halloysite and kaolinite minerals, and quartz minerals, respectively, using the Brookhaven Zetaplus zeta meter. In the zeta potential measurements, depending on pH, the desired amounts of <38 μm sized halloysite, kaolinite, and quartz minerals were mixed with 100 mL of distilled water using a magnetic stirrer at 500 rpm for 10 min. The pH adjustments of the suspensions were made by using 0.1 M oxalic acid dihydrate for the acidic medium and 0.1 M KOH for the alkaline medium. The adjustments of the dispersant dosages were performed with halloysite, kaolinite, and quartz minerals after adding sodium silicate, STPP, and SHMP separately at the dosages of 2.5, 5, and 10 kg/ton, and the suspensions were mixed for 10 min. All prepared suspensions were kept for 5 min to let the coarse particles settle down and a stable suspension could be obtained. Approximately 3 mL aliquots were drawn from the surfaces of the suspensions that reached equilibrium and transferred to the zeta potential measuring device in a 4 mL measuring cell, and the zeta potential measurements were performed. The measurements were carried out with 20 repetitions for each pH value and the standard deviation value of the measurements was kept below ±2 mV.

2.2.3. Dispersion/Sedimentation Experiments

Dispersion/sedimentation experiments in the presence of different pH and dispersants were carried out at a 5% solids ratio with <38 µm sized materials. In pH-dependent experiments, the pH adjustments of the suspensions were made by using oxalic acid dihydrate for the acidic medium and KOH for the basic medium. The adjustment of dispersant concentrations for the experiments was carried out by using sodium silicate, STPP, and SHMP at the dosages of 2.5, 5, and 10 kg/ton, separately, to see the effect of dispersant type and dosage on dispersion/sedimentation. Then, the prepared suspensions were mixed in a magnetic stirrer at 500 rpm for 4 h and poured into a 100 mL measuring cylinder. Finally, after the suspensions were turned upside down 10 times, the dispersion/sedimentation of the particles in the suspension was monitored, and the sedimentation level over time was recorded by measuring the bed layer. In the experiments, the change in the interface between the condensed bed layer and the sedimentation layer was recorded. Additionally, the turbidity measurements were carried out by pulling the suspension at a depth of 5.55 cm (30 mL) downwards from the surface (18.5 cm) after a 2 h sedimentation period in which a significant difference was observed in the sedimentation layer with a HACH 2100AN IS turbidimeter.
The effects of dispersant types on the dispersion of halloysite ore in an aqueous medium were investigated to improve the dispersion process. An IKA RW20 model overhead mixer was used for the mechanical dispersion studies with halloysite ore in the presence of dispersants at optimum parameters that were obtained in the previous study [22]. For this purpose, −10 mm halloysite ore was mechanically dispersed with dispersants such as sodium silicate, STPP, and SHMP at a mixing speed of 1000 rpm, in pure water, with a solids ratio of 35%, and at room temperature at dosages between 2.5 and 10 kg/ton. Moreover, the changes in the viscosity of the pulp obtained after the experiments, the amount of material that changed to <38 µm size, and the changes in the chemical contents of the obtained materials were investigated. The viscosity measurements were performed with an NDJ-1 analog viscometer, which had a 0.1–100,000 mPa.s capability.

3. Results and Discussions

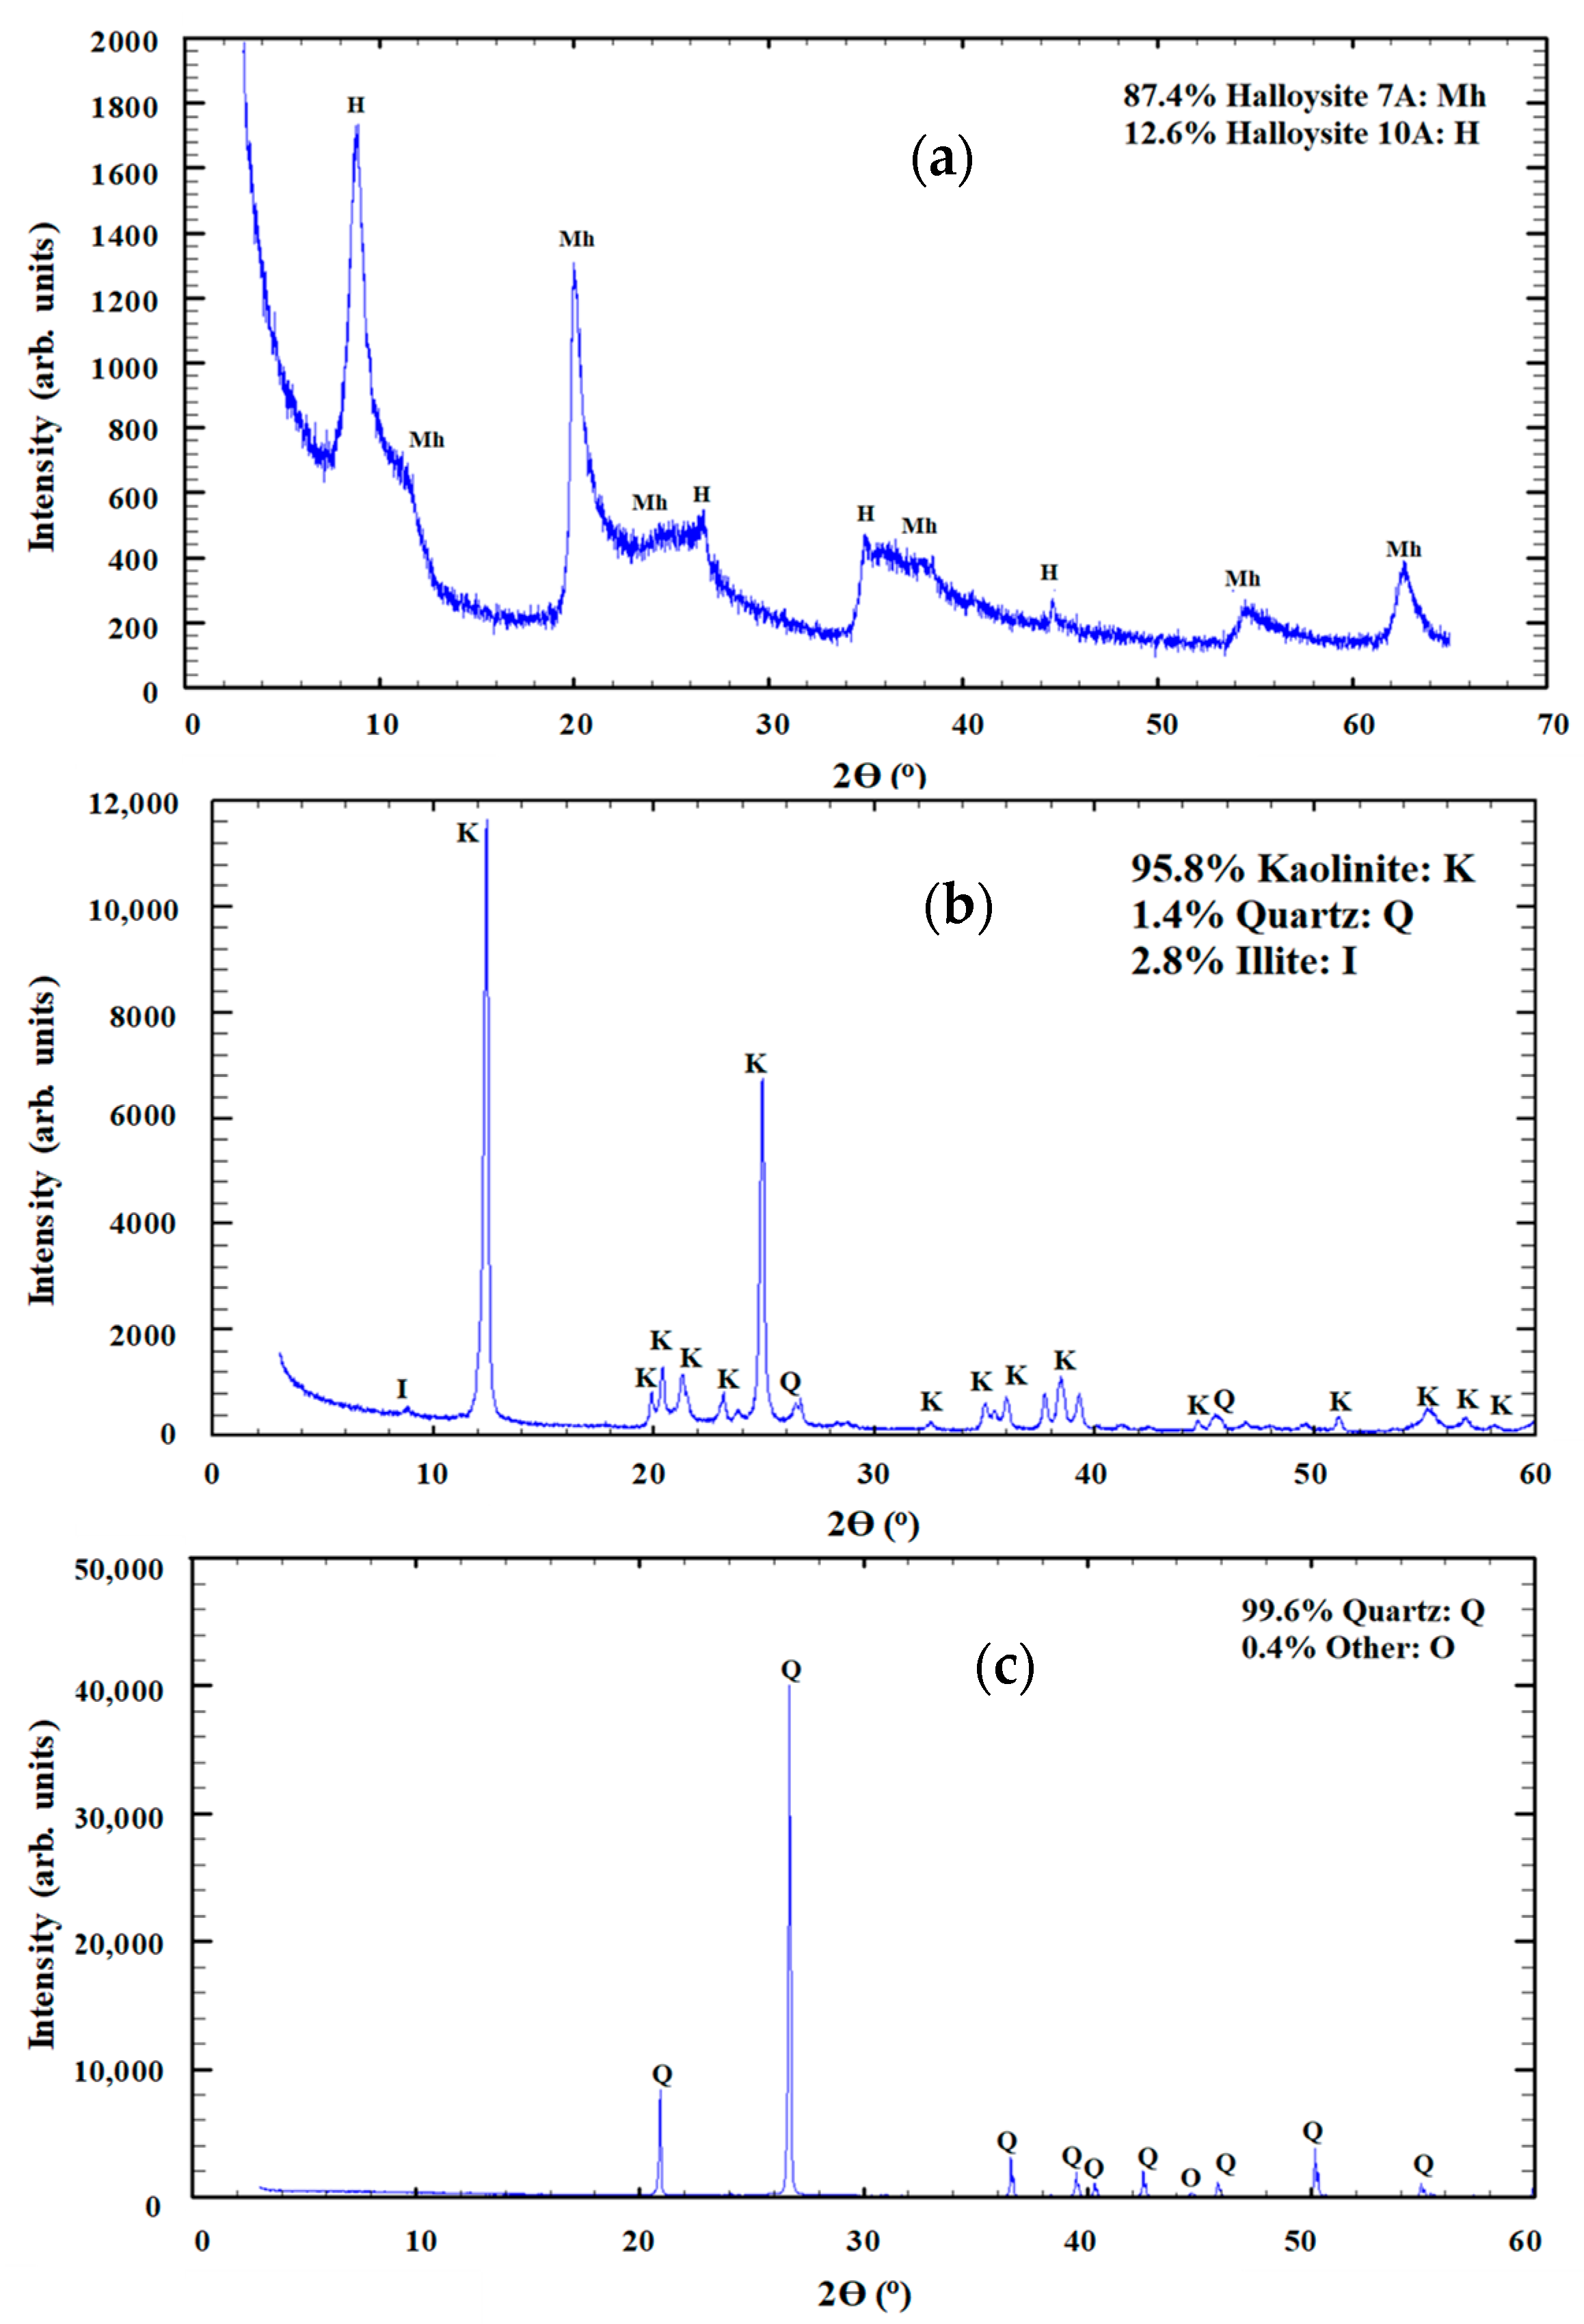
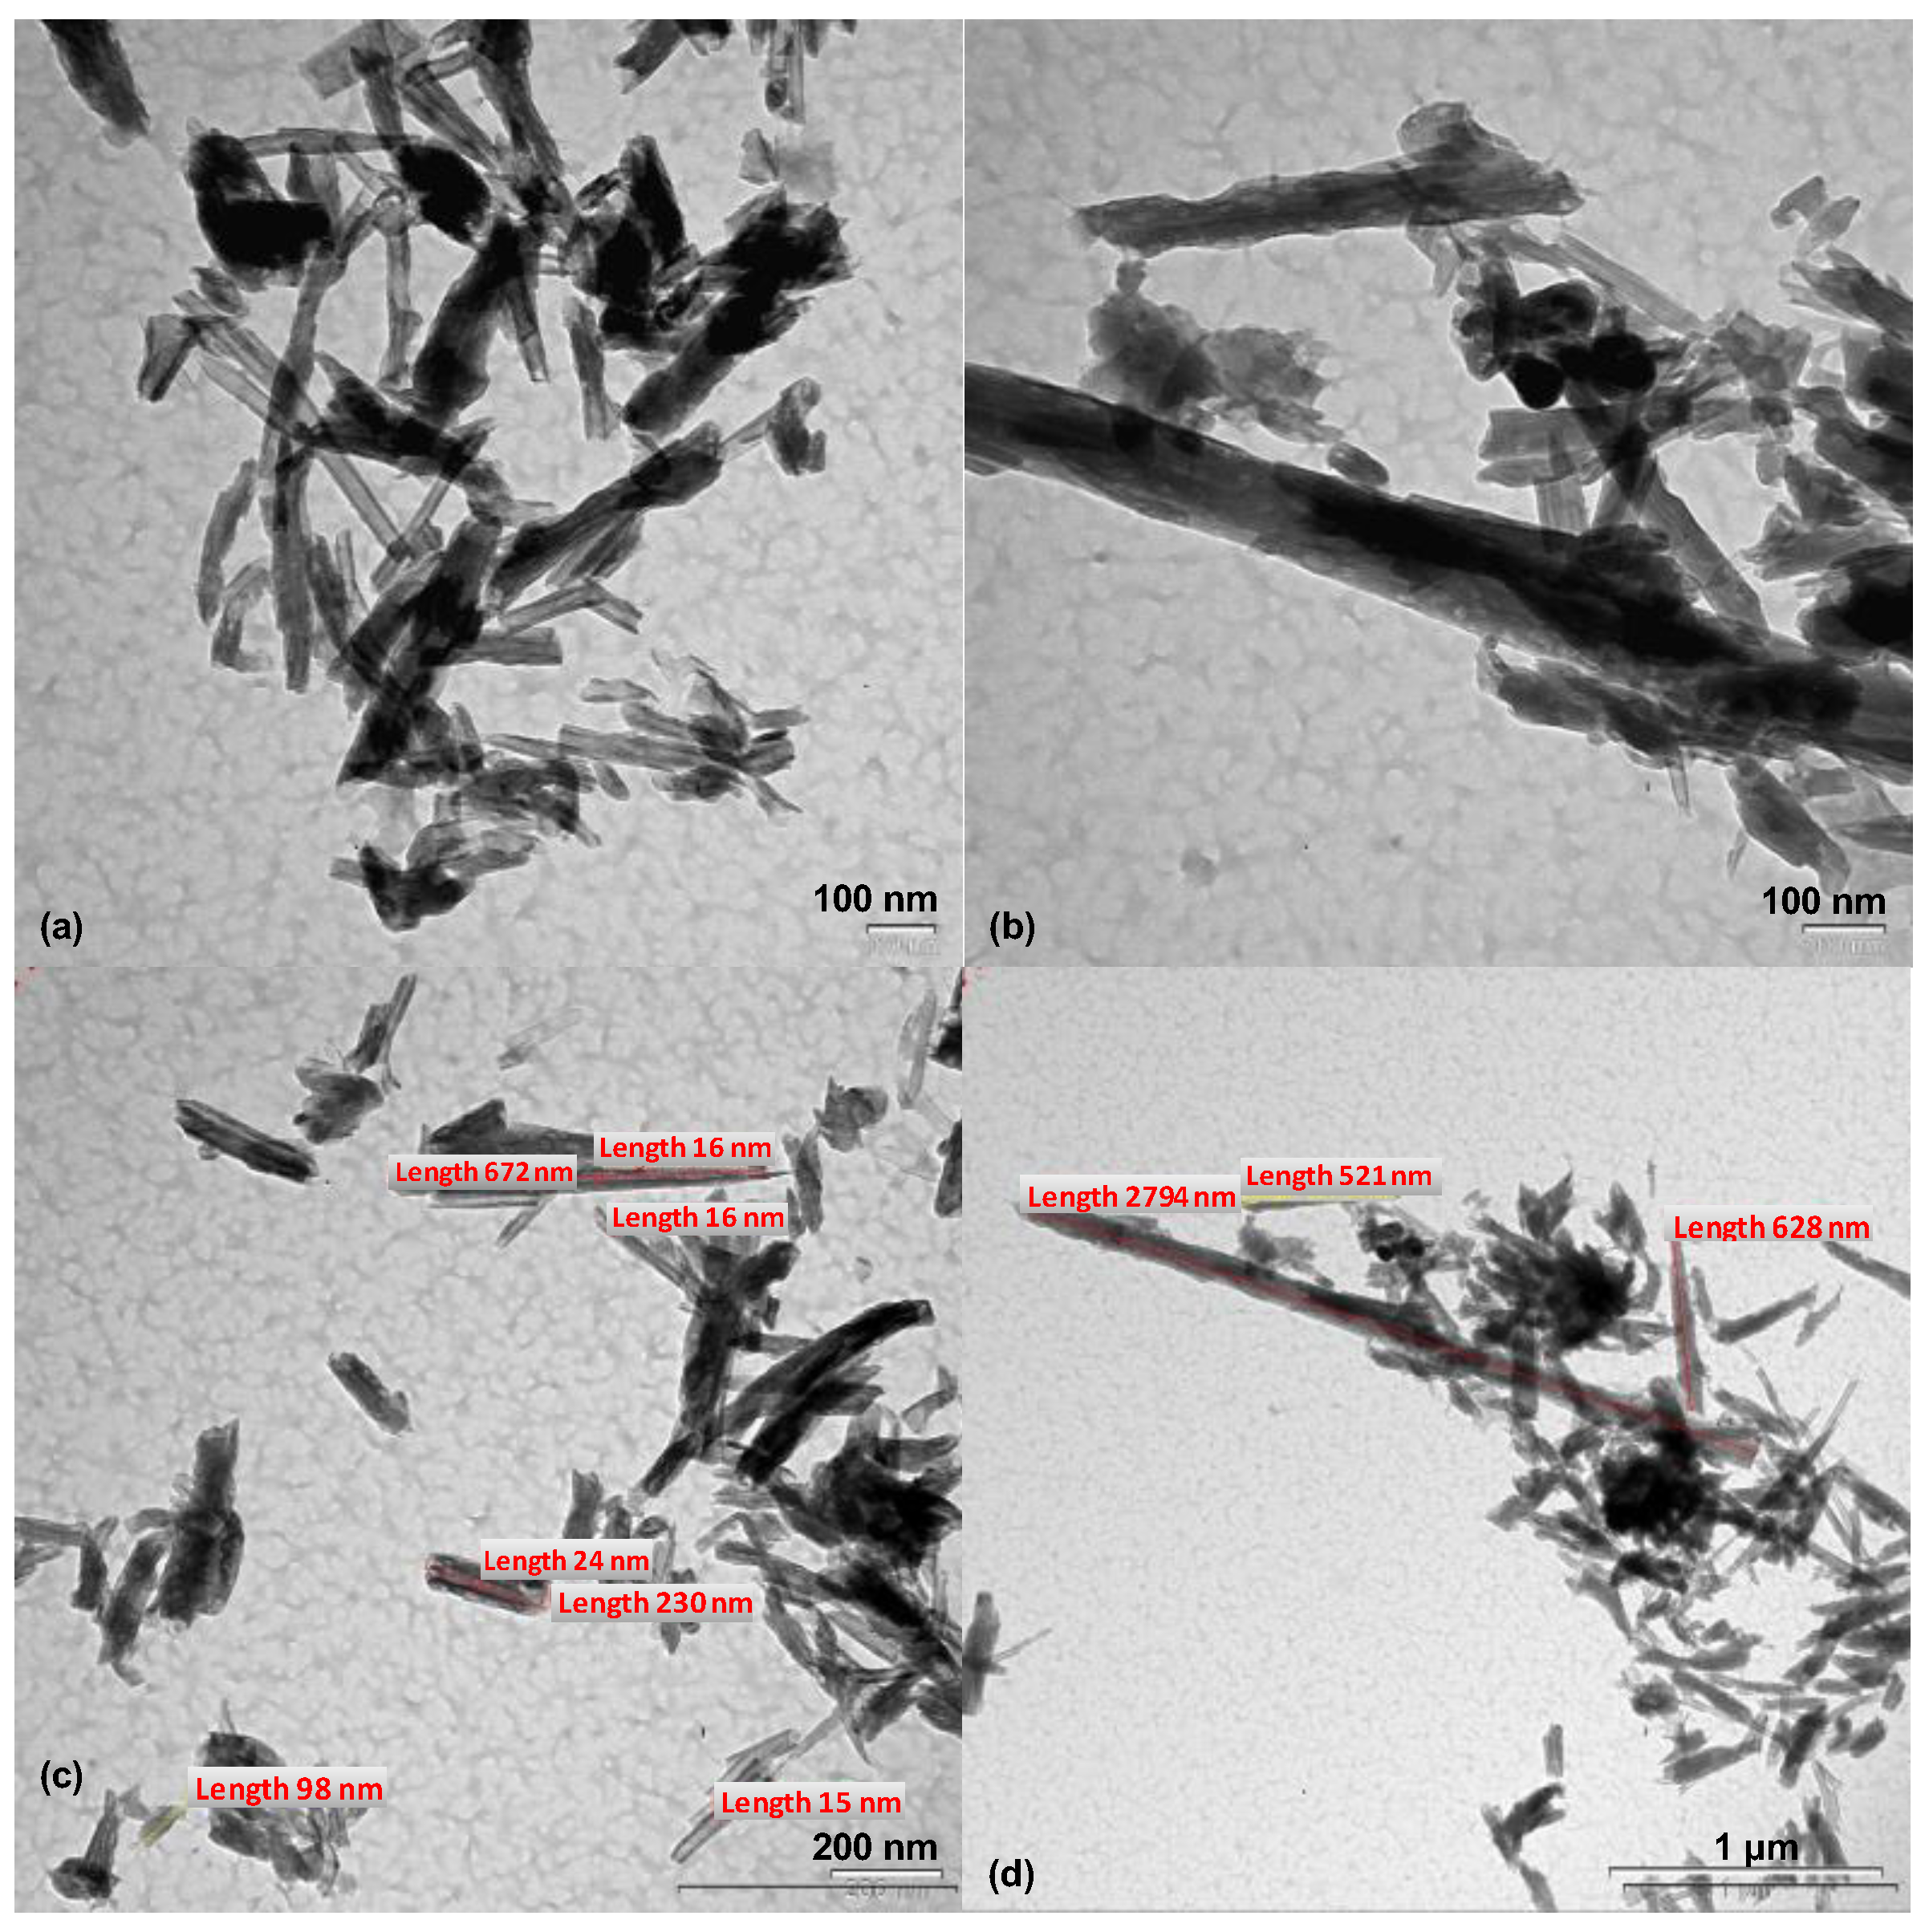
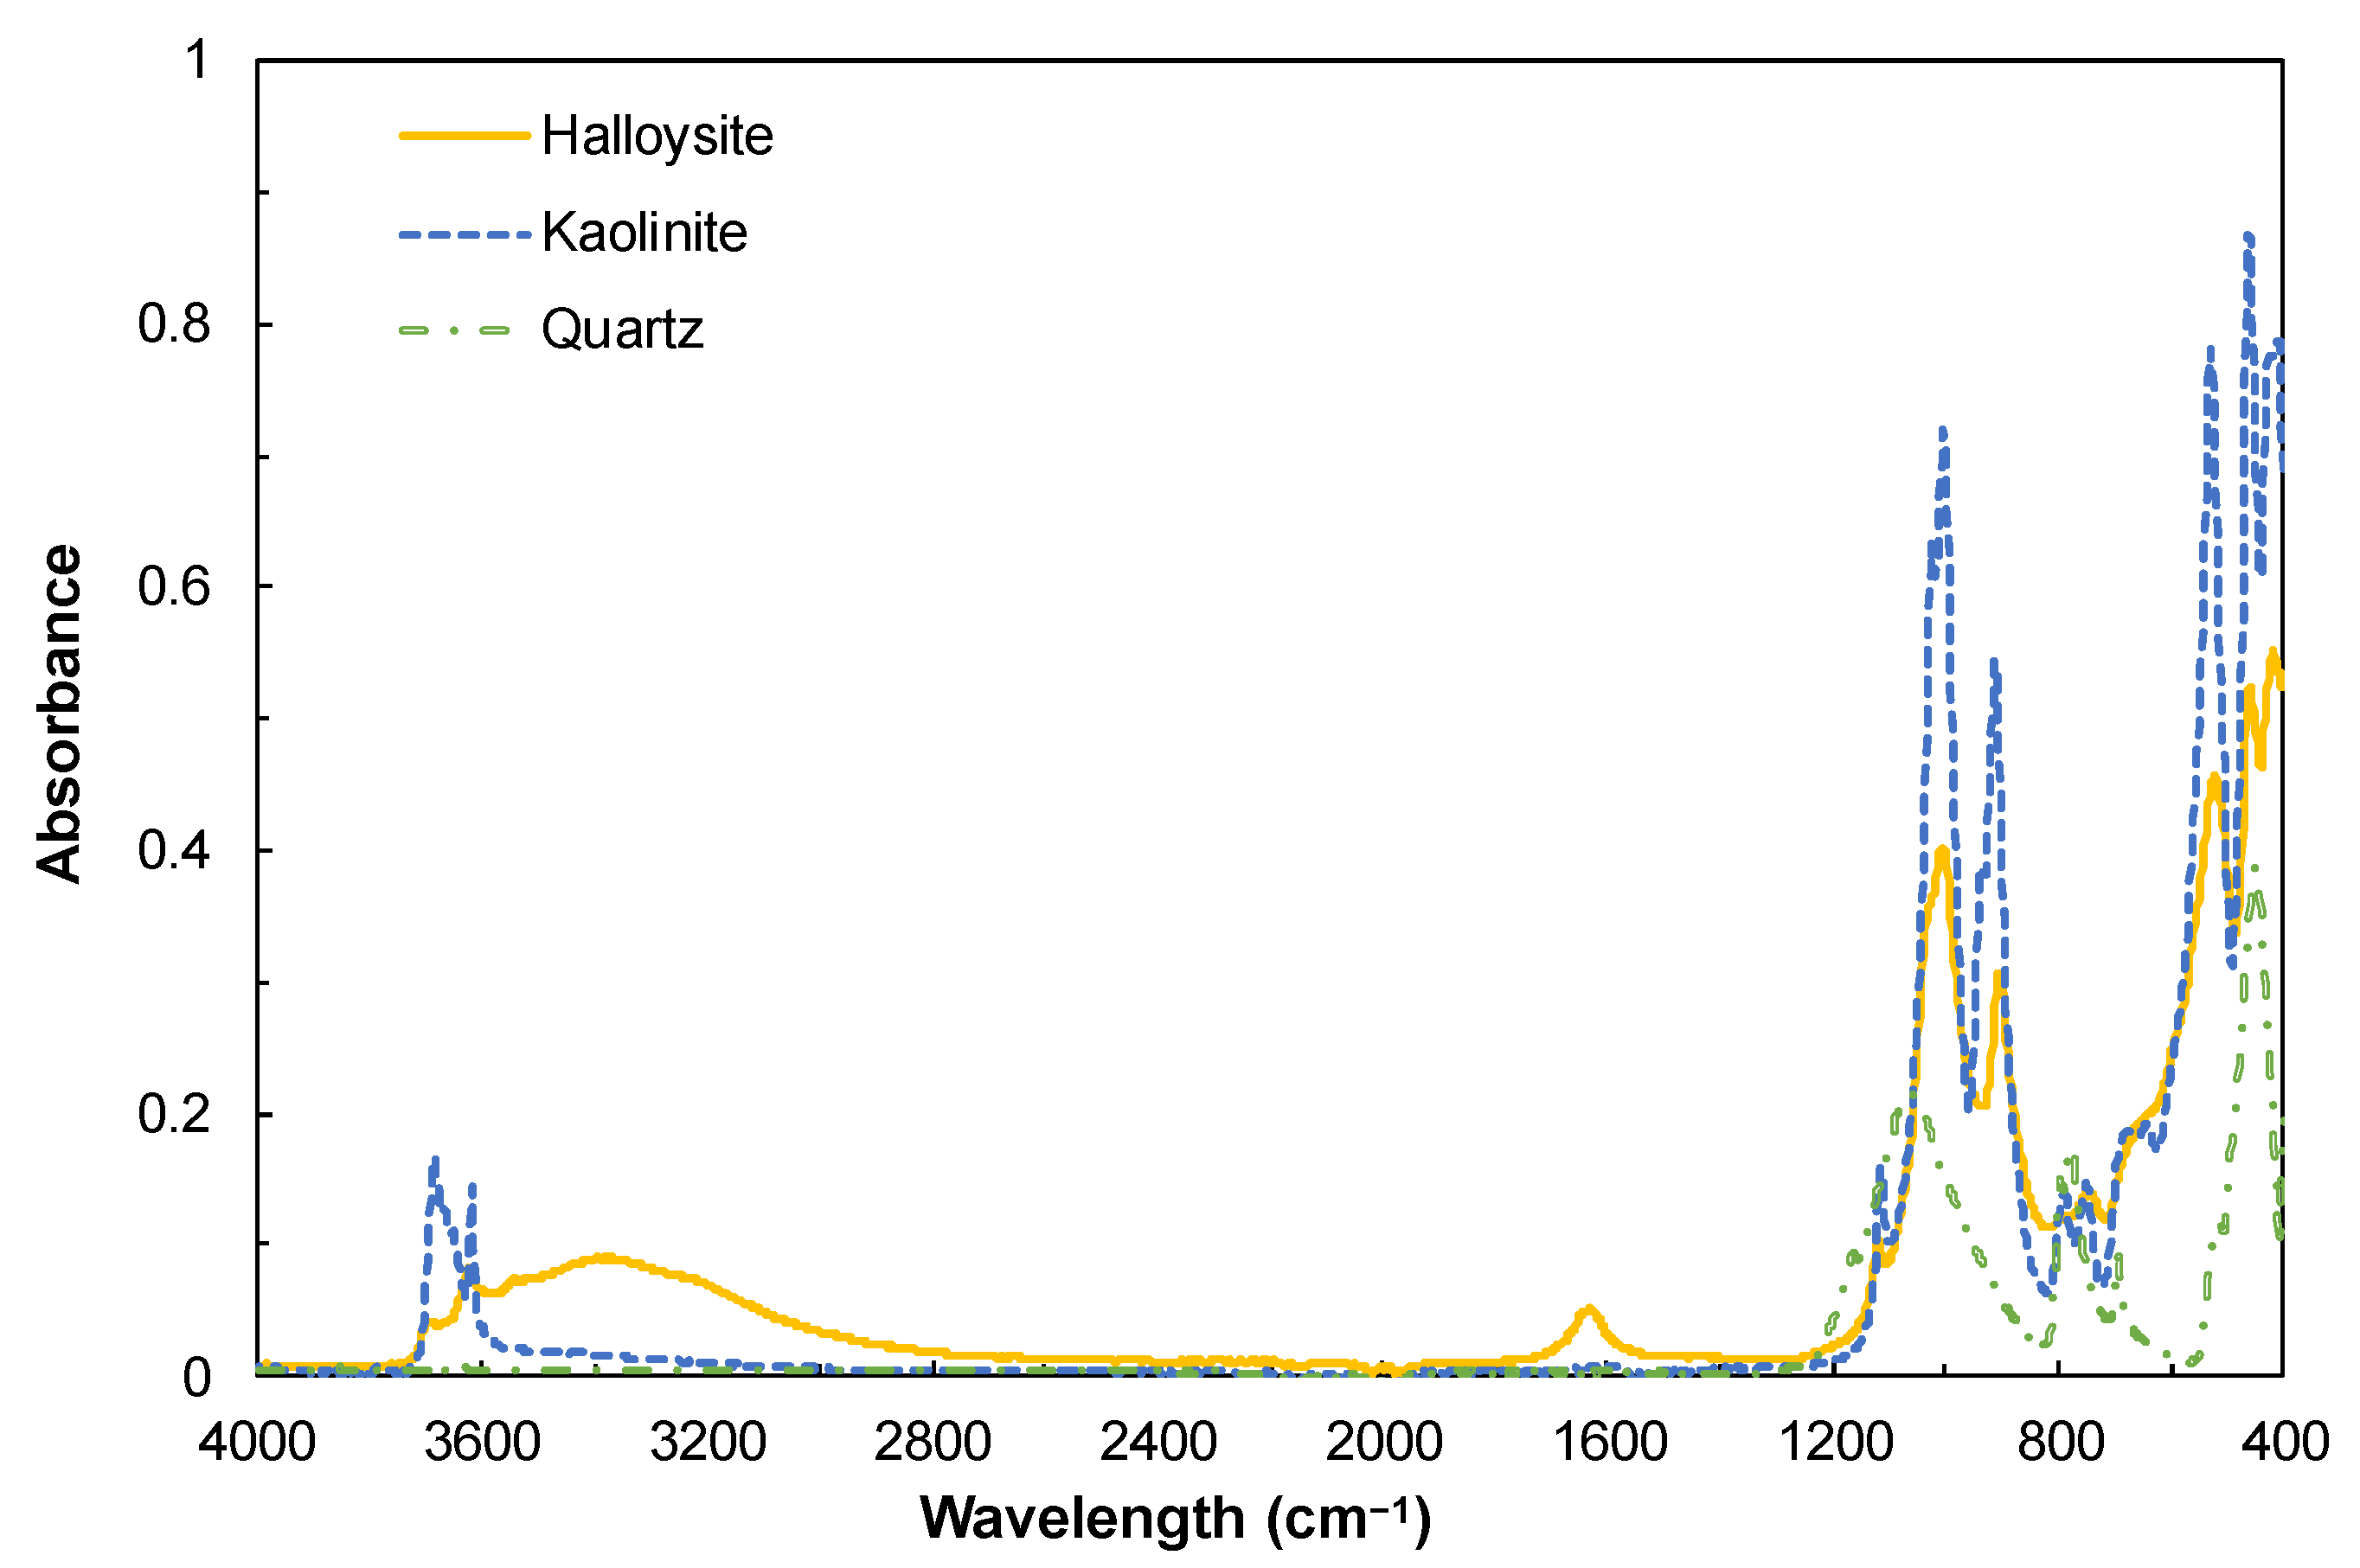
3.1. Sample Characterization

As seen from the chemical analysis of the sample presented in Table 1, the contents of Al2O3, SiO2, and loss on ignition (LOI) values of halloysite, kaolinite, and quartz minerals were 38.3, 38.2, 0.5%; 44.0, 46.6, 99.2%; and 17.0, 13.5, 0.2%, respectively. Titanium, iron, calcium, magnesium, and potassium were found as minor impurities in the structure of halloysite and kaolinite, while the impurities in the structure of the quartz minerals originated from titanium and aluminum (Table 1).
Additionally, the mineralogical analyses of the samples are shown in Figure 1. As seen in Figure 1a, the XRD diagram of the halloysite mineral consisted of 87.4% halloysite 7 Å and 12.6% halloysite 10 Å type. Large diffraction peaks were observed in the XRD pattern of the halloysite due to the crystal structure of the halloysite nanotube (HNT). In general, the pattern had peaks corresponding to the metahalloysite or halloysite 7 Å type. The diffraction peaks at 12.0, 20.1, 24.6, 35.0, 37.9, 54.5, and 62.6 corresponded to the (001), (100), (002), (110), (003), (210), and (300) h-k-1 planes for 2θ, respectively. The 12.0 peak in the (001) plane represented the 0.73 nm layer spacing seen in halloysite 7 Å. Moreover, the 20.1 peak (0.44 nm) in the (100) plane also indicated the presence of halloysite 7 Å.
Figure 1b showed the XRD diagram of kaolinite and that the diffraction peaks at 12.3, 19.8, 20.3, 24.8, 35.1, 37.6, 38.3, and 51.1 values corresponded to (001), (020), (110), (002), (130), (003), (202), and (004) h-k-1 planes, respectively. XRD analysis showed that the kaolinite mineral consisted of 95.8% kaolinite, 1.4% quartz, and 2.8% illite minerals.
The diffraction peaks at 20.82, 26.62, 36.52, 39.44, 40.26, 42.41, 45.75, 50.10, and 54.83 corresponded to (001), (011), (110), (012), (111), (200), (021), (112), and (022) h-k-1 planes in the quartz mineral XRD diagram, respectively [23]. The quartz sample consisted of 99.6% quartz mineral and 0.4% other minerals, quantitatively (Figure 1c).
Halloysite and kaolinite minerals were crushed with a jaw crusher to −10 mm. The size of the quartz mineral was −100 µm. These minerals were sieved to obtain a <38 µm size fraction after mixing at a 5% solids ratio for 4 h at 500 rpm in pure water. Table 2 presents the D10, D50, and D90 values for the minerals that were used in the zeta potential measurement and dispersion/sedimentation experiments.
TEM images of halloysite mineral (Figure 2) demonstrated that the mineral showed tubular morphology. The inner parts of the halloysite nanotubes were empty and there were pores on the tubes. The TEM images showed that the length of the HNTs reached 2794 nm, and the diameter of the HNTs’ lumen ranged between 15.40–24.35 nm (Figure 2). The surface area of the halloysite mineral was measured as 120.6 m2/g by the BET analysis.
Well-crystallized kaolinites consisted of particles with morphologically well-defined hexagonal-shaped pinacoid {001} faces. The hexagonal surfaces of the particles correspond to 001 basal planes in the crystallographic view. While the axial dimensions of the kaolinite particles were different from each other, the surface dimensions of the particles were greater than their thickness. In this state, kaolinites were arranged as platelets. The typical size of kaolinite particles ranged from 0.2 to 4 μm in diameter, but very small particles have also been described in the literature [24]. Figure 3a shows the TEM image of the lamellar kaolinite mineral in which the hexagonal morphology was clearly defined. With the BET analysis method, the surface area of the kaolinite mineral was measured as 15.6 m2/g. In the TEM image of the quartz mineral, the quartz particles appeared to have basic structural units (Figure 3b).
Generally, the basic units of clay minerals are hydroxyl groups, tetrahedral silicate/aluminum anions, octahedral metal cations, and interlayer cations. Considering the IR frequencies of clay minerals, the broad bands between 3000 and 3750 cm−1 are due to the O–H stretching seen in silanol groups and water. The bending vibrations for Metal–OH group occur in the region of 600–950 cm−1. There are Si-O and Al–O stretching vibrations in the range of 700–1200 cm−1. Si-O and Al–O bending vibrations are dominant in the 150–600 cm−1 range. At 900 cm−1, there is a band assigned to the Si-O stretching frequency of the silanol group [25]. FTIR spectra of halloysite, kaolinite, and quartz minerals are given in Figure 4. Al–OH stretching vibration at 3696 cm−1 frequency and Al–OH stretching vibration intensities observed in the octahedral layer at 1623 cm−1 were lower in halloysite than in kaolinite [26]. Moreover, a wide hydroxyl stretch band associated with layer water was observed below 3600 cm−1 in the halloysite FTIR spectrum. For the halloysite, the two bands observed at 1636 cm−1 and 1650 cm−1 were assigned to two different water-bending vibrations in the interlayer [27]. In addition, the peaks assigned to Si-O stretching and Si-O–Al stretching vibrations below 1033 cm−1 were observed to be more intense in kaolinite than in halloysite [28].
The fingerprint region of infrared bands related to quartz crystals was between 400–1200 cm−1 [29]. The characteristic peaks of pure quartz mineral at 1083 cm−1 and 775 cm−1 showed asymmetric and symmetrical Si-O stretching vibrations, respectively, and the peak at 450 cm−1 showed asymmetric Si-O bending vibrations [30].
In the experimental studies, first of all, the zeta potential measurements were carried out to explain the dispersion/sedimentation behavior of the minerals. One of the basic elements that provides dispersion in solid suspensions is the electrostatic repulsion forces between the particles, and this can be explained by the measurement of the zeta potential between the particles. Then, the dispersion/sedimentation experiments were carried out to reveal the differences in the morphology of halloysite, kaolinite, and quartz minerals in the presence and absence of dispersants. Lastly, halloysite ore, which was mineralogically mostly composed of halloysite, kaolinite, quartz minerals, and a small amount of other impurities, was used to determine the content of the <38 µm sized materials by taking advantage of the difference in dispersibility with and without dispersant medium. The enrichment of the ore with dispersibility difference was investigated.

3.2. Zeta Potential Measurements

3.2.1. Without Dispersants

Zeta potential, an electrokinetic phenomenon on the surface of clay minerals, affects the dispersion and sedimentation behavior of particles in water suspension [31]. In the zeta potential measurements of halloysite, kaolinite, and quartz minerals according to pH, oxalic acid dihydrate and KOH were used as the acidic and alkaline mediums, respectively. The zeta potential measurements were performed between pH 3–11 after stabilizing the pH values, and the results are shown in Figure 5.
The zeta potential values of kaolinite and quartz minerals were negative in all measurements and were increasingly negative from pH 3 to 11 (Figure 5). As seen from the zeta potential-pH graph, the zero point of charge (ZPC) of the halloysite mineral was approximately pH 3.5. The zeta potential of halloysite mineral was measured as −8.29 mV at natural pH (3.8). The surface charge of the sample was positive at acidic pH values lower than pH 3.5 and increased to 16.22 mV at pH 3. For the halloysite, the surface charge of the sample decreased to −45.25 mV from ZPC to pH 7, and it was measured as −39.15 mV for pH 11.
The decrease in the negativity of the zeta potential with the increase in pH could be explained by the adsorption of OH ions on polar groups such as silanol (Si-OH) and aluminol (Al-OH) at the edges of the kaolinite layer, or by ionizing these groups and passing the H+ ion into water [32]. The increase in the zeta potential at very low pH could be explained by the adsorption of H+ on these silanol or aluminol groups, or by the ionization of hydroxyl ions from these groups into the water [33]. These results suggested that the zeta potentials of clay minerals were significant only between pH 3 and 10 owing to the stability of their chemical structures [31].

3.2.2. With Dispersants

In order to investigate the changes caused by the addition of dispersants in aqueous suspensions of halloysite, kaolinite, and quartz minerals regarding physico-chemical properties, zeta potential measurements were carried out using sodium silicate, STPP, and SHMP at 2.5, 5, 7.5, and 10 kg/ton dosages. Figure 6 shows the change in the zeta potentials of halloysite, kaolinite, and quartz minerals as a function of sodium silicate, STPP, and SHMP dosages.
In the zeta potential measurement of halloysite at natural pH (3.8), the surface charge was measured as −8.29 mV. With the addition of a maximum of 10 kg/ton of sodium silicate, STPP, and SHMP, the zeta potentials of halloysite reached −24.40, −27.75, and −29.78 mV, respectively (Figure 6a). The surface charge of kaolinite was measured as −28.98 mV in the zeta potential measurement performed at natural pH (6.2). With the addition of a maximum of 10 kg/ton of sodium silicate, STPP, and SHMP, the halloysite zeta potentials of kaolinite reached −32.63, −36.11, and −38.67 mV, respectively (Figure 6b). In the zeta potential measurement of quartz at natural pH (6.7), the surface charge was measured as −30.40 mV. With the addition of a maximum of 10 kg/ton of sodium silicate, STPP, and SHMP, the halloysite zeta potentials reached −46.31, −69.06, and −73.88 mV, respectively (Figure 6c).
In sodium silicate, STPP, and SHMP systems, sodium ions take calcium counter ions’ place within the electrical double layer in kaolinitic clay suspensions [34]. Since halloysite, kaolinite, dickite, and nacrite minerals are dioctahedral 1:1 layered natural clay minerals of the kaolin group, they show similar adsorption properties for sodium silicate, STPP, and SHMP on kaolinitic clay minerals. However, in a sodium silicate system, silanol groups react with hydroxyl groups [35]. In STPP and SHMP systems, phosphate ion adsorption occurs. Because of these reactions, the negative charge of clay particles becomes more negative [36].
As a result, the effects of dispersants on each suspension prepared with halloysite, kaolinite, and quartz minerals were different. The effect of the dispersants used on the kaolinite zeta potential change was not much, the zeta potential remained almost constant, but the dispersant dosage was more effective on halloysite and quartz minerals.

3.3. Dispersion/Sedimentation Studies
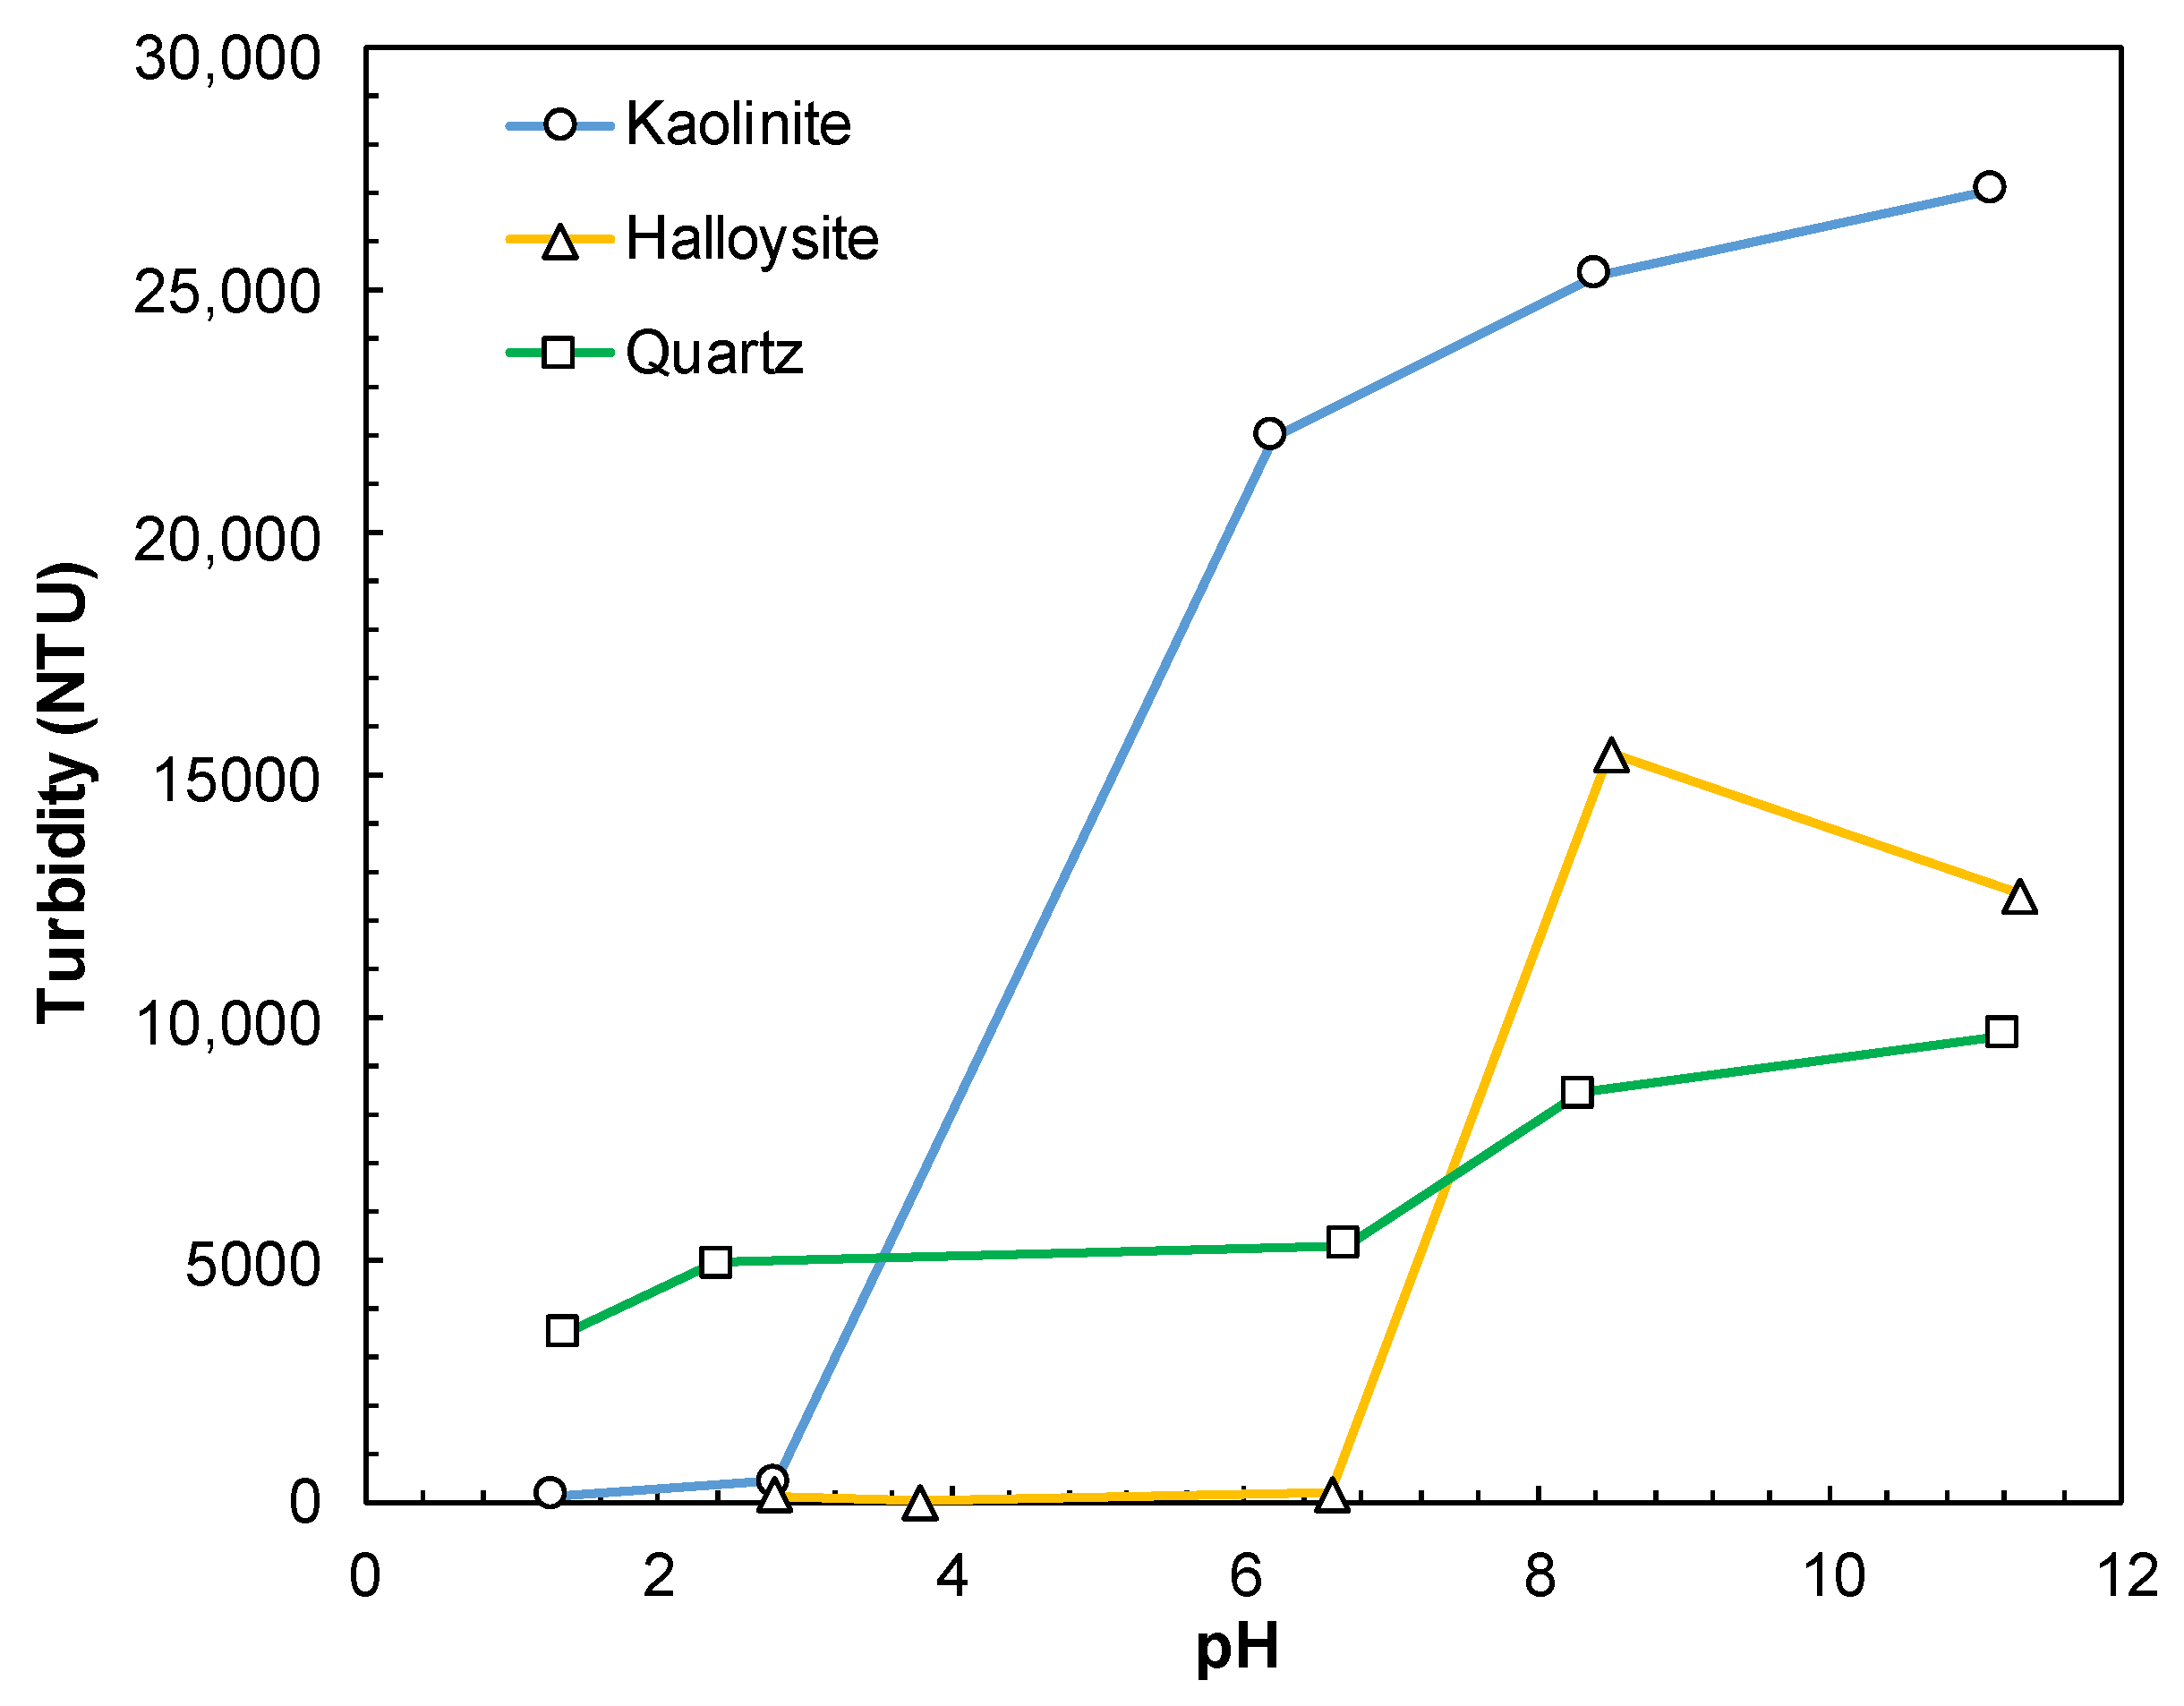
3.3.1. Effect of pH

In Figure 7, the bed layer thicknesses of halloysite, kaolinite, and quartz minerals at natural pHs and room temperature are given until 480 min settling time. Halloysite settled fast at natural pH (3.8) in sedimentation behavior. The possible reason for this was that the zeta potential of halloysite measured at natural pH was between the zeta potential values (<−40 mV) required for agglomeration of solids because van der Waals interaction between HNTs occurred [37]. Partial dissolution of silicon and aluminum from the structural lattice became due to the increasing OH ion concentration towards the alkaline environment, and hence the negatively increasing zeta potential value of the surfaces caused the solids to repel each other electrically and the slowing of the sedimentation of the particles as a result of the formation of a dispersed environment clearly explains this situation [31,38,39].
In natural pH, dispersion/sedimentation behavior was observed in which there were non-settled particles in the layer above the bed layer and in which sedimentation was not completed, without a clear separation phase.
The sedimentation tests performed at different pHs for quartz demonstrated that the dispersed particles were seen above the bed layer. Therefore, the turbidity measurements were also carried out to monitor the sedimentation since there was no obvious interface for quartz. The images for the dispersion/sedimentation experiments for the halloysite, kaolinite, and quartz minerals at natural pH after the 1440 min sedimentation period are shown in Figure 7.
The bed layer thicknesses of the minerals did not change after 120 min (Figure 7). For this reason, the changes in the turbidity values of halloysite, kaolinite, and quartz minerals were measured at different pH values after the 120 min sedimentation period (Figure 8). The turbidity values of kaolinite were low (450 NTU), down to pH 2.8, and increased significantly (27,020 NTU) as the pH increased from pH 2.8 to pH 11.1. While the turbidity value of halloysite was 18 NTU at natural pH (3.8), it continued to be low, between pH 2.8 (150 NTU) and pH 6.6 (188 NTU), and was found to increase significantly at pH 8.5 (15,430 NTU) and 11.3 (12,520 NTU). In quartz, the turbidity value, which was 3472 NTU at pH 1.4, increased and reached 9628 NTU at pH 11.2.
As shown in Figure 8, the turbidity values are quite different from each other for pH > 8. This difference is probably due to the formation of different dispersed states between minerals or the difference in particle size distribution between minerals. As seen in Table 2, there was a significant difference in D50 and D90 values between the minerals and the turbidity values were lower than kaolinite, although the size distribution was the coarsest quartz followed by halloysite. As seen in Figure 5, the turbidity difference was probably because the most change in zeta potential above pH > 8 was in the kaolinite mineral. In these cases, the kaolinite was better dispersed and caused the particles to remain suspended. Obtaining the lowest turbidity value in quartz under the same conditions might be the result of the change in the distribution of suspended particles by sedimentation of coarse quartz particles. The difference in turbidity results between minerals at natural pH and below was because the zeta potential values required for the agglomeration of particles were reached at higher pH in halloysite than in other minerals. The dispersibility of kaolin minerals was high in alkaline medium because their charges originate in the dissociation of hydroxyl groups at the edge of the crystal lattice [31].

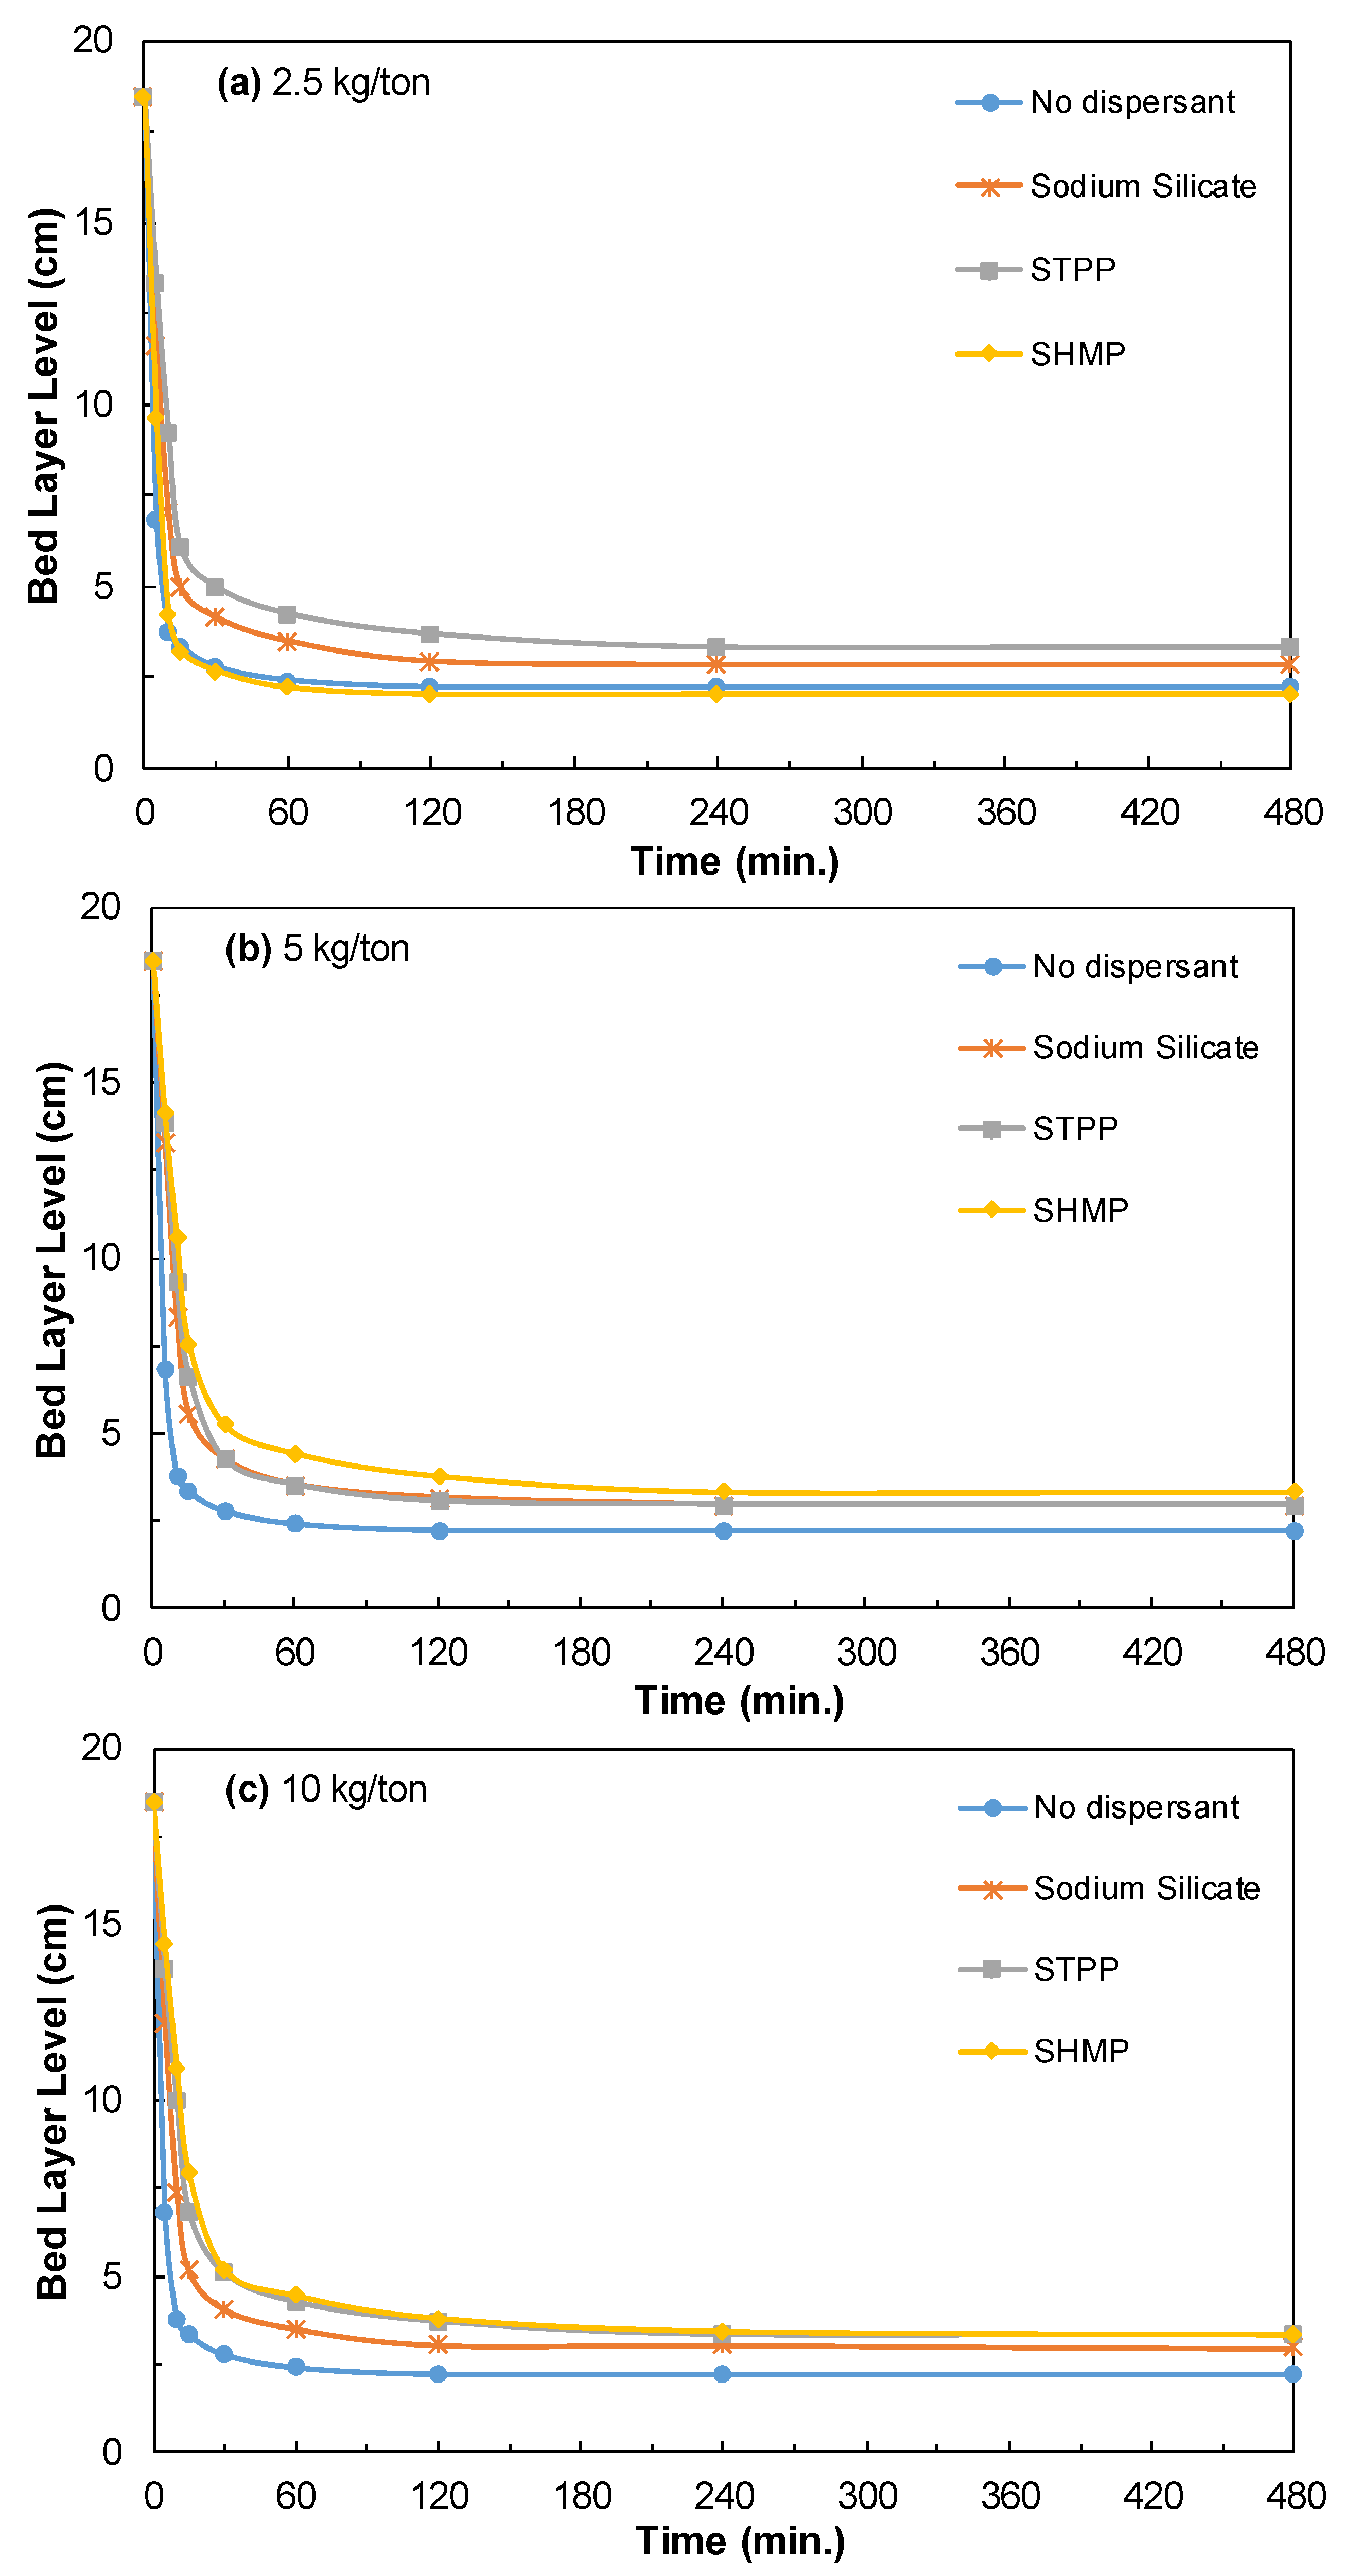
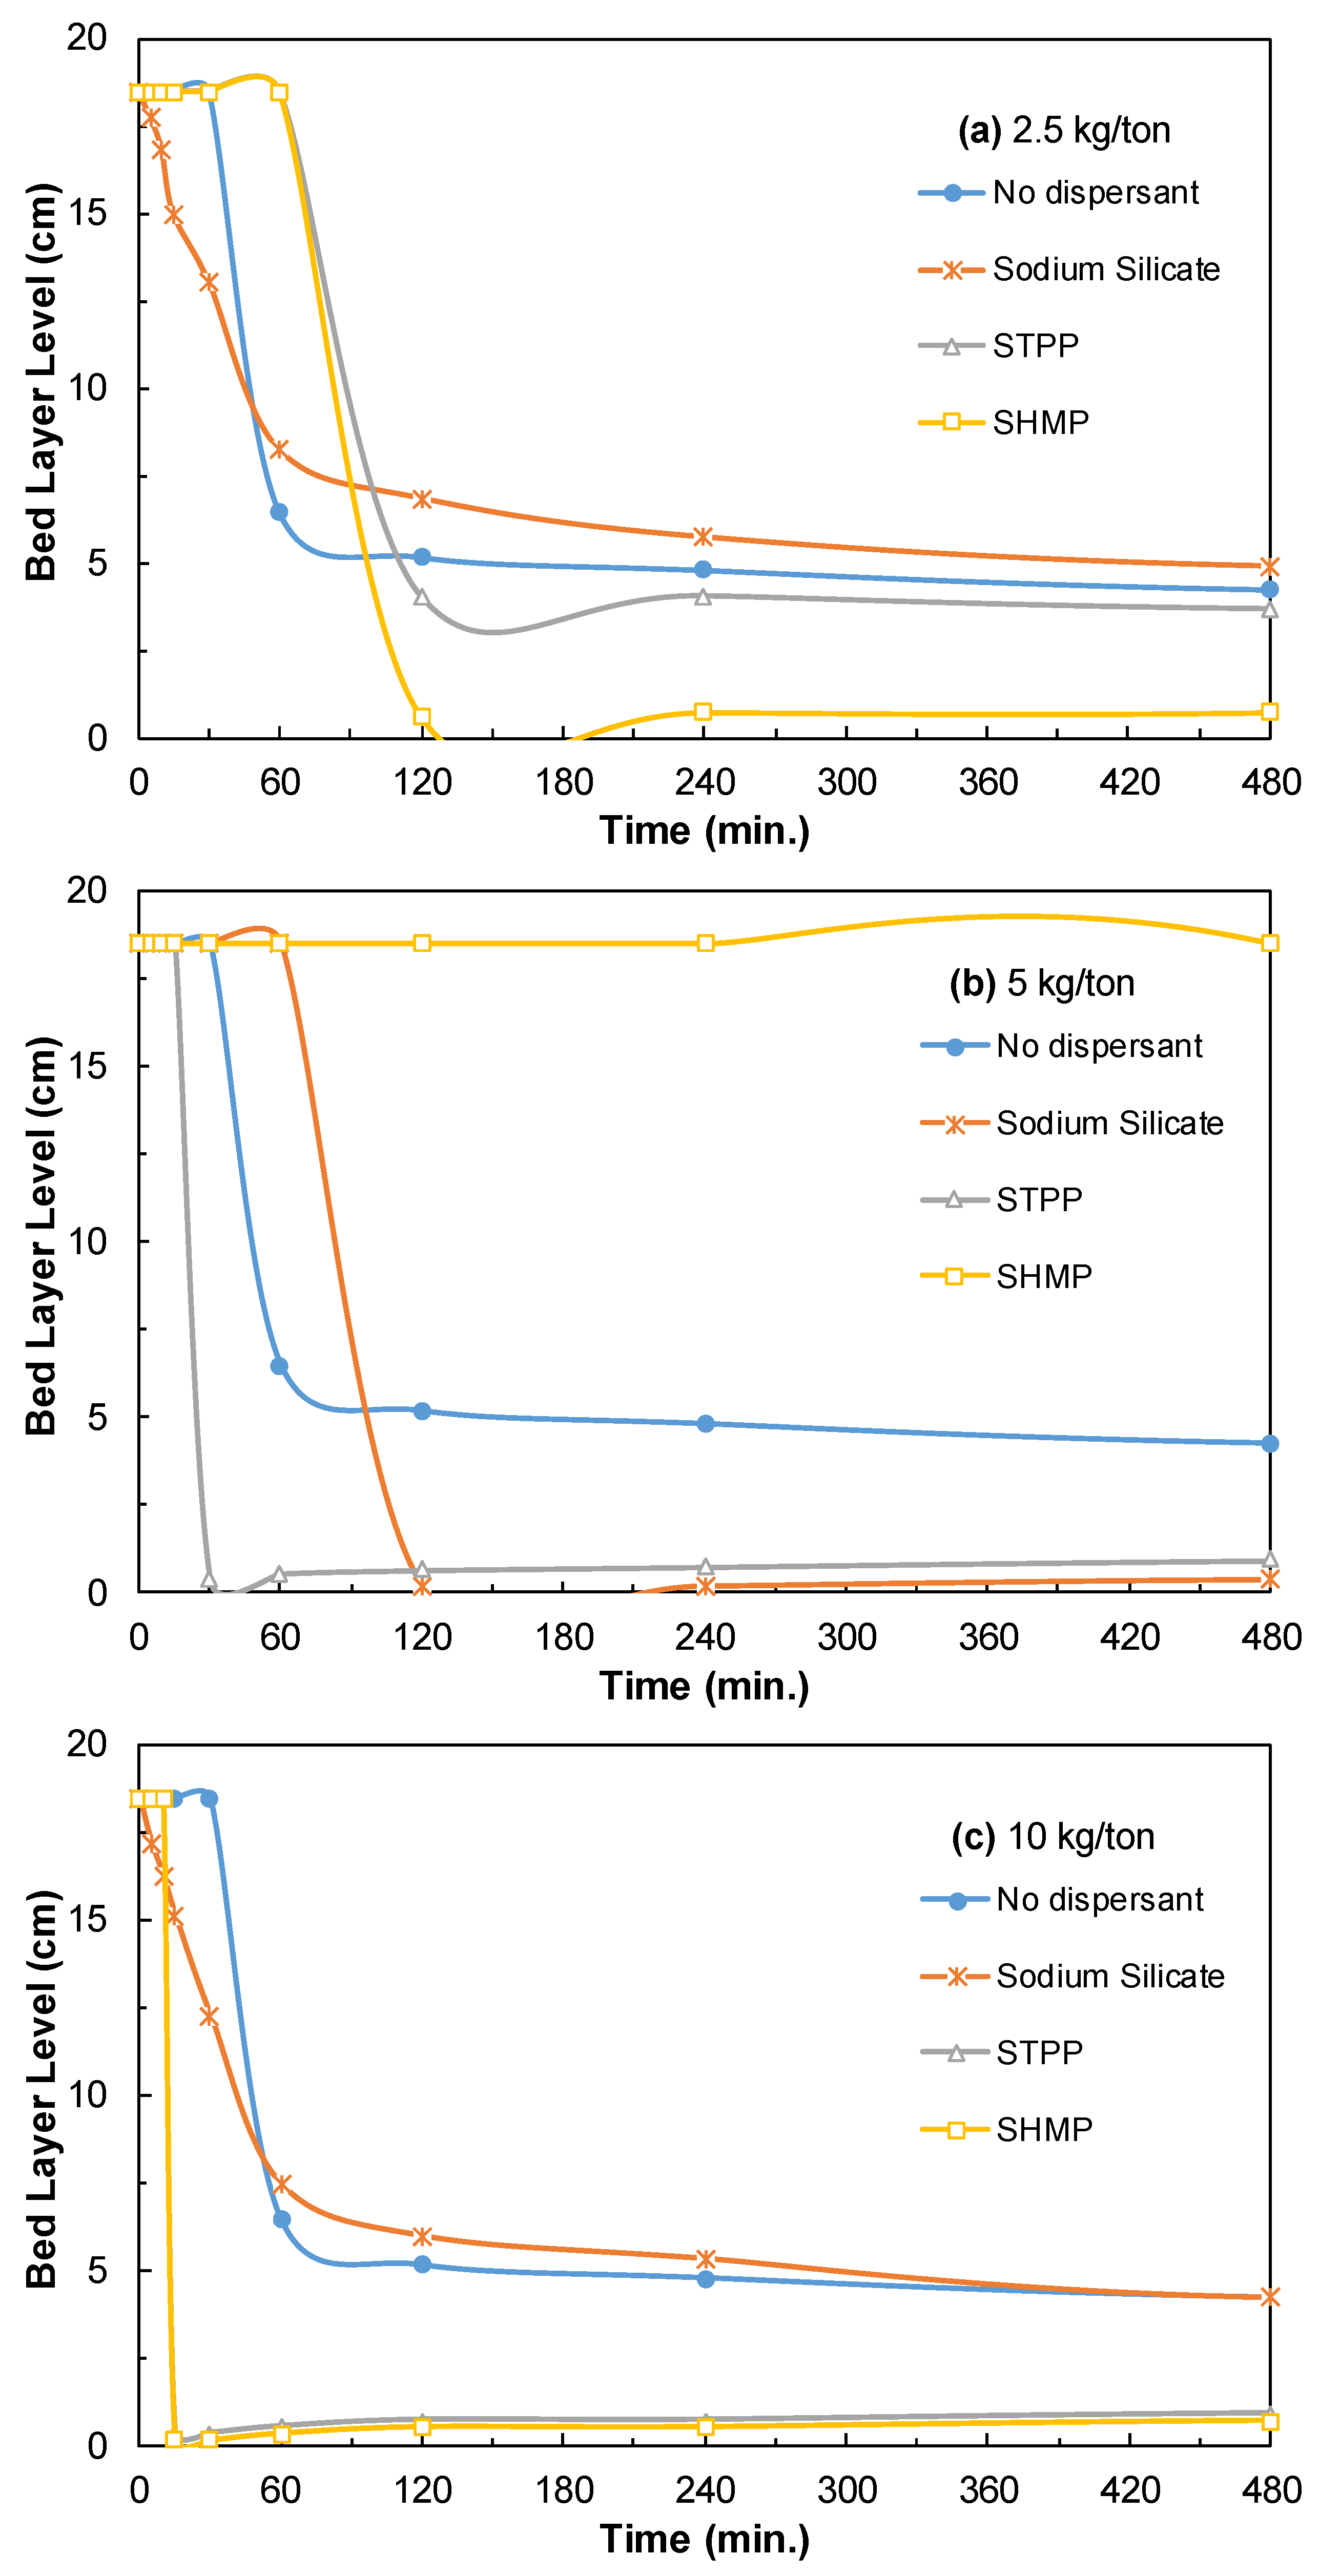
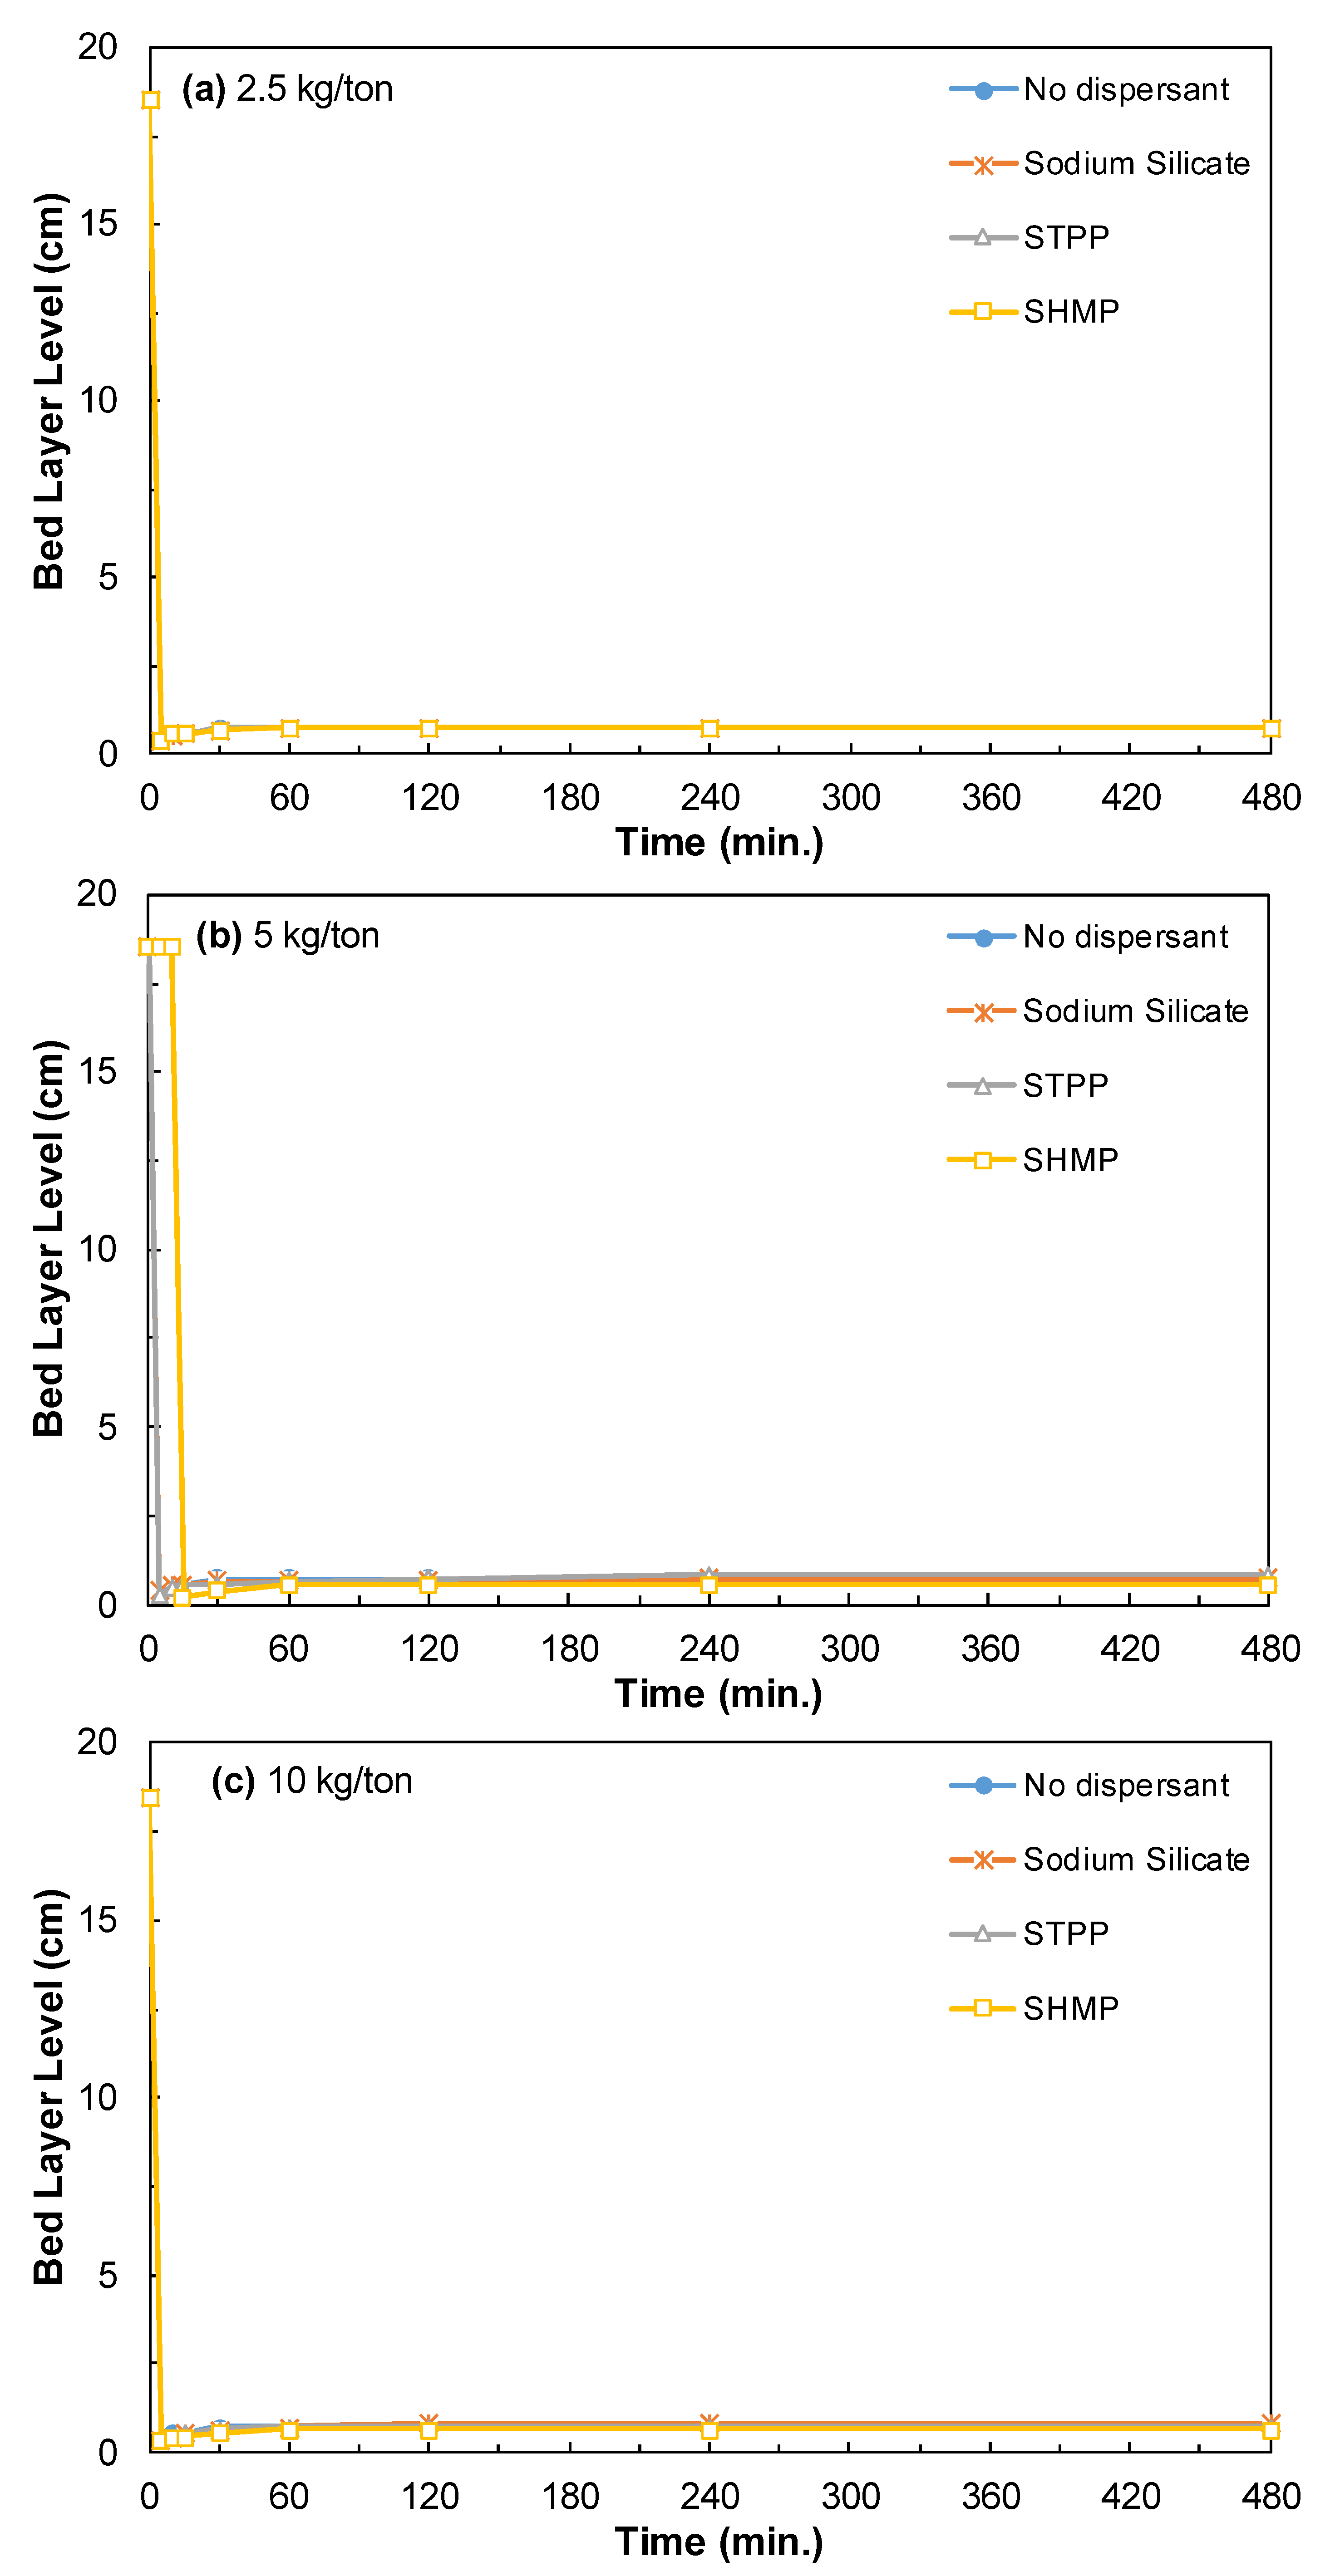
3.3.2. Effect of Dispersants

In the sedimentation experiments of halloysite in the presence of dispersants, the settling speed was determined as sodium silicate–STPP–SHMP from fast to slow, respectively (Figure 9). In the sedimentation experiments performed with each dispersant type with kaolinite mineral, no significant bed layer was formed even after 24 h, the kaolinite minerals remained suspended (Figure 10). According to the dispersant types, in the sedimentation experiments performed with quartz, the bed layer of quartz was formed later in the presence of SHMP (Figure 11).
As a result of the sedimentation experiments performed separately with halloysite, kaolinite, and quartz minerals with sodium silicate, STPP, and SHMP, the turbidity value increased with dispersant dosage increment. The turbidity values at natural pH for halloysite, kaolinite, and quartz minerals without dispersant were measured as 18 NTU, 30,020 NTU, and 5312 NTU, respectively. At the maximum 10 kg/ton dispersant dosages, the turbidity values of halloysite, kaolinite, and quartz minerals were 22 NTU, 73,220 NTU, and 8228 NTU for sodium silicate; 39 NTU, 80,060 NTU, and 8324 NTU for STPP; 45 NTU, 82,870 NTU, and 8440 NTU for SHMP, respectively (Figure 12).
While there was a clear image on the bed layer of the halloysite in the presence of dispersants, turbidity continued on the bed layer in kaolinite minerals, especially in the presence of STPP and SHMP. In the sedimentation experiments performed with quartz, there were particles on the bed layer for all dispersants, even after 24 h.
Dispersants are used to keep solids suspended in suspension for a longer time and to prevent their interaction with each other, that is, to increase the dispersion forces by reducing the intergranular attraction forces. It can be seen from the turbidity values obtained for halloysite in Figure 12a that the three dispersant types used for these three minerals showed not much effect on the suspension of the particles in suspension when compared to the medium without dispersant for halloysite. All three types of dispersants used for kaolinite have a high effect on the suspension of particles and were ranked as SHMP > STTP > sodium silicate according to the degree of effect (Figure 12b). All three dispersants were effective on quartz and the order was similar to that of kaolinite (Figure 12c). As a result, halloysite could be separated from each other by utilizing the sedimentation characteristics of the particles by using a dispersant in an ore containing such minerals.
In the sedimentation experiments performed with halloysite, kaolinite, and quartz minerals in the presence of separate dispersants, when turbidity measurements after 120 min were examined, SHMP had the highest effect on turbidity, then STPP, and sodium silicate had the least effect.

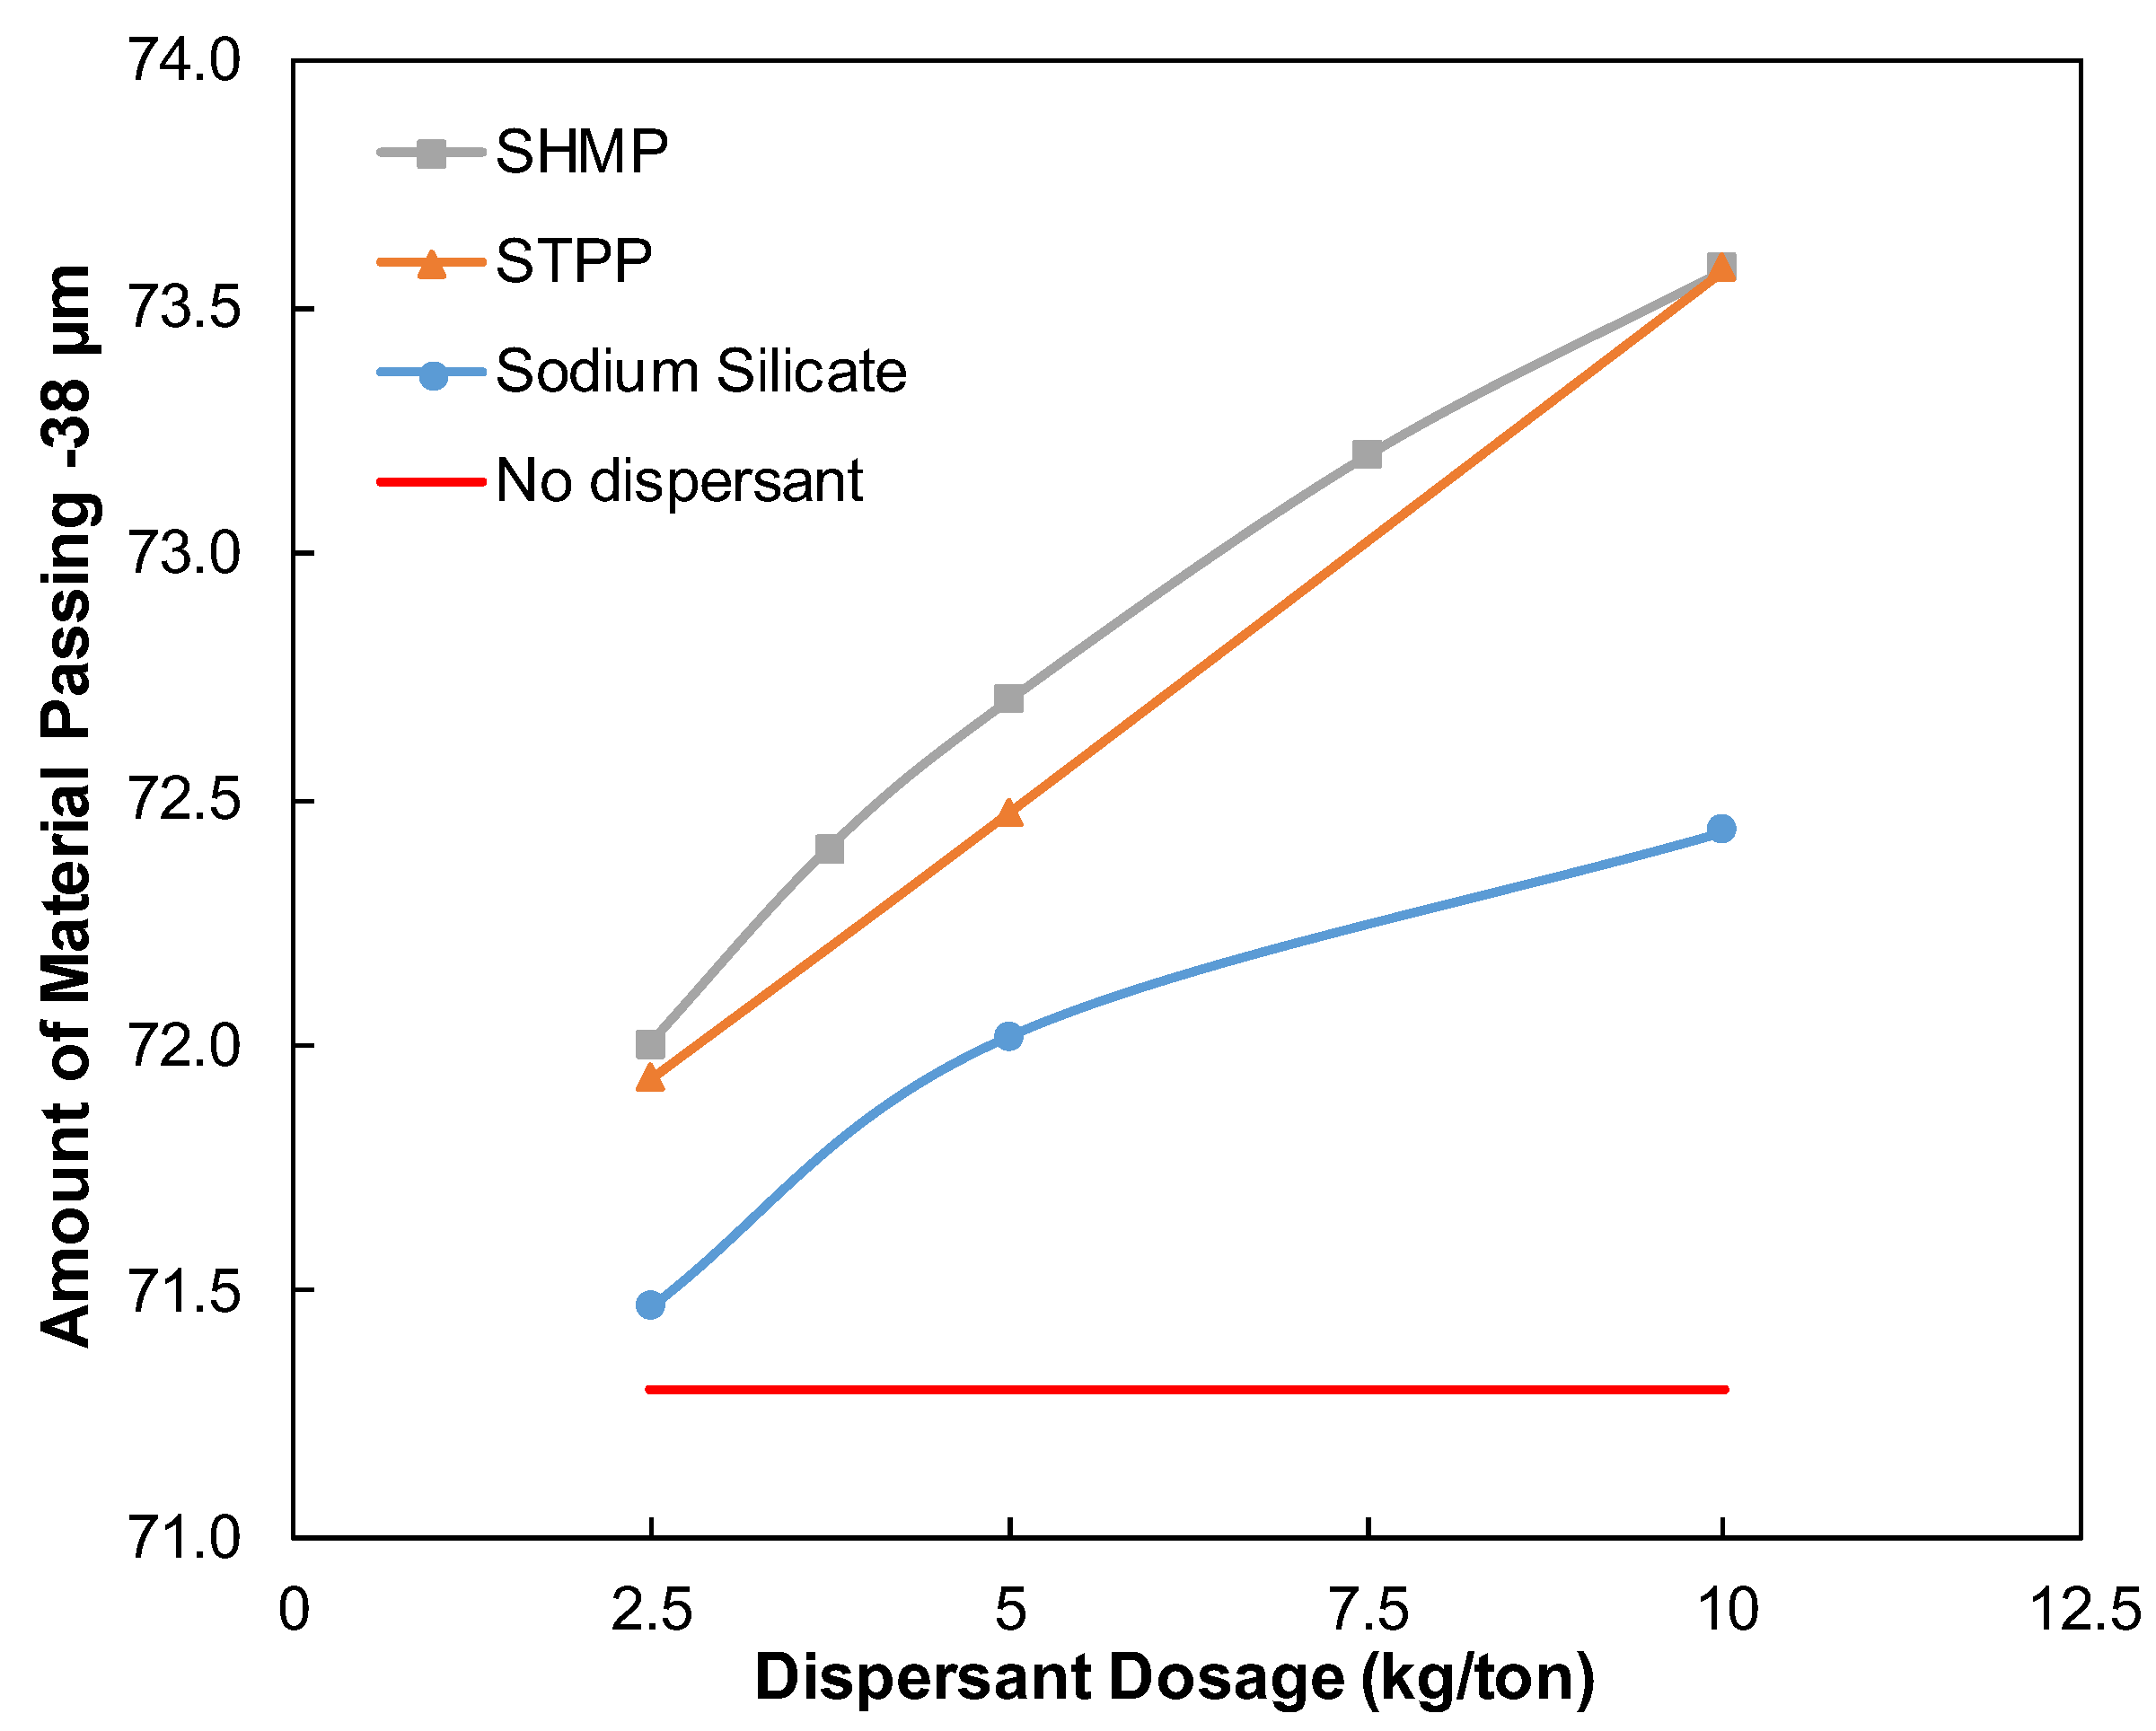
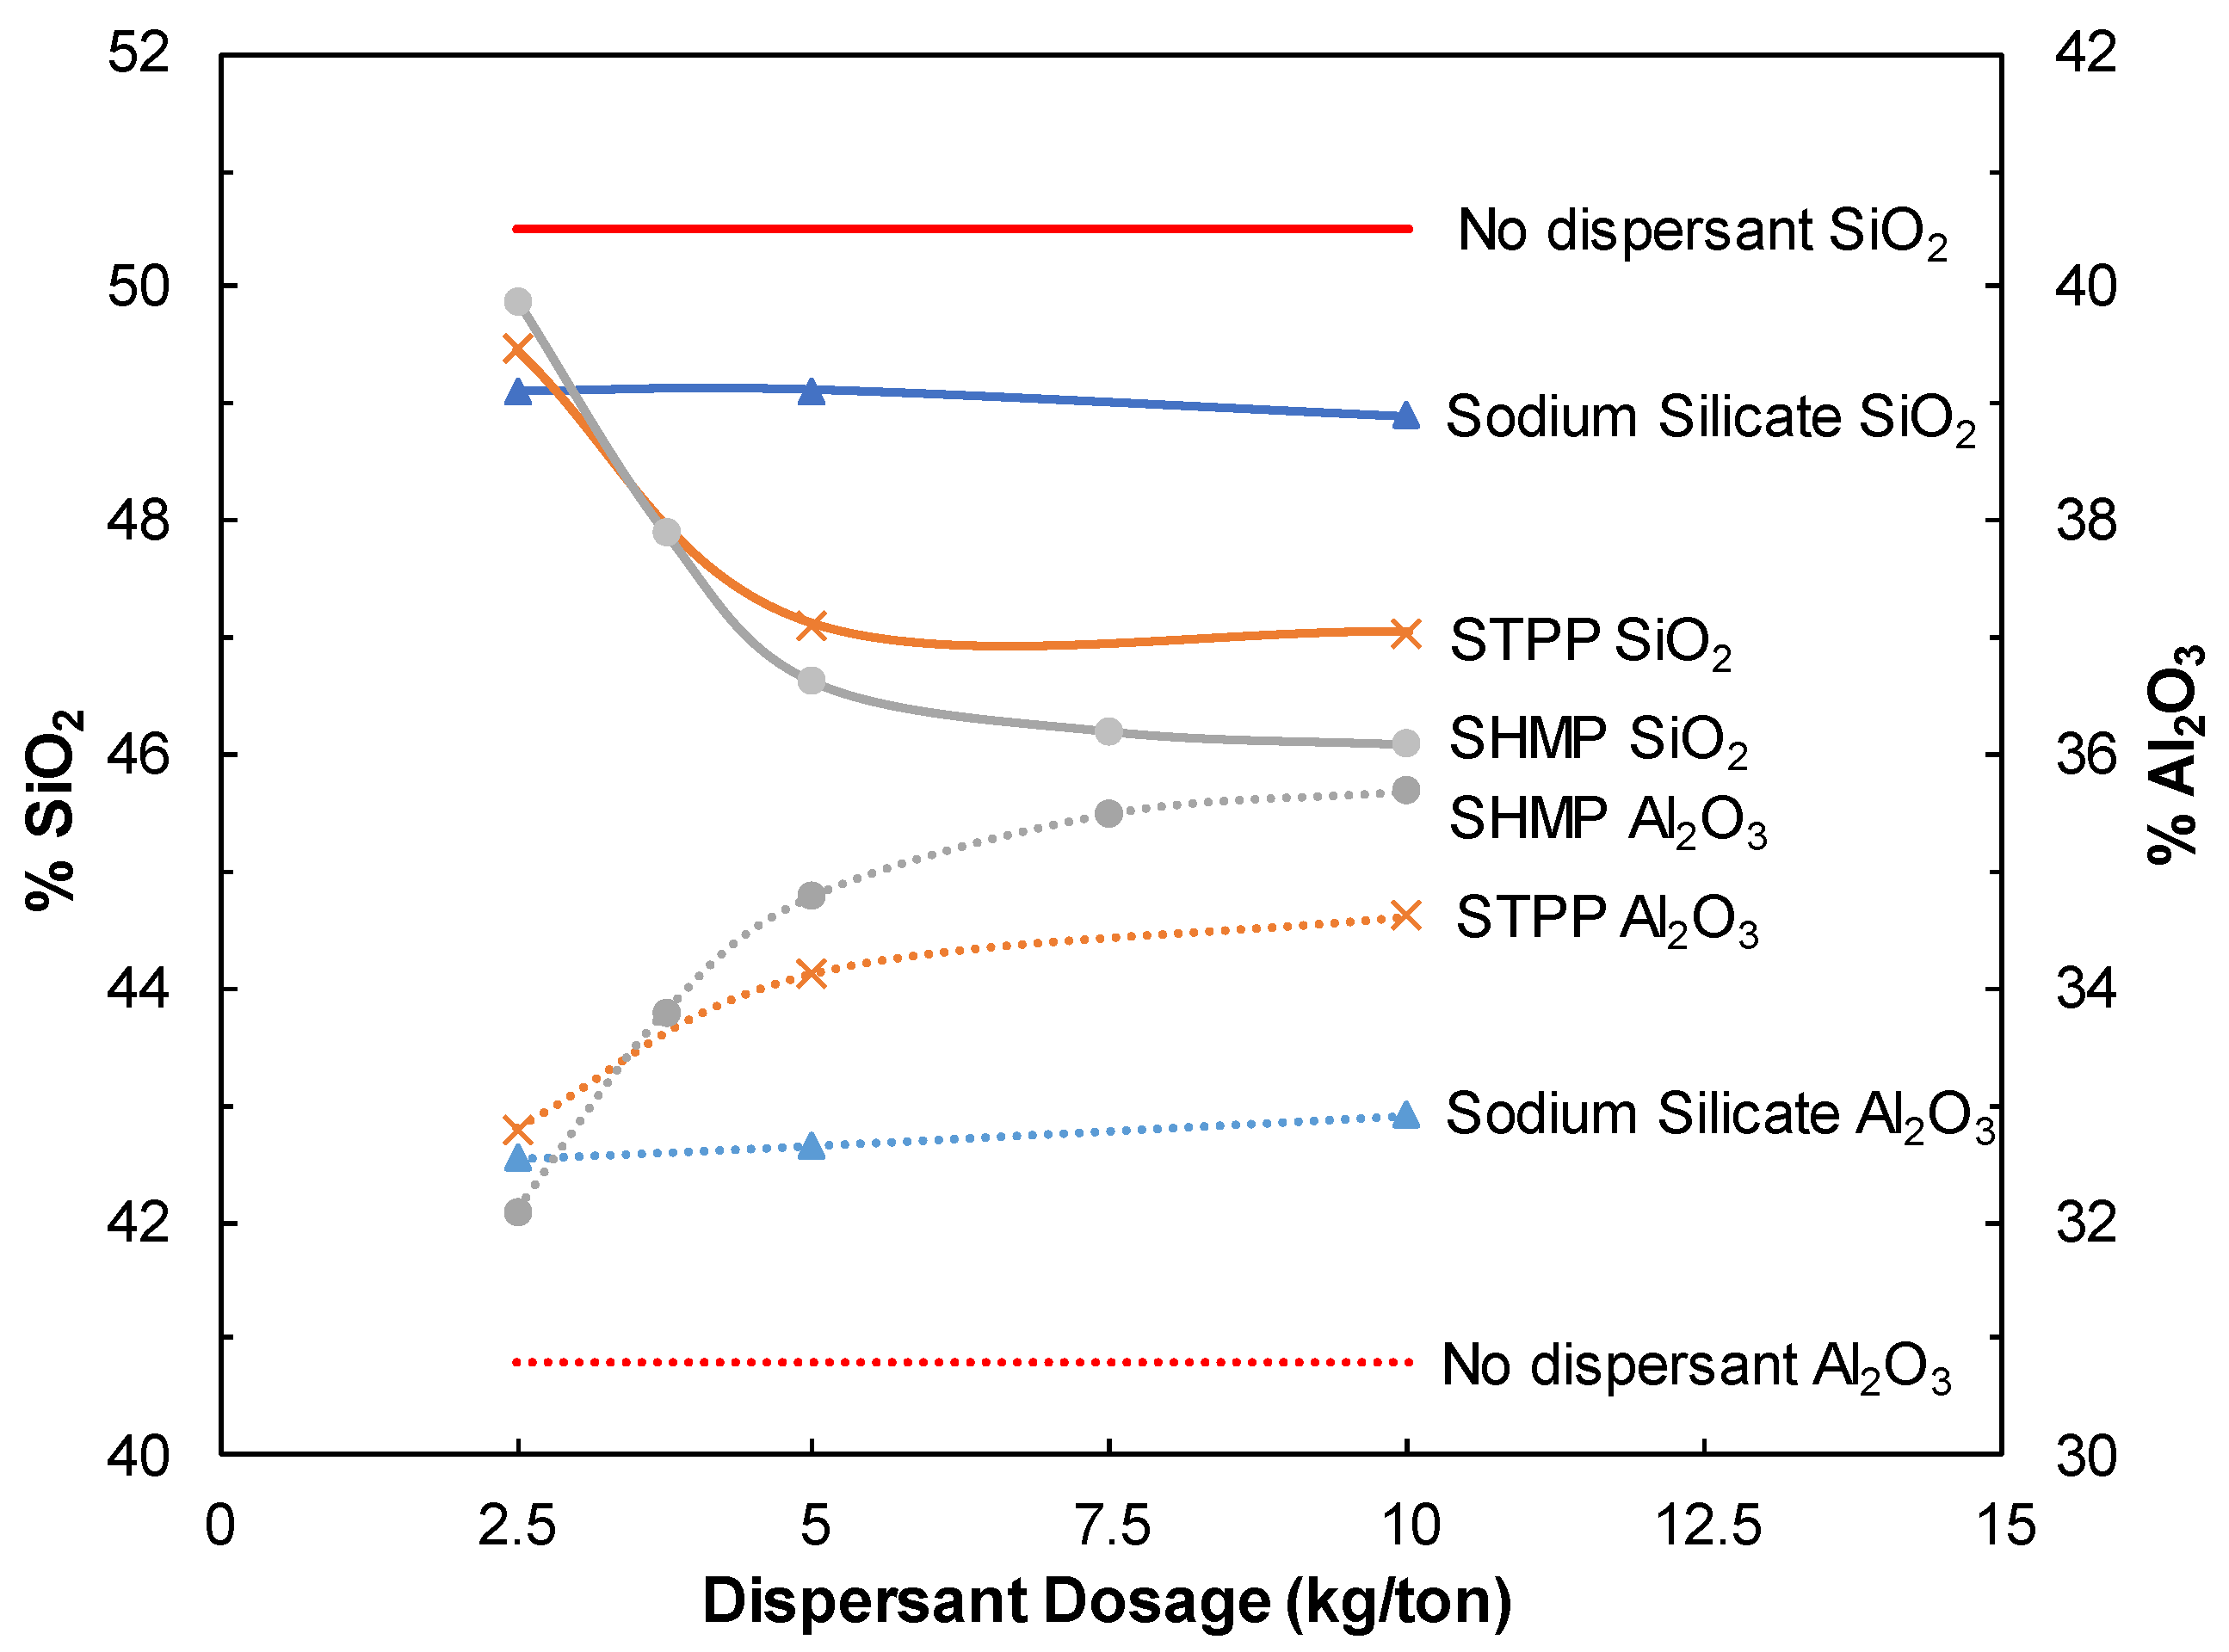
3.3.3. Effect of Dispersants on Halloysite Ore Dispersion

In these experimental studies, halloysite ore, which was mineralogically mostly composed of halloysite, kaolinite, quartz minerals, and a small amount of other impurities, was used to determine the content of the <38 µm sized materials by taking advantage of the difference in dispersibility with and without dispersant medium. The enrichment of the ore with dispersibility difference was investigated. The mechanical dispersion conditions were taken from the previous study [22].
The increase in zeta potential leads to a decrease in viscosity or shear forces in colloidal suspensions composed of homogeneously charged silica and clay particles [40,41]. While the viscosity of halloysite ore prepared with distilled water was measured as 217.5 mPa.s, the minimum viscosity values for sodium silicate, STPP, and SHMP were measured as 70.4 mPa.s, 5.6 mPa.s, and 3.3 mPa.s for 10 kg/ton of dispersant dosage, respectively (Figure 13).
Figure 14 shows the amount of material that passed to <38 µm size as a result of the dispersion performed separately with the presence of distilled water and dispersants. A total of 71.3% of the material was passed to <38 µm size in the presence of distilled water, while 72.4%, 73.6%, and 73.6% of the material passed to <38 µm size with the use of 10 kg/ton sodium silicate, STPP, and SHMP, respectively.
In Figure 15, the Al2O3 and SiO2 content of <38 µm sized materials are given as a result of mechanical dispersion with sodium silicate, STPP, and SHMP. As the STPP and SHMP concentrations increased, the SiO2 content of <38 µm decreased and the Al2O3 content increased. There was no significant change in SiO2 and Al2O3 content when compared without dispersant with the use of sodium silicate. STTP and SHMF dispersants seemed to be more effective for clay minerals than sodium silicate [42]. Here, the decrease in SiO2 content and the increase in Al2O3 content in parallel with the increase in the amount of <38 µm sized material showed that the clay minerals in the clay ore could be dispersed better with mechanical energy in a dispersant medium. SHMF and STPP dispersants were more effective on quartz from all three minerals in the zeta potential measurements made with halloysite, kaolinite, and quartz minerals one by one (Figure 6c). Later, this effect takes the form of halloysite and kaolinite. In this case, the quartz minerals were primarily dispersed in the suspension, and halloysite and quartz were affected by this dispersion later in the presence of mechanically dispersed clay minerals with SHMP and STPP dispersants. In other words, the success of mechanical energy in the dispersion of clay minerals mechanically dispersed in the presence of dispersants was due to the increase in the electrostatic repulsion forces caused by the dispersants between the particles.
The chemical analyses were analyzed as 30.8% Al2O3 and 50.5% SiO2 content without dispersant. When 10 kg/ton of sodium silicate, STPP, and SHMP were added, the Al2O3 content increased to 32.9%, 34.6%, and 35.7%, while the SiO2 content decreased to 48.9%, 47.0%, and 46.1%, respectively.
Clay minerals are naturally finer particle sizes. However, pH has an important effect on the sedimentation of clay particles and, as seen from Figure 5, the ZPC of halloysite was nearly at pH 3.5, and the kaolinite and quartz particle surface charges tended to reach ZPC in the acidic pH. The pH of the halloysite was measured as 3.6 in a 35% solids ratio. Besides, the charge on the clay particles controls the degree of dispersion and is determined by the physico-chemical properties in suspension [43,44]. As a result of the dispersion experiments performed with sodium silicate, STPP, and SHMP, the viscosity decreased as the dispersant dosage increased and the amount of material that passed to <38 µm size slightly increased because of the net surface charge of the minerals in the suspensions becoming more negative, most probably [45]. When the chemical analyzes of the <38 µm sized materials were examined, the Al2O3 content increased and the SiO2 content decreased with the dispersant dosage increment. The effect of dispersants causes dispersing of the clay minerals in the water system. For this reason, the Al2O3 content of the <38 µm sized material increased with the dispersion in the presence of dispersants. According to these results, the most effective dispersant was determined as SHMP. In the mechanical dispersion experiments performed with 7.5 kg/ton of SHMP, 73.2% of <38 µm sized material with 35.5% Al2O3 and 46.1% SiO2 content could be obtained at the optimum dispersant dosage.

4. Conclusions

The zeta potential measurements with halloysite, kaolinite, and quartz minerals indicated that the surface charges of kaolinite and quartz minerals were negative in the pH ranges (3–11) measured, which was compatible with the literature [21,46]. Halloysite reached the zero point of charge (ZPC) at pH 3.5. As the ZPC approached acidic pH values, all minerals settled faster than for alkaline pH values and turbidity values on the bed layer were lower. In the zeta potential measurements performed at the natural pH of halloysite, kaolinite, and quartz minerals in the presence of dispersants, the negativity of the surface charges of the samples increased as a function of dispersant concentration. For each mineral, the order according to the degree of effect on the surface charge change was SHMP > STPP > sodium silicate. The effect order of the dispersant types obtained from zeta potential measurements was supported by sedimentation experiments. Moreover, the turbidity values of the samples taken from the sedimentation experiments increased significantly with the dispersant dosage increase.
The mechanical dispersion for the halloysite ore was performed in the presence of sodium silicate, STPP, and SHMP (2.5–10 kg/ton) in distilled water. In the presence of dispersants, the viscosity values decreased significantly and the amount of material passing to <38 µm size increased. The chemical analysis of <38 µm sized material was analyzed as 30.8% Al2O3 and 50.5% SiO2 content in the presence of distilled water under optimum mechanical dispersion conditions. At 10 kg/ton of sodium silicate, STPP, and SHMP dispersants, the Al2O3 content increased to 32.9%, 34.6%, and 35.7%, while the SiO2 content decreased to 48.9%, 47.0%, and 46.1%, respectively. The increase in the Al2O3 content and the decrease in SiO2 content of the <38 µm size fraction in the presence of dispersants for mechanical dispersion was an important indicator showing the increase in clay content and the decrease in the amount of free quartz. The dispersant type that had the greatest effect on the mechanical dispersion conditions, SHMP was determined as the optimum dispersant along with 7.5 kg/ton dosage, where there were the important changes in the <38 µm sized material, viscosity, Al2O3, and SiO2 values.
In conclusion, the use of dispersants enhanced the mechanical dispersion effect for plastic clay mineral separation from hard minerals in an aqueous medium. Additionally, the effect of pH and the dispersant types are important physicochemical parameters to understand halloysite, kaolinite, and quartz separation in fine particle size (<38 µm).
Moreover, the concentrated halloysite sample should be used as a raw material with different purposes in ceramic body compositions, which will be an interesting subject for future study.

Author Contributions

Experimental methodology, E.D., M.C., M.T. and O.O.; validation, M.T. and I.K.U.; investigation, E.D., M.C., M.T. and O.O.; resources, Y.Y., E.D., M.C. and O.O.; original draft preparation, E.D., M.C. and O.O.; writing—review and editing, E.D. and M.C. and O.O.; supervision, M.C. and O.O.; project administration, M.C. and O.O. All authors have read and agreed to the published version of the manuscript.

Funding

This research received no external funding.

Acknowledgments

This study was funded by the Scientific Research Projects Coordination Unit of Istanbul University-Cerrahpasa. Project number: 35427.

Conflicts of Interest

The authors declare no conflict of interest.

References

  1. Bayda, S.; Adeel, M.; Tuccinardi, T.; Cordani, M.; Rizzolio, F. The history of nanoscience and nanotechnology: From chemical–physical applications to nanomedicine. Molecules 2020, 25, 112. [Google Scholar] [CrossRef] [PubMed] [Green Version]
  2. Bates, T.F.; Hildebrand, F.A.; Swineford, A. Morphology and structure of endellite and halloysite. Am. Mineral. 1950, 35, 463–484. [Google Scholar]
  3. Taniguchi, N. On the basic concept of ‘nano-technology’. In Proceedings of the International Conference on Production Engineering, Tokyo, Japan, 26–29 August 1974; pp. 18–23. [Google Scholar]
  4. Iijima, S. Helical microtubes of graphite carbon. Nature 1991, 354, 56–58. [Google Scholar] [CrossRef]
  5. Cheng, R.; Li, H.; Liu, Z.; Du, C. Halloysite Nanotubes as an Effective and Recyclable Adsorbent for Removal of Low-Concentration Antibiotics Ciprofloxacin. Minerals 2018, 8, 387. [Google Scholar] [CrossRef] [Green Version]
  6. Churchman, G.J.; Pasbakhsh, P.; Hillier, S. The rise and rise of halloysite. Clay Miner. 2016, 51, 303–308. [Google Scholar] [CrossRef] [Green Version]
  7. Lázaro, B.B. Halloysite and kaolinite: Two clay minerals with geological and technological importance. Rev. Real Academia Ciencias. Zaragoza 2015, 70, 1–33. [Google Scholar]
  8. Churchman, G. Properties and Processes, Handbook of Soil Sciences, 2nd ed.; Sumner, M.E., Ed.; CRC Press: Boca Raton, FL, USA, 1999; pp. F3–F76, 2nd Chapter. [Google Scholar]
  9. Ross, T.J.; Kerr, P.F. Halloysite and Allophone; US Geological Survey, Department of the Interior: Washington, WC, USA, 1934; Volume 185-G, pp. 135–148.
  10. MacEwan, D.M.C. The nomenclature of the halloysite minerals. Mineral. Mag. J. Mineral. Soc. 1947, 28, 36–44. [Google Scholar] [CrossRef]
  11. Churchman, G.J.; Carr, R.M. The definition and nomenclature of halloysites. Clays Clay Miner. 1975, 23, 382–388. [Google Scholar] [CrossRef]
  12. Brindley, G.W. Kaolin, serpentine and kindred minerals. In The X-ray Identification and Crystal Structures of Clay Minerals; Brown, G., Ed.; Mineralogical Society: London, UK, 1961; pp. 51–131. [Google Scholar]
  13. Santos, P.S.; Brindley, G.W.; Santos, H.D. Mineralogical studies of kaolinite-halloysite clays Part III. A fibrous kaolin mineral from Piedade, Sao Paulo, Brazil. Am. Mineral. 1965, 50, 619–628. [Google Scholar]
  14. Grim, R.E. Clay Mineralogy; McGraw-Hill: New York, NY, USA, 1968. [Google Scholar]
  15. Churchman, G.J.; Whitton, J.S.; Claridge, G.G.C.; Theng, B.K.G. Intercalation method using formamide for differentiating halloysite from kaolinite. Clays Clay Miner. 1984, 32, 241–248. [Google Scholar] [CrossRef]
  16. Robertson, I.D.M.; Eggleton, R.A. Weathering of granitic muscovite to kaolinite and halloysite and plagioclase-derived kaolinite to halloysite. Clays Clay Miner. 1991, 39, 113–126. [Google Scholar] [CrossRef]
  17. Kohyama, N.; Fukushima, K.; Fukami, A. Observation of the hydrated form of tubular halloysite by an electron microscope equipped with an environmental cell. Clays Clay Miner. 1978, 26, 25–40. [Google Scholar] [CrossRef]
  18. Rawtani., D.; Agrawal, Y.K. Multifarious applications of halloysite nanotubes: A review. Rev. Adv. Mater. Sci. 2012, 30, 282–295. [Google Scholar]
  19. Zubkiewicz, A.; Szymczyk, A.; Franciszczak, P.; Kochmanska, A.; Janowska, I.; Paszkiewicz, S. Comparing Multi-Walled Carbon Nanotubes and Halloysite Nanotubes as Reinforcements in EVA Nanocomposites. Materials 2020, 13, 3809. [Google Scholar] [CrossRef]
  20. Vergaro, V.; Abdullayev, E.; Lvov, Y.M.; Zeitoun, A.; Cingolani, R.; Rinaldi, R.; Leporatti, S. Halloysite clay nanotubes: Characterization, biocompatibility and use as drug carriers. Biomacromolecules 2010, 11, 820–826. [Google Scholar] [CrossRef] [PubMed]
  21. Lun, H.; Ouyang, J.; Yang, H. Enhancing dispersion of halloysite nanotubes via chemical modification. Phys. Chem. Miner. 2014, 41, 281–288. [Google Scholar] [CrossRef]
  22. Durgut, E.; Cinar, M.; Terzi, M.; Unver, I.K.; Yildirim, Y.; Boylu, F.; Ozdemir, O. Effect of Blunging/Dispersion Parameters on Separation of Halloysite Nanotubes from Gangue Minerals. Minerals. 2022, 12, 683. [Google Scholar] [CrossRef]
  23. Sachan, A.; Penumadu, D. Identification of microfabric of kaolinite clay mineral using x-ray diffraction technique. Geotech. Geol. Eng. 2007, 25, 603–616. [Google Scholar] [CrossRef]
  24. Bobos, I.; Duplay, J.; Rocha, J.; Gomes, C. Kaolinite to halloysite-7A transformation in the kaolin deposit of Sao Vicente de Pereira, Portugal. Clay Clay Miner. 2001, 49, 596–607. [Google Scholar] [CrossRef]
  25. Madejová, J.; Gates, W.P.; Petit, S. Chapter 5—IR Spectra of Clay Minerals. Dev. Clay Sci. 2017, 8, 107–149. [Google Scholar]
  26. Saikia, B.J.; Parthasarathy, G. Fourier Transform Infrared Spectroscopic Characterization of Kaolinite from Assam and Meghalaya, Northeastern India. J. Mod. Phys. 2010, 01, 206–210. [Google Scholar] [CrossRef] [Green Version]
  27. Calhoun, F.G.; Carlisle, V.W. Infrared spectra of selected Colombian Andosols. Proc. Soil Crop Sci. Soc. Fla. 1972, 31, 157–161. [Google Scholar]
  28. Cheng, H.; Frost, R.L.; Yang, J.; Liu, Q.; He, J. Infrared and infrared emission spectroscopic study of typical Chinese kaolinite and halloysite. Spectrochim. Acta A Mol. Biomol. Spectrosc. 2010, 77, 1014–1020. [Google Scholar] [CrossRef] [PubMed] [Green Version]
  29. Saikia, B.J. Spectroscopic estimation of geometrical structure elucidation in natural SiO2 crystal. J. Mater. Phys. Chem. 2014, 2, 28–33. [Google Scholar]
  30. Saikia, B.J.; Parthasarathy, G.; Sarmah, N.C. Fourier transform infrared spectroscopic estimation of crystallinity in SiO2 based rocks. Bull. Mater. Sci. 2018, 31, 775–779. [Google Scholar] [CrossRef] [Green Version]
  31. Kitagawa, Y.; Yorozu, Y.; Itami, K. Zeta potentials of clay minerals estimated by an electrokinetic sonic amplitude method and relation to their dispersibilıty. Clay Sci. 2001, 11, 329–336. [Google Scholar]
  32. Ersoy, B.; Evcin, A.; Uygunoglu, T.; Akdemir, Z.B.; Brostow, W.; Joshua, W. Zeta Potential–viscosity relationship in kaolinite slurry in the presence of dispersants. Arab. J. Sci. Eng. 2014, 39, 5451–5457. [Google Scholar] [CrossRef]
  33. Tarí, G.; Bobos, I.; Gomes, C.S.F.; Ferreira, J.M.F. Modification of surface charge properties during kaolinite to halloysite 7 Å transformation. J. Colloid Interface Sci. 1999, 210, 360–366. [Google Scholar] [CrossRef]
  34. Eygi, M.S.; Ateşok, G. An investigation on utilization of poly-electrolytes as dispersant for kaolin slurry and its slip casting properties. Ceram. Int. 2008, 34, 1903–1908. [Google Scholar] [CrossRef]
  35. Amorós, J.L.; Sanz, V.; Jarque, J.C. Electrokinetic and rheological properties of highly concentrated kaolin dispersion: Influence of particle volume fraction and dispersant concentration. Appl. Clay Sci. 2010, 49, 33–43. [Google Scholar] [CrossRef]
  36. Vitali, S.; Giorgini, L. Overview of the rheological behaviour of ceramic slurries. FME Trans. 2019, 47, 42–47. [Google Scholar] [CrossRef]
  37. Joo, Y.; Sim, J.H.; Jeon, Y.; Lee, S.U.; Sohn, D. Opening and blocking the inner-pores of halloysite. Chem. Commun. 2013, 49, 4519–4521. [Google Scholar] [CrossRef] [PubMed]
  38. Özgen, S.; Çilek, E.C. Effects of some cations to the surface properties of silicates (feldspar and quartz). Erciyes Univ. J. Inst. Sci. Technol. 2012, 28, 116–121. [Google Scholar]
  39. Hou, T.; Xu, R.; Zhao, A. Interaction between electric double layers of kaolinite and Fe/Al oxides in suspensions. Colloids Surf. A Physicochem. Eng. Asp. 2007, 297, 91–94. [Google Scholar] [CrossRef]
  40. Kobayashi, M.; Juillerat, F.; Galletto, P.; Bowen, P.; Borkovec, M. Aggregation and charging of colloidal silica particles: Effect of particle size. Langmuir 2005, 21, 5761–5769. [Google Scholar] [CrossRef]
  41. Singh, B.P.; Mencavez, R.; Takai, C.; Fuji, M.; Takahashi, M. Stability of dispersions of colloidal alumina particles in aqueous suspensions. J. Colloid Interface Sci. 2005, 291, 181–186. [Google Scholar] [CrossRef] [PubMed]
  42. Murray, H.H. Applied Clay Mineralogy: Developments in Clay Science 2; Elsevier: Amsterdam, The Netherlands, 2007. [Google Scholar]
  43. Ouyang, J.; Zhou, Z.; Zhang, Y.; Yang, H. High morphological stability and structural transition of halloysite (Hunan, China) in heat treatment. Appl. Clay Sci. 2014, 101, 16–22. [Google Scholar] [CrossRef]
  44. Önen, V.; Göçer, M.; Taner, H.A. Effect of coagulants and flocculants on dewatering of kaolin suspensions. Omer Halisdemir Univ. J. Eng. Sci. 2018, 7, 297–305. [Google Scholar]
  45. Chorom, M.; Rengasamy, P. Dispersion and zeta potential of pure clays as related to net particle charge under varying pH, electrolyte concentration and cation type. Eur. J. Soil Sci. 1995, 46, 657–665. [Google Scholar] [CrossRef]
  46. Yükselen-Aksoy, Y.; Kaya, A. Zeta potential of kaolinite in the presence of alkali, alkaline earth and hydrolyzable metal ions. Water Air Soil Pollut. 2003, 145, 155–168. [Google Scholar] [CrossRef]
Figure 1. XRD diagram of (a) halloysite, (b) kaolinite, and (c) quartz minerals.
Minerals 12 01426 g001
Figure 2. TEM images of halloysite nanotubes (a) and (b) 100 nm, (c) 200 nm, and (d) 1 µm.
Minerals 12 01426 g002
Figure 3. TEM images of (a) kaolinite and (b) quartz minerals.
Minerals 12 01426 g003
Figure 4. FTIR spectra of halloysite, kaolinite, and quartz minerals.
Minerals 12 01426 g004
Figure 5. Zeta potential of halloysite, kaolinite, and quartz minerals as a function of pH.
Minerals 12 01426 g005
Figure 6. Zeta potential change of (a) halloysite, (b) kaolinite, and (c) quartz minerals in the presence of different dispersants at natural pHs (3.8, 6.2, and 6.7, respectively) and room temperature.
Minerals 12 01426 g006
Figure 7. Time-dependent variation of the bed layer thickness of halloysite, kaolinite, and quartz minerals at natural pHs and room temperature along with the images for the dispersion/sedimentation experiments at 1440 min.
Minerals 12 01426 g007
Figure 8. The change in turbidity values of halloysite, kaolinite, and quartz minerals measured at different pH values after 120 min sedimentation period.
Minerals 12 01426 g008
Figure 9. Halloysite sedimentation behavior in the presence of dispersants at concentrations of (a) 2.5 kg/ton, (b) 5 kg/ton, and (c) 10 kg/ton at natural pH and room temperature.
Minerals 12 01426 g009
Figure 10. Kaolinite sedimentation behavior in the presence of dispersants at concentrations of (a) 2.5 kg/ton, (b) 5 kg/ton, and (c) 10 kg/ton at natural pH and room temperature.
Minerals 12 01426 g010
Figure 11. Quartz sedimentation behavior in the presence of dispersants at concentrations of (a) 2.5 kg/ton, (b) 5 kg/ton, and (c) 10 kg/ton at natural pH and room temperature.
Minerals 12 01426 g011
Figure 12. Turbidity measurements of (a) halloysite, (b) kaolinite, and (c) quartz according to dispersant types at natural pH and room temperature.
Minerals 12 01426 g012
Figure 13. Viscosity changes of pulps of halloysite ore according to dispersant types (1000 rpm blunging speed and 35% pulp concentration at 25 °C room temperature and natural pH of 3.9).
Minerals 12 01426 g013
Figure 14. Change in the ratio of material passing to <38 µm size halloysite ore according to dispersant types and dosages (1000 rpm blunging speed and 35% pulp concentration at 25 °C room temperature and natural pH of 3.9).
Minerals 12 01426 g014
Figure 15. The variation of SiO2 and Al2O3 content in <38 µm sized halloysite ore according to dispersant types (1000 rpm blunging speed and 35% pulp concentration at 25 °C room temperature and natural pH of 3.9).
Minerals 12 01426 g015
Table 1. Chemical analysis of pure halloysite, kaolinite, and quartz minerals.
MineralLOI *SiO2Al2O3TiO2Fe2O3CaOMgONa2OK2O
Halloysite17.044.038.30.20.30.00.10.00.0
Kaolinite13.546.638.20.80.30.10.10.00.5
Quartz0.299.20.50.10.00.00.00.00.0
Halloysite ore12.050.929.70.73.90.20.40.21.1
* LOI: loss on ignition.
Table 2. D10, D50, and D90 values of <38 µm sized minerals.
MineralD10 (µm)D50 (µm)D90 (µm)
Halloysite2.89.423.8
Kaolinite2.36.517.5
Quartz3.814.232.9
Publisher’s Note: MDPI stays neutral with regard to jurisdictional claims in published maps and institutional affiliations.

