Article

Acoustic Emission Parameter Characterization of Damage Process of the Limestone with Different Rockburst Tendencies

1
School of Resources and Environmental Engineering, Jiangxi University of Science and Technology, Ganzhou 341000, China
2
Jiangxi Key Laboratory of Mining Engineering, Jiangxi University of Science and Technology, Ganzhou 341000, China
3
Yinshan Mining Industry Co., Ltd., Jiangxi Copper Industry Group, Dexing 334200, China
*
Author to whom correspondence should be addressed.
Minerals 2022, 12(11), 1423; https://doi.org/10.3390/min12111423
Submission received: 20 October 2022 / Revised: 5 November 2022 / Accepted: 8 November 2022 / Published: 10 November 2022

Abstract

:
The laboratory discrimination tests of the rockburst tendency and AE tests under the uniaxial compression were conducted on the limestone. Three criterions were used to judge the rockburst tendency of the limestone with a buried depth of 600–1000 m under the same borehole. The rock damages were quantified by the AE events, ring count and energy. The fractal characteristics of these parameters were compared and analyzed. The characterization accuracy of these parameters on the damage process of the limestone with different rockburst tendencies was discussed. The AE parameters of the limestone with different rockburst tendencies increase sharply when the stress is near its peak. With the increase in the rockburst tendency, the variation of the AE event rate and ring count of the limestone is more and more consistent with the AE energy. Based on the characterization of the AE events and ring count, the damage process is characterized by a gradual evolution, while based on the energy characterization, it is characterized by a stepped evolution. The damage represented by the AE energy reveals the intensity and instantaneity of the rockburst failure. According to the verification of the CV value, the fractal dimension D of the AE energy fluctuates more gently with the increase in the rockburst tendency. It reflects the energy storage characteristics of the rock with a rockburst tendency in the loading process, which is consistent with the failure mechanism of the rockburst. Therefore, AE energy is more accurate to characterize and predict the failure of the limestone with a rockburst tendency.

1. Introduction

With the progress of deep mining, many problems (such as a high ground stress, a high ground temperature, a high seepage pressure and a strong excavation disturbance) are encountered in the exploitation of mineral resources [1] and a series of deep geological disasters can be caused in this case. Rockburst is one of the common major disasters in mine production [2,3]. It has increasingly become an inevitable and frequent dynamic disaster in the mining process of underground metal mines. To reduce the incidence of mine disasters, it is of a great engineering significance to investigate the mechanism and prevention of rockburst in deep hard rock. In the study of rock damage and failure, acoustic emission (AE) technology can be used to reflect the internal damage evolution characteristics of rock samples [4,5]. Rock damage is accompanied by its internal energy dissipation, and the storage, dissipation and transformation of energy inside the rock is the fundamental cause of rockburst [6]. Therefore, there must be a correlation between AE events, rock damage and rockburst tendency.
Researchers have carried out studies on the AE characteristics of rock failure and the relationship between rock damage and AE events. Shkuratnik [7] analyzed the characteristics of the AE in rock salt samples during deformation under various thermobaric experimental conditions. Aker [8] studied the AEs which were associated with shear and tensile failures around a horizontal borehole in a sandstone sample subjected to triaxial stress. Liu [9] conducted the studies of the stress and displacement evolution within rock based on AE monitoring in laboratory experiments. Wang [10] established two damage constitutive models based on the AE ring count and energy principle. Through the unloading experiment of sandstone, Hou [11] studied the acoustic emission characteristics of the sandstone unloading failure under a high stress. Zhao [12] established rock models based on PFC2D to study the characteristics of the quiet period of AE during the rock failure process. Přikryl [13] carried out laboratory experiments on rock samples to understand the relationship between the AE parameters and the rock fabric. Kim [14] used various methods to quantify the damage evolution in the process of granite failure, including the crack volumetric strain, b value and AE energy, and proposed that AE energy is more appropriate. Lee [15] conducted uniaxial compression tests on very strong and weak rock specimens to investigate the AE parameters when the failure of the specimen occurred. Kim [16] used the normalized value of the measured AE energy with the maximum AE energy to characterize the degree of damage. Ganne [17] studied two laboratory situations to investigate the correlation between micro-fractures and AE. Rodríguez [18] conducted the diametral compression tests for the characterization of the cracking pattern according to the AE parameters. Tian [19] evaluated the damage development of deep formation rock quantitatively by acoustic emission (AE) tests. Xue [20] studied the damage characteristics of coal samples under five loading rates based on the cumulative ring count of acoustic emissions. Girard [21] pointed out that AE monitoring is a common technique to characterize the damage evolution of solid materials. Moradian [22] evaluated the applicability of AEs for localizing asperity damaged zones and the damage intensity in joint surfaces. Zhang [23] investigated the damage evolution during the cyclic loading and unloading of coal samples by using acoustic emissions positioning technology. In the existing studies, AE technology has been widely used to study rock instability and failure, and rock damage models have been established based on the AE parameters. However, the applicability of different AE parameters in studying the damage process of rock samples has been rarely explored. Due to the different rockburst tendencies of rocks, the severity of their damage varies greatly; the AE parameters, including the events, ring count and energy, have their own physical meanings different from other parameters. Therefore, the effectiveness of these parameters in reflecting the damage characteristics of rock with different rockburst tendencies remains to be studied.
In this study, the rockburst tendency of the limestone taken from different burial depths was comprehensively distinguished, and AE tests of the limestone were carried out under a uniaxial compression. The characterization parameters of the AE events, ring count and energy were implemented successively to characterize the damage process of rock samples, and the damage characteristics of the limestone with different rockburst tendencies at different stages were compared and analyzed. Based on the rockburst mechanism and the change characteristics of the AE fractal dimension value D of the rock damage, the applicability of different characterization parameters for the rock damage was discussed. This study provides a theoretical reference for rockburst monitoring by AE technology.

2. Materials and Methods

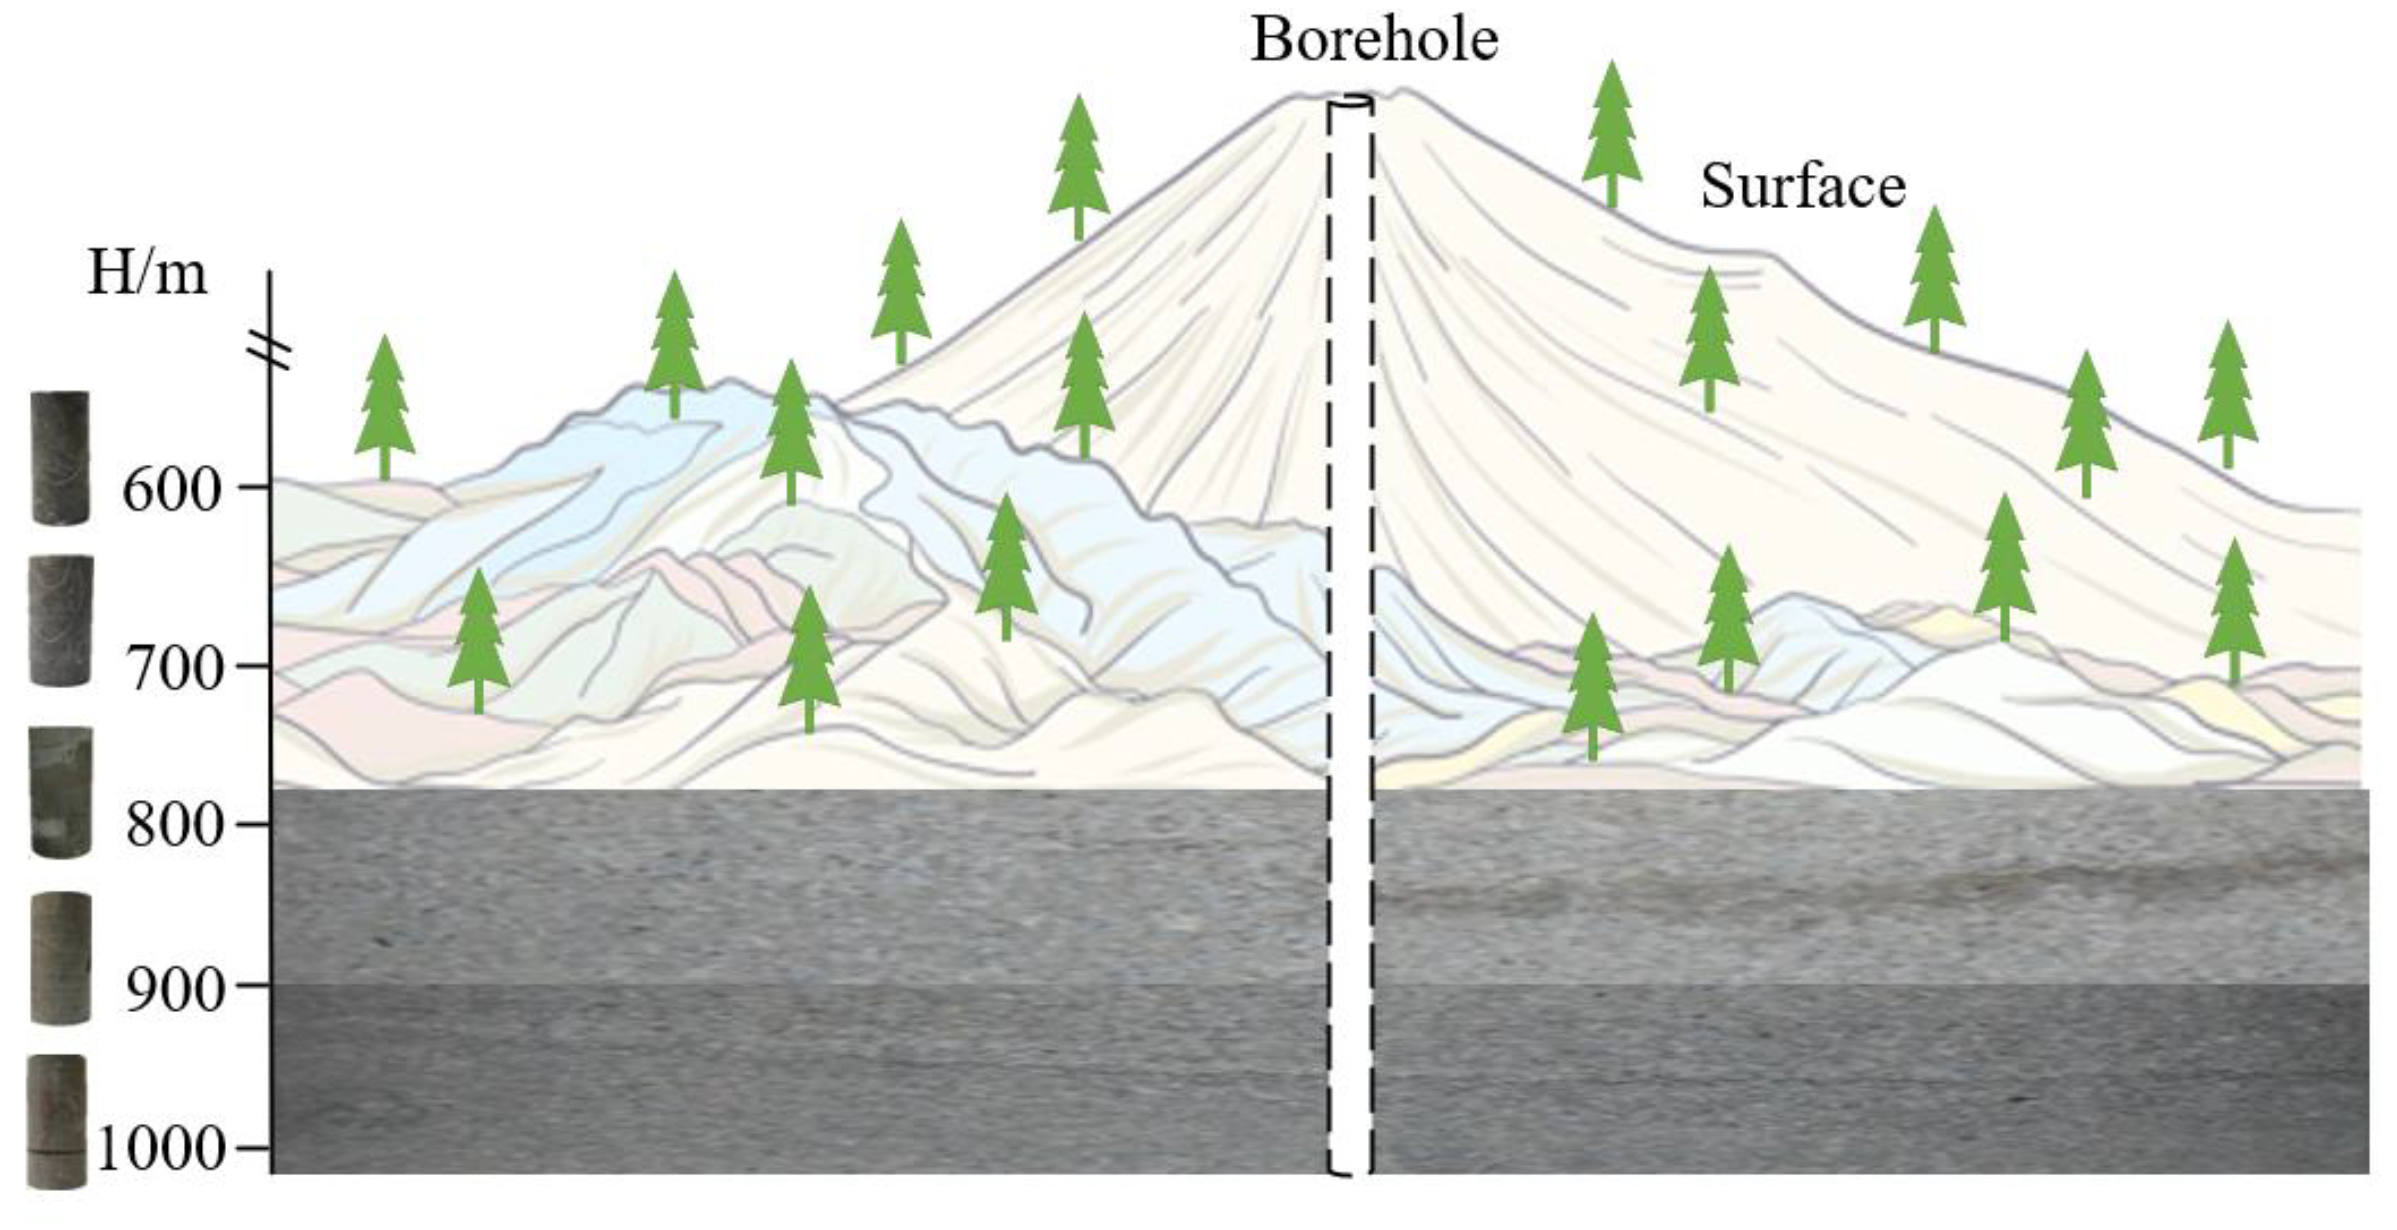
2.1. Specimen Preparation

In this test, the rock samples were taken from a copper mine in Jiangxi Province. These samples were collected from the same drilled rock core with a buried depth of 600–1000 m, and the sampling interval depth was 100 m, as shown in Figure 1. The lithology of the sample is limestone. According to the Standard for the test methods of engineering rock mass, the standard cylindrical limestone with a size of Φ 50 × 100 mm was obtained. To ensure the parallelism, flatness and perpendicularity of the sample and reduce the test error, the sample surface was polished smooth. The treated sample was saturated in vacuum, and the porosity was tested with an NM-60 magnetic resonance analyzer.

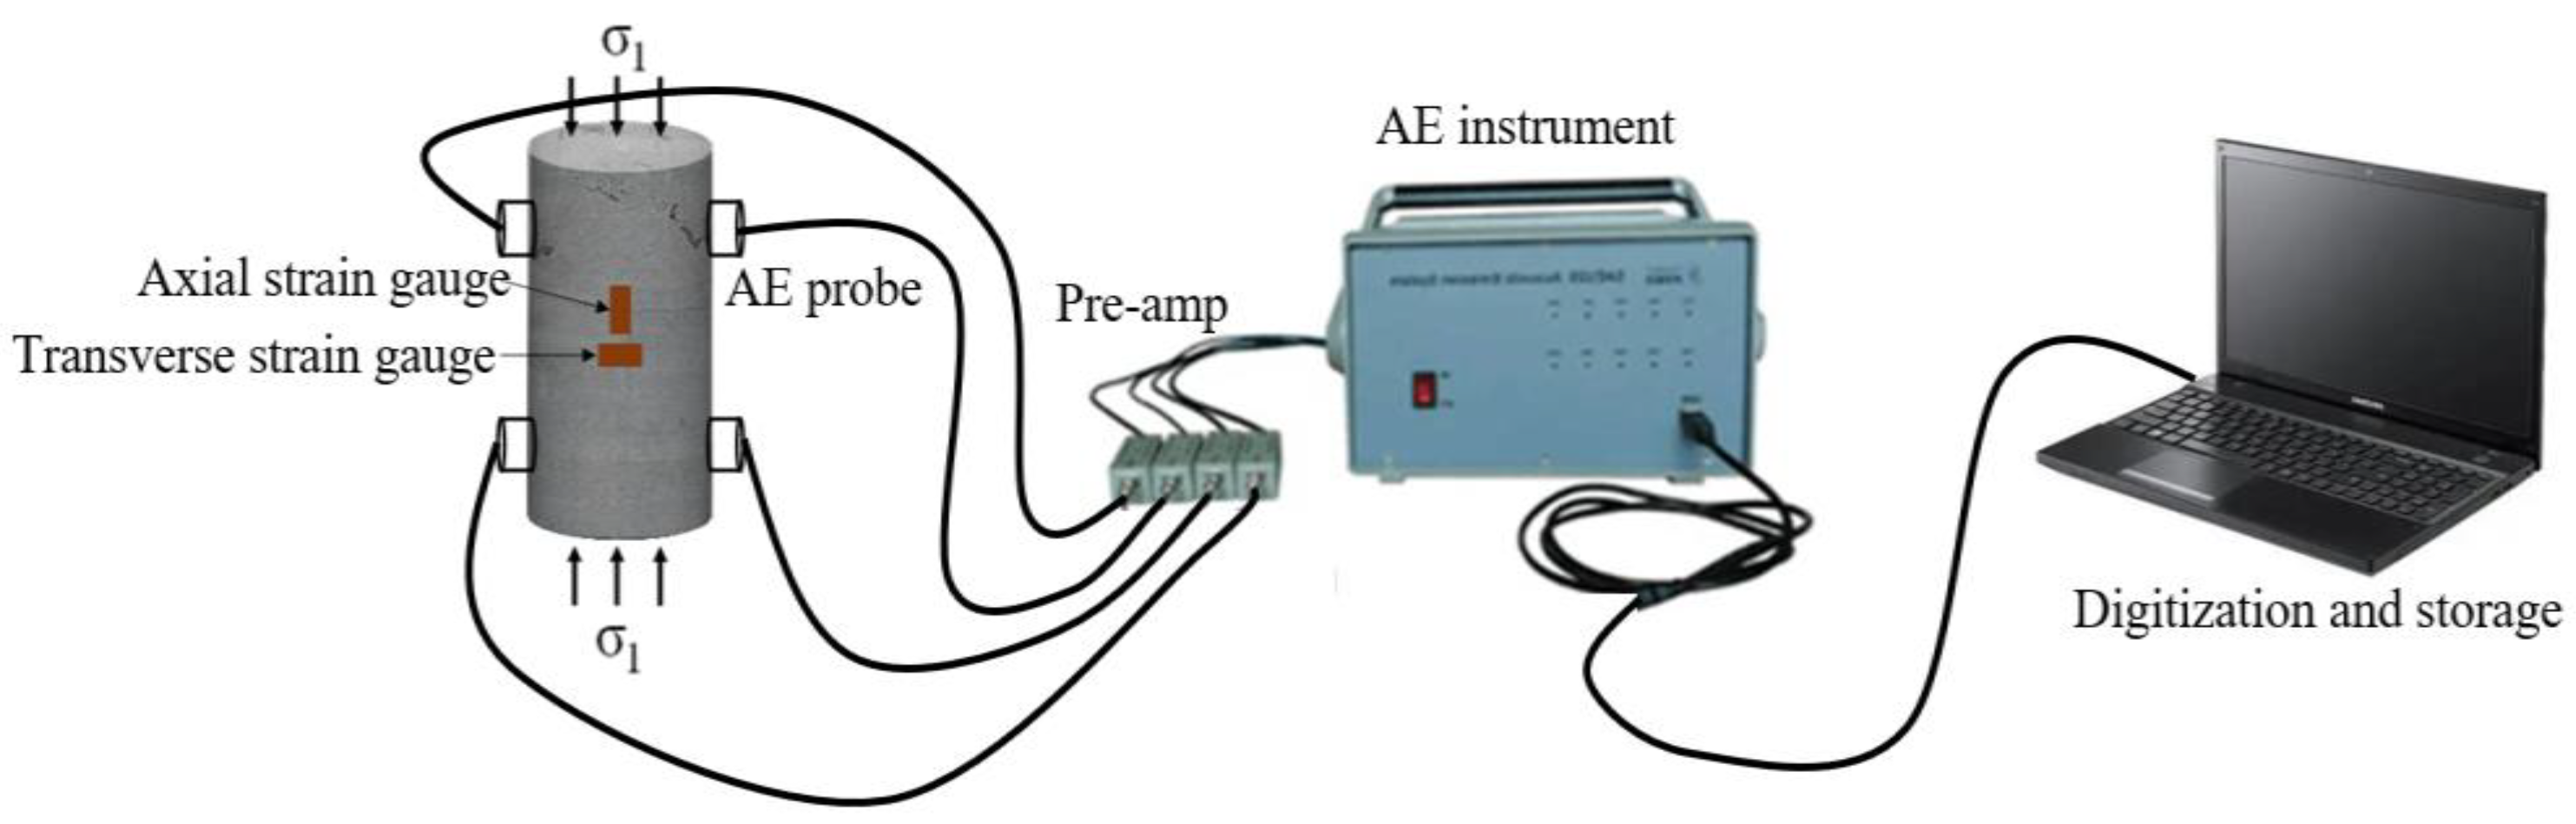
2.2. Test Methods and Acoustic Emission Monitoring

The RMT-150C rock mechanics test system was used to carry out the uniaxial loading–unloading tests and uniaxial compression tests. The displacement loading mode was adopted in the test, and the loading rate was controlled to be 0.002 mm/s. The sensors in the test system were used to record the axial deformation, transverse deformation, uniaxial compressive strength and other parameters of the sample during compression in real time. The PCI-II acoustic emission system and UT1000 acoustic emission sensor were adopted. They are all developed by PAC. The PCI II system has a frequency range of 1 KHz–3 MHz, and the maximum sampling rate of 10 M per second was set. The response frequency of the UT1000 sensor is 35–1000 kHz. The number and location of the channels are shown in Figure 2. The sampling rate was set as 1 MSPS and the threshold value was 40 dB. During the test, a layer of Vaseline antifriction agent was applied to the upper and lower ends of the rock specimen to reduce the end effect and end noise. In order to ensure a full contact between the sensor and the rock sample, a coupling agent was applied to the side of the rock sample.
Figure 3 shows the stress–strain curve of the limestone with different burial depths under the uniaxial loading. It can be seen that the uniaxial compressive strength of the limestone increases with the increase in the burial depth. As the buried depth ranges from 600 m to 1000 m, the average uniaxial compressive strength of the limestone increases from 70.80 MPa to 130.93 MPa. Table 1 shows some of the physical and mechanical parameters.

3. Results and Discussion

3.1. Rockburst Tendency of the Limestone with Different Burial Depths

The occurrence of rockburst depends on two necessary conditions: one is the inherent nature of the rock itself, and the other is the external environment of the rock [24]. There are property differences in the limestone taken from different burial depths. The deeper the burial depth, the smaller the porosity and the denser the rock. The deep rock is in a high-stress environment, and larger energy is easily accumulated and stored in the deep rock. Therefore, under the same conditions, deep rocks are more prone to rockburst. To effectively discriminate the rockburst tendency, the laboratory test of the rock mechanics was first carried out, and then the relevant evaluation indexes were calculated according to the test data. Based on the laboratory test data, the main indexes for judging the rockburst tendency are as follows: the strength brittleness coefficient B, deformation brittleness index Kε, impact energy coefficient Wcf, linear elastic performance We, critical depth hcr and elastic energy index WET. Due to the randomness of the discrimination results of the rockburst tendency by a single criterion, we carried out many preliminary studies on the qualitative analysis of the rockburst tendency by using multiple criteria [25,26]. In this paper, the elastic energy index (WET) criterion, the deformation brittleness index (Kε) criterion and the linear elastic energy (We) criterion were used to judge the rockburst tendency of the limestone with a buried depth of 600–1000 m under the same borehole.

3.1.1. Rockburst Tendency Based on Elastic Energy Index Criterion

The elastic energy index WET is the ratio of the elastic deformation energy accumulated in the rock to the consumed strain energy.
W E T = Φ V Φ E = ε p ε e f ( ε ) d ε 0 ε t f ( ε ) d ε ε p ε e f ( ε ) d ε
According to the σ-ε curves obtained after the uniaxial loading–unloading test of the limestone samples with different burial depths, the elastic energy index WET of the limestone can be calculated. Table 2 shows the discrimination results of the rockburst tendency of the limestone based on the elastic energy index WET.

3.1.2. Rockburst Tendency of the Limestone Based on Brittleness Index Criterion

The deformation brittleness index Kε is the ratio of the total deformation ε of the rock at the stress peak to the permanent deformation εp after the unloading.
K ε = ε ε P
Based on the σ-ε curves obtained from the uniaxial loading–unloading tests, the deformation brittleness index Kε of the limestone with different burial depths can be calculated. Table 3 shows the rockburst tendency of the limestone based on the deformation brittleness index Kε.

3.1.3. Rockburst Tendency of the Limestone Based on Linear Elastic Energy Criterion

The linear elastic property We is the ratio of the square of the uniaxial compressive strength of the rock to twice the unloading tangent modulus. It represents the amount of energy stored in the rock when the loading stress reaches the peak value.
W e = σ c 2 2 E S
According to the average uniaxial compressive strength and average unloading tangent modulus of the limestone with different burial depths, the linear elastic property index We of the limestone can be calculated. Table 4 shows the rockburst tendency of the limestone based on the linear elastic property index.

3.1.4. Comprehensive Discrimination of Rockburst Tendency

Based on the discrimination results of the elastic energy index criterion, the deformation brittleness index criterion and the linear elastic energy criterion, the rockburst tendency of the limestone with different burial depths is comprehensively distinguished. The results are shown in Table 5. As shown in Table 5, when the buried depth of the limestone is less than 600 m, there is not a rockburst tendency; when the buried depth is 700–800 m, there is a weak rockburst tendency; when the buried depth is 900 m, there is a medium rockburst tendency; and when the buried depth is more than 1000 m, the limestone presents a strong rockburst tendency. In conclusion, with the increase in the burial depth, the rockburst tendency of the limestone gradually increases.

3.2. AE Characteristics of Rocks at Different Stress Stages

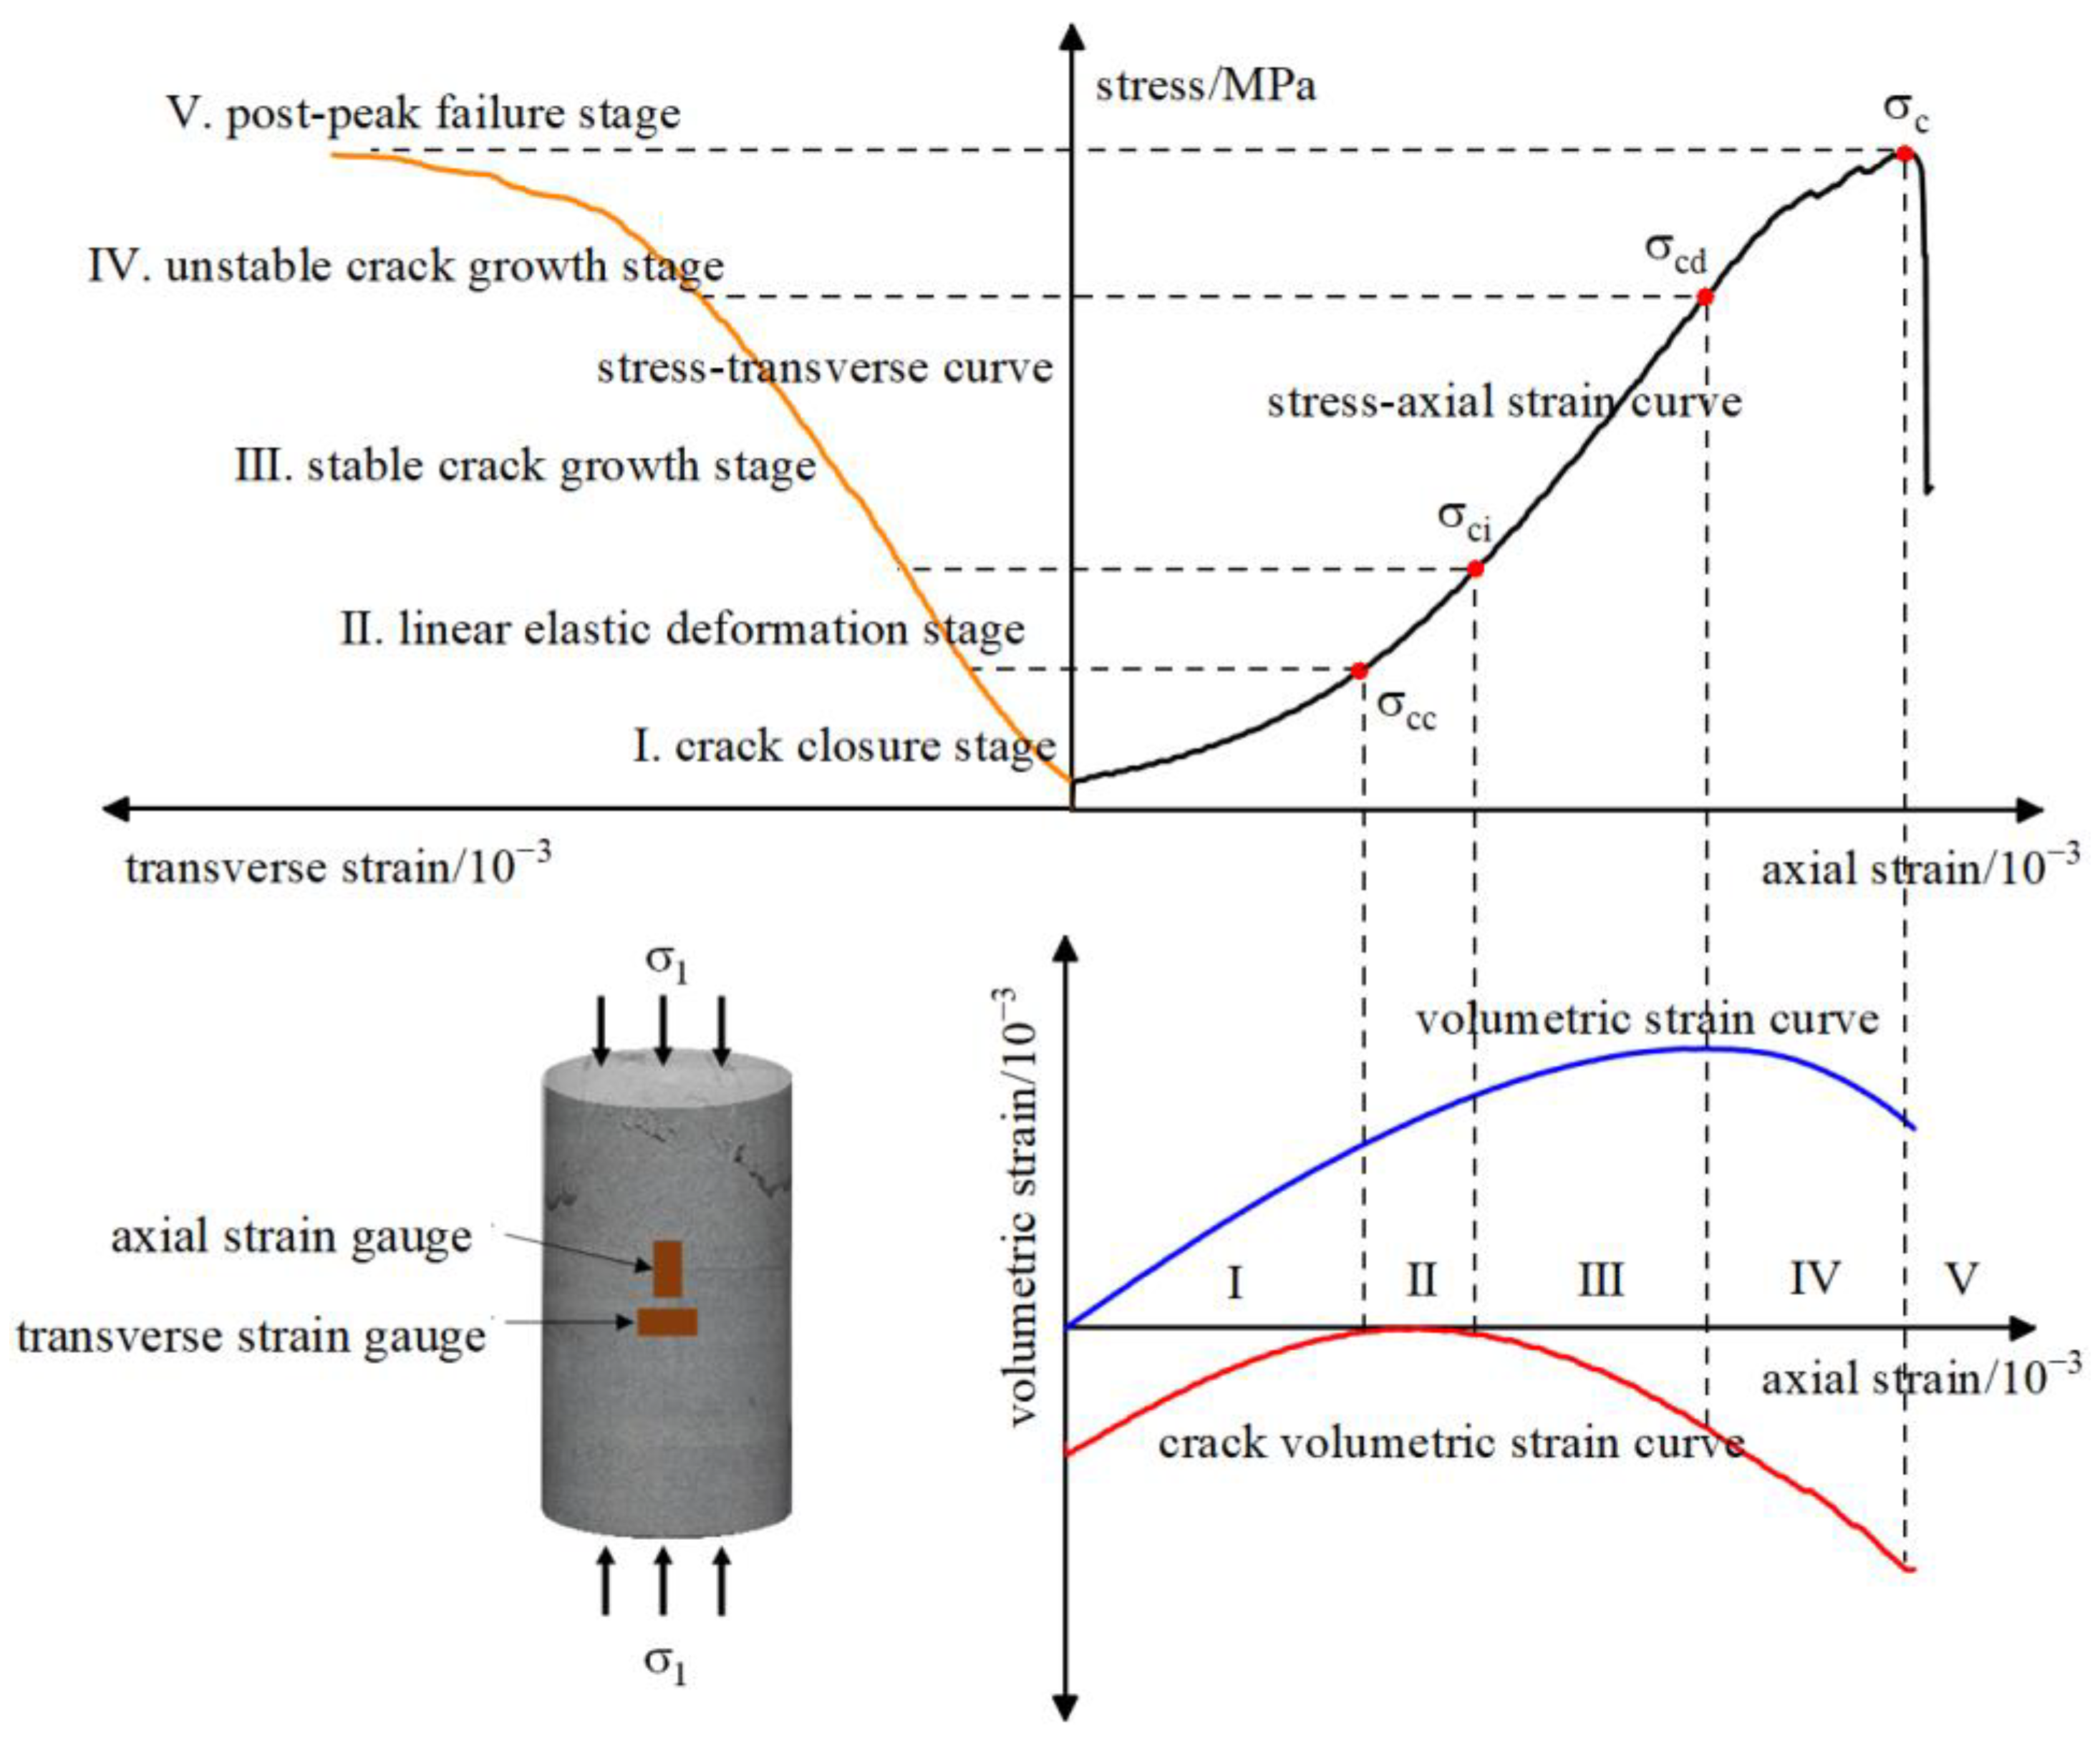
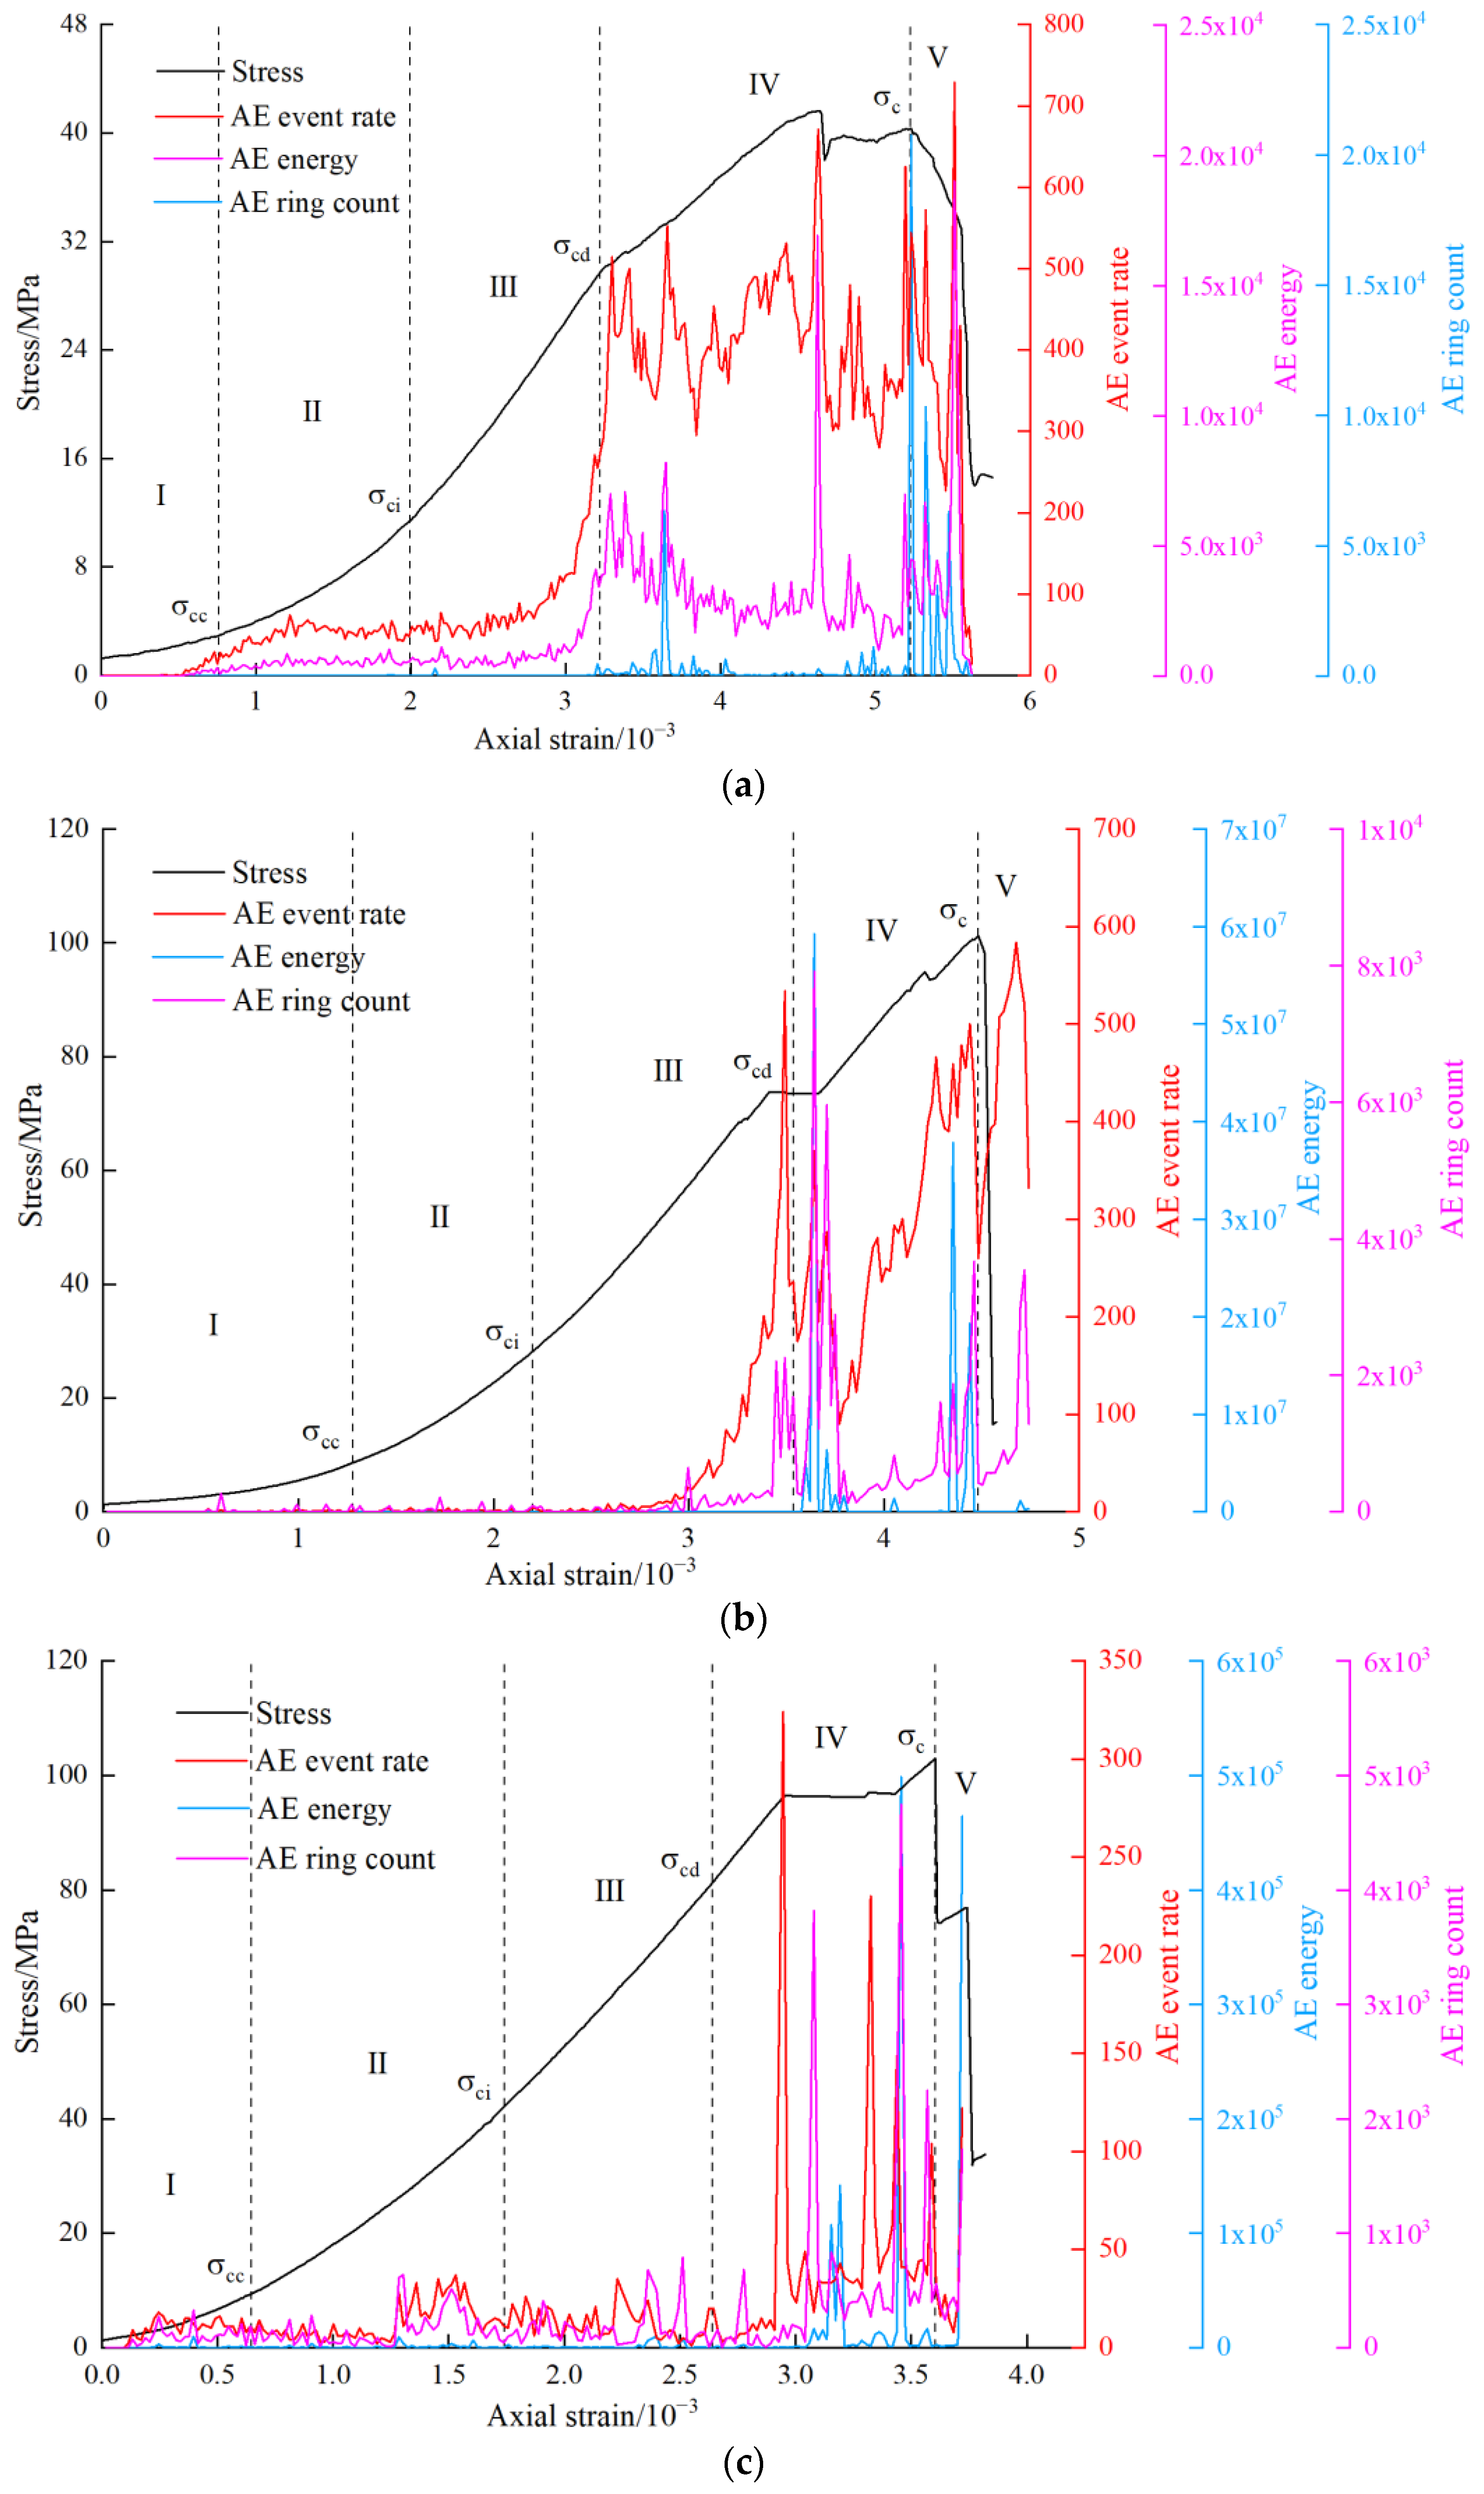
3.2.1. Division of Different Stress Stages

The characteristic stress of the rock mass mainly includes the closure stress, crack initiation stress, damage stress and peak stress. The crack initiation stress and damage stress are the critical points of the rock failure stage and the instability stage and they are important characteristic parameters in characterizing the stress stage of the rock mass. The characteristic stress of the rock under a uniaxial loading can be obtained by the crack volume strain method [27]. The stress–strain curve of the rock can be divided into five stages: I. the crack closure stage; Ⅱ. the linear elastic deformation stage; Ⅲ. the stable crack growth stage; Ⅳ. the unstable crack growth stage; and Ⅴ. the post-peak failure stage, as shown in Figure 4.
The volumetric strain of the rock can be calculated by Equation (4):
ε V = ε 1 + 2 ε 3
where ε 1 is the axial strain of the rock in the failure process under the uniaxial compression and ε 3 is the transverse strain of the rock in the failure process under the uniaxial compression.
Based on Hooke’s law, the elastic volumetric strain of the rock can be calculated by Equation (5):
ε V e = 1 - 2 μ E σ
where σ is the axial stress of the rock in the failure process under the uniaxial compression; μ is the Poisson’s ratio of the rock; and E is the elastic modulus.
The volumetric strain of the rock material is the sum of the elastic volumetric strain and the crack volumetric strain, so the calculation function of the crack volumetric strain is expressed as follows:
ε V c = ε V ε V e
where ε V c is the crack volume strain of the limestone during the rock failure under the uniaxial compression; ε V is the volume strain of the limestone during the rock failure under the uniaxial compression; and ε V e is the elastic volume strain of the limestone during the rock failure under the uniaxial compression.

3.2.2. AE Characteristics of the Limestone with Different Rockburst Tendency

According to the elastic energy index criterion, the deformation brittleness index criterion and the linear elastic energy criterion, the rockburst tendency of the limestone with different burial depths can be comprehensively distinguished. The rockburst tendency of the limestone at a depth of 600–1000 m can be divided into four grades: no rockburst, weak rockburst, medium rockburst and strong rockburst. To study the AE characteristics of the limestone with different rockburst tendencies at different stress stages, four representative samples with different rockburst tendencies were selected.
AE monitoring technology is an effective method of monitoring that studies the failure mechanisms in coal and rock mass in a real-time and continuous manner [28,29,30]. As shown in Figure 5, the AE characteristic parameters of the limestone with different rockburst tendencies show certain similarities in stages I and II, while there are certain differences in stages III, IV and V.
(1)
Stage I: the crack closure stage. The internal original pores and cracks of the limestone are gradually compacted, and this stage ends with the generation of the closure stress of the rock. The AE activities of the limestone with different rockburst tendencies at this stage remain basically calm. The AE event rate and ring count continue to appear in this stage, but the AE energy is in a quiet period without an obvious change. It indicates that the closure of the original fracture pores mainly occurs in the rock, and no obvious damage occurs.
(2)
Stage II: the linear elastic deformation stage. The stress–strain curve of the rock tends to be linear. After the compaction of the limestone, the original pores and fissures do not expand any further. The deformation of the rock at this stage can be considered as an elastic deformation, and this stage ends with the generation of the rock crack initiation stress. Due to the large in situ stress on the deep rock, the stress level at this time is not sufficient to induce secondary cracks in the limestone, the AE activity remains relatively stable and the AE event rate and energy do not increase significantly.
(3)
Stage III: the stable crack growth stage. This stage ends with the generation of the rock damage stress. For rock samples with no or a weak rockburst tendency, the AE event rate and ring count increase in this stage, while the AE energy is still in a quiet period in this stage. It indicates that secondary cracks are gradually generated in the limestone under this stress stage, while macro damage does not occur in the sample. The AE event rate, ring count and energy of the limestone with a medium rockburst tendency remain relatively stable. The AE event rate and ring count of the limestone with a strong rockburst tendency increase slightly, which may be related to its internal grain, joints and other microstructures. The rock with a strong rockburst tendency has no obvious damage, and the AE energy remains calm.
(4)
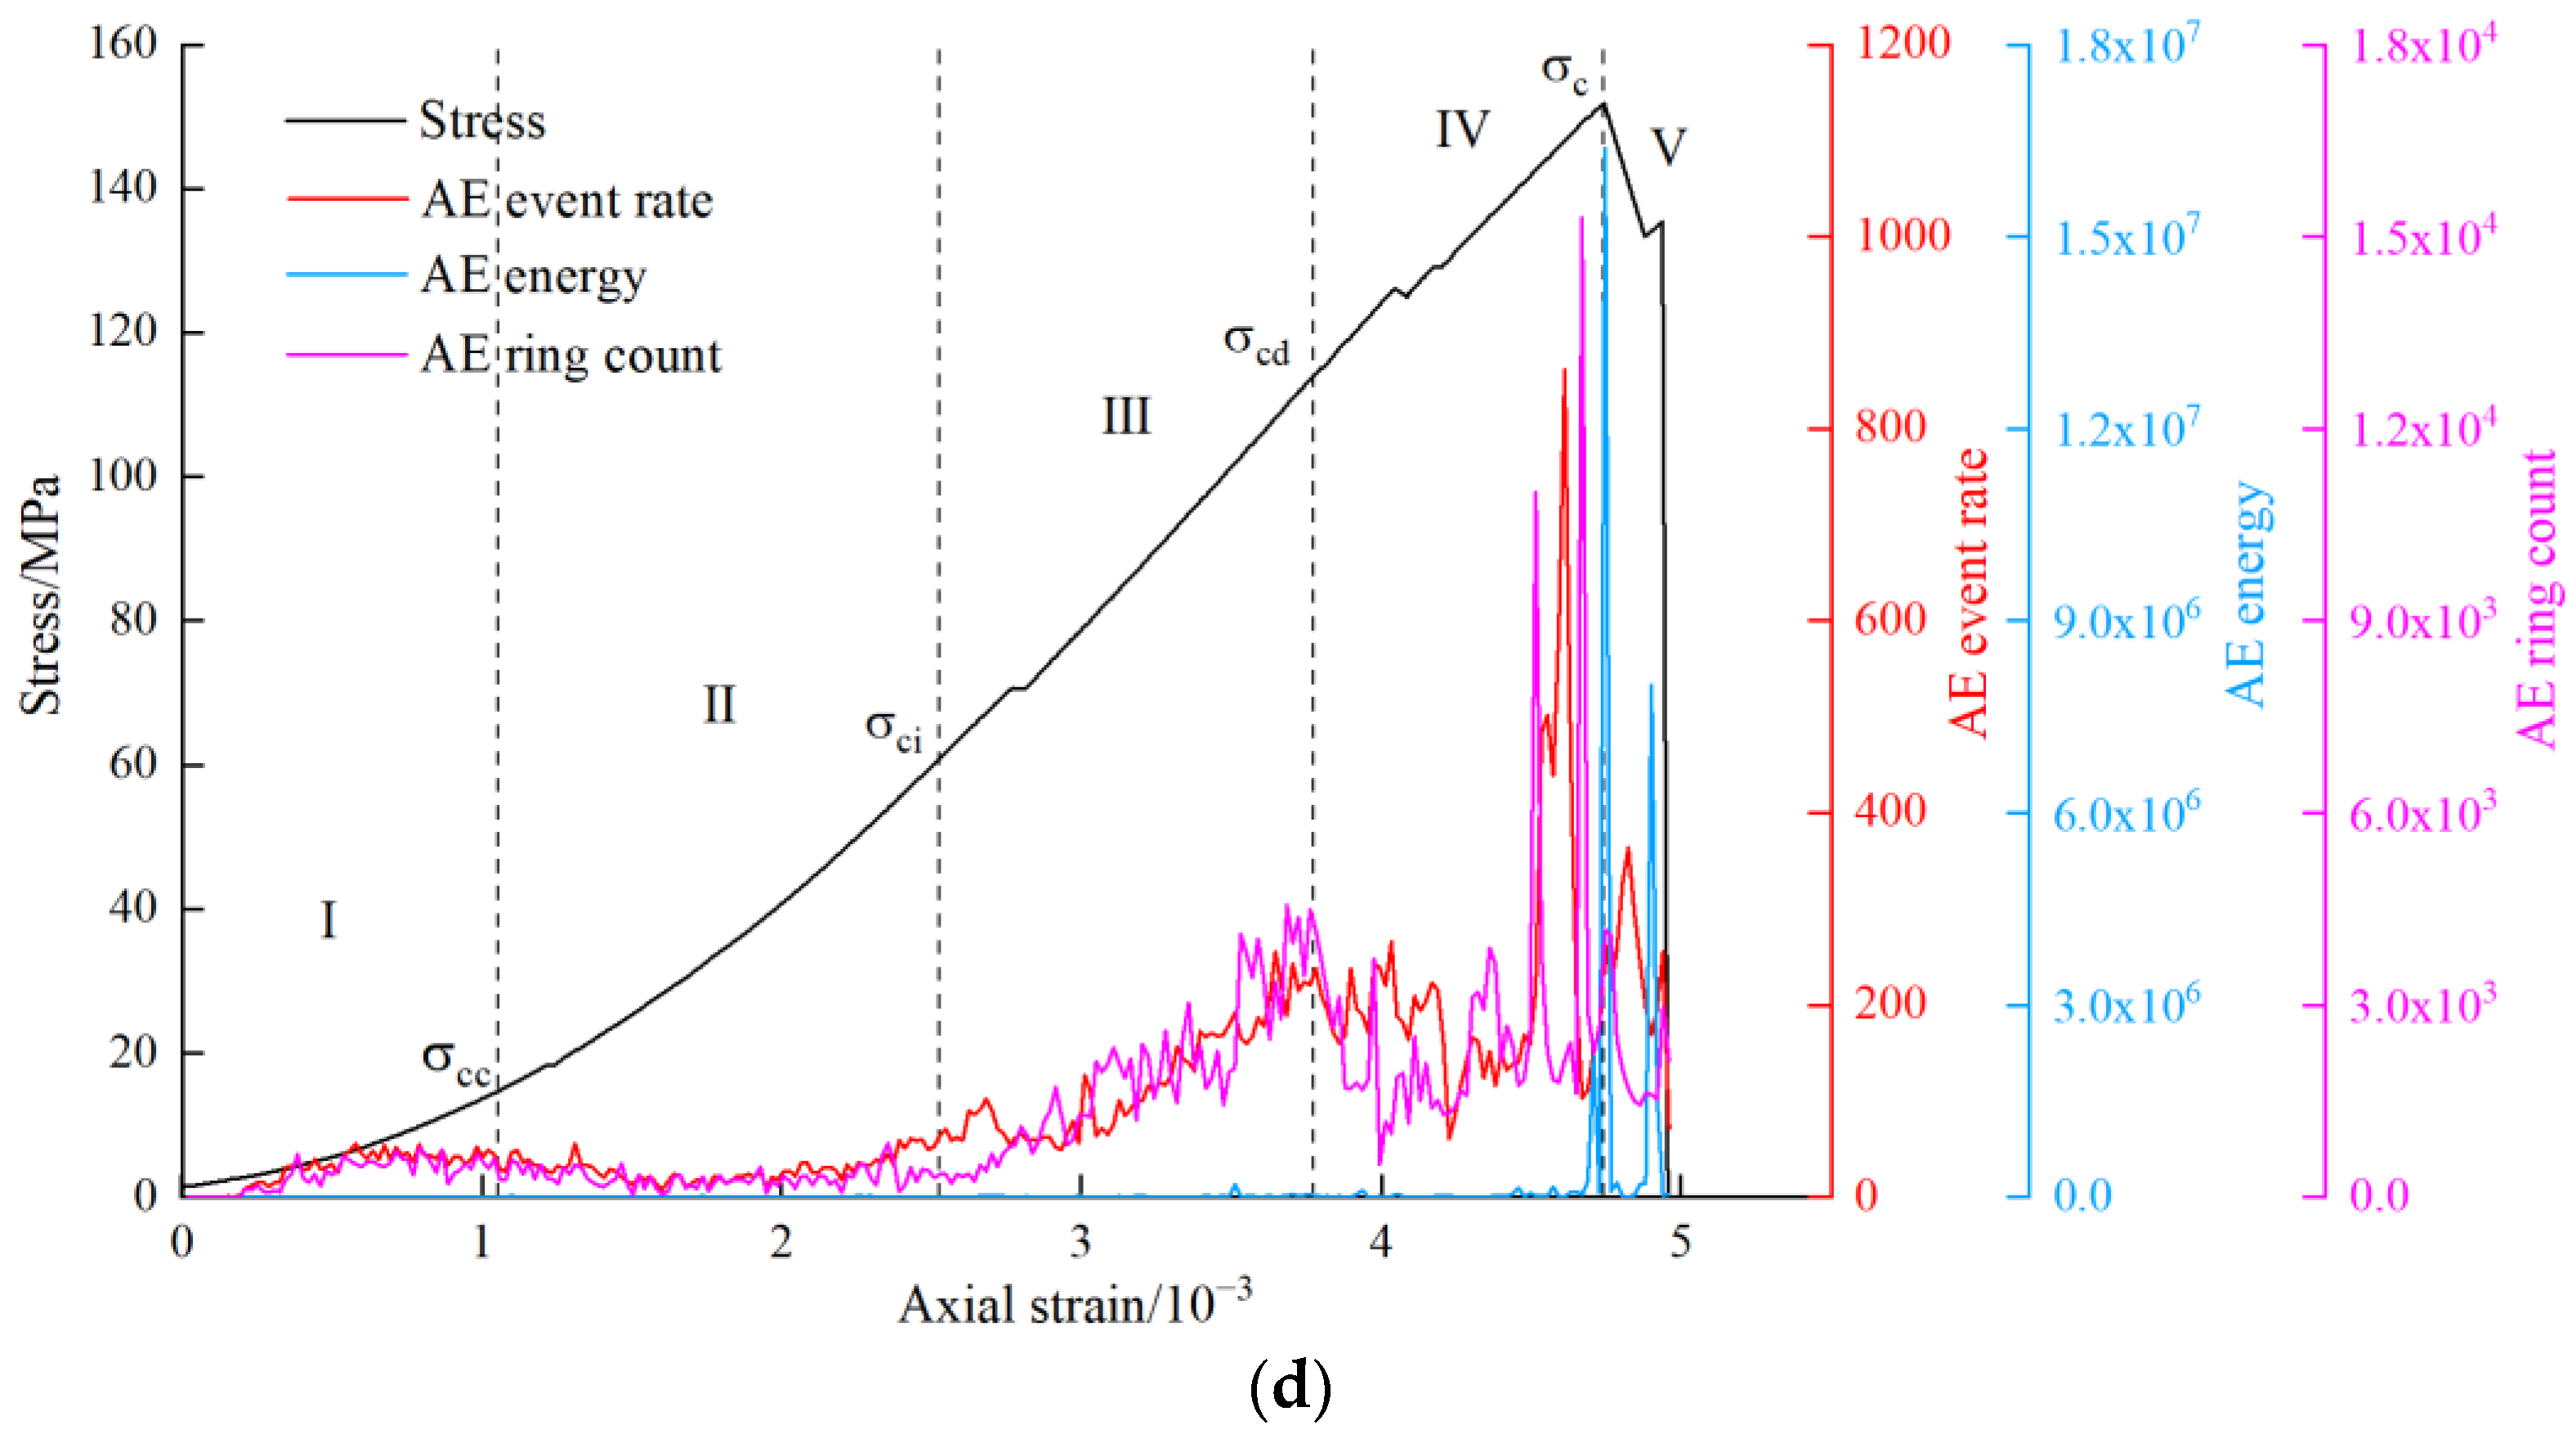
Stage IV: the unstable crack propagation stage. After the unstable crack propagation stage, the secondary cracks in limestone with different rockburst tendencies are gradually penetrated, forming a macro fracture surface, and the high strain energy stored in the rock is released. Therefore, the high AE event rate and ring count occur frequently in this stage, and the AE energy also increases significantly.
(5)
Stage V: the post-peak stage. There are AE signals in limestone with different rockburst tendencies in this stage. According to the characteristics of the stress–strain curve, the limestone with no, medium and strong rockburst tendencies still has a certain residual strength after the peak strength failure, and the rock has a secondary failure under the stress, resulting in AE signals. The limestone with a weak rockburst tendency has a scattered high AE event rate, but the AE energy is almost 0. Therefore, the AE activity here is generated by the rock sliding along the macro fault surface.
For the limestone without a rockburst tendency, when the loading stress reaches the damage stress of the rock, the high AE event rate occurs frequently, while the ring count increases slightly; when the stress decreases significantly, the ring count increases sharply. There are two significant growths in the AE energy during the failure process, but the low energy AE activity is more active in the unstable crack propagation stage. For limestone with a weak rockburst tendency, when the loading stress is close to the rock damage stress, the AE event rate and the ring count increases first and then decreases, and then the AE event rate increases gradually, but the ring count does not increase obviously until the stress is close to the peak value. There are two significant growths in the AE energy during the failure process, and the time interval between the two increases is shorter than that of the limestone without a rockburst tendency. For limestone with a medium rockburst tendency, the high AE event rate and ring count appear in stages. Before the peak stress, the AE energy has a small increase and a large increase, and the time interval between the two increases is shorter than that of limestone with a weak rockburst tendency. For limestone with a strong rockburst tendency, the AE event rate and ring count have the same changing trend; both of them increase gradually in the steady crack growth stage and remain relatively stable, and then increase sharply when the stress is near the peak stress. The AE energy is always in a quiet period and only increases sharply when the stress is close to the peak stress.
In conclusion, the AE event rate, ring count and energy of limestone all experience a quiet period before a significant increase. With the increase in the rockburst tendency, the high AE rate and ring count change from a continuous occurrence to a phased occurrence; the longer the quiet period AE energy experiences, the shorter the time interval between the two increases in the AE energy. The results show that with the increase in the rockburst tendency, the energy consumed in the rock during the loading process gradually decreases and more energy is stored, and the stored strain energy changes from a gradual dissipation to a phased release. For limestone with a strong rockburst tendency, the AE value increases sharply only before the peak stress, and the energy release mode changes to an instantaneous release. The storage, dissipation and transformation of energy inside the rock is the fundamental cause of the rockburst. With the increase in the rockburst tendency, the variation of the AE event rate and ring count of limestone is more and more consistent with the variation in the energy. Therefore, we believe that AE energy characterization is more representative in studying the failure characteristics of rocks with a strong rockburst tendency in the loading process.

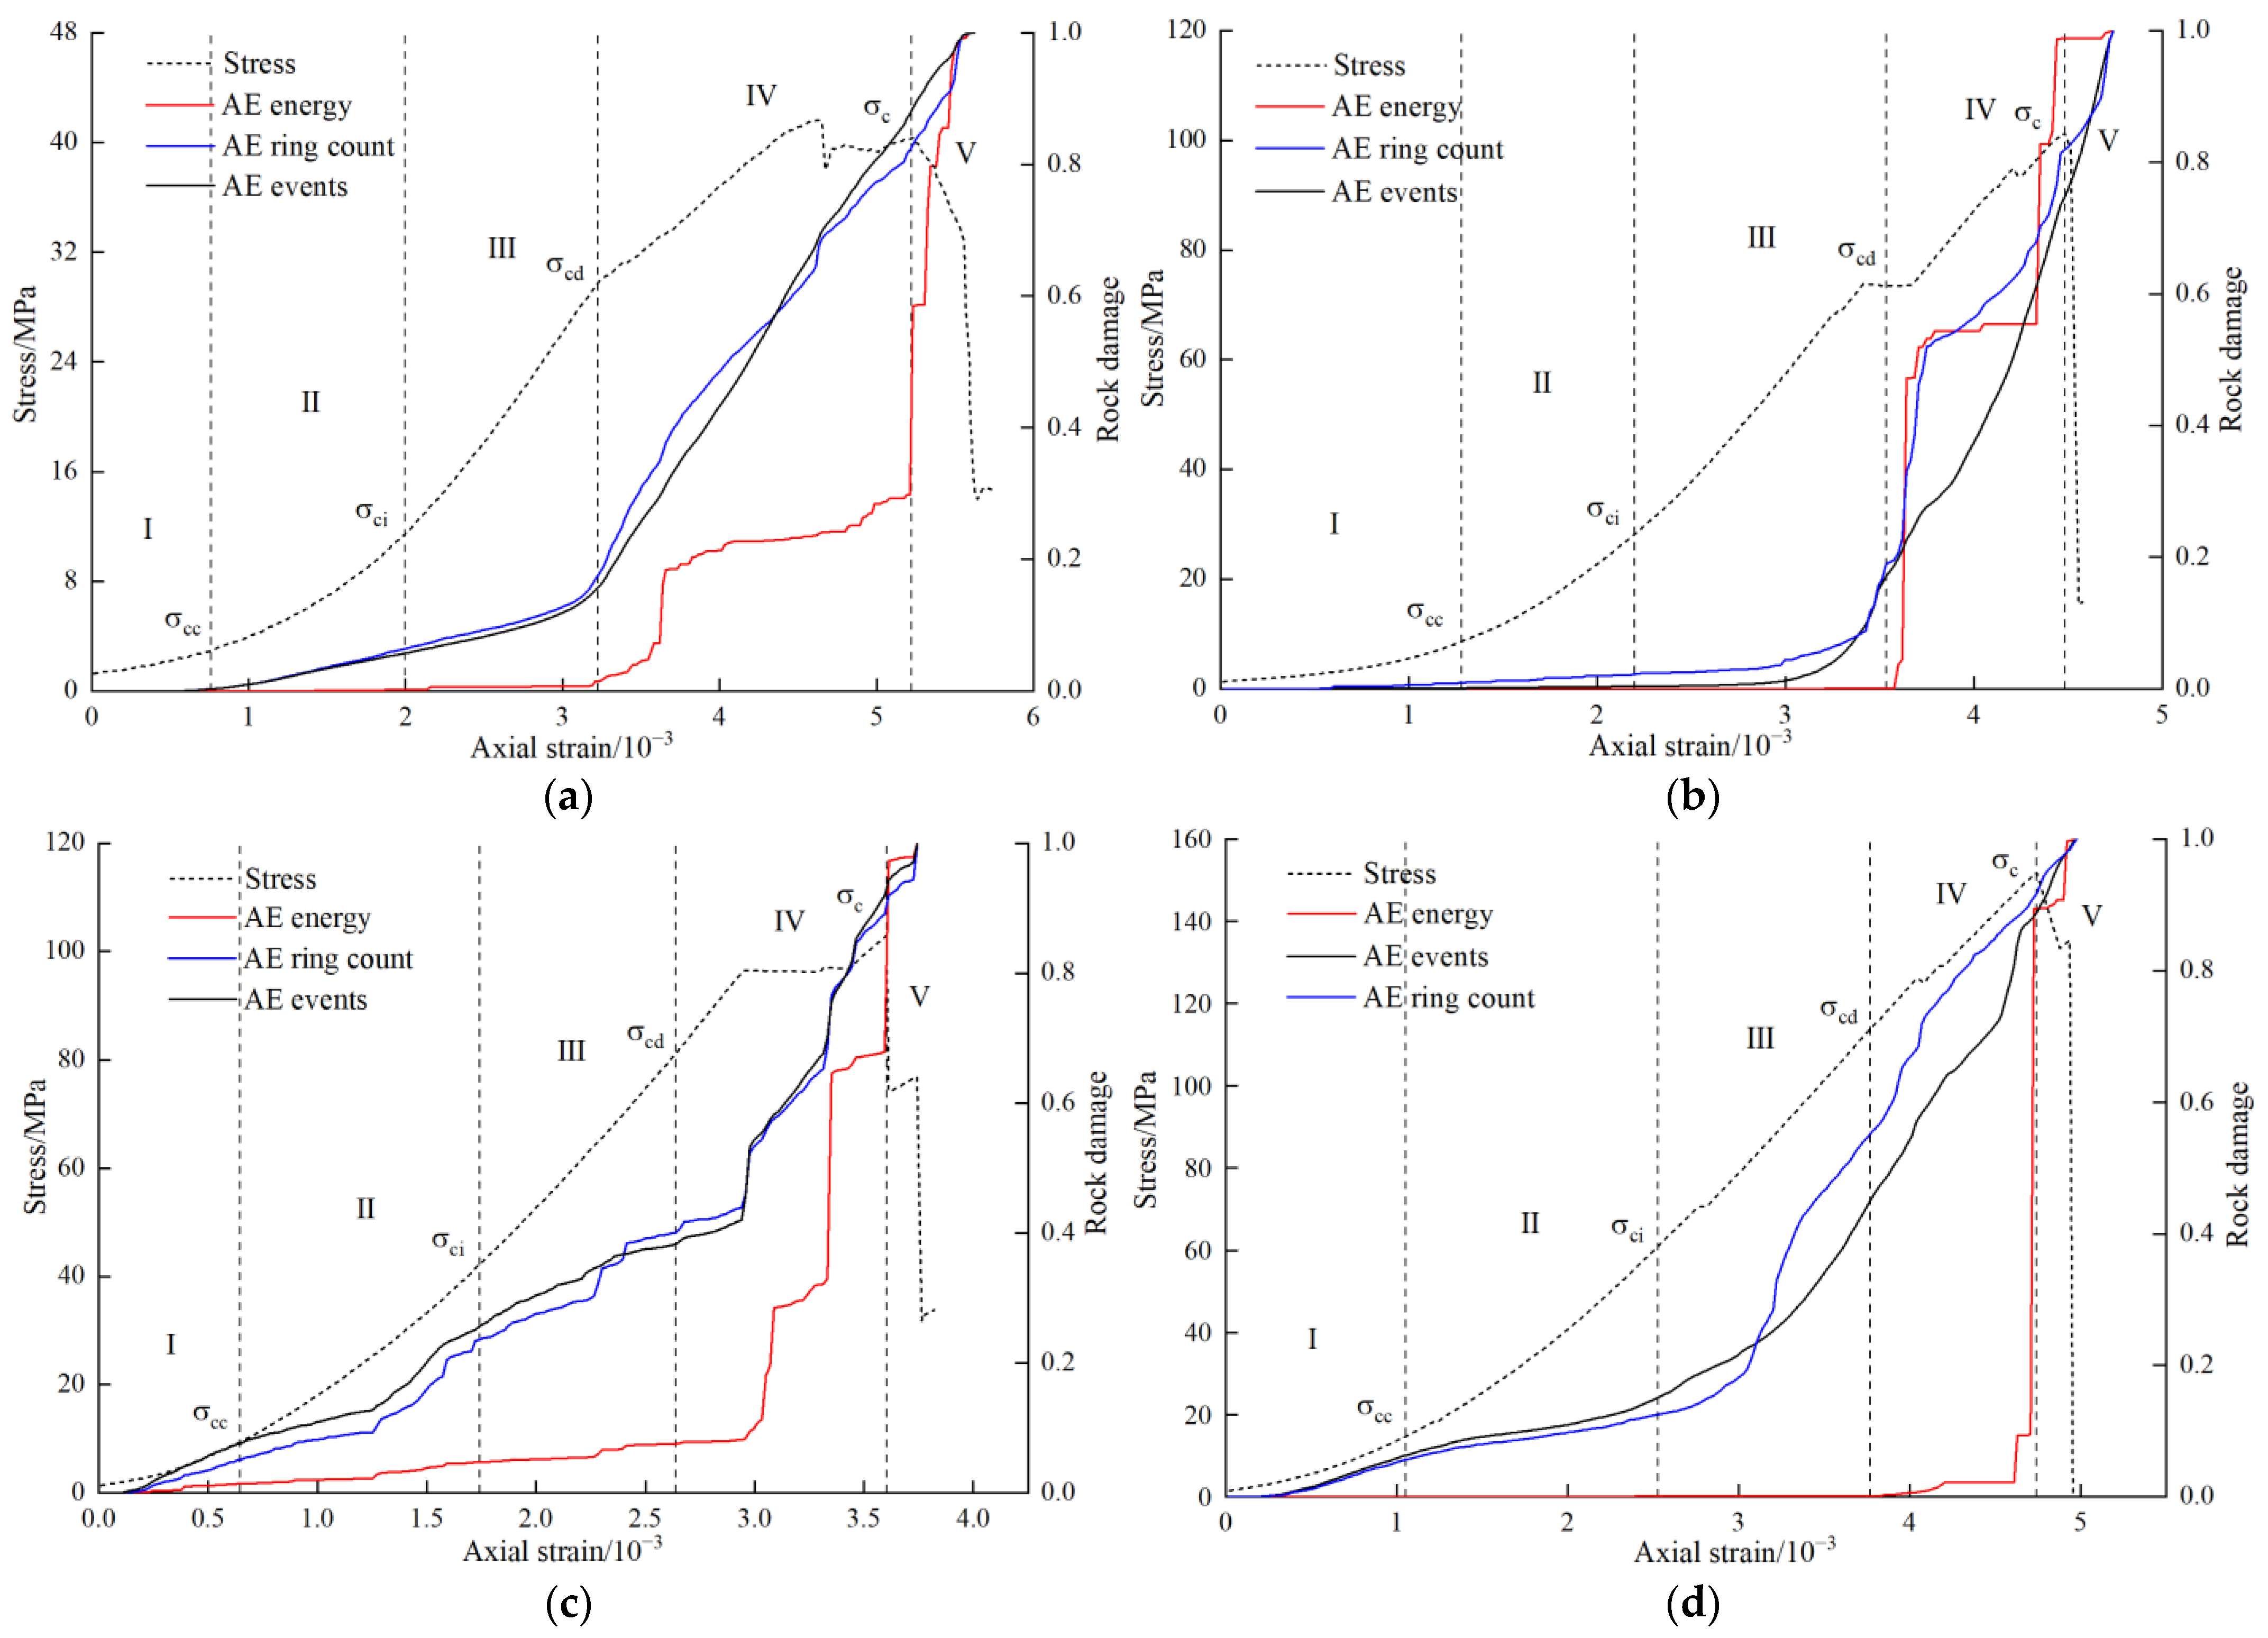
3.3. Comparative Analysis of Damage Process Represented by Different AE Parameters

Acoustic emission (AE) is a wave of elastic energy which is released during the rock breakage [31,32]. The change of its parameters can characterize the damage evolution in the rock mass [33,34]. Tang [35] assumed that the AE events and the damage developed linearly and established the equivalent relationship between the rock damage and the normalized AE characteristic parameters. That is, the parameters are normalized by the cumulative count (see Equation (7)), and the normalized value is the cumulative damage in the rock at this time.
d = N / N a
where d is the rock damage; N is the AE cumulative value at a certain time; and Na is the AE cumulative value in the whole process of the rock failure.
According to Equation (7), the AE events, ring count and energy in the failure process of the limestone with different rockburst tendencies are normalized, and the damage changes represented by the different AE parameters are obtained, as shown in Figure 6.
As shown in Figure 6, the damage change characteristics represented by different AE parameters have obvious differences. The damage change curve represented by the AE events and ring count is relatively stable, while the damage change curve represented by the energy presents a stepped change.
(1)
The characterization of the rock damage by the AE events and ring count. In the rock compaction stage (stage I), no damage can be observed in the limestone with no or with a weak rockburst tendency. After reaching the closure stress, the damage begins to accumulate at a certain rate, and the damage accumulation rate increases near the damage stress. However, the limestone with the medium and strong rockburst tendency has an obvious damage accumulation and maintains a relatively stable growth rate. The damage accumulation rate of the limestone with a medium rockburst tendency increases during the unstable crack propagation stage, and that of the limestone with a strong rockburst tendency increases soon after the stress reaches the crack initiation stress. The damage represented by the AE events and ring count of the limestone with no, a medium and a strong rockburst tendency is similar, and there is no obvious difference between them. The cumulative rate of the damage represented by the ring count of the limestone with the weak rockburst tendency increases before the damage stress point and decreases after the damage stress point, while the cumulative rate of the damage represented by the AE events increases before the damage stress point and becomes a fixed value.
(2)
The characterization of the rock damage by the energy. Before the loading stress reaches the damage stress, the damage represented by the energy of the limestone with different rockburst tendencies has not accumulated significantly, and it presents a stepped change after the damage stress. The damage of limestone with no and with a weak rockburst tendency increases abruptly near the damage stress point and then increases steadily for a period of time; with the occurrence of the rock failure, the damage increases rapidly to the peak. The damage of the limestone with a medium rockburst tendency begins to accumulate speedily in the middle of the unstable crack propagation stage, and the damage of the sample increases slowly from the initial loading stage. This may be related to its internal grain, joints and other microstructures. The damage of the limestone with a strong rockburst tendency goes through a long quiet period. It only accumulates slightly near the peak stress and accumulates speedily within a short time. The damage represented by the AE energy of the limestone has gone through a quiet period. After the accelerated accumulation of the damage, there is a transitional quiet period before the next accelerated accumulation. With the increasing rockburst tendency of the limestone, the more delayed the accelerated accumulation of the damage, the shorter the transitional quiet period, and the limestone with the strong rockburst tendency has no transitional quiet period.
To sum up, there are differences in the damage evolution process of rocks represented by the different AE parameters. The rock damage represented by the AE events and ring count tends to be gentle, and the damage initiation point appears early, which cannot better represent the severe accelerated accumulation process of the damage caused by the sudden release of the internal energy of rocks with a rockburst tendency. The damage represented by the energy can better reflect the instantaneity and intensity of the rockburst damage.

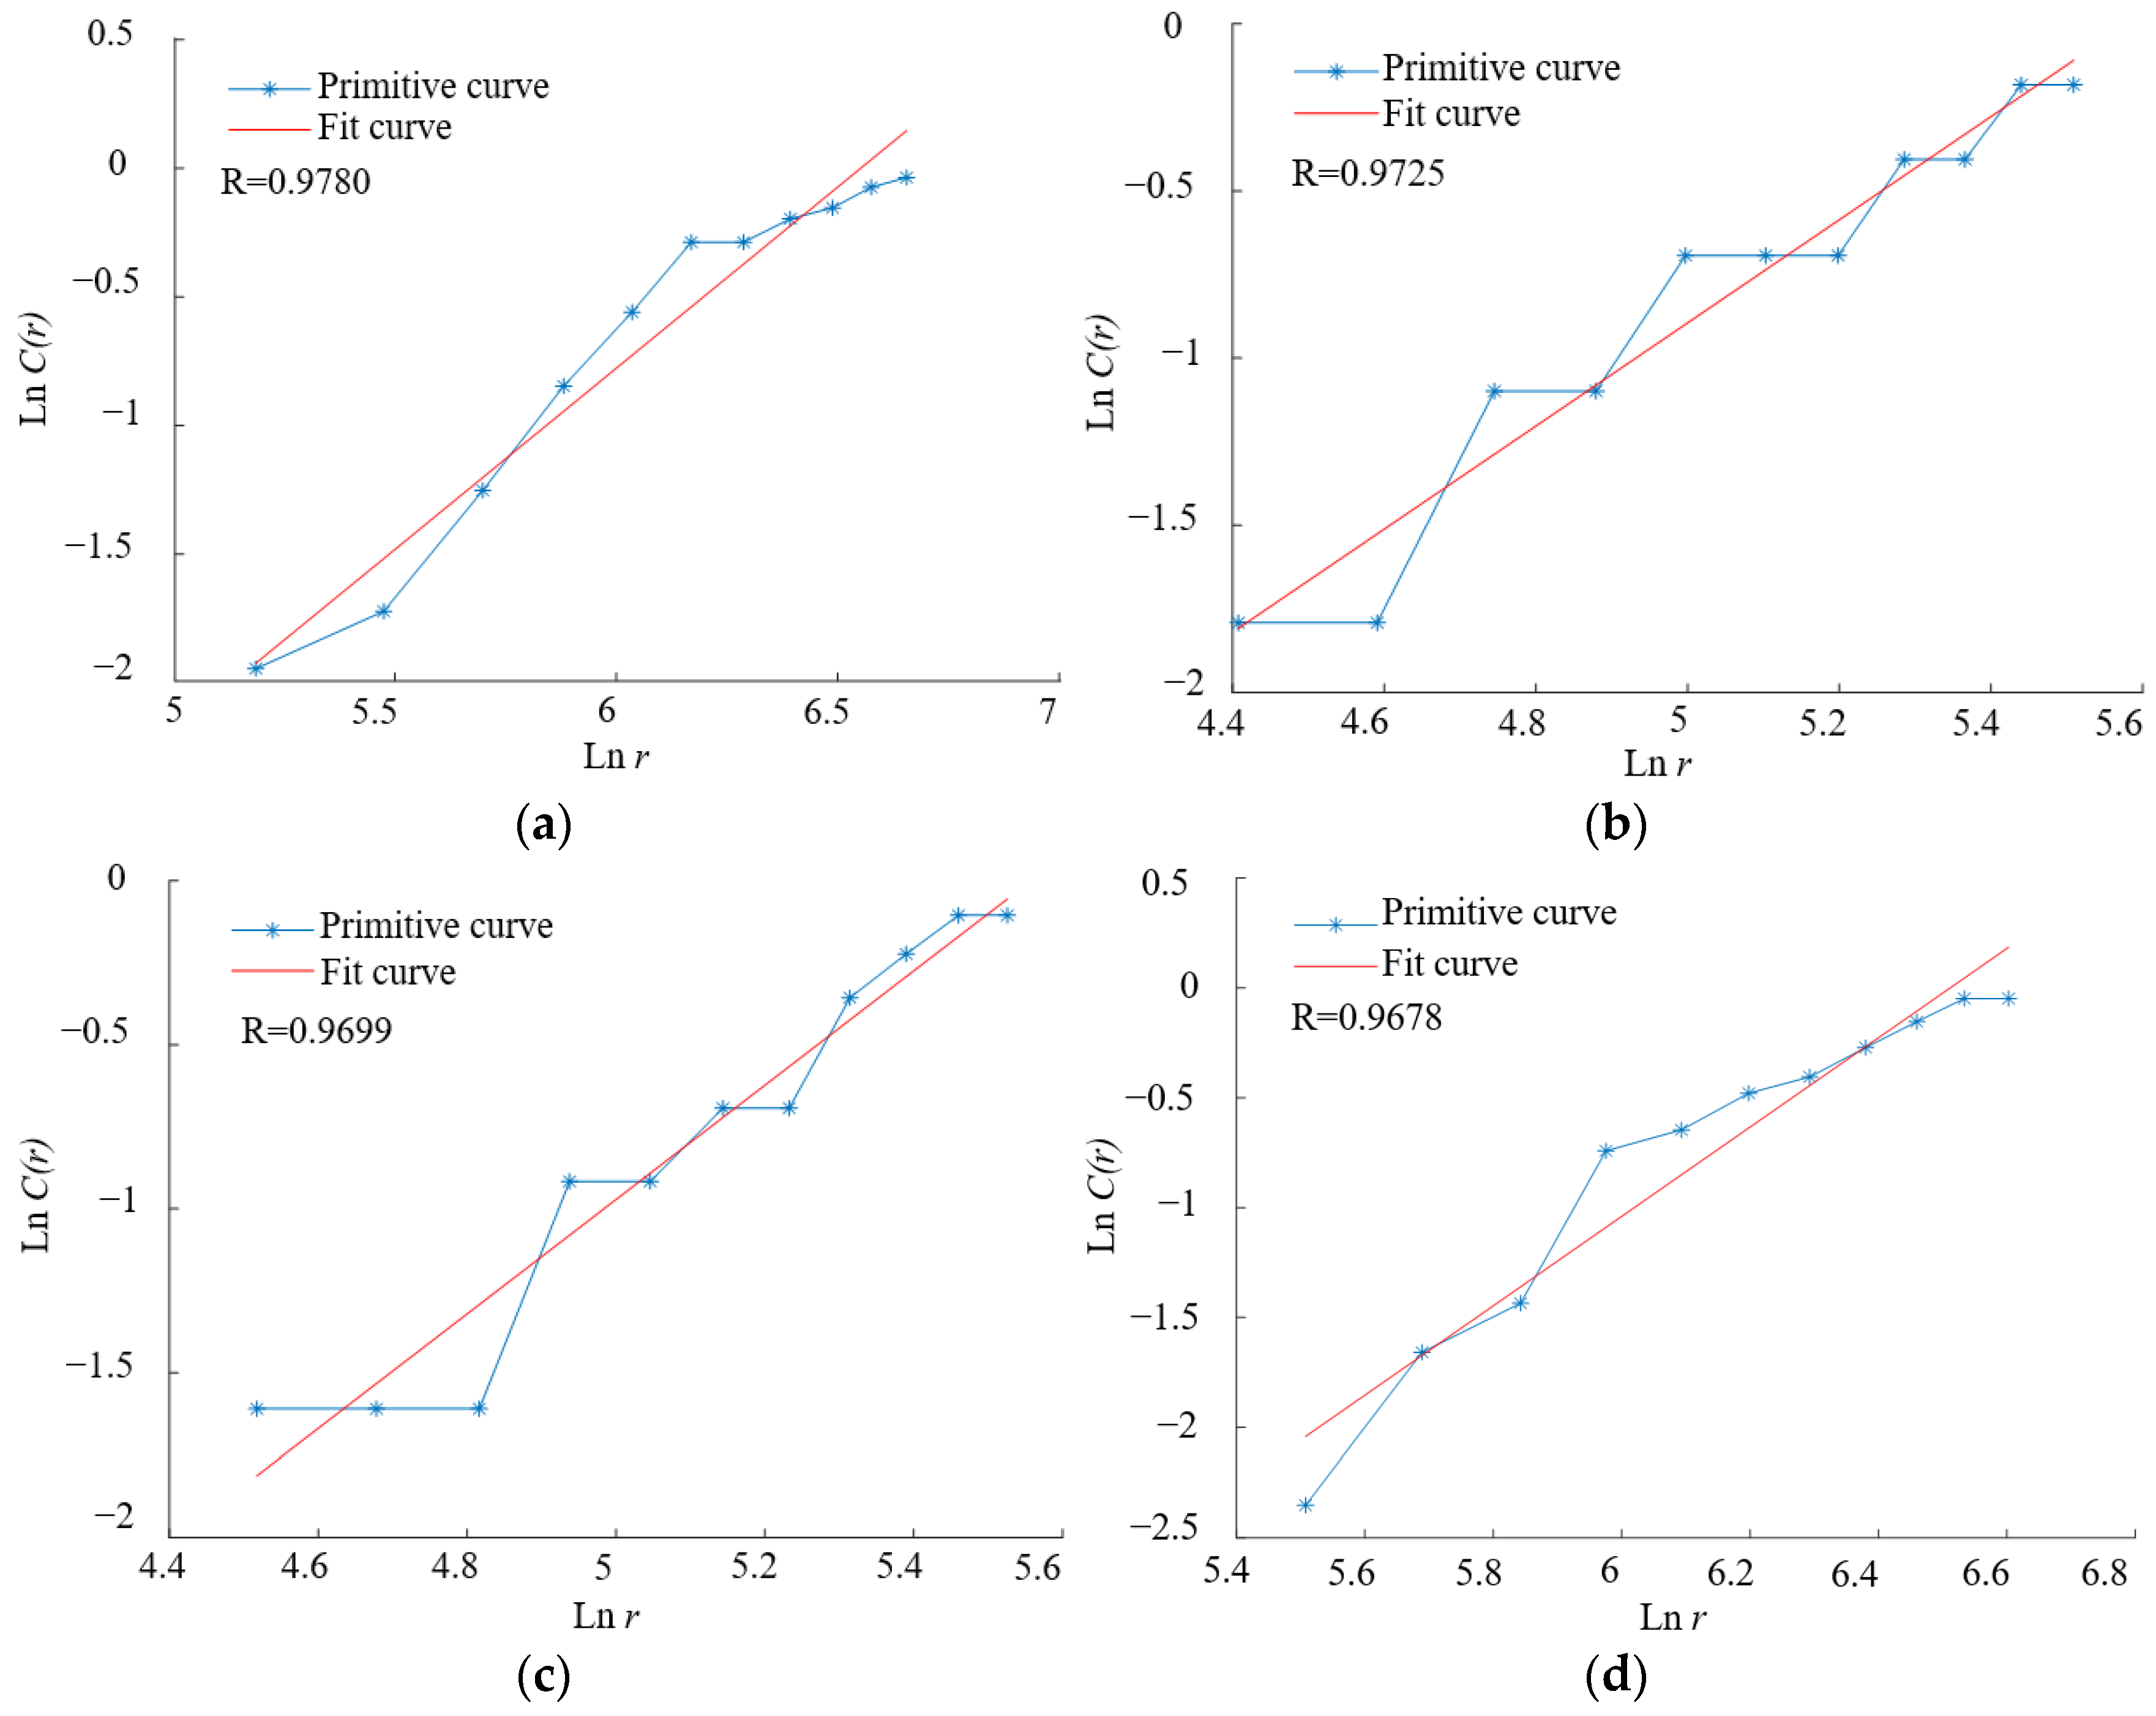
3.4. AE Fractal Characteristics of the Limestone with Different Rockburst Tendencies

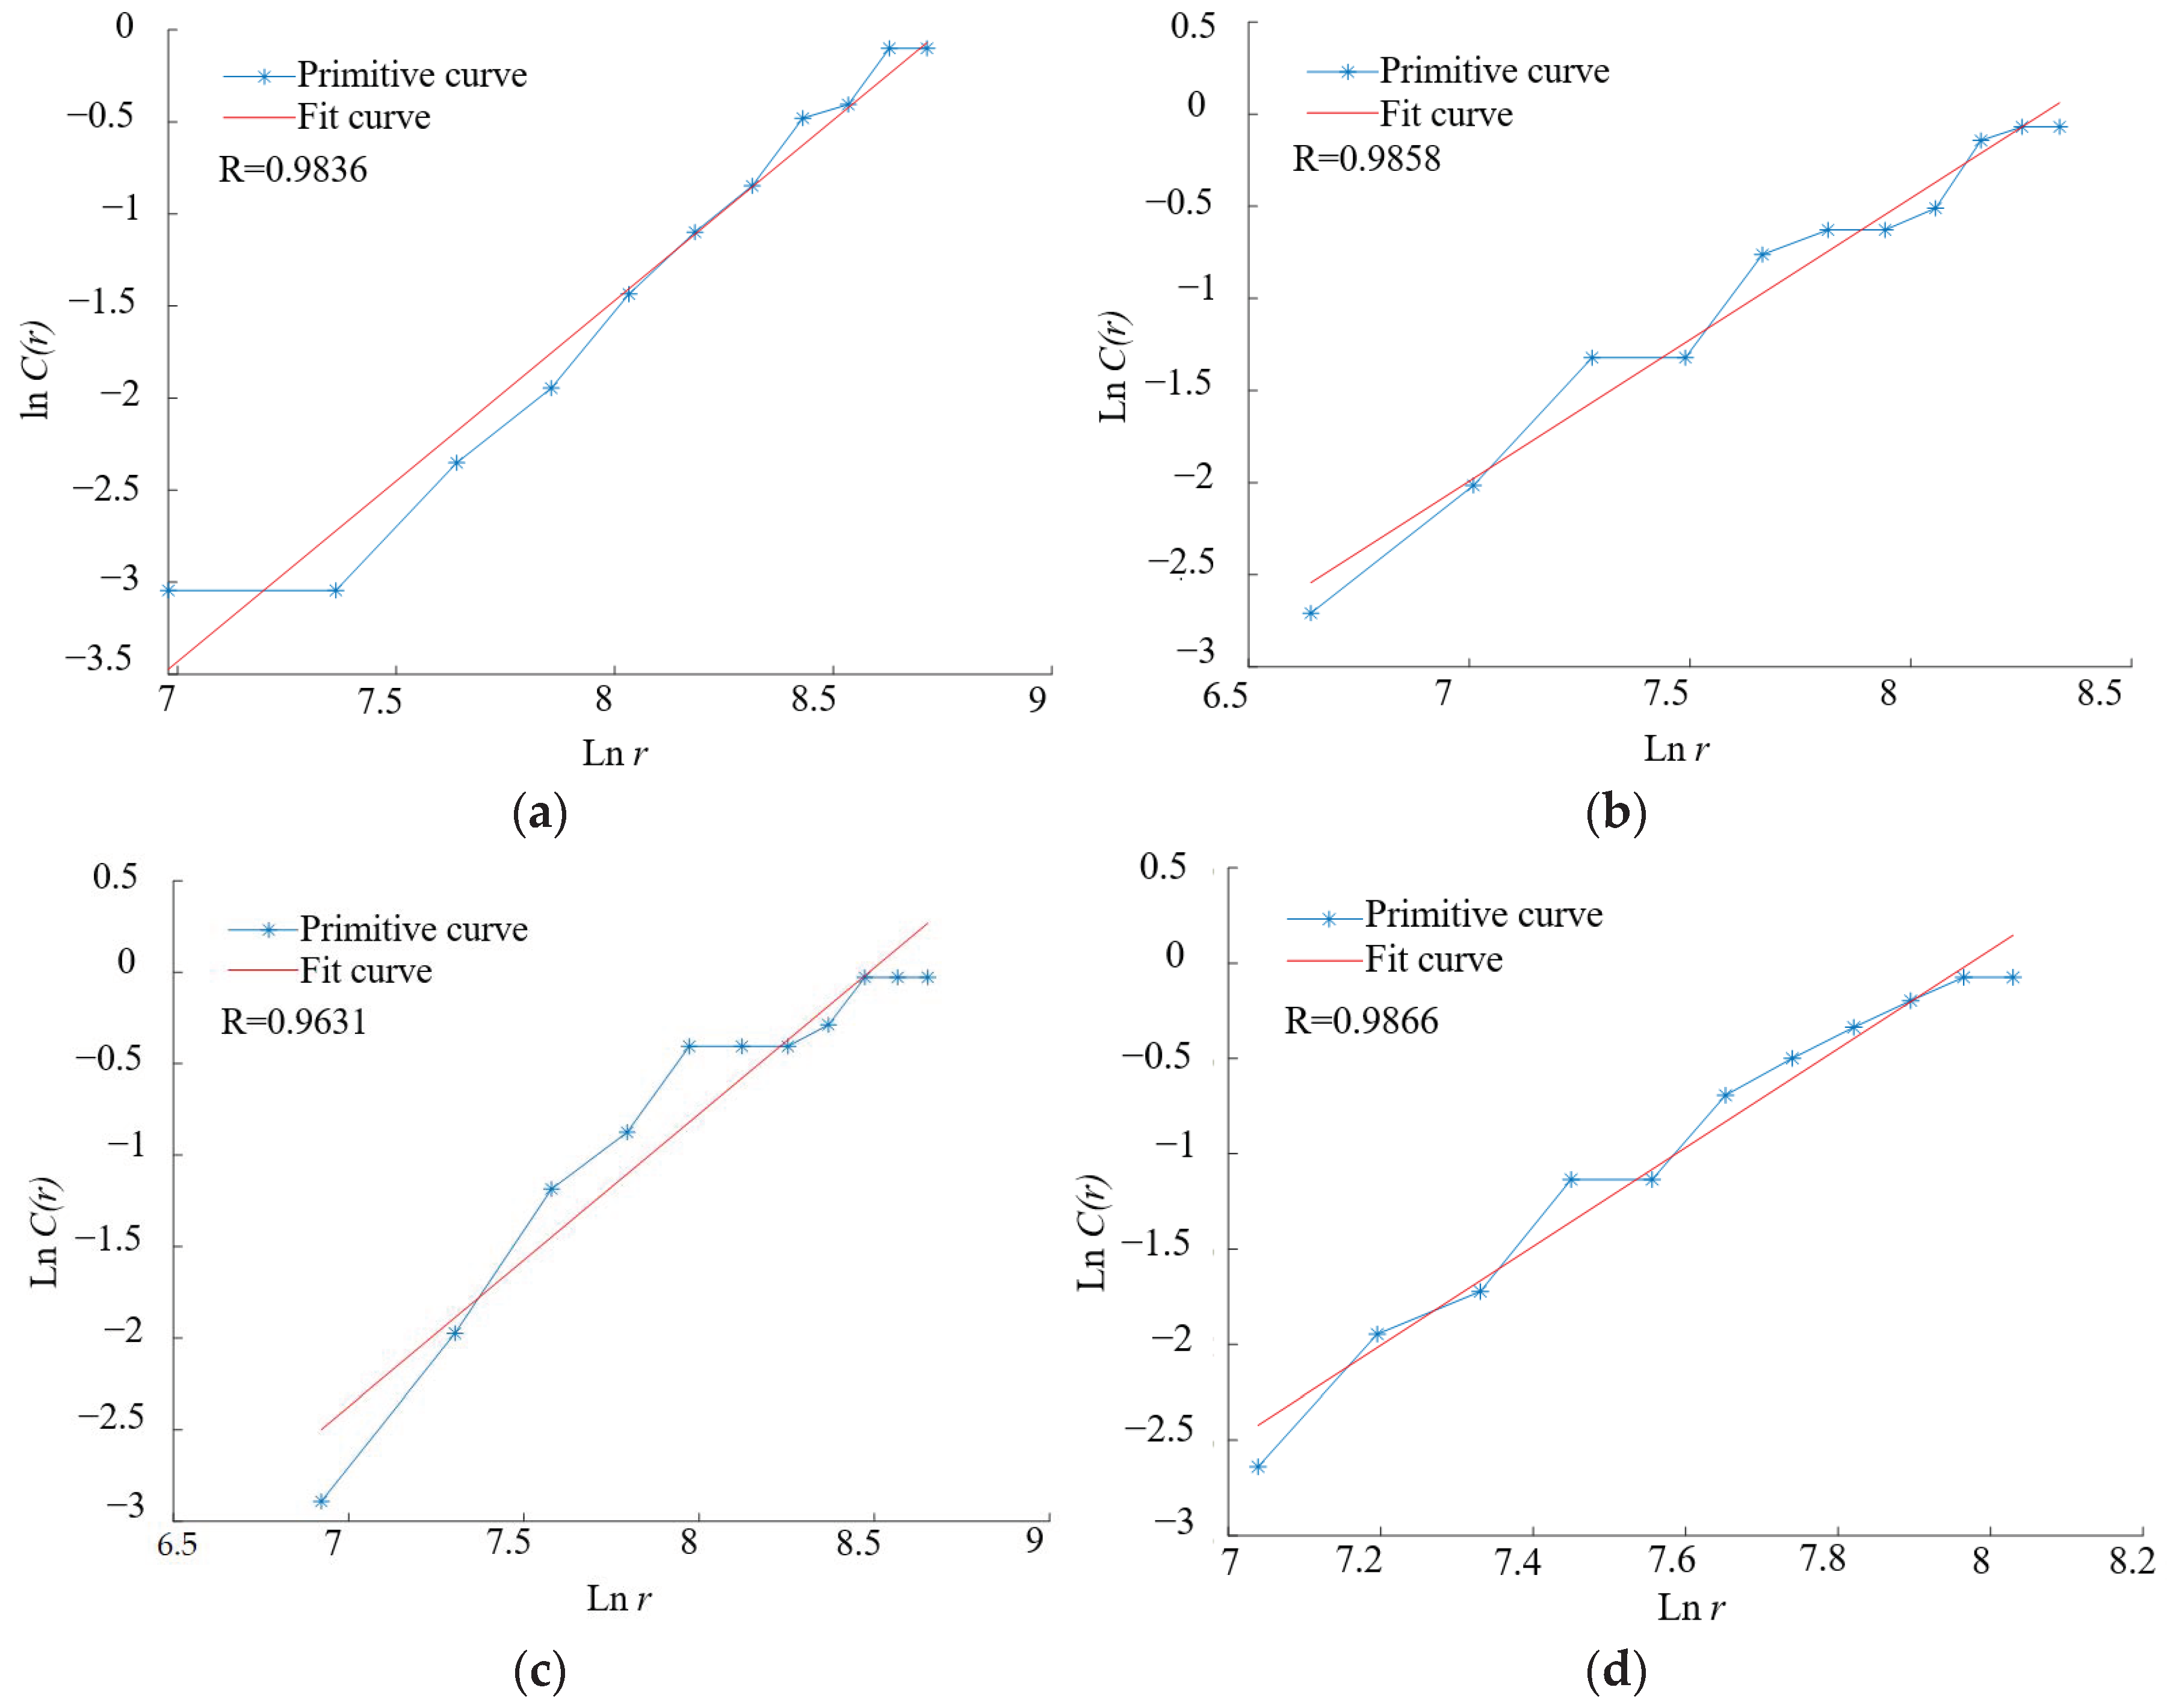
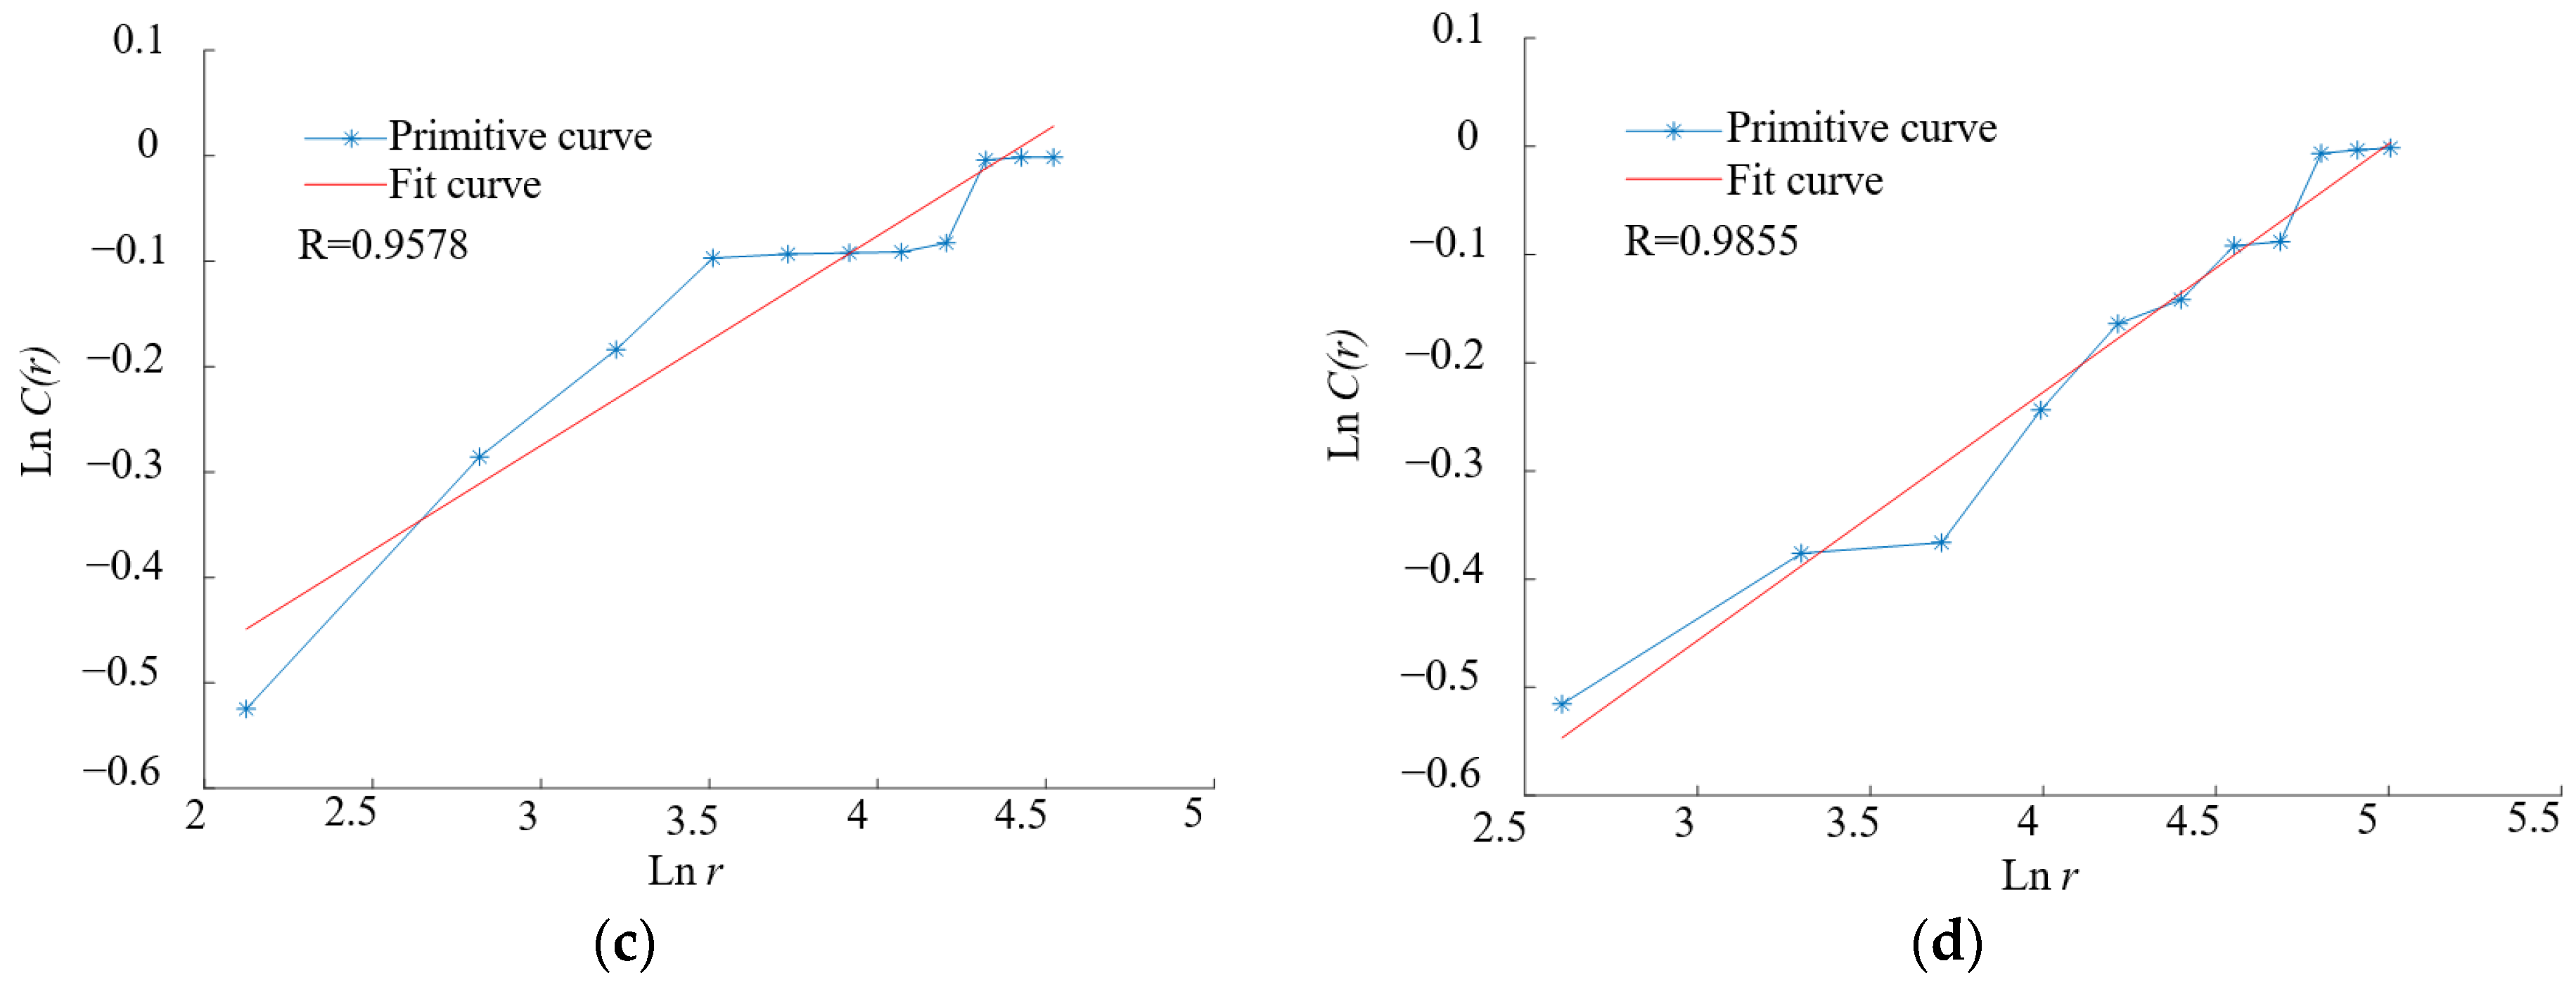
3.4.1. Calculation of Fractal Dimension

The evolution law of the AE characteristic parameter correlation dimension D in the rock fracture process is closely related to the mechanical process of the rock damage, which reflects the change in the damage of the rock’s internal structure [36,37]. Based on different AE characteristic parameters, the corresponding correlation dimension D is calculated. According to the fractal characteristics in the rock failure and the rockburst failure mechanism, the applicability of each AE characteristic parameter in characterizing the damage process of the limestone with different rockburst tendencies is discussed.
According to the G-P algorithm proposed by Grassberger [38], the correlation dimension of the AE time series of the limestone is calculated.
(1)
The AE signals of a single limestone rock correspond to a sequence set with a capacity of n [39]:
X = { x 1 ,   x 2 ,   x 3 ,   ,   x n }
The AE events, ring count and energy of the limestone are taken as the time series, respectively.
(2)
Construction of m-dimensional phase space
The first m data intercepted from the AE one-dimensional time series set X, a new m-dimensional phase space vector, is reconstructed and then the right shift method is used to move the τ data. Finally, the one-dimensional time series set is further expanded into the m-dimensional vector groups.
X 1 = ( x 1 ,   x 2 ,   x 3 ,   ,   x m ) X 2 = ( x 1 + τ ,   x 2 + τ ,   x 3 + τ ,   ,   x m + τ ) X n = ( x n + τ ,   x n + τ ,   x n + τ ,   ,   x n + ( m 1 ) τ ) }
(3)
Correlation function of m-dimensional phase space points:
C ( r ) = lim N 1 N 2 i = 1 N j = 1 N H ( r | X i X j | )
where H(x) is the Heaviside step function and r is a given scale function. When the distribution of the phase space points approaches a straight line, it indicates that the AE time series has obvious fractal characteristics.
(4)
Correlation dimension expression calculation
The correlation dimension expression is as follows:
D ( m ) = lim r ln C m ( r ) ln r
The correlation dimension D of the AE events, ring count and energy of the limestone with different rockburst tendencies is calculated by using Equation (11), and the time-series fractal characteristics of the AE parameters are compared and analyzed. When calculating the correlation dimension of the AE of the limestone with different rockburst tendencies, the value of the phase space dimension m should be consistent. Taking the limestone with a weak rockburst tendency as an example, the relationship curve is drawn with the phase space dimension m as the abscissa and the correlation dimension D as the ordinate, as shown in Figure 7. When the phase space dimension m is [2,4], the correlation dimension D tends to be linear. Here, the phase space dimensions m are all taken as three.

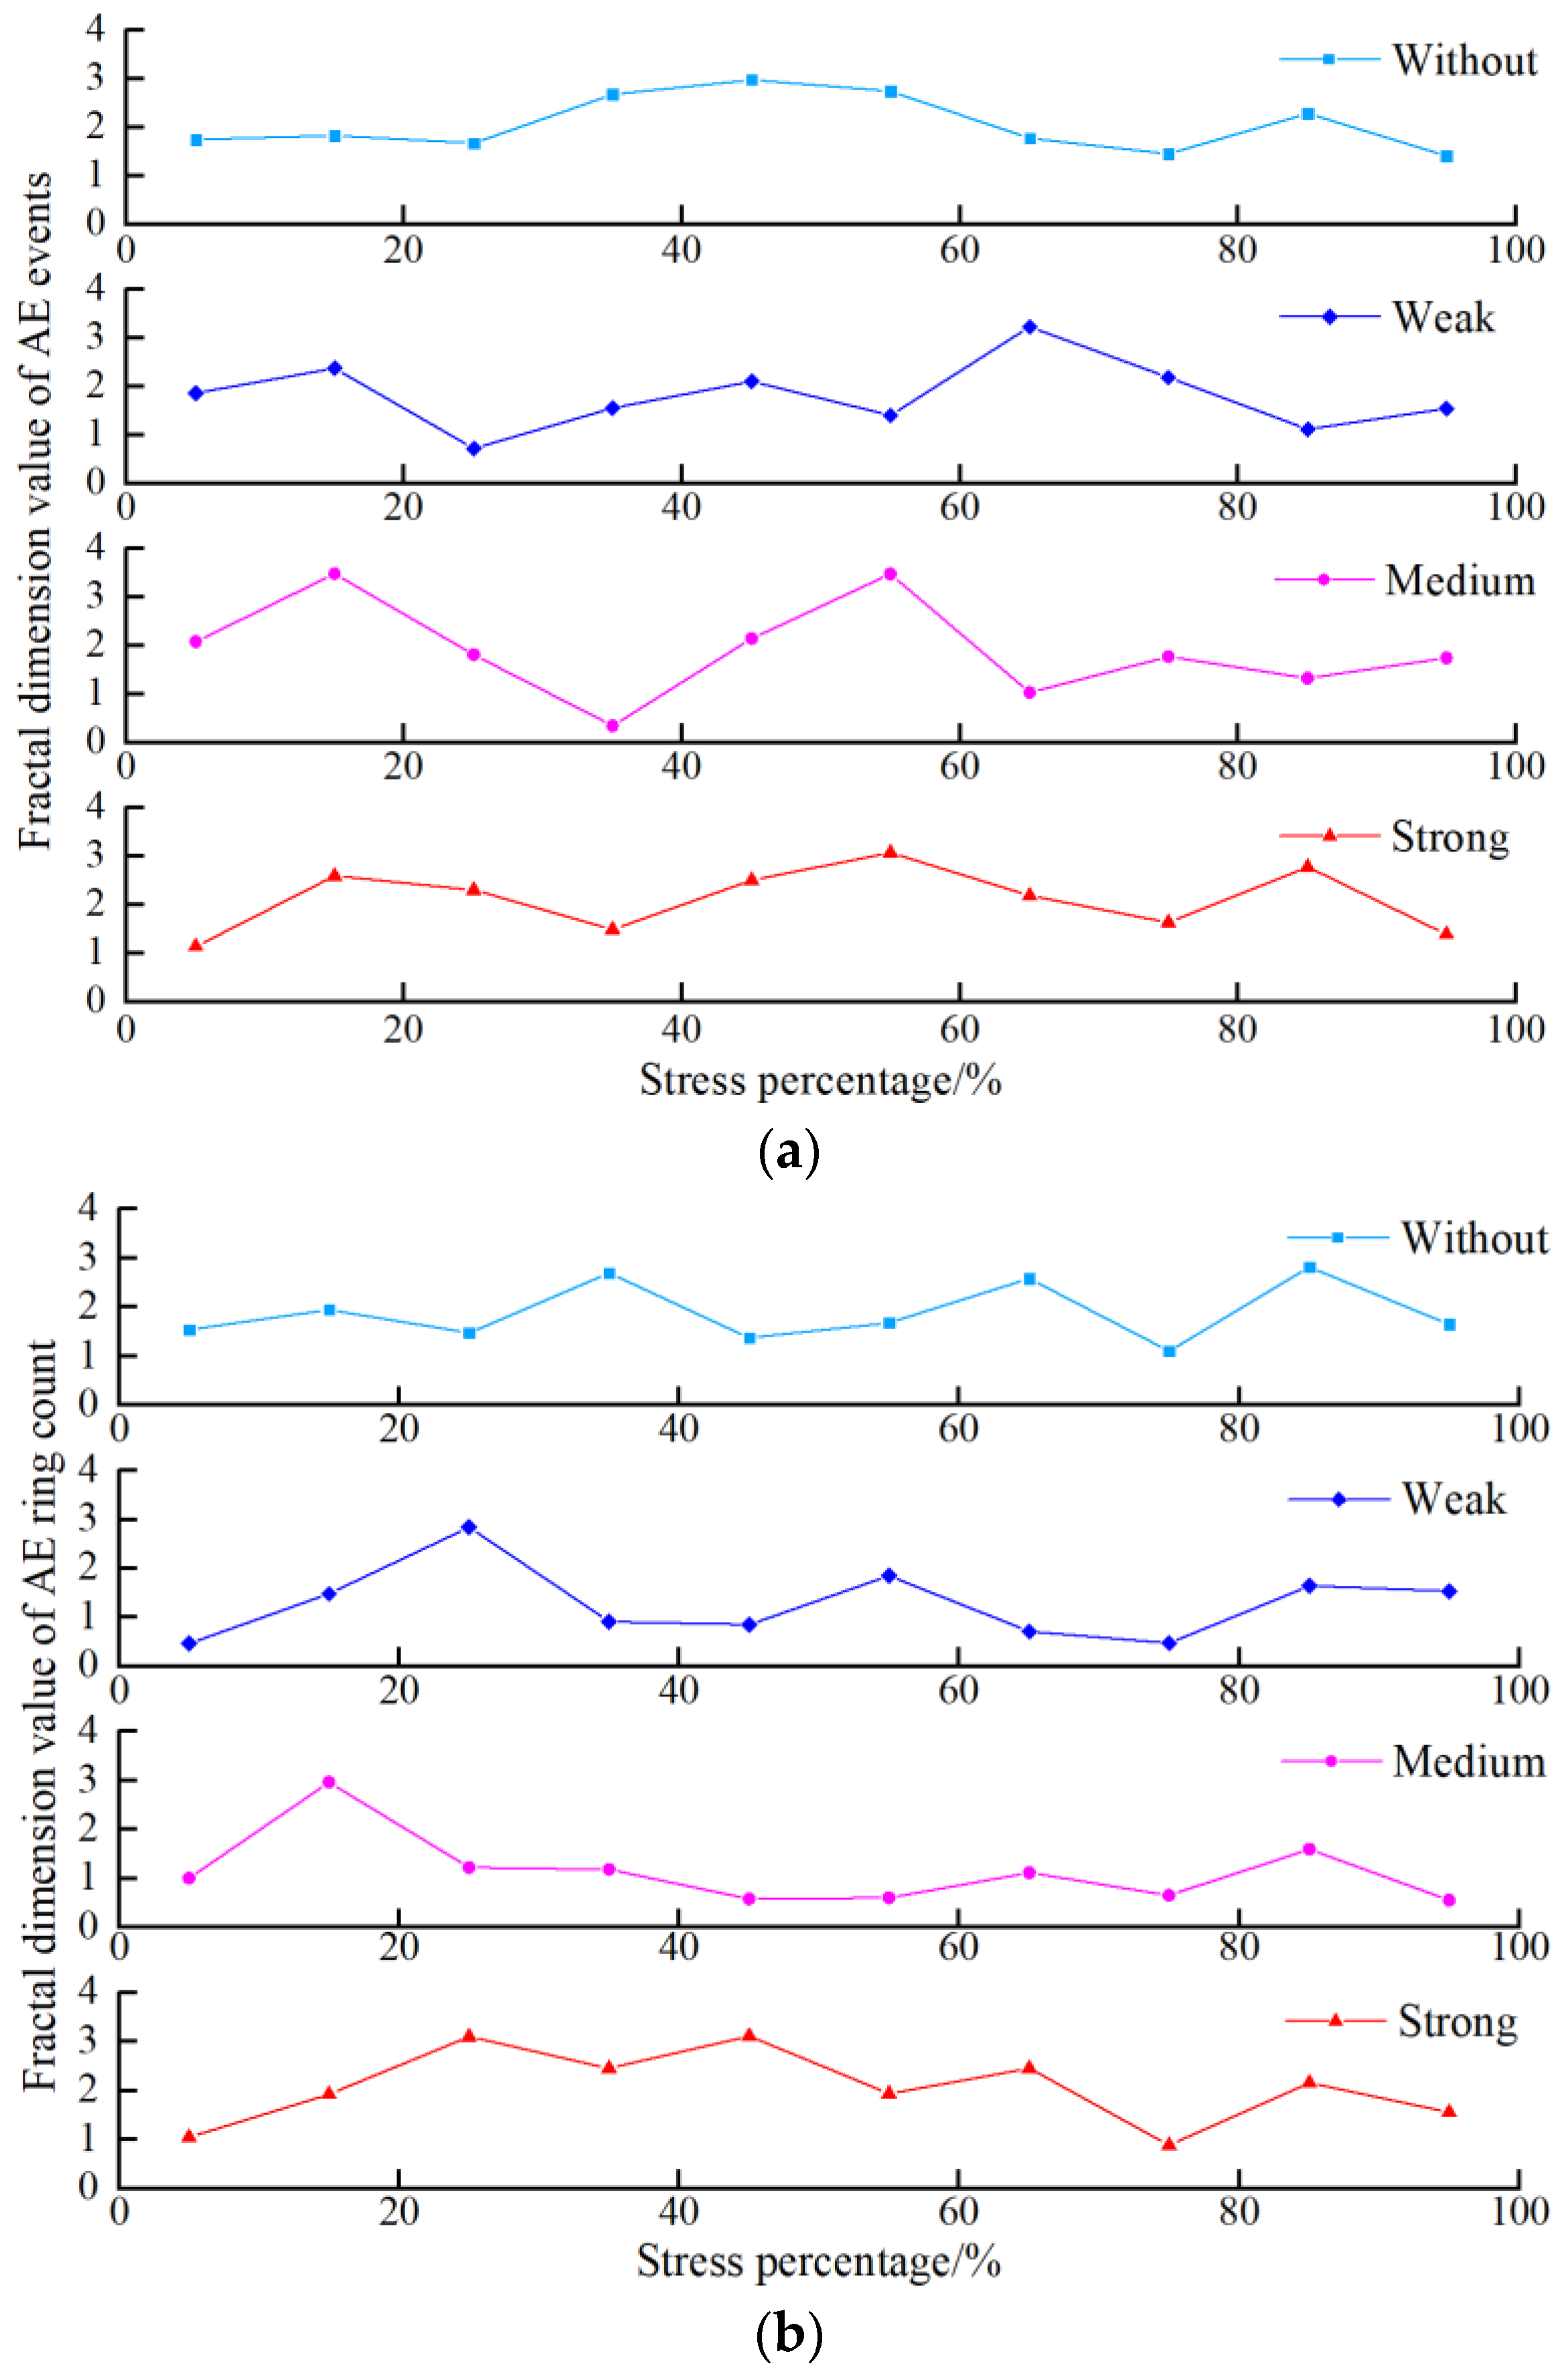
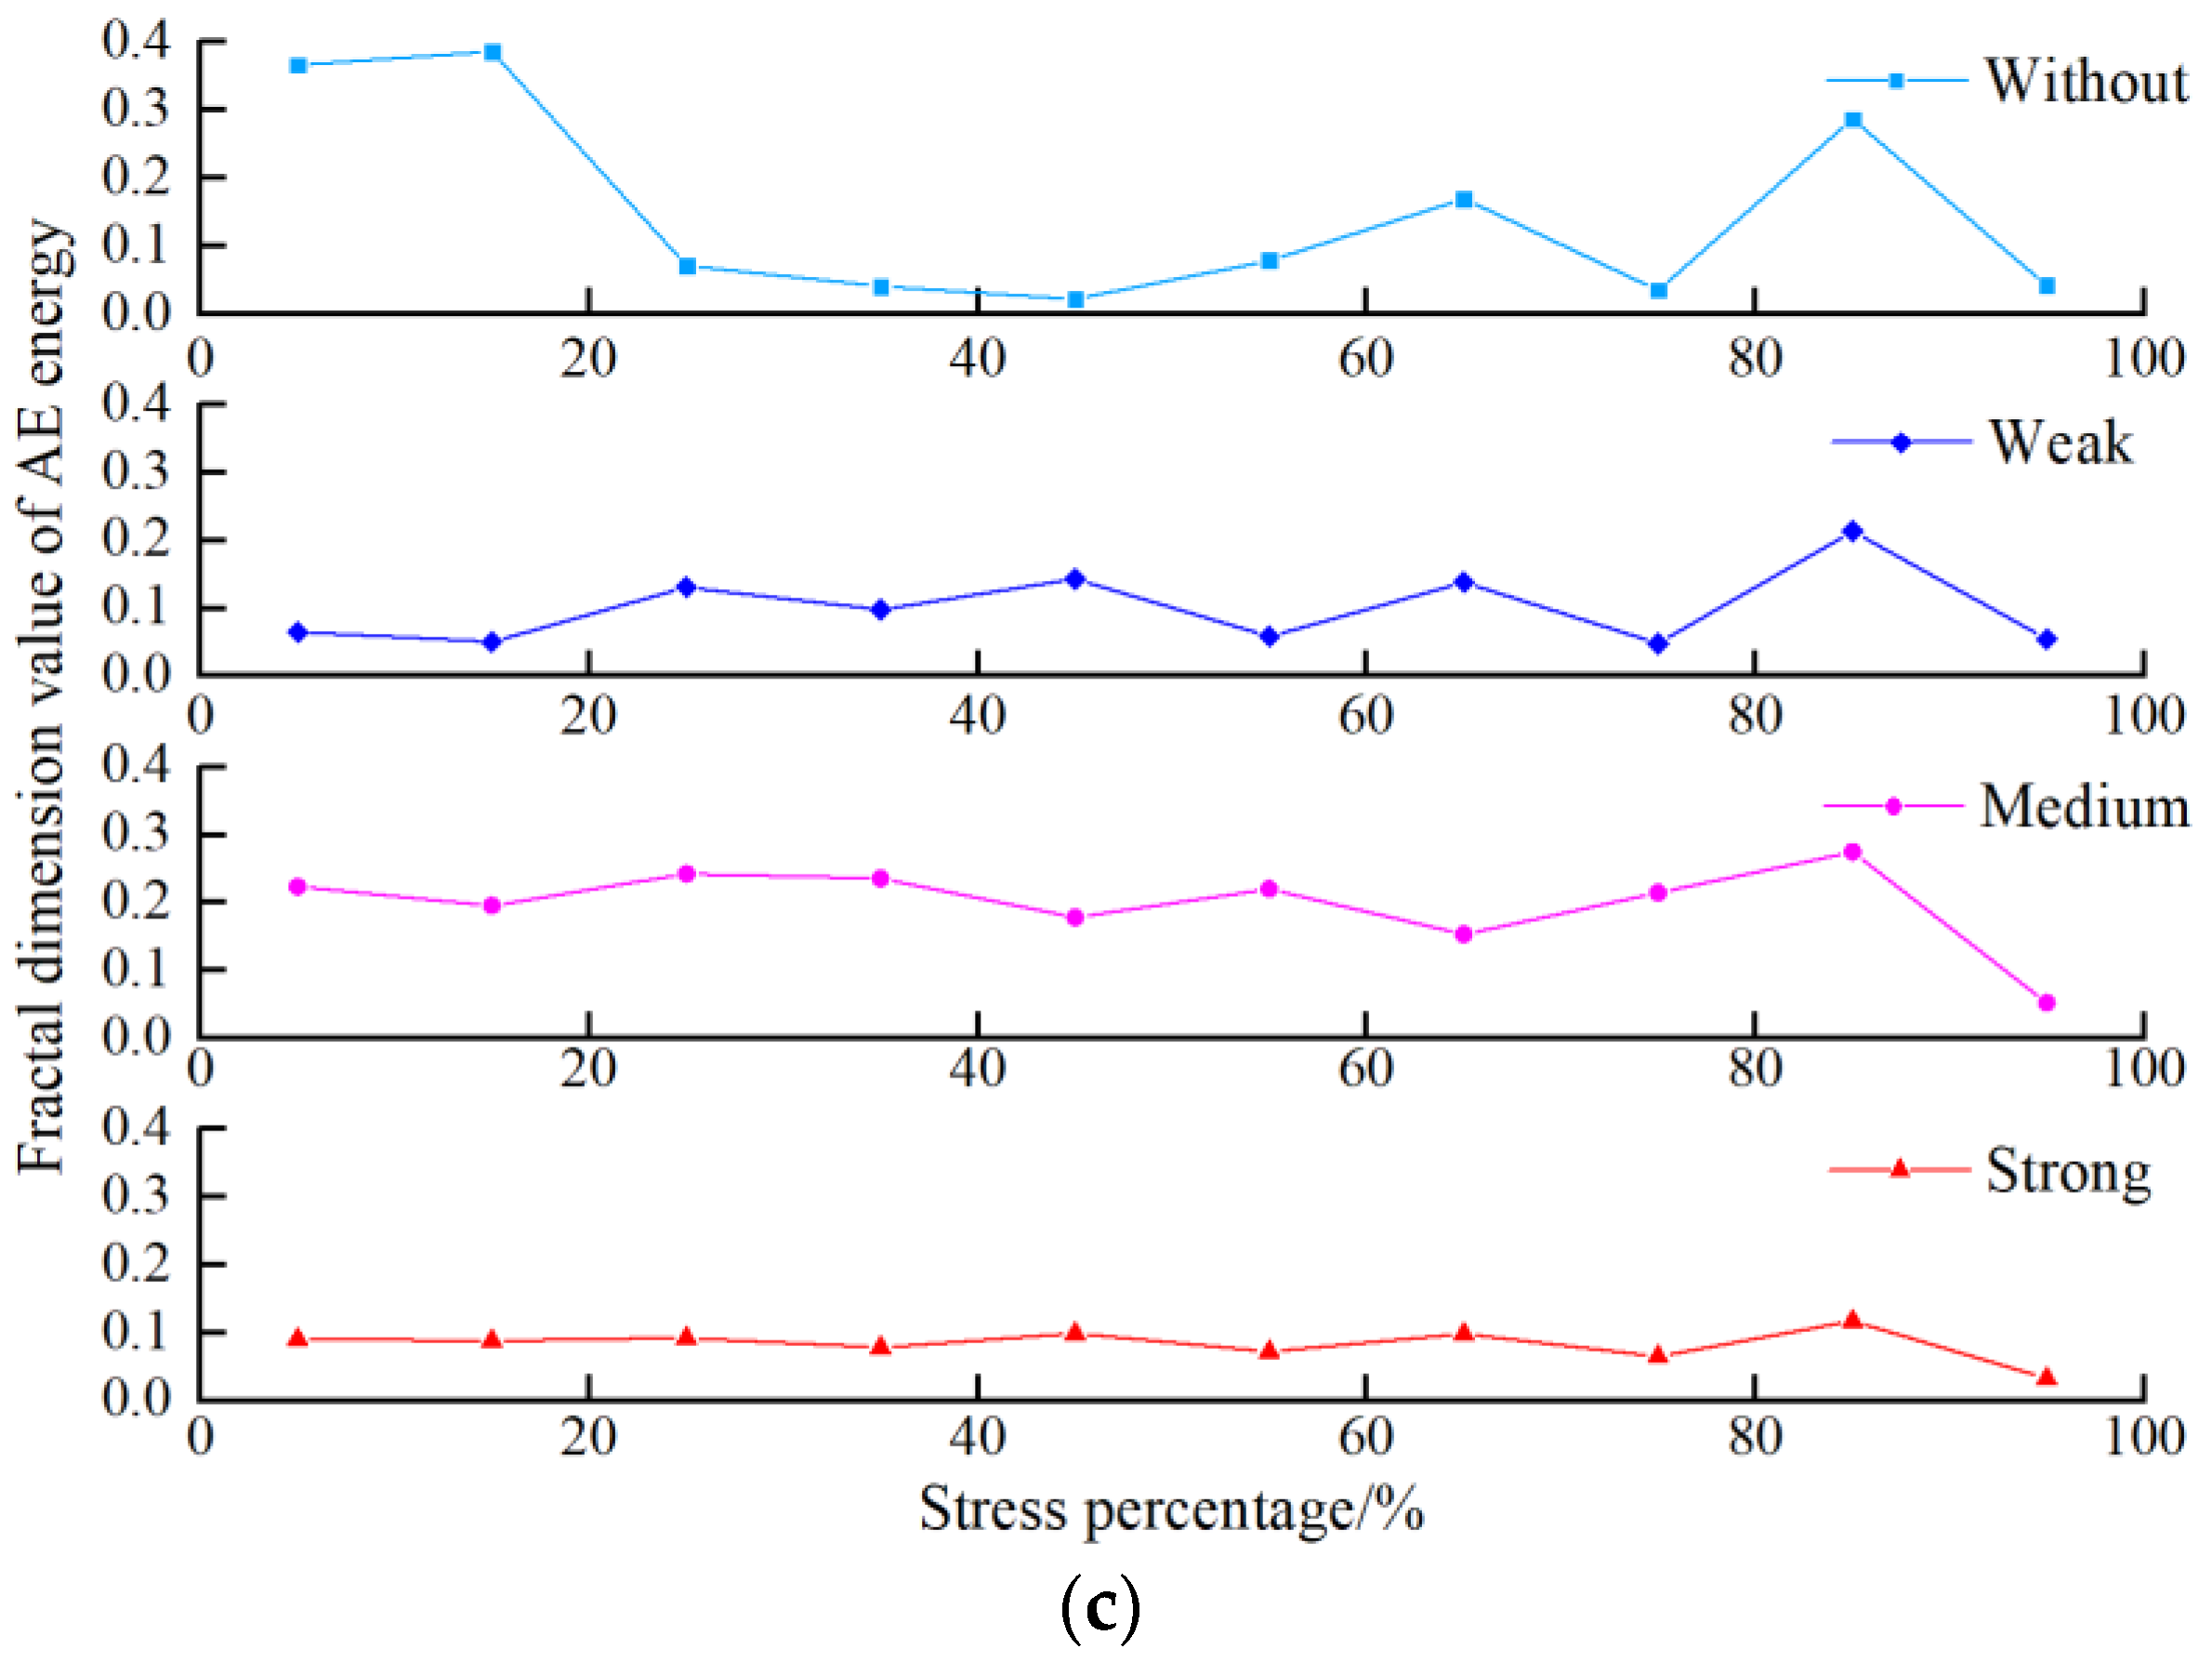
3.4.2. Fractal Characteristics of Acoustic Emission Parameters

The univariate linear regression is performed for the AE events, ring count and energy parameter series of the limestone with different rockburst tendencies, as shown in Figure 8, Figure 9 and Figure 10. The fitting line has a strong correlation with the original curve, and the correlation coefficients are greater than 0.95, indicating that the AE events, ring count and energy have good fractal characteristics in the failure process of the limestone. The fractal dimension values of the AE events, ring count and energy calculated based on the G-P algorithm are obtained, as shown in Figure 11.
As shown in Figure 11a, the fractal dimension D of the AE events of the limestone with a medium rockburst tendency fluctuates relatively violently, while that of the limestone without a rockburst tendency fluctuates stably. In Figure 11b, the fluctuation degree of the fractal dimension D of the AE ring count of the limestone with different rockburst tendencies is similar. In Figure 11c, the fractal dimension D of the AE energy of the limestone without a rockburst tendency fluctuates most violently, followed by limestone with a weak rockburst tendency, and limestone with a strong rockburst tendency is the most stable. To quantify the fluctuation degree of the fractal dimension value of each parameter, the coefficient of variation CV ( C V = σ / x ¯ ) is introduced to analyze the volatility of the data in different groups. The greater the CV value, the greater the data volatility, and vice versa. The variation coefficients of the AE events, ring count and energy fractal dimension value [CV(s), CV(z) and CV(n)] of the limestone with different rockburst tendencies are calculated, respectively. The results are shown in Table 6 and they are draw into a column diagram in Figure 12.
It can be seen from the rock burst failure mechanism that the limestone with a stronger rockburst tendency mainly stores energy in its interior at the early stage of loading, and the dissipated energy is only a small part. Only micro damage occurs to the rock, and the macro structure remains intact. The increase or decrease in the fractal dimension can reflect the damage and destruction of the rock. There is no obvious change rule of the acoustic emission events and the ringing count fractal dimension D of the limestone with different rockburst tendencies, but the change in the acoustic emission energy fractal dimension D is more stable with the increase in the rockburst tendency. Therefore, the change in the fractal dimension based on the AE energy is more consistent with the rockburst mechanism.
In conclusion, the rock damage represented by the AE events and ring count appears prematurely and has prominent features of a progressive evolution. As a result, the intensity and instantaneity of the rock failure with a rockburst tendency cannot be effectively characterized. The energy characterization of the damage process of the limestone with different rockburst tendencies not only avoids the interference of small energy events in the compaction and elastic stages, but also characterizes the accelerated damage accumulation process of violent rock damage. Energy conversion is the essence of rock failure [40]. The essence of rockburst is the instantaneous and violent release of high strain energy stored in the rock [41,42]. Therefore, the change law of the energy fractal dimension D is more in line with the rockburst mechanism. Additionally, with the increasing tendency of the rockburst, the change characteristics of the AE event rate and ring count in the process of rock failure are gradually consistent with that of the energy. Therefore, the AE energy is more reasonable in presenting the damage process of rocks with a stronger rockburst tendency.

4. Conclusions

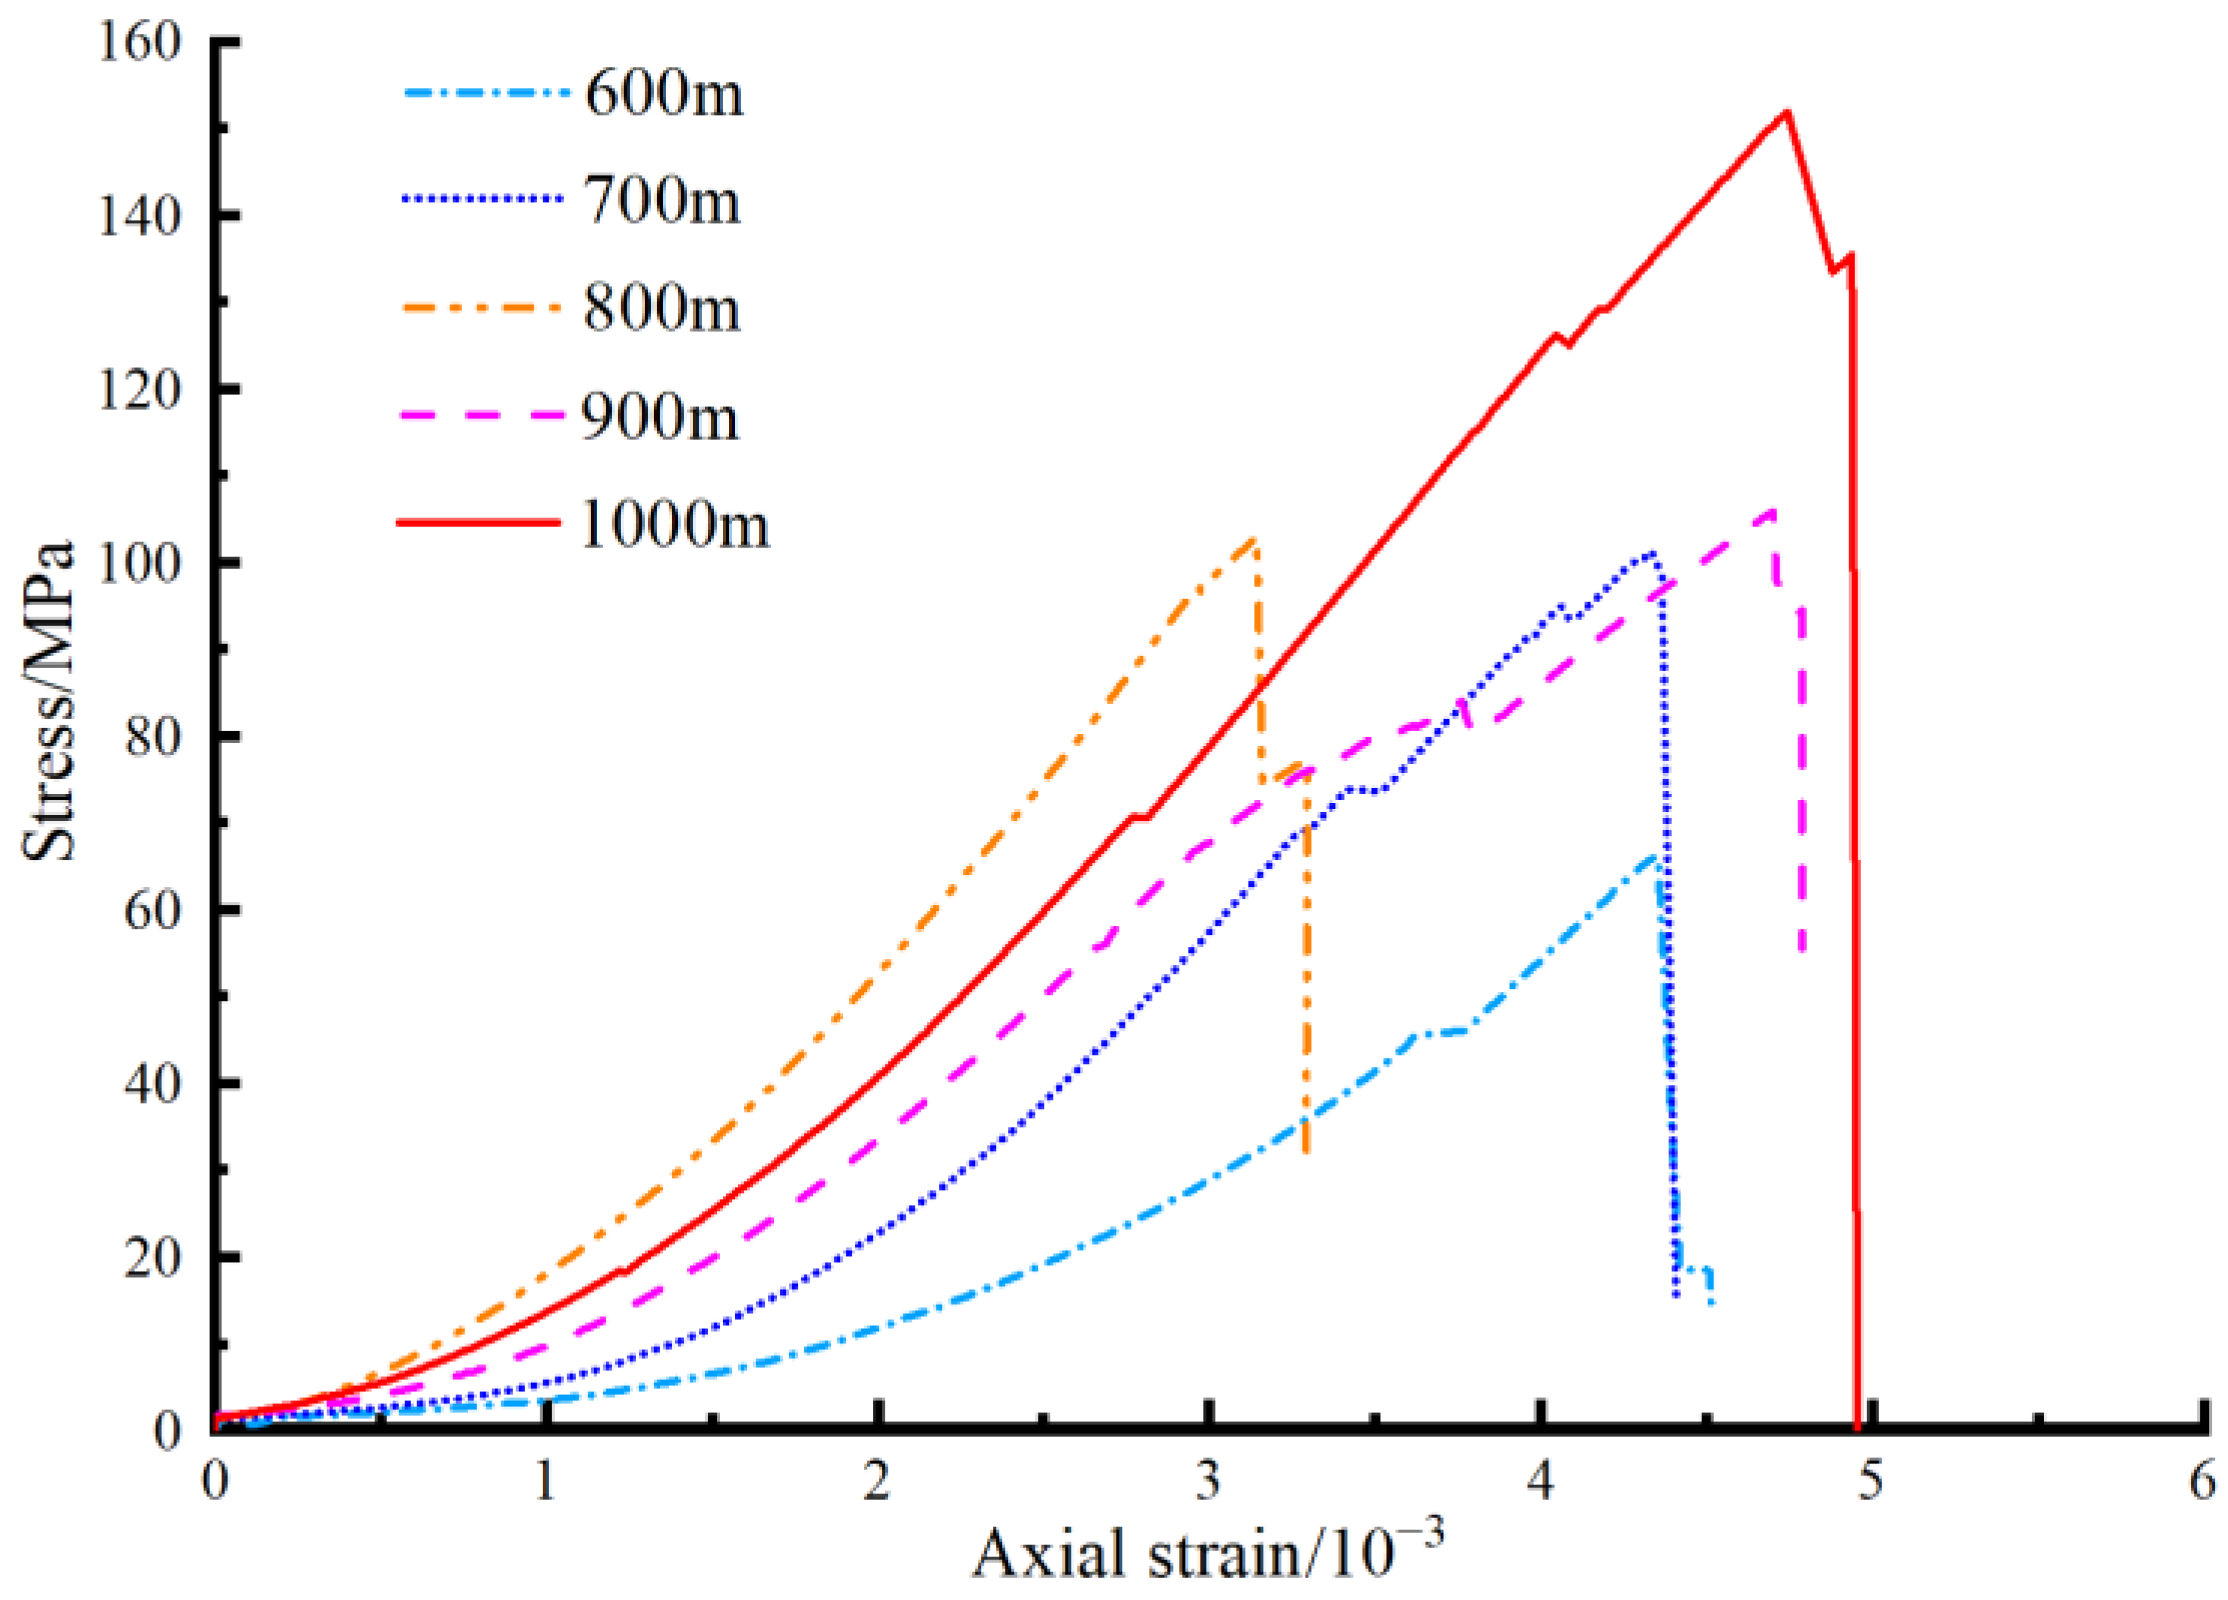
  • The deeper the rock is buried, the smaller the porosity, the greater the density, the denser the rock is and the greater the uniaxial compressive strength is. Based on the elastic energy index criterion, the deformation brittleness index criterion and the linear elastic energy criterion, the rockburst tendency of the limestone with different burial depths is analyzed, and it is concluded that the rockburst tendency increases with the increase in the burial depth. Specifically, limestone with a burial depth of 600 m does not have a rockburst tendency, while the limestone with a burial depth of 700 and 800 m, 900 m and 1000 m have a weak, medium and strong rockburst tendency, respectively.
  • Under the uniaxial stress state, the AE event rate and ring count have similar changing trends, and the energy shows a sharp growth after a quiet period. With the increase in the rockburst tendency, the change characteristics of the AE event rate and ring count tend to be consistent with the energy. The less lower the AE event rate is, the longer the quiet period of the energy is and the smaller the interval of the first and last growths of the AE energy is. For the limestone with a strong rockburst tendency, the AE energy increases suddenly only before the peak stress.
  • The normalization of the AE characteristic parameters can be used to calculate the damage of the limestone. The damage process of the limestone represented by the AE events and ring count shows progressive evolution characteristics, and the damage represented by the energy shows stepped evolution characteristics. The damage represented by the energy can not only reflect the energy storage process of the rockburst incubation, but it also reflects the instantaneity and intensity of the rockburst damage.
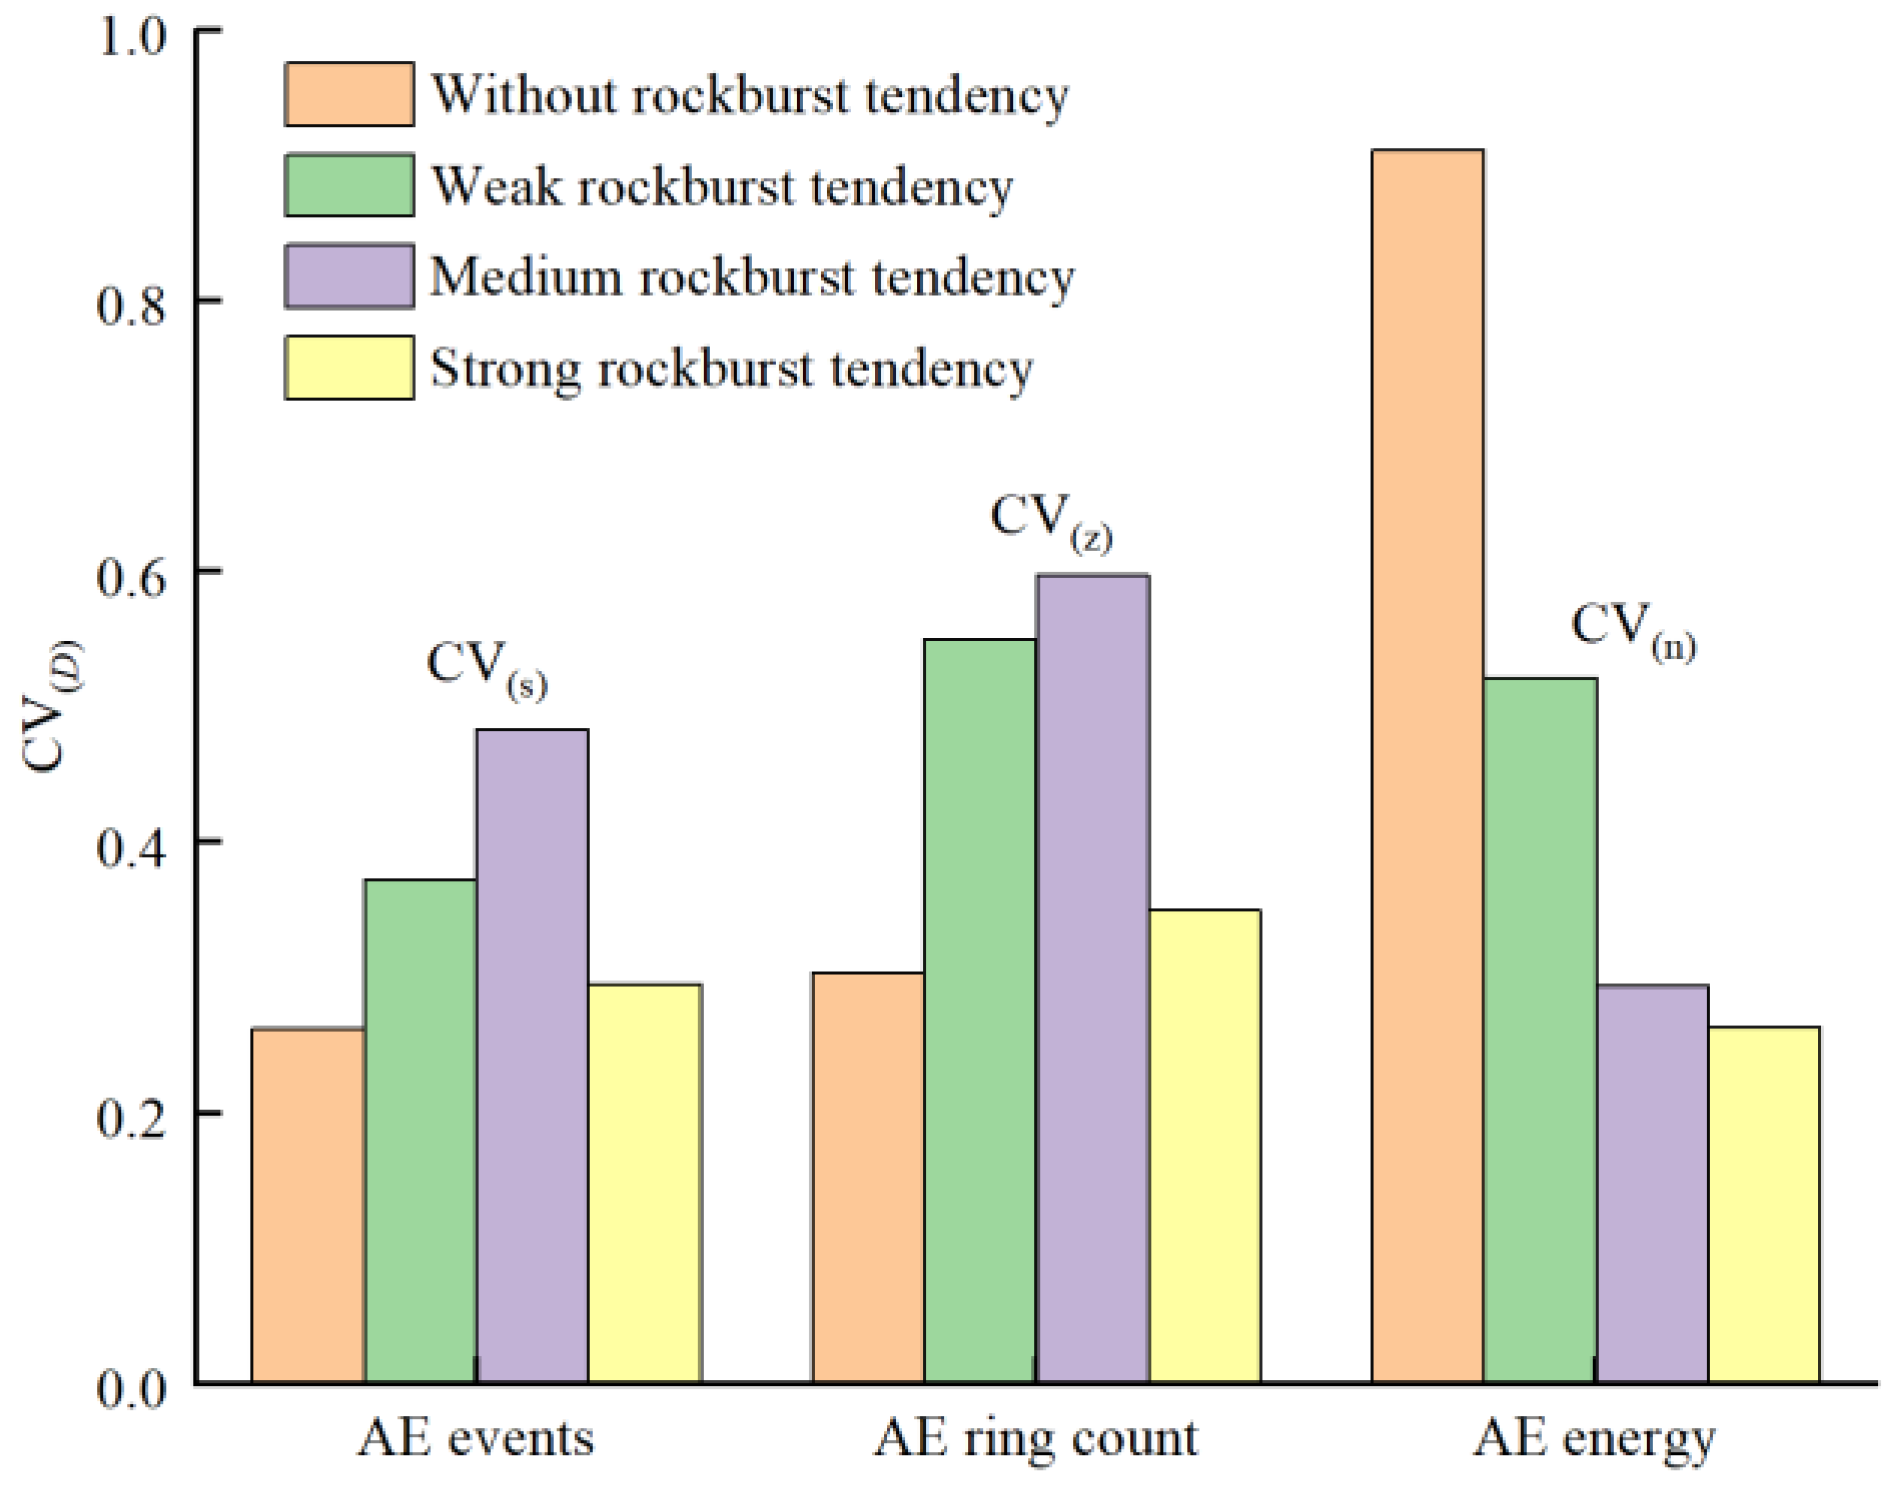
  • The fluctuation in the fractal dimension D of the AE energy is more gentle with the increase in the rockburst tendency, and the variation coefficient CV of the mathematical-statistical index is used for the verification. It reflects the energy storage characteristics of rock with a rockburst tendency in the loading process, which is consistent with the failure mechanism of the rockburst. Therefore, the AE energy is more reasonable in characterizing the damage process of rocks with a stronger rockburst tendency.

Author Contributions

Conceptualization, H.Z. and Q.C.; methodology, H.Z. and Q.C.; software, H.Z.; validation, H.Z. and Q.Z.; formal analysis, Q.C. and X.W.; investigation, X.W. and Q.Z.; resources, K.Z.; data curation, H.Z.; writing—original draft preparation, H.Z.; writing—review and editing, H.Z.; visualization, X.W.; supervision, Q.C.; project administration, X.W.; funding acquisition, X.W. All authors have read and agreed to the published version of the manuscript.

Funding

This research was funded by Young Jinggang Scholars Award Program in Jiangxi Province (No. QNJG2018051), and Jiangxi Province “Double Thousand Plan” scientific and technological innovation high-end talents project (No. jxsq2019201043).

Data Availability Statement

Not applicable.

Conflicts of Interest

The authors declare no conflict of interest.

References

  1. He, M.-C.; Xie, H.-P.; Peng, S.-P.; Jiang, Y.-D. Study on Rock Mechanics in Deep Mining Engineering. Chin. J. Rock Mech. Eng. 2005, 24, 2803–2813. [Google Scholar]
  2. Nierobisz, A. Investigation of mine roadway support load during seismic events. J. Min. Sci. 2012, 48, 298–307. [Google Scholar] [CrossRef]
  3. Wasilewski, S. Gas-Dynamic Phenomena Caused by Rock Mass Tremors and Rock Bursts. Int. J. Min. Sci. Technol. 2020, 30, 413–420. [Google Scholar] [CrossRef]
  4. Browning, J.; Meredith, P.G.; Stuart, C.E.; Healy, D.; Harland, S.; Mitchell, T.M. Acoustic Characterization of Crack Damage Evolution in Sandstone Deformed under Conventional and True Triaxial Loading. J. Geophys. Res. Solid Earth 2017, 122, 4395–4412. [Google Scholar] [CrossRef] [Green Version]
  5. Yang, J.; Zhao, K.; Song, Y.; Wang, Q.; Zhao, K.; Ji, Y. Damage Evolution Laws of Low-Strength Molybdenum Ore Under Uniaxial Compression. Nat. Resour. Res. 2022, 31, 1189–1202. [Google Scholar] [CrossRef]
  6. Fan, P.; Wang, M.; Li, W. Rockburst and the Storage, Dissipation and Transform of Energy in Rock. In Proceedings of the 2nd National Engineering Safety and protection Academic Conference, Beijing, China, 14 August 2010; Volume II, pp. 280–286. [Google Scholar]
  7. Shkuratnik, V.L.; Kravchenko, O.S.; Filimonov, Y.L. Acoustic Emission of Rock Salt at Different Uniaxial Strain Rates and Under Temperature. J. Appl. Mech. Tech. Phys. 2020, 61, 479–485. [Google Scholar] [CrossRef]
  8. Aker, E.; Kühn, D.; Vavryčuk, V.; Soldal, M.; Oye, V. Experimental Investigation of Acoustic Emissions and Their Moment Tensors in Rock during Failure. Int. J. Rock Mech. Min. Sci. 2014, 70, 286–295. [Google Scholar] [CrossRef]
  9. Liu, J.P.; Wang, R.; Lei, G.; Si, Y.T.; Li, Y.H. Studies of Stress and Displacement Distribution and the Evolution Law during Rock Failure Process Based on Acoustic Emission and Microseismic Monitoring. Int. J. Rock Mech. Min. Sci. 2020, 132, 104384. [Google Scholar] [CrossRef]
  10. Wang, J.; Zhang, C.; Fu, J.; Song, W.; Zhang, Y. The Energy Dissipation Mechanism and Damage Constitutive Model of Roof–CPB–Floor (RCF) Layered Composite Materials. Minerals 2022, 12, 419. [Google Scholar] [CrossRef]
  11. Hou, Z.; Xiao, F.; Liu, G.; Bashkov, O.V.; Lyu, L. Mechanical Properties and Acoustic Emission Characteristics of Unloading Instability of Sandstone under High Stress. Minerals 2022, 12, 722. [Google Scholar] [CrossRef]
  12. Zhao, K.; Wu, W.; Zeng, P.; Gong, C. Study on the Characteristics of Acoustic Emission Quiet Period in Rocks with Different Elastic Modulus. Minerals 2022, 12, 956. [Google Scholar] [CrossRef]
  13. Přikryl, R.; Lokajíček, T.; Li, C.; Rudajev, V. Acoustic Emission Characteristics and Failure of Uniaxially Stressed Granitic Rocks: The Effect of Rock Fabric. Rock Mech. Rock Eng. 2003, 36, 255–270. [Google Scholar] [CrossRef]
  14. Kim, J.S.; Lee, K.S.; Cho, W.J.; Choi, H.J.; Cho, G.C. A Comparative Evaluation of Stress–Strain and Acoustic Emission Methods for Quantitative Damage Assessments of Brittle Rock. Rock Mech. Rock Eng. 2015, 48, 495–508. [Google Scholar] [CrossRef]
  15. Lee, J.W.; Oh, T.M.; Kim, H.; Kim, M.; SONG, K. Analysis of acoustic emission parameters according to failure of rock specimens. J. Korean Tunn. Undergr. Space Assoc. 2019, 21, 657–673. [Google Scholar]
  16. Kim, J.S.; Kim, G.Y.; Baik, M.H.; Finsterle, S.; Cho, G.C. A new approach for quantitative damage assessment of in-situ rock mass by acoustic emission. Geomech. Eng. 2019, 18, 11–20. [Google Scholar]
  17. Ganne, P.; Vervoort, A.; Wevers, M. Quantification of pre-peak brittle damage: Correlation between acoustic emission and observed micro-fracturing. Int. J. Rock Mech. Min. Sci. 2007, 44, 720–729. [Google Scholar] [CrossRef]
  18. Rodríguez, P.; Arab, P.B.; Celestino, T.B. Characterization of Rock Cracking Patterns in Diametral Compression Tests by Acoustic Emission and Petrographic Analysis. Int. J. Rock Mech. Min. Sci. 2016, 83, 73–85. [Google Scholar] [CrossRef]
  19. Tian, Y.; Yu, R.; Zhang, Y.; Zhao, X. Research on Damage Evolution of Deep Formation Rock Based on Acoustic Emission Test. Int. J. Damage Mech. 2021, 30, 145–159. [Google Scholar] [CrossRef]
  20. Xue, J.; Wang, S.; Yang, Q.; Du, Y.; Hou, Z. Study on Damage Characteristics of Deep Coal Based on Loading Rate Effect. Minerals 2022, 12, 402. [Google Scholar] [CrossRef]
  21. Girard, L.; Beutel, J.; Gruber, S.; Hunziker, J.; Lim, R.; Weber, S. A custom acoustic emission monitoring system for harsh environments: Application to freezing-induced damage in alpine rock walls. Geosci. Instrum. Methods Data Syst. 2012, 1, 155–167. [Google Scholar] [CrossRef] [Green Version]
  22. Moradian, Z.A.; Ballivy, G.; Rivard, P. Correlating acoustic emission sources with damaged zones during direct shear test of rock joints. Can. Geotech. J. 2012, 49, 710–718. [Google Scholar] [CrossRef]
  23. Zhang, Z.; Li, S.; Wang, E.; Liu, X.; Zhang, Y. Research on the Damage Evolution Characteristics of Coal Based on Cluster Analysis of Temporal-Spatial Dimension of Acoustic Emission Events. Yanshilixue Yu Gongcheng Xuebao/Chin. J. Rock Mech. Eng. 2020, 39, 3338–3347. [Google Scholar]
  24. Miao, S.J. Analysis and Prevention Technology of Rock Burst Tendency in Deep Hard Rock Mining; Metallurgical Industry Press: BeiJing, China, 2016. [Google Scholar]
  25. Zeng, Q. Analysis of Acoustic Emission Parameters of Limestone with Different Rock Burst Tendencies and Research on Fracture Characteristics. Master’s Thesis, Jiangxi University of Science and Technology, Ganzhou, China, 2021. [Google Scholar]
  26. Wang, X.; Zhang, H.; Chen, Q.; Zeng, Q.; Liu, J. Acoustic Emission Characteristics and Damage Model of Limestone Loading with Different Rockburst Tendencies. Chin. J. Rock Mech. Eng. 2022, 41, 1373–1383. [Google Scholar]
  27. Martin, C.D. The progressive fracture of Lac du Bonnet granite. Int. J. Rock Mech. Min. Sci. Geomech. Abstr. 1994, 31, 643–659. [Google Scholar] [CrossRef]
  28. Ishida, T.; Kanagawa, T.; Kanaori, Y. Source Distribution of Acoustic Emissions during an In-Situ Direct Shear Test: Im-plications for an Analog Model of Seismogenic Faulting in an Inhomogeneous Rock Mass. Eng. Geol. 2010, 110, 66–76. [Google Scholar] [CrossRef]
  29. Jiang, Z.; Li, Q.; Hu, Q.; Liang, Y.; Xu, Y.; Liu, L.; Wu, X.; Li, X.; Wang, X.; Hu, L.; et al. Acoustic Emission Characteristics in Hydraulic Fracturing of Stratified Rocks: A Laboratory Study. Powder Technol. 2020, 371, 267–276. [Google Scholar] [CrossRef]
  30. Oh, T.M.; Kim, M.K.; Lee, J.W.; Kim, H.; Kim, M.J. Experimental Investigation on Effective Distances of Acoustic Emission in Concrete Structures. Appl. Sci. 2020, 10, 6051. [Google Scholar] [CrossRef]
  31. Munoz-Ibanez, A.; Delgado-Martin, J.; Grande-Garcia, E. Acoustic emission processes occurring during high-pressure sand compaction. Geophys. Prospect. 2019, 67, 761–783. [Google Scholar] [CrossRef]
  32. Ospitia, N.; Hardy, A.; Si Larbi, A.; Aggelis, D.G.; Tsangouri, E. Size Effect on the Acoustic Emission Behavior of Textile-Reinforced Cement Composites. Appl. Sci. 2021, 11, 5425. [Google Scholar] [CrossRef]
  33. Yang, J.; Mu, Z.L.; Yang, S.Q. Experimental Study of Acoustic Emission Multi-Parameter Information Characterizing Rock Crack Development. Eng. Fract. Mech. 2020, 232, 107045. [Google Scholar] [CrossRef]
  34. Wu, Y.; Peng, K.; Zou, Q.; Long, K.; Wang, Y. Tensile Properties and Damage Evolution Laws of Granite After High- and Low-Temperature Cycles. Nat. Resour. Res. 2022, 31, 1289–1306. [Google Scholar] [CrossRef]
  35. Tang, C.; Xu, X. Evolution and propagation of material defects and kaiser effect function. J. Seismol. Res. 1990, 13, 203–213. [Google Scholar]
  36. Maystrel, D.; Rossi, J.P. Implementation of a Rigorous Vector Theory of Speckle for Two-Dimensional Microrough Surfaces. J. Opt. Soc. Am. A 1986, 3, 1276–1282. [Google Scholar] [CrossRef]
  37. Sun, H.; Liu, X.L.; Zhu, J.B. Correlational fractal characterisation of stress and acoustic emission during coal and rock failure under multilevel dynamic loading. Int. J. Rock Mech. Min. Sci. 2019, 117, 1–10. [Google Scholar] [CrossRef]
  38. Grassberger, P.; Procaccia, I. Characterization of Strange Attractors. Phys. Rev. Lett. 1983, 50, 346–349. [Google Scholar] [CrossRef]
  39. Ji, H. Research and Application of Acoustic Emission Performance of Concrete Materials; China Coal Industry Publishing House: Beijing, China, 2004. [Google Scholar]
  40. Du, X.; Xue, J.; Ma, Q.; Chen, Z.; Zhan, K. Energy Evolution Characteristics of Coal–Rock Composite Bodies Based on Unidirectional Load. Nat. Resour. Res. 2022, 31, 1647–1663. [Google Scholar] [CrossRef]
  41. Zhang, W.Q.; Mu, C.M.; Xu, D.K.; Li, Z.Q. Energy Action Mechanism of Coal and Gas Outburst Induced by Rockburst. Shock Vib. 2021, 2021, 5553914. [Google Scholar] [CrossRef]
  42. Gong, F.Q.; Ni, Y.X.; Ren, L. Effects of Loading Rate on Rockburst Proneness of Granite from Energy Storage and Surplus Perspectives. Rock Mech. Rock Eng. 2022, 55, 6495–6516. [Google Scholar] [CrossRef]
Figure 1. Schematic diagram of the limestone rock sampling.
Minerals 12 01423 g001
Figure 2. Schematic diagram of AE test system for rock samples.
Minerals 12 01423 g002
Figure 3. Stress–strain curves of the limestone with different burial depths.
Minerals 12 01423 g003
Figure 4. Division of rock characteristic stress stages.
Minerals 12 01423 g004
Figure 5. Variation features of AE characteristic parameters of the limestone at different stress stages. (a) The limestone without a rockburst tendency; (b) the limestone with a weak rockburst tendency; (c) the limestone with a medium rockburst tendency; and (d) the limestone with a strong rockburst tendency.
Minerals 12 01423 g005aMinerals 12 01423 g005b
Figure 6. Damage changes represented by different AE parameters of the limestone. (a) The limestone without a rockburst tendency; (b) the limestone with a weak rockburst tendency; (c) the limestone with a medium rockburst tendency; and (d) the limestone with a strong rockburst tendency.
Minerals 12 01423 g006
Figure 7. Relation curve of phase space dimension m and correlation dimension D.
Minerals 12 01423 g007
Figure 8. Double logarithmic relationship of AE events of the limestone. (a) The limestone without a rockburst tendency; (b) the limestone with a weak rockburst tendency; (c) the limestone with a medium rockburst tendency; and (d) the limestone with a strong rockburst tendency.
Minerals 12 01423 g008
Figure 9. Double logarithmic relationship of AE ring count of the limestone. (a) The limestone without a rockburst tendency; (b) the limestone with a weak rockburst tendency; (c) the limestone with a medium rockburst tendency; and (d) the limestone with a strong rockburst tendency.
Minerals 12 01423 g009
Figure 10. Double logarithmic relationship of AE energy of the limestone. (a) The limestone without a rockburst tendency; (b) the limestone with a weak rockburst tendency; (c) the limestone with a medium rockburst tendency; and (d) the limestone with a strong rockburst tendency.
Minerals 12 01423 g010aMinerals 12 01423 g010b
Figure 11. Fractal dimension values of AE parameters of the limestone with different rockburst tendencies. (a) Fractal dimension value of AE events; (b) fractal dimension value of AE ring count; and (c) fractal dimension value of AE energy.
Minerals 12 01423 g011aMinerals 12 01423 g011b
Figure 12. Comparison of fractal dimension fluctuation of AE parameters.
Minerals 12 01423 g012
Table 1. Physical and mechanical parameters.
Depth/mElastic Modulus/GPaUniaxial Compressive Strength/MPaPorosity/%
60024.0970.801.148
70040.52104.181.096
80040.68116.031.111
90040.83116.950.940
100045.39130.930.919
Table 2. Rockburst tendency based on elastic energy index [25,26].
Depth/mΦE/MJΦV/MJWETRockburst Tendency
60084.36462.2121.356None
60055.91250.4411.108None
70054.04224.1122.241Weak
70088.14543.1412.043Weak
80085.67837.1242.308Weak
80095.85435.2402.436Weak
90096.48825.4833.786Medium
900162.31441.2583.910Medium
1000161.22431.3565.193Strong
1000324.21663.9105.35Strong
Table 3. Rockburst tendency based on deformation brittleness index [25,26].
Depth/mTotal Deformation/10−3Permanent Deformation/10−3Deformation Brittleness Index/KεRockburst Tendency
6007.824.321.81None
4.651.852.43Weak
7003.350.903.72Weak
6.452.452.63Weak
8005.081.643.10Weak
6.001.484.05Weak
9005.071.024.97Weak
6.441.016.38Medium
10004.080.429.71Strong
5.130.816.33Medium
Table 4. Rockburst tendency based on linear elastic energy [25,26].
Depth/mAverage Unloading Tangent Modulus/GPaLinear Elastic Property/kJ/m3Rockburst Tendency
60048.05469.963Weak
70046.831115.471Medium
80045.899141.202Medium
90038.584175.879Medium
100038.223222.774Strong
Table 5. Rockburst tendencies based on multiple criteria [25,26].
Depth/mRockburst Tendency Criterion
Elastic Energy IndexDeformation Brittleness IndexLinear Elastic PropertyComprehensive Rockburst Tendency
600NoneNoneWeak None
700WeakWeakWeakWeak
800WeakWeakMedium Weak
900MediumMediumMedium Medium
1000StrongStrongStrong Strong
Table 6. Calculation results of variation coefficients.
Variation CoefficientsLimestone with Different Rockburst Tendencies
None WeakMediumStrong
CV(s)0.2630.3720.483 0.296
CV(z)0.3030.5500.5970.349
CV(n)0.9110.5210.294 0.263
Publisher’s Note: MDPI stays neutral with regard to jurisdictional claims in published maps and institutional affiliations.

