
Study on Macro-Meso Deformation Law and Acoustic Emission Characteristics of Granular Gangue under Different Loading Rates
1
State Key Laboratory of Coal Resources and Safe Mining, School of Mines, China University of Mining & Technology, Xuzhou 221116, China
2
Inner Mongolia Power Coal Industry Co., Ltd., Ordos 017100, China
3
Hebei Key Laboratory of Mechanical Reliability of Heavy Equipment and Large Structures, Yanshan University, Qinhuangdao 066004, China
*
Author to whom correspondence should be addressed.
Minerals 2022, 12(11), 1422; https://doi.org/10.3390/min12111422
Submission received: 23 August 2022
/
Revised: 5 November 2022
/
Accepted: 8 November 2022
/
Published: 9 November 2022
(This article belongs to the Special Issue Solid-Filling Technology in Coal Mining)
Abstract
:Bulk gangue is a common backfill material in solid backfill mining. After backfilling into the goaf, bulk gangue serves as the main body to bear the load of overlying strata, and its deformation resistance is the key factor affecting the backfill quality. In this study, the laterally confined compression test of broken gangue was designed, the compaction deformation characteristics of gangue specimens under different loading rates were studied, the acoustic emission (AE) energy characteristics of gangue specimens under compression were analyzed, and the relationship model between macroscopic deformation of broken gangue under compression and AE energy was established. The particle flow numerical software PFC2D was used to stimulate the particle breakage in the gangue compaction process, and the coal gangue particle model was established through particle cluster units. The particle force chain distribution and fracture evolution characteristics of gangue specimens in the compression process were studied, and the macroscopic deformation mechanism was revealed from the mesoscopic perspective. The results showed that: the porosity variation of the gangue specimen increases with the increase of loading rate; the porosity increases with the decrease in the strain, the porosity decreases with the increase in the stress, and the relationship between porosity and stress is monotonously decreasing. With the increase of loading rate, the AE signals produced by particle breakage become stronger, while the influence of the loading rate on the maximum strain, fragmentation and AE signal of the specimen is gradually weakened. Under different loading rates, the “instability-optimization” of the skeleton force chain structure of the gangue model and the crushing-recombination of cracks are the main reasons for the compaction deformation of gangue specimens at the early stage of loading. The research results are of great significance to reveal the deformation mechanism of coal gangue as backfill materials under compression.
1. Introduction
Solid backfill mining technology is an important means to solve the coal pressure problems of “mining under buildings, mining under railways, mining under water bodies” and achieve safe and environmental replacement of coal resources [1,2,3]. The gangue is widely used as backfill material, and its deformation characteristics under the loading effect of overburden directly affect the rock stability control effect [4,5]. Therefore, it is important to study the deformation characteristics of the coal gangue during load-bearing compression to improve the load-bearing capacity of the backfill body [6,7].
At present, research on the compression-deformation characteristics of gangue-filled materials has been widely conducted. Cheng, et al. investigated the stability of the unconfined backfill body and analyzed the influence of long-term stability strength and creep hardening coefficient on the stability [8]. Kesimal, et al. studied the changes in strain and energy of gangue specimens with different lithologies under compression [9]. Zhou, et al. developed a three-way loading system for gangue, analyzed the axial compression characteristics of the gangue backfill body with different graduations, and revealed the influence of different grain size graduations on the compression of backfill materials under compression [10]. Wu, et al. tested the deformation characteristics and energy dissipation law of gangue specimens under different grain sizes and initial loading stress conditions [11]. At the same time, numerical simulation was also used to study the deformation characteristics of the gangue backfill material in the compression process [12,13,14].
The subsidence rate of overlying strata greatly affects the bearing process of the gangue backfill in goaf. However, there are few studies on the influence of loading rate on the fragmentation and deformation characteristics of gangue. In this study, the acoustic emission (AE) system was introduced into the lateral limit compression test, the relationship model between the compression deformation and the AE energy of the crushed gangue was established, and the damage law of the gangue under different loading rates was analyzed from the perspective of mechanics and energy. Through the numerical model of the gangue particle flow, the distribution of particle force chain and fracture evolution characteristics of the gangue specimens under different loading rates were studied in the compression process, and the macroscopic deformation mechanism of the gangue samples was obtained from the mesoscopic perspective. The research results are of great significance to reveal the compression deformation mechanism of gangue-filled materials.
2. Experimental Design and the Establishment of Particle Flow Numerical Model
2.1. Material Preparation
The “digging gangue” taken from Datun Coal and Power (Group) was used in this experiment. The lithology of the gangue was sandstone, and the mineral composition was obtained by the gangue test. As shown in Table 1, the gangue specimen contains a high content of SiO2, which is the skeleton composition of the gangue. Moreover, gangue specimens also contain different contents of Al2O3 and CaO and other substances.
The graded sieve was used to screen gangue, and the following gangue specimens with grain size were obtained: 10–20 mm, 20–30 mm, 30–40 mm, 40–50 mm, and 50–60 mm, respectively. To reduce the impact of gangue particle size ratio on the testing effect, coal gangue specimens with a uniform gradation (continuous gradation) were made according to mass ratio, with the mass of each particle size gangue accounting for 20%.
2.2. Experiment Design
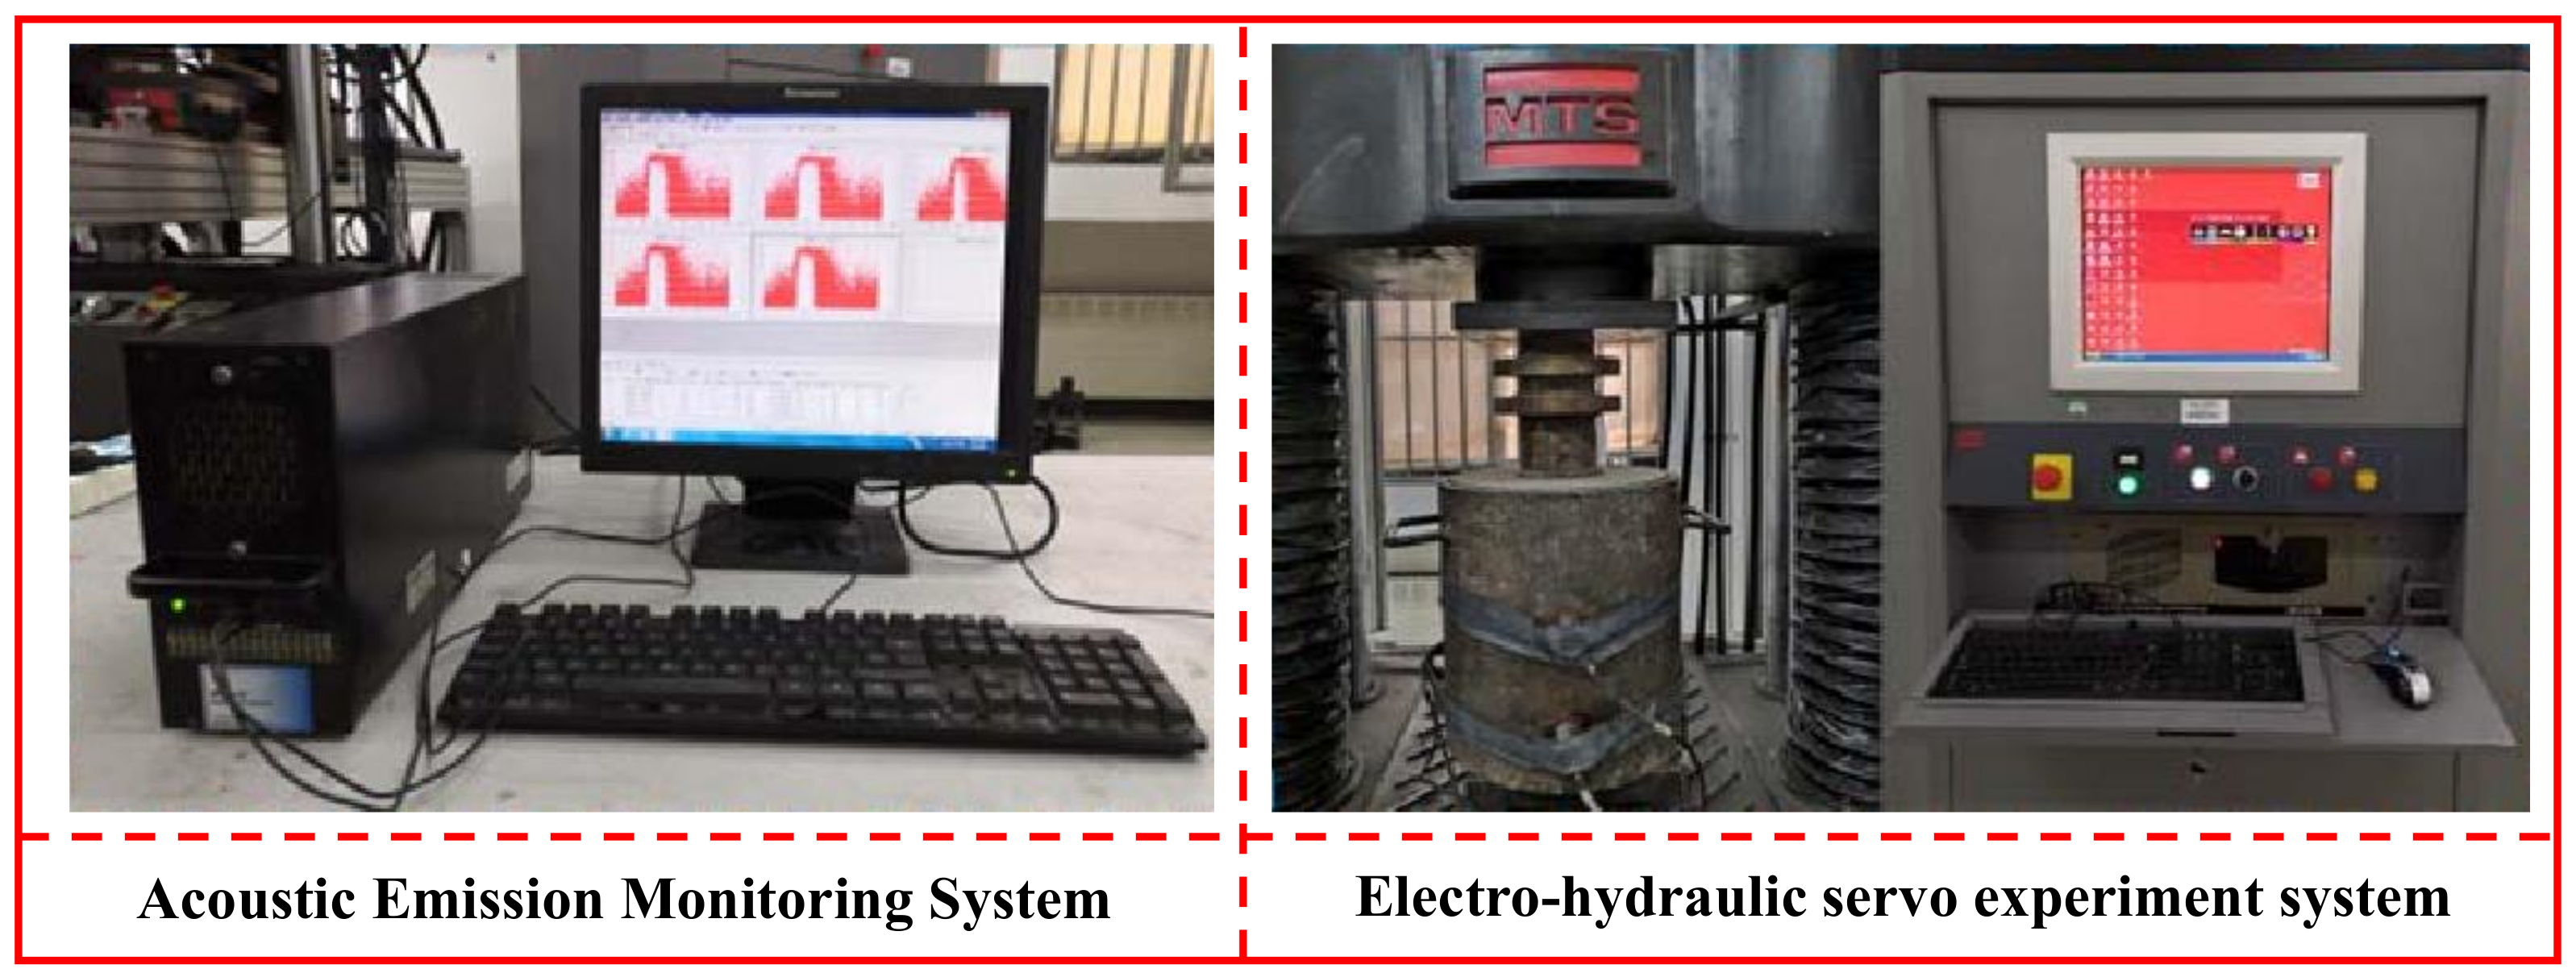
The loading control system and AE monitoring system were used for this experiment. The MTS815.02 rock triaxial servo test system was used as the loading control system. The PCI-2 AE test and analysis system produced by American Physical Acoustic Corporation (PAC) was used as the AE monitoring system, which can automatically record and store the AE parameters on the computer to realize the real-time monitoring and positioning of the AE. A steel cylinder with 270 mm depth, 250 mm inner diameter, and 230 mm loading height was used to hold the crushed gangue specimen. Six AE sensors were uniformly arranged from bottom to top of the steel container to receive AE signals to the computer. To ensure the coupling effect between AE sensors and the steel container, contact parts were coated with grease, squeezed to remove the air, and then fixed with tape so that it was tightly attached to the surface of the steel container. Figure 1 shows the whole experiment system.
In this experiment, the sampling frequency of the six channels of the AE test and analysis system was set as 5 MSPS (5 MHz), the gain of the preamplifier was set as 40 dB, the high-pass filter of the analog filter was 1 kHz, and the low-pass filter was 400 kHz. As acoustic emission signals were greatly affected by environmental noise, the fixed threshold value of 45 dB was set in this test after repeated debugging, which can basically shield environmental noise.
The stress-controlled loading type was used in this test. A total of six schemes were designed to research the AE characteristics of gangue specimen under different loading rates during the confined compression process. The loading rate was set as 0.25 kN/s, 0.5 kN/s, 1.0 kN/s, 1.5 kN/s, 2.0 kN/s, and 5.0 kN/s, respectively. When the axial stress reached 16 MPa, the system was terminated. The data of the load, deformation, AE signals, and other parameters during the test were collected and recorded automatically.
2.3. Construction of Particle Flow Numerical Model
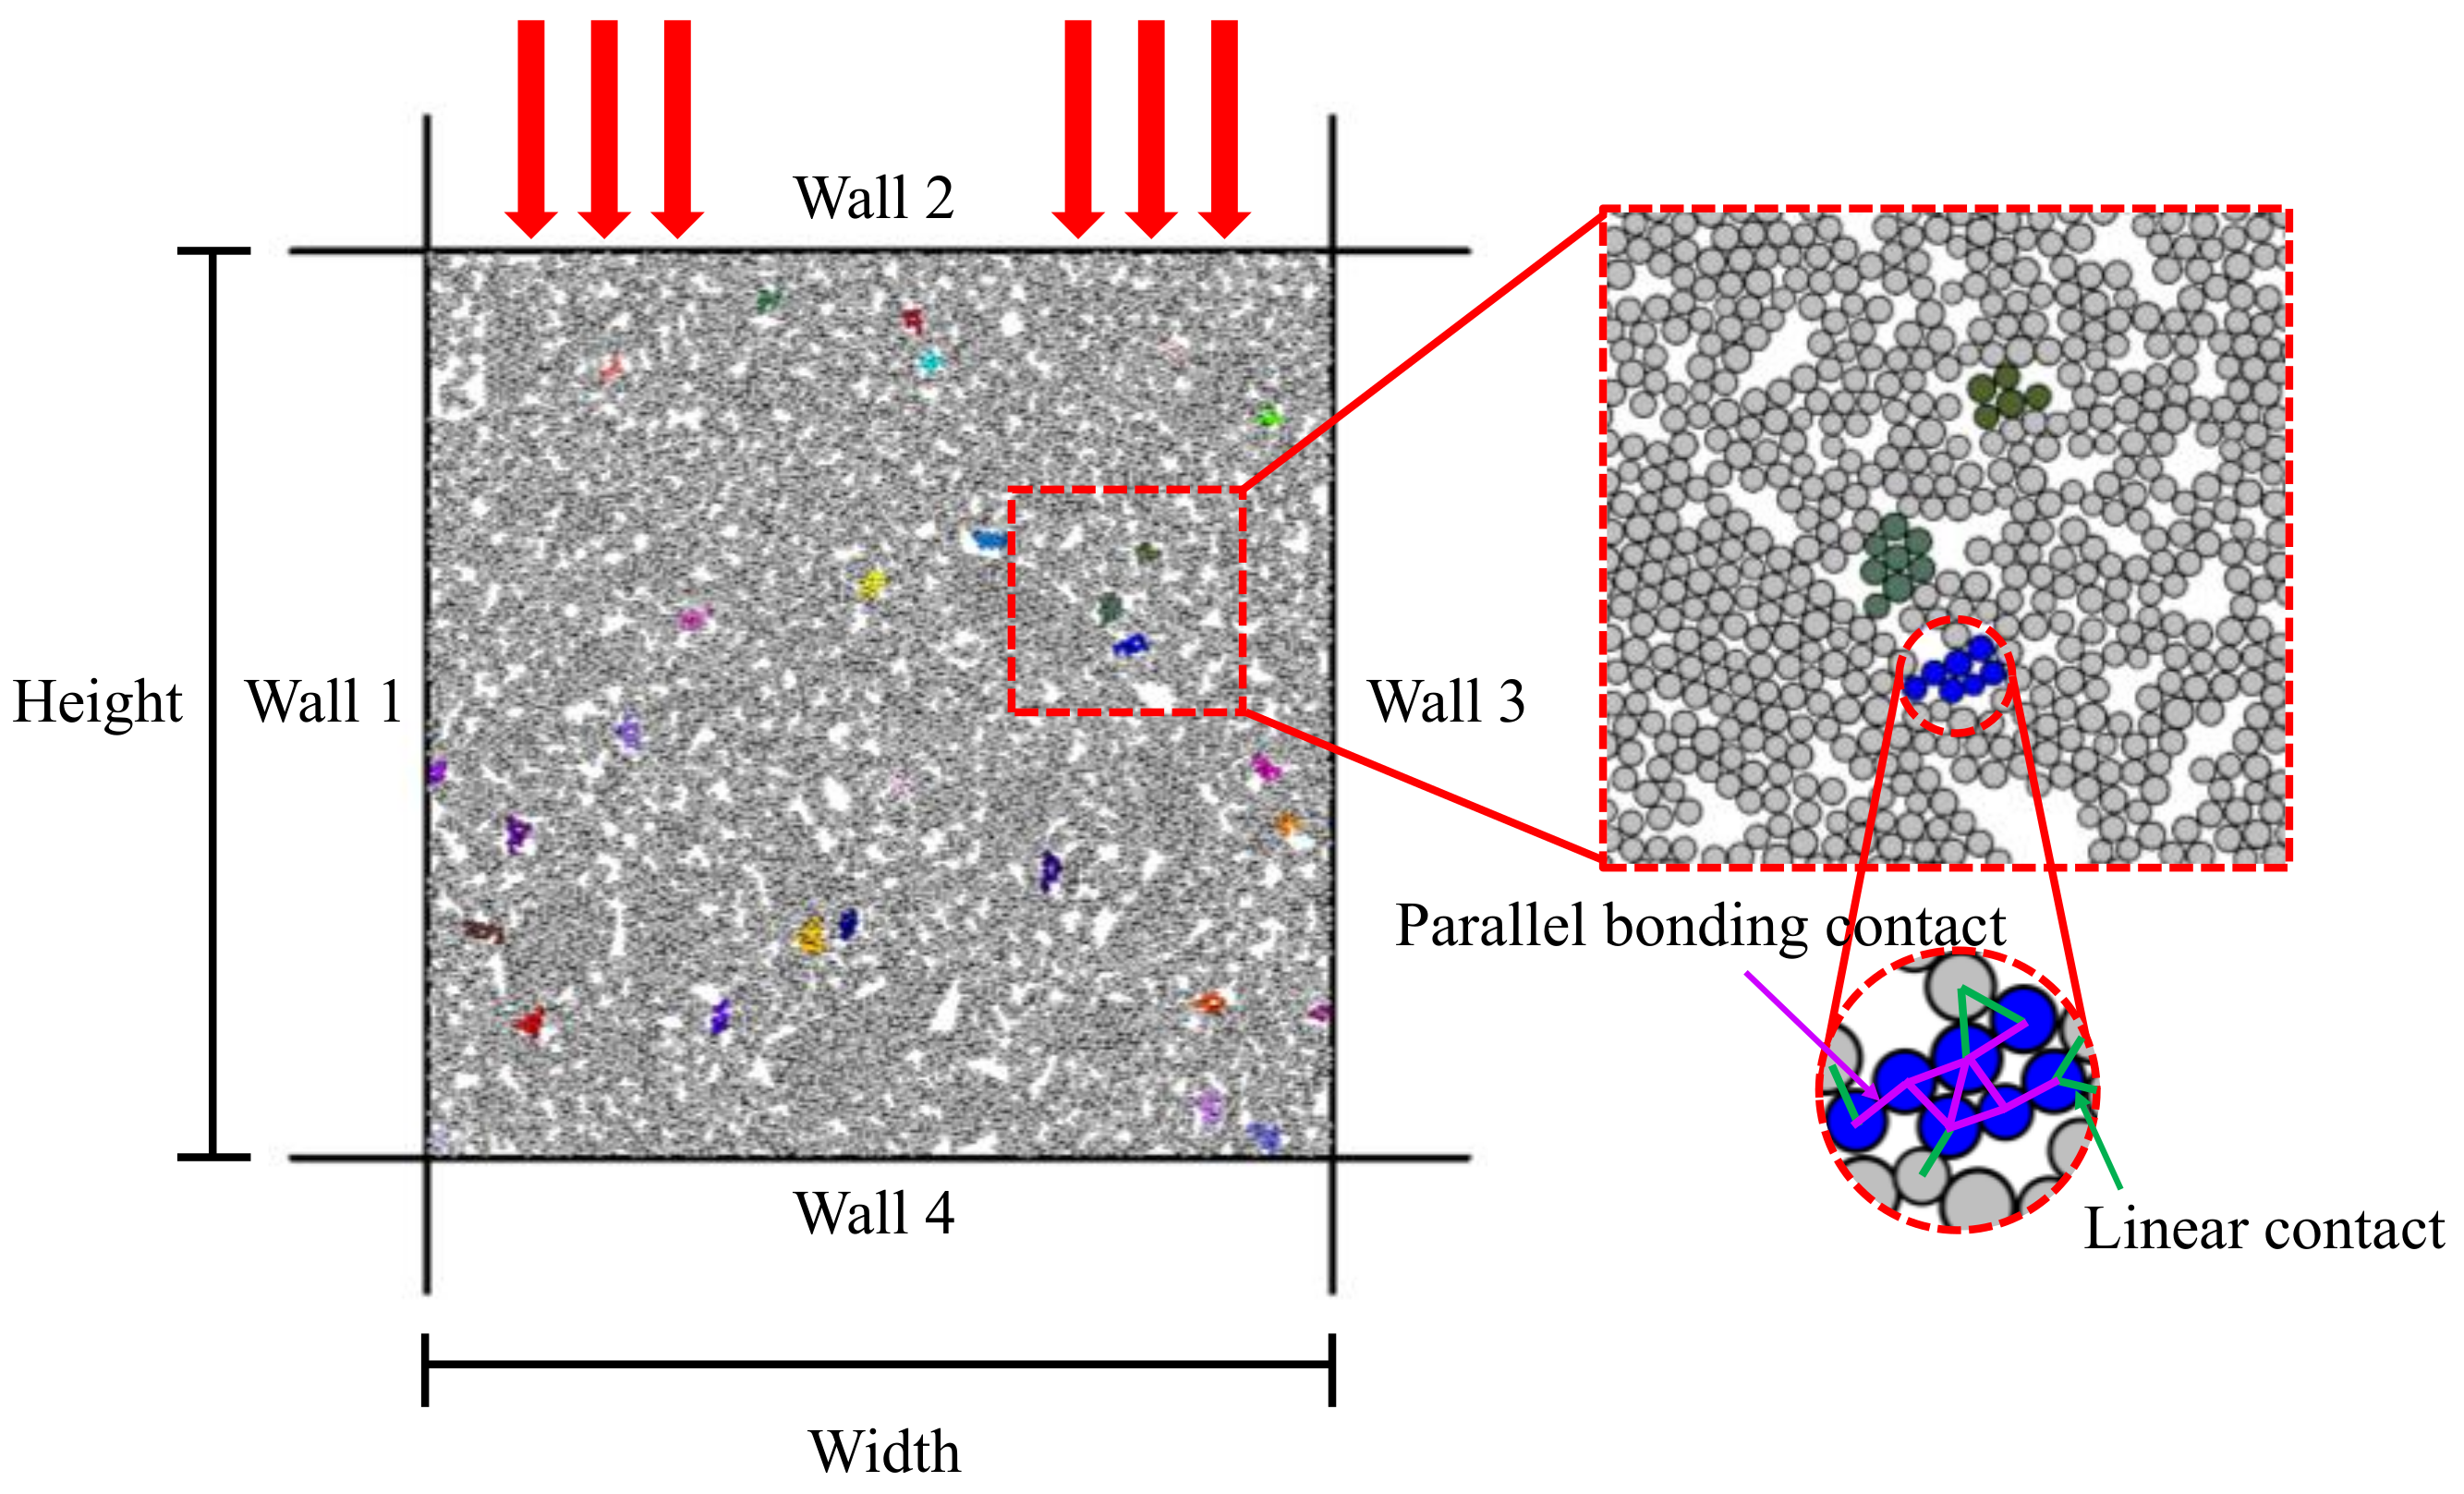
In this study, the particle flow numerical simulation software PFC2D was used for simulation. According to the actual size of the test steel cylinder, the wall was used to simulate the rigid compaction cylinder. In the boundary contour, the distribution command was used to fill the particles with a radius of 1.0 × 10⁻³. The particles inside the particle contour generated before were divided into groups, and the particles in the contour were not deleted [15,16,17]. The rigid cluster units with different gradations were obtained, as shown in Figure 2. At the same time, the flexible cluster particle flow model of broken gangue specimens was generated by the FISH function. In the simulation process, the wall stiffness was 1.0 × 10⁹ N/m, the wall friction coefficient was 0, and the particle density and porosity of the gangue specimen were 2800 kg/m and 0.3. The stress, strain, force chain, and fracture evolution during compaction were recorded in real time by the FISH function [18,19].
3. Result and Analysis
3.1. Confined Compression Deformation of Gangue at Different Loading Rates
- (1)
- Stress-strain relationship
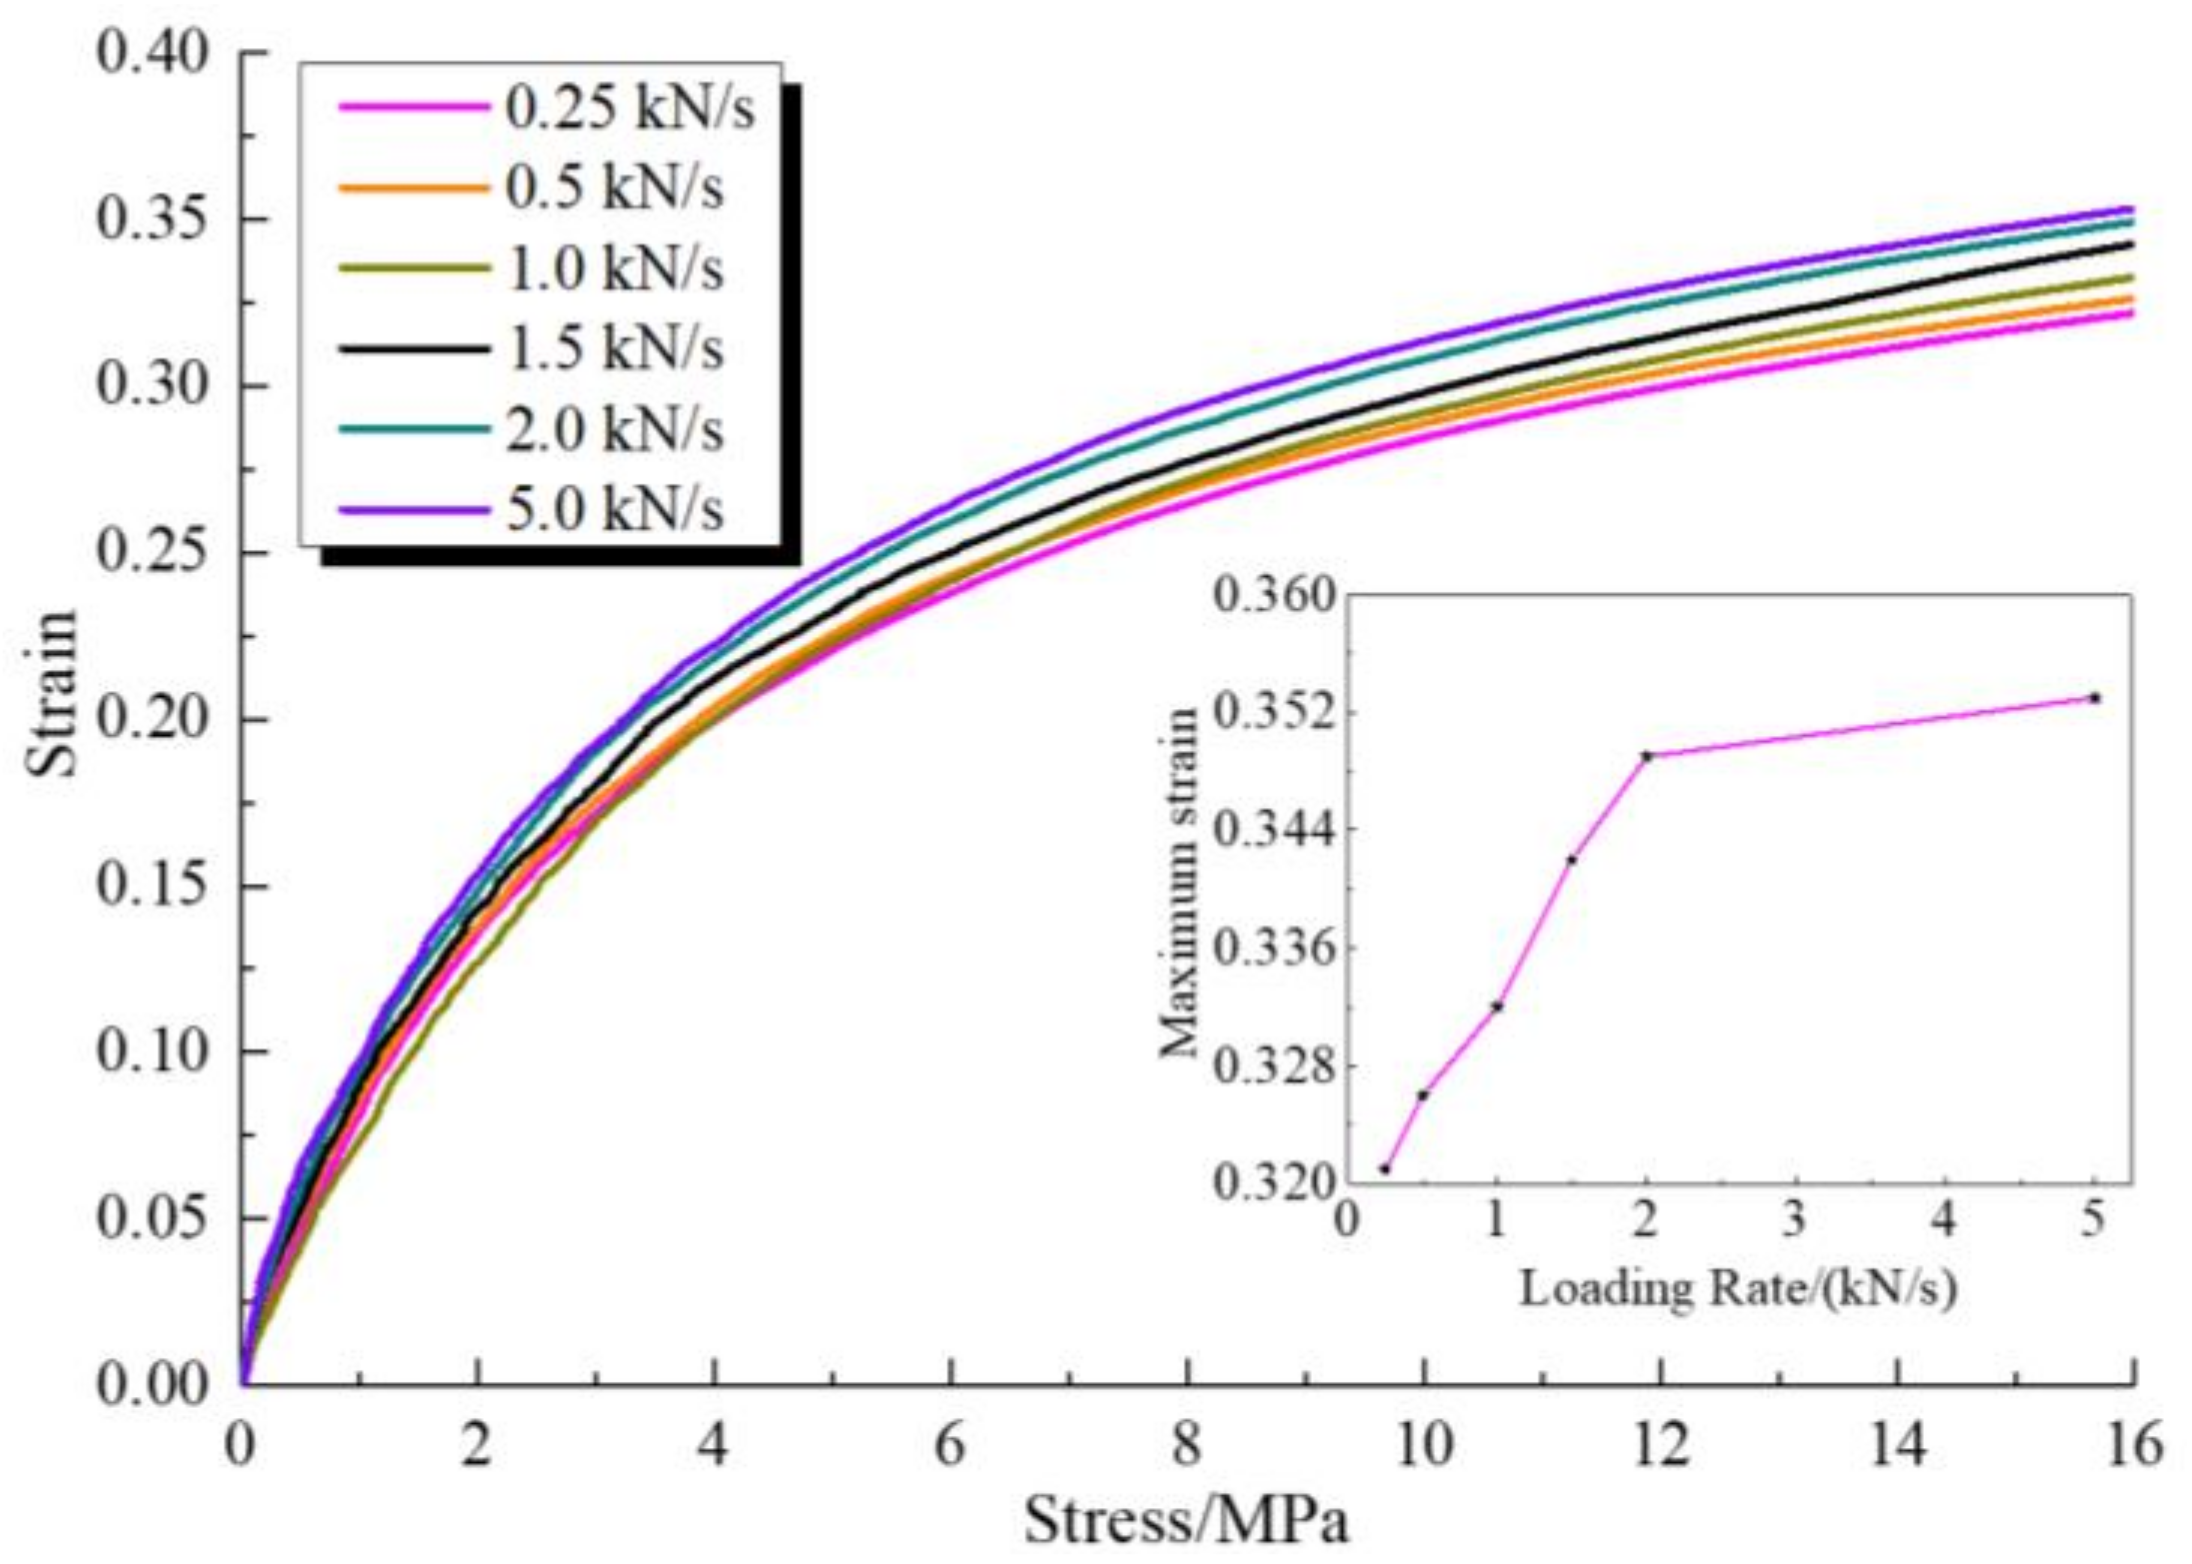
A total of six groups of confined compression tests were designed in this experiment. Each test was repeated three times, and the average value of the three tests was taken as the final test results. Figure 3 shows the stress–strain (σ-ε) curves of the coal gangue at different loading rates under the confined compression.
As shown in Figure 3, it can be found that
- (1)
- The overall trend of stress–strain curves of gangue specimens under six different loading rates is consistent. With the increase of stress, the strain presents three stages of fast growth, slow growth, and stable deformation. The growth rate of the strain is larger in the early loading stage, and the strain amount at this stage accounts for about 50% of the total strain. This is because the pores among gangue blocks are compacted in this stage, and the gangue block with large grain size is gradually broken. In the middle loading stage, the growth rate of the gangue strain decreases. At this stage, pores have been compacted, and the gangue deformation is mainly caused by fragmentation. In the later loading stage, the strain of the gangue remains stable. This is because the gangue cannot be broken, and has reached a relatively stable state.
- (2)
- The maximum strain of the gangue is directly proportional to the loading rate, that is, the greater the loading rate, the greater the maximum strain. With the increase of loading rate, the maximum strain of the gangue increases from 0.321 to 0.353, indicating that the loading rate has a great impact on the mechanical properties and deformation characteristics of crushed gangue. The main reason is that under the low loading rate, the gangue fragmentation and compaction process are relatively slow, and a stable bonding of the gangue can be formed. At this time, the gangue cannot be further broken. Under the high loading rate, pores between the gangue are quickly compacted, and then the gangue with large particle size is quickly broken. At this time, the gangue is incapable of forming a stable bonding state. Finally, the gangue is crushed and compacted again, leading to a further increase of the strain.
- (3)
- With the increase of loading rate, the maximum strain increases continuously. When the loading rate is greater than 2 kN/s, the growth rate of the strain decreases, indicating that 2 kN/s is the optimal loading rate under this condition. Therefore, when the backfill body is compacted, the optimal compacting force should be maintained at about 2 kN/s. Moreover, after the backfill body is backfilled into the goaf, the loading rate generated by the overlying surrounding rock is in a dynamic change under the disturbance of mining activities, which will have a greater impact on the bearing capacity of the backfill body. Consequently, the influence of mining activities should be minimized to reduce the disturbance to the backfill body.
- (2)
- Porosity–strain relationship
Gangue is a granular material with uniform particle size and irregular shapes [20,21,22]. The porosity K of the gangue can be expressed as follows:
where V is the apparent volume of the gangue in the loose state, mL; V0 is the absolute volume of the gangue in the absolute dense state, mL; r is the radius of the steel tube; h is the residual height of the gangue after compression, m is the mass of the gangue before and after compression; h0 is the initial backfill height of the gangue; is the strain in the compression process and the absolute density of the gangue.
As shown in Equation (1), when the mass and the inner diameter of the steel cylinder are constant, the porosity in the compression process decreases with the decrease of the residual height of gangue. At a given h0, the porosity decreases with the increase of strain. If ε = 0, the initial porosity is positively correlated with the initial backfill height.
- (3)
- Porosity-stress relationship
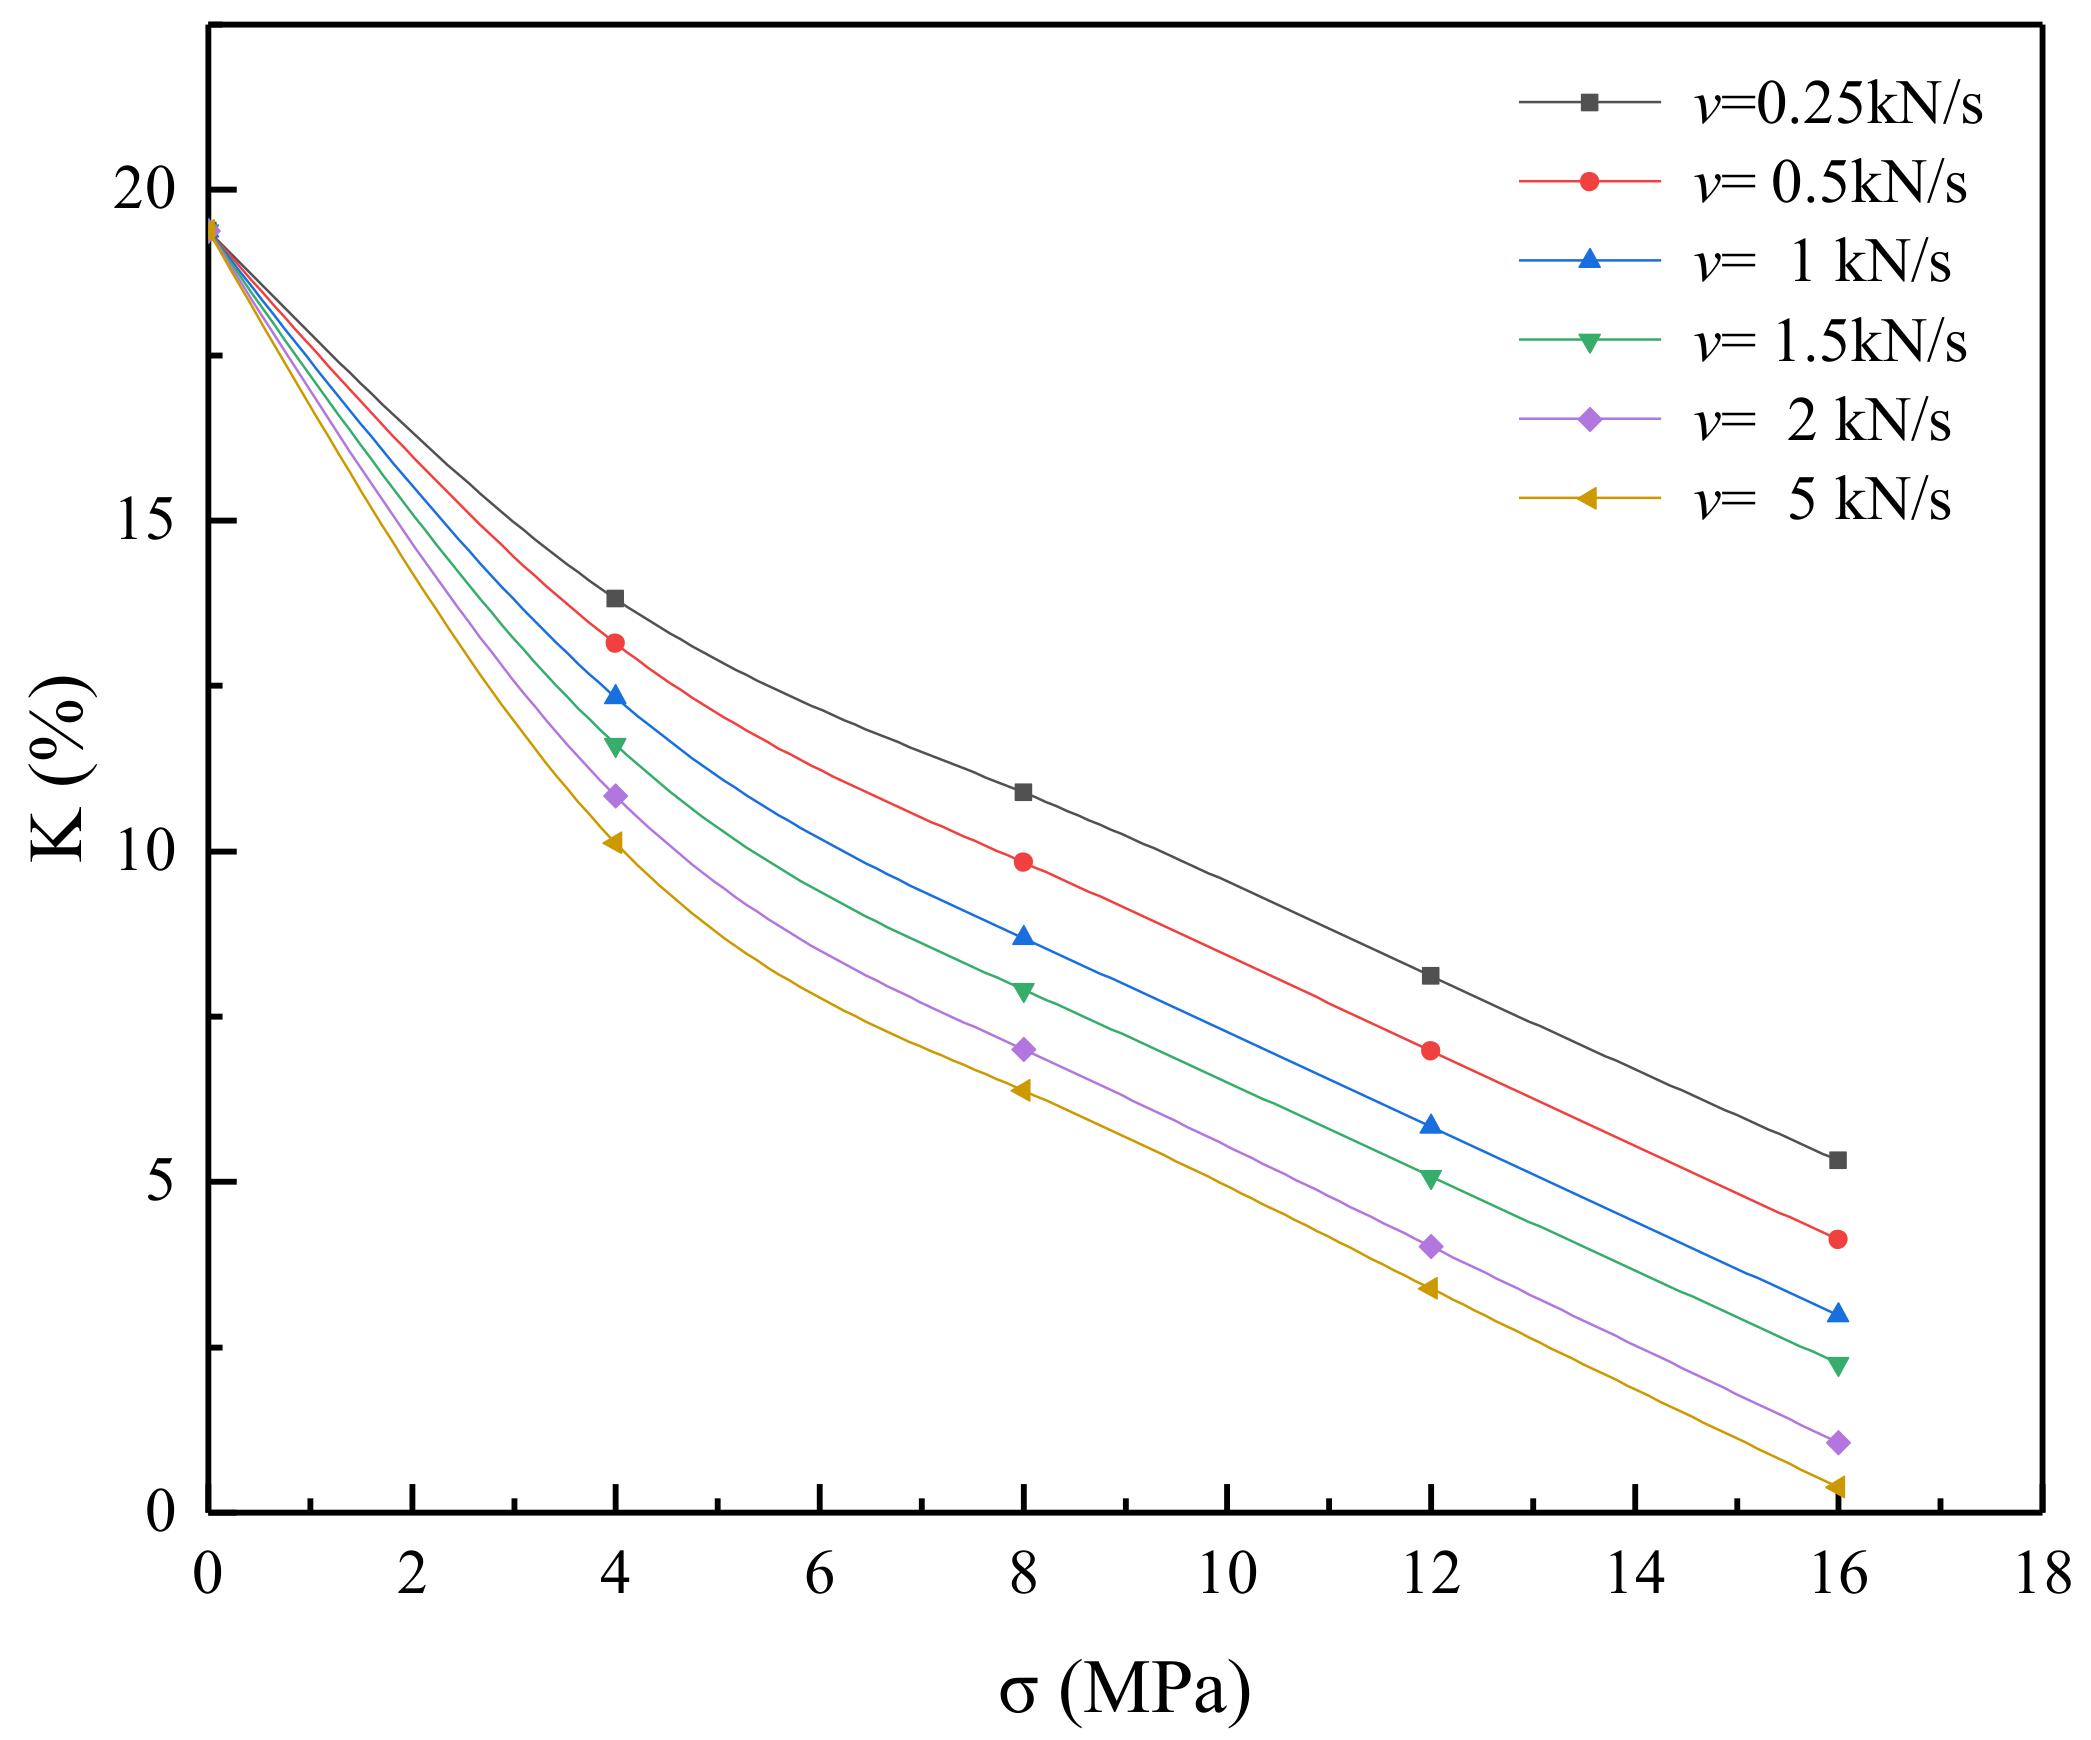
According to Equation (1), the porosity corresponding to different stresses is calculated. Figure 4 shows the variation of porosity with stress. It can be seen that with the increase of stress, the porosity decreases in different stages. Among them, the decline rate of porosity is the largest in the range of 0–4 MPa, followed by that between 4 and 8 MPa, and the slowest in the range of 8–16 MPa. This declining trend of porosity corresponds to the three stages of macro deformation of gangue specimens. As the gangue is in uniform gradation, the initial porosity is also the same. As the loading rate increases, the porosity decreases rapidly in each stress stage, indicating that the greater the loading rate, the greater the porosity change.
3.2. AE Energy Characteristics of Gangue at Different Loading Rates
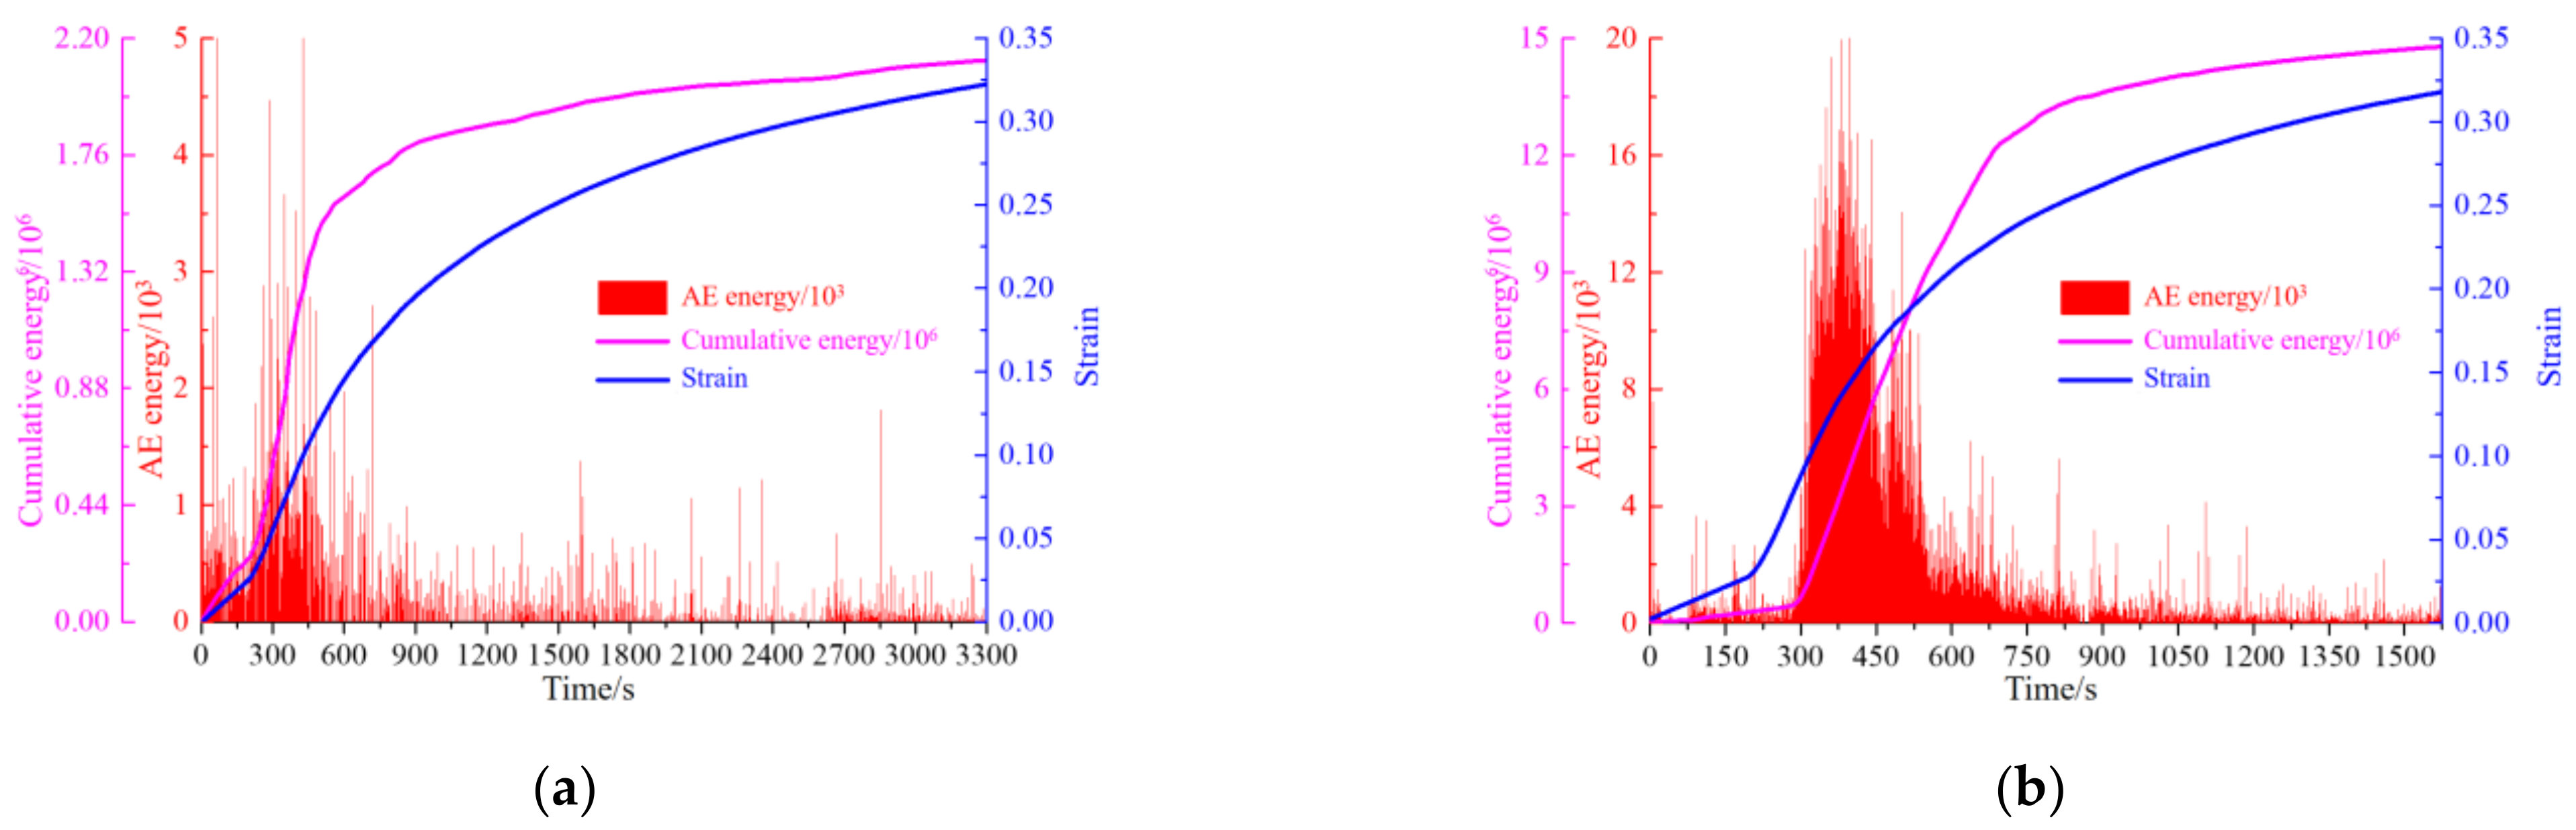
A large amount of friction and fragmentation can be generated in the loaded gangue, leading to the generation of acoustic emission (AE) signals during this process. AE technology can detect the acoustic emission signal generated by gangue under compression. Through analyzing the AE signal, the change of the internal state of gangue and the evolution of mechanical properties can be studied, and the failure mechanism of rock instability can be inverted, which has important guiding significance for engineering applications. AE energy can be obtained by the area enclosed by the acoustic signal envelope and time axis, which can reflect the relative energy and intensity of the event. By monitoring the AE energy, the change characteristics of gangue in different stages of compression can be studied, so as to reveal the deformation and fragmentation mechanism of gangue [23,24,25]. Figure 5 shows the strain, energy, and cumulative energy curves of the gangue at different loading rates under the confined compression.
As shown in Figure 5, it can be obtained that
- (1)
- The changing trend of the cumulative energy curves and strain curves are consistent. With the increase of loading rate, the cumulative AE energy of the gangue also increases. Through the AE monitoring technology, the dynamic monitoring of AE energy in the process of gangue fragmentation can reflect the damage process inside the specimen. It shows that AE energy can effectively characterize the mechanical properties of the gangue.
- (2)
- When the loading rate is less than 1.0 kN/s, the AE energy and strain curve of the specimen can be clearly divided into three stages: early loading stage, middle loading stage, and later loading stage. In the early loading stage (Stage 1), strain and AE energy increase slowly. This is because the pores between the gangues are compacted, and the gangues are not broken under the low loading rate, and AE energy mainly stems from the friction between the gangues. In the middle loading stage (Stage 2), the crushing of gangue results in the release of a large amount of energy, which increases the accumulated energy rapidly. Due to the low loading rate, a stable structure can be easily formed by the gangue. Thus, the duration of the AE signal is short. In the later loading stage (Stage 3), the AE signal intensity is low, and the accumulated energy gradually tends to be stable.
- (3)
- When the loading rate is more than 1.5 kN/s, the changing trend of AE signal energy at the early loading stage is the same as that under the low loading rate. However, at the middle loading stage, the gangue cannot adjust each other to form a stable carrier under the higher loading rate, some gangue is further crushed and accompanied by the energy release. This process lasts so long that the late stage of stress loading does not appear. The deformation process of gangue and the generation process of the AE phenomenon last for a long time, and the later loading stage (the accumulated AE energy tends to stable state) is not significant.
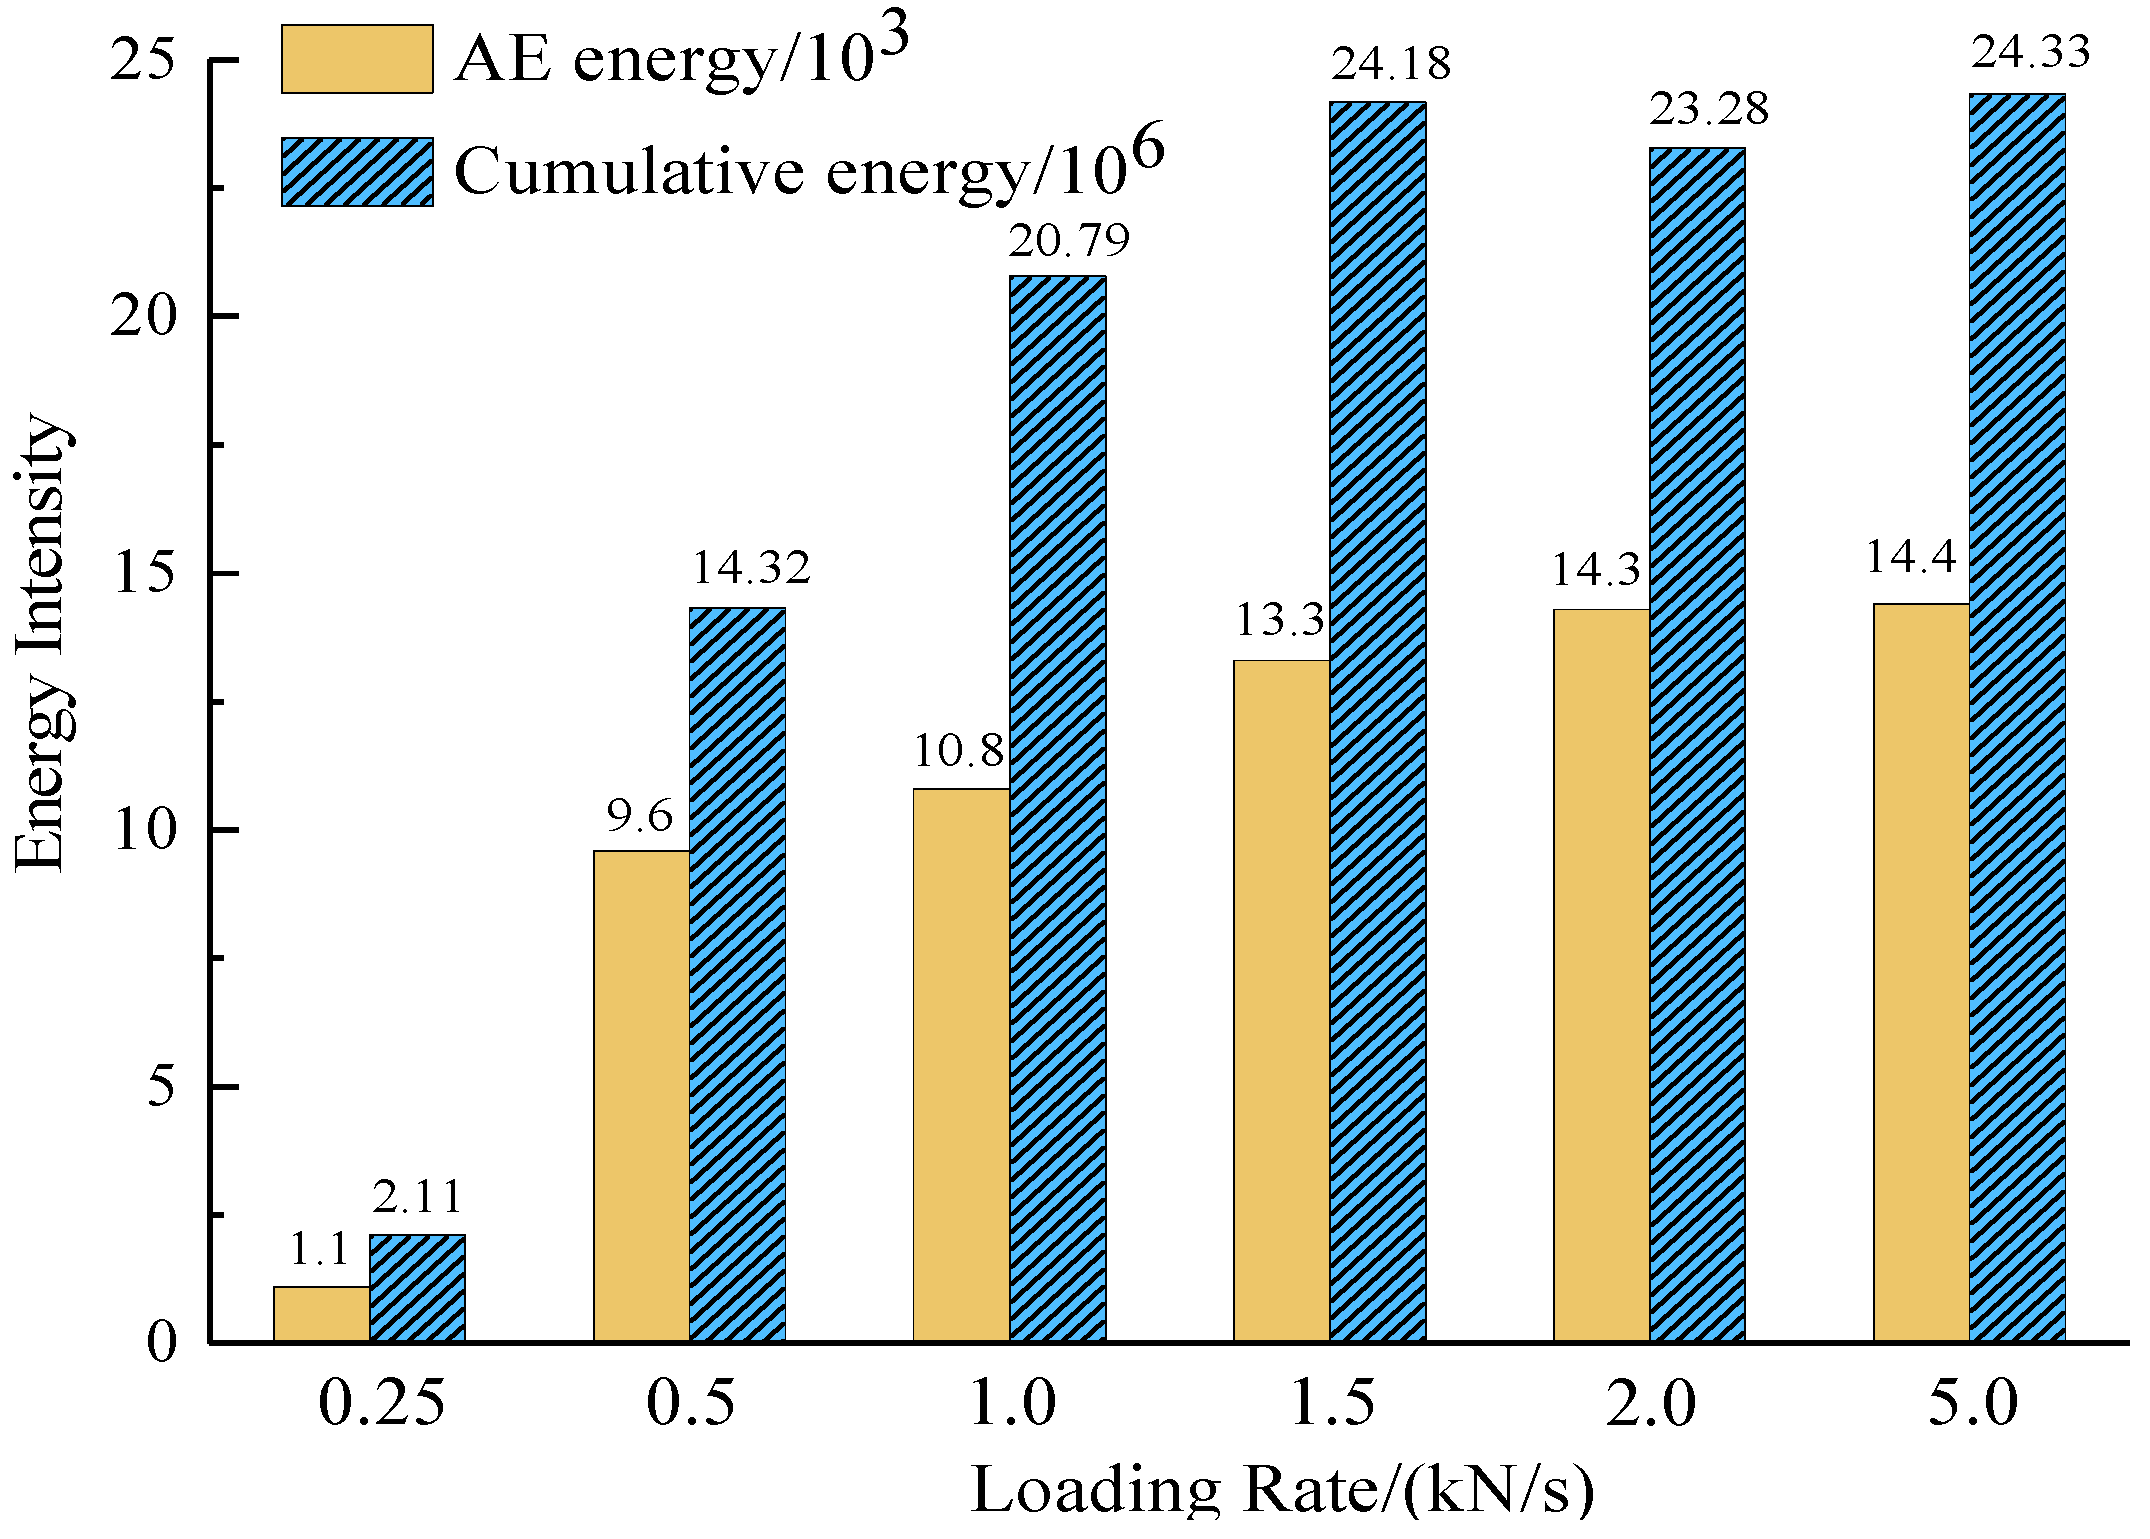
- (4)
- As shown in Figure 6, the maximum AE energy of gangue specimens under six different loading rates during the whole compaction process are 1.1 × 10³, 9.6 × 10³, 10.8 × 10³, 13.3 × 10³, 14.3 × 10³, and 14.4 × 10³, respectively. Meanwhile, the cumulative energy of gangue specimens are 2.11 × 10⁶, 14.32 × 10⁶, 20.79 × 10⁶, 24.18 × 10⁶, 23.28 × 10⁶, and 24.33 × 10⁶, respectively. It is found that under the low loading rate, the damage of the gangue is smoother and the energy cycle is short, and the cumulative energy is also smaller; under the high loading rate, the gangue is broken, and the compaction process is more violent and the energy cycle is longer, the accumulated energy is greater.
3.3. Relationship Model of Macroscopic Deformation and AE Energy at Different Loading Rates
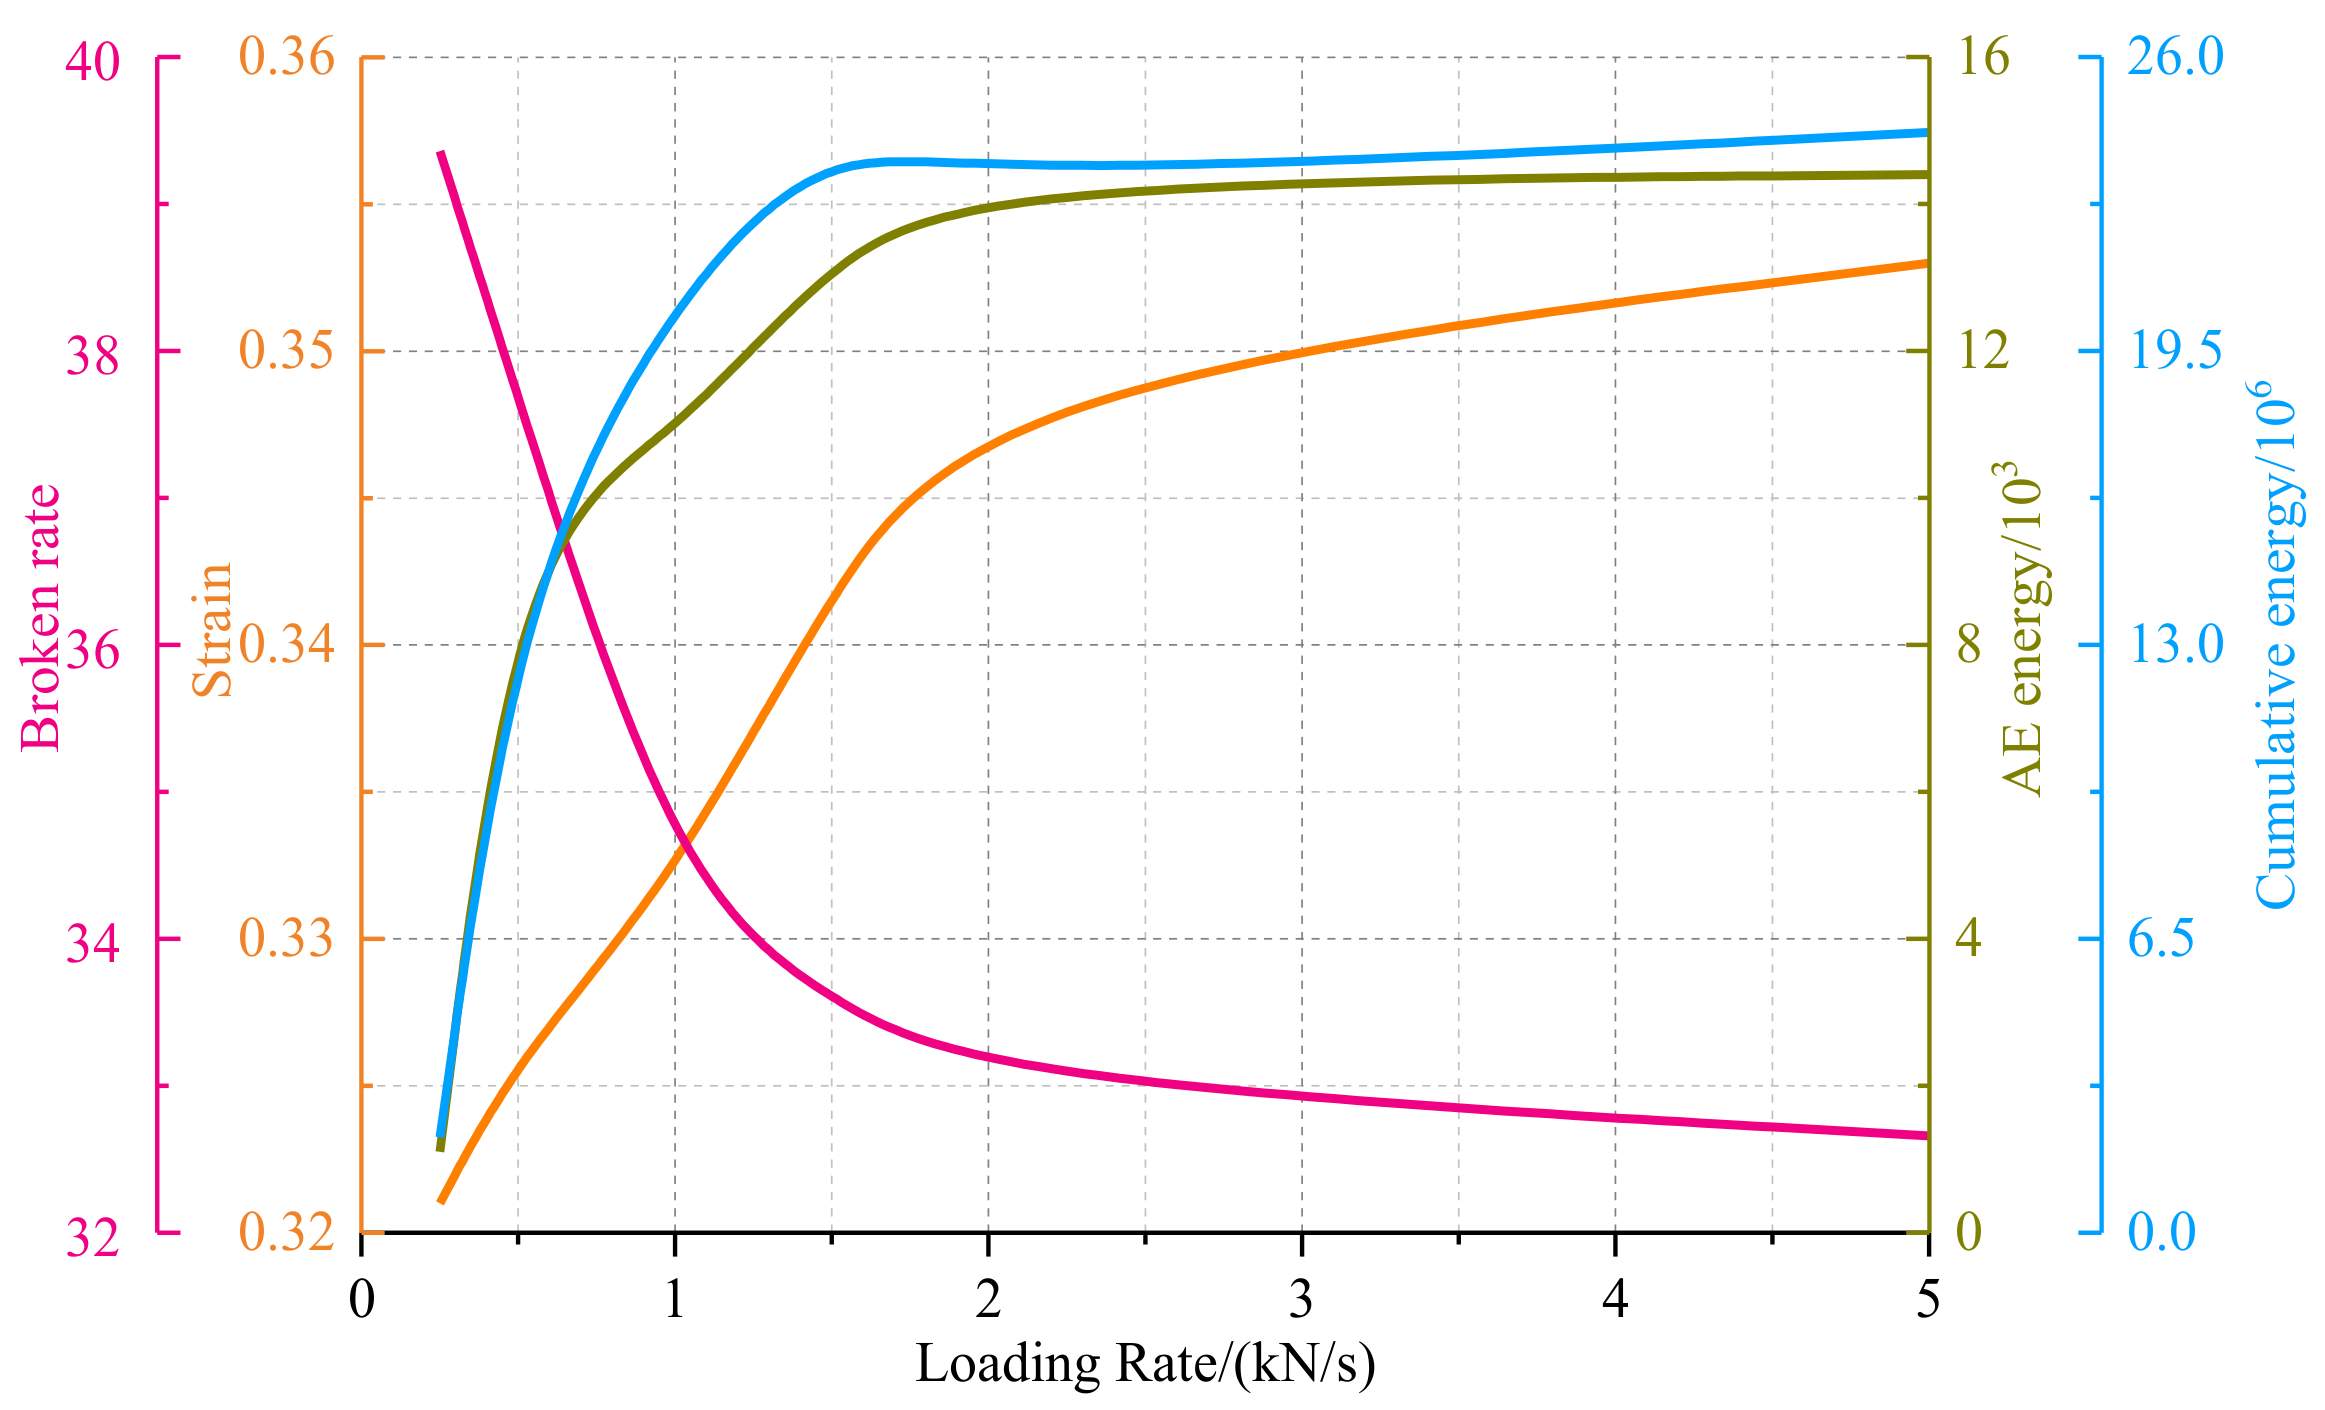
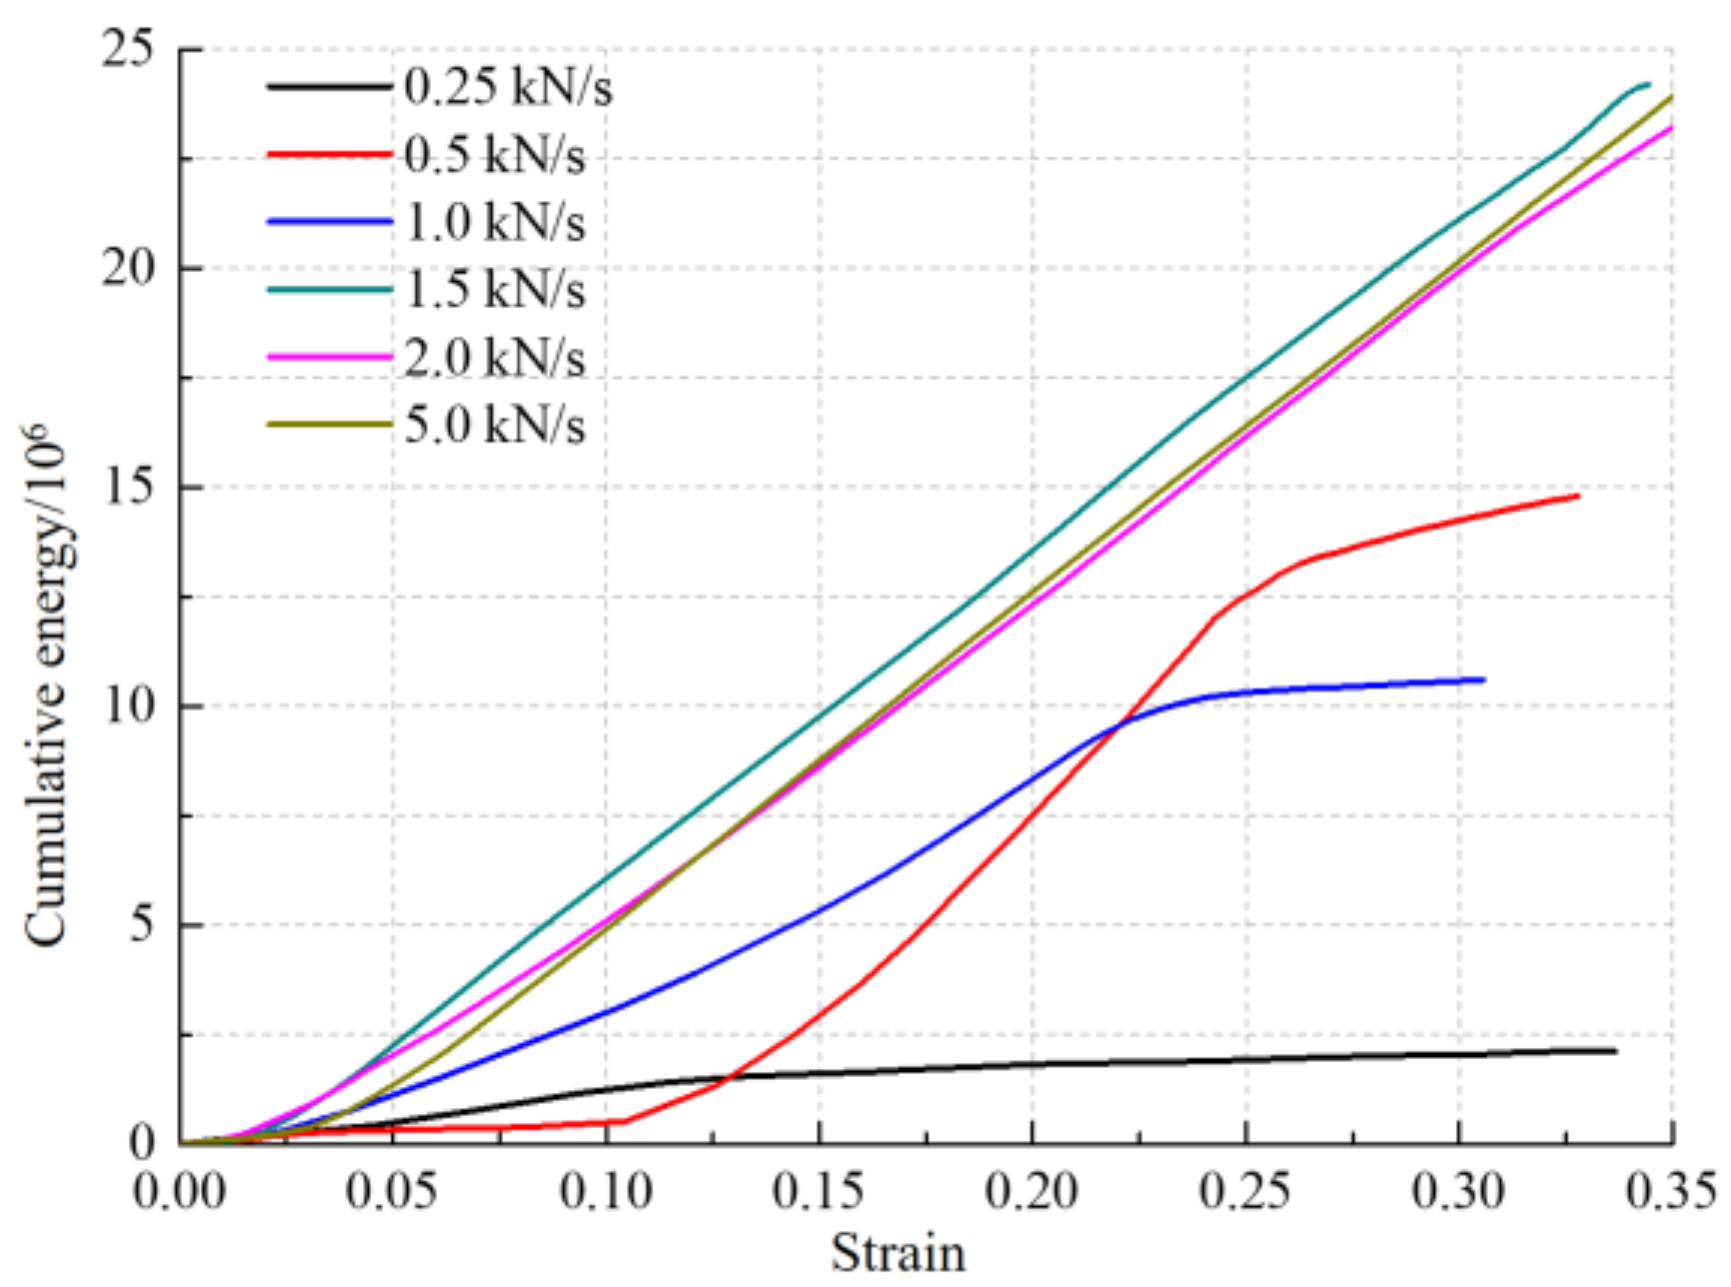
Through the loading control system and AE monitoring system, the maximum strain-fragmentation rate-AE energy-cumulative energy curve (Figure 7) and macroscopic deformation-cumulative energy curve (Figure 8) under different loading rates were obtained. Based on the macroscopic deformation-AE cumulative energy curve, the linear fitting model of macroscopic deformation and AE cumulative energy is established, as shown in Table 2.
From the above, it is concluded that:
- (1)
- The variation trend of maximum strain, maximum energy, and accumulated energy of gangue under different loading rates is consistent. With the increase of loading rate, the maximum strain, AE energy, and cumulative energy rapidly increase first and then become stable, but the fragmentation rate decreases. Other than that, when the loading rate is less than 1.5 kN/s, the change of the loading rate has a large impact on specimens; when the loading rate is more than 1.5 kN/s, the influence of the loading rate change on specimens is decreased.
- (2)
- At the low loading rate, the relationship between the macroscopic deformation and energy change of gangue shows three stages, and the linear correlation coefficients at different stages are higher than 0.96. However, at the high loading rate, the relationship between macroscopic deformation of the specimens and AE energy is mainly reflected in the first two stages while the third stage is not obvious. It implies that the macroscopic deformation of gangue specimens is closely related to the change of energy, so the fragmentation process of gangue can be analyzed through the change of AE energy.
3.4. Distribution Characteristics of Force Chain of Gangue Model under Different Loading Rates
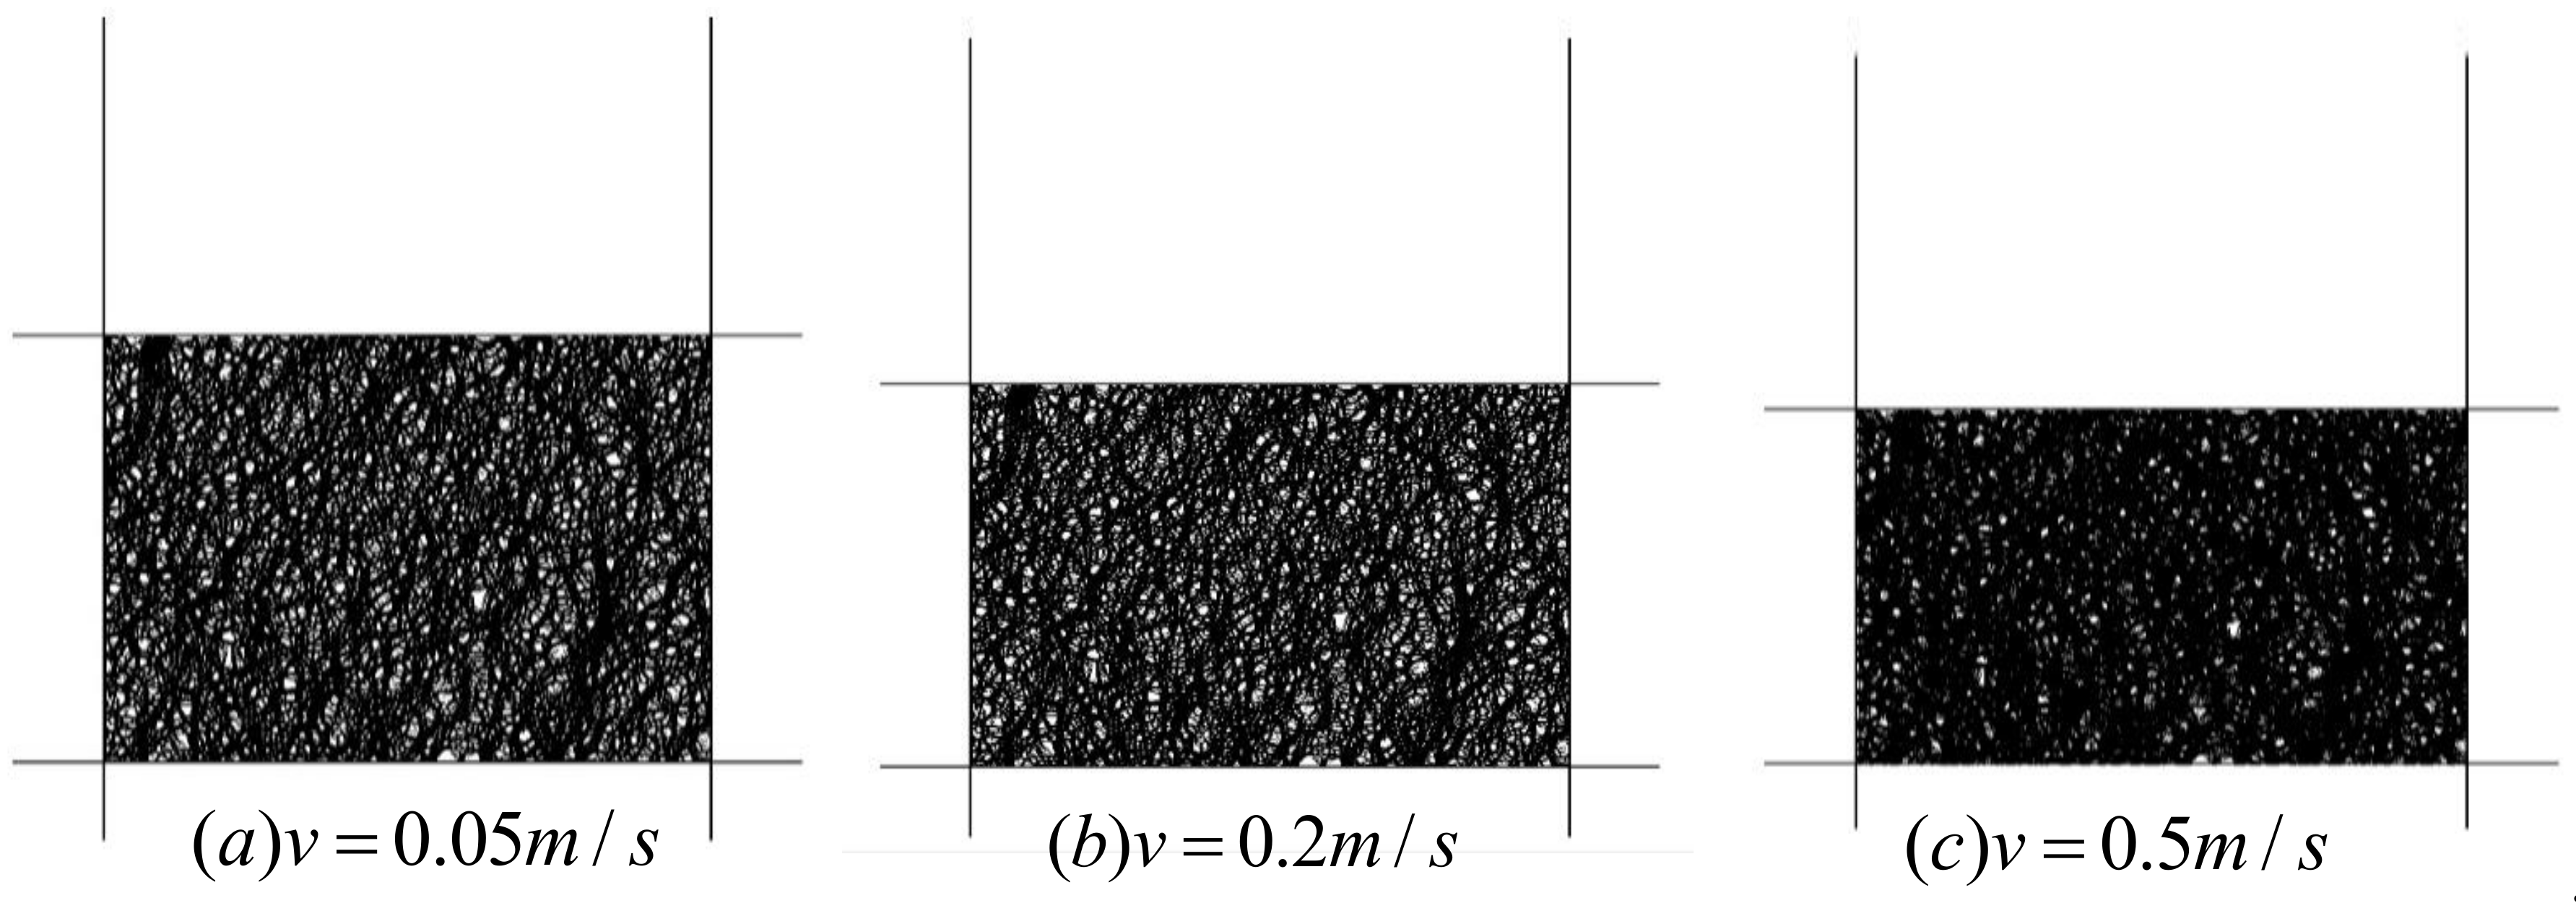
Figure 9 and Figure 10 show the distribution of the model force chain in the compression process of gangue particles with different loading rates under the axial pressure of 4 MPa and 16 MPa. Combined with the stress–strain curves, it can be found that in the early stage, the loading rate accelerates the compaction and filling of the pores between gangue, resulting in the gradual increase of the early strength chain with the increase of the rate. In the figure, the compression height is reduced, the particle force chain is thickened, and the color is deepened. In the later stage of axial pressure, the loading rate has little effect on the distribution of the force chain in the gangue compression process. Thus, there is almost no difference in the distribution of the force chain at each rate in the later stage [26,27].
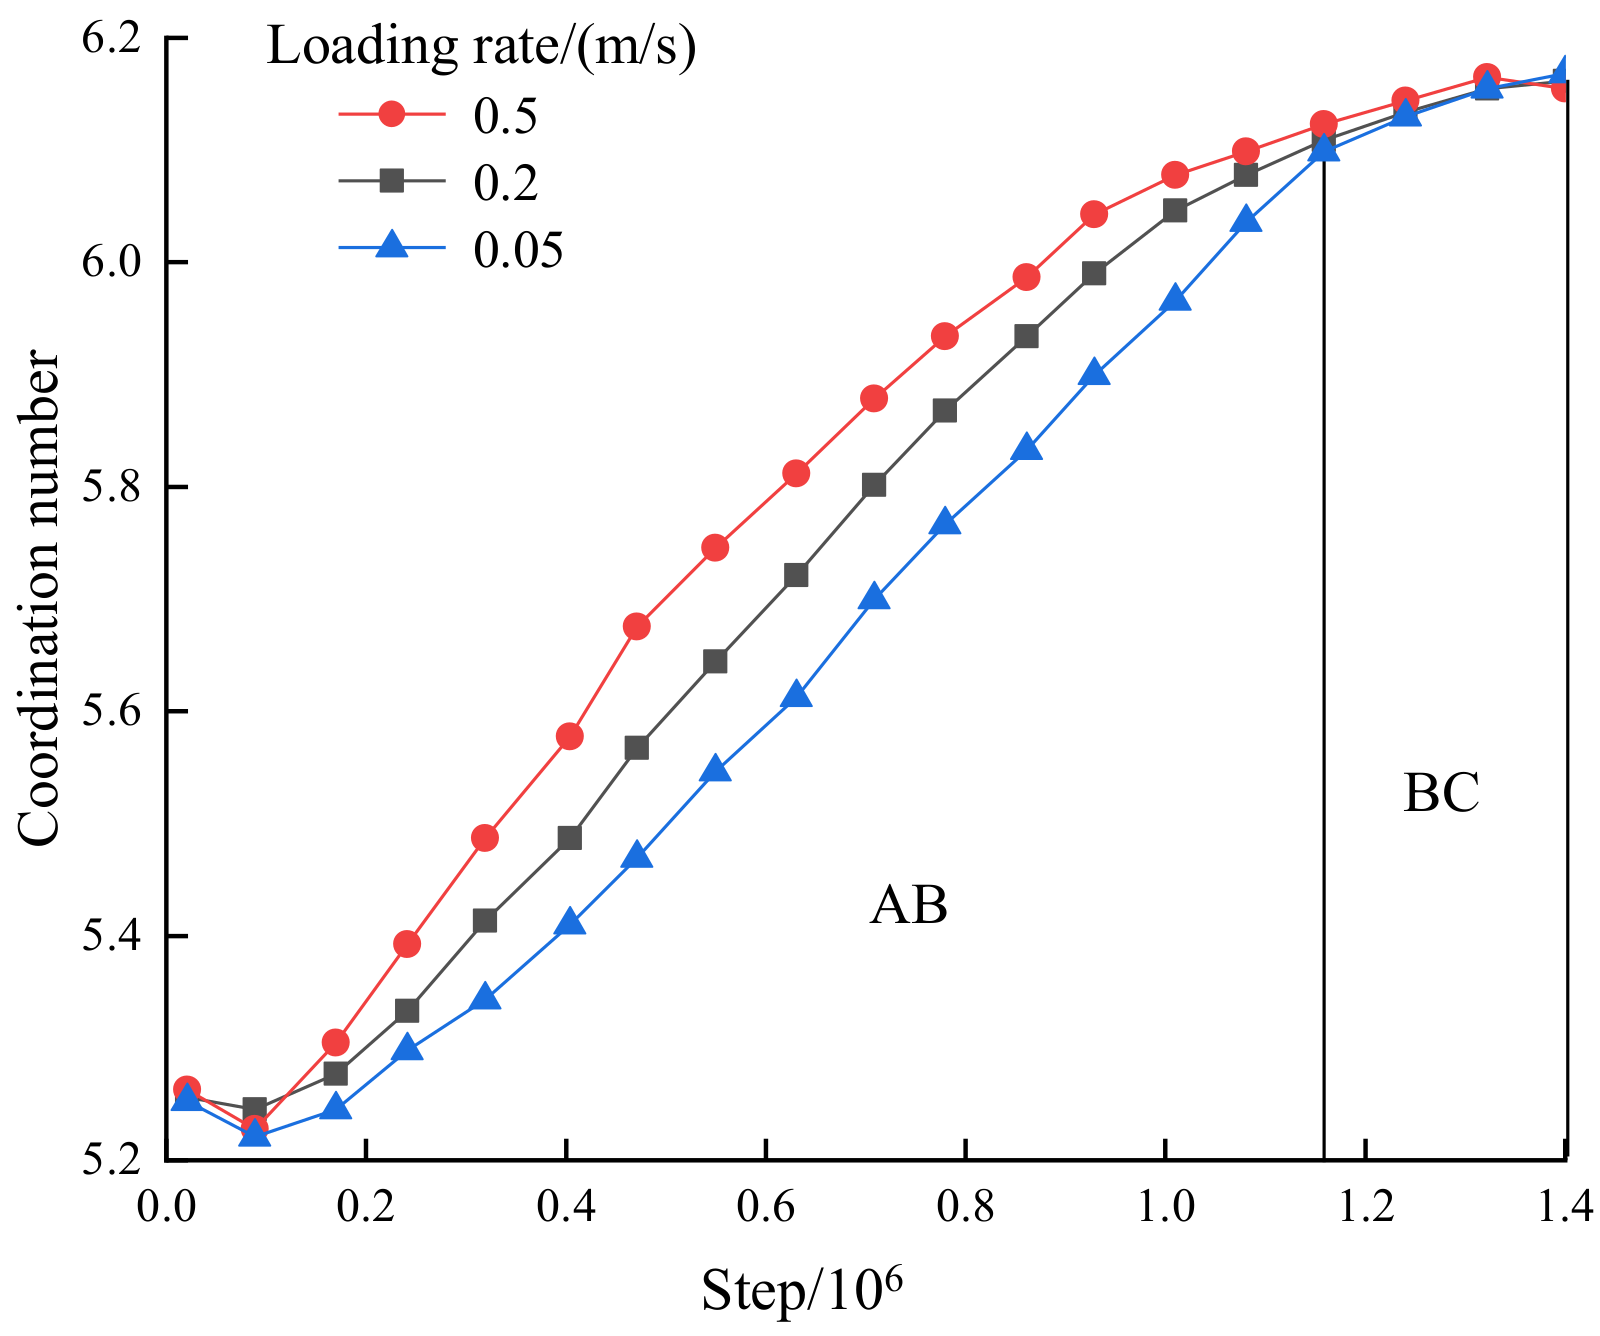
To intuitively reflect the influence of loading rate on the force chain distribution of gangue particles, the time-coordination number curves during gangue compression at different loading rates are shown in Figure 11. It is found that the force chain increases gradually with the increase of loading rate in the early loading stage (AB stage). The higher the loading rate, the higher the slope of the coordination number curve. The process of “instability-optimization” occurs continuously in the skeleton force chain structure, but the stability of the skeleton force chain structure is gradually enhanced, and the bearing capacity of the specimen is also gradually enhanced. In the later stage of compression (BC stage), the loading rate has little effect on the force chain of the model, and there is a rare change in the curve at the later stage. This finding can be used to explain the macroscopic deformation process of gangue.
3.5. Fracture Evolution Characteristics of Gangue Model under Different Loading Rates
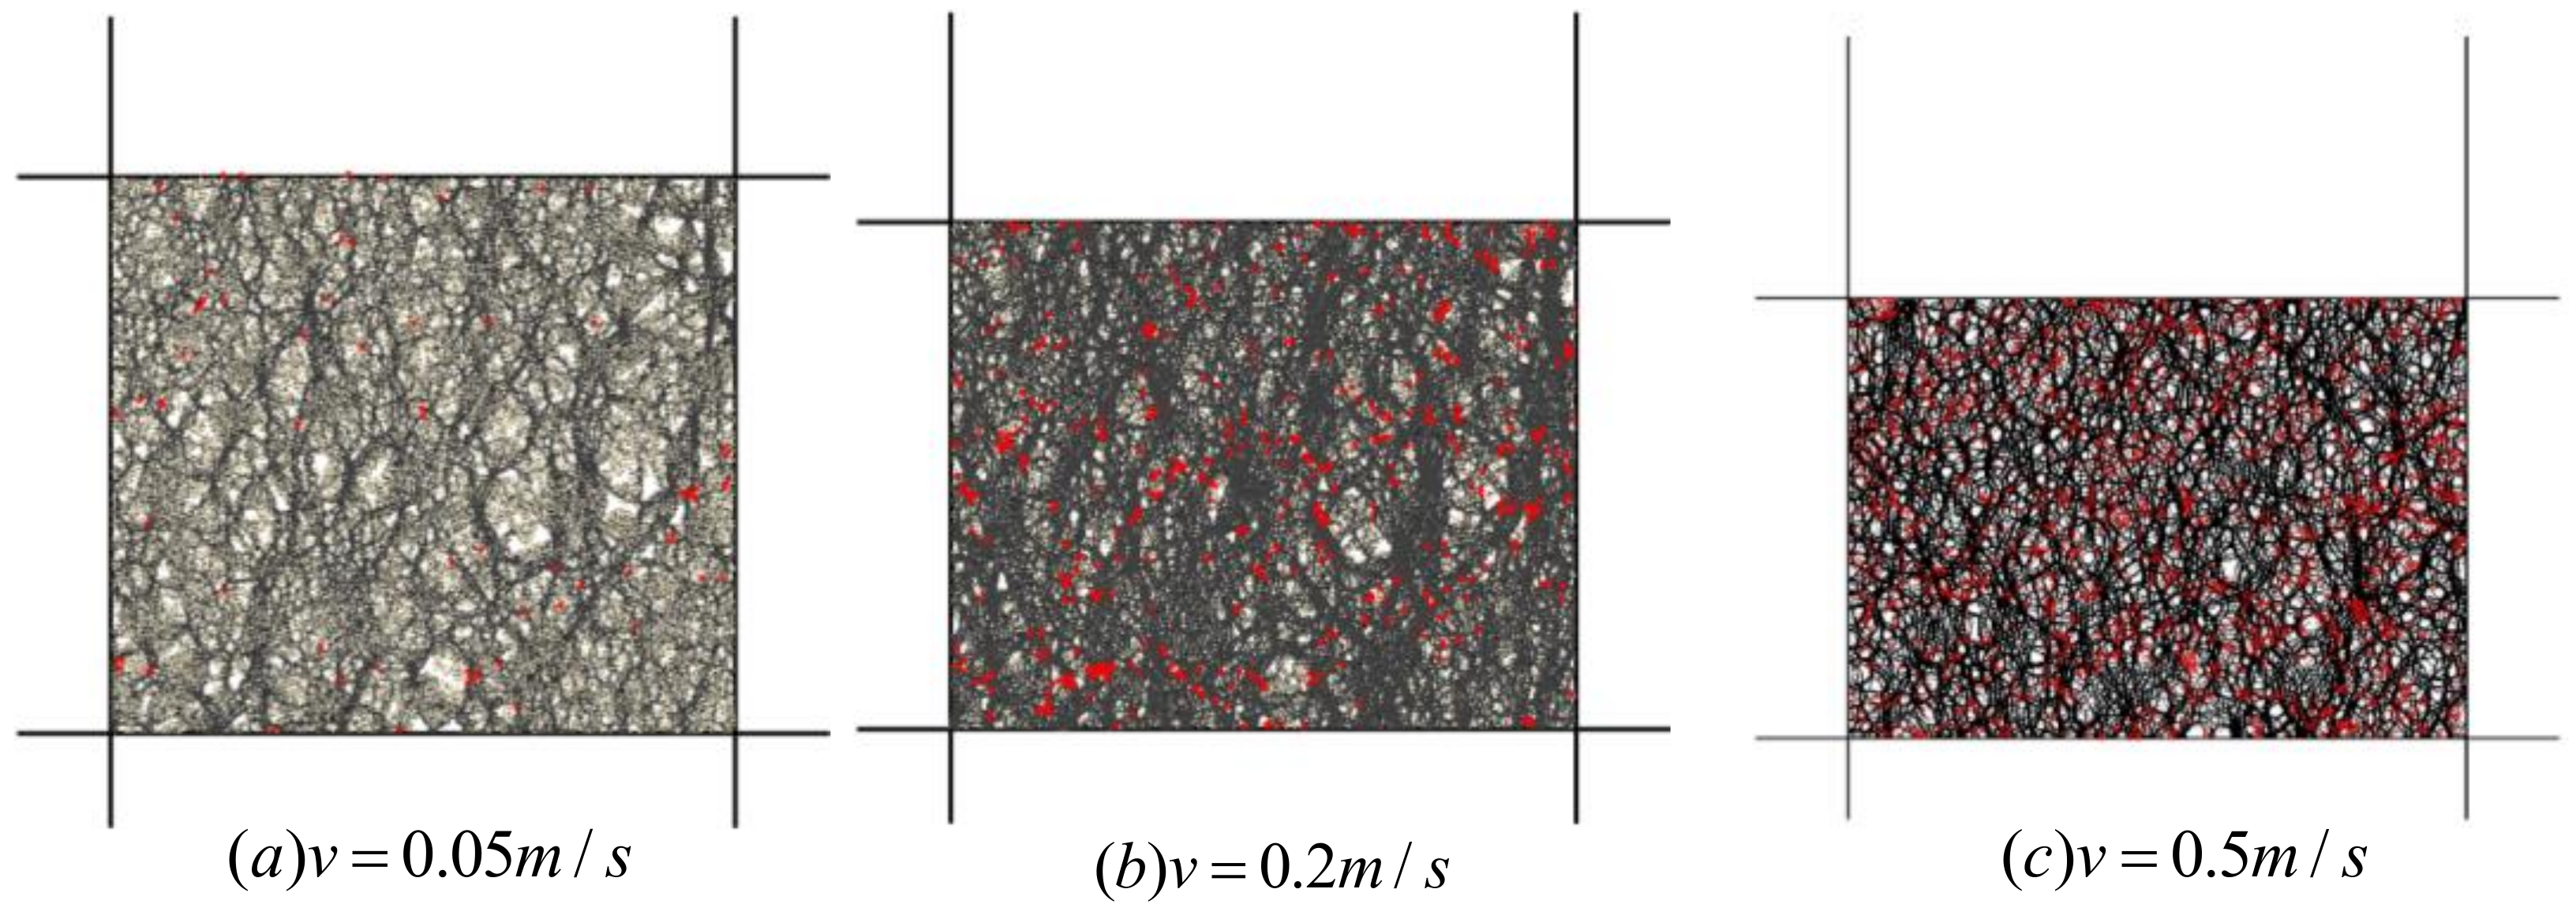
Figure 12 and Figure 13 show the fracture evolution of gangue particles at different loading rates under the axial pressure of 4 MPa and 16 MPa. In the initial compaction stage, the fracture increases obviously with the increase of loading rate, which represents the improvement of fragmentation degree of gangue. The most intuitive manifestation in the diagram is the increase of rate and the decrease of compression displacement. In the later stage, the loading rate has little effect on the deformation of gangue, and there is almost no difference in the evolution of cracks under different rates.
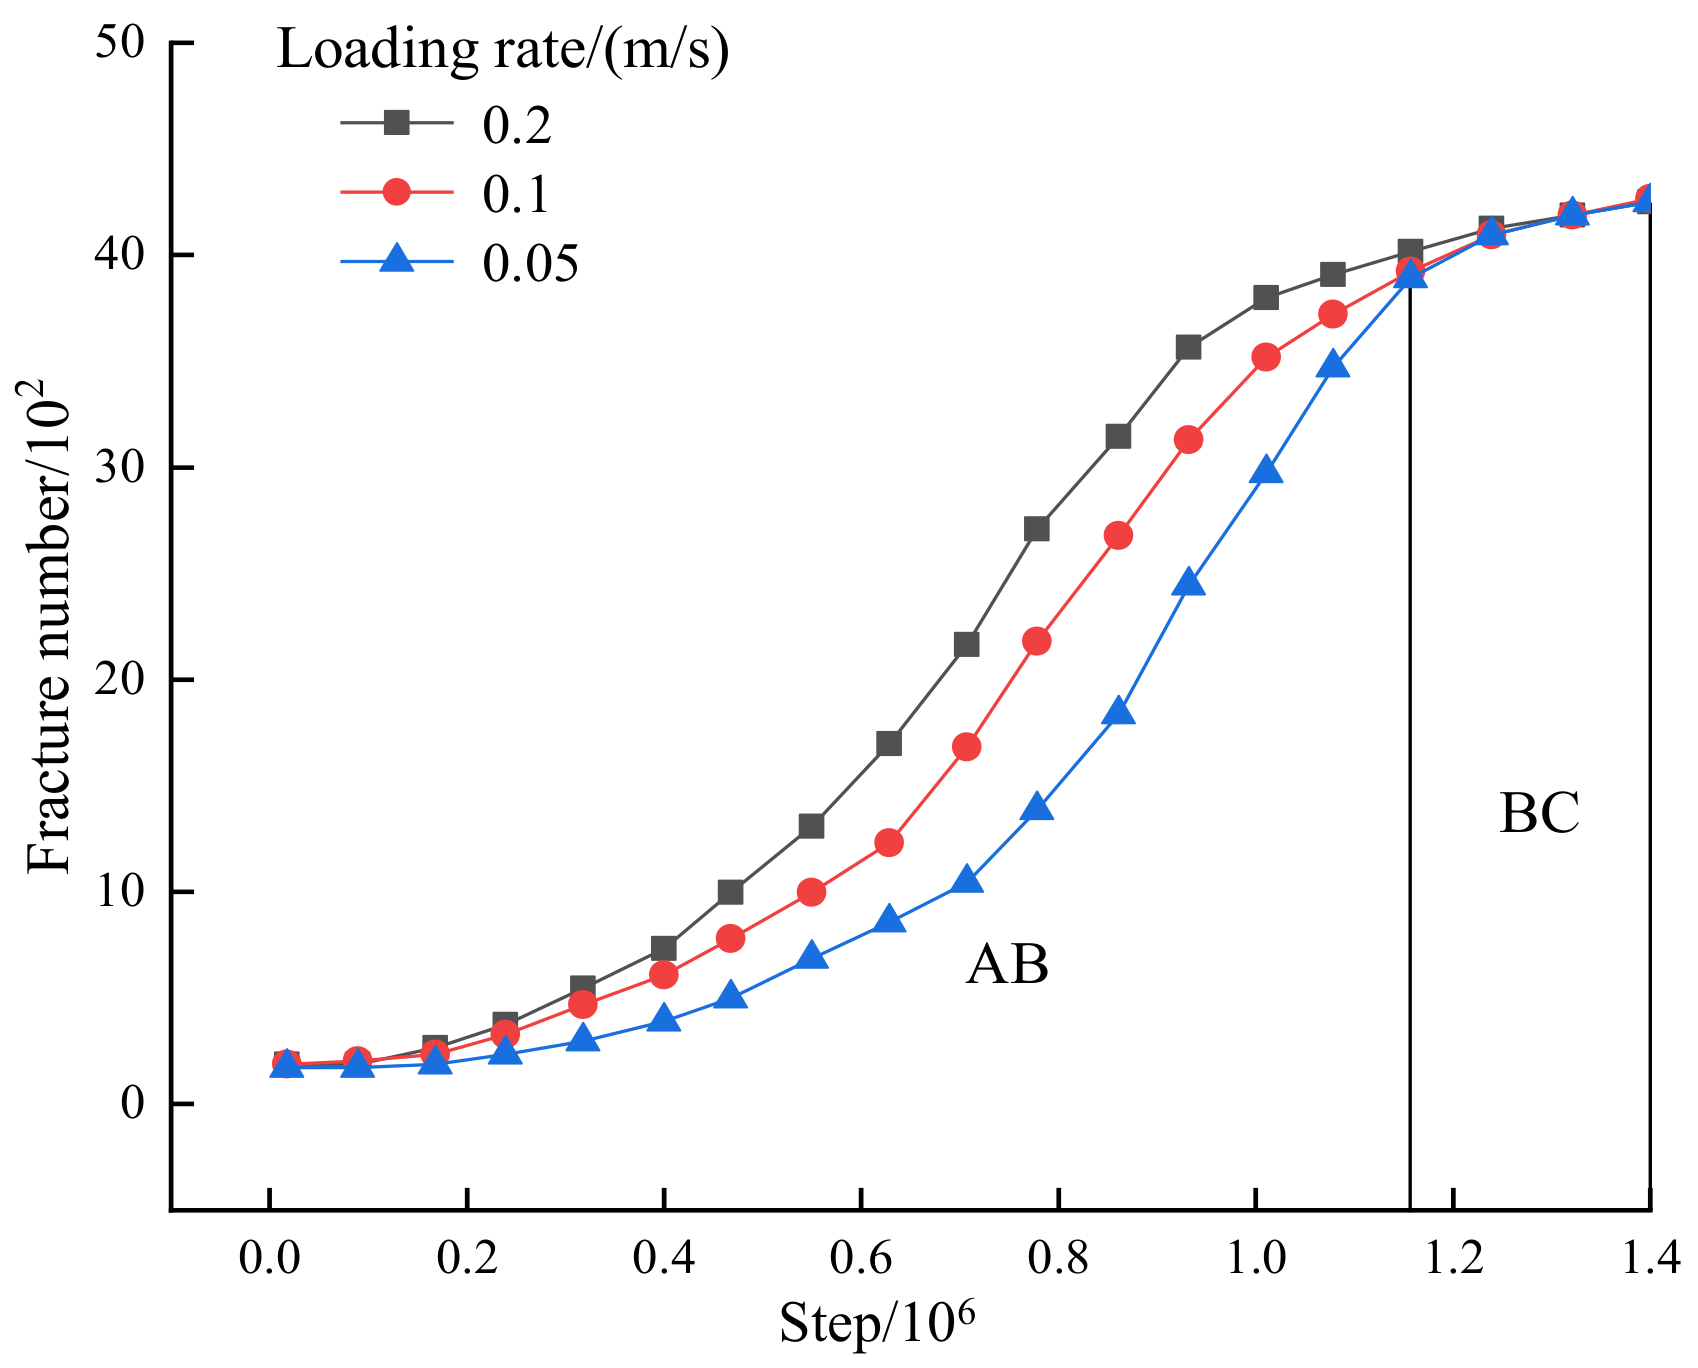
To directly reflect the influence of loading rate on the fracture evolution of gangue particles, the time-fracture number curves of gangue with different loading rates during compression are obtained, as shown in Figure 14. It can be found that in the early stage of compression (AB stage), the number of fractures increases with the increase of loading rate, fractures constantly undergo a crushing-recombination process, which is consistent to the coordination number curve. The higher the loading rate, the greater the slope of the coordination number curve. In the later stage of compression (BC stage), the model particles are broken to a certain extent, and the loading rate has little effect on the overall model, resulting in almost overlapping curves in the later stage.
4. Conclusions
In this paper, the acoustic emission monitoring technology is used to analyze the deformation and acoustic emission characteristics of granular gangue under different loading rates in the process of confined compression. Combined with the particle flow numerical simulation method, the macroscopic deformation and failure mechanism of gangue under different loading rates is revealed from the mesoscopic point of view. The main conclusions are as follows:
- (1)
- Direct compression of pores under low stress is the main factor affecting macroscopic deformation of the gangue. The porosity of the gangue decreases with the decrease of residual height, and increases with the decrease of strain. The porosity is inversely proportional to the stress, and the decreasing rate decreases gradually.
- (2)
- With the increase of loading rate, the maximum energy and cumulative energy of AE increase continuously, which is consistent with the macroscopic deformation characteristics of gangue. In the early loading, there is less gangue fragmentation and low AE signal; in the later loading stage, the gangue fragmentation is intensified, and the AE signal strength and cumulative energy increase significantly.
- (3)
- With the increase of loading rate, the influence of loading rate on deformation, fragmentation and AE signals of gangue is gradually weakened.
- (4)
- In the early loading stage, the distribution of the force chain and the fracture development of the gangue model are deepened. In the later loading stage, there is almost no difference in the state distribution of each model. The macroscopic deformation and failure mechanism of gangue under different loading rates is revealed from the mesoscopic point of view.
Author Contributions
Conceptualization, T.Q.; writing-original draft preparation, T.Q. and X.G.; methodology, X.G. and Z.W.; validation, W.Q.; investigation, Z.W. and H.W.; supervision, T.Q.; funding acquisition, Y.H. All authors have read and agreed to the published version of the manuscript.
Funding
This work was funded by the National Natural Science Foundation of China (No. 52104103, 52022107, 52174128), the Natural Science Foundation of Jiangsu Province (No. BK20210499, BK20190031), the Natural Science Foundation of Hebei Province (E2020203077), the Hebei Provincial Postdoctoral Science Foundation (B2020003012) and Tianshan Innovation Team Program (2021D14016).
Data Availability Statement
Data are contained within the article.
Acknowledgments
Thanks for the great efforts of editors and reviewers.
Conflicts of Interest
The authors declare no conflict of interest.
References
- Li, J.; Huang, Y.; Gao, H.; Ouyang, S.; Guo, Y. Transparent characterization of spatial-temporal evolution of gangue solid wastes’ void structures during compression based on CT scanning. Powder Technol. 2020, 376, 477–485. [Google Scholar] [CrossRef]
- Guo, S.; Zhang, J.; Li, M.; Zhou, N.; Song, W.; Wang, Z.; Qi, S. A preliminary study of solid-waste coal gangue based biomineralization as eco-friendly underground backfill material: Material preparation and macro-micro analyses. Sci. Total Environ. 2021, 770, 145241. [Google Scholar] [CrossRef] [PubMed]
- Wang, J.; Zhang, J.; Zhang, Q.; Wu, Z.; Zhang, Q.; Wang, Y.; Gao, D. Analysis of the Control Effect and Parameter Optimisation of Urban Surface Deformation in Underground Coal Mining with Solid Backfilling. Adv. Civ. Eng. 2021, 2021, 6705685. [Google Scholar] [CrossRef]
- Yan, H.; Zhang, J.; Li, B.; Zhu, C. Crack propagation patterns and factors controlling complex crack network formation in coal bodies during tri-axial supercritical carbon dioxide fracturing. Fuel 2020, 286, 119381. [Google Scholar] [CrossRef]
- Huang, P.; Zhang, J.; Yan, X.; Spearing, A.J.S.; Li, M.; Liu, S. Deformation response of roof in solid backfilling coal mining based on viscoelastic properties of waste gangue. Int. J. Min. Sci. Technol. 2021, 31, 279–289. [Google Scholar] [CrossRef]
- Sun, Q.; Meng, G.; Sun, K.; Zhang, J. Physical simulation experiment on prevention and control of water inrush disaster by backfilling mining under aquifer. Environ. Earth Sci. 2020, 79, 429. [Google Scholar] [CrossRef]
- Shi, D.; Cao, D.; Xue, J.; Deng, Y.; Liang, Y. DEM studies on the effect of particle breakage on the critical state behaviours of granular soils under undrained shear conditions. Acta Geotech. 2022, 17, 4865–4885. [Google Scholar] [CrossRef]
- Cheng, Q.; Zhang, J.; Zhou, N.; Guo, Y.; Pan, S. Experimental Study on Unconfined Compression Strength of Polypropylene Fiber Reinforced Composite Cemented Clay. Crystals 2020, 10, 247. [Google Scholar] [CrossRef] [Green Version]
- Kesimal, A.; Yilmaz, E.; Ercikdi, B.; Alp, I.; Deveci, H. Effect of properties of tailings and binder on the short-and long-term strength and stability of cemented paste backfill. Mater. Lett. 2005, 59, 3703–3709. [Google Scholar] [CrossRef]
- Zhou, N.; Han, X.; Zhang, J.; Li, M. Compressive deformation and energy dissipation of crushed coal gangue. Powder Technol. 2016, 297, 220–228. [Google Scholar] [CrossRef]
- Wu, D.; Luo, F.; Li, M.; Diao, Y.; Guo, Y.; Xu, P. Macroscopic and microscopic study on the compression bearing characteristics and deformation failure mechanism of gangue with different particle sizes. Powder Technol. 2021, 383, 198–211. [Google Scholar] [CrossRef]
- Xiao, M.; Ju, F.; Ning, P.; Li, K. Mechanical and Acoustic Emission Behavior of Gangue Concrete under Uniaxial Compression. Materials 2019, 12, 3318. [Google Scholar] [CrossRef] [Green Version]
- Bi, H.; Ni, Z.; Tian, J.; Jiang, C.; Sun, H.; Lin, Q. Influence of lignin on coal gangue pyrolysis and gas emission based on multi-lump parallel reaction model and principal component analysis. Sci. Total Environ. 2022, 820, 153083. [Google Scholar] [CrossRef]
- Chen, T.; Fang, Q.; Wang, Z.; Zhu, W. Numerical simulation of compression breakage of spherical particle. Chem. Eng. Sci. 2017, 173, 443–454. [Google Scholar] [CrossRef]
- Meng, F.; Song, J.; Yue, Z.; Zhou, H.; Wang, X.; Wang, Z. Failure mechanisms and damage evolution of hard rock joints under high stress: Insights from PFC2D modeling. Eng. Anal. Bound. Elements 2021, 135, 394–411. [Google Scholar] [CrossRef]
- Gutiérrez-Ch, J.; Senent, S.; Melentijevic, S.; Jimenez, R. Distinct element method simulations of rock-concrete interfaces under different boundary conditions. Eng. Geol. 2018, 240, 123–139. [Google Scholar] [CrossRef]
- Liang, Z.; Trc, D.; Xl, B.; Lt, C. Acoustic emission, damage and cracking evolution of intact coal under compressive loads: Experimental and discrete element modelling. Eng. Fract. Mech. 2021, 252, 107690. [Google Scholar]
- Yan, Y.; Yang, C.; Peng, L.; Li, R.; Bai, H. Emission characteristics of volatile organic compounds from coal-, coal gangue-, and biomass-fired power plants in China. Atmospheric Environ. 2016, 143, 261–269. [Google Scholar] [CrossRef]
- Yang, B.Y.; Chen, Z.C.; Wu, F.H. The influence factors of sulfur emission of coal and coal gangue and the formation of acid rain. Environ. Chem. 2004, 23, 548–554. [Google Scholar]
- Feng, S.; Yan, Y.; Lai, C. Experimental study on flow boiling characteristics of hybrid micro-channels with gradient distribution pillars and bypass. Int. J. Heat Mass Transf. 2022, 186, 122468. [Google Scholar] [CrossRef]
- Ma, D.; Zhang, J.; Duan, H.; Huang, Y.; Li, M.; Sun, Q.; Zhou, N. Reutilization of gangue wastes in underground backfilling mining: Overburden aquifer protection. Chemosphere 2020, 264, 128400. [Google Scholar] [CrossRef] [PubMed]
- Zhou, H.; Zhang, M.; Sun, S.; Wang, X. Synthesis of Coal Gangue-Based Mesoporous X Zeolite with Soft Template and Its Adsorption Methylene Blue. Sci. Adv. Mater. 2021, 13, 2157–2166. [Google Scholar] [CrossRef]
- Liu, J.-P.; Li, Y.-H.; Xu, S.-D.; Xu, S.; Jin, C.-Y.; Liu, Z.-S. Moment tensor analysis of acoustic emission for cracking mechanisms in rock with a pre-cut circular hole under uniaxial compression. Eng. Fract. Mech. 2015, 135, 206–218. [Google Scholar] [CrossRef]
- Xu, X.; Xia, M.; Ke, F.; Bai, Y. Experimental Evidence of Critical Sensitivity in Catastrophe. Pure Appl. Geophys. 2006, 163, 1751–1767. [Google Scholar] [CrossRef] [Green Version]
- Jiang, M.; Spikes, K.T. Estimation of reservoir properties of the Haynesville Shale by using rock-physics modelling and grid searching. Geophys. J. Int. 2013, 195, 315–329. [Google Scholar] [CrossRef] [Green Version]
- Habr, B.; Saliba, Y.; Hajal, J.; Smayra, V.; Riachy, M.; Fares, N. Hydrocortisone mitigates ICU-AW by fine-tuning of muscle atrophic and hypertrophic signaling pathways in a sepsis model with limb immobilization. Life Sci. 2020, 261, 118366. [Google Scholar] [CrossRef]
- Munuera, C.; Barrena, E.; Ocal, C. Scanning force microscopy three-dimensional modes applied to conductivity measurements through linear-chain organic SAMS. Nanotechnology 2007, 18, 125505. [Google Scholar] [CrossRef]
Figure 1.
Experimental system.

Figure 2.
Backfilling of graded particle profiles.

Figure 3.
Stress-strain curve of gangue specimens at different loading rates under the confined compression.
Figure 3.
Stress-strain curve of gangue specimens at different loading rates under the confined compression.

Figure 4.
Porosity-stress curves of gangue specimens.

Figure 5.
AE energy-cumulative energy-strain-time curve of gangue at different loading rates: (a) 0.25 kN/s. (b) 0.5 kN/s. (c) 1.0 kN/s. (d) t 1.5 kN/s. (e) 2.0 kN/s (f) 5.0 kN/s.
Figure 5.
AE energy-cumulative energy-strain-time curve of gangue at different loading rates: (a) 0.25 kN/s. (b) 0.5 kN/s. (c) 1.0 kN/s. (d) t 1.5 kN/s. (e) 2.0 kN/s (f) 5.0 kN/s.


Figure 6.
Histogram of AE energy-cumulative energy of gangue.

Figure 7.
Maximum strain-fragmentation rate-AE energy-cumulative energy curve.

Figure 8.
Macroscopic deformation-cumulative energy curve.

Figure 9.
Distribution of force chain of gangue model at different loading rates under the axial pressure of 4 MPa.
Figure 9.
Distribution of force chain of gangue model at different loading rates under the axial pressure of 4 MPa.

Figure 10.
Force chain distribution of gangue model at different loading rates under the axial pressure of 16 MPa.
Figure 10.
Force chain distribution of gangue model at different loading rates under the axial pressure of 16 MPa.

Figure 11.
Step-coordination number curve in the compression process of gangue with different loading rates.
Figure 11.
Step-coordination number curve in the compression process of gangue with different loading rates.

Figure 12.
Fracture evolution of gangue models with different loading rates under the axial pressure of 4 MPa.
Figure 12.
Fracture evolution of gangue models with different loading rates under the axial pressure of 4 MPa.

Figure 13.
Fracture evolution of gangue models with different loading rates under the axial pressure of 16 MPa.
Figure 13.
Fracture evolution of gangue models with different loading rates under the axial pressure of 16 MPa.

Figure 14.
Step-crack number curves during compression at different loading rates.


Table 1.
Mineral composition of coal gangue.
| Ingredients | SiO2 | Fe2O3 | Al2O3 | CaO | MgO | TiO2 | Burning Loss |
|---|---|---|---|---|---|---|---|
| % | 49.34 | 5.11 | 16.79 | 5.8 | 0.93 | 0.92 | 14.96 |
Table 2.
The linear fitting model between macroscopic deformation and cumulative energy.
| Loading Rate/(kN/s) | Stage 1 | Stage 2 | Stage 3 |
|---|---|---|---|
| 0.25 | y = 9.288 x + 0.009 | y = 13.209 x − 0.141 | y = 2.639 x + 1.260 |
| 0.5 | y = 4.747 x + 0.044 | y = 94.252 x − 11.141 | y = 25.233 x + 6.622 |
| 1.0 | y = 11.592 x − 0.009 | y = 50.115 x − 1.801 | y = 6.128 x + 8.752 |
| 1.5 | y = 11.881 x − 0.015 | y = 75.086 x − 1.445 | |
| 2.0 | y = 22.670 x − 0.044 | y = 72.071 x − 1.923 | |
| 5.0 | y = 12.298 x − 0.023 | y = 75.696 x − 2.553 |
Publisher’s Note: MDPI stays neutral with regard to jurisdictional claims in published maps and institutional affiliations. |
© 2022 by the authors. Licensee MDPI, Basel, Switzerland. This article is an open access article distributed under the terms and conditions of the Creative Commons Attribution (CC BY) license (https://creativecommons.org/licenses/by/4.0/).
Share and Cite
MDPI and ACS Style
Qin, T.; Guo, X.; Huang, Y.; Wu, Z.; Qi, W.; Wang, H. Study on Macro-Meso Deformation Law and Acoustic Emission Characteristics of Granular Gangue under Different Loading Rates. Minerals 2022, 12, 1422. https://doi.org/10.3390/min12111422
AMA Style
Qin T, Guo X, Huang Y, Wu Z, Qi W, Wang H. Study on Macro-Meso Deformation Law and Acoustic Emission Characteristics of Granular Gangue under Different Loading Rates. Minerals. 2022; 12(11):1422. https://doi.org/10.3390/min12111422
Chicago/Turabian StyleQin, Tao, Xin Guo, Yanli Huang, Zhixiong Wu, Wenyue Qi, and Heng Wang. 2022. "Study on Macro-Meso Deformation Law and Acoustic Emission Characteristics of Granular Gangue under Different Loading Rates" Minerals 12, no. 11: 1422. https://doi.org/10.3390/min12111422
Note that from the first issue of 2016, this journal uses article numbers instead of page numbers. See further details here.