Article

Methodology and Model to Predict HPGR Throughput Based on Piston Press Testing

by
Giovanni Pamparana
1,*,
Bern Klein
1,* and
Mauricio Guimaraes Bergerman
1,2,*
1
Norman B. Keevil Institute of Mining Engineering, University of British Columbia, Vancouver, BC V6T 1Z4, Canada
2
Department of Mining and Petroleum Engineering, Polytechnical School, University of São Paulo, Cidade Universitária, Butantã, São Paulo 05508-220, Brazil
*
Authors to whom correspondence should be addressed.
Minerals 2022, 12(11), 1377; https://doi.org/10.3390/min12111377
Submission received: 7 October 2022 / Revised: 26 October 2022 / Accepted: 27 October 2022 / Published: 29 October 2022
(This article belongs to the Special Issue Experimental and Numerical Studies of Mineral Comminution)

Abstract

:
Sizing High-Pressure Grinding Rolls (HPGR) requires a large quantity of material, making it not attractive and costly to be considered for new mining projects regardless of their energy consumption reduction benefits. Ongoing efforts are being made at the University of British Columbia to predict the behaviour of the HPGR using a low quantity of material on a piston-and-die press apparatus. Although the energy requirements and size reduction predictive models are already developed, there is still a need to predict the HPGR throughput on a small-scale test. This paper presents a new model to predict the HPGR throughput based on the previously developed model to predict the operational gap by using less than 2 kg of sample. The throughput model was developed using machine learning techniques and calibrated using pilot-scale HPGR tests and piston press tests. The resulting model has an R2 of 0.91 with an average prediction error of ±4.2%. The developed methodology has the potential to fill the gap of the missing throughput model. Further pilot-scale HPGR testing is required to continue validating the model.

1. Introduction

The high-pressure grinding rolls (HPGR) technology is increasingly being considered for hard ore comminution due to its significant benefits in energy consumption compared to conventional semi-autogenous grinding (SAG) mill circuits. It has been shown that HPGR circuits can reduce the energy requirements by 10 to 40% [1,2,3,4]. Additional downstream benefits of the HPGR comminution include enhanced mineral liberation from the ore and reduction of the particles’ strength due to the generation of micro-fractures [5]. To size/scale up an HPGR, a large quantity of material is required to conduct pilot-scale tests, which are usually not readily available for early-stage projects [6]. There is also a lack of industry-approved methods to size/scale up the HPGR using laboratory-scale equipment. Manufacturers conduct a series of pilot-scale HPGR tests to obtain the required information to scale-up the parameters to an industrial standard [7]. Other studies have investigated the use of the piston-and-die press to predict and validate pilot-scale HPGR studies [8,9]. Due to these limitations, the HPGR technology has not been able to be widely considered in greenfield projects.
Several models have been developed previously at the University of British Columbia (UBC) to predict the energy and size reduction of the pilot-scale HPGR. Predictions can be made using a piston-and-die press test (PPT) apparatus and a low quantity of material to size the HPGR [10,11,12,13]. The throughput prediction is still undeveloped in the area providing a research opportunity.
The HPGR throughput is directly related to the roll’s speed and operational gap (space between the rolls) [14] occurring during the compression of the material, indicating a volumetric flow dependency, while the material passes through the rolls, it generates a counter-force to the pressure applied by the HPGR as resistance to compression resulting in the operational gap [15]. The material passing through the rolls will compress until there is a force equilibrium. Equation (1) represents a volumetric flow of material passing through the operational gap based on plug flow through the rolls [16]. A strong assumption is that the material does not slip at the gap to be able to use the roll’s velocity as the material’s one in the flux equation.
Q H = 3600 · L · v r · ρ g · X g
where: Q H [t/h] is the calculated HPGR throughput, L [m] is the roll length, v r [m/s] is the roll speed, ρ g [t/m 3 ] is the density of the compressed material in the operational gap, and X g [m] is the HPGR operational gap.
The most challenging parameter to estimate is the compressed density of the material passing through the rolls [17]. Although it is possible to measure the flake density and thickness of the intact compacted ore pieces collected after the HPGR operation, the measurements are not completely representative of what is happening inside the gap. As soon as the material is expelled from the HPGR it expands such that the flakes are thicker and less dense than inside the HPGR.
The operational gap is related to the material properties having a significant impact on the specific throughput constant. The ore hardness and density and the particle size (feed top size and fines content) will have a great impact on how the material will compress [18,19]. The moisture content will impact how the material will be grabbed into the rolls due to the changes in friction and adhesion between the particles. High moisture content can also lead to slippage of the material in the rolls, reducing the performance of the HPGR [20,21,22]. In previous work, the authors developed a methodology to predict the operational gap of the pilot-scale HPGR by conducting several PPTs [
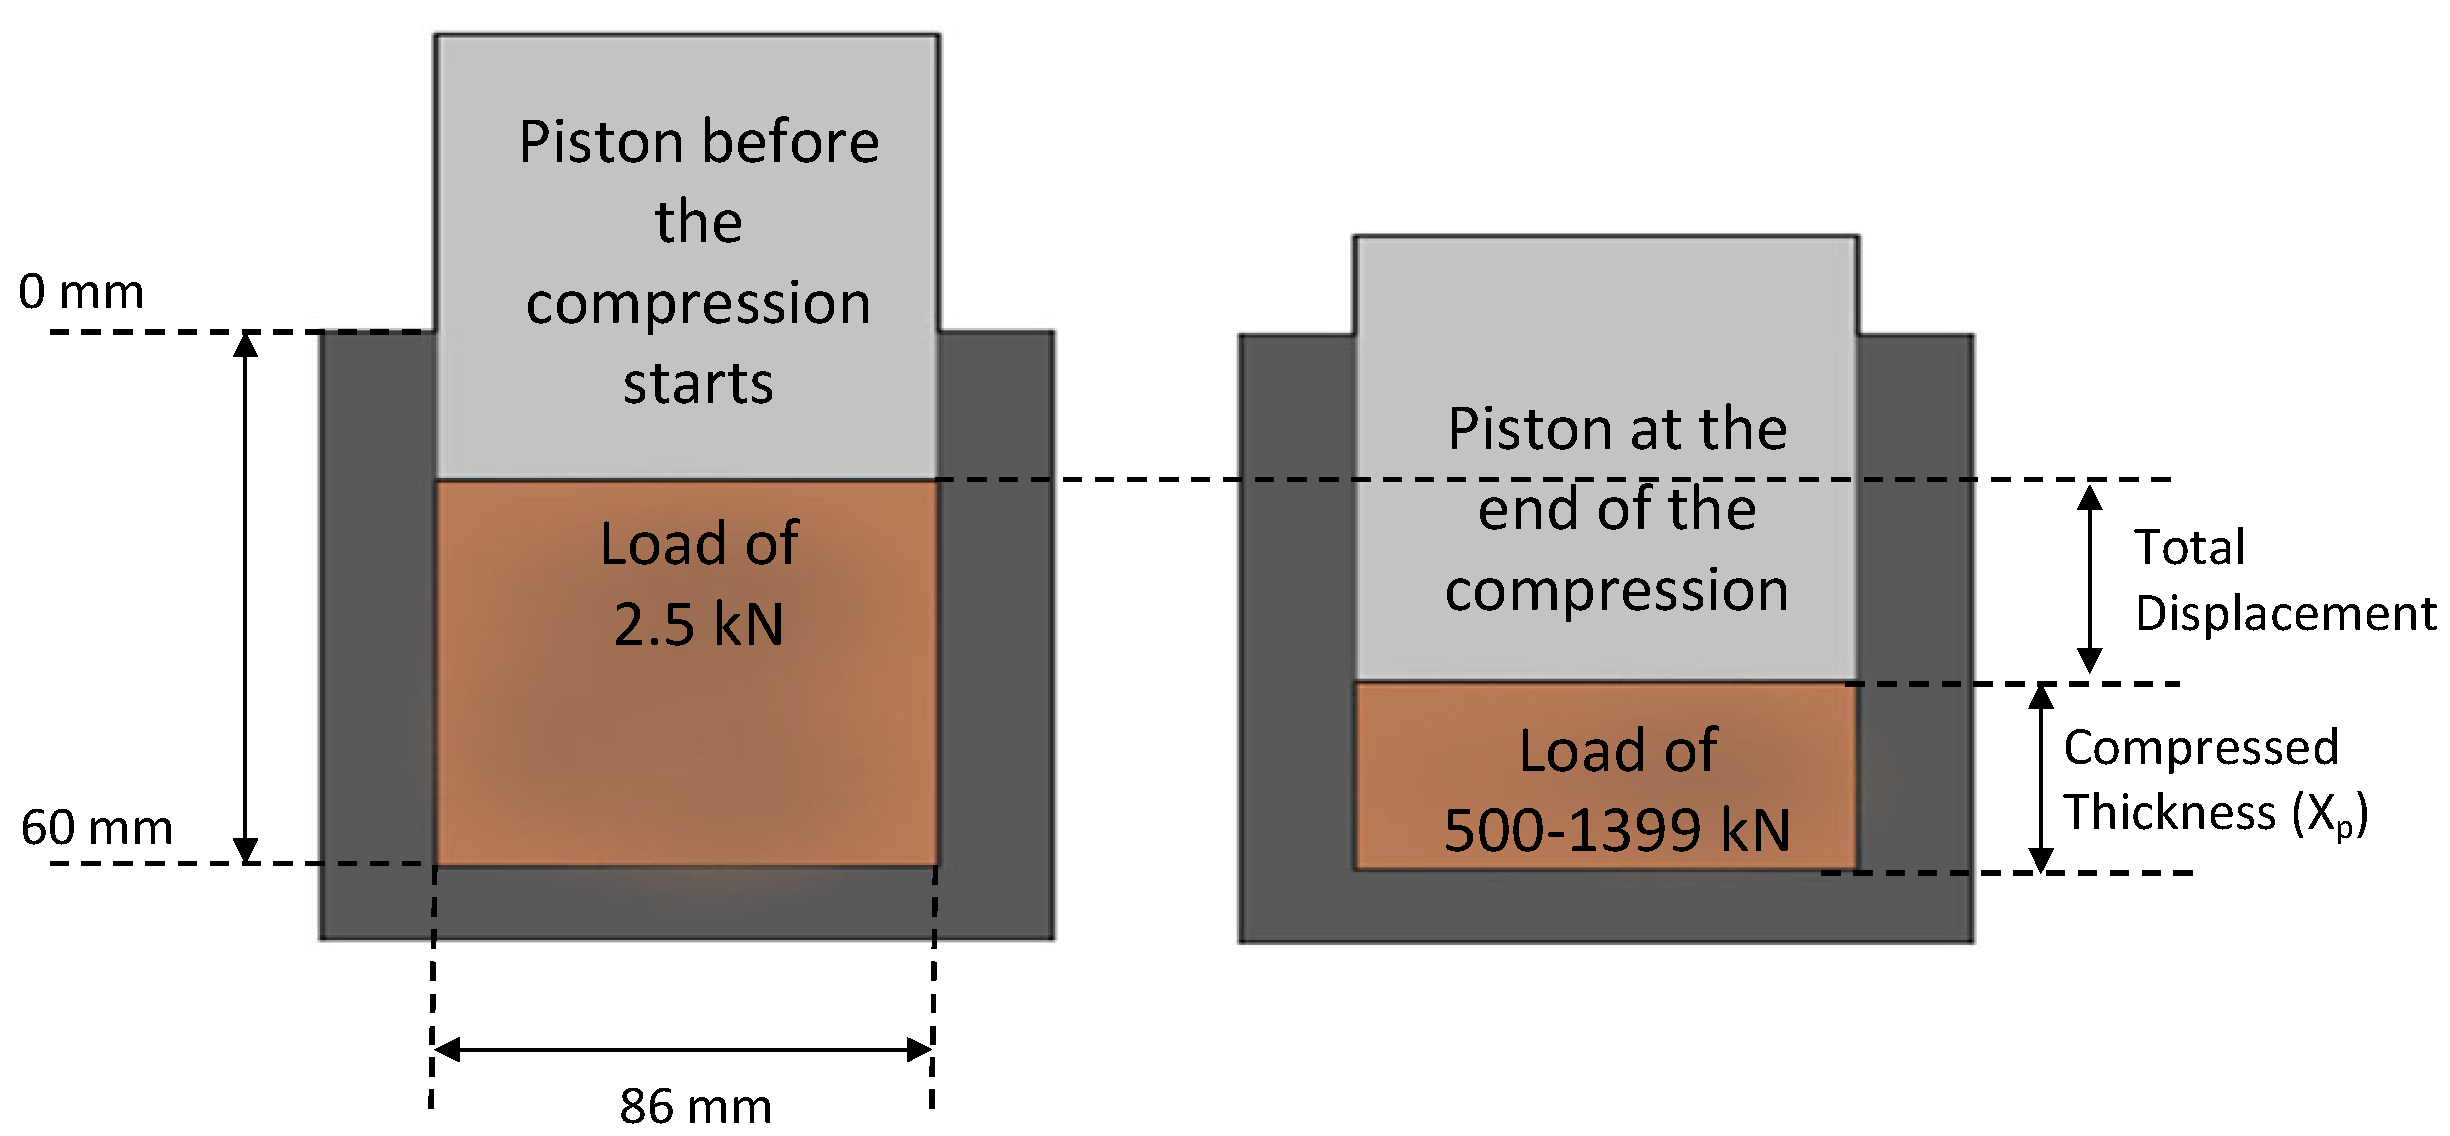
23]. The methodology consists of simulating the HPGR compression by compressing several volumes of material at different pressing forces, indicating the material’s compressibility. The results from these compressions allow for predicting the operational gap in the HPGR and supplying important information for the throughput modelling.
The PPT can capture the material’s compressibility, allowing the results to be related to the HPGR. Several authors have used the PPT to predict the HPGR throughput. Qiu et al. [24] focused on predicting Metso’s HRC™ by using strain gauges on their proprietary piston and die setting (Metso’s Packed-Bed Test) and relating to industrial HPGR plant survey data for calibration. At UBC, Nadolski [25] developed a regression model based on PPT, pilot-scale HPGR, and shear box tests. The challenge with these models is that the strain and shear values measured are low compared to those seen in the HPGR. Additionally, a standalone PPT without needing HPGR calibration has not yet been developed.
This paper aims to develop a throughput prediction model for the HPGR using data science techniques. Data obtained from the piston press tests will be used as predictors alongside other important operational parameters that define the HPGR throughput. Several pilot-scale HPGR tests using different ores will be used to initially calibrate the model. Regardless, an alternative to not using HPGR pilot-scale testing is also presented.

2. Methods

2.1. Pilot-Scale HPGR

A Köppern HPGR was used to conduct the pilot-scale tests (Figure 1). This machine has Hexadur rolls with a diameter of 750 mm and a width of 220 mm, a variable speed drive, and a hydraulic system that can apply a pressing force of up to 8 N/mm2. The system can record power draw, operating gap, roller speed, and operating pressure. Each test is a single pass of 250–300 kg of material crushed to −32 mm which is choke-fed from the top before the machine starts. This pilot machine can achieve a throughput of 25–35 t/h depending on the material characteristics and machine settings.
The material is discharged to a conveyor belt with a splitter that allows the collection of the centre and edge products separately. The product is collected only when the machine is operating in a steady state (∼15–20 s after 5 s that the machine started), while the rest is discarded into the waste bin. The data for analysis is collected during this period as well. The moisture and roll speed are both maintained constant during the operation. The throughput is calculated from the weight of the collected product.

2.2. Piston Press Test

An MTS hydraulic press was adapted to incorporate a piston that can compress material inside a die with a removable base to discharge the compacted material (Figure 2). The machine can apply forces up to 1399 kN while recording the displacement and force in time data. A die of 86 mm diameter and 60 mm height is used, which translates into a maximum applied pressure of 240.5 MPa, close to the pressure that the HPGR can apply on the centre of the rolls.
The PPT requires around 10–20 kg of a sample crushed to −12.5 mm. Using shaking screens, a sub-sample is taken to obtain the feed particle size distribution (PSD). The moisture is then adjusted to the desired level, and the bulk density is measured by filling a two-litre beaker with 2 kg of sample and then applying mechanical vibration for 10 min. The regular PPT conducted at UBC uses sub-samples of 240 mL for each compression. The bulk density is used to calculate the required mass for testing, and the samples are stored in bags to preserve moisture.
Figure 3 is a schematic showing the PPT compression process. From the data obtained during the test, a force-displacement curve is generated that is used to determine the energy input. The obtained displacement is corrected by the strain of the machine’s parts which can account for up to 1.5 mm at 1400 kN.

2.3. Ore Samples

Ore from eight different deposits was used for the study. These ores were composed principally of metal sulphide minerals where the main gangue mineral phase was primarily silicates. The samples were crushed to −12.5 mm achieving a F80 from 6 to 9 mm. Table 1 shows the characteristics of the various ores used for HPGR and PPT testing. The origin of each sample must be kept confidential.

2.4. Testing Methodology

A total of 66 pilot-scale HPGR tests were performed. Each of the samples was compressed at different specific force settings ranging from 2 to 5 N/mm2. Different roll speeds were also used throughout the testing ranging from 0.35 to 0.76 m/s. For each test, the specific energy consumption, operational gap, and throughput were recorded to be used for the study. Table 2 shows a summary of the operation parameters that can be varied in the test program.
For each sample, PPTs were performed differently than the regular testing described by Davaanyam [11]. For energy-size reduction predictions, 240 mL of sample is required to be compressed on the PPT. Due to the throughput being dependent on the volumetric flow of material, it makes sense to use different volumes of material to provide data points for the modelling. Three volumes of material are tested on the PPT for the throughput prediction: 180 mL, 240 mL, and 300 mL. These volumes are chosen arbitrarily to cover the same range that the HPGR operational gap prediction methodology uses [23]. Each sample will be compressed to 1400 kN to obtain the full force-displacement curve. That force-displacement curve will be used to extract data points for modelling. Figure 4 shows an example of compressed material on the PPT.

3. Modeling

3.1. Model Predictors

The throughput model is developed using machine learning techniques incorporating different predictors such as HPGR operational targets and PPT results. The operational predictors are HPGR variables that will directly affect the throughput. The predictors originating from the PPT results characterize the material’s compressibility under different pressures. To maintain the model’s generality, the predicted response is the specific throughput (also called m-dot or m ˙ ). The specific throughput is the capacity of an HPGR with a roll diameter of 1 m, a width of 1 m and a roller speed of 1 m/s. This parameter is widely used in the industry to compare the throughput of different HPGRs built with different dimensions. It can also be used to upscale the HPGR from pilot to industrial scale. Table 3 shows the variables used and their descriptions.
The moisture, roller speed, and specific pressing force are selected for the HPGR operation. The specific energy consumption used for the modelling was obtained directly from the HPGR pilot-scale testing. It is preferable to get specific energy consumption directly from pilot-scale testing since it will provide an accurate result. Regardless, if no pilot-scale tests are available for a material, the specific energy consumption can be predicted by performing PPTs following the procedure developed by [26]. The sample bulk density is measured from the sample crushed to −12.5 mm before performing PPTs.
The forces required for the model are calculated from the force-displacement curve for each compression performed on the three volumes. The HPGR specific energy consumption target is searched on each curve to obtain the force that generates that specific energy consumption on the PPT. The compressed thickness at that force level is also recorded to be used in the model. If the specific energy consumption value exceeds what was recorded on the force-displacement curve, it is necessary to extrapolate the force and compressed thickness from it.
The forces and displacements from the PPT represent the compressibility of the sample at different volumes when applying the same specific energy that the material would have seen in the HPGR operation. Three volumes are used to address any curvature that could happen with the change of the sample volume in the die (adds robustness).

3.2. Model Selection

Several machine learning regression models were tested to fit and predict the data. Due to the small number of pilot-scale HPGR tests available with associated PPT data, care must be taken to select a model that will not overfit the data. For example, neural network models work well to predict the behaviour of the specific throughput, but if there is little data available, they can overfit the model. To avoid overfitting, the k-fold cross-validation technique was used, which consists of dividing the dataset into k number of sets and sequentially removing one of them to test the model fit with the other k 1 sets [27,28]. In this study, a 5-fold cross-validation was performed to evaluate each of the models.
Table 4 shows a summary of the tested models. The coding and training of the models were performed using MATLAB and its integrated data science package under academic licensing. The shown scores are the coefficient of determination (R2), root mean squared error (RMSE), mean absolute error (MAE), and mean relative error (MRE). As well, the cross-validation R2 and RMSE are shown.
The neural networks (NN) resulted in almost a perfect fit, but the validations indicated an overfit model, so it has to be discarded. The tree ensemble model was also discarded due to poor performance in cross-validation. Although the Gaussian Process Regression (GPR) is a good model for when a small amount of data is available, and it resulted in a perfect fit, it performed poorly in the cross-validation, so it was decided to be discarded as well.
The linear stepwise regression model performed poorly at the validation stage and worse than the other linear models. The linear stepwise regression model also removed several of the variables considered for modelling. It is desired to keep the selected variables since they have a proven influence on the HPGR throughput. Although the multi-linear regression model performed worse over the data, it has a better performance over the cross-validation, indicating that maintaining the predictors increases the robustness of the model.
The best results were obtained using an interactions stepwise regression (ISWR) model and a Support Vector Regression (SVR) using a third-order polynomial kernel function. The ISWR considered interactions between the predictors and quadratic terms. The linear terms were not excluded from the ISWR model and only one interaction was kept which was desired.

4. Results

The SVR [29] and ISWR [30] models performed well for both the data fit and the cross-validation. 
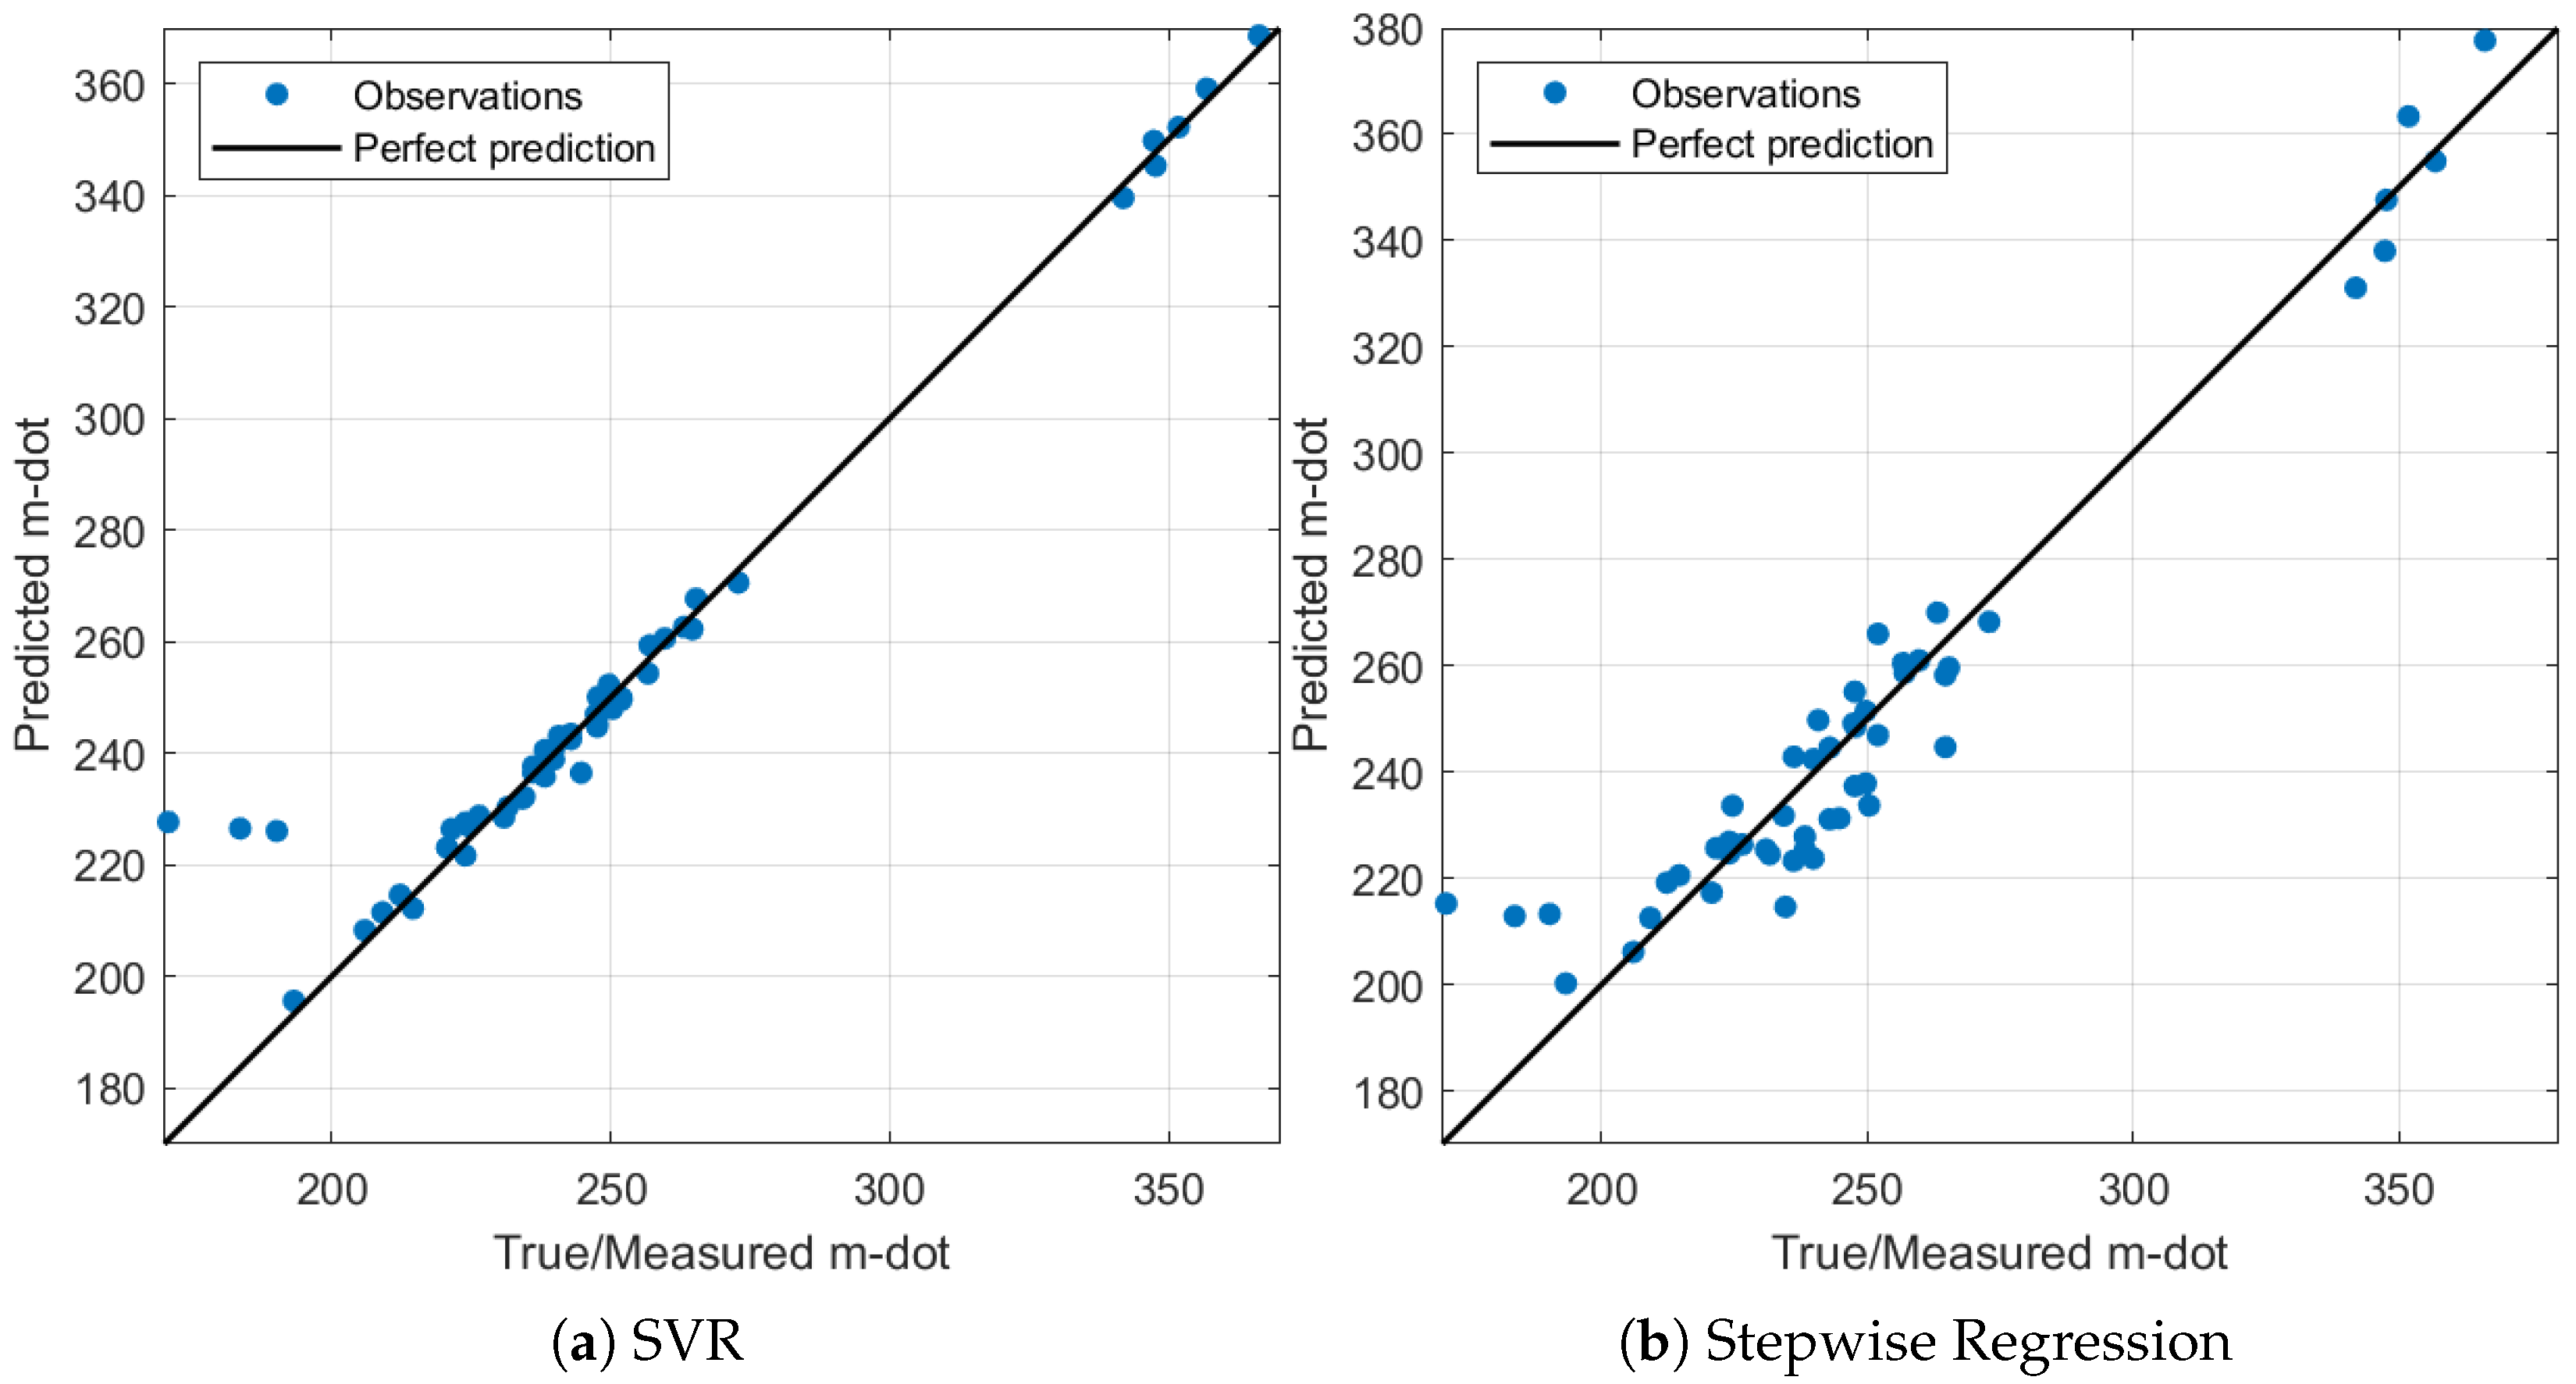
Figure 5 shows the predicted versus true response of the two models, which indicates how well they perform on the observations.
The graph shows three outlier points for each model; the predicted m ˙ values are greater than the measured values m ˙ of 170.2, 183.6, and 190.2 [ts/hm3]. Interestingly, these three points are from the same deposit (sample 5 from Table 1) and correspond to HPGR tests that yielded a lower throughput than expected indicating the limits of the model. Mineral samples that result in a specific throughput lower than 200 [ts/hm3] usually have material characteristics that do not allow the HPGR operational gap to expand and thus may not be amenable for HPGR comminution.
The SVR is a “black box” regression model that can perform very well with little data. Regardless, it is not trivial to report and analyze. Additionally, some data points do not perform well with the SVR model, as shown in Figure 5a.
For simplicity and explainability, the chosen model is the ISWR considering the variables’ first-order interactions. This model can be explained and written as an easy-to-understand formula. The predictor candidates with a p-value over 0.05 are removed from the model. As well, linear dependent terms are removed regardless of their p-value. No quadratic terms were kept on the model, and only one interaction was not removed. The model significantly improved the linear model by adding the moisture and roll speed interaction.
The following is the linear regression model obtained through this methodology (following Wilkinson notation [31]):
m ˙ 1 + H + V R + E S P + F S P + ρ B + F V 1 + F V 2 + F V 3 + X P 1 + X P 2 + X P 3 + H · V R
Table 5 shows each predictor’s estimated intercept and coefficients and their standard error.
The resulting model has a R2 of 0.91 and an adjusted R
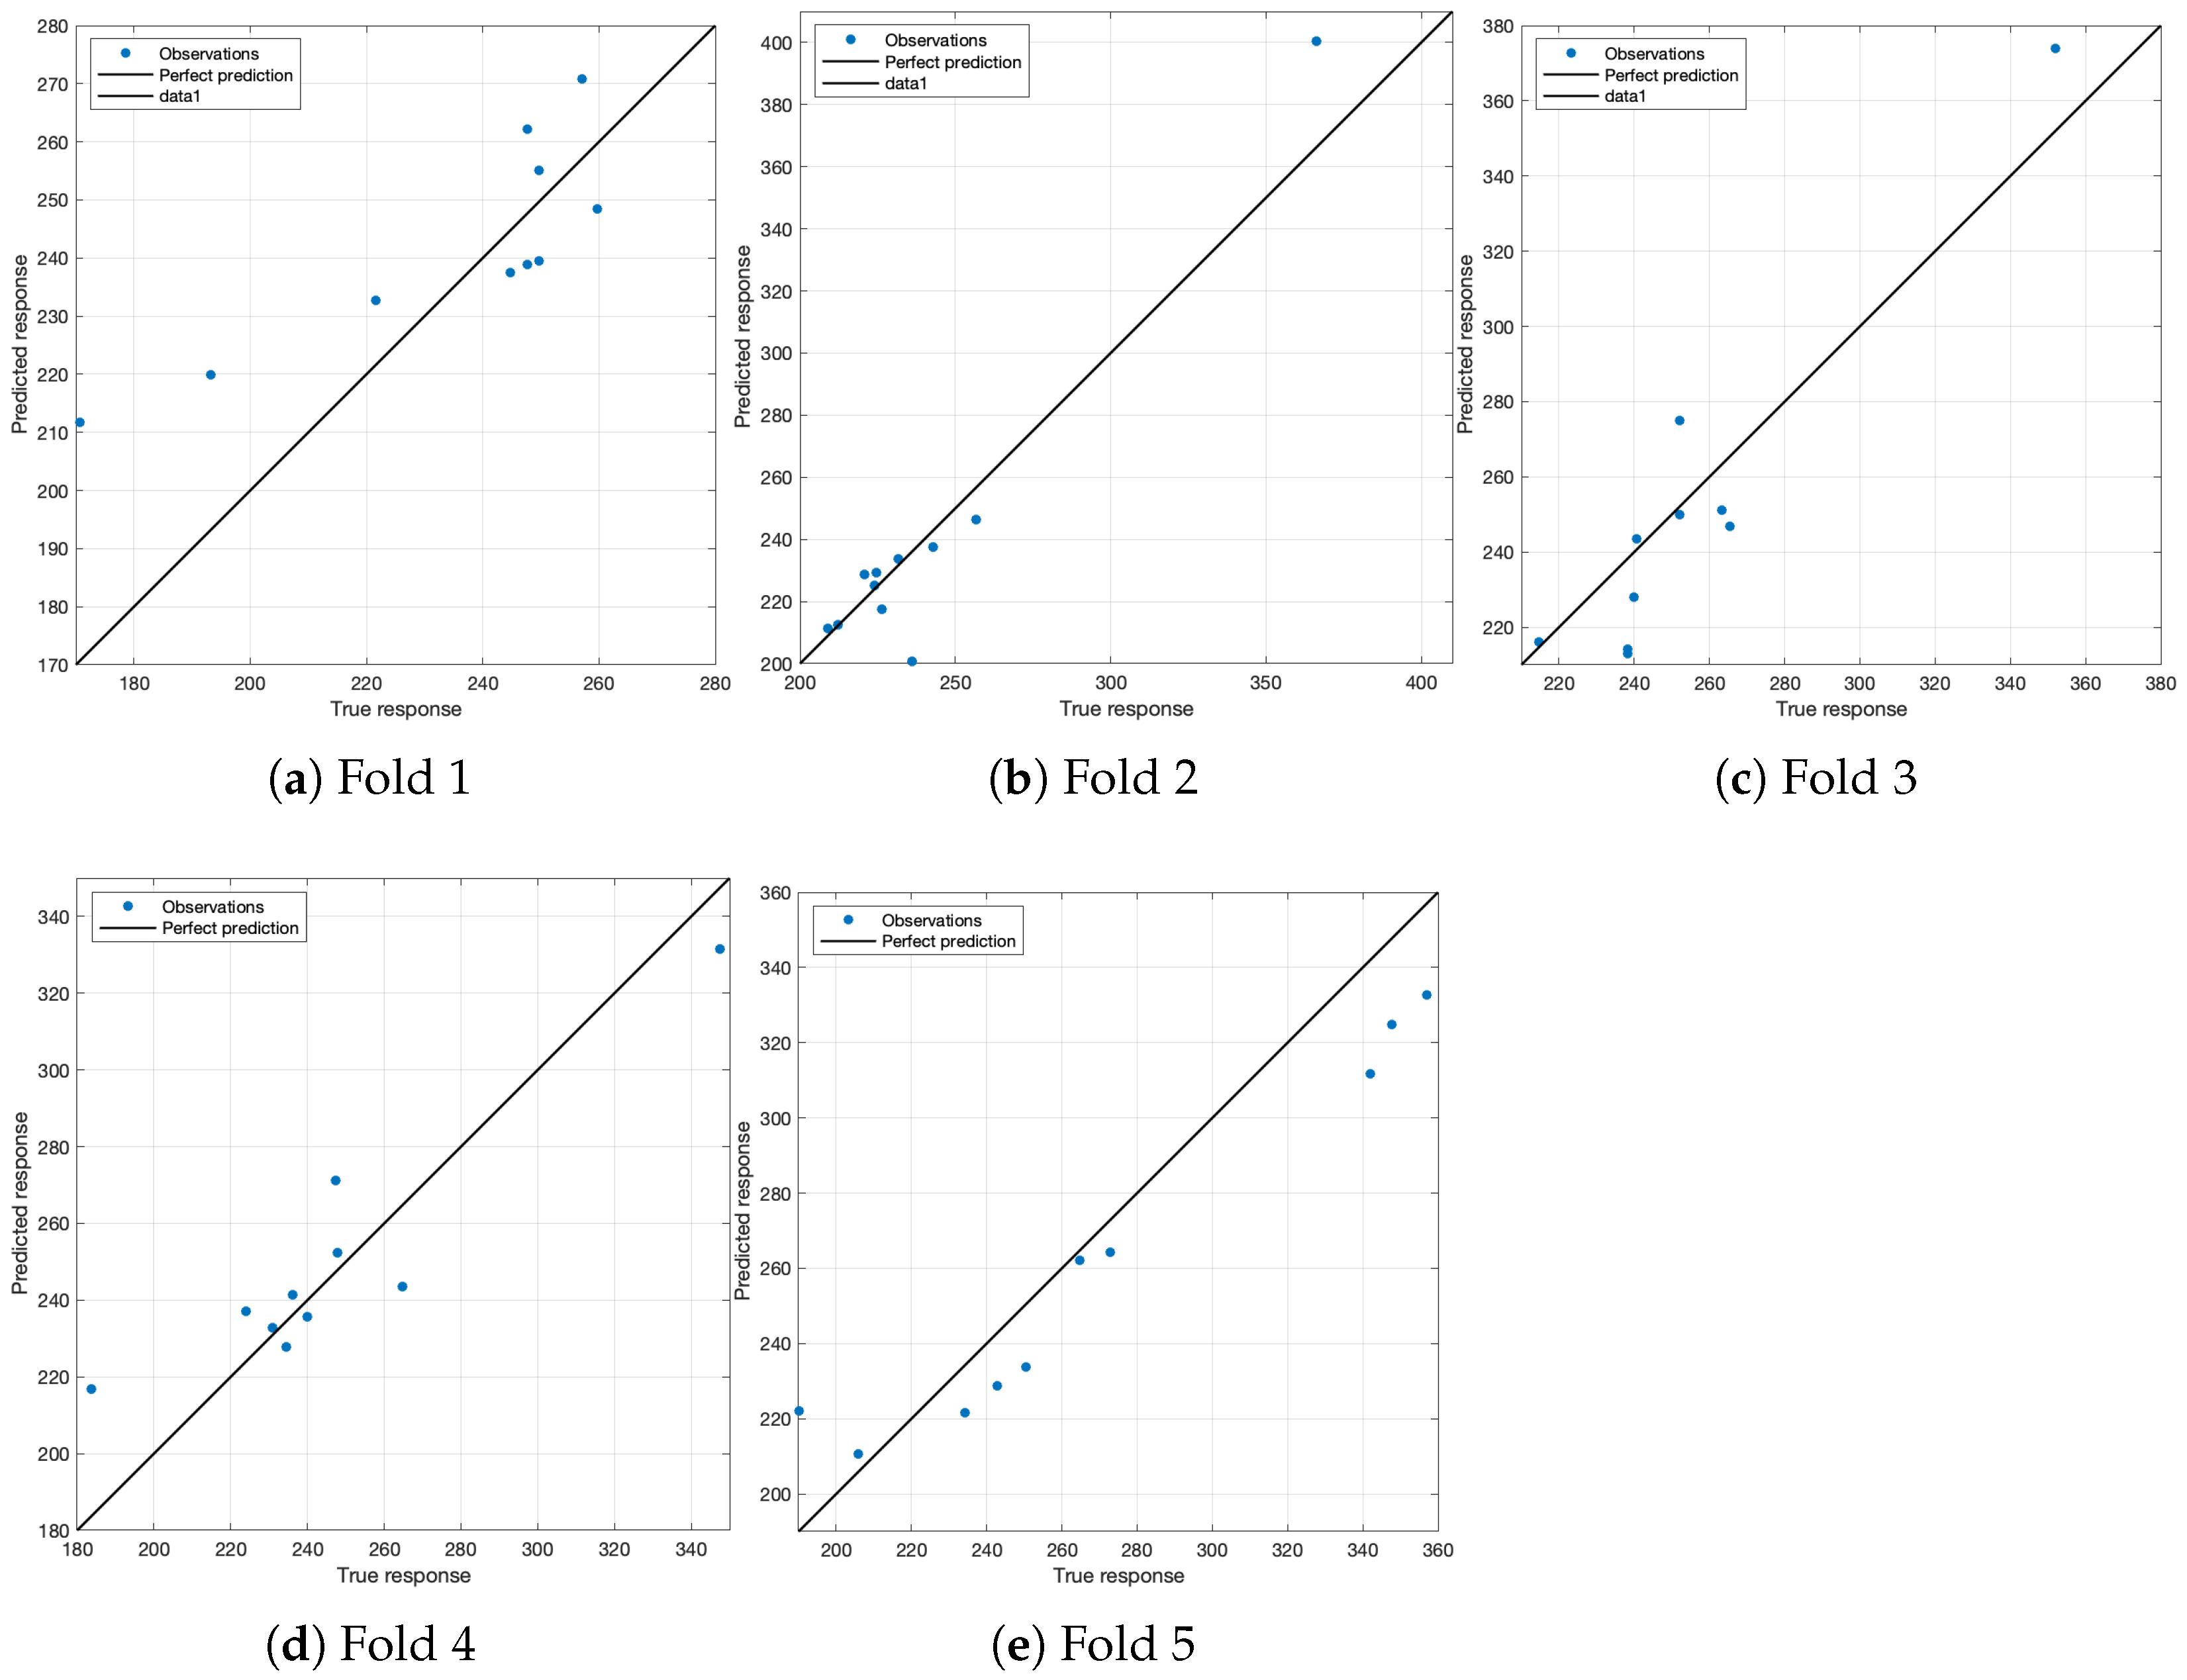
2 of 0.884 with a root mean squared error of 12.8 and an average relative error of ±4.2%. The results of the 5-fold cross-validation are shown in Table 6 and Figure 6, which indicate good performance and reliability of the model.

5. Conclusions

A specific throughput model was developed for the HPGR, which uses several operational parameters and the results from compressing three different volumes on the piston press test. Using this model, it is possible to size the capacity without performing new pilot-scale HPGR tests with a high confidence level. The piston press tests performed to predict the throughput follow a volumetric approach allowing for assessing the compressibility change of the material when using different volumes.
If pilot-scale tests are available, it is possible to make an accurate prediction for the specific throughput of the HPGR. This is due to the availability of the specific energy consumption of the HPGR and the possibility of interpolating these values for a new prediction. In the absence of pilot-scale HPGR tests, it is possible to predict the specific energy consumption of the HPGR following the database methodology developed at the University of British Columbia.
A stepwise regression model was used to fit the data where the interactions and quadratic terms of the variables are also considered. All the linear variables and only the moisture interaction with the HPGR roll speed were kept on the model. The resulting model is a very good fit for the data with a high R2 value, and a low root mean squared error. The average relative error for the predictions is under 5%, indicating the high accuracy of the model.

Author Contributions

Conceptualization, G.P. and B.K.; Data curation, G.P.; Formal analysis, G.P. and M.G.B.; Funding acquisition, B.K.; Investigation, G.P.; Methodology, G.P.; Resources, B.K.; Software, G.P.; Supervision, B.K. and M.G.B.; Validation, G.P.; Writing—original draft, G.P.; Writing—review & editing, B.K. and M.G.B. All authors have read and agreed to the published version of the manuscript.

Funding

This work was supported by the Agencia Nacional de Investigacion y Desarrollo (ANID) Scholarship Program Doctorado Becas Chile 2018-72190606 and Mitacs Accelerate Program.

Institutional Review Board Statement

Not applicable.

Informed Consent Statement

Not applicable.

Data Availability Statement

Not applicable.

Acknowledgments

The authors would like to acknowledge Köppern for allowing the use of the pilot machine for research.

Conflicts of Interest

The authors declare no conflict of interest.

References

  1. Schönert, K. A first survey of grinding with high-compression roller mills. Int. J. Miner. Process. 1988, 22, 401–412. [Google Scholar] [CrossRef]
  2. Saramak, D.; Tumidajski, T.; Brożek, M.; Gawenda, T.; Naziemiec, Z. Aspects of comminution flowsheets design in processing of mineral raw materials. Gospod. Surowcami Miner. 2010, 26, 59–69. [Google Scholar]
  3. Morrell, S. Helping to reduce mining industry carbon emissions: A step-by-step guide to sizing and selection of energy efficient high pressure grinding rolls circuits. Miner. Eng. 2022, 179, 107431. [Google Scholar] [CrossRef]
  4. Campos, T.M.; Bueno, G.; Tavares, L.M. Confined Bed Breakage of Fine Iron Ore Concentrates. Minerals 2020, 10, 666. [Google Scholar] [CrossRef]
  5. Ghorbani, Y.; Mainza, A.; Petersen, J.; Becker, M.; Franzidis, J.P.; Kalala, J. Investigation of particles with high crack density produced by HPGR and its effect on the redistribution of the particle size fraction in heaps. Miner. Eng. 2013, 43–44, 44–51. [Google Scholar] [CrossRef] [Green Version]
  6. Daniel, M.; Klein, B.; Wang, C. High-Pressure Grinding Roll Technology. In SME Mineral Processing & Extractive Metallurgy Handbook; Society for Mining, Metallurgy, and Exploration (SME): Englewood, CO, USA, 2019. [Google Scholar]
  7. Rashidi, S.; Rajamani, R.K.; Fuerstenau, D.W. A Review of the Modeling of High Pressure Grinding Rolls. KONA Powder Part. J. 2017, 34, 125–140. [Google Scholar] [CrossRef] [Green Version]
  8. Dundar, H.; Benzer, H.; Aydogan, N. Application of population balance model to HPGR crushing. Miner. Eng. 2013, 50–51, 114–120. [Google Scholar] [CrossRef]
  9. Benzer, H.; Dündar, H.; Altun, O.; Tavares, L.M.M.; Powell, M.; Mazzinghy, D.B.; Russo, J.F.C. HPGR simulation from piston-die tests with an itabirite ore. REM—Int. Eng. J. 2017, 70, 99–107. [Google Scholar] [CrossRef] [Green Version]
  10. Nadolski, S.; Bamber, A.S.; Klein, B.; Drozdiak, J. Investigation into Laboratory Scale Tests for the Sizing of High Pressure Grinding Roll. In Proceedings of the Autogenous and Semi-autogenous Grinding Technology Conference, Vancouver, BC, Canada, 25–28 September 2011. [Google Scholar]
  11. Davaanyam, Z. Piston Press Test Procedures for Predicting Energy–Size Reduction of High Pressure Grinding Rolls. Ph.D. Thesis, The University of British Columbia, Vancouver, BC, Canada, 2015. [Google Scholar]
  12. McClintock, M. Validation of Methodologies for Sizing a High Pressure Grinding Roll. Ph.D. Thesis, University of British Columbia, Vancouver, BC, Canada, 2018. [Google Scholar] [CrossRef]
  13. Wang, C. Development of a Comprehensive HPGR Model Using Large Experimental Data Sets. Ph.D. Thesis, University of British Columbia, Vancouver, BC, Canada, 2021. [Google Scholar] [CrossRef]
  14. Morrell, S.; Lim, W.; Shi, F.; Tondo, L. Modelling of the HPGR Crusher. In Comminution Practices; Kawatra, Ed.; SME: Denver, CO, USA, 1997; pp. 117–126. [Google Scholar]
  15. Schönert, K.; Lubjuhn, U. Throughput of high compression roller mills with plane and corrugated rollers. In Proceedings of the 7th European Syposium on Comminution, Ljubljana, Yugoslavia, 12–14 June 1990; pp. 213–217. [Google Scholar]
  16. Lubjuhn, U.; Schönert, K. Material flow in the acceleration zone and throughput of high pressure roller mills. In Proceedings of the XVIII International Mineral Processing Congress (IMPC), Sydney, Australia, 23–28 May 1993; pp. 161–168. [Google Scholar]
  17. Saramak, D.; Naziemiec, Z. Determination of the nip zone angle in high-pressure grinding rolls. Physicochem. Probl. Miner. Process. 2013, 49, 243–253. [Google Scholar]
  18. Morley, C. High pressure grinding rolls: A technology review. In Advances in Comminution; SME Inc.: Littleton, CO, USA, 2006; pp. 15–39. [Google Scholar]
  19. Klymowsky, R.; Patzelt, N.; Knecht, J.; Burchardt, E. Selection and sizing of high pressure grinding rolls. Miner. Process. Plant Des. Pract. Control. Proc. 2002, 1, 636–668. [Google Scholar]
  20. Fuerstenau, D.W.; Abouzeid, A.Z.M. The performance of the high pressure roll mill: Effect of feed moisture. Fizykochem. Probl. Miner. 1998, 32, 227–241. [Google Scholar]
  21. Fuerstenau, D.W.; Abouzeid, A.Z.M. Role of feed moisture in high-pressure roll mill comminution. Int. J. Miner. Process. 2007, 82, 203–210. [Google Scholar] [CrossRef]
  22. Saramak, D.; Kleiv, R.A. The effect of feed moisture on the comminution efficiency of HPGR circuits. Miner. Eng. 2013, 43–44, 105–111. [Google Scholar] [CrossRef]
  23. Pamparana, G.; Klein, B. A methodology to predict the HPGR operational gap by using piston press tests. Miner. Eng. 2021, 166, 106875. [Google Scholar] [CrossRef]
  24. Qiu, X.; Vien, A.; Mular, M.; Alkac, D.; Pate, B. Linking the Packed Bed Test to Full Size HRC™ HPGR Performance; SAG: Vancouver, BC, Canada, 2019; p. 21. [Google Scholar]
  25. Nadolski, S. Development of a Laboratory Scale Procedure for Predicting throughput of High Pressure Grinding Rolls. Ph.D. Thesis, The University of British Columbia, Vancouver, BC, Canada, 2012. [Google Scholar]
  26. Davaanyam, Z.; Klein, B.; Nadolski, S. Using piston press tests for determining optimal energy input for an HPGR operation. In Proceedings of the Sixth International Conference on Semi-Autogenous and High Pressure Grinding Technology, Vancouver, BC, Canada, 20–24 September 2015. [Google Scholar]
  27. Li, K.C. Asymptotic Optimality for Cp, CL, Cross-Validation and Generalized Cross-Validation: Discrete Index Set. Ann. Stat. 1987, 15, 958–975. [Google Scholar] [CrossRef]
  28. Fushiki, T. Estimation of prediction error by using K-fold cross-validation. Stat. Comput. 2011, 21, 137–146. [Google Scholar] [CrossRef]
  29. Smola, A.J.; Schölkopf, B. A tutorial on support vector regression. Stat. Comput. 2004, 14, 199–222. [Google Scholar] [CrossRef] [Green Version]
  30. Kabe, D.G. Stepwise Multivariate Linear Regression. J. Am. Stat. Assoc. 1963, 58, 770–773. [Google Scholar] [CrossRef]
  31. Wilkinson, G.N.; Rogers, C.E. Symbolic Description of Factorial Models for Analysis of Variance. Appl. Stat. 1973, 22, 392. [Google Scholar] [CrossRef]
Figure 1. Köppern pilot-scale HPGR at UBC used to run the tests.
Minerals 12 01377 g001
Figure 2. MTS Hydraulic Press at UBC used for the study with the piston and the die installed.
Minerals 12 01377 g002
Figure 3. PPT procedure scheme.
Minerals 12 01377 g003
Figure 4. Material compression on the PPT: (a) Uncompressed material in die; (b) Material after compression; (c) Unloaded compressed material.
Minerals 12 01377 g004
Figure 5. Specific throughput predicted vs. true response plots for the selected models.
Minerals 12 01377 g005
Figure 6. ISWR k-fold cross-validation plots.
Minerals 12 01377 g006
Table 1. Ores used for HPGR and PPT testing.
SampleMetalOre TypeAxbBBWi [kWh/t]Moisture
1Gold OreGold22–3512.3–17.22.5%
2Nickel OreNickel-Copper25–3315.6–24.22.4%
3Iron OreHematite--3%
4Iron OreHematite--6%
5Copper OreCopper-Moly3118.03%
6Copper OreCopper-Gold-Silver23–4018.0–22.02.5%
7Copper OreCopper-Gold23–4018.0–24.03.5%
8Copper OreCopper-Gold23–4018.0–24.03.5%
Table 2. Summary of operation parameters.
EquipmentParameterUnitsOperation Range
HPGRSpecific Force[N/mm2]2–5
Roll Speed[m/s]0.35–0.76
Moisture Content[%]2.4%–6%
PPTPressing Force[kN]1400
Volume[ml]180, 240, 300
Table 3. Variables used for modeling.
VariableUnitsDescriptionMinMax
H[%]Test moisture content2.46.0
Vr[m/s]HPGR rollers speed0.350.76
ESP[kWh/t]HPGR specific energy consumption target1.23.1
FSP[N/mm2]HPGR specific pressing force2.05.0
ρ B[g/l]Sample bulk density1.391.90
FV1[kN]PPT force required to obtain the required specific energy using a 180 mL sample8263356
FV2[kN]PPT force required to obtain the required specific energy using a 240 mL sample8973400
FV3[kN]PPT force required to obtain the required specific energy using a 300 mL sample9523838
Xp1[mm]PPT compressed thickness when applying FV137.343.7
Xp2[mm]PPT compressed thickness when applying FV230.338.4
Xp3[mm]PPT compressed thickness when applying FV320.931.5
m-dot[ts/m3h]HPGR specific throughput170366
Table 4. Tested algorithms to fit the specific throughput model.
ModelR2RMSEMAEMREValidation R2Validation RMSE
Interactions Stepwise Regression0.9112.809.964.2%0.8417.24
Multi-linear Regression0.8019.3215.636.8%0.6625.01
Linear Stepwise Regression0.9211.818.593.7%0.2537.27
Neural Network1.000.50.430.2%−0.8333.68
Gaussian Process Regression1.000.030.020.1%0.5927.53
Support Vector Regression0.9112.665.282.6%0.8218.21
Tree Ensemble0.968.405.722.5%−0.233.80
Table 5. Linear regression coefficients.
PredictorCoefficientSE
Intercept961.14225.95
H−189.1927.02
VR−927.79124.71
ESP−102.5323.30
FSP5.0210.67
ρ B341.4758.55
FV1−0.020.03
FV2−0.020.02
FV30.090.03
Xp1−43.6512.54
Xp2−10.038.90
Xp355.139.76
H·VR333.7247.87
Table 6. ISWR k-fold cross-validation results.
k-FoldR2RMSE
10.5918.20
20.8615.78
30.7616.95
40.8316.29
50.8819.42
Publisher’s Note: MDPI stays neutral with regard to jurisdictional claims in published maps and institutional affiliations.

