
Order–Disorder Diversity of the Solid State by NMR: The Role of Electrical Charges

1
Museo Nacional de Ciencias Naturales (CSIC), José Gutierrez Abascal 2, 28006 Madrid, Spain
2
Centre National de la Recherche Scientifique (CNRS), UPR3079 CEMHTI, Université d’Orléans, 1D Av. de la Recherche Scientifique, CEDEX 2, 45071 Orléans, France
3
National High Magnetic Field Laboratory (NHMFL) 1800 East, Paul Dirac Drive, Tallahassee, FL 32310, USA
4
Institute of Ceramics and Glass (CSIC), Kelsen 5, 28049 Madrid, Spain
*
Author to whom correspondence should be addressed.
Minerals 2022, 12(11), 1375; https://doi.org/10.3390/min12111375
Submission received: 23 June 2022
/
Revised: 10 October 2022
/
Accepted: 25 October 2022
/
Published: 29 October 2022
(This article belongs to the Special Issue NMR Spectroscopy in Mineralogy and Crystal Structures)
Abstract
:The physical explanations and understanding of the order–disorder phenomena in the solid state are commonly inferred from the experimental capabilities of the characterization techniques. Periodicity is recorded according to the averaging procedure of the conventional reciprocal-space techniques (RSTs) in many solids. This approach gives rise to a sharp trimodal view including non-crystalline or amorphous compounds, aperiodic crystals and periodic crystals. However, nuclear magnetic resonance (NMR) spectroscopy offers an alternative approach that is derived from the distinct character of the measurements involved at the local scale. Here, we present a sequence of progressive order–disorder states, from amorphous structures up to fully ordered mineral structures, showing the great diversity existing in the solid state using multinuclear NMR spectroscopy. Some examples in glasses and products of their crystallization are used, as well as several minerals (including beryl-group and feldspar-group minerals) at magnetic fields up to 35.2 T, and some examples from literature. This approach suggests that the solid state is a dynamic medium, whose behavior is due to atomic adjustments from local compensation of electrical charges between similar structural states, which explains Ostwald’s step rule of successive reactions. In fully ordered feldspar minerals, we propose that the electronic structure of the elements of the cavity site is involved in bonding, site morphology and feldspar topology. Furthermore, some implications are derived about what is a mineral structure from the point of view of the NMR experiments. They open the possibility for the development of the science of NMR Mineralogy.
1. Introduction
The descriptions and interpretations that have been given to explain the origin of the structures of the solid state have been changing throughout history, depending on the available techniques of characterization and the previously existing models. At present, our understanding of the solid state in direct space comes from information provided by reciprocal-space techniques (RSTs). Its model is expressed through the concept of “crystal”, which is a mathematical object with defined geometric and symmetrical characteristics, where the dense packing of spherical atoms and the resulting periodicity are its fundamental characteristics.
There are many solids and minerals that do not fit with this idealized approach, however. They contain discordant elements, and thus they have been considered as amorphous, non-crystalline, imperfect, anomalous, hybrids, and defective solids. As a result, all such solids have been excluded, or have not been used with the same interest, for the generation of explanatory models. Furthermore, many of these neglected solids are currently explained with the same principles, as if the solids actually can be made to fit that dominant model. The concept of “mineral” has also been highly influenced by that of “crystal”, as well as by the possibilities of analytical techniques for determining chemical composition, where stoichiometry is also seen as a fundamental character linked to the periodicity of crystals. The progressive discovery of the increasing structural, chemical and textural diversity that exists in natural and synthetic solids has frequently collided with the expectations created by the a priori models. At present, we know that all instrumental techniques have specific analytical possibilities and that they are limited by their power of resolution in both the spatial and temporal scales.
In this work, we offer an alternative interpretation of the solid state by paying attention to both aspects. We take into account a wide range of solid types in terms of degrees of order–disorder series and in solid-solution series, but also use high-resolution NMR techniques, mainly on aluminosilicate frameworks and in particular on feldspar-group minerals, and also glasses and products of their crystallizations. In this approach, a mineral is any natural or synthetic solid compound with either a stoichiometric or non-stoichiometric composition. Hence, an alternative perspective to the geometric spatial model is suggested, and a new physicochemical explanation is presented on an empirical basis, where electric charges have a fundamental role, including not only the low-energy valence electrons of the last shells, but also the high-energy electrons from within.
2. Background
The physical understanding and explanations of order–disorder phenomena in the solid state are mainly determined by the characteristics of the investigated materials used for this research and the limitations of the experimental techniques used. Minerals or available natural solids have been the main solid materials used for the construction of theoretical idealizations in crystals, and the physical explanations of their order–disorder phenomena. In recent times, synthetic compounds have also been used with these objectives. However, the capabilities to generate order and structural diversity in natural minerals are remarkable due to geological time scales, absent in the experimental circumstances of the laboratory.
Idealizations about crystal structures derived from experimental data on minerals started with goniometry in the 18th century, optical microscopy in the 19th century, continued with X-ray diffraction in the first part of the 20th century, and with spectroscopic techniques mainly in the second part of the 20th century. Goniometric measurements of minerals only allowed the separation between crystalline substances with euhedral habits on one side, having constant interfacial angles in crystals or regular morphological units at the macroscopic scale when measuring the same mineral species, and non-crystalline anhedral substances on the other side, for amorphous (i.e., without shape) solid minerals. This experimental methodology produced the identification and definition of the symmetry systems in crystals as the basic idealization for the description of natural order. However, with the discovery of optical microscopy, and the examination of many minerals in thin sections, it was found that most minerals with a crystalline habit were actually composed of twins, sectors, fine intergrowths and other heterogeneities, thus not being true crystals as expected from a priori models. A higher resolution at the atomic scale was needed to define the origin of the symmetry at the macroscopic scale, in order to obtain new data for the description of crystals according to such models.
Reciprocal-space techniques (RSTs), such as X-ray diffraction (XRD), neutron diffraction, and selected-area electron diffraction (SAED) patterns, take the advantage of the diffraction phenomenon in crystalline minerals by a suitable radiation wavelength. From this approach, a mineral or any solid is a crystal if its atoms, ions and/or molecules form, on average, a long-range ordered arrangement in direct space. Thus, the reciprocal-space definition indicates that a solid is a crystal if it has essentially a sharp (point-like) diffraction pattern [1]. These Bragg peaks are commonly used to build up a lattice model in the form of “ideal” crystals, involving cell parameters and space-group symmetries. These experimental techniques have produced a classification of solids in a trimodal distribution, depending on the character of the described lattice: (i) “amorphous solids”, which do not have Bragg peaks and thus do not have a lattice, though showing remarkable diffuse scattering because of aperiodicity; (ii) “aperiodic crystals”, which have structures that produce sharp Bragg peaks, but lack strict three-dimensional lattice periodicity and, consequently, with extremely common diffuse scattering; and (iii) “periodic crystals”, which have structures with, ideally, sharp diffraction peaks that can be used to build up a reciprocal lattice. However, many “real” crystals (for instance, common minerals) almost always present diffuse scattering in their diffraction patterns, which is often ignored when an ideal lattice model is constructed. Thus, an additional distinction in real crystals is required to separate and to distinguish between “perfect crystals”, with Bragg peaks and an absence of diffuse scattering, and “imperfect crystals” with “average structures” where both Bragg peaks and diffuse scattering are resolved. Alternatively, a perfect crystal can also be defined as one in which only point defects exist, such as thermal vacancies or impurities, and as allowed by states close to thermodynamic equilibrium [2].
It is important to note that periodicity is derived from the measurement of long-range order–disorder, which is explained as the periodic filling of space by atoms, in most cases by using atoms with spherical shapes. In contrast, “glassy” materials are generally described as amorphous solids because they lack this periodic packaging. However, the measured periodicity is very commonly the result of an averaging procedure inseparable from the physical character of the experimental capabilities. These averaged data are produced in size domains of 50–100 nm for having a coherent X-ray diffraction phenomenon [3]. Therefore, if the scale of repeating structural motifs, the small deviations from the averaged predominant regularities, and also diffuse scattering are ignored (for instance in the case of atomic disorder of stoichiometric or non-stoichiometric compounds), only “ideal” crystals with periodic models are obtained. These crystals may be described as “real” minerals, actually having aperiodic structures (pseudoperiodic or strictly non-periodic structures), but with order only at the local scale.
In this case, long-range disordered structures with true medium-range order are perceived as ideal long-range ordered structures avoiding, in fact, the atomic schemes at the medium range also. It is also the case in fine coherent intergrowths of two phases where the abnormal lattice parameters and space-group symmetries are the result of lattice strain. In these cases, the crystalline models are the products of rational idealizations rather than descriptions of the true structures in the available order–disorder states of nature. These rationalizations impose axiomatic periodicity that can hide some real structural features of minerals [4,5], and thus they avoid alternative explanations of the ordered atomic schemes existing in minerals.
Nuclear magnetic resonance (NMR) offers an alternative approach to the understanding of order–disorder states found in minerals as well as in glasses [4,5,6,7,8,9,10,11,12,13,14,15,16,17,18,19,20,21,22]. In this review, we have selected some examples from our own experimental works, but also include some new experimental results, to develop a scheme of structural order–disorder states between highly disordered structures and fully ordered and nearly stoichiometric mineral structures. This spectroscopic technique produces information about statistical distributions of atomic sites at the local scale instead of averaged single values of structural dimensions. The resolving power of discrete signals in NMR does not depend on the size of homogeneous volumes but on the existence of populations of atoms having similar local configurations in terms of similar chemical environments, the surrounding electrical charges and/or local bonding geometries.
The values of chemical shifts of the different resonances are thus related to different chemical environments and local geometries, giving rise to spectroscopically distinct sites. However, the spectroscopically distinct sites from short-range order resolved by NMR are not always coincident with the crystallographically distinct sites expected from RSTs [22]. The chemical environments distinguishable by NMR are coincident with the diffraction sites if the short-range atomic correlations reach distances at the long-range scale, to give rise to strictly periodic patterns, i.e., only in the case of perfect or quasi-perfect crystals. In this case, the same atomic configurations occurring at the local scale are reproduced throughout the whole crystalline volume without changes, giving rise to correlations that are accessible to the resolving-power of the averaging procedure of the RSTs. However, where chemical disorder exists, such as in order–disorder series and in solid-solutions series, the active nuclei can produce different resonances for each discrete chemical environment. Positional disorder from the lack of strict periodicity is recorded as a widening of signals, because atoms have site distributions instead of lattice sites, lowering the resolution of discrete spectroscopically distinct sites in a structure. Spectral resolution is also limited in quadrupolar nuclei where the spectral characteristics of different atomic sites are similar, resulting in uncertainties that are difficult to overcome. Hence, the NMR techniques produce complementary and, in certain cases, unique information about the atomic configurations in the solid state, including in addition specimens having an imperfect long-range order, which is the general case in minerals, particularly in feldspars.
Consequently, the NMR techniques open up new possibilities of expanding the description of the structural diversity in the solid state, particularly by using it in glasses, the product of their crystallization and minerals. This perspective can be called NMR Mineralogy as a complementary approach to modern mineralogy that mainly rests on XRD and chemical data. In addition, NMR allows the development of alternative explanations on the origin of structural order in the solid state. These explanations have not yet been fully explored, although chemical composition is often suggested as an alternative to geometry as the cause of crystallization.
Here, we show the great diversity that exists in the atomic structures of the solid state, as revealed from NMR data (Table 1). This diversity has important consequences to decide on how we can describe what a mineral is, including the structural diversity observed in order–disorder series and solid-solution series in the solid state. These are the main criteria used to define different “mineral species”. Finally, a role of electrical charges at different correlation scales is proposed as the driving force for ordering. We suggest that the electronic structure of the cations located at the M site imposes the most stable values to the cation–anion distances, as they appear in the topology of the tetrahedral framework of perfectly ordered structures. Therefore, the electronic structure could also be responsible for the formation of perfect crystals with fully ordered structures at the different length scales.
3. Materials and Methods
3.1. Materials
We have used diverse materials to illustrate different states in order–disorder series and solid-solution series. Their main characteristics will be described in each section.
3.2. Chemical Analysis by Electron Microprobe Analysis (EMPA)
Feldspar specimens used in this work were characterized by spatially resolved quantitative chemical analysis for the major elements Si, Al, Na, K and Ca. We employed an SX-50 instrument at the Institut des Sciences de la Terre d’Orléans (ISTO, CNRS, Olivier Rouer, analyst) and a JEOL Superprobe JXA-8900M instrument at the ICTS Centro Nacional de Microscopía Electrónica (UCM, Madrid, Alfredo Larios Fernández, analyst). The operating conditions were 15 kV and 25 nA, and the spot diameter was between 1 and 5 μm. The ZAF software was used to correct for matrix effects. The chemical compositions of feldspars were expressed as OrxAbyAnz, with x, y and z expressing the molar content of KAlSi3O8, NaAlSi3O8 and CaAl2Si2O8 components in solid solution. We obtained information on chemical homogeneity by obtaining four or five compositions per specimen.
3.3. Powder X-ray Diffraction (XRD) Patterns
Specimens were studied with powder XRD to assess the amorphous character in glasses and to characterize the crystalline species. The glasses and products of their devitrification were studied using a BRUKER D8 Advance Diffractometer equipped with lynxeye (rapid detector) at the Instituto de Cerámica y Vidrio (ICV–CSIC) in Madrid. Plagioclase feldspars and moonstone were studied by powder XRD using a PANanalytical θ–2θ X’Pert PRO, recorded with CuKα1 radiation at 45 kV and 40 mA over a range of 10°–60° 2θ, with a step size of 0.0167° and 100 s time constant time at the Servicio Interdepartamental de Investigación (SIdI–UAM) in Madrid. The unit-cell parameters were acquired by Rietveld refinement using a BRUKER-AXS TOPAS v6 (2016) and Diffrac.Eva 5.1 (2019) from BRUKER AXS, Karlsruhe (Germany). The same procedure was used to quantify the weight proportion of the Or and Ab components in the moonstone intergrowths as well as in NaBO2 and NaBO2·2H2O phases. Finally, the XRD patterns of alkali feldspars with end-member compositions are described in [4]; an INEL CPS 120 equipment was employed with CoKα1 radiation at 30 kV and 25 mA.
3.4. Nuclear Magnetic Resonance (NMR)
Four NMR laboratories produced the experimental results described in this work. These are: (i) the Solid State Nuclear Magnetic Resonance Laboratory (Molecular Spectroscopy Unit) of the Interdepartmental Investigation Service, Universidad Autónoma de Madrid (SIdI-UAM), using a Bruker AV 400 WB spectrometer at 9.4 T for the acquisition of 31P and 11B spectra; (ii) the NMR Support Laboratory of the Instituto de Ciencia de Materiales (ICMM-CSIC), using an AVANCE II (Bruker) equipment at 9.4 T for 29Si and 27Al spectra, as described in detail in [4]; (iii) the RMN Haute Résolution Solide et Haute Température à Conditions Extrêmes et Matériaux: Haute Température et Irradiation (CEMHTI, CNRS), using a Bruker Avance III spectrometer at 9.4 T and 17.6 T for single-pulse experiments in 29Si, 27Al and 23Na spectra, and at 20 T for 29Si–27Al double-resonance magic-angle spinning (MAS) NMR experiments, as described in detail in [22]; (iv) the MagLab, at the U.S. National High Magnetic Field Laboratory (NHMFL) in Tallahassee, Florida, USA, for the 19.6 T experiments in 27Al, 23Na and 39K spectra; the 27Al NMR spectra were performed in some samples at 35.2 T in the DC field facility of the MagLab [23]. The NMR spectra were analyzed by using DMFIT2011 [24] to calculate the isotropic chemical shift δi, the center of gravity of the signals c.g., the quadrupolar constants CQ, the asymmetry factor η, the line width lw of each component, and also the relative areas A of each component of the spectra. Additional details about the NMR experiments, such as MAS frequency of rotation υr, will be presented where used in the Figures.
4. Results
4.1. Non-Crystalline Structures
The first group of solids includes a collection of materials that do not produce Bragg diffraction maxima, but only broad diffuse rings, which reflect the lack of definite interatomic distances [25], i.e., to the lack of periodicity. Glasses, gels, and also some nanopowders produced by mechanosynthesis are commonly labeled “amorphous” because of a lack of sharp diffraction peaks. However, from the point of view of solid- state NMR, four distinct structural types can be discriminated among the amorphous materials (Table 1).
First, highly disordered structures are described here as the disordered end-member from the point of view of resonances that can be resolved. The solid state NMR spectra of these materials consist of a single broad signal in which a coordination polyhedron is inferred as well as an approximate degree of condensation. For Si atoms, Qn may vary (0 ≤ n ≤ 4) from isolated orthosilicate tetrahedral (T) units of Si atoms and four non-bridging oxygen atoms (Q0) to fully polymerized tectosilicate structures without non-bridging oxygen atoms (Q4). However, no additional details can be inferred from the experimental results, e.g., features of the T rings in medium-range structures consisting of between three and more than eight T units.
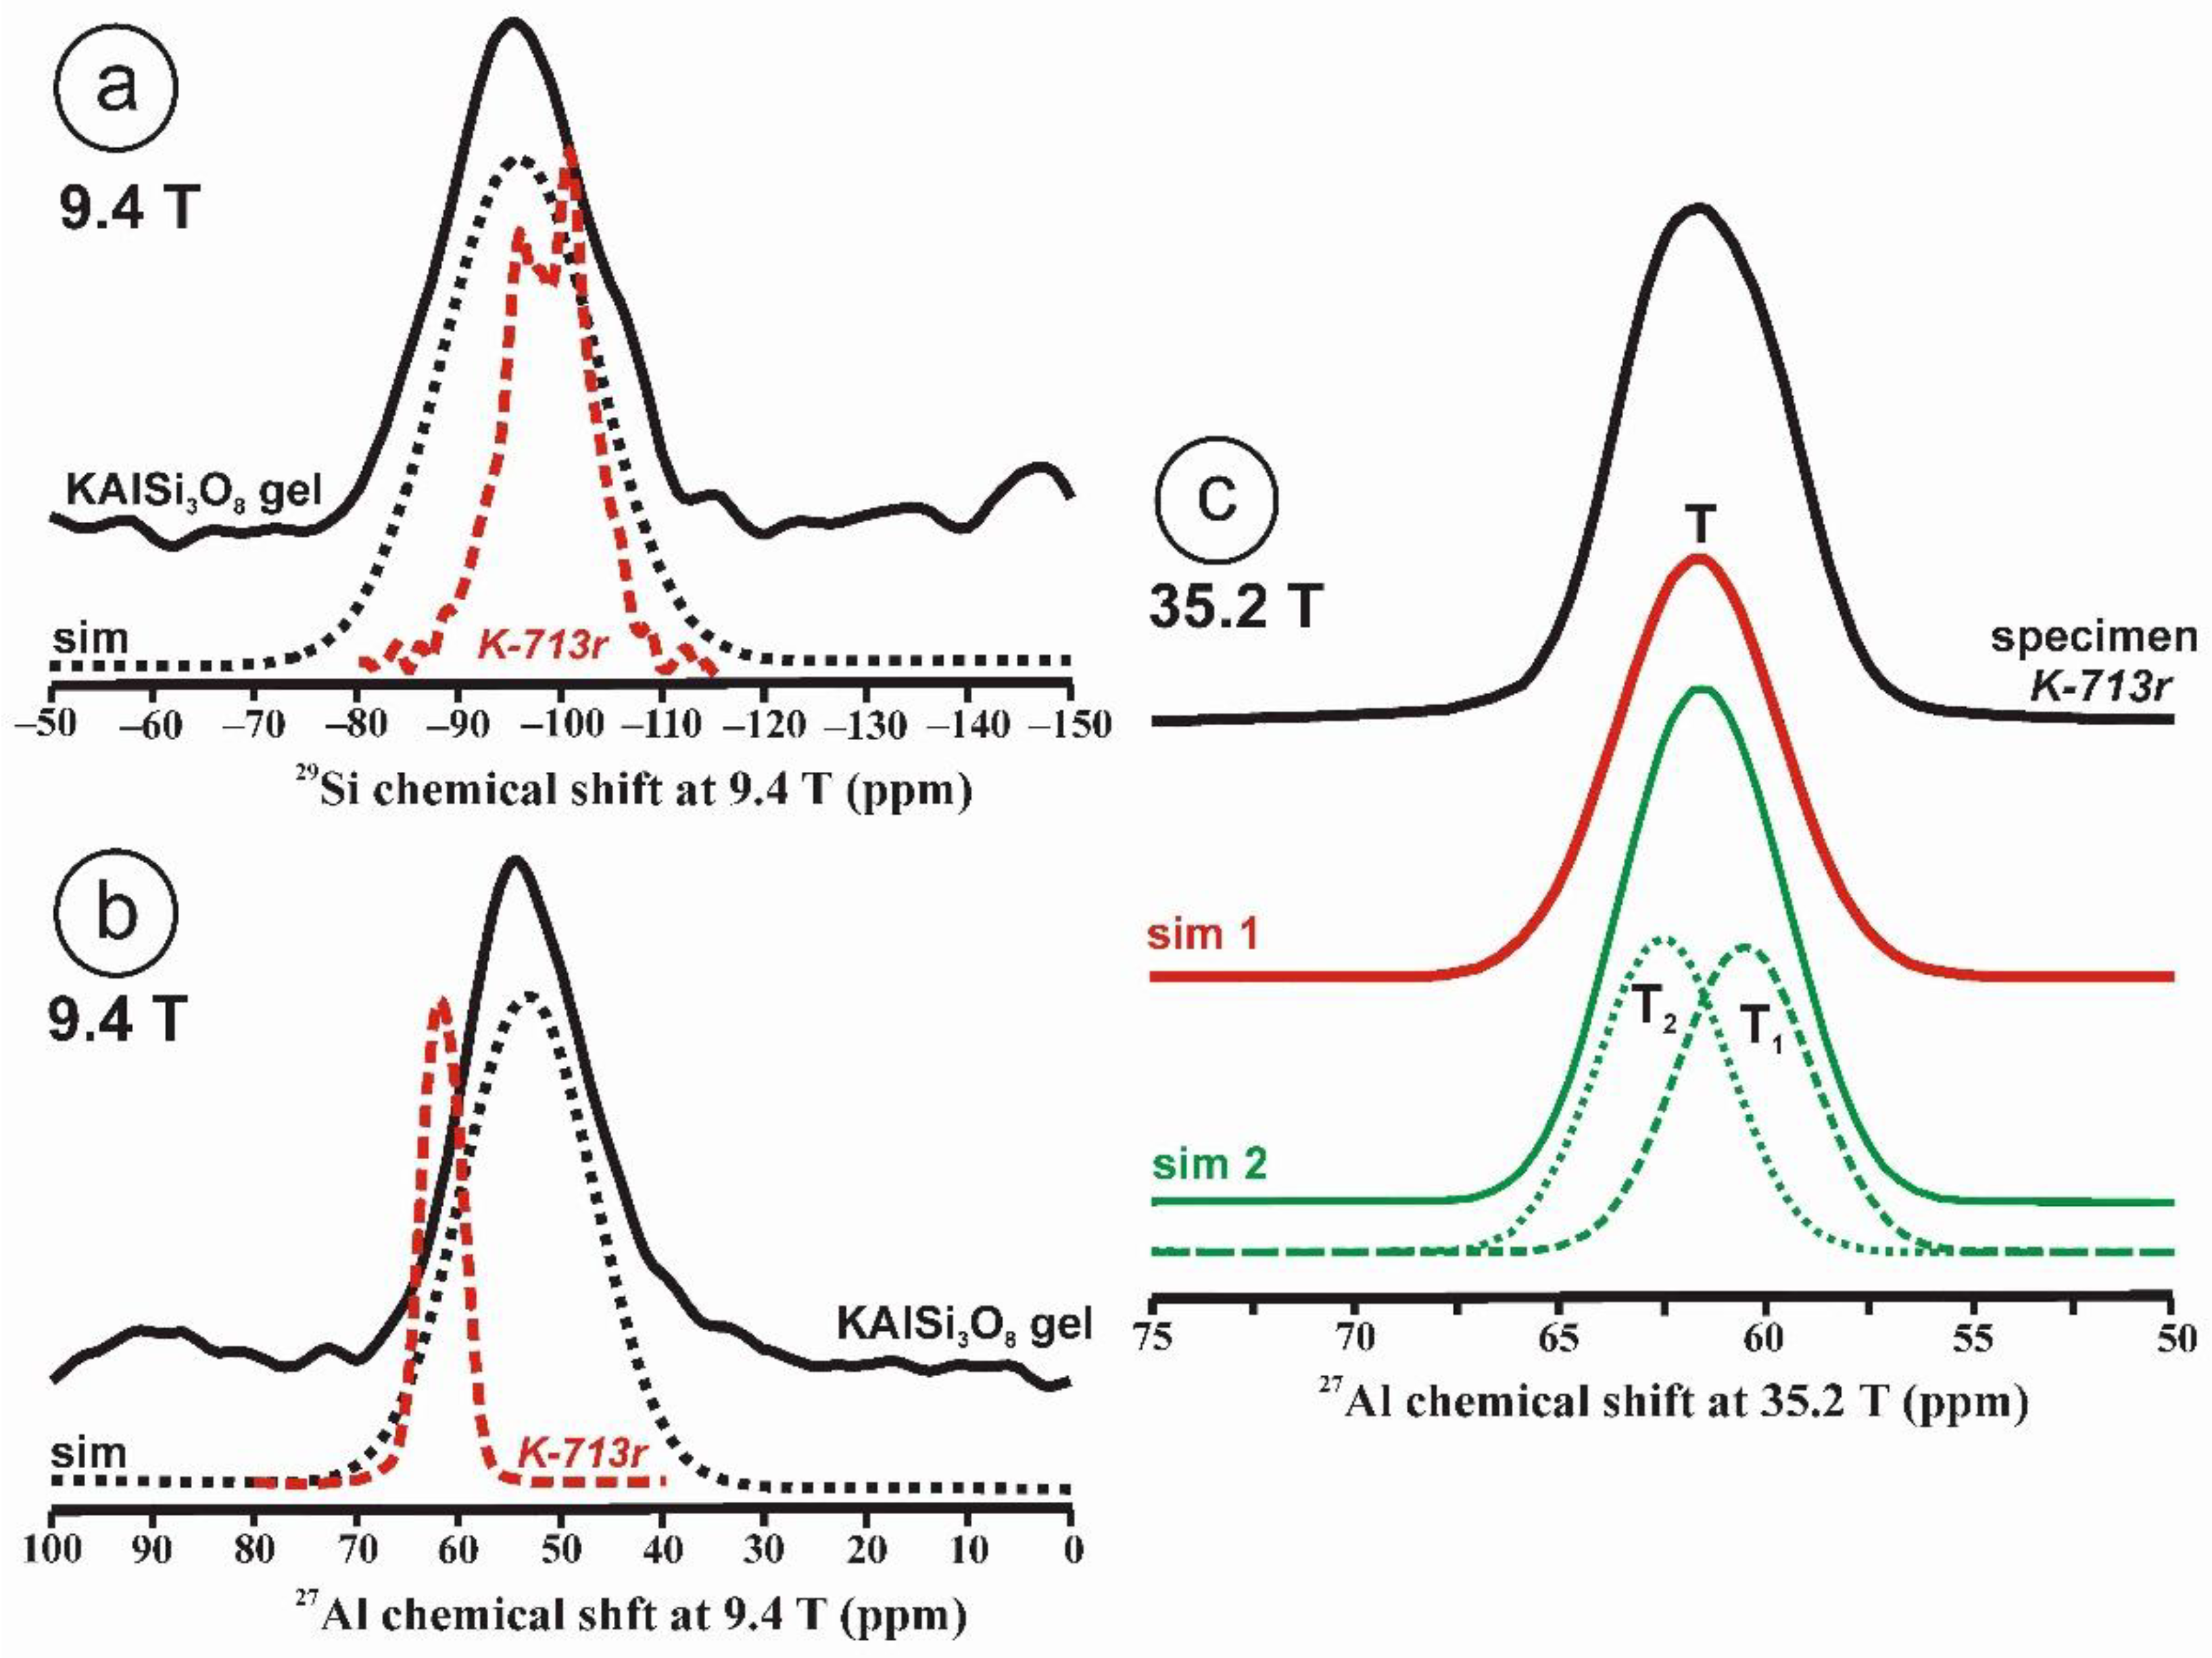
As an example, we have selected a gel of KAlSi3O8 composition. The gel was prepared by using the method of Hamilton and Henderson [26]; K, Al, and Si were introduced into the gel from precursor powdered compounds, K2CO3, tetraethoxysilane (TEOS) and Al(NO3)3·9H2O. The obtained sol-gel was heated up to 450 °C to obtain a gel powder without volatile elements with the desired final stoichiometric composition. This fully disordered solid state is characterized by very broad signals in NMR. Figure 1a,b show the 29Si and 27Al MAS NMR spectra of KAlSi3O8 gel. Both spectra show a single broad resonance attributed to silicon and aluminum atoms in four-fold coordination. The structure of the crystalline KAlSi3O8 consists of statistically distributed SiO4 and AlO4 tetrahedra, where potassium ions provide electrostatic neutrality. In the amorphous gel-like solid, the network is equally built up of a fully polymerized structure of Si–O–Si or Si–O–Al bonds in tetrahedra. The 29Si NMR resonance with a chemical shift of ca. 96 ppm does not allow one to distinguish between groupings that have Si–O–Al bonds from those that do not. This type of disorder would correspond to the general label “amorphous solid”. In this case, spectral resolution is obtained for the first sphere of coordination only.
Figure 1c displays the 27Al spectrum at 35.2 T of sanidine Or78.7Ab21.3 from Eifel (Germany) that has been ion-exchanged into a pure Or100 as specimen K-713r. It represents the first crystalline structure formed from a glass or a gel of the same composition [4]. It is worth noting that the single resonance with c.g. at 61.6 ppm has a similar shape to that in the gel in Figure 1b, although the quadrupolar broadening has been almost totally cancelled. It is not possible to resolve spectroscopically distinct sites owing to the large distributions of chemical shift of the four possible tetrahedral sites than can be inferred from the 29Si spectrum [4]. If two Gaussian curves are used for the simulation of this spectrum, they will have the same area. This relationship between the amorphous precursor and the first crystalline product has been explained as the easiest transformation from a kinetic perspective, or “simplexity principle” as suggested by Goldsmith [27]. The nucleation and growth of disordered phases with higher simplexity (i.e., simplicity) are favored over more stable and ordered compounds of lower simplexity, as an expression of Ostwald’s step rule of successive reactions [28].
In a second stage we point out to chemically ordered structures in which NMR spectra show a range of different resonances related to defined chemical environments. For instance, in a hydrated SiO2 glass, Q3-OH, and Q2-(OH)2 are detected by 29Si CP-MAS NMR [29] in addition to Si atoms at Q4 sites. Herein, we are going to present a much more complex glass structure in the P–O–N system, or so-called oxynitride system. Oxynitride phosphate glasses are typically obtained via ammonolysis reactions of a phosphate parent glass at temperatures where the liquid has a low viscosity, though held below 800 °C to avoid phosphorus reduction. The parent phosphate glass is placed into a graphite mold and subjected to ammonia flow for several hours. Nitridation reactions of phosphate glasses have been recently reviewed by Muñoz [30].
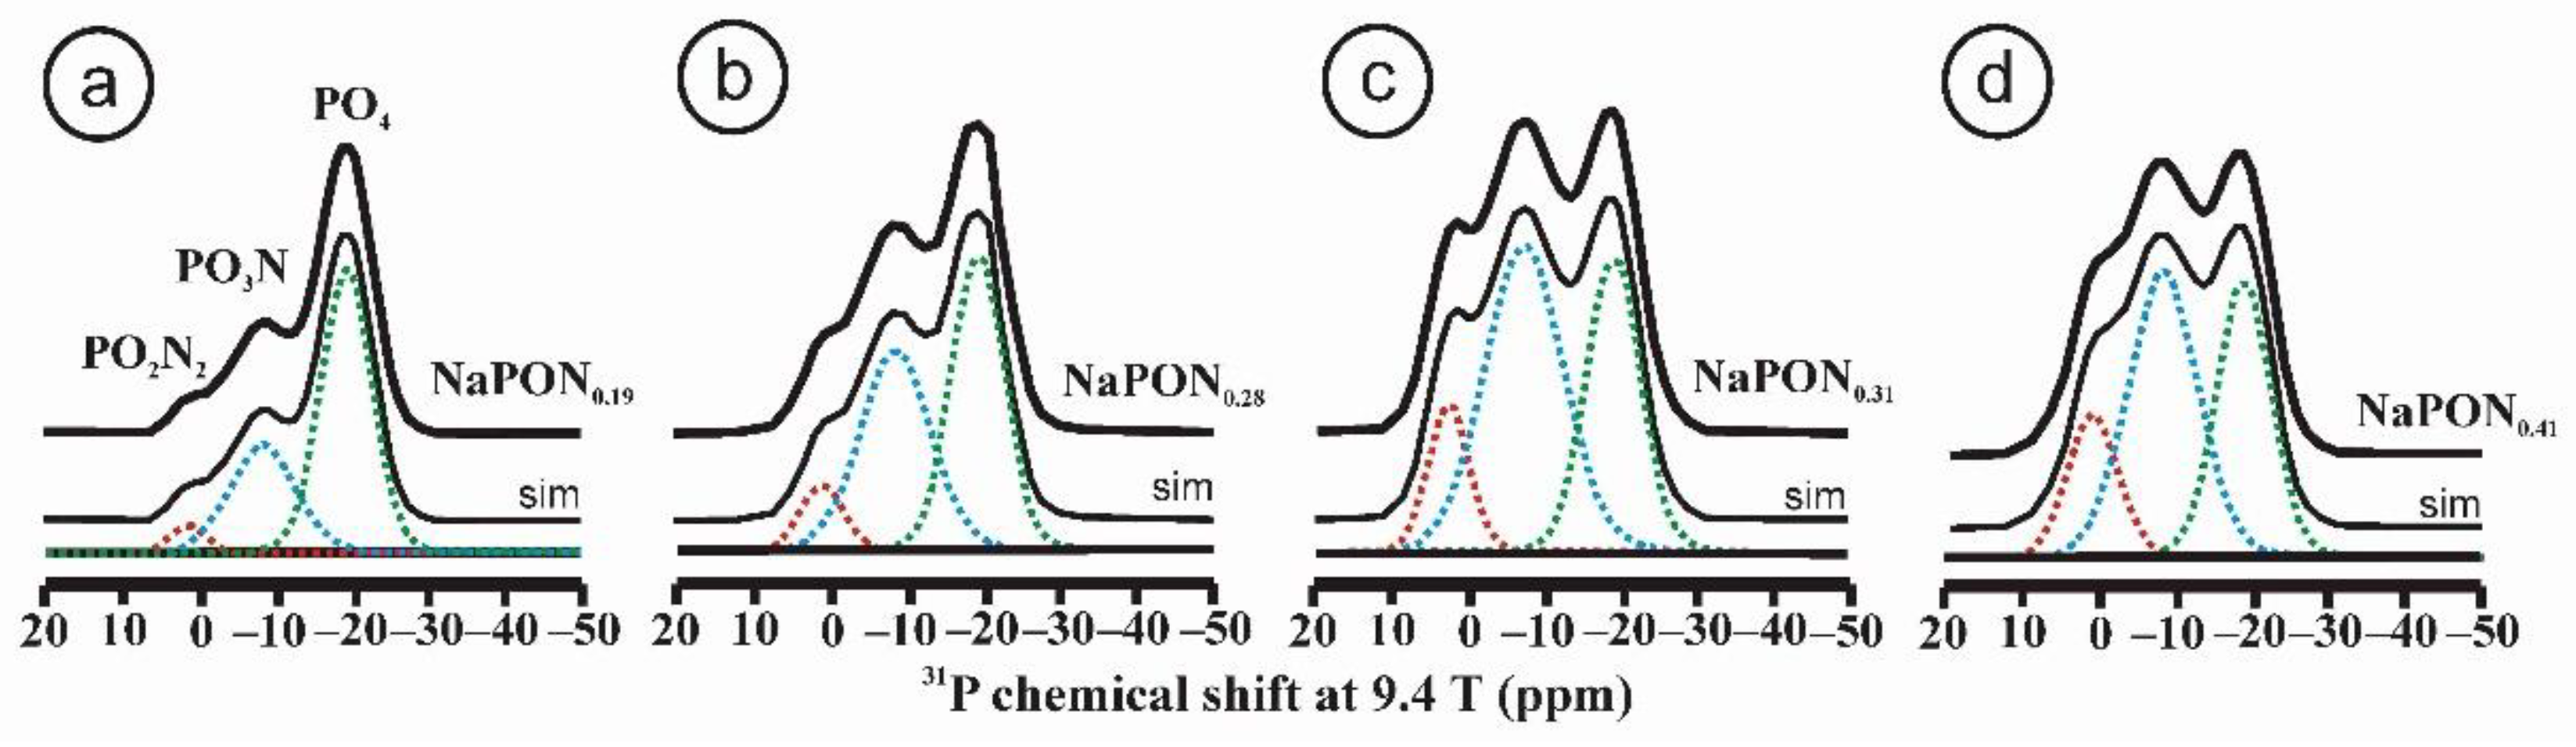
Oxynitride glasses became popular in glass research in the 1970s as a result of the study of amorphous phases such as SiAlO2N produced during the sintering of Si3N4 ceramics [31]. In 1982, Marchand synthesized the first oxynitride phosphate glass from NaPO3 using the ammonolysis method by reacting phosphate melts with NH3 at 700 °C [32,33]. As in silica-based glasses, the phosphate tetrahedra may have one or two oxygen atoms replaced by nitrogen, producing two new structural groups with one and two nitrogen atoms per phosphorus atom, PO3N and PO2N2, respectively. The network becomes strengthened by the formation of P–N = P or P–N < (P)2 bonds that increase the bond density. Figure 2 shows the 31P MAS NMR spectra of a series of oxynitride phosphates glasses obtained by nitridation of a NaPO3 glass, with increasing nitrogen contents between N/P = 0.19 and N/P = 0.41 [34]. The spectra show very clearly three resonances attributed to PO4 (green), PO3N (blue) and PO2N2 (red) tetrahedra. The 31P resonance of PO4 groups forming Q2-type tetrahedra typically appears at –20 ppm for the NaPO3 metaphosphate glass. Once nitrogen substitutes for oxygen and forms PO3N and PO2N2 groups, their resonances are distinguished at lower fields, with chemical shifts near –9 and 1 ppm, respectively.
![Minerals 12 01375 g002]()
Figure 2.
31P MAS NMR spectra of NaPON glasses with increasing nitrogen contents: N/P = 0.19, 0.28, 031, 0.41, respectively (see Table 2 for the deconvolutions). Spectra were deconvoluted into three Gaussian-like curves attributed to resonances of PO4, PO3N and PO2N2 structural units. Adapted with permission from Ref. [34]. 2021, American Chemical Society. (a) NaPON0.19, (b) NaPON0.28, (c) NaPON0.31 and (d) NaPON0.41.


Table 2.
The numerical values of the deconvolutions of the 31P MAS NMR spectra of Figure 2.
Table 2.
The numerical values of the deconvolutions of the 31P MAS NMR spectra of Figure 2.
| Glasses | NaPON0.19 | NaPON0.28 | NaPON0.31 | NaPON0.41 |
|---|---|---|---|---|
| Sites | δiso/area % | δiso/area % | δiso/area % | δiso/area % |
| PO2N2 | 1.3/3 | 1.2/7 | 2.8/13 | 1.0/15 |
| PO3N3 | −8.5/30 | −8.5/42 | −6.5/53 | −8.5/47 |
| PO4 | −19.9/67 | −19.2/51 | −17.5/34 | −18.7/38 |
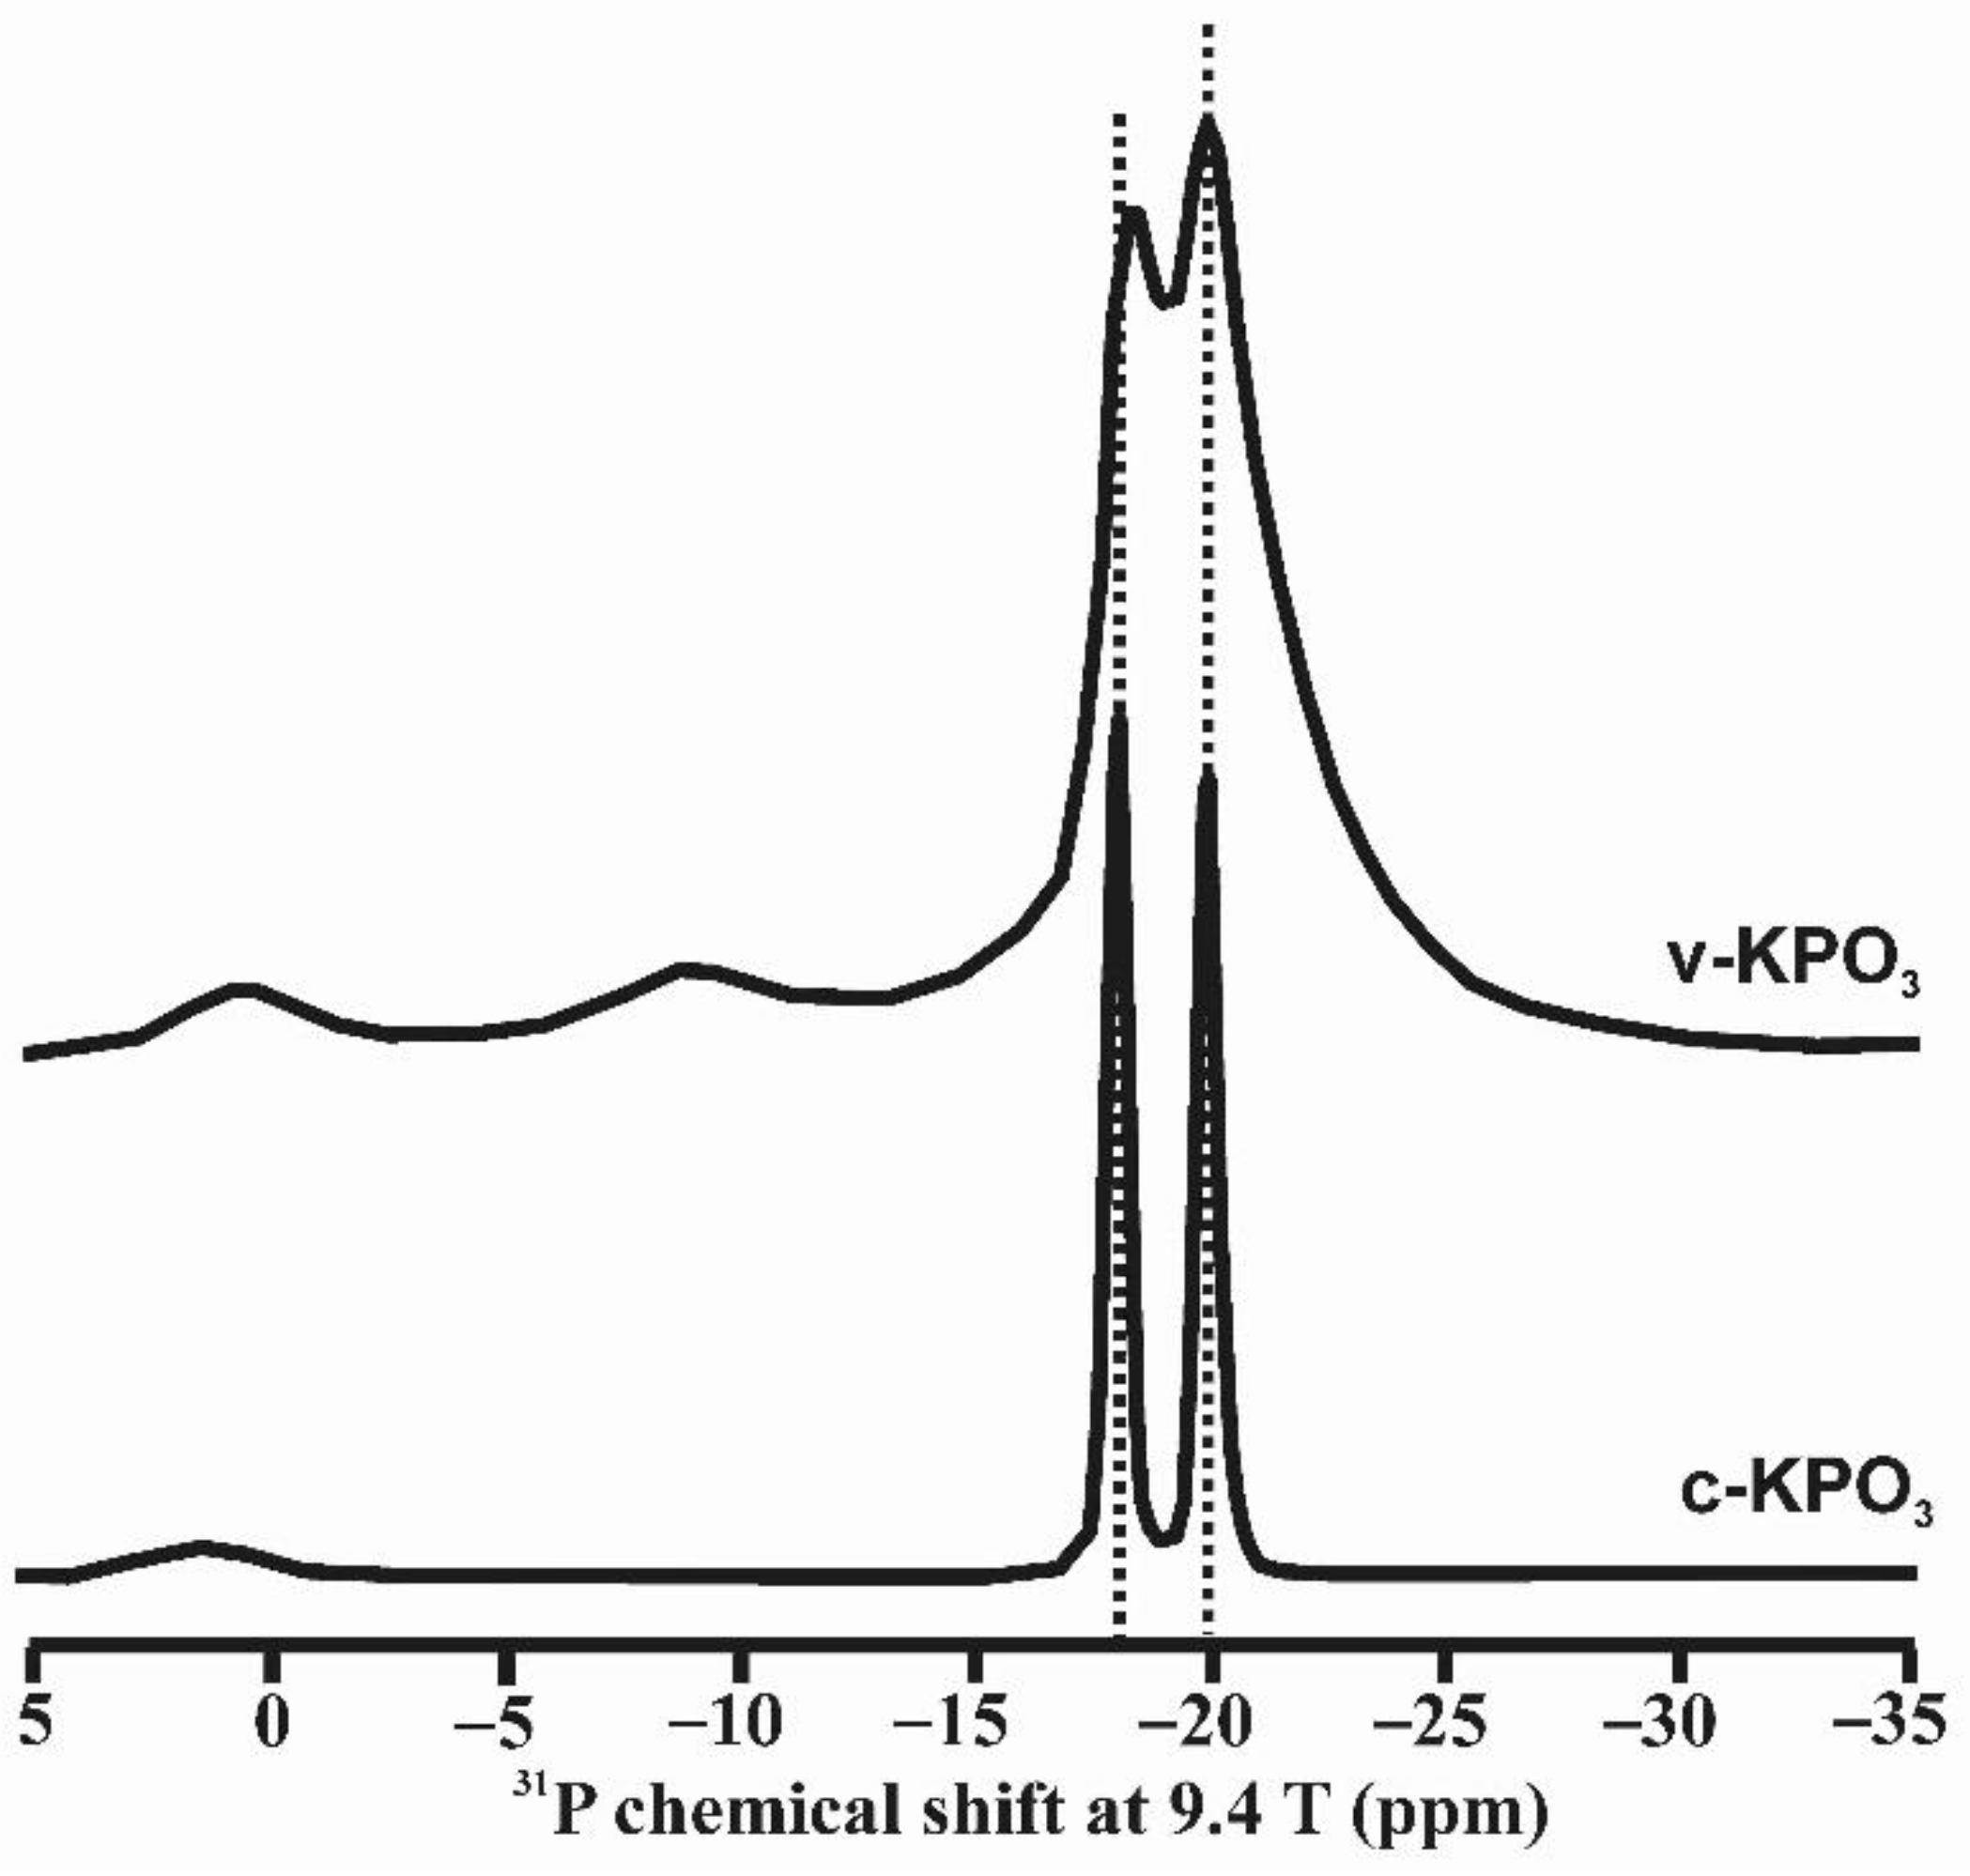
A third case involves geometrically ordered structures, solids in which more than one site can be identified and attributed to local chemical changes rather than to a different bulk composition. Consider for instance a Na2Si4O9 glass, with a structure containing Si atoms in Q3 and Q4 polyhedra in a melt quenched at 1 bar, and a totally different structure in one quenched at 12 GPa. In the latter, a Q3–Q4 distinction is no longer clear; five- and six-coordinated Si atoms may well be present [35]. In this case, the phenomenon of glass polyamorphism could result in the crystallization of different crystalline phases from a melt. We also explore the case of KPO3 glass as an example of this type of local order. A glass with composition KPO3 was obtained by rapidly quenching the melt as described in [36]. Crystalline KPO3 was obtained after maintaining the melt at 740 °C for 24 h. NMR spectroscopy can resolve structural sites with different geometry. It is possible to resolve distinct resonances from geometrically distinct atomic positions. Figure 3 shows that two resonances can be resolved at chemical shift values very close to those found in the crystalline compound [36]. Note that despite this structural order, XRD cannot detect such a configuration because it does not form periodic arrangements.
Unlike other alkali metaphosphate compositions, KPO3 does not vitrify upon quenching the melt unless very rapid cooling is applied to avoid spontaneous crystallization. The fact that the structure of the liquid just above its liquidus temperature is so similar to the one of its crystalline counterparts is the basis for its tendency to crystallize so readily. Furthermore, the structure of crystalline KPO3 has only two sites for phosphorus atoms, which makes the liquid crystallize to periodic structures much more easily than in the case of sodium or lithium metaphosphate liquids; the crystalline structures of the latter have three and five distinct sites for phosphorus, respectively. Hence, the similarities between the structures of the liquid, glass and crystals of KPO3 account for the much more rapid rate of crystallization, in comparison with the other alkali metaphosphate compositions.
The last type of amorphous structure occurs in chemically and geometrically ordered structures caused by the kinetics of transition of the glass to form crystalline solids with a similar structure. We have selected NaBO2 to illustrate such structural diversity. A sodium borate glass with that composition was obtained by melting and quenching a batch of the stoichiometric mixture of reagent-grade Na2CO3 and B2O3 at 900 °C for 2 h. The glassy sample of NaBO2 was obtained by pressing part of the liquid between two metallic plates in order to avoid spontaneous crystallization, whereas a crystalline sample, c-NaBO2, resulted from free cooling of the melt. Furthermore, the crystallized melt was submitted to a recrystallization treatment at 850 °C for 24 h, giving rise to a new crystalline sample, rc-NaBO2 with an even greater crystallinity.
An intermediate state of order of glasses exists in compounds in which NMR is able to resolve not only coordination polyhedra but also local chemical environments for the same coordination. Silicate and phosphate glasses consist of SiO4 or PO4 tetrahedra; borate glasses are considered anomalous because of their different electronic configuration. Boron can only form three covalent bonds with oxygen through a sp2 hybridization. The basic building block in B2O3 glass is the BO3 triangle [37]. Vitreous B2O3 is thus composed of approximately the same amount of BO3 triangles and the so-called boroxol rings, made up of three BO3 units. Furthermore, these two basic arrangements can also form superstructural units by linking two or more of them, e.g., triborate, pentaborate or dipentaborate. The particularity of boron atoms is that it keeps a vacant pz orbital perpendicular to the plane of the BO3 triangle; that orbital could be filled with electrons of the sp3 lone-pair orbital of an oxygen atom. This gives rise to the formation of a BO4 tetrahedron bonded to a neighboring BO3 triangle where a modifier oxide is added to the B2O3 network; the excess negative charge over boron in four-fold coordination is compensated with the modifier cations. As more modifier is added to the borate glass, the reticulation of the network increases until no more BO4 tetrahedra can be created, which is reflected as an anomaly in the glass properties, producing critical points [38].
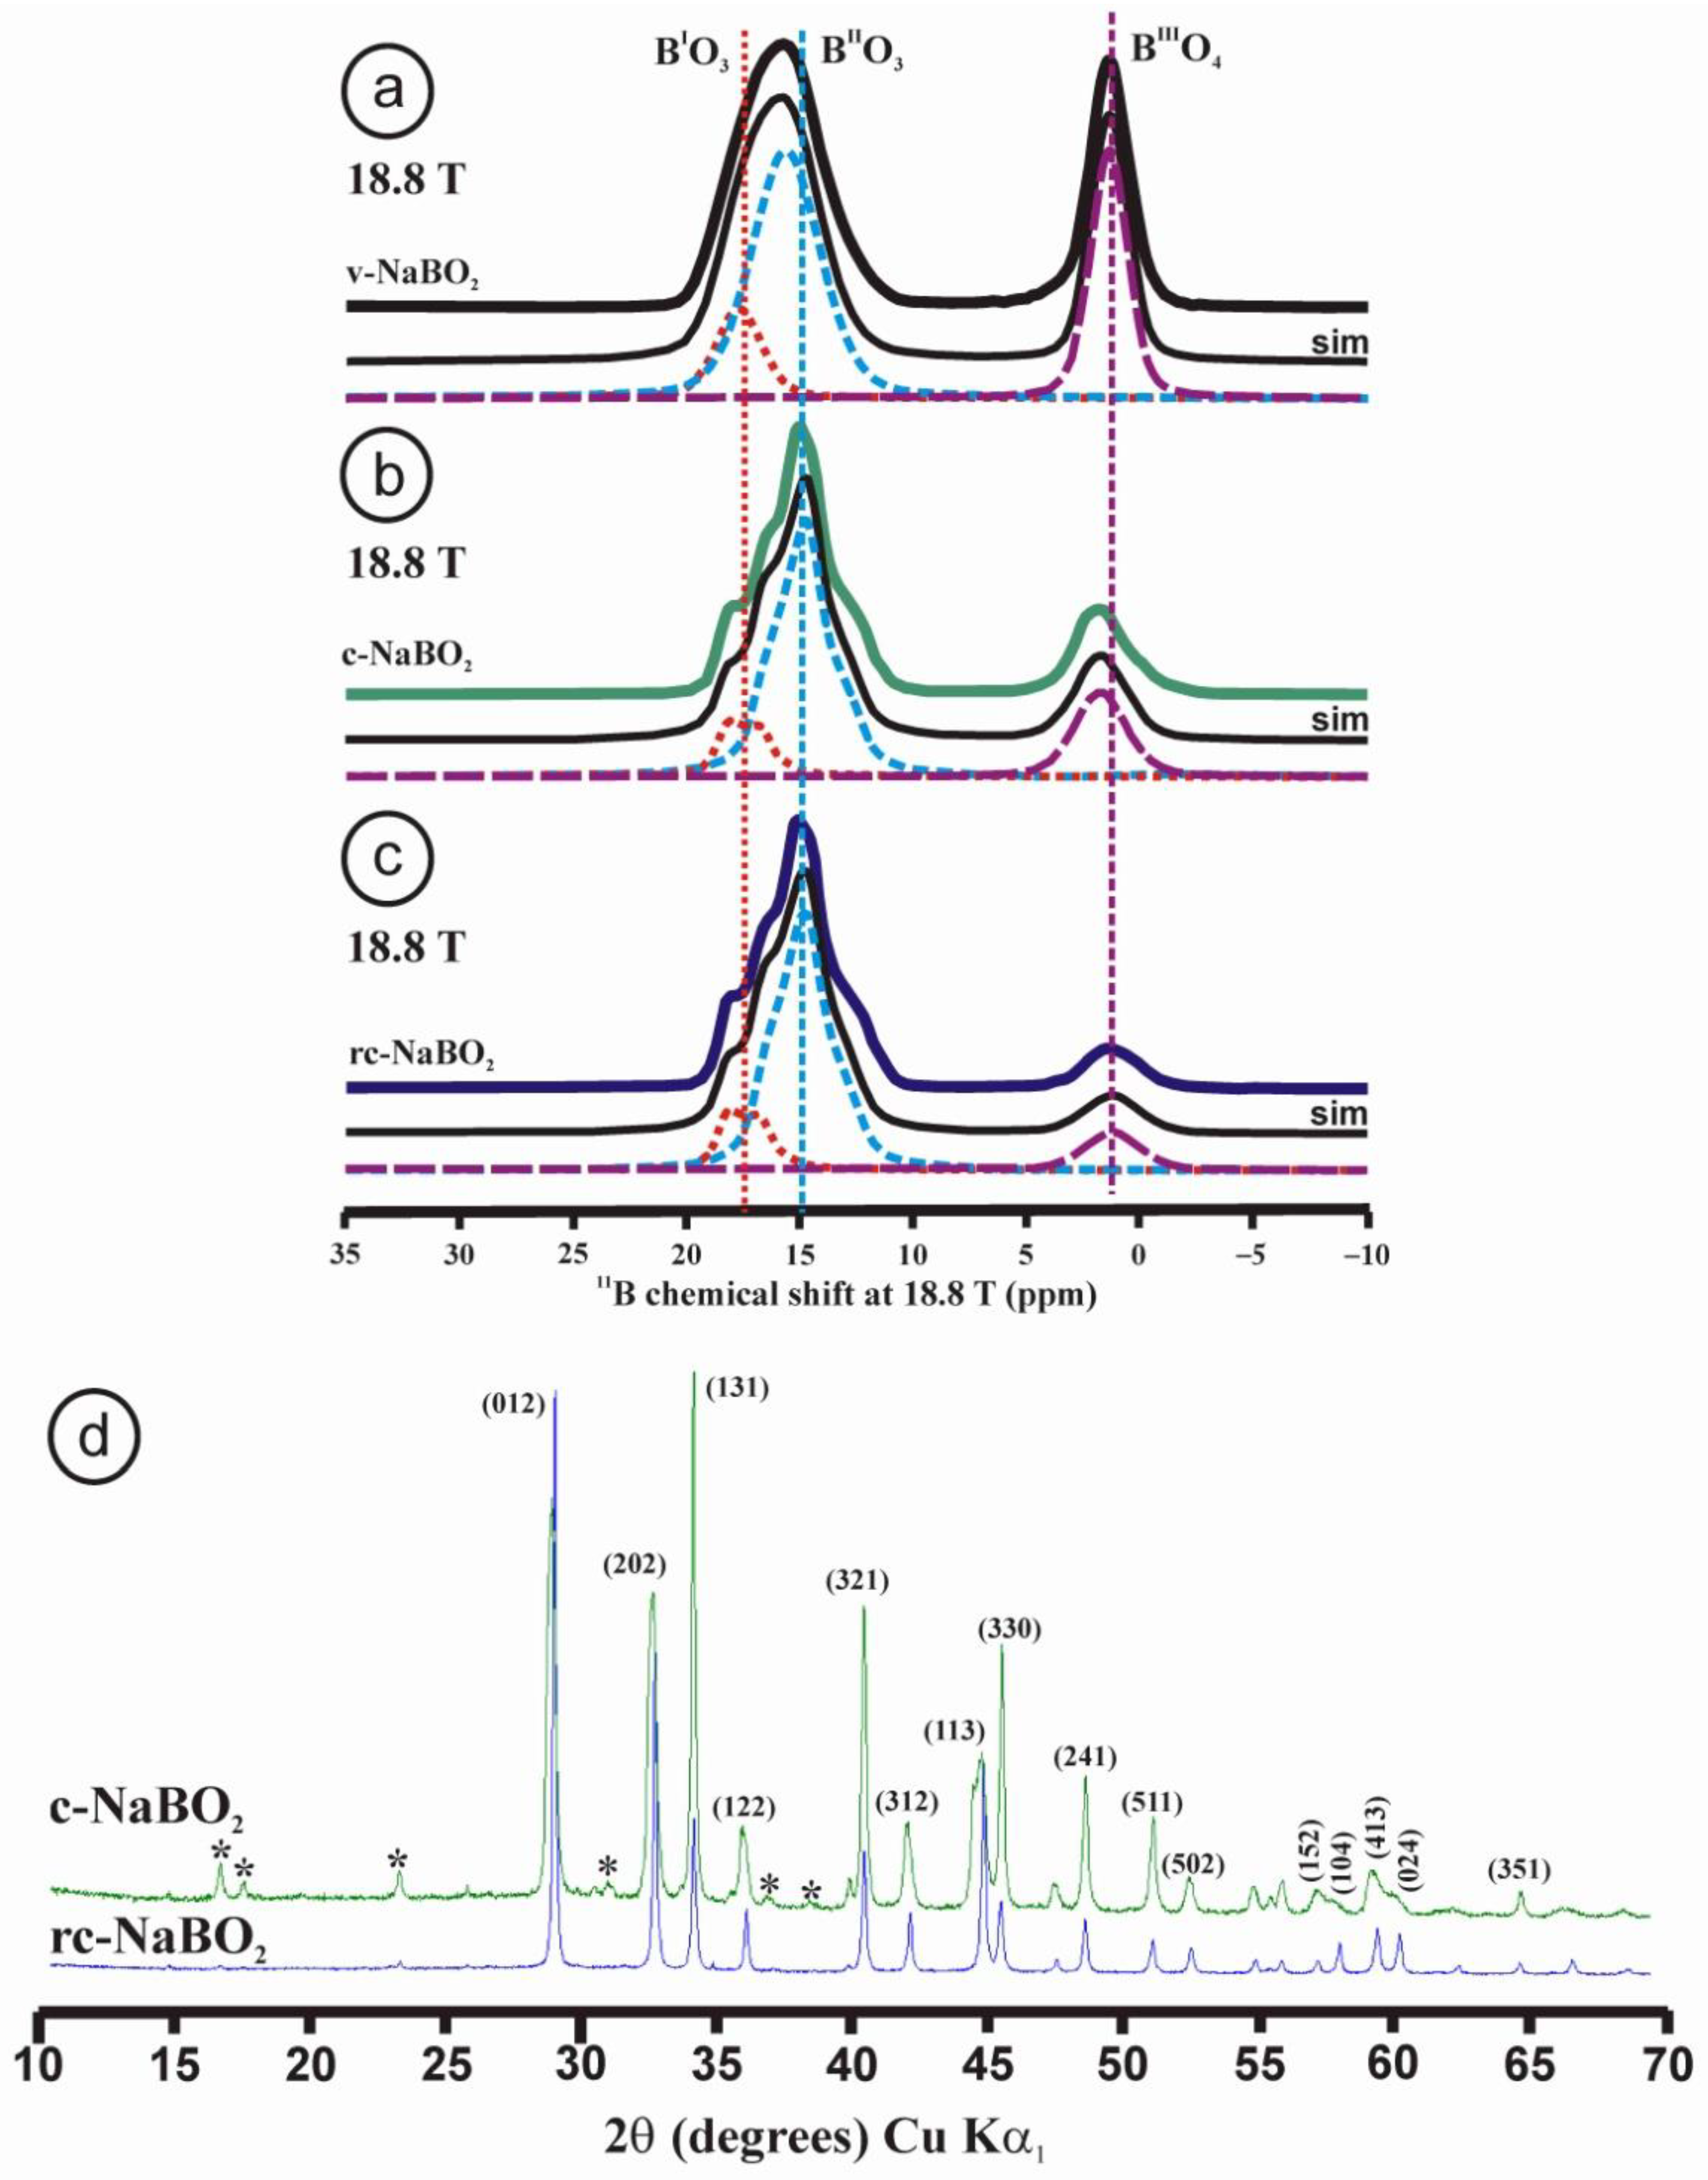
Unlike in silicate or phosphate glasses, the range of glass formation in alkali borate glasses is very limited. It is only possible for contents of M2O up to 30 to 40 mol.%, with the exception of Li2O, for which 50 mol.% can be attained [38]. In the system Na2O–B2O3, glass formation is possible up to 40 mol.% Na2O without spontaneous crystallization. Therefore, as with KPO3 metaphosphate, a melt of a 50Na2O–50B2O3 metaborate composition readily crystallizes upon cooling, developing NaBO2 crystals with practically no remaining glassy phase. However, one can induce a much faster quenching by rapidly pressing the liquid between two metals and so obtain vitreous NaBO2. Figure 4a–c shows the 11B MAS NMR spectra at 18.8 T, displaying the structure of glassy sodium metaborate, sample v-NaBO2, and two crystallized samples as c-NaBO2 and rc-NaBO2.
The spectrum of the v-NaBO2 glass sample can be simulated by using three Voigt curves as no quadrupolar profile was resolved. The numerical data are in agreement with the available literature [37]. It has been common to attribute two BO3 lines to boron atoms in and out of boroxol rings. Other authors [39] assigned the resonances at ~15.4 ppm to BO3 symmetric sites, or boron atoms having three non-bridging oxygen atoms or three bridging oxygen atoms. After transformation of the glass to a crystalline compound, the NaBO2 liquid should completely transform its structure to one dominated by rings of three linked BO3 units. Although the line shape of the boron resonances in three-fold coordination for c-NaBO2 and rc-NaBO2 samples changes to one composed of narrower signals, their spectra still show a very significant amount of boron atoms in tetrahedral coordination, which should not appear in the pure crystalline phase according to the lattice model of NaBO2 refined from XRD data [40]. This model has a rhombohedral symmetry with space group Rc, with only a single site for B atoms [40], and the unit-cell parameters a = 11.925(1), c = 6.439(1) Å. The XRD patterns of the crystallized samples are very similar, except for broad (413), (104), (024) and (351) maxima in the sample c-NaBO2 and the presence of 2.15 wt.% NaBO2·2H2O (Figure 4d). A Rietveld refinement of cell parameters in the same space group and using the CC = 34,645 file as reference for sample c-NaBO2 resulted in a = 11.929(1), c = 6.4589(8) Å, whereas sample rc-NaBO2 gave a = 11.931(1), c = 6.4236(1) Å. Thus, no remarkable differences were found in our crystalline samples in comparison with the lattice model from single-crystal XRD [40]. However, the 11B NMR spectra of these crystallized samples (Figure 4b,c) reveal two sites in triangular coordination (BI and BII) and one tetrahedral site for B atoms (BIII). The same three signals were found in the original glass structure of sample v-NaBO2 (Figure 4a).
![Minerals 12 01375 g004]()
Figure 4.
11B MAS NMR spectra at 18.8 T of v-NaBO2 glass sample (a), crystallized c-NaBO2 (b), and recrystallized rc-NaBO2 (c). In (d) powder XRD patterns of samples c-NaBO2 (green) and rc-NaBO2 (violet), with some (hkl) diffraction maxima from NaBO2 in file CC = 34,645 (file pdf 32-14046), and an impurity (with *) of NaBO2·2H2O. In (a) three Voigt curves, related to three boron atoms (BI, BII and BIII), are used to simulate the spectrum. In (b,c) quadrupolar profiles were inferred from the experimental spectra for BI and BII, whereas Voigt curves were used to simulate BIII. The 11B MAS NMR spectra were obtained as a result of pulses of π/2 at 150 µs and 4.96 W, υr = 16 kHz, at 18.8 T, in a 2.5 mm rotor. See the numerical values of the deconvolutions in Table 3.

Table 3.
Deconvolution of the 11B spectra at 18.8 T in the three samples of NaBO2 in Figure 4.
Table 3.
Deconvolution of the 11B spectra at 18.8 T in the three samples of NaBO2 in Figure 4.
| Samples | Sites | δiso (ppm) | c.g. (ppm) | CQ (MHz) | η | lw (ppm) | A (%) |
|---|---|---|---|---|---|---|---|
| v-NaBO2 | BI–BO3 | 17.7 | 2.4 | 16.7 | |||
| BII–BO3 | 15.6 | 3.6 | 56.0 | ||||
| BIII–BO4 | 1.4 | 1.7 | 30.3 | ||||
| c-NaBO2 | BI–BO3 | 19.0 | 1.93 | 0.20 | 12.9 | ||
| BII–BO3 | 17.0 | 1.97 | 0.92 | 66.7 | |||
| BIII–BO4 | 1.7 | 2.7 | 20.4 | ||||
| rc-NaBO2 | BI–BO3 | 19.0 | 1.93 | 0.20 | 15.9 | ||
| BII–BO3 | 17.0 | 1.97 | 0.92 | 72.8 | |||
| BIII–BO4 | 1.2 | 2.9 | 11.3 |
Note: the curves deconvoluted by a quadrupolar profile are described by using NMR parameters (i.e., δiso, CQ (MHz) and η), whereas the curves deconvoluted with a Voigt curve (in all cases at xG/(1 − x)L = 0.7) are described by the center of gravity c.g. and line width lw.
Clearly, the original structure of the NaBO2 glass is mostly preserved in the crystallized and recrystallized products, which have more spectroscopically distinct sites than the crystallographically distinct ones expected from the available lattice model [40]. In other words, the glass structure at the local scale is very close to that of the first crystal to be formed, though lacking long-range order, and thus it is similar to its precursor melt. From the point of view of XRD, the crystallization is seen as a sharp process in which diffraction peaks abruptly appear. With the NMR technique, one can see the structural aspects that are preserved during the transformation from glass to crystalline material, including the three distinct boron atoms, IIIBI, IIIBII and IVBIII. It also shows the main changes occurring during that transition, including a reduction in the width of the site distributions in the same chemical environments and also a progressive release of the BO4 groups with a prolonged recrystallization of crystalline precursors.
4.2. Long-Range Homogeneously Disordered Structures
Long-range homogeneously disordered structures are typically found in mixed crystals, i.e., solid-solution series, as non-stoichiometric compounds. This type of disordered structure can also occur in fully stoichiometric compounds, as in the end-members of these solid-solution series. There, the minerals have an exact, precise and fixed chemical composition, expressed as a chemical formula with a small integer ratio among different atoms. Note that these structures can also display a wide diversity of order–disorder structural states. They are commonly described by means of the concept of “average structure” because they are ideally supposed to be periodic crystals at the resolving power of reciprocal space and electron microscopy techniques. However, these structures have only pseudoperiodic structures as they are disordered at the long-range scale, i.e., they are not strictly periodic despite Bragg peaks being resolved, as is frequently manifested by the additional diffuse scattering.
“Real” aperiodic crystals have thus commonly been described as “ideal” periodic crystals. This contrast between the true (local) symmetry and the modeled symmetry is particularly evident in minerals with “anomalous” optical properties, where the word “anomalous” actually means “unexpected”. The optical data “clash” with the external symmetry of the crystalline volume with a euhedral shape, which has traditionally been called a “crystal”, particularly before the emergence of X-ray crystallography and RSTs to gauge the average symmetry. An idealized character and perfection are implicit in using the term “crystal” for well-defined geometric morphological units, with a perception of the lattice model as a “reality”, instead of being seen as just a useful and beautiful model. Accordingly, where some physical properties in a crystal do not match the expected symmetry as determined by RSTs, these are deemed “anomalous”, rather than the supposedly observed or experimentally determined symmetry. This phenomenon is known in particular specimens of a given mineral species. Such specimens may be labeled “optically anomalous crystals” [41]; the problem is thus ascribed to some poorly developed specimens. However, crystals with “anomalous” optical properties are ubiquitous in nature [42], as anticipated by Mallard in the 19th century [43].
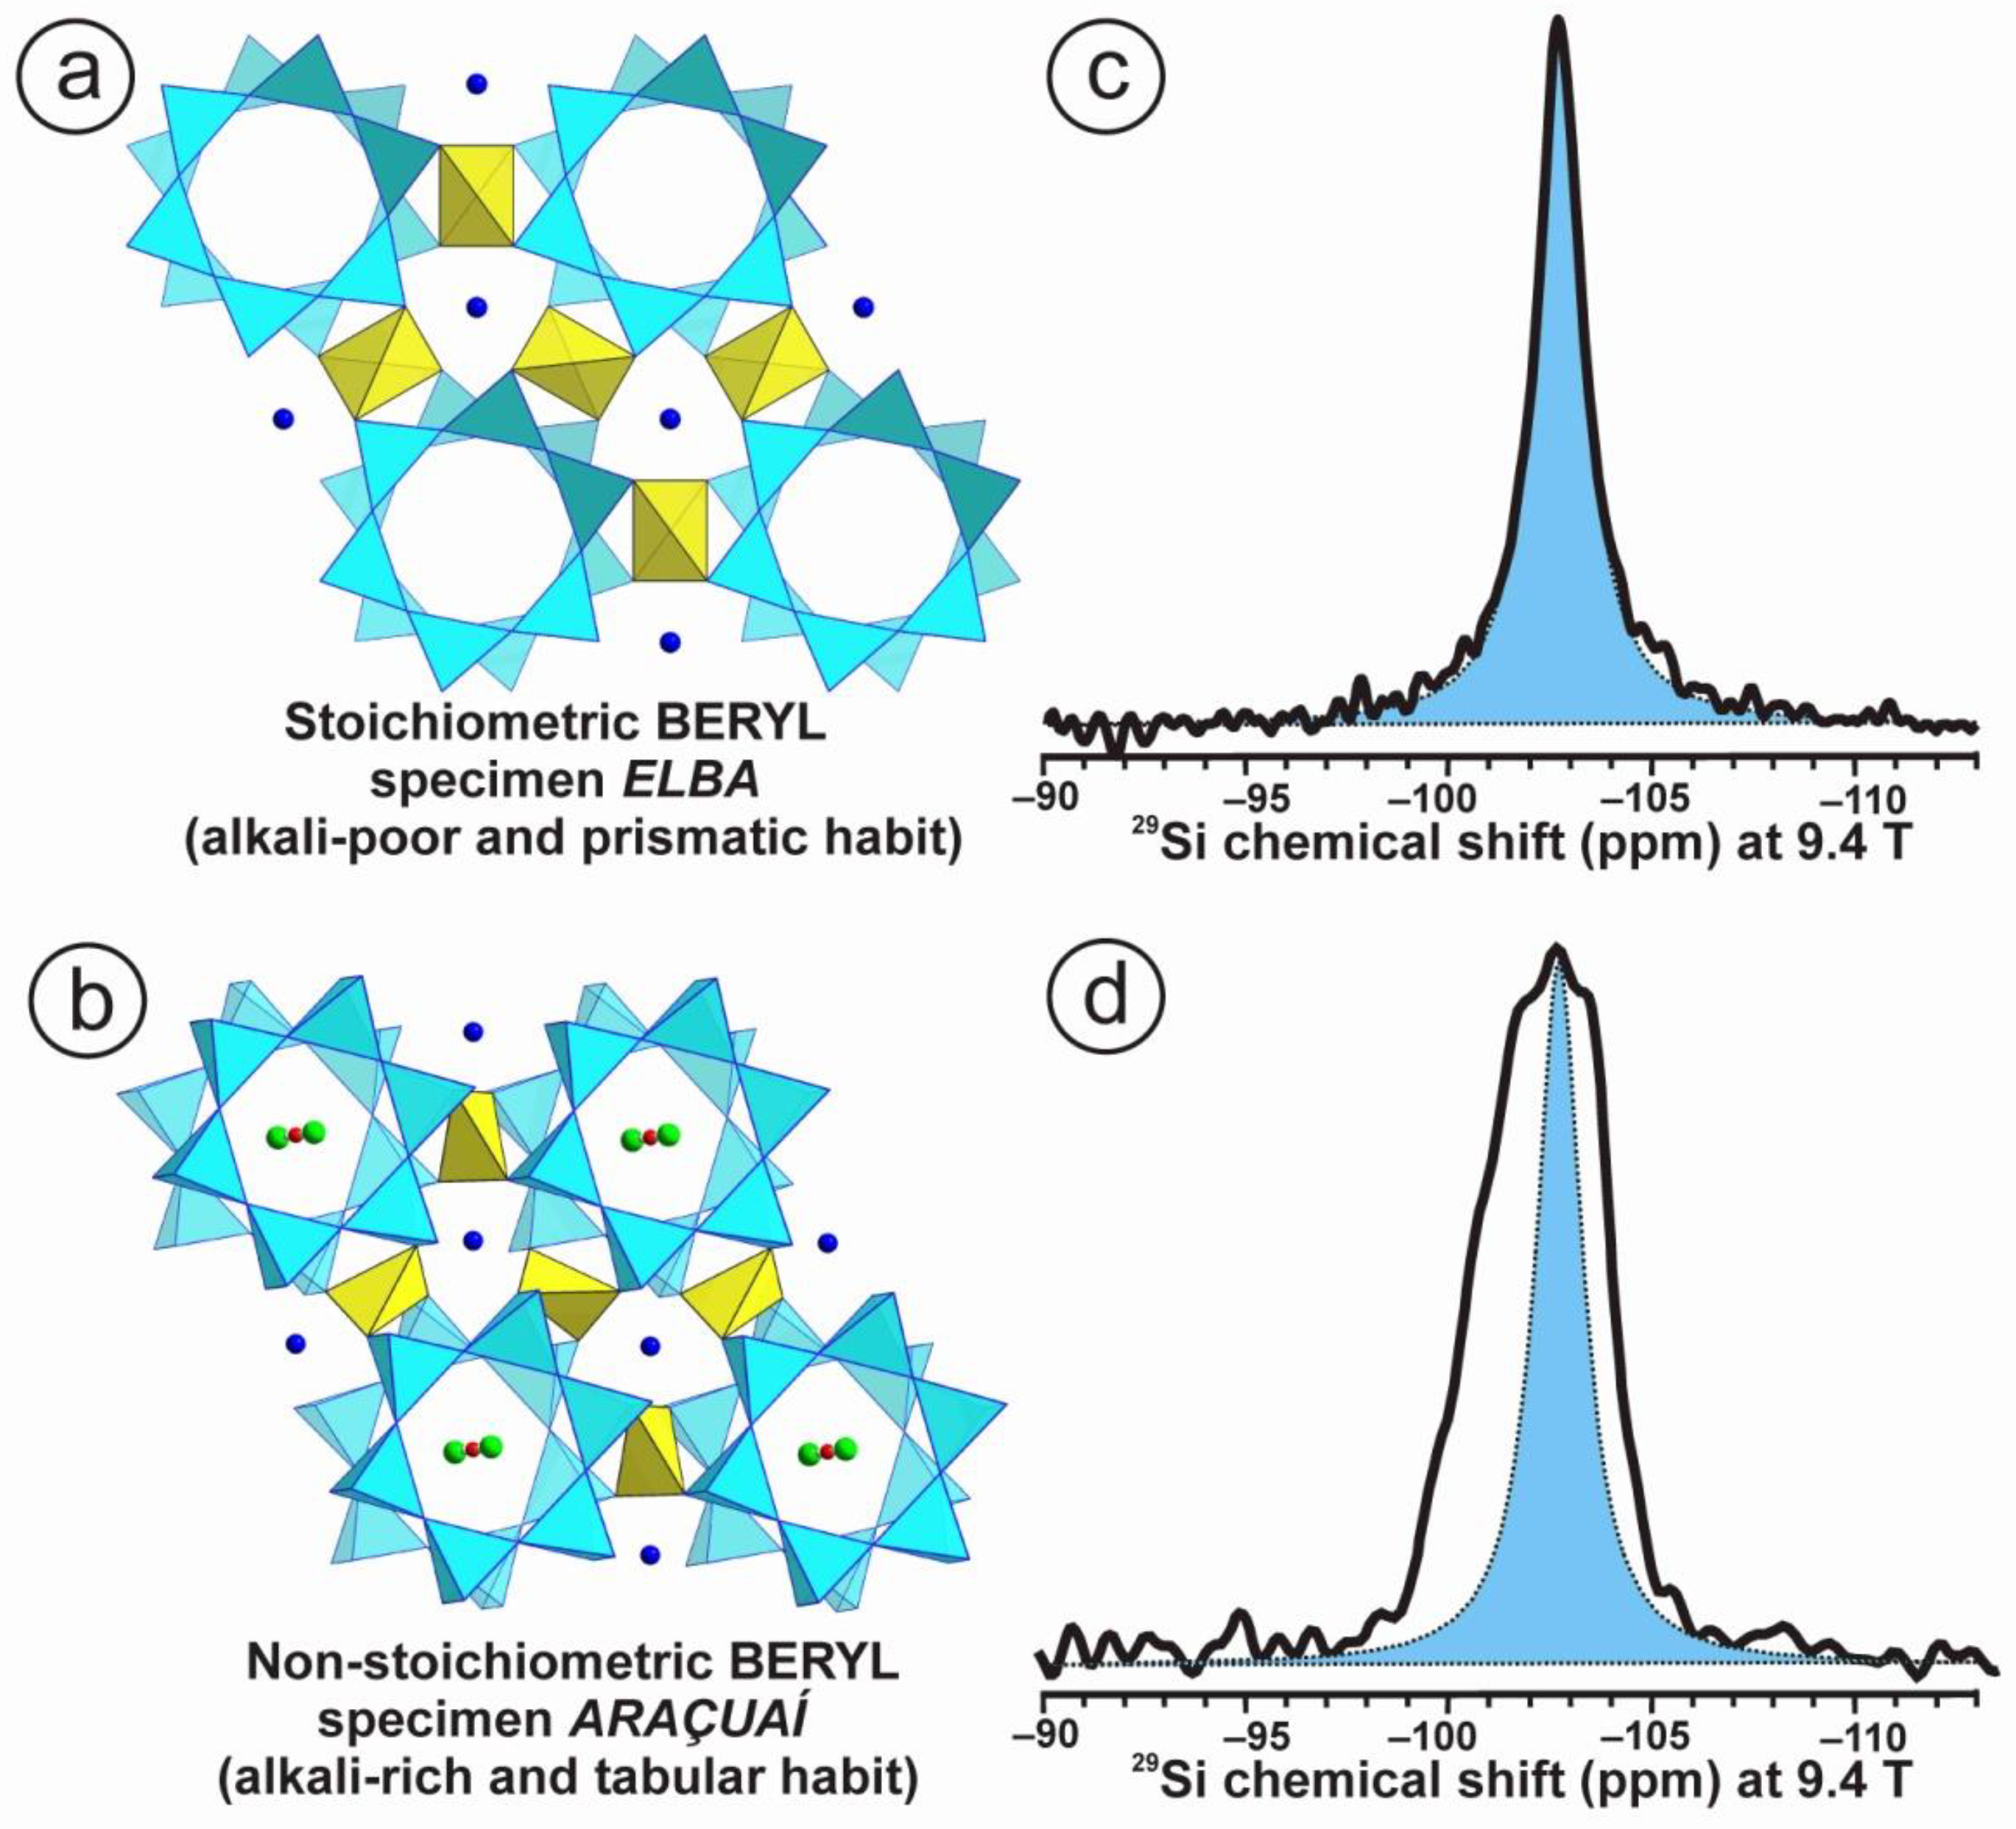
We provide an explanation of the origin of anomalous optical properties in long-range homogeneously disordered structures in minerals of the beryl-group minerals using NMR data. This phenomenon is very common in that mineral group because the expected symmetry dictated by the space group P63/mcc symmetry from RSTs data in beryl is rarely found. Optical anomalies appear in the form of biaxiality in basal sections along the [001] plane. This anomalous character has been explained by the presence of chemical impurities or strain centers induced by chemical substitutions, as well as by defects occurring during crystal growth [42,44,45]. Two different specimens of colorless beryl having powder XRD patterns fully consistent with P63/mcc symmetry are compared in Figure 5 and Table 4. Specimen Elba is an alkali-poor sample with a chemical composition unusually close to the ideal chemical formula, which is rare in nature; the prisms are long and sharp, with a hexagonal shape. Specimen Araçuaí is an alkali-rich sample; as such, it has a non-stoichiometric chemical composition, as well as a markedly tabular habit.
The former has a single resonance in the 29Si NMR spectrum at 9.4 T that can be simulated with a single Lorentzian curve centered at −102.7 ppm and with a 1.4 ppm line width. The T sites are occupied by the Si atoms in the six-membered rings of the hexagonal structure of beryl. The six Si atoms in the formula Be3Al2Si6O18 are close to being identical from the NMR point of view, and the six-fold symmetry axis is thus fully explained by a local P63/mcc space-group symmetry. With additional atoms in the structure, such as Na, Li and Cs located in the hexagonal channels, non-stoichiometry must ensue in alkali-rich beryl. A much broader complex and asymmetric resonance appears at ca. −107 ppm, with a much broader line width of ~3.6 ppm and a pseudo-Gaussian shape. In this case, a single Si site in the six-membered rings does not exist on the local scale. In addition, the hypothesized H2O molecules are actually OH groups, as revealed in 1H NMR spectra [46]. Alkali-rich beryl thus does not have a hexagonal symmetry at the local scale, but rather an average hexagonal symmetry with a pseudosenary axis. The long-range P63/mcc symmetry becomes only an “ideal” but false model [5,46]. The prismatic hexagonal habit is lost, and the tabular shape indicates a loss of the senary axis also at the macroscopic scale.
Figure 5.
(a) P63/mcc space-group lattice model of the structure of beryl with hexagonal symmetry and a chemical composition close to Be3Al2Si6O18 projected onto the (001) plane. The Si atoms at tetrahedral sites (blue) form six-membered rings; the Be atoms occupy one tetrahedral site (yellow) connecting two Si rings to give Si in Q4(2Si,2Be) environments, and the Al atoms occupy a single octahedral site [47]. (b) The same lattice model in an alkali-rich beryl along the same projection but slightly tilted to show Na atoms in green and H2O molecules in red for the oxygen atom or Cs atoms [48]. In this case, the Li atoms are at the Be site, and Na and Cs atoms are in channels at the height of Si rings and Be–Al layers, respectively. Oxygen atoms of H2O molecules in red are supposed to be located between two Na atoms [49]. In addition, H2O molecules are thought to be at the site of Cs atoms. (c) The 29Si MAS NMR spectrum of specimen Elba at 9.4 T shows a single resonance that can be simulated with a Lorentzian curve (in blue) centered at −102.7 ppm and a line width of 1.4 ppm. (d) The 29Si spectrum of specimen Araçuaí at 9.4 T shows a much broad resonance, compared to that of specimen Elba (blue), centered at ca. −102 ppm and a line width of 3.6 ppm. The experimental conditions for the acquisition of the 29Si MAS NMR spectra at 9.4 T, at υr = 10 kHz in a 4 mm rotor, are similar to those used for alkali feldspars [4].

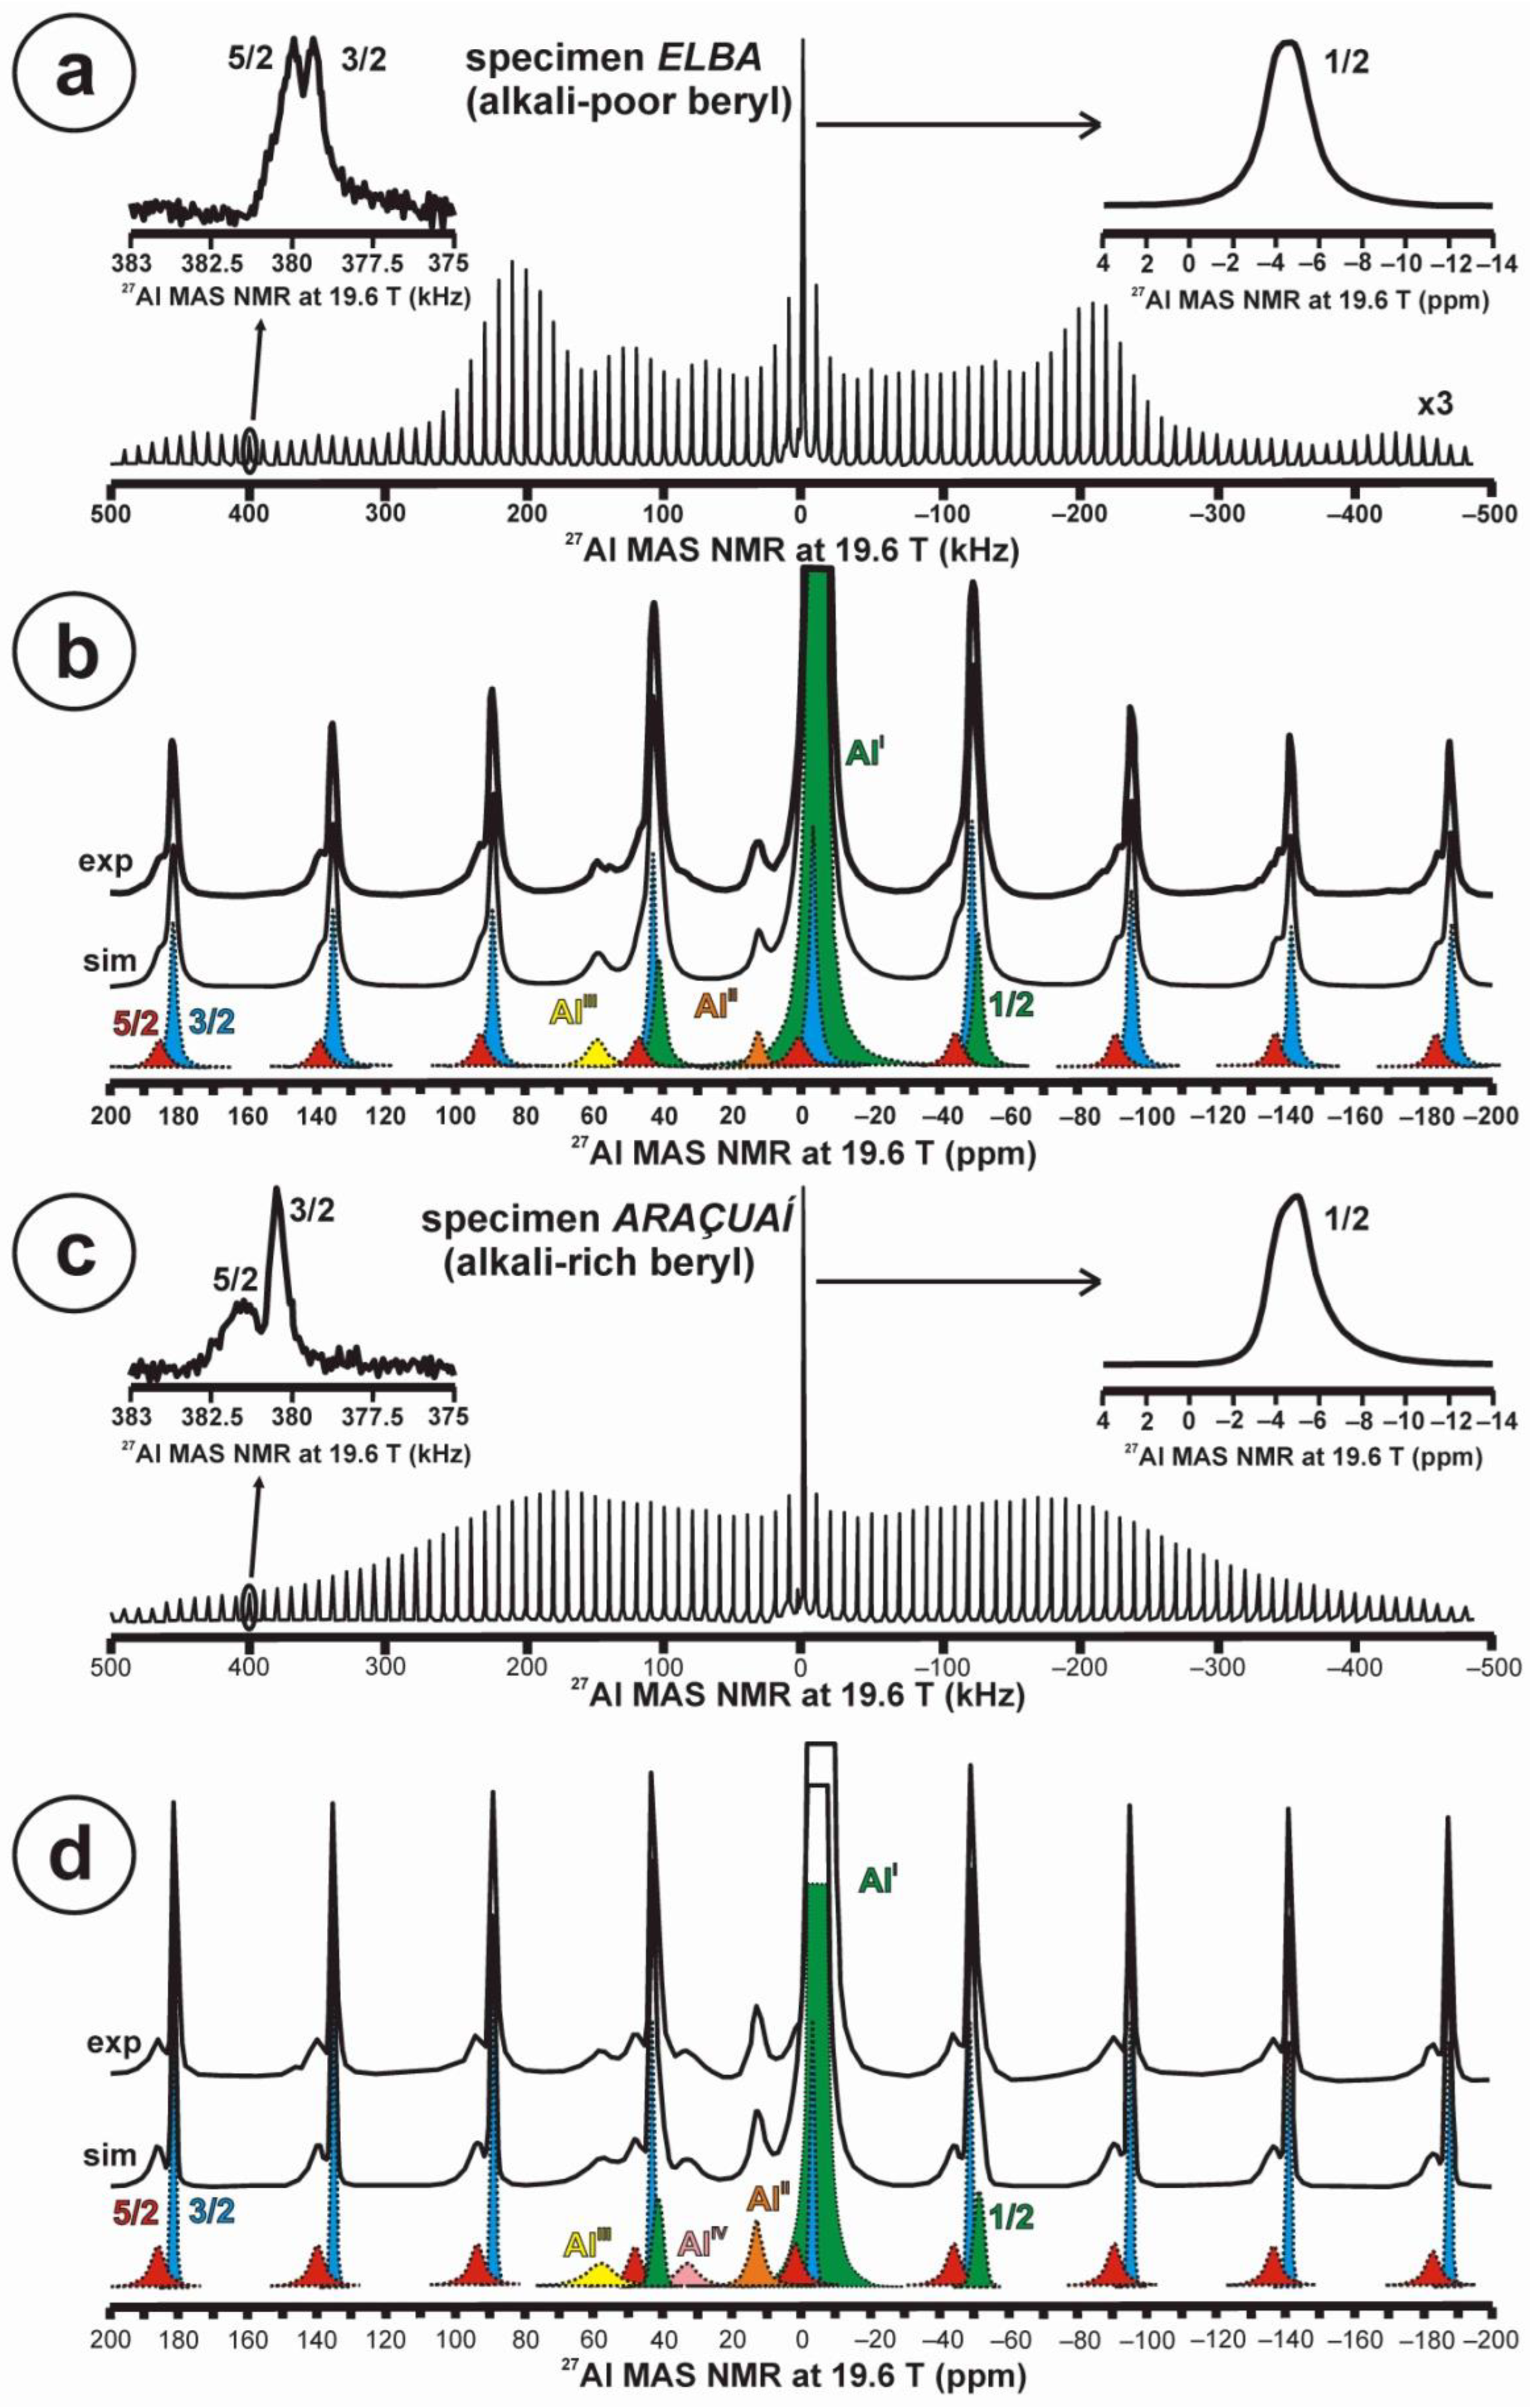
Quadrupolar nuclei were also very sensitive to small chemical changes from the stoichiometric composition. Figure 6a,b show the total 27Al STMAS NMR spectrum at 19.6 T of the alkali-poor beryl (specimen Elba), with details about the 1/2, 3/2 and 5/2 transitions in satellite lines as inset. Note the well-developed quadrupolar shape profile from the first-order quadrupolar interaction, and the symmetric shape of the central transition. It corresponds to a single site for Al atoms in octahedral coordination as AlI with c.g. (1/2) = −4.6 ppm and lw = 2.5 ppm, c.g. (3/2) = −3.2 ppm and lw = 2.4 ppm, and c.g. (5/2) = 0.1 ppm and lw = 4.8 ppm. The estimated values of δiso and νQ are −4.0 ppm and 250 KHz, respectively. However, two additional sites, at a very low concentration, are recorded in the spectrum as AlII at c.g. = 12.3 ppm also in octahedral coordination, and as AlIII at c.g. = 58.7 ppm from Al atoms in tetrahedral coordination with oxygen atoms (Figure 6b). In specimen Araçuaí, Figure 6c,d display the same representation of the 27Al STMAS NMR spectrum at 19.6 T. However, the profile from the first-order quadrupolar interaction is almost unrecognizable, the 1/2 central transition is now an asymmetric curve, and the 5/2 transition is not so well developed as in the other specimen. The same three sites for Al atoms, AlI, AlII and AlIII, are resolved at approximately the same positions for the alkali-rich beryl. For AlI, c.g. (1/2) = −4.8 ppm and lw = 2.4 ppm, c.g. (3/2) = −3.1 ppm and lw = 1.9 ppm, and c.g. (5/2) = 0.0 ppm and lw = 6.0 ppm. The estimated values of δiso and νQ are −3.9 ppm and >250 KHz, respectively. An additional AlIV site appears with c.g. = 32.9 ppm, corresponding to a coordination with five oxygen atoms (Figure 6d).
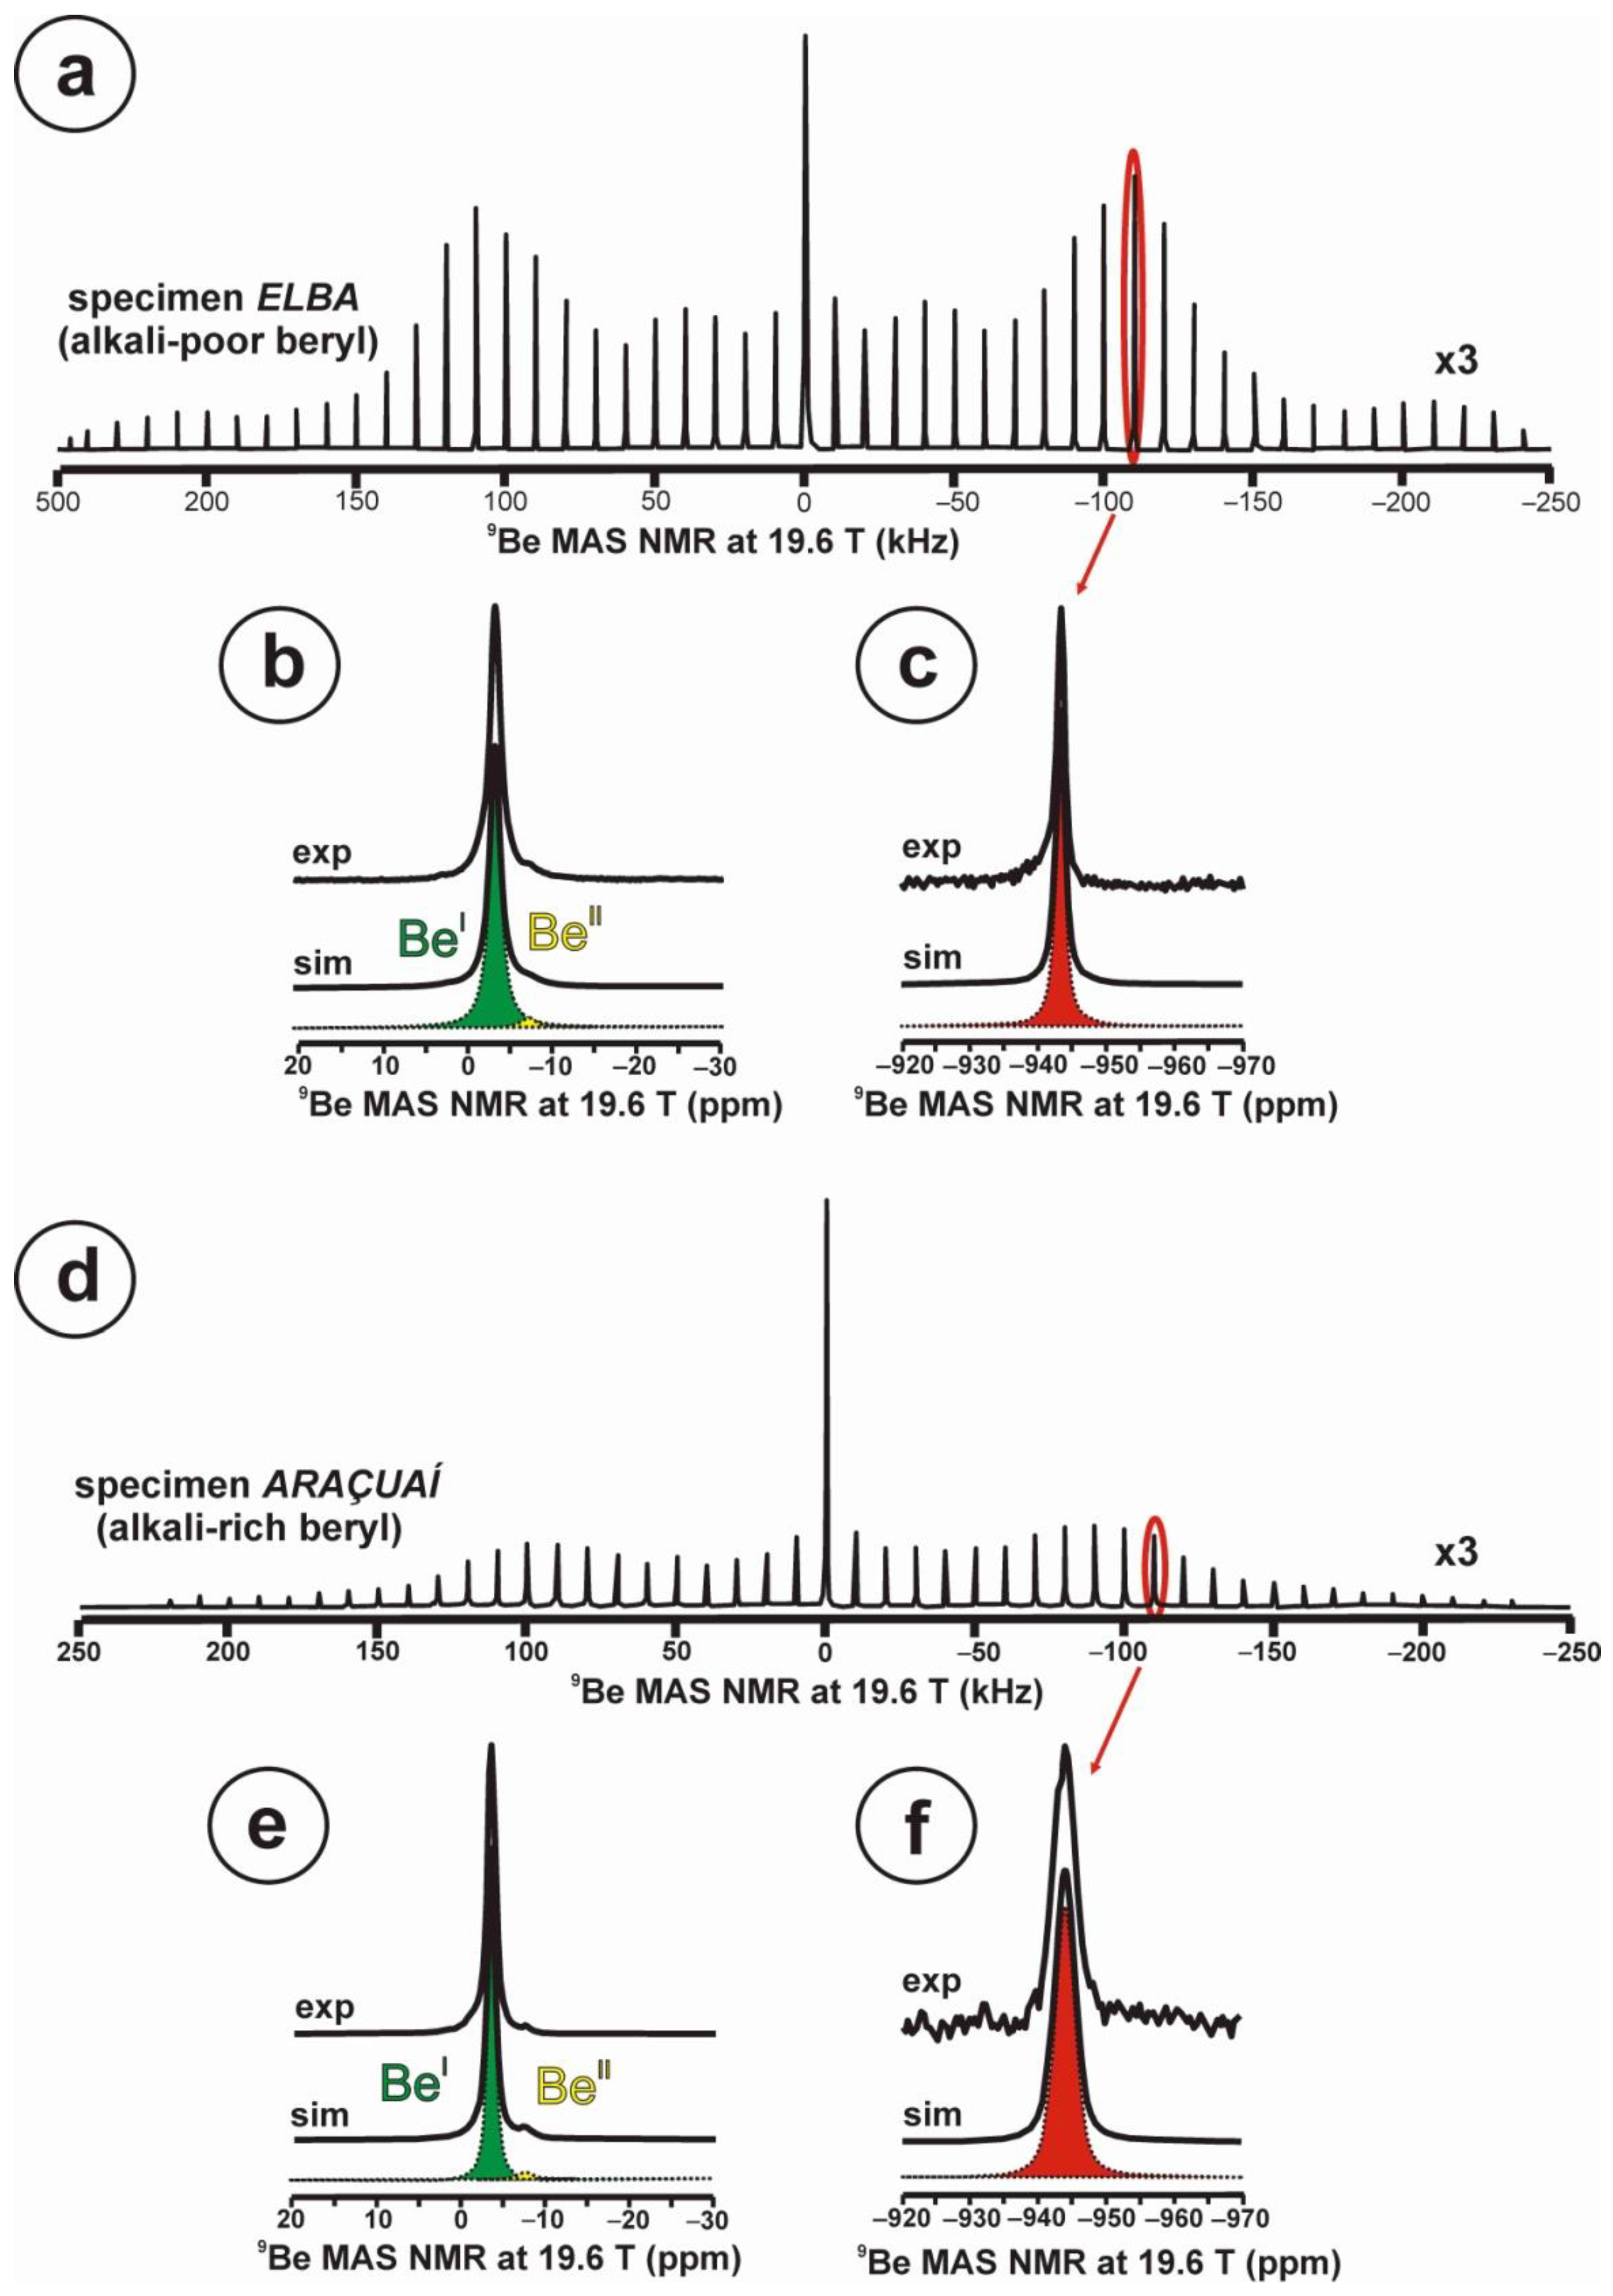
At 19.6 T, the 9Be spectrum of the alkali-poor beryl has a well-developed quadrupolar profile in the STMAS spectrum (Figure 7a), whereas in the alkali-rich beryl, this profile is partially lost (Figure 7d). In specimen Elba, the spectrum (Figure 7b) can be simulated with two sites for Be atoms, BeI with a Lorentzian curve at c.g. = −3.4 ppm and lw = 1.6 ppm with 98.1 % area, and BeII also with a Lorentzian curve with c.g. = −7.5 ppm and lw = 1.3 ppm with 1.9 % area. Whereas in specimen Araçuaí, the spectrum (Figure 7d) can be simulated with two sites for Be atoms, BeI with a Lorentzian curve at c.g. = −3.4 ppm and lw = 1.1 ppm with 98.8 % area, and BeII also with a Lorentzian curve with c.g. = −7.4 ppm and lw = 0.9 ppm with 1.2 % area. In the two cases, the satellite 3/2 resonances are only detected for site BeI (Figure 7c,f), but they are narrower in the alkali-poor beryl.
These results indicate that profound structural differences exist at the local scale between the end-members and intermediate members of the solid-solution series in minerals, although their average symmetry is similar. Note that most common minerals are non-stoichiometric compounds, and the deviations of the chemical stoichiometry are seen as imperfections, defects and impurities from an a priori expected “ideal” model. The perspective of this work is to study the structural diversity as it occurs in nature, and not as predicted by axiomatic models developed by other experimental techniques.
Three different classes of long-range homogeneously disordered structures can be distinguished: random structures, Loewenstein structures and charge-dispersed structures. These may appear both in non-stoichiometric and fully stoichiometric compounds, as resolved by well-defined characteristics in the NMR spectra. In other words, stoichiometry alone does not guarantee a perfect atomic order. It is a necessary condition, but it is not a sufficient one.
Random structures that have a random distribution of atoms at a certain lattice site do have charge restrictions only in relation to the first-coordination sphere (i.e., coordination polyhedra). However, they have regular structural motifs along the three dimensions, giving rise to diffraction peaks. They do not have charge restrictions in the second sphere of coordination, and very commonly give rise to a high symmetry, for instance in Ca1–xSrxF2 mixed crystals. In this case, five chemical environments around F atoms are formed: (4Ca,0Sr), (3Ca,1Sr), (2Ca,2Sr), (1Ca,3Sr) and (0Ca,4Sr), with different chemical shifts for each chemical environment in 19F NMR spectra [50]. The line intensities of each component along the solid solution indicate a random Ca–Sr distribution [50]. This variation is recorded by XRD as an increase in the lattice constant from 5.46 Å to 5.81 Å in the Fm–3m lattice [50].
A similar random character at the T sites occupied by Si and Al atoms has been found in the faujasite solid-solution, a zeolite-group mineral with a Q4 framework structure and Fd3 or Fd3m space-group symmetry. Here, Loewenstein’s rule is not respected, as in a random distribution, and Al–O–Al bonds are formed depending only on the Al:Si ratio of the chemical formula [51]. In a random crystalline structure, the degree of order is related only to electrostatic forces between atoms, which are mostly limited to the first coordination sphere [51]. In addition, a random distribution of charges has been found in the synthetic and stoichiometric compound CaAl2SiO7, or the gehlenite end-member of the melilite solid-solution series [52]. Thus, random structures are common in both stoichiometric and non-stoichiometric compounds of the solid state.
In the second category, Loewenstein structures are typically silicates, aluminates and aluminosilicates that have a Loewenstein’s state of order; Al3+–O–Al3+ bonds are avoided because of non-random distributions of aluminum atoms in tetrahedral sites occupied also by silicon atoms. They show certain restrictions in the position of charges that are not easy to explain by considering only the Pauling electrostatic valence rule [53]. In these structures, bonds with alkali atoms (A+) as A+/Al3+–O–Si4+ and alkaline earth atoms (A2+) as Al3+–O–Si4+ /A2+/Al3+–O-Si4+ for the local compensation of electrical charges are formed preferentially. This phenomenon is particularly well known in the study of the Si,Al distributions in aluminosilicates with Q3 and Q4 configurations. The NMR spectra can identify TO4 tetrahedra with Si and Al atoms in Q3n (3–nSi,nAl) Si,Al distribution in phyllosilicates and Q4n (3–nSi,nAl) Si,Al distributions in tectosilicates. Correlation experiments are useful to detect not only atomic configurations of the first sphere of coordination, but also changes in the position of resonances with the atomic environments in the second sphere of coordination. Loewenstein structures occur in β-spodumene and β-eucryptite solid-solution series in the system LAS (Li1–xAl1–xSi1+xO4 for 0 ≤ x ≤ 1 from LiAlSiO4 to SiO2) for a wide compositional range [22,54]. This includes some stoichiometric compounds such as LiAlSi3O8 with a Si:Al ratio of 3:1 like in alkali feldspar but with the β-spodumene structure [22].
Third, charge-dispersed structures are formed in compounds with some additional charge restriction where long-range charge interactions are involved, for instance between tetrahedrally coordinated 3+ and 4+ cations in aluminosilicates. In this case, site occupancies are restricted not only to the second coordination sphere but also at much greater distances. This phenomenon has been studied in detail in non-stoichiometric compounds such as micas, where two alternative Si,Al distributions have been studied in the layers of tetrahedra Q3 in relation to the dispersion of Al atoms [55,56]. These two models have been called “maximum dispersion of charges” (MDC model) and “homogeneous dispersion of charges” (HDC model). The MDC model is consistent with the Dempsey’s rule of avoidance (or minimization) of Al–O–Si–O–Al linkages for a given Si:Al ratio, i.e., assuming a larger separation between Al atoms than in the case of Loewenstein’s rule, as developed in the Q4 framework of zeolites [57]. In the HDC model, the dispersion of Al atoms is higher than with Al–O–Al avoidance, but lower than total avoidance of Al–O–Si–O–Al linkages. This occurs in micas, where the number of Al atoms per six-membered T rings is close to that expected from the Si:Al ratio in the chemical formula [56]. In all these cases, a perfect periodicity or full order at the long-range scale does not exist; the dispersion of charges cannot give rise to constant atomic schemes that spread along the three dimensions to give rise to a fully ordered structure.
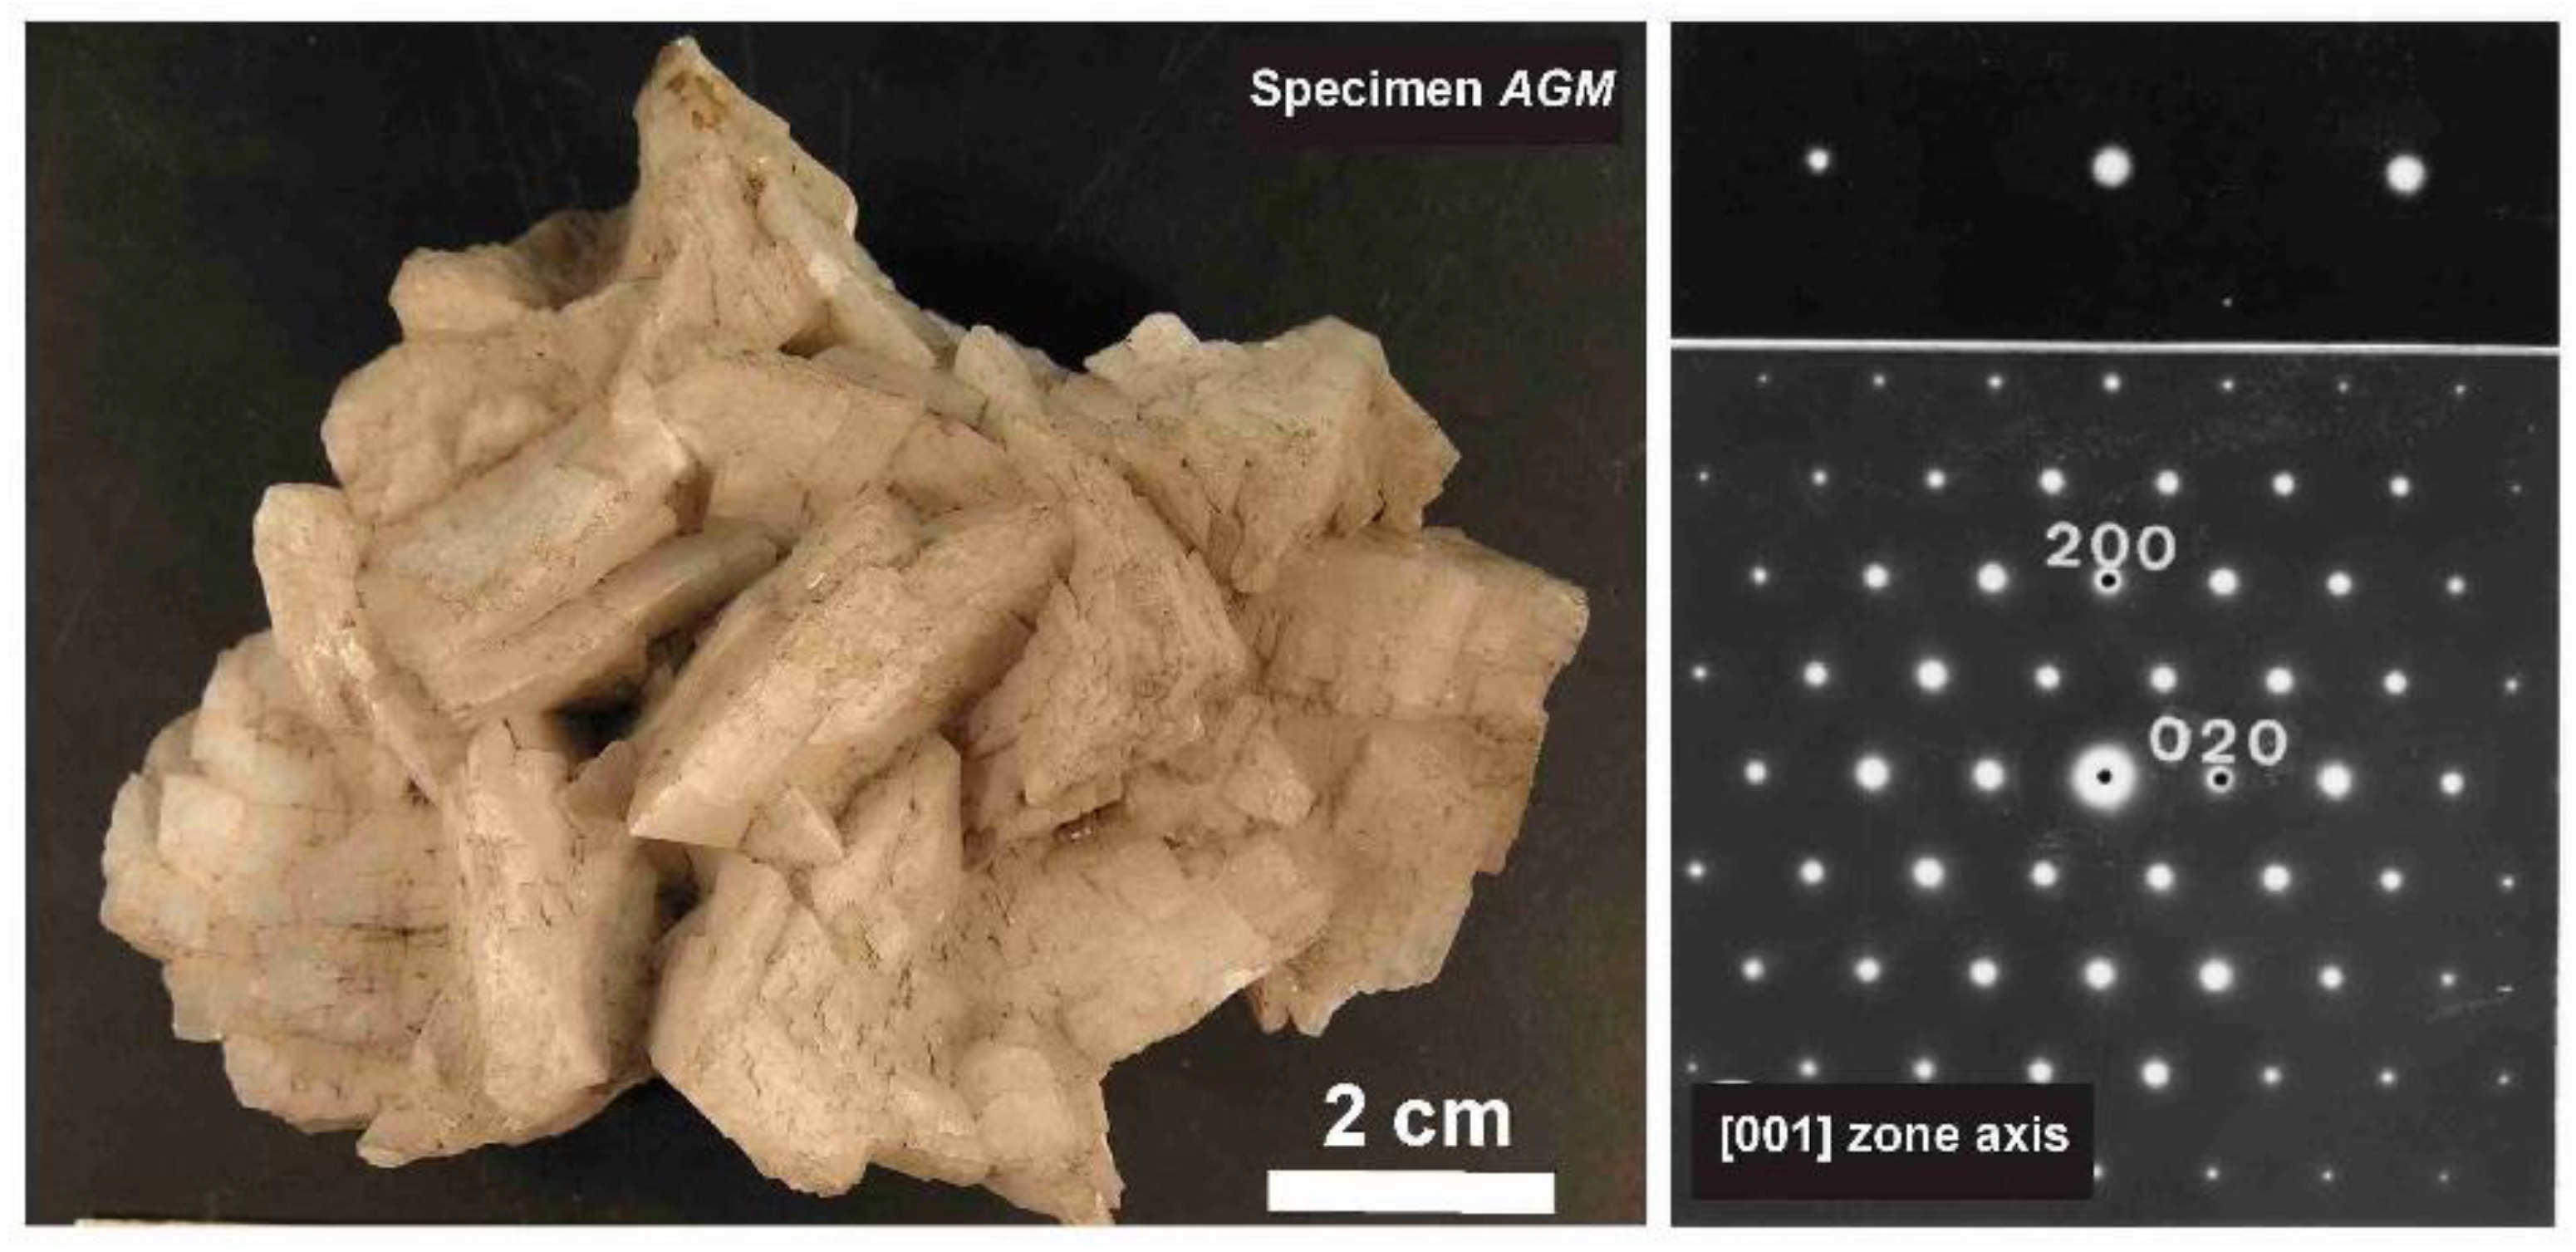
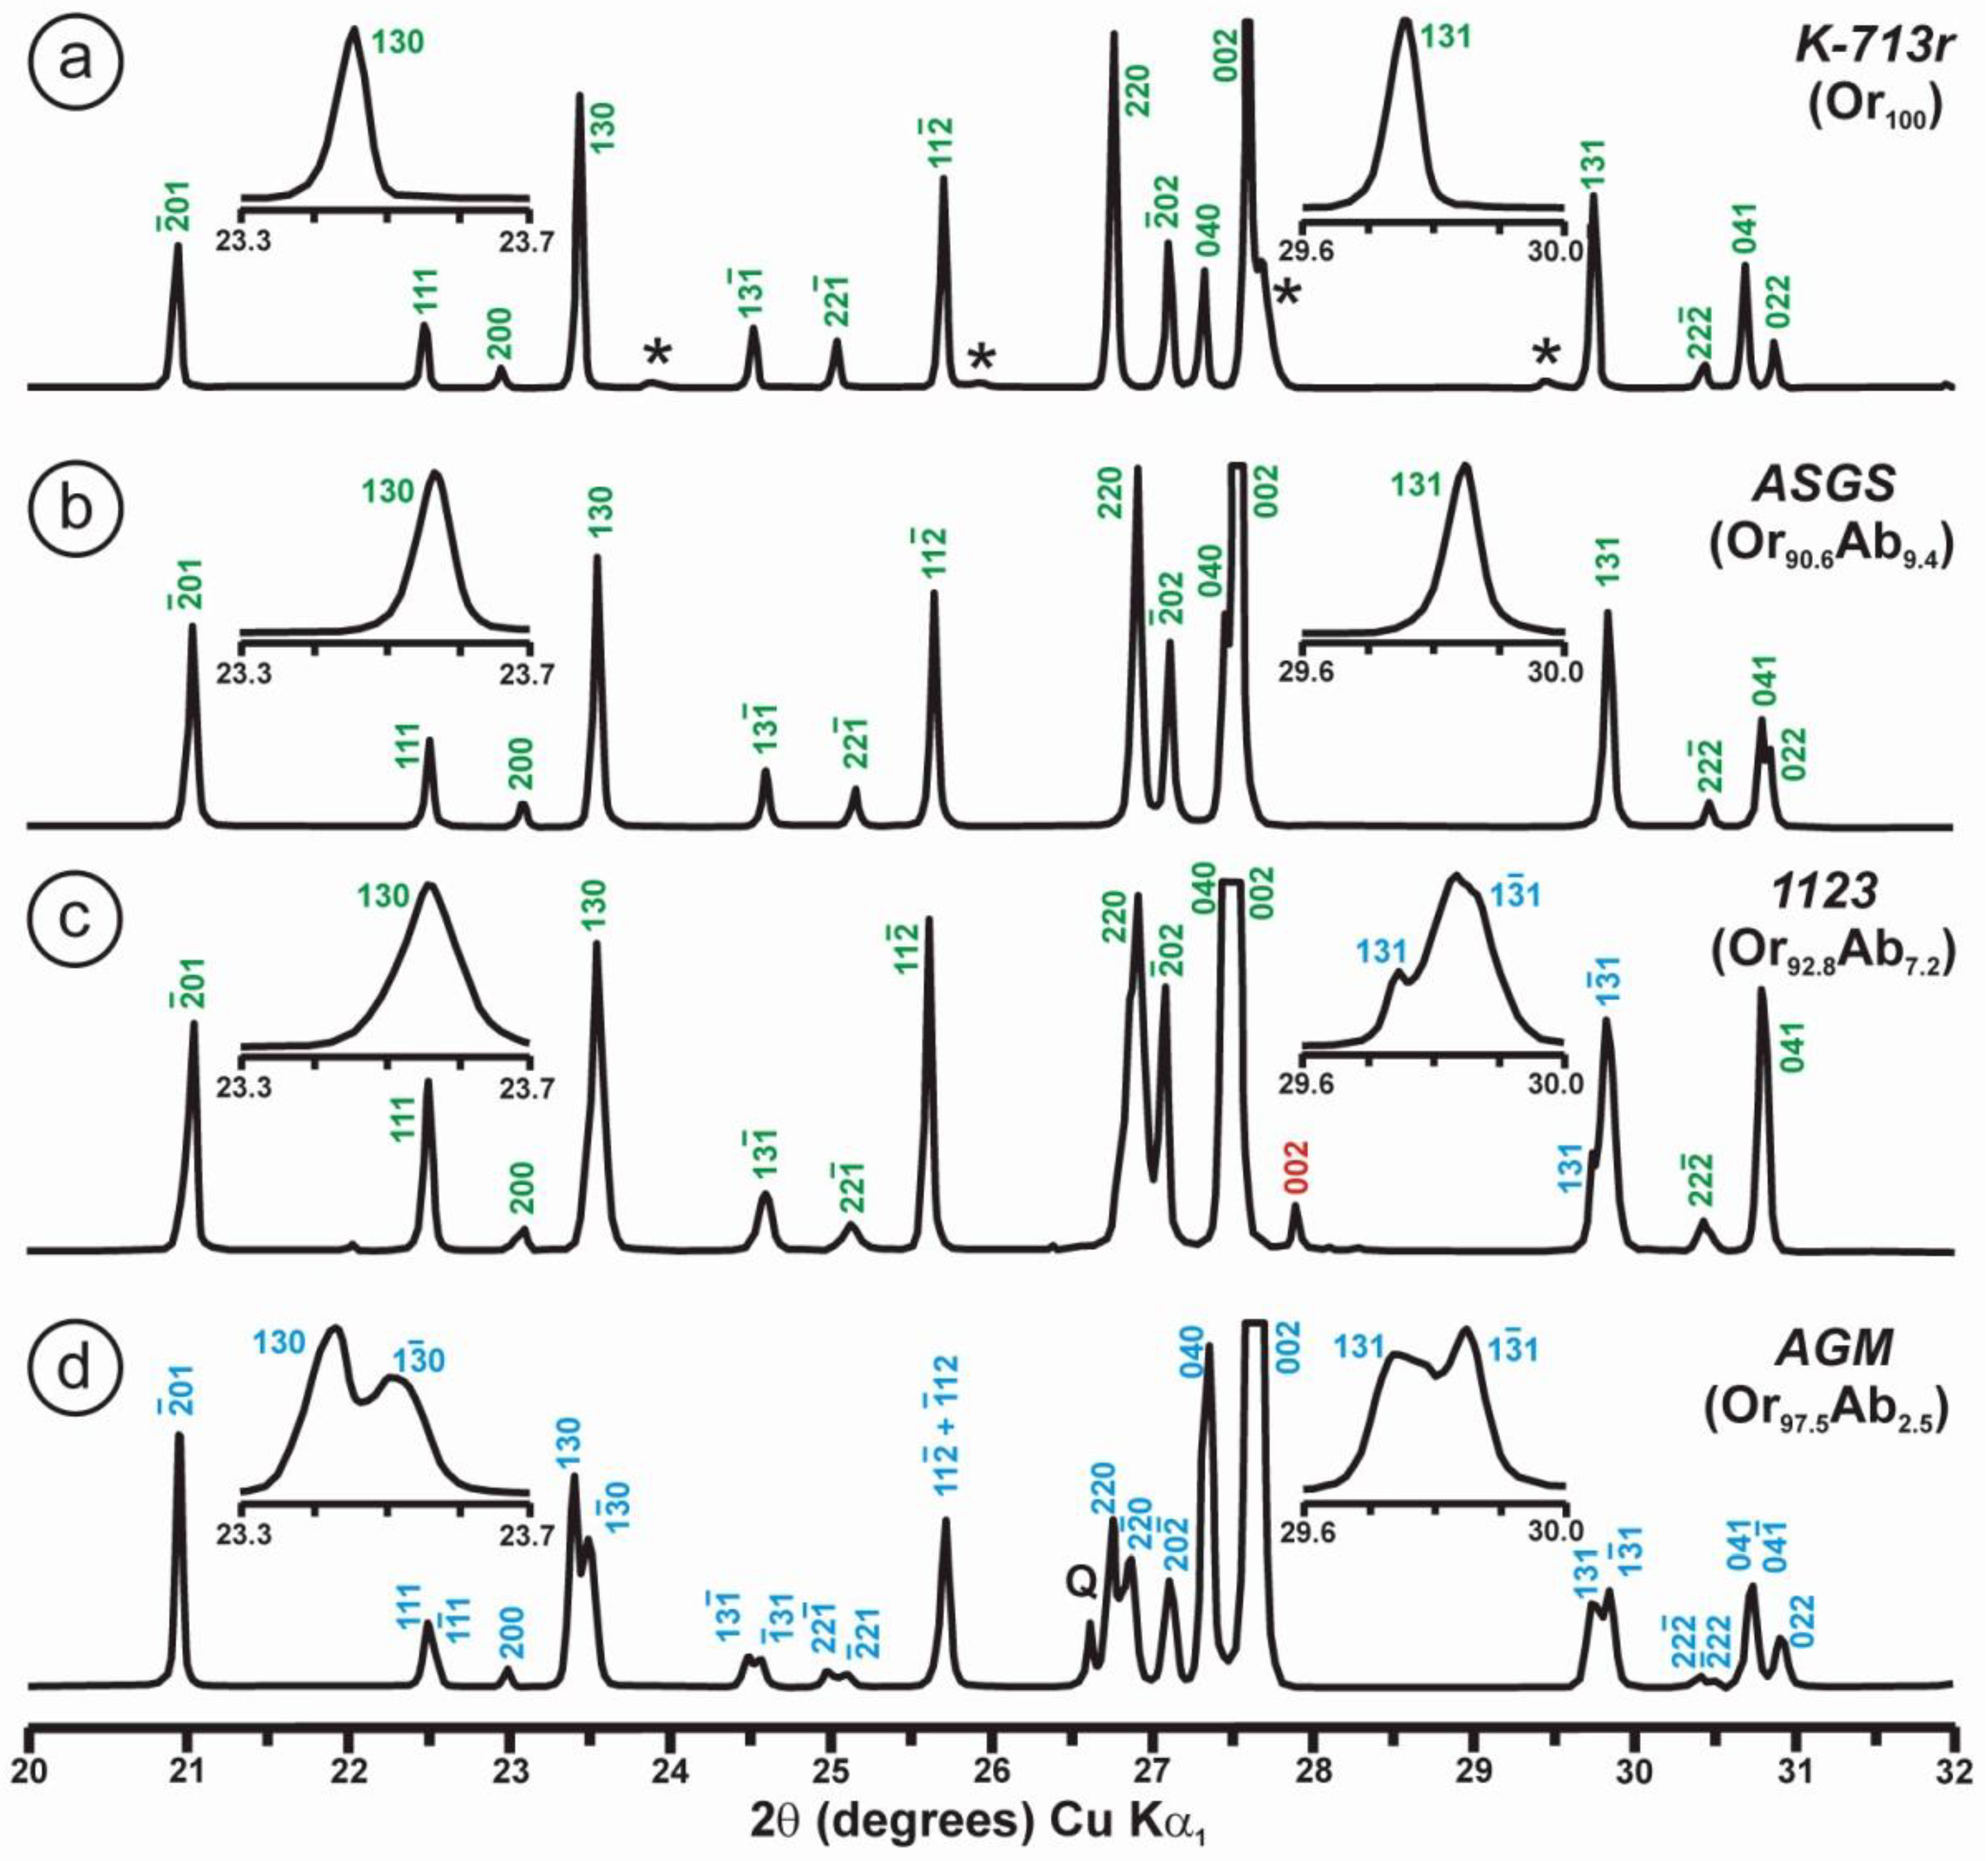
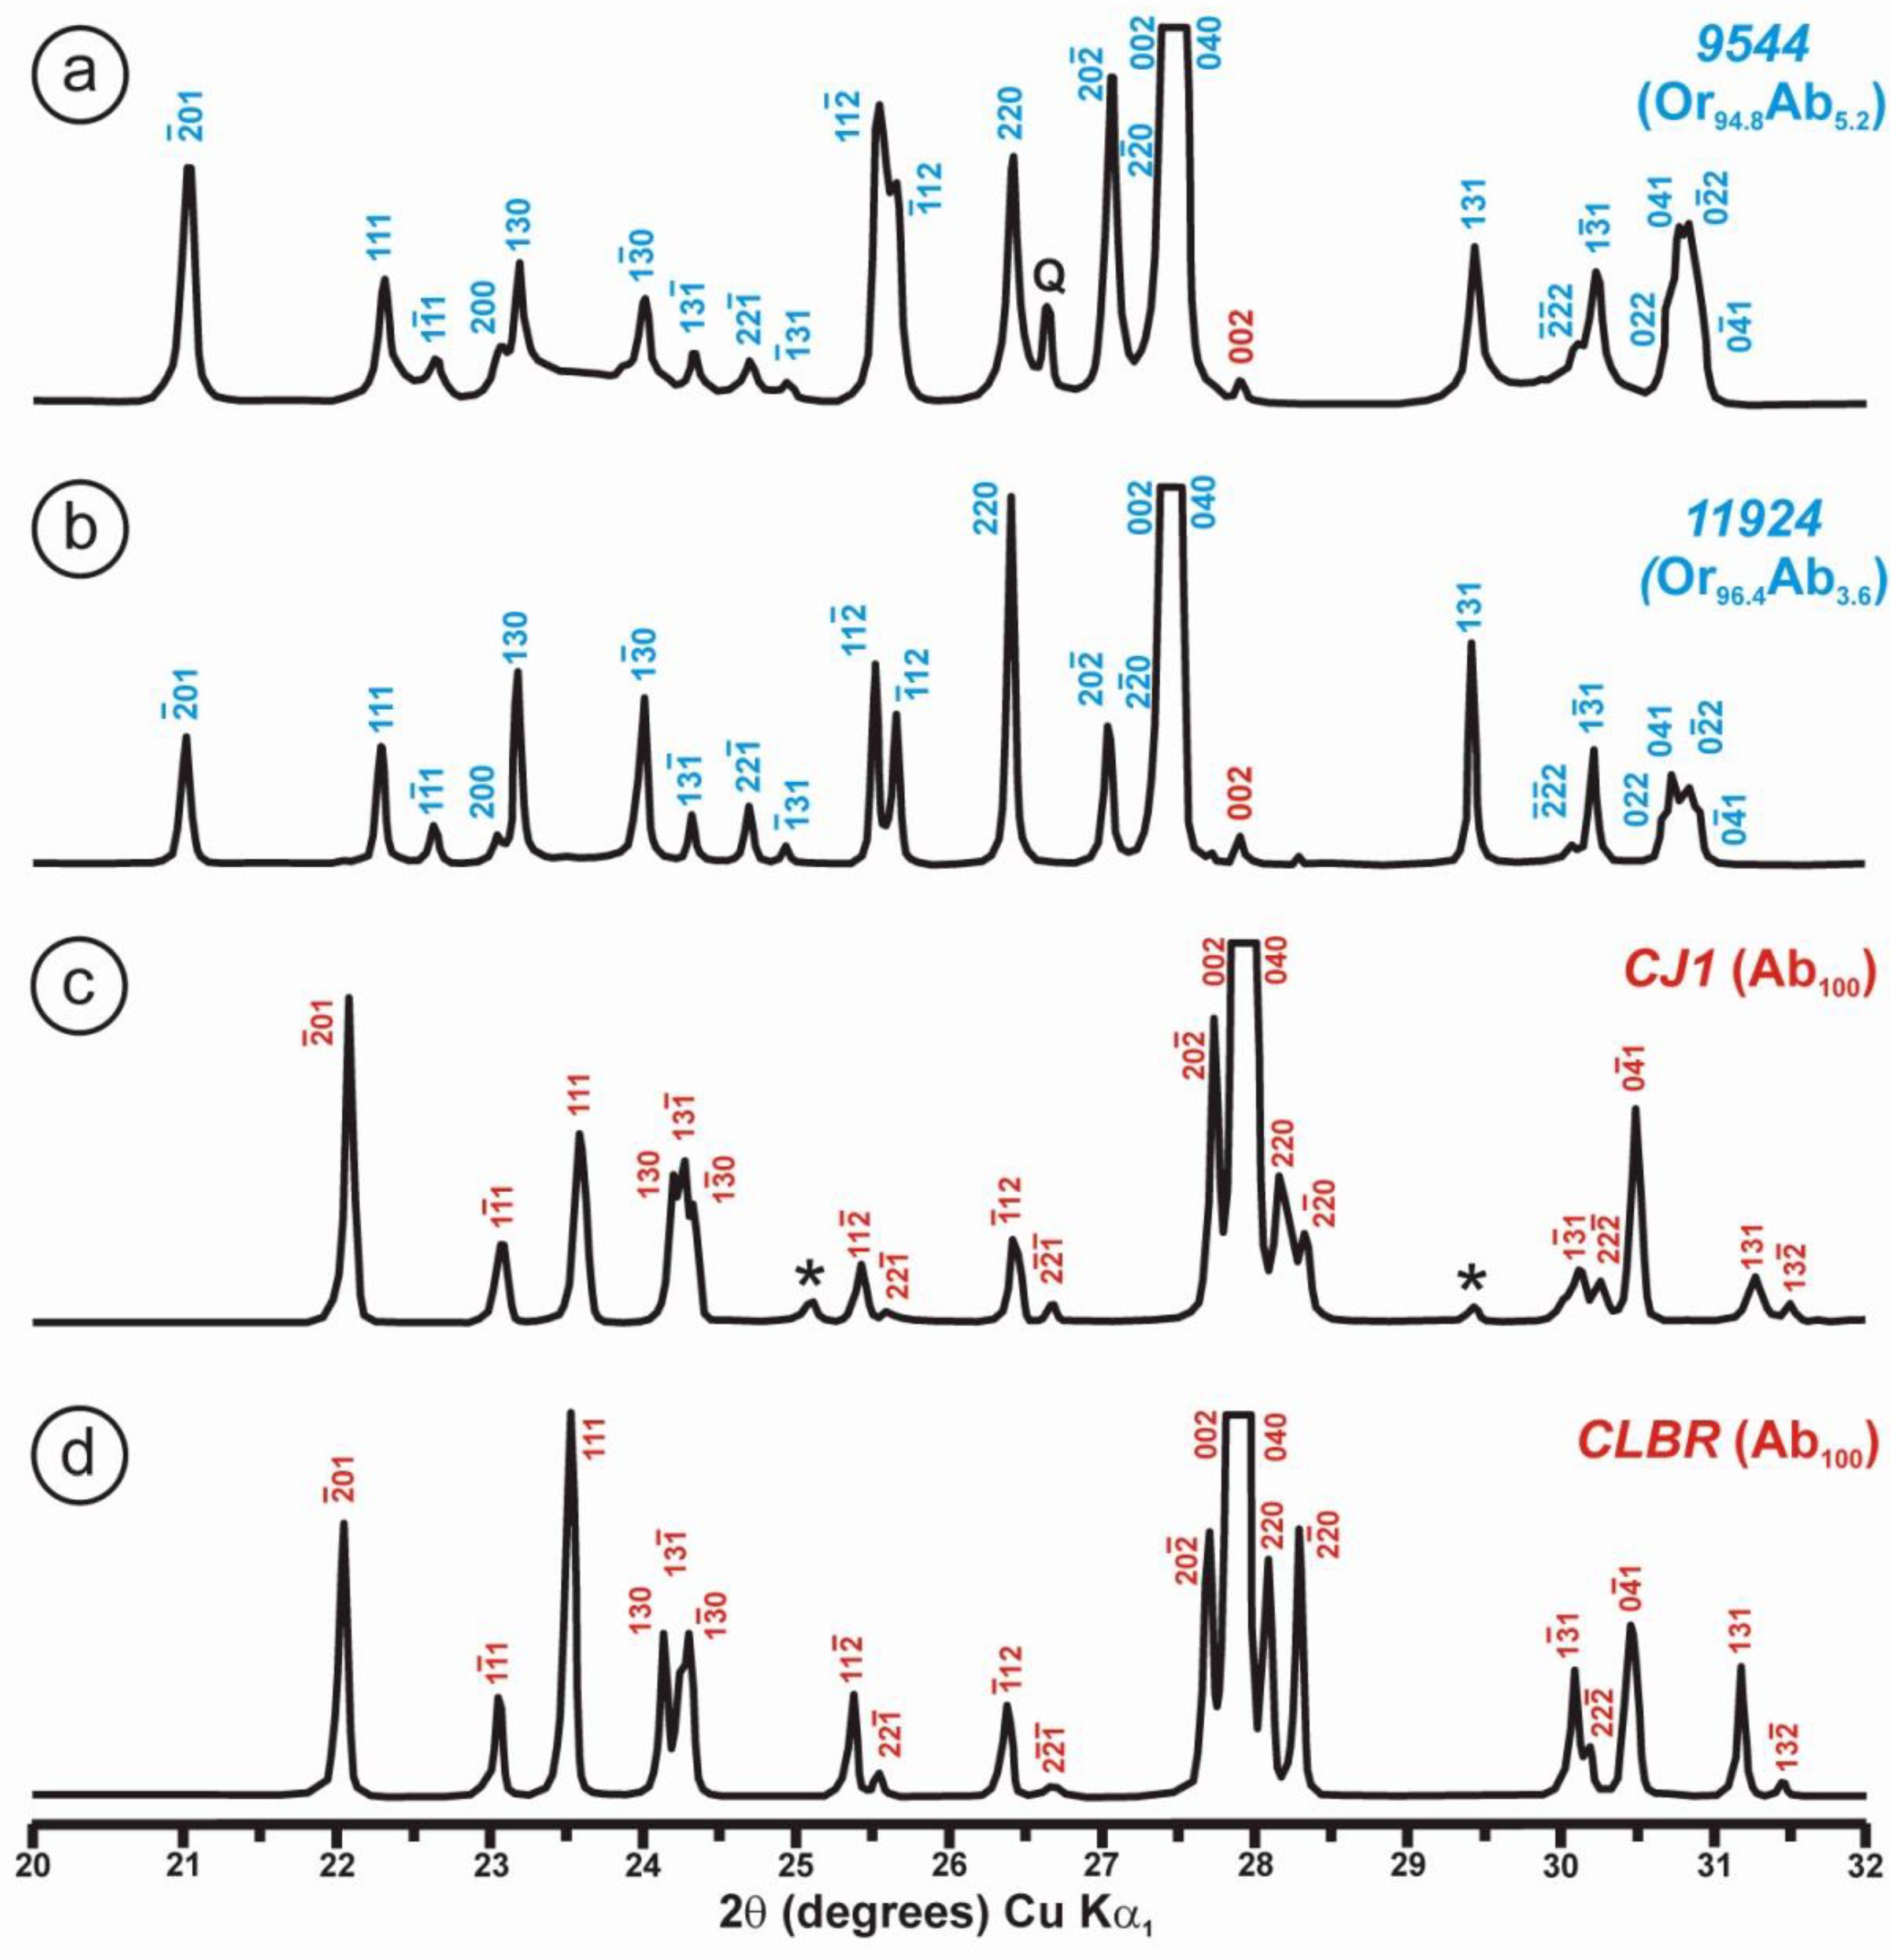
The phenomenon of charge dispersion has also been invoked in “valencianite”, which has a formula close to KAlSi3O8 stoichiometry (i.e., the end-member composition of the alkali feldspar solid-solution series) and the Q4 tectosilicate structure of the K-feldspars. Specimen AGM from the Valenciana mine in Guanajuato, Mexico [4] is from the collection of the Museo Nacional de Ciencias Naturales (MNCN, CSIC). It was investigated by Andrés del Rio and A. von Humboldt at the beginning of the 19th century. The aggregate of several large crystals up to ~3 cm displays the well-known “curved faces” and a pearly luster that greatly resembles dolomite crystals (Figure 8). Some features had already been described and analyzed by Breithaupt in 1830 [58]. The specimen has a composition Or97.5Ab2.5 and cell dimensions similar to those of disordered sanidine: a = 8.594(1), b = 13.024(1), c = 7.177(1) Å. However, its symmetry is triclinic, with α = 90.06(1), β = 116.07(1), γ = 89.74(1)° (Rietveld refinement) [4]. Figure 9 shows some details of the XRD pattern of specimen AGM in comparison with other specimens used in this work.
However, some of the modern specimens collected at the same mine are not strictly “valencianite” as described here in specimen AGM, but common idiomorphic K-feldspar with an adularia Felsöbanya habit, composed of a mixture of orthoclase and microcline at the optical and X-ray scales [59]. It seems that our specimen is a product of hydrothermal crystallization at lower temperatures and not the result of a monoclinic-to-triclinic transition from a precursor having monoclinic symmetry. Specimen AGM has a disordered and triclinic structure, which is different of that disordered structure quenched in sanidine crystals that crystallized at high temperatures from volcanic rocks. Electron-diffraction patterns of specimen AGM show diffraction maxima with a very regular round shape and without any diffuse scattering (Figure 8), but its NMR spectra indicate a disordered structure in comparison with the low microcline end-member of the order–disorder series (see below). Hence, it is important to note that chemical disorder may not give rise to diffuse scattering, and thus go unnoticed by RSTs.
Figure 10 and Table 5 show the NMR spectra and their parameters from spectral simulation for “valencianite” using specimen AGM. Most of the area of the 29Si spectrum (Figure 10a) can be simulated with four broad components of ca. 2.30 ppm line width at −101.4 ppm, −100.04 ppm, −97.41 ppm, and −94.95 ppm, caused by the four tetrahedra T2m (2Si,2Al), T2O (3Si,1Al), T1m (3Si,1Al) and T1O (3Si,1Al) sites, respectively. The site occupancies of the Si atoms and the chemical shifts are very close to those of microcline, where these components have a line width of ~ 1 ppm. If we compare this spectrum with that of sanidine with a similar composition and with a Si,Al distribution that follows Loewenstein’s rule, we infer that in “valencianite”, the (4Si,0Al), (2Si,2Al), (1Si,3Al) and (0Si,4Al) are virtually absent (except for T2m site with a (2Si,2Al) environment), i.e., having a strong dispersion of charges at long distances to give rise to chemical environments mainly close to the Si:Al ratio of 3:1, existing in the stoichiometric chemical formula. This structure is thus compatible with medium-range order in which only one Al atom occurs per each four-membered ring in the structure, to give rise to “…1-1-1-1…” chains [4]. One can interpret these results as originating from a structure in which electrical charges are homogeneously distributed, in a way similar to the Si,Al distribution in the layer of tetrahedra in micas, where the number of chemical environments must be strongly reduced but strict periodicity is not yet attained due to disorder [55,56].
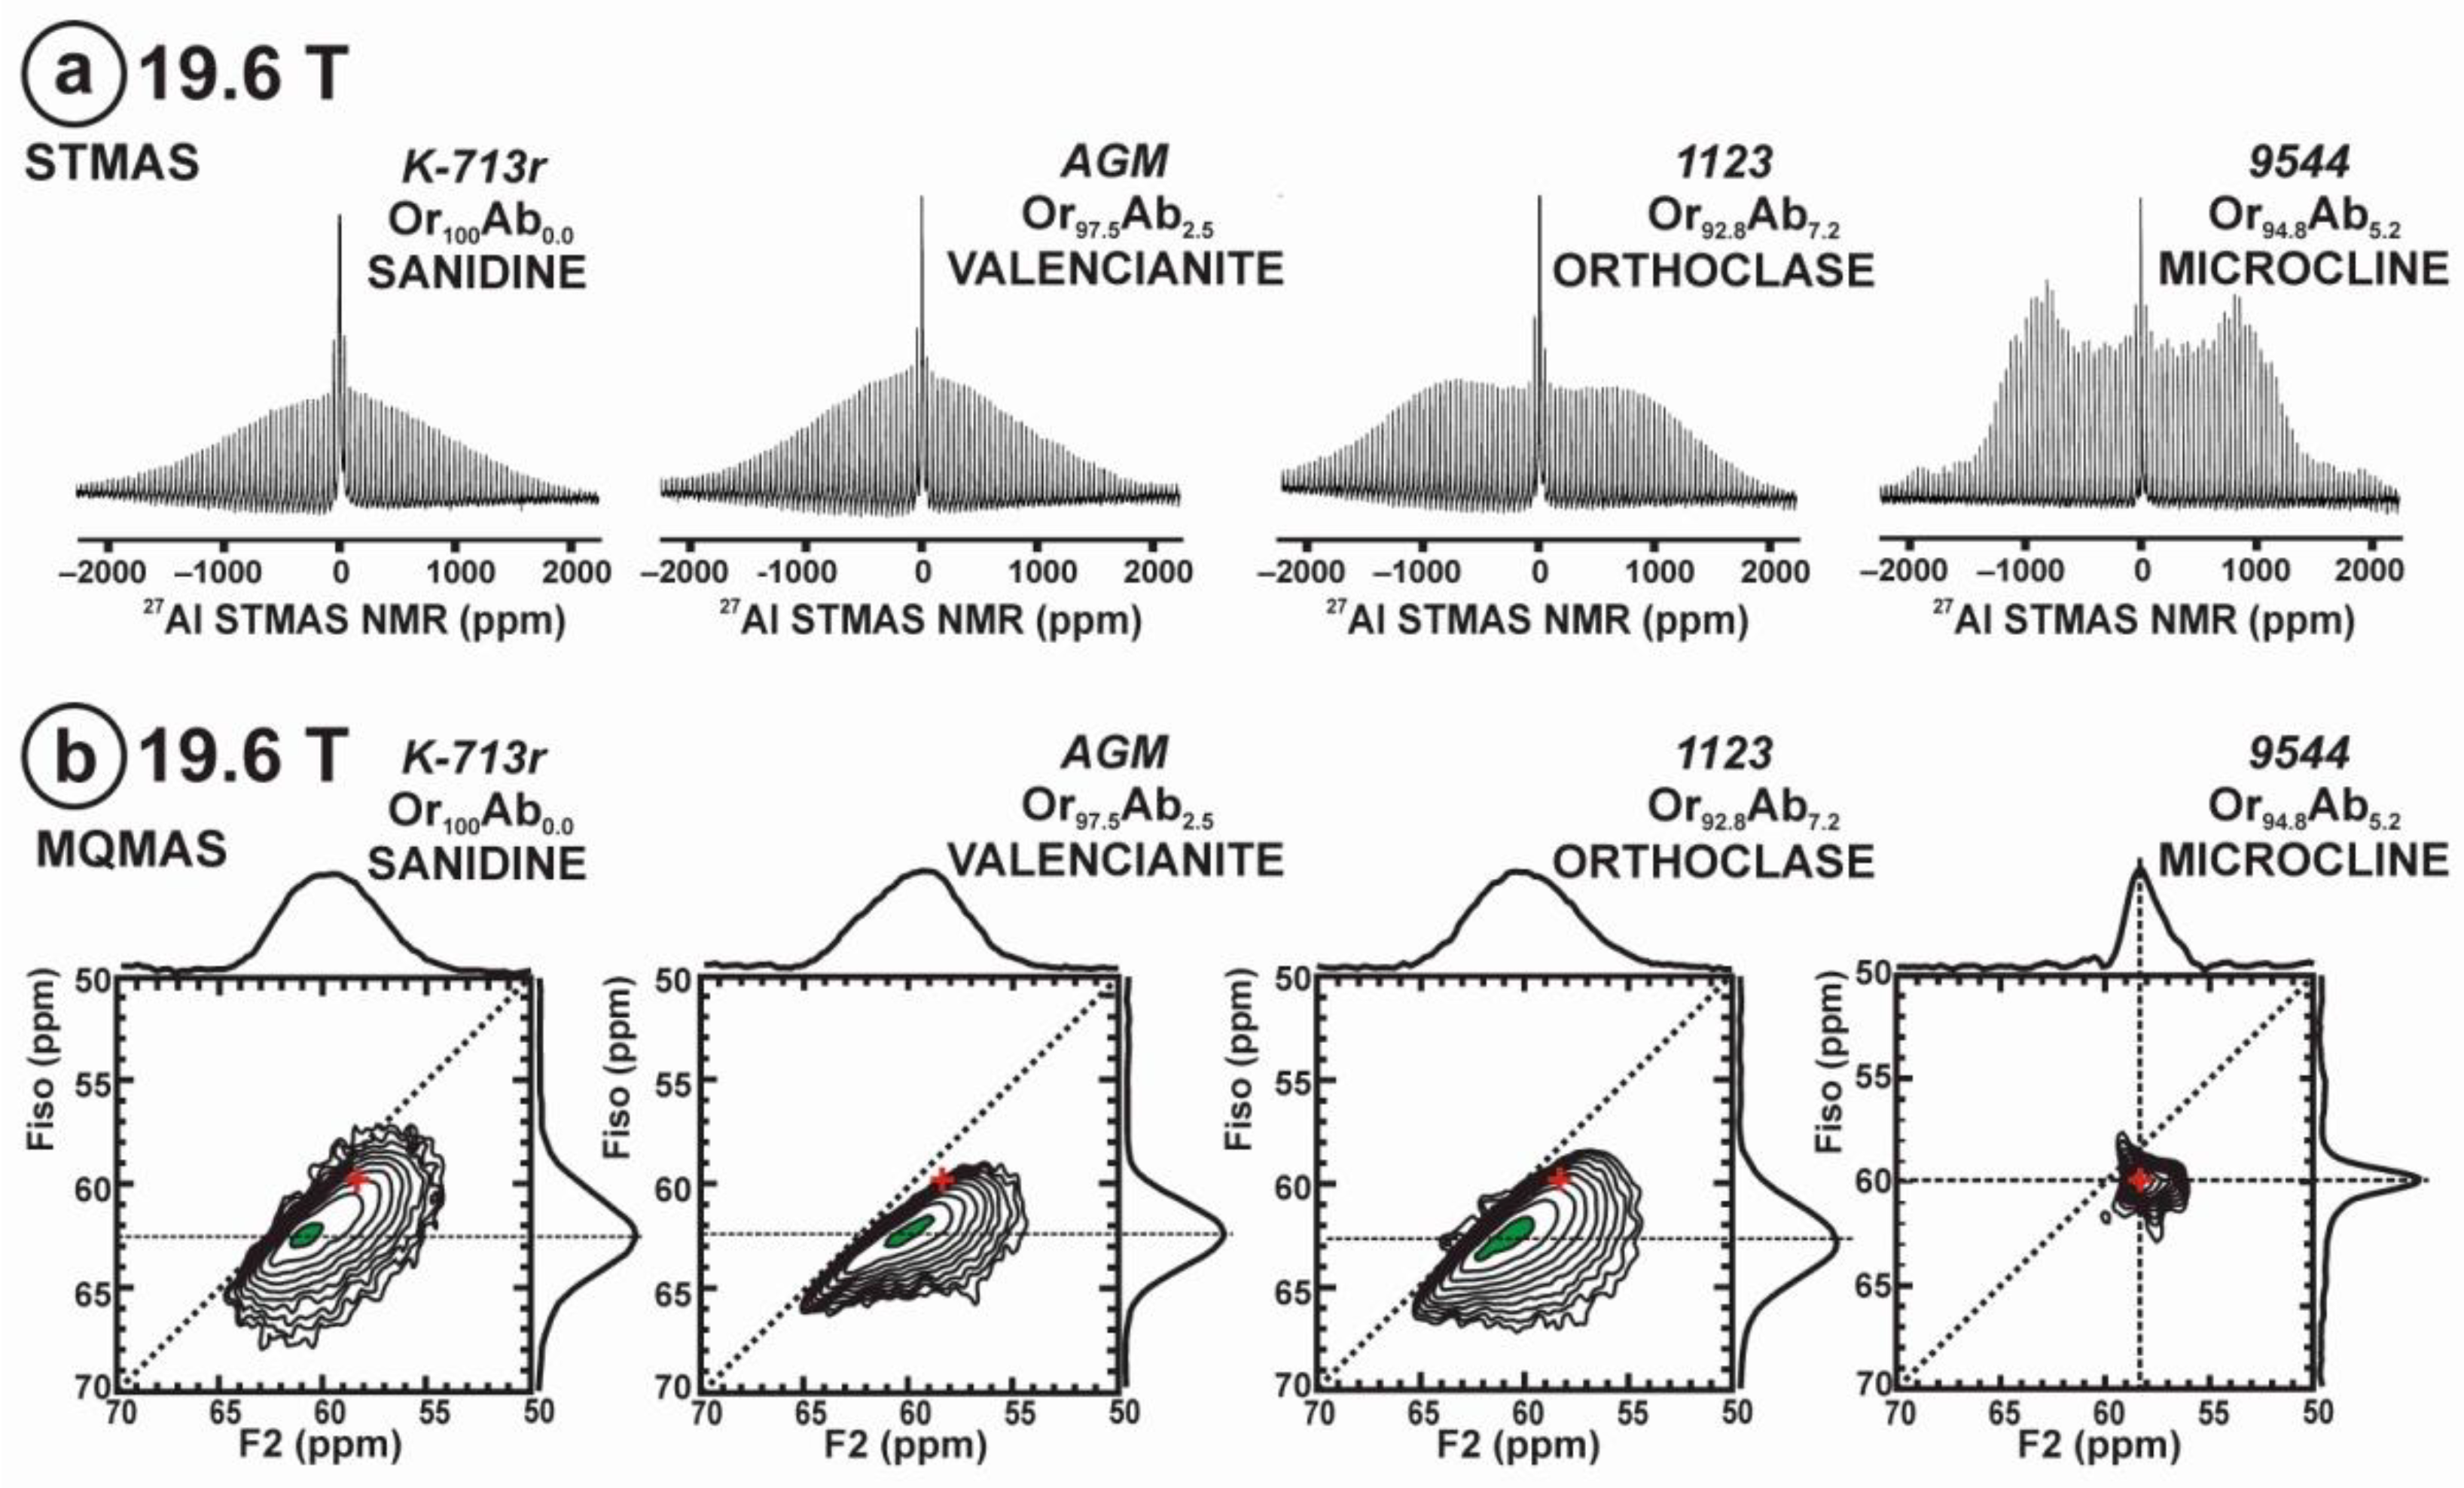
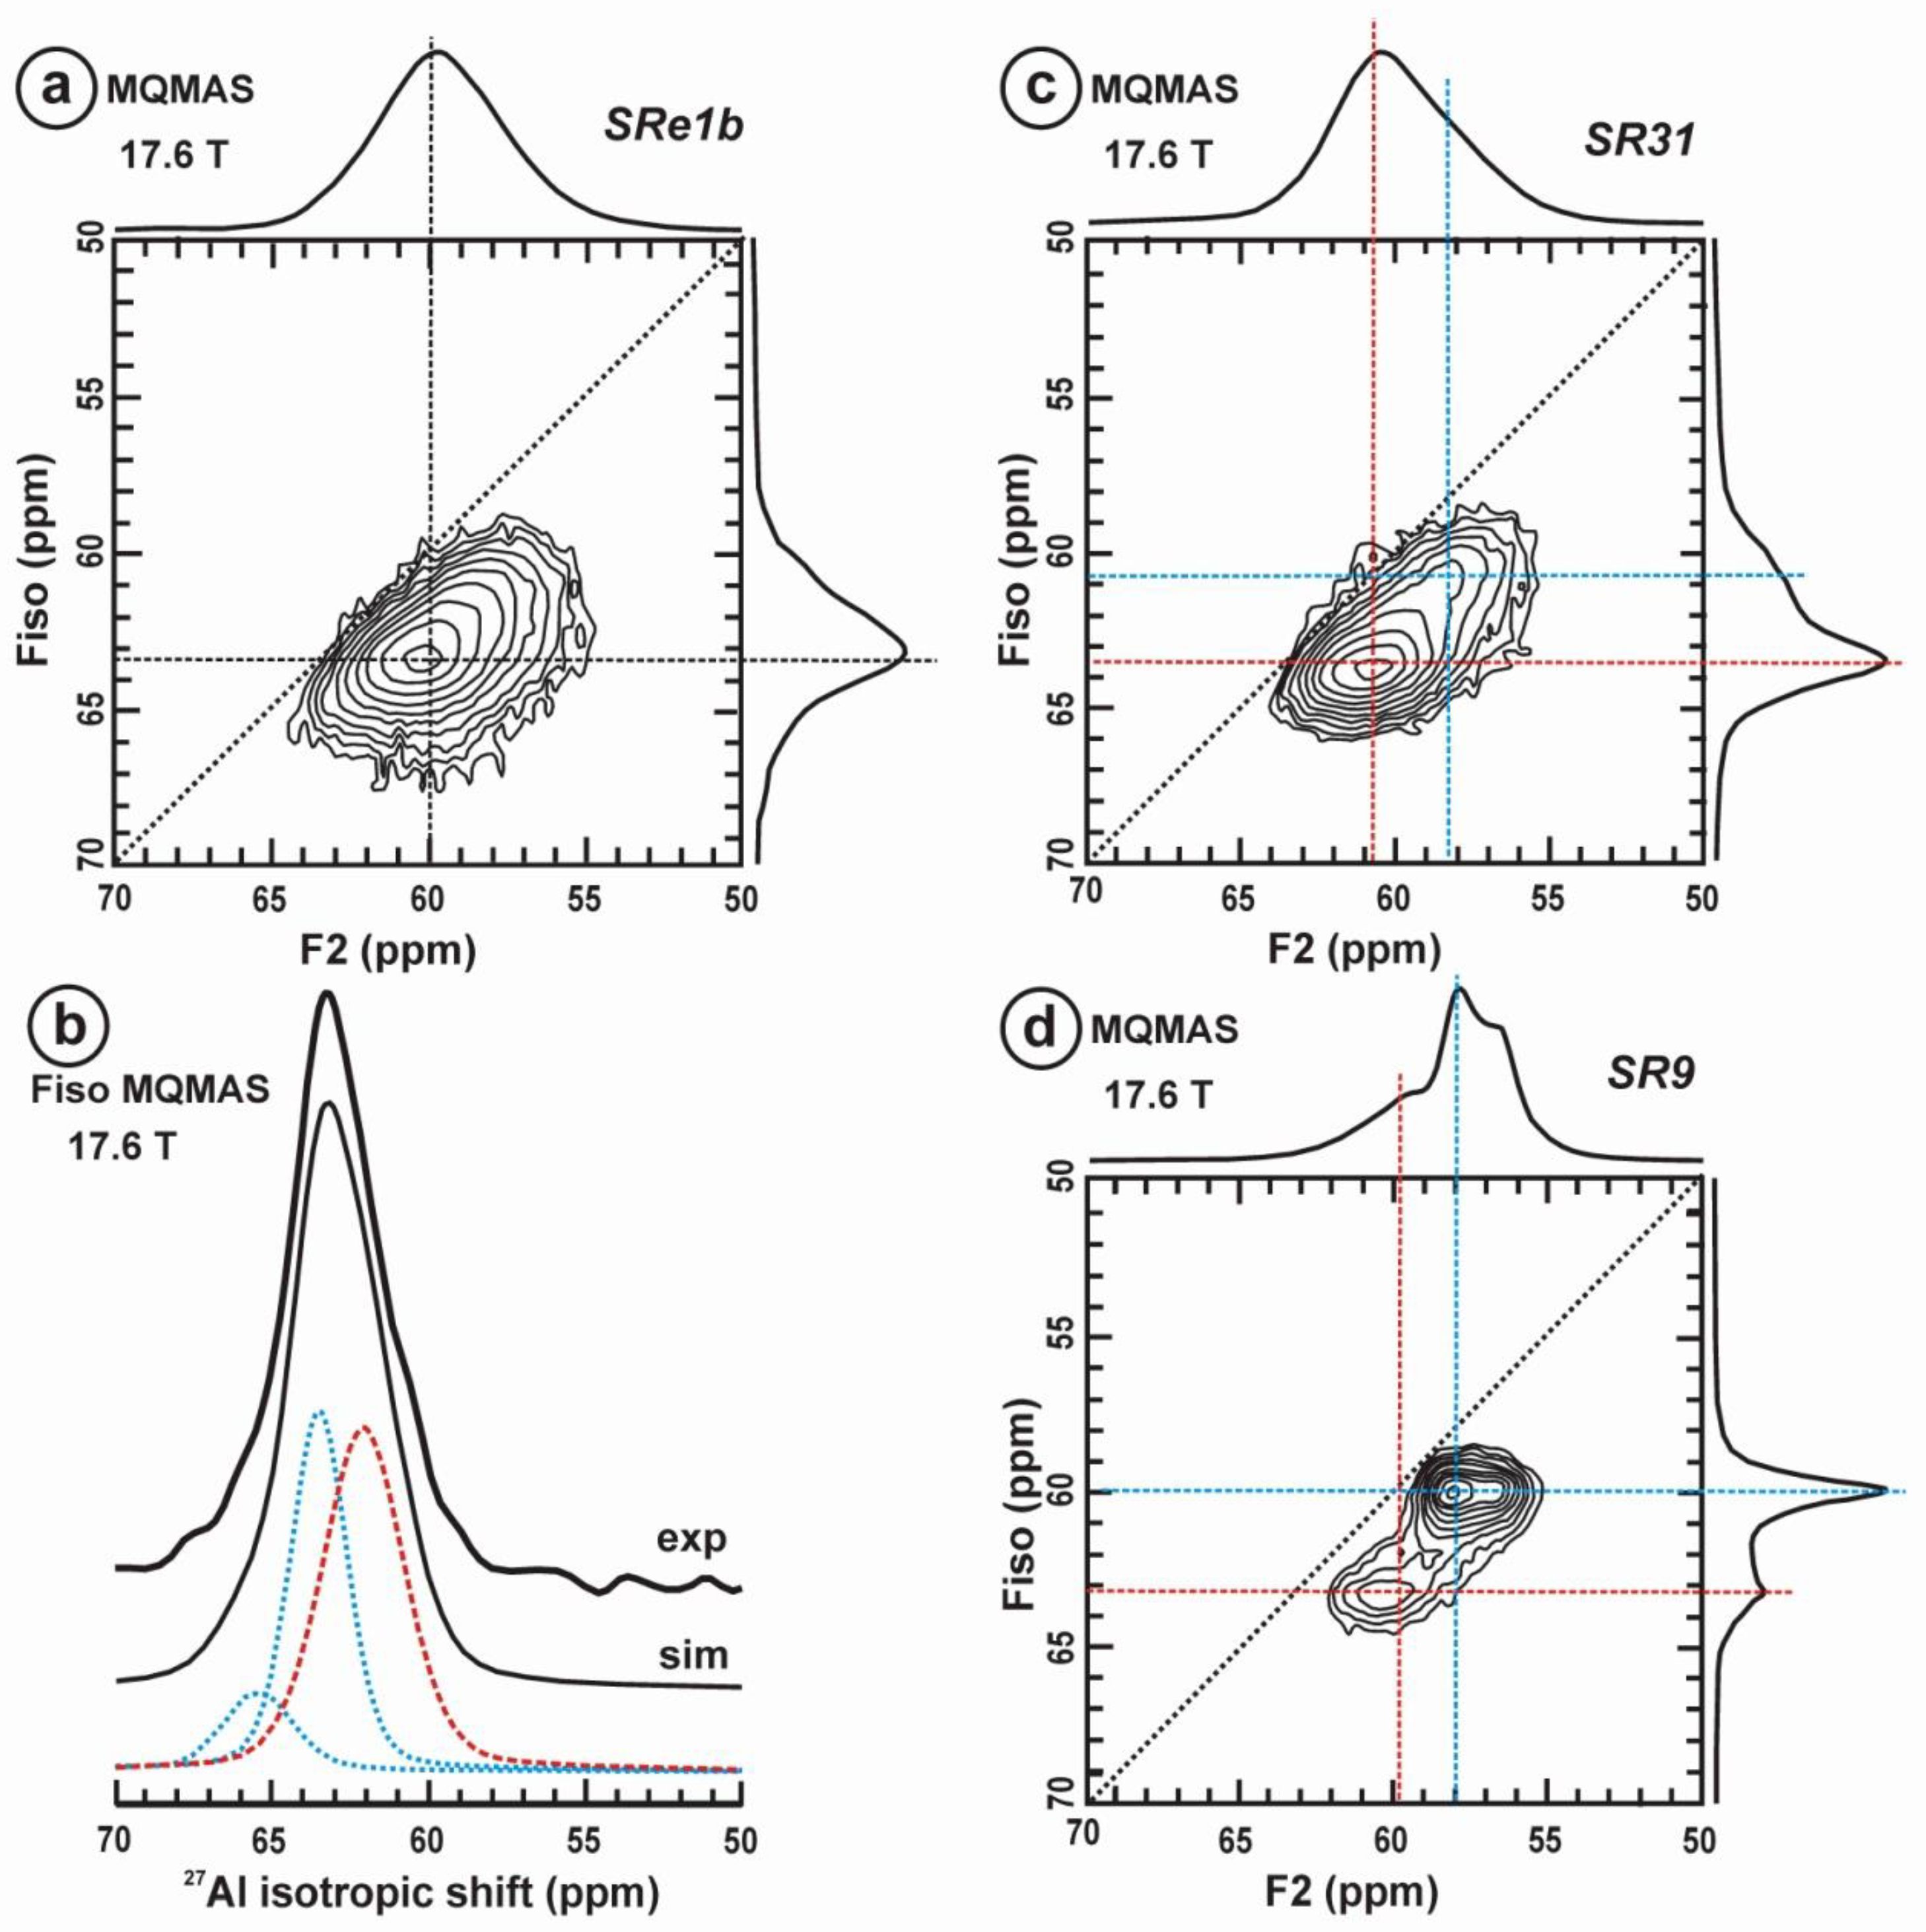
Figure 11 exhibits the 27Al satellite-transition magic-angle (sample) spinning (STMAS) NMR and the 27Al multi-quantum magic-angle spinning (MQMAS) NMR at 19.6 T of “valencianite” in comparison with those from the three accepted mineral species of K-feldspars by IMA, i.e., sanidine, orthoclase and microcline. The 27Al STMAS spectrum of “valencianite” is closer to sanidine than to the other two mineral species, since it does not have a clear quadrupolar profile from the first-order quadrupolar interaction (Figure 11a). The 27Al MQMAS NMR spectrum of “valencianite” differs from those of the orthoclase and sanidine, because the distributions in the chemical shift and in the second-order quadrupolar interaction (i.e., the site distributions) for the Al sites are narrower than in the two minerals with a monoclinic symmetry by RSTs. However, it is definitely much larger than in the specimen of microcline, actually the “X-ray microcline” variant.
“Valencianite” has an X-ray diffraction pattern with cell angles that can be interpreted as obeying C symmetry in the triclinic system, and thus corresponding to “microcline”, i.e., one of the IMA-approved species, with a low obliquity as found in the “X-ray intermediate microcline” variety. However, the cell dimensions of “valencianite” are similar to those of sanidine, also an IMA-approved species. The NMR spectra of “valencianite”, with a disordered Si,Al distribution but with a remarkable dispersion of charges as in orthoclase, are definitely different from those of the three IMA-approved species of K-feldspar. The case of “valencianite” thus opens the possibility to define mineral species using NMR spectra as the defining experimental data of reference, if local structure can be considered the better criterion in this case to distinguish the species instead of only stoichiometric composition.
4.3. Heterogeneous Structures at the Mesoscale
In the late 19th century, Ernest Mallard [43] attempted to explain anomalous optical phenomena in crystalline substances using optical microscopy data. He focused on minerals composed of an intimate intergrowth of coherent lamellae of the same composition but with different orientations, as well as minerals containing lamellae of a different chemical compound. His explanations were later largely ignored by X-ray crystallographers, who were convinced that the technology they employed had a higher resolution than optical microscopy. Reciprocal space techniques thus have traditionally been used to obtain average structures in minerals that were interpreted to be “single crystals” but with a heterogeneous character.
It was more or less contemporaneously revealed by electron microscopy and electron diffraction that these minerals were actually formed by structural or chemical heterogeneities (or both) at the mesoscale (i.e., <50 nm). Mallard’s hypothesis was revisited more than 75 years later, in the 1960s and 1970s by Fritz Laves in his study of feldspars by XRD [60,61,62,63,64,65]. It was again discussed by Bambauer et al. [66]. Nowadays, depending on the size scale and character of the coexisting domains and the nature of their wall boundaries, three different solids are recognized: aperiodically modulated “tweed” structures, composite periodically modulated structures, and fine coherent intergrowths of two phases.
The aperiodically modulated “tweed” structures have gradual and diffuse wall boundaries between distinct structural units or modules. The structure is transformed (modulated) along two approximately orthogonal waves, in most cases without strict periodicity, as irregularly shaped and spaced waves with different of amplitudes. This transitional behavior gives rise to gradual changes between ill-defined modules or domains with a similar average chemical composition and degree of local order, but with different relative orientations. Domains with sharp walls and regular separation cannot be invoked in this case. This kind of modulation can cause twin domains, i.e., modules with sharp boundaries related by symmetry operations. It is found in many solids including metallic alloys [67], ceramic superconductors [68] and minerals such as cordierite [69]. In K-feldspars, the tweed pattern occurs in most cases as an aperiodically modulated structure in common orthoclase, although it has occasionally also been found with a commensurate modulated structure [70].
Since the proposal of Barth in 1934 [71], orthoclase is accepted by IMA as a mineral species of the K-feldspar group, and thus different from sanidine and microcline. Barth suggested that sanidine, orthoclase and microcline are different species because they differ in degree of order in their Si,Al distribution. Sanidine and orthoclase have a monoclinic symmetry with Si,Al disorder at two T sites, and microcline has a triclinic symmetry, with Si,Al order at four T sites. The interpretation of orthoclase as the result of microcline lamellae with different sizes, shapes and orientations, i.e., the Mallard’s hypothesis, was again proposed to explain diffuse (scattering) streaks in X-ray photographs [60]. The heated debate about the nature of orthoclase reflected the differences in resolution of the experimental techniques and the structural and microstructural diversity among specimens with a similar X-ray pattern.
With additional research, the X-ray symmetry of orthoclase is now described with three contrasting models: average structure, overall structure and apparent structure. The “average structure” model involves a C2/m monoclinic symmetry and suggests that if a local deviation from monoclinic symmetry exists, it is probably very small [72], i.e., following the Barth’s hypothesis. The “overall structure” model suggests an alternation of partially ordered domains that retain an overall monoclinic symmetry to X-rays [73]. With these two models, one assumes that the weakness of the diffuse streaks is a minor or accessory effect in comparison to the concentrated intensity in the Bragg spots. The structure is considered monoclinic from an average or overall perspective, and one ignores or avoids the question whether the reciprocal space techniques have sufficient power to resolve the real structure. The third model (“apparent structure”) derives from the observation of the appearance of orthoclase in its geological context, almost invariably with microcline rather than with sanidine. With the apparent structure explanation, one describes orthoclase as a material that deviates from truly monoclinic sanidine but appears to be monoclinic because of triclinic domains too small to be resolved by optical microscopy or even by XRD experiments. Such domains are related to each other by the Albite (A) and Pericline (P) twin laws, i.e., the symmetry elements lost during the monoclinic-to-triclinic transition [63].
The domain texture with tweed contrast was finally resolved in orthoclase by transmission electron microscopy (TEM). Orthogonal diffuse streaks were observed in selected-area diffraction (SAED) patterns, and interpreted following various approaches: as a monoclinic lattice that is homogeneously perturbed by two orthogonal transverse distortion wave systems [74]; as a domain texture composed of triclinic domains in a cross-hatch pattern similar to microcline at the optical scale, reflecting a combination of Albite and Pericline twinning [75]; as a partially ordered structure with lattice modulations with changes in the structural obliquity (i.e., departures from orthogonality) and an average triclinic symmetry [76]. High-resolution electron microscopy and 29Si NMR experiments combine to indicate a triclinic structure at the local scale similar to that of microcline, but having only a partially ordered Si,Al distribution [77].
The above explanations generally imply a transformation mechanism in which the process takes places by coarsening of the ill-defined (wave) domain into twin domains via independent and unrelated atomic adjustments. However, recent observations in K-rich feldspars from granitic pegmatites [78,79] indicate that the tweed microstructure of orthoclase cannot be explained by a random nucleation-and-growth process, i.e., by an atom-by-atom diffusion process of independent atomic units from a monoclinic (sanidine) precursor. Actually, the development of modules as fine tweed domains or large twin lamellae occurs from avalanche-like orthogonal recrystallization units or long-distance transformation waves in the solid state. The propagation of these ordering events from strain centers throughout the mineral structure occurs by cooperative motions of many atoms following mainly the rational directions of the Albite and Pericline twin laws, as well as other irrational directions [78,79]. This process produces mainly four types of lamellar intersections as crossovers between these units, giving rise to negative or positive interference effects. These recrystallization units can be observed at the sub-optic scale in orthoclase and at the optic scale in microcline and are formed on cooling during the monoclinic C2/m to triclinic C transition, giving rise to complex twin patterns in which regularity can be explained by a self-organization phenomenon [78,79].
Figure 12 shows the SAED patterns and high-resolution TEM image of specimen ASGS of orthoclase with variable degrees of transformation to microcline. This specimen has an X-ray pattern fully consistent with C2/m monoclinic symmetry (Figure 9b); it has a SAED pattern with well-developed diffuse streaks instead of diffraction spots from Bragg peaks, particularly along the [001] zone axis (Figure 12a), as described by McConnell [74]. It corresponds to a homogeneous tweed pattern of low amplitude or to recrystallization units of low intensity in direct-space observations, as shown in Figure 12b.
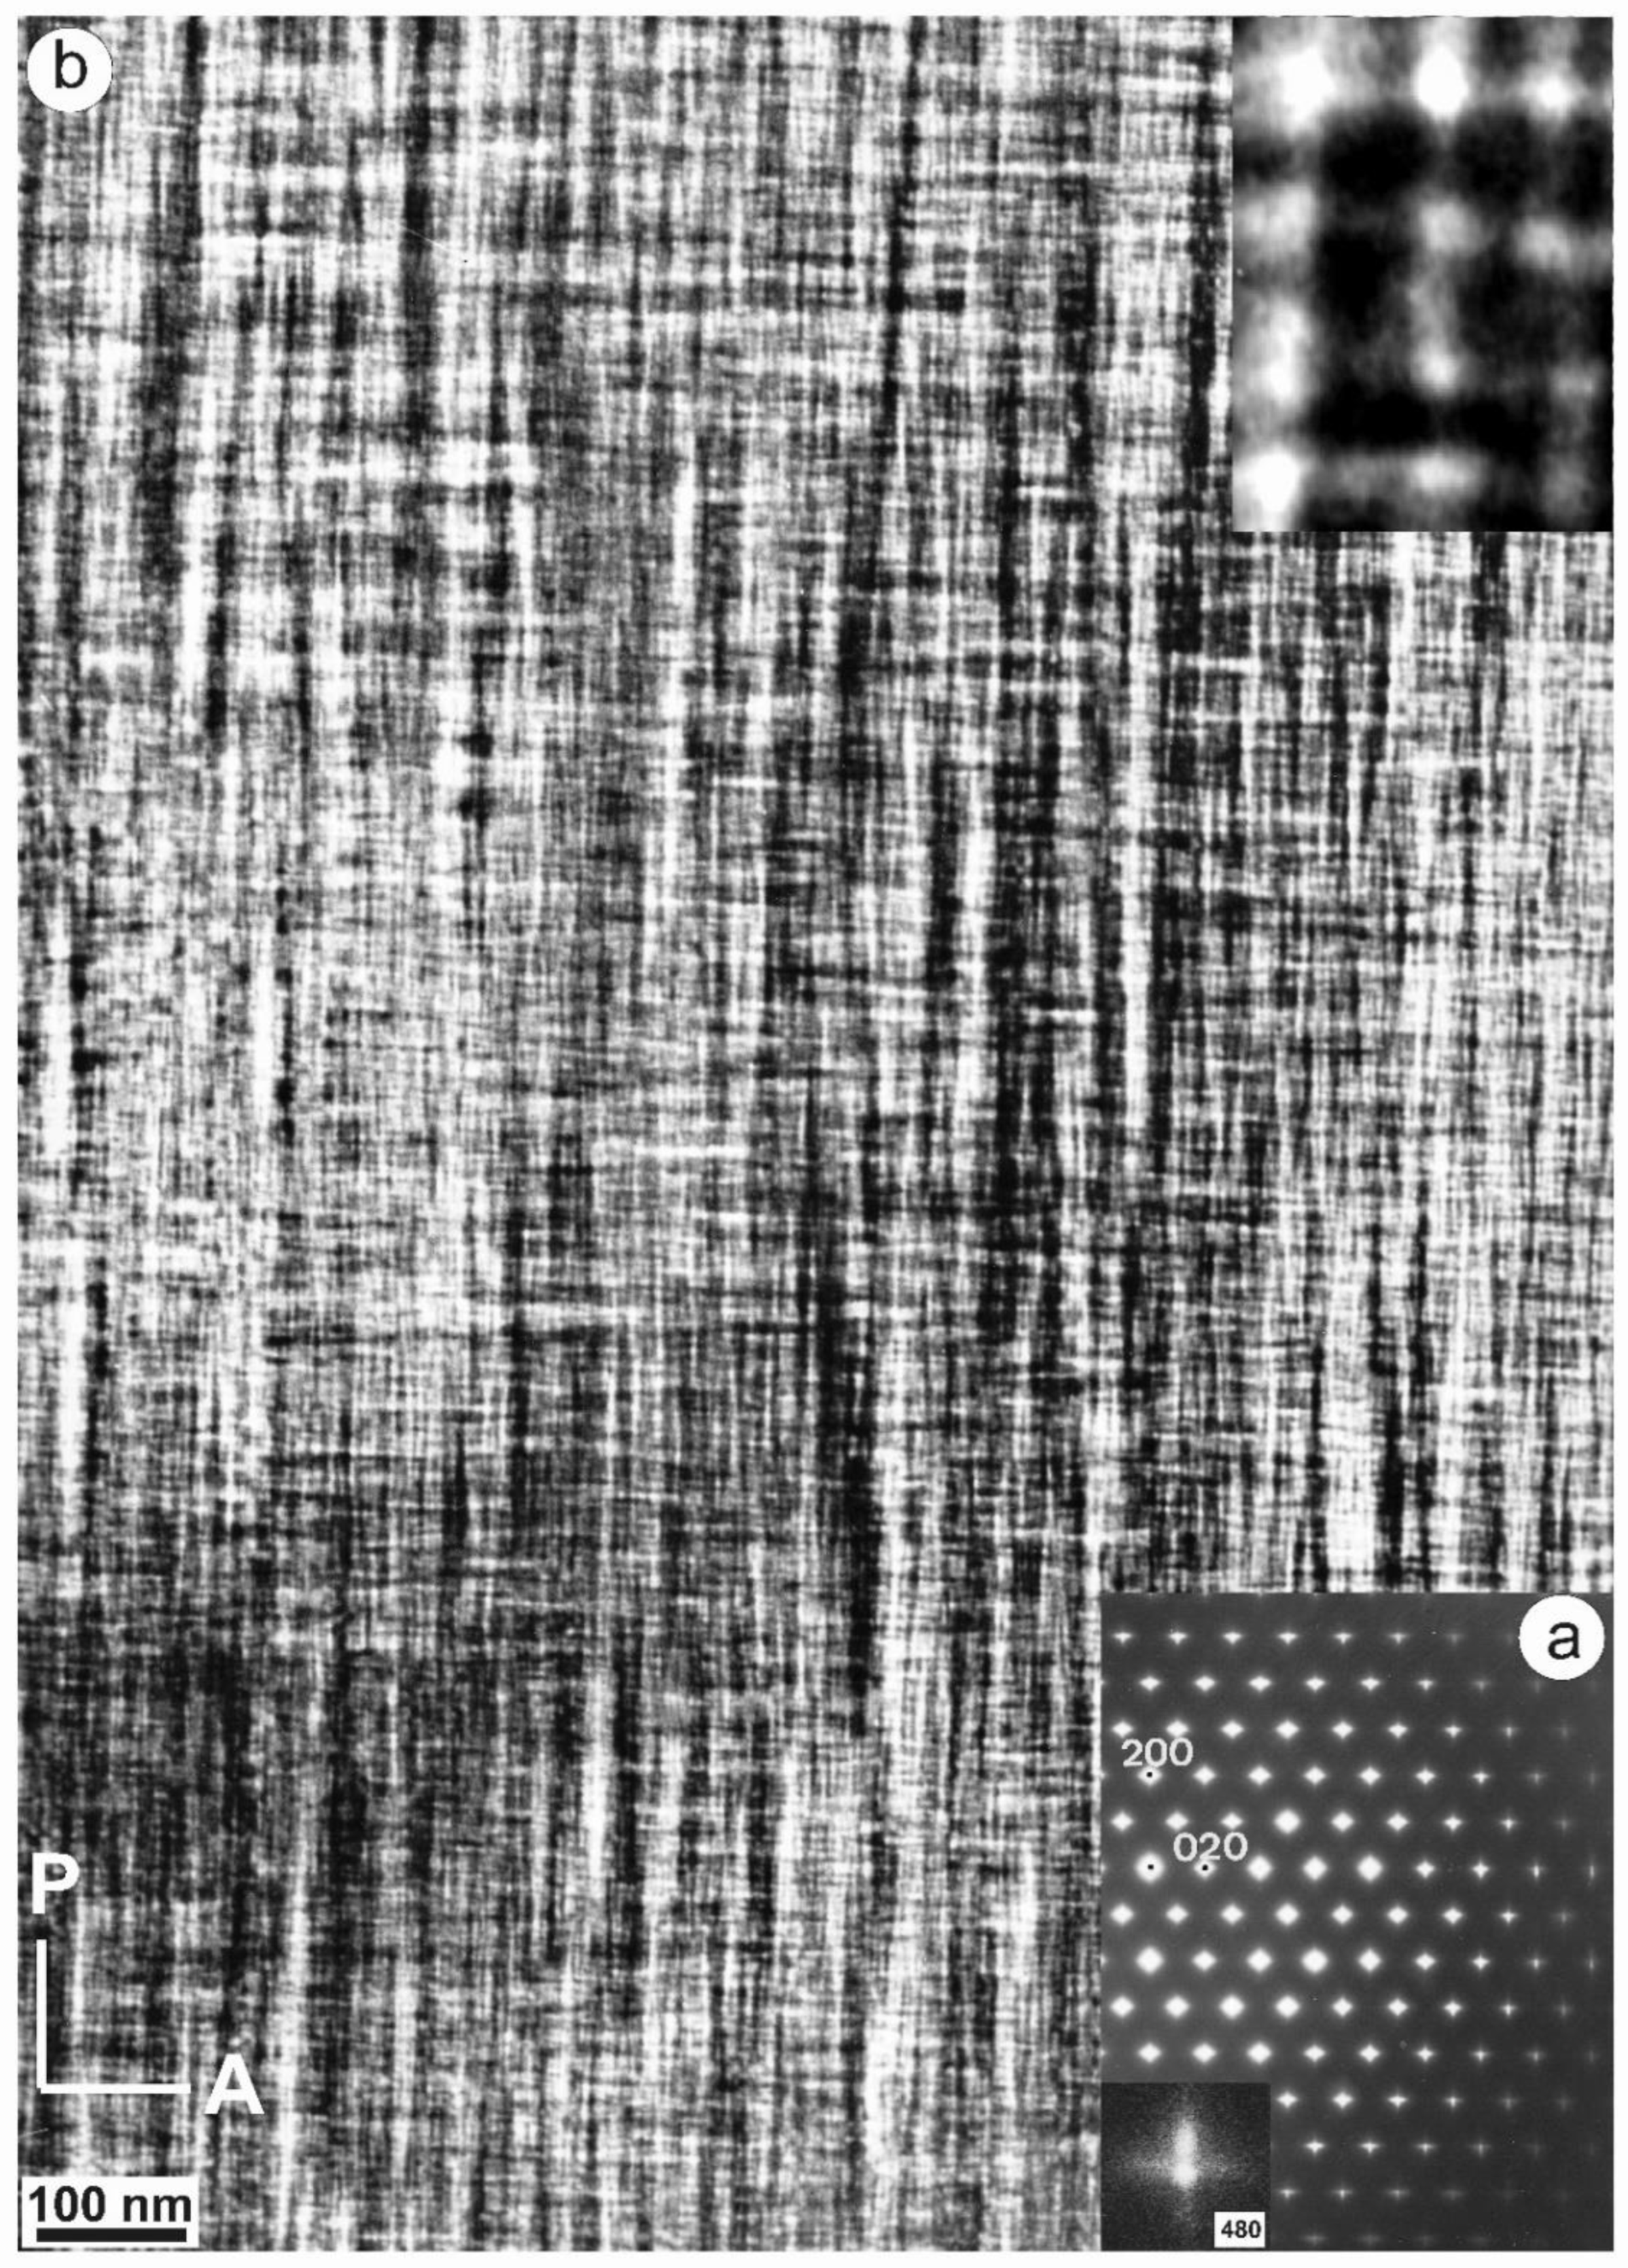
Specimen 5963, with an XRD pattern similar to that of specimen 1123 (Figure 9c), i.e., with detection of some triclinic domains, has an SAED pattern similar to that of specimen ASGS, but with detectable splitting of spots at high (hkl) values, particularly at the Pericline orientation, as shown in Figure 13a for the (480) diffraction maximum [77,79]. It corresponds to a tweed microstructure with a remarkably heterogeneous character, with fine tweed changing gradually to a coarser tweed, and diverse amplitude revealed from a variety of contrasts in a gray scale between bright and dark, as shown in Figure 13b. If the coarse tweed is observed in detail, a regular microstructure with a sharper contrast than conventional tweed can be found, as in the inset of Figure 13b. This pattern can be explained as high-amplitude modulations in the form of orthogonal avalanche-like transformation units along the Albite and Pericline twin-laws, as +A, −A, +P and −P variants and their different crossovers. These units are very similar to those patterns found at the optical scale in K-feldspar from pegmatites (see details in optical micrographs and explanations about the terminology in [79]).
Thus, many specimens with an orthoclase X-ray pattern, in some cases with evidence of partial and incipient recrystallization to microcline, actually have very heterogeneous microstructures at the mesoscale and do not have a single structural state nor symmetry. Several degrees of transformation coexist intimately side by side. Ordered microcline domains form mainly at crossovers produced by the intersection of transformation avalanches with a positive interference, as in the case of +A/+P and −A/−P crossovers, giving rise to the microstructure shown in the inset of Figure 13b. In perthitic orthoclase from pegmatites, large and intense avalanches are triggered from the internal interfaces with other minerals, and they typically spread mainly from albite veins or stress centers at end points of albite domains with diamond shapes [79], giving rise to twins. However, in unexsolved orthoclase (i.e., in most samples of adularia or hydrothermally crystallized euhedral minerals), a similar pattern of tweed microstructure is produced mainly by multiple but weaker avalanches generated by a process of homogeneous nucleation.
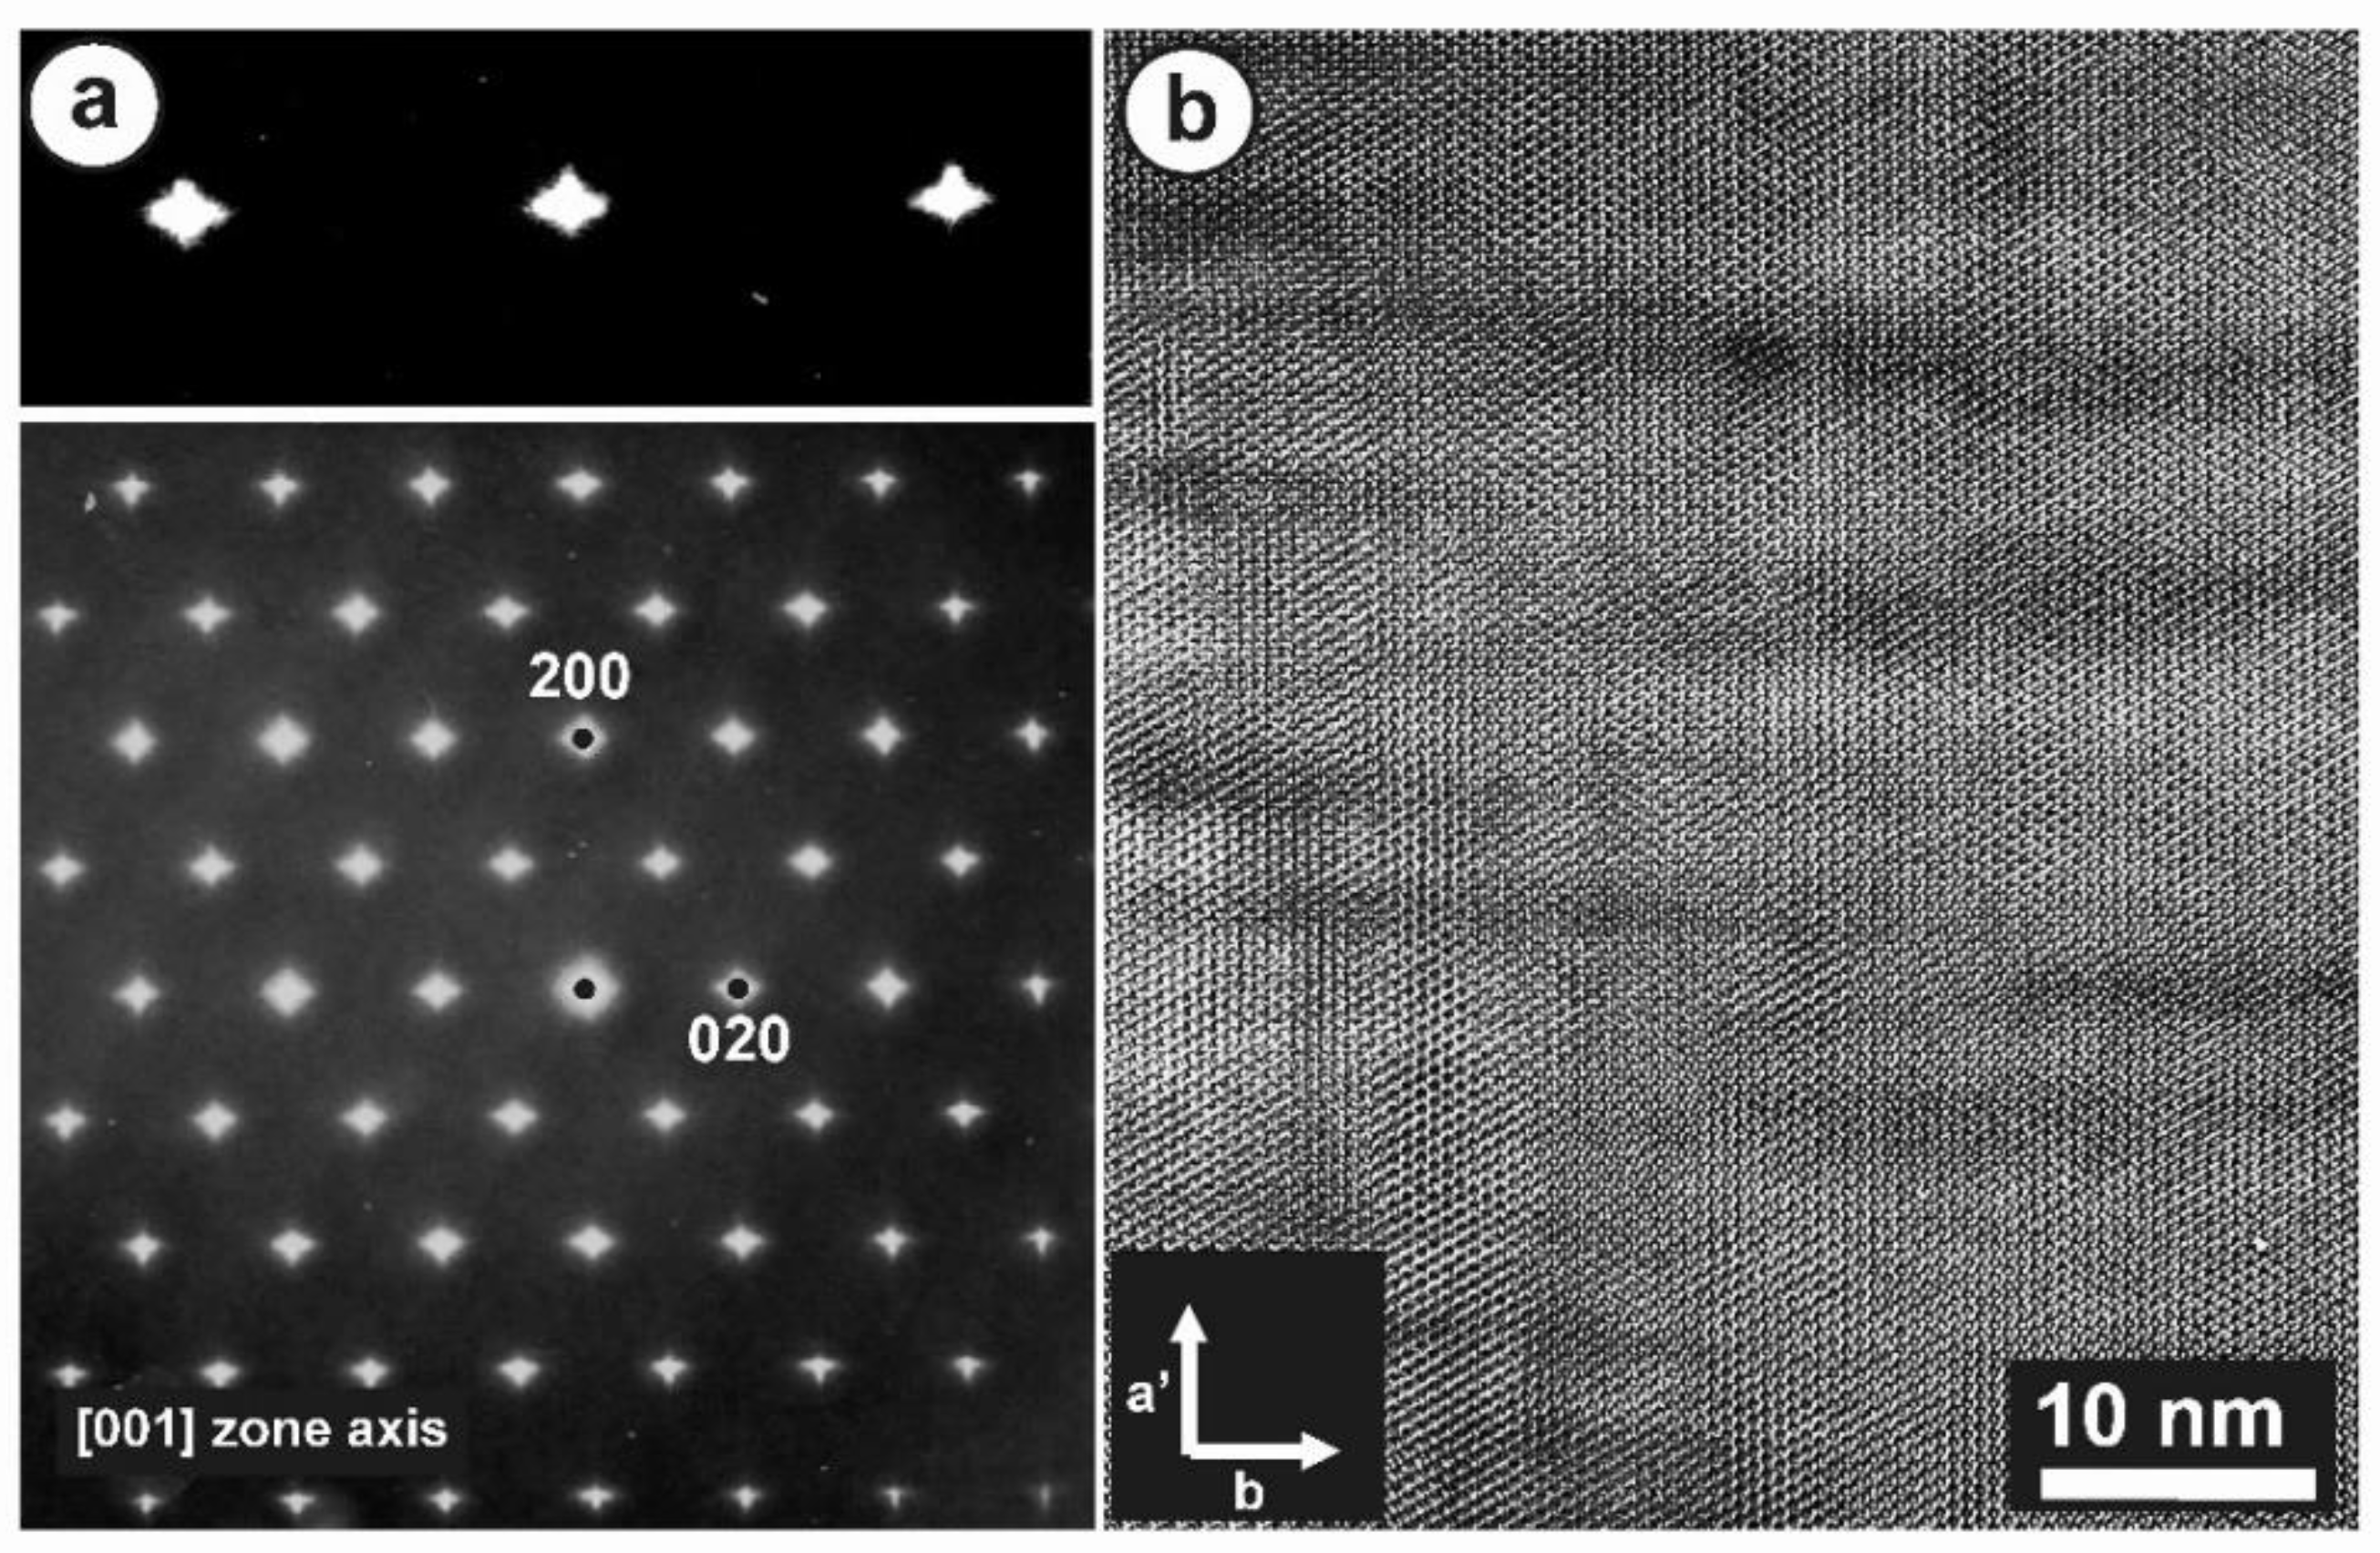
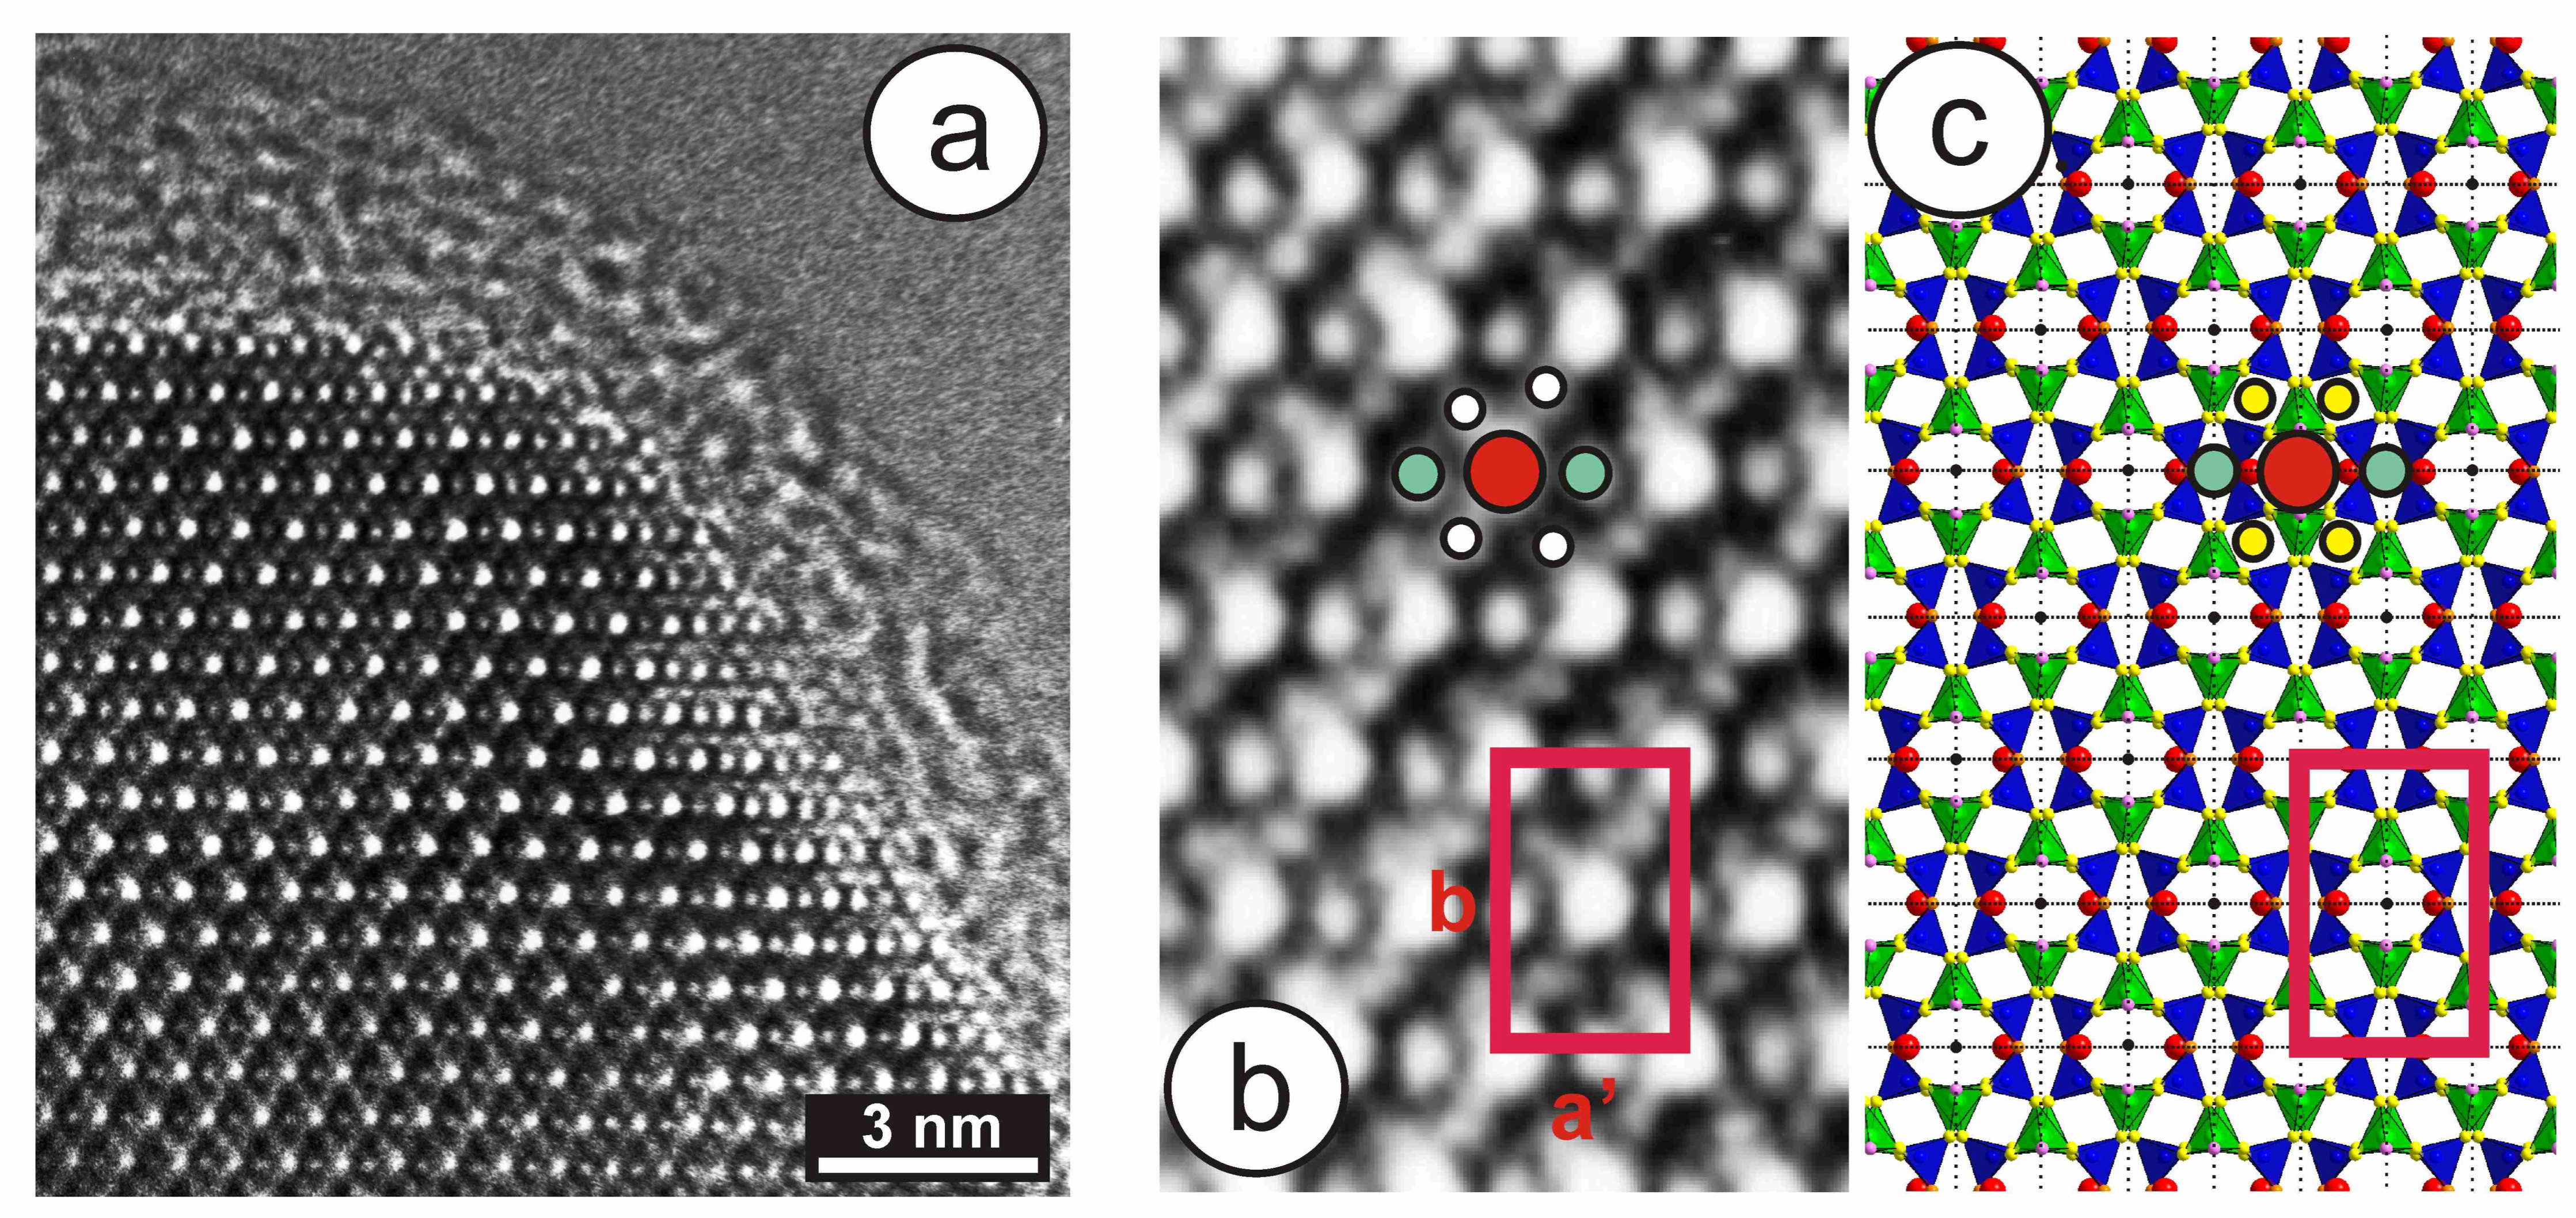
High-resolution TEM images from specimen 1123 have provided additional understanding of the local structure in minerals with the tweed pattern. This specimen has an X-ray pattern mainly consistent with orthoclase (see hkl positions in green in Figure 9c); it is very heterogeneous, however, and shows an incipient transition to microcline, as detected in the (131) region only (blue peaks in Figure 9c). The 27Al STMAS NMR and 27Al MQMAS NMR spectra of this specimen (Figure 11) show a wide distribution in the chemical shift and also in both first- and second-order quadrupolar interactions for Al atoms in a tetrahedral coordination. These spectra are similar to those of sanidine, but different from “valencianite”, and far from the well-defined single site in (low) microcline. Figure 14a shows the border of a euhedral particle along the [001] zone axis with high-resolution TEM; a fine contrast was resolved at high-magnification conditions (Figure 14b). The bright dots can be correlated with structural channels along this direction, because their geometrical configuration is the same as the projected configuration of heavy atoms delimiting those channels in an ideal monoclinic lattice (Figure 14c). Note that the γ* is close to 90° and that the b unit-cell dimension is ~1.3 nm, whereas a′ ≈ 0.85 × sin 116° is roughly 0.77 nm (Figure 14b). However, the symmetrical distribution of channels in the experimental image does not correspond with that in the lattice monoclinic model (Figure 11c).
In the monoclinic lattice, three different types of channels are marked: in red, the pseudohexagonal channel defined by a six-membered T ring, where the “m” mirror plane and the “2” binary axis cross at the center of symmetry; in turquoise, the rhombic channels related by the 2-fold (binary) axis (vertical), and in yellow, the channels formed by the well-known four-membered T rings of the structure, with two T1 sites and two T2 sites, related by the mirror plane (horizontal). However, the yellow channels seem to be absent in the experimental image, and they are shown in white (Figure 14b) as the 2-fold axis seems to be absent. Thus, the γ* angle is perhaps close to 90°, but at the local scale, the mirror plane and binary axis may not be present. Note that in a disordered structure such as sanidine or “valencianite”, an average of one Al atom occurs per each four-membered ring, whereas if an order similar to microcline exists in the structure, rings with two Al atoms alternate, with the rings having 0 Al atoms [47]. Thus, similar rings will give rise to a similar contrast in images generated in electron microscopy, which is clearly not the case for the four-membered rings in Figure 14b.
All of these data suggest that the conventional description of orthoclase, as a crystal in terms of an idealized regular and periodic lattice or a perturbed lattice with a C2/m monoclinic (average or overall) symmetry, is really far from the experimental SAED patterns and TEM images. Here, we suggest that orthoclase is actually a mineral with a highly dynamic crystalline medium, whose behavior gives rise to very heterogeneous microstructures at the mesoscale; it has pseudoperiodicity only at the local scale.
The first NMR experiments at low magnetic fields [80], and later at medium magnetic fields [77], showed that orthoclase with a tweed microstructure is consistent with an average local geometry similar to that of microcline. Additional 29Si NMR spectra at 9.4 T and 27Al NMR spectra at 19.6 T have shown that the disordered Si,Al distribution over four T sites in orthoclase indicates that the structure is not strictly periodic, but a pseudotriclinic structure only at the long-range scale [4]. In addition, Loewenstein’s rule is respected, and local compensation of charges occurs by polyatomic arrangements involving Al and K atoms in well-defined configurations at the medium-range scale [4]. However, a model that only considers Loewenstein’s rule to explain the order–disorder of the Si,Al+K distribution is not sufficient to reproduce the experimental 29Si and 27Al NMR spectra.
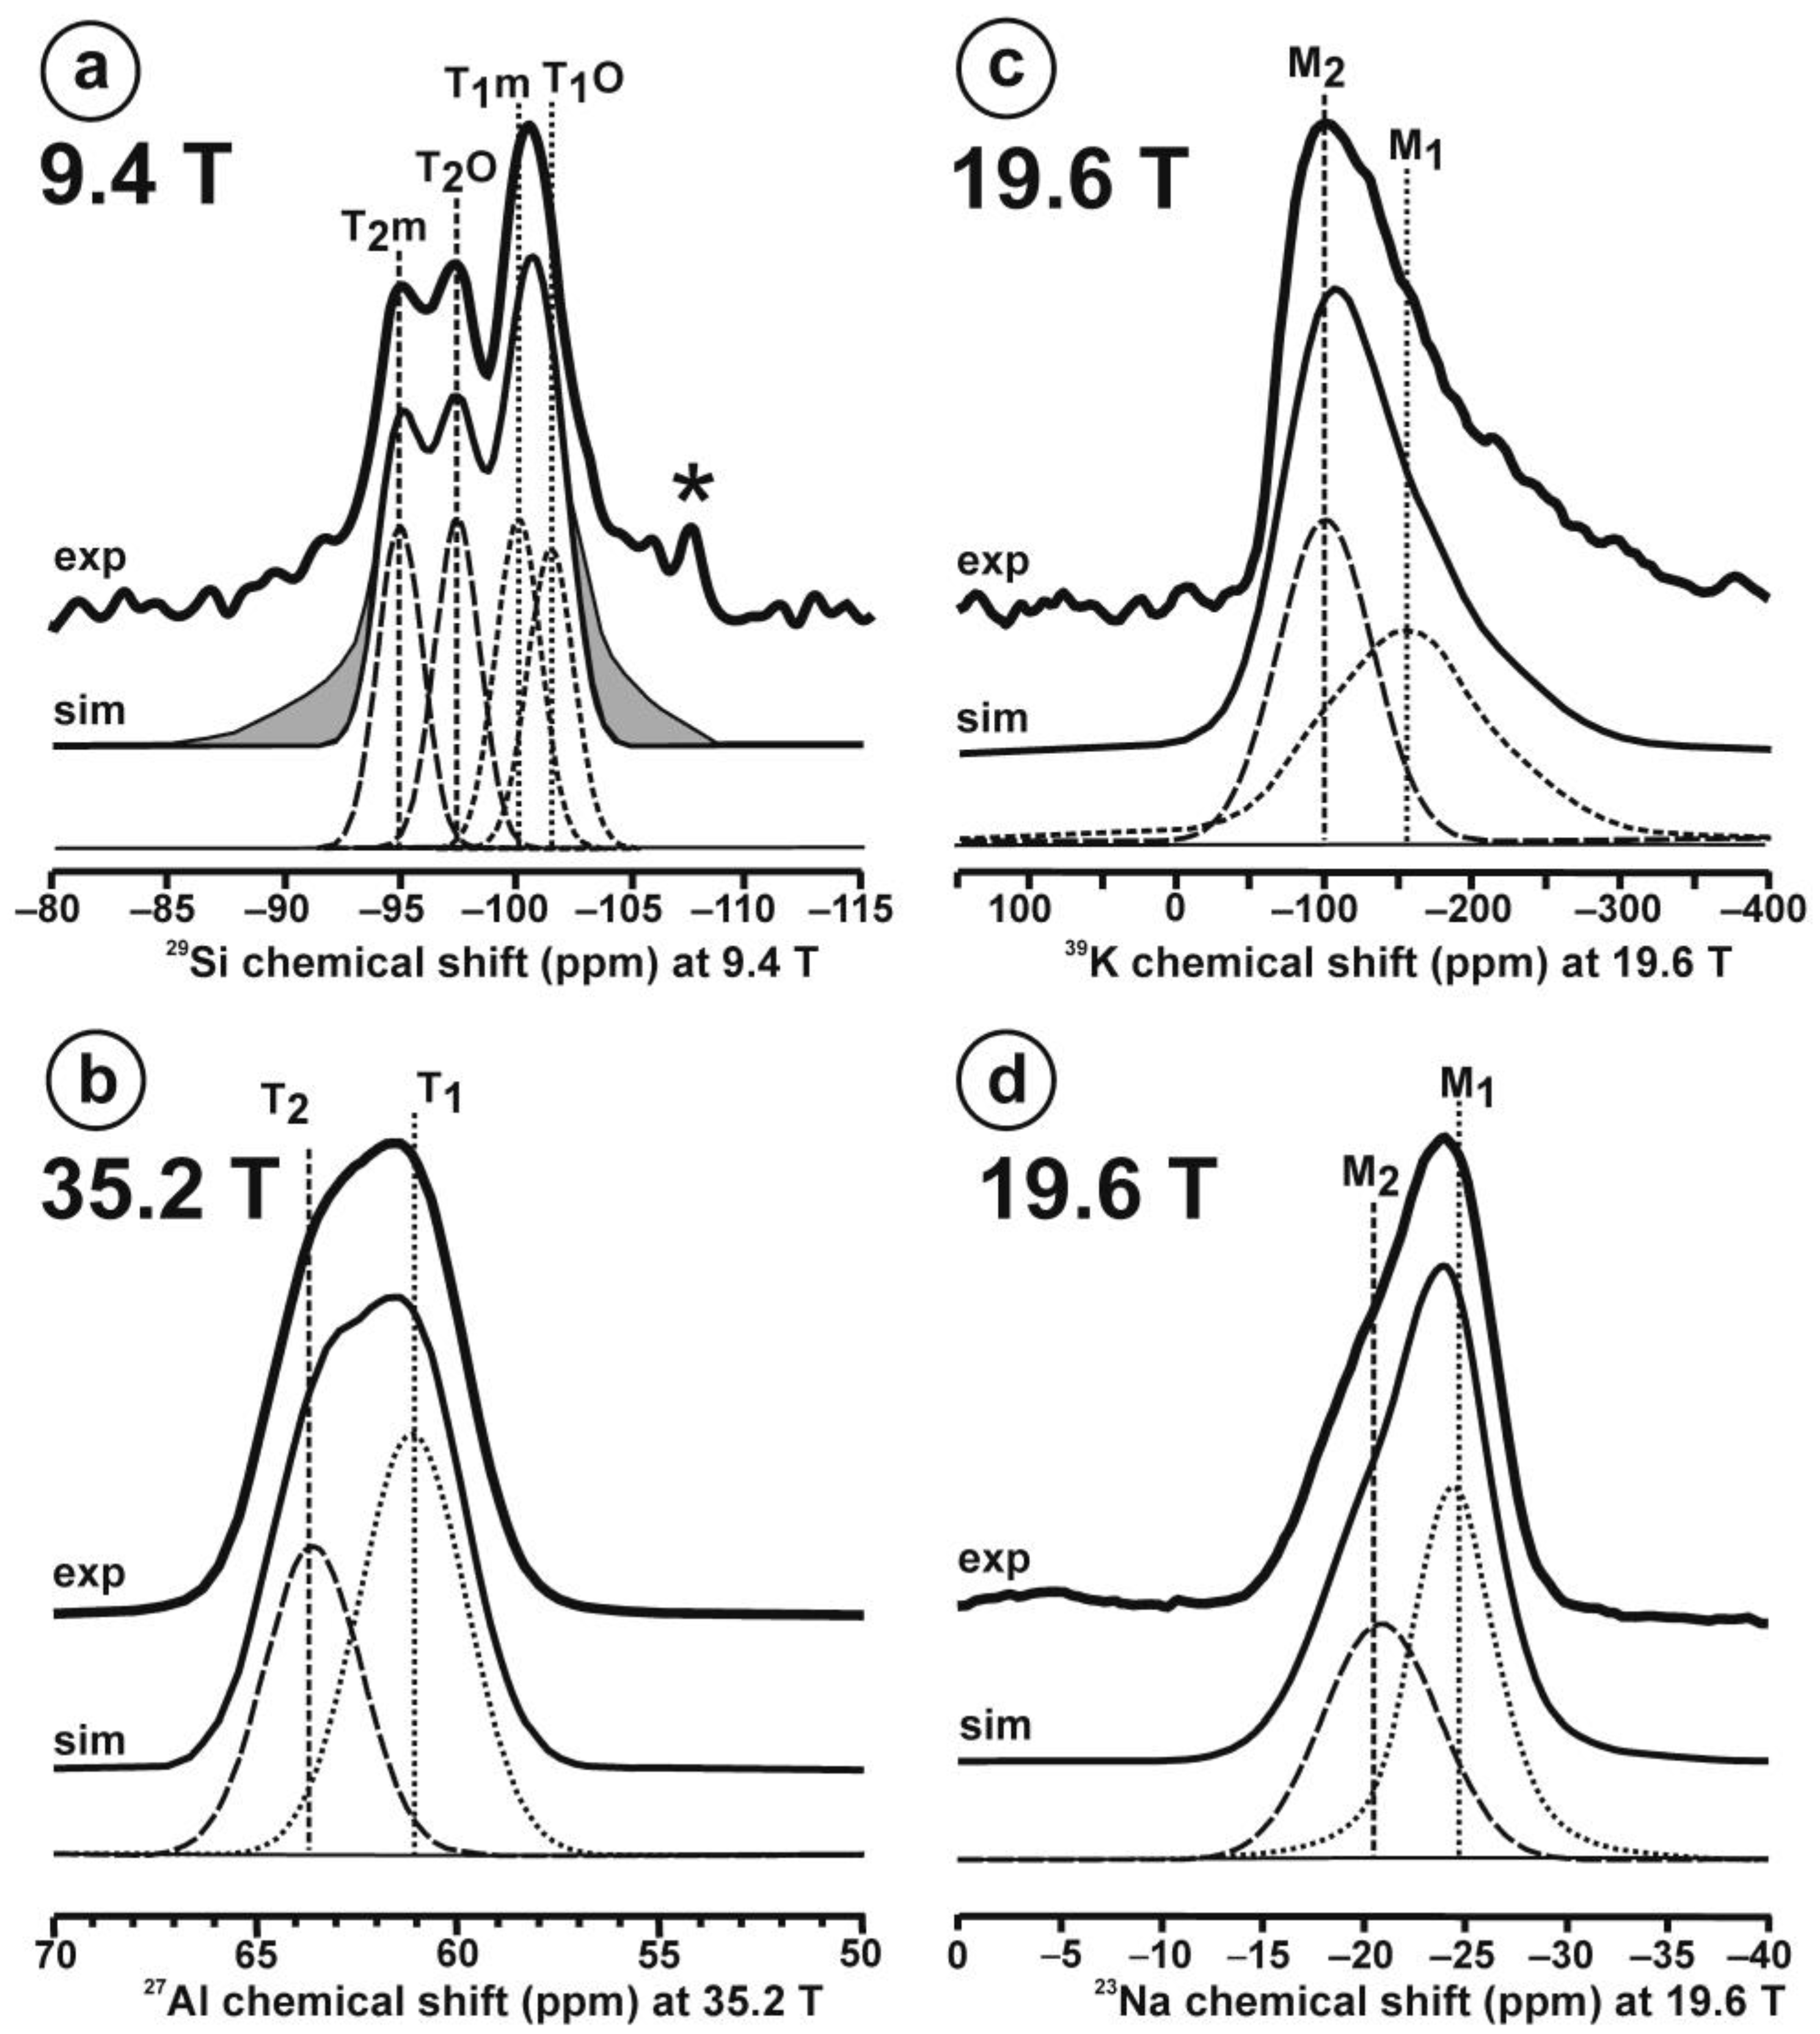
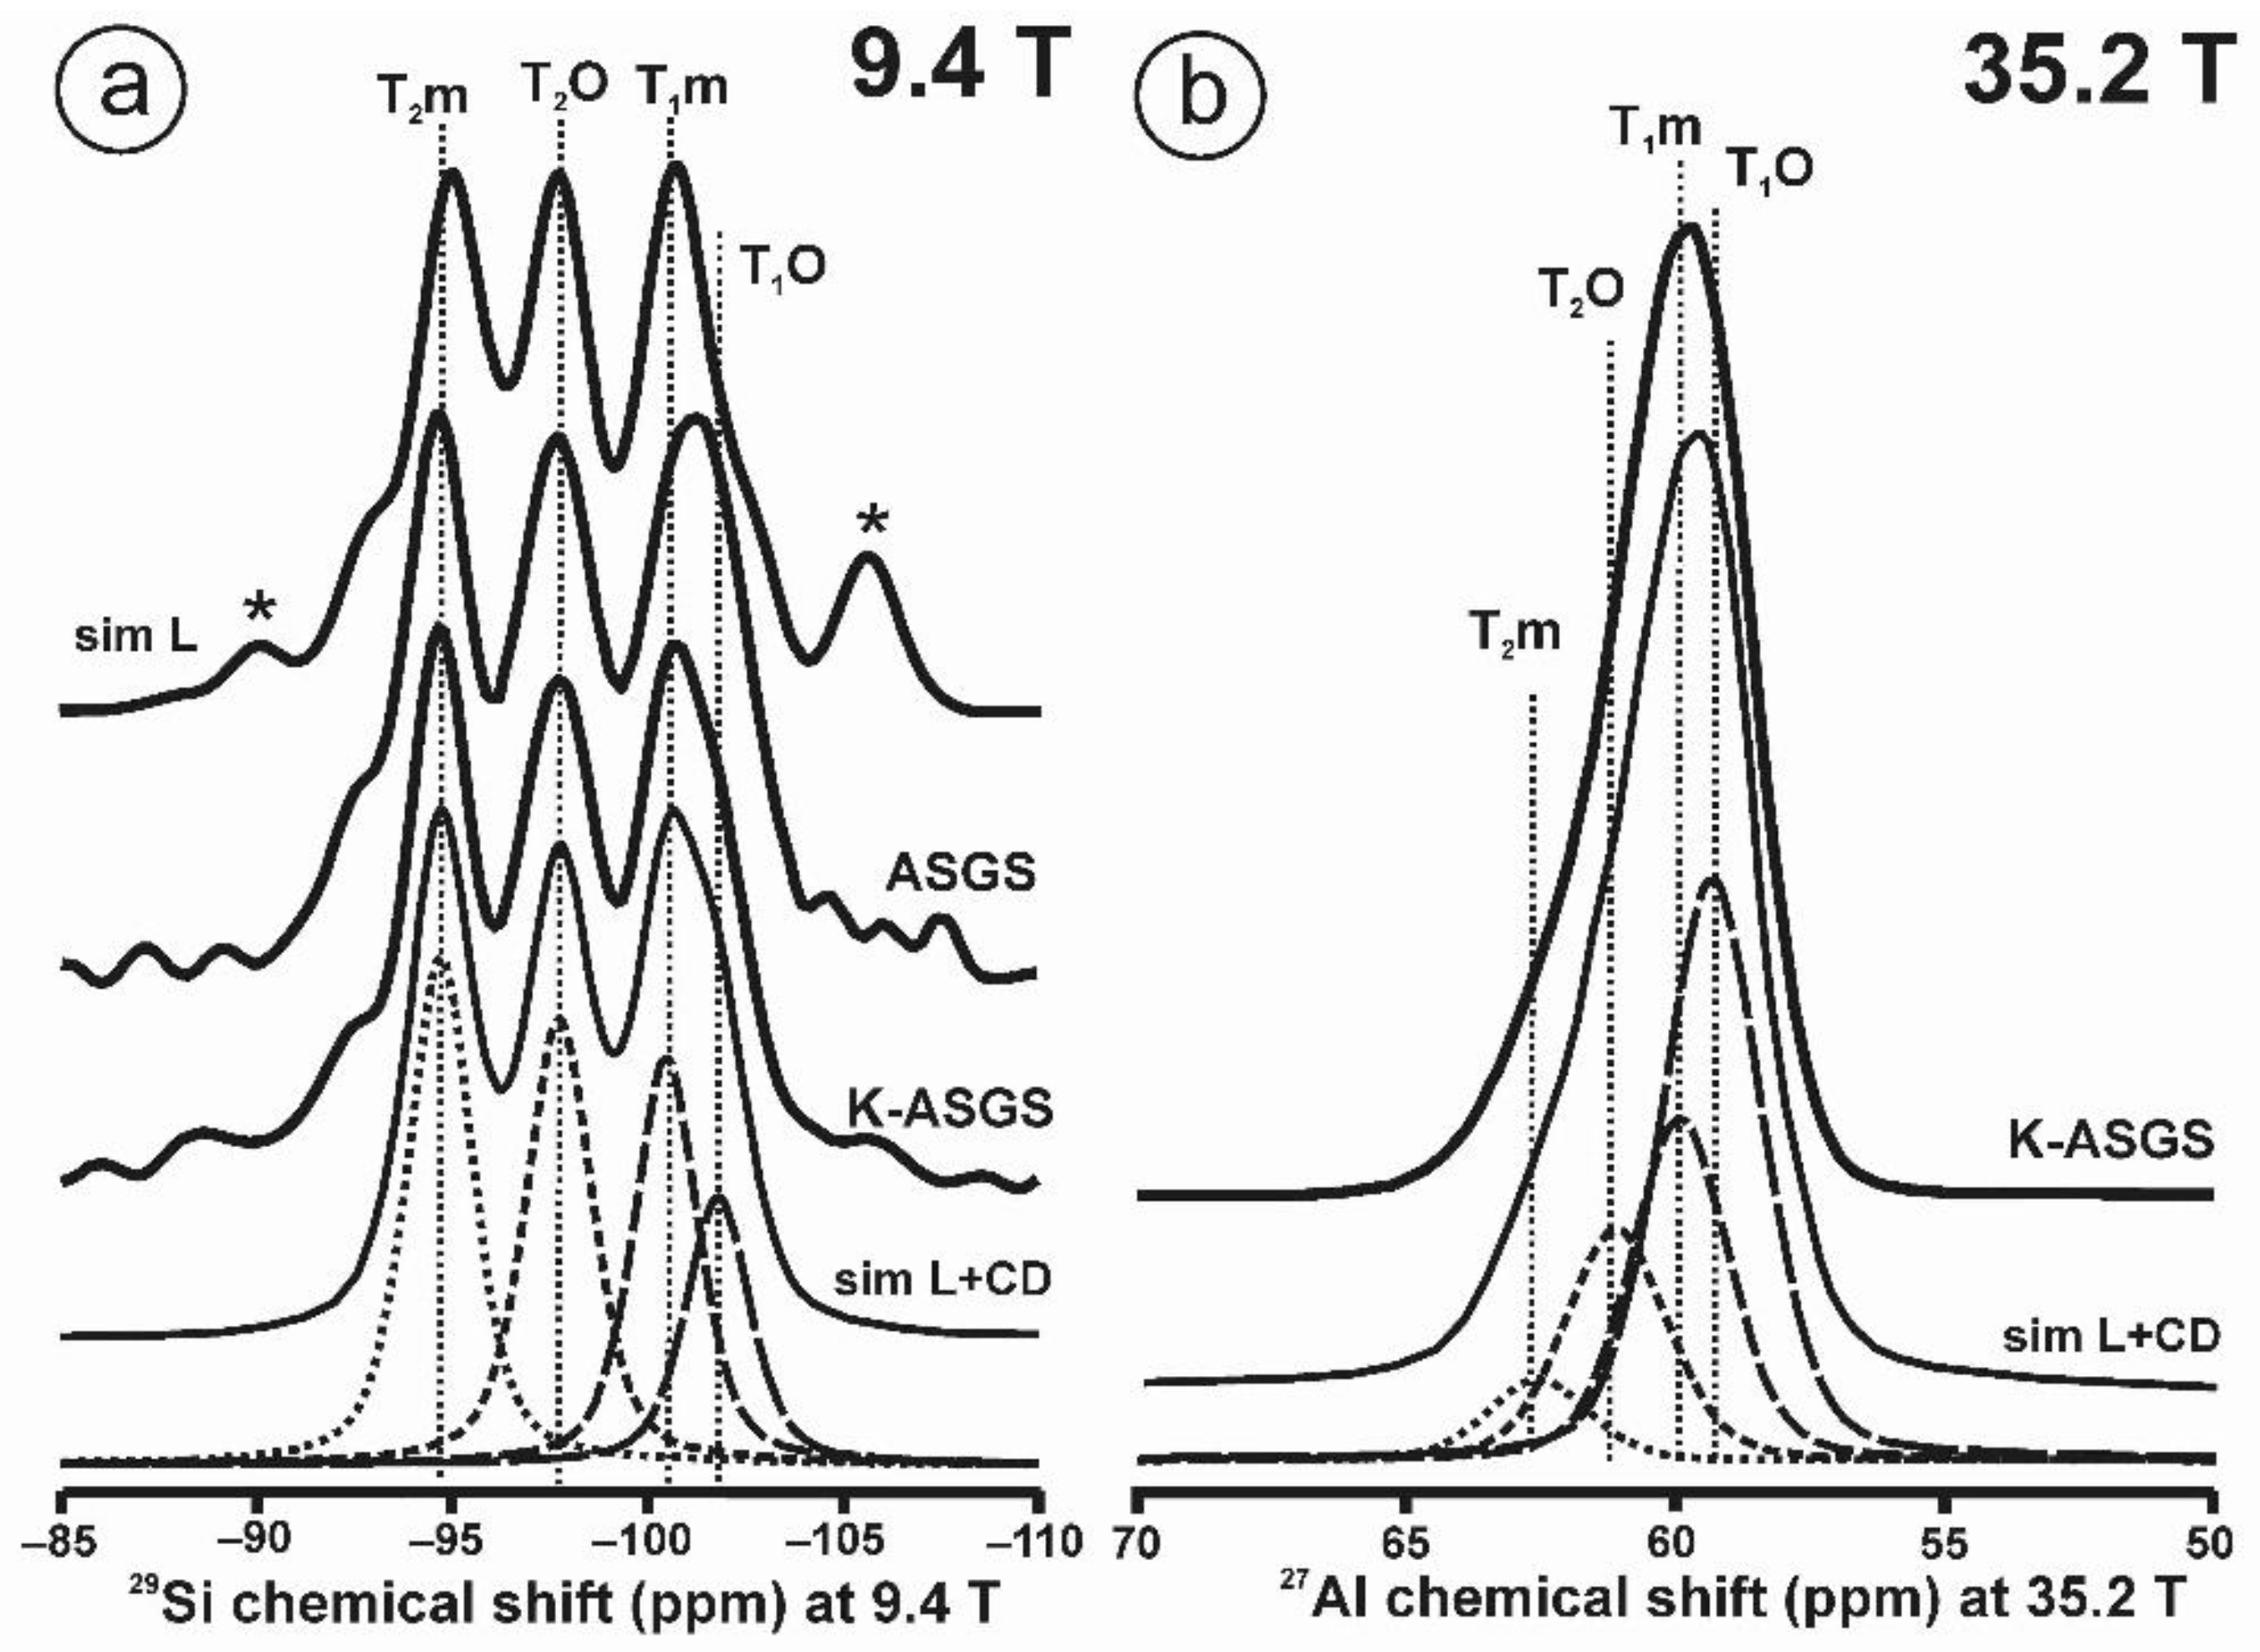
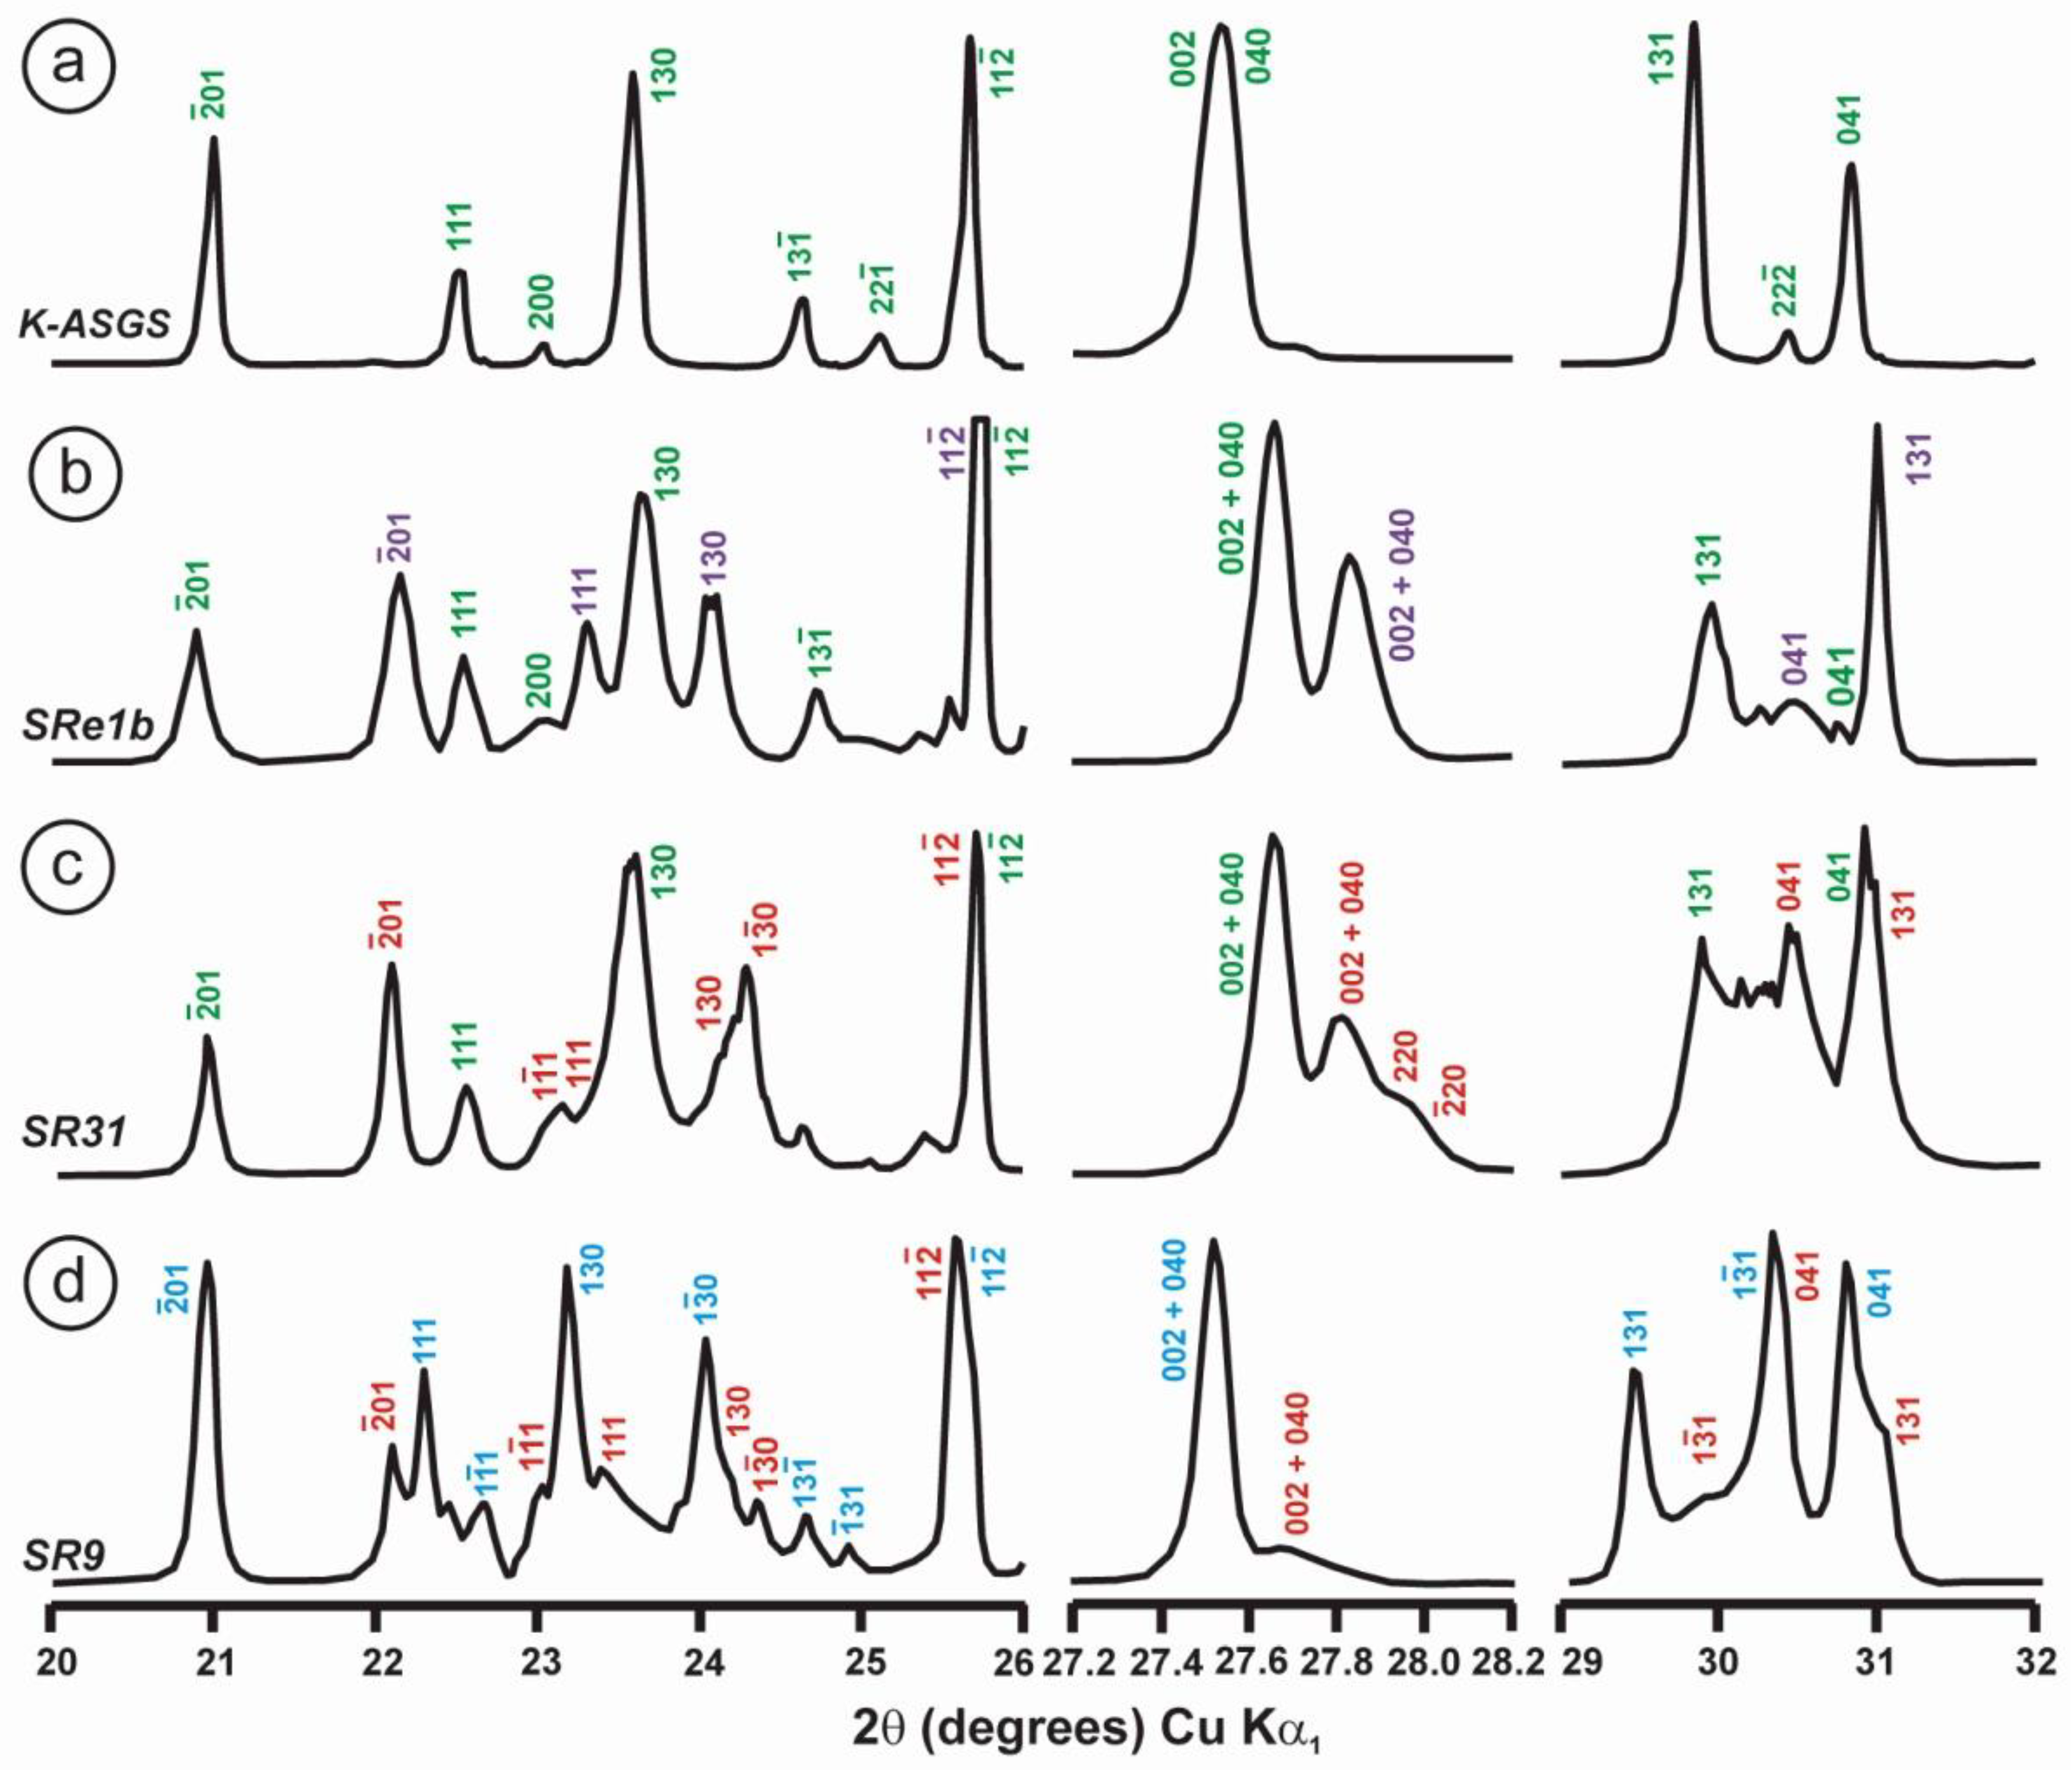
Here, we study the order–disorder state of orthoclase specimen ASGS by interpreting experimental 29Si spectra at 9.4 T and 27Al spectra at 35.2 T (Figure 15). This specimen, from the collection of the Museo Nacional de Ciencias Naturales (MNCN, CSIC), is from Saint Gotthard (Switzerland) and of historical importance. It consists of an aggregate of several large euhedral crystals up to ~5 cm across with sharp, planar faces, labeled as adularia with the Felsöbanya habit. Our specimen of Or90.6Ab9.4 composition (EMPA) has an average monoclinic symmetry and C2/m space group from powder XDR patterns, with cell dimensions similar to those of other orthoclase specimens: a = 8.562(1), b = 12.984(1), c = 7.208 (1) Å, α = γ = 90°, β = 116.01(1)° (Rietveld refinement). We have produced an orthoclase specimen with pure Or100 composition by ion-exchange experiments with molten KBr at 825 °C for 30 h to produce specimen K-ASGS with a = 8.567(1), b = 12.974(1), c = 7.212(1) Å, α = γ = 90°, β = 116.02(1)° (Rietveld refinement). No remarkable structural changes are observed in the specimen by XRD after the chemical treatment.
The 29Si NMR spectra of specimens ASGS and K-ASGS are almost identical; they can be interpreted as a Si,Al distribution in which Loewenstein’s rule is obeyed, as is also the case in specimen 1123 [4]. However, if that is so, the simulation of the 29Si spectra cannot fully explain the experimental spectrum (Figure 15a). The best simulation of the experimental profile using only this criterion is produced if the Al occupancies in the four T sites are t1O = 0.70, t1m = 0.05, t2O = 0.05 and t2m = 0.20. However, this simulation produces some resonances at ca. –90 ppm from Si atoms in T2m (1Si,3Al) and at ca. –106 ppm (* in sim L of Figure 15a) that do not appear in the experiments. In addition, the high Al occupancies in the T2m sites implies that some four-membered rings must have two Al atoms, which is not correlated with short T-O distances in the structural models of fully ordered microcline from XRD. Thus, a new model is presented here in which three criteria are used. First, as the chemical shifts of orthoclase and microcline are so close, the local structure of orthoclase can be similar to that of microcline with some disordered Si atoms at the T1O site, and thus some Al atoms at the other three sites. In this way, the 29Si spectrum of orthoclase should be derived with a minimum deviation from that of microcline. Second, Loewenstein’s rule must be perfectly obeyed, as with the other K-feldspars. And third, a perfectly homogeneous dispersion of charges on the Al atoms in the structure will preferentially allow the formation of only four chemical environments for Si atoms: T1O (3Si,1Al), T1m (3Si,1Al), T2O (3Si,1Al) and T2m (2Si,2Al), as we must distribute three Si atoms per unit formula into four T sites of the C triclinic structure. At least one (2Si,2Al) environment must be formed. With these criteria, a simulation has been carried out with only four components (sim L + CD in Figure 15a). As the Al occupancies tx in the 29Si spectrum can be calculated from the peak intensities Ix in %, as tx = 1 – 3(Ix/100), a plausible mathematical simulation emerges for values such as t1O = 0.50, t1m = 0.25, t20 = 0.17 and t2m = 0.08, with resonances at chemical shift of T1O = −101.9 ppm, T1m = −100.5 ppm, T2O = −97.7 ppm, and T2m = −94.7 ppm, in all cases with 2.0 ppm line width, i.e., double the line width necessary to simulate the 29Si spectrum of fully ordered microcline.
To test this simulation, the 27Al NMR spectrum of orthoclase, in the same specimen K-ASGS, has been obtained at 35.2 T. At this external field, the quadrupolar broadening has been almost totally cancelled, and the line widths of the observed resonances are mainly due to distributions of the chemical shifts. Thus, three restrictions are imposed for the mathematical simulation of this NMR spectrum, including an analogous separation between the four components of Al (4Si,0Al), a line width close to double than that observed in fully ordered microcline, and finally four signals with areas showing Al site occupancies similar to that in the 29Si spectrum. With these restrictions, the 27Al spectrum at 35.2 T has been simulated with four curves giving tx values as: t1O = 0.46, t1m = 0.28, t2O = 0.19 and t2m = 0.08; chemical shifts at T1O = 59.4 ppm, T1m = 60.0 ppm, T2O = 61.2 ppm and T2m = 62.7 ppm, in all cases lw = 2.3 ppm (Figure 15b). This simulation suggests that the initial hypothesis is probable, i.e., local restriction from Loewenstein’s rule and homogeneous charge dispersion. Moreover, it indicates that the local structure in orthoclase is more similar to that of microcline than to that of sanidine. It is only pseudotriclinic or non-strictly periodic, with site distributions instead of spectroscopically distinct sites with well-defined and constant values of the NMR parameters.
This model implies that Mallard’s hypothesis to explain the structure of orthoclase is correct in essence, and the monoclinic symmetry recorded by RSTs is an “apparent symmetry” due to a lack of resolution [66]. However, orthoclase is not composed only of “X-ray low microcline” domains. Some domains formed by crossovers with a positive interference can produce a similar degree of local order but probably a slightly different local geometry. This suggestion is supported by the fact that the resonance at ~58.6 ppm from Al atoms at the T1O site in fully ordered microcline at 35.2 T could correspond to the component at ~59.4 ppm from Al atoms in T1O site of orthoclase at 35.2 T (see the deconvolution of Figure 15b). Note that a difference of about 0.8 ppm is very close to the estimated uncertainty in the experimental chemical shift of the 27Al spectra; at this external field, it is about 1 ppm. However, these values are far from the c.g. of the signal observed in the 27Al spectrum of sanidine at 61.6 ppm at 35.2 T (Figure 1c) and also from that in “valencianite” at 62.1 ppm at the same external magnetic field (Figure 10b). As suggested by Bambauer et al., that K-feldspar should be labeled “X-ray orthoclase” in comparison to the other “X-ray varieties”, because it has a microstructure that is below the limits of resolution of both light optical and X-ray methods [66]. Thus, the external monoclinic symmetry or the one resolved by RSTs is simply an artifact due to the lack of resolving power. An “ideal” long-range periodicity is imposed in such extremely heterogeneous minerals (see Figure 13) as if they were “crystals” as a mathematical object. Moreover, such imposition could be hiding some more important structural aspects and behaviors of the solid state, where this crystalline medium is far from equilibrium. It will tend toward equilibrium on cooling, at which point a structure must appear in which the triclinic character is perfectly developed [4]. This structural character is investigated at the end of this article.
The second type of heterogeneous structure with modularity at the mesoscale is here called periodically modulated composite structures. These are formed by fully coherent intergrowths of two or more phases with a marked contrast in their chemical composition, produced during primary growth or by later unmixing at the subsolidus stage. They have different degrees of mismatch between the coexisting modules, as occurs in polytypism and polytypic series, polysomes and polysomatic series [81,82,83].
Modularity, ubiquitous in plagioclase, is an unresolved problem, particularly in labradorite NaCaAl3Si5O16, which is the example selected in this work to represent its main NMR characteristics. The term labradorite has been traditionally used to designate a mineral of the plagioclase group with composition from Ab50An50 to Ab30An70. It is retained for historical reasons. Single-crystal XRD patterns and ED patterns of labradorite describe a feldspar with an incommensurately modulated structure, showing two types of modularity that generally coexist. One, with a periodicity from about 50–100 Å, gives rise to e-satellites [84,85] caused by fine-scale coherence between the two modules with a different Ca:Na ratio [86]. The other has a variable periodicity of lamellar domains owing to unmixing in the range of the wavelengths of the visible spectrum (i.e., λ > 400 nm), and thus the cause of the Schiller effect from violet to red colors in some specimens [87], or at shorter wavelength, about 100–150 nm [86]. As a result, where the periodicity is well defined, regular intergrowths in labradorite give rise to supersatellites or s-satellites in single-crystal XRD patterns [83,84]. Conventional single-crystal XRD and neutron refinements of these heterogeneous crystals have produced an ideal average structure with a single lattice obeying a C space group by using only Bragg peaks and ignoring the e-satellite reflections [88,89]. Owing to the scale of the intergrowth of two phases, they cannot be resolved in the diffraction patterns. Moreover, the refined average structure is considered to be unaffected by the presence of such a weak superstructure [90]. The average structure has a subtle increase in the γ angle from ~89.7° for An50 to ~90° for An60 [91].
We have studied several specimens of labradorite in this chemical range, with and without Schiller effect, to evaluate any structural change (Table 6). The powder XRD patterns of these specimens of labradorite were compared with the theoretical powder patterns derived from average structures from single-crystal determinations by using the ICSD (Inorganic Crystal Structure Database) database. All specimens are compatible with a C space-group average symmetry, and in particular with file CC = 193,736 from [86], which was used as the initial standard for the Rietveld refinement of cell parameters. This average structure suggests a lattice model with four tetrahedral sites occupied by both Si and Al atoms, and thus in a disordered Si,Al distribution.
The XRD, ED and transmission electron microscopy images of e-plagioclase samples have been interpreted in several ways: modularity between albite-like and anorthite-like domains [92], periodic I1-like domains connected by inversion-twin boundaries [93], a superstructure from periodic antiphase boundaries [94], e2-plagioclase as an incommensurate structure with anorthite content between An25 and An50 in a disordered structure with Al avoidance and e1-plagioclase as an incommensurate structure with anorthite content > An50 with Na–Ca order below 800 °C [95]. However, because of the common coexistence of the two modulations in labradorite with e- and s-satellites, the first with size domains below the limit of resolution of the XRD and the second with domains close to that limit, each s-lamella has its own e-modulation, and it is not possible to resolve the Ca–Na modulation in an unambiguous way [86].
Surprisingly, after all of these considerations, the 29Si spectra of very different samples (Figure 16) are very similar in all cases, and also similar to the spectra available in the literature between An54 and An60 [96]. This similarity suggests a comparable composite structure at the local scale at least between An50 and An60, where slight variations in the lattice parameters can be explained by different contributions of two different lamellae, here called p1 and p2 domains. No simple and single simulation can be carried out in these spectra as multiple solutions can be found without any guarantee of truth. This strong similarity by NMR among specimens contrasts with the differences that have been found by electron diffraction in samples with different cooling rates [97].
Specimen IN1 was selected for additional NMR scans as it is a colorless and transparent mineral of chemical composition Or1Ab49An50 (EMPA), showing a weak Schiller effect with blue iridescence, wide Albite and Pericline twins and its crossovers, and no additional minerals as impurities at the optic scale. This specimen has been analyzed in an 27Al{29Si} HMQC NMR experiment at 17.6 T (750 MHz) as shown in Figure 17. In the 27Al spectrum at 11.7 T, labradorite produces only a single broad resonance centered at ~60 ppm [98]; at 17.6 T, however, a doublet is resolved reflecting the modularity of the structure at ~48 ppm for p1-plagioclase ~An60 and at ~53 ppm for p2-plagioclase ~An40, a compositional range for the domains that has already been suggested in the literature [99,100,101]. The 29Si spectra of p1- and p2-plagioclases have been simulated with six components, whereas the total spectrum can be reproduced by the sum of about 50% of each component (Table 7). It is difficult to interpret these simulations using lattice models with strict periodicity and well-defined space-group symmetries in each module of plagioclase. Our data thus suggest that labradorite specimens from An50 to An60 (Figure 17) are the result of an intergrowth of two pseudoperiodic structures formed by limited Na–Ca exsolution and with contrasting atomic structures.
The deconvolutions presented are mathematical solutions to show how complex and robust the local structure of labradorite seems to be on the basis NMR data, in comparison with the other average models. Additional NMR experiments are necessary to resolve the medium-range polyatomic organizations in these modules, as the 29Si spectra do not have a simple interpretation in term of crystallographically distinct sites; we need to define the relationship of p-domains derived from NMR to e-modulations and s-domains.
The third type of heterogeneous structure occurs where the lamellar size from ~5 nm to ~100 nm does not produce strict periodicity between lamellae at the mesoscale, but only a measurable average pseudoperiodicity. As a result, no satellite diffraction maxima are recorded by RSTs, as occur in e-plagioclase. These aperiodically modulated composite structures are formed by the intergrowth of two structures with a different chemical composition but a related structure. In fine intergrowths, fully coherent structures can be generated, as in alkali feldspar cryptoperthite, formed by an exsolution process [102,103]. In this case, structural strain appears from coherency between the two phases with different chemical composition but a shared structure. As the exsolution process progresses, the size of the lamellae of the two components increases and the interfaces become semicoherent to incoherent, particularly where there is interaction with aqueous fluids. The structural strain also decreases or disappears where the interfaces are fully non-coherent, in vein perthites. The structural strain has been represented as lattice strain and has been described by anomalous lattice parameters measured in XRD patterns, particularly in the a-dimension of the unit cell, in comparison with other normal (i.e., unstrained) alkali feldspar intergrowths with non-coherent boundaries [104,105,106,107]. Strain is also manifested by diffuse streaks in electron-diffraction patterns [79,102]. Intermediate alkali feldspars can also form, as in labradorite, a weak second modulation that produces a visible effect at the optical scale with a ~400 nm wavelength, giving rise to a blue-white Schiller effect. The term “moonstone” is used for the gemstones with such an optical effect. This second modulation does not normally form a lamellar microtexture with sufficient chemical contrast to be resolved by back-scattered electron diffraction. However, scanning Rayleigh scattering microscopy was able to resolve island, labyrinth and stripe patterns, with such periodicity as to produce reflection of blue light, from an unmixing process of spinodal decomposition that produces such large chemical waves but with a low amplitude [108].
Three specimens of moonstone from Meetiyagoda (Sri Lanka) were used in this work (Table 8), with exsolved domains at very different scales. Specimen SRe1b is a fully transparent crystalline sample with sharp blue iridescence. Specimen SR31 is a non-iridescent opaque sample with a perthitic texture in which the large lamellae are visible at the optical scale. Specimen SR9 is a translucent sample with white iridescence. The approximate bulk chemical composition derived from EMPA (JEOL-8900M equipment) using a beam of about 5 μm3 at 15 kV and 25 nA to avoid sodium losses, gave: Or50Ab50 for specimen SRe1b, Or39Ab59 for specimen SR31, and Or70Ab30 for specimen SR9. These specimens originate in pegmatites hosted in metamorphic rocks at the granulite facies of metamorphism [109], i.e., in a relatively dry environment without evidence of a wet coarsening process at the subsolidus stage. The ordering reaction occurred without the active participation of aqueous fluids. Hence, the structural coherency (or pseudocoherency) between the two lamellar phases produced by exsolution is mostly preserved.
Specimen SRe1b does not show evidence of exsolution if examined by conventional scanning electron microscopy (SEM) techniques. However, high-resolution field-emission electron microscopy images, using a back-scattered electron (BSE) detector in a field emission SEM, showed that two lamellar domains coexist in a fine coherent intergrowth, with a size scale between 20 and 40 nm, in a pseudoperiodic configuration with sharp boundaries, locally with a zig-zag shape in diagonal association (Figure 18a). The X-ray diffraction photographs of this type of specimen have been interpreted as a single-crystal pattern of a monoclinic K-rich feldspar (orthoclase or sanidine) plus oriented diffuse reflections in positions that correspond approximately to a Na-feldspar with an intermediate state between the low-temperature modification of albite and the high-temperature modification of analbite [64]. Specimen SRe1b shows a powder XRD pattern that is consistent with that interpretation. Thus, it was difficult to identify the diffraction maxima from the two types of lamellar domains, as the lamellar thickness is inferior to that of the coherent X-ray diffraction at 50–100 nm [3], thus complicating the refinement of the cell parameters by the Rietveld method. Figure 19b shows three regions of the X-ray pattern of this specimen and, for comparison, those of orthoclase in specimen K-ASGS (Figure 19a) and the other two specimens of moonstone. It was possible to distinguish some of the (hkl) diffraction maxima belonging to the two intergrown phases, but no clear evidence of triclinic character was detected in neither of the two feldspar components (Figure 19b). The Rietveld quantification indicates the coexistence of 63.4% monoclinic K-rich feldspar and 36.6% triclinic Na-feldspar. The a-dimensions in the two feldspars are strongly anomalous in comparison with unstrained alkali feldspars (compare the cell parameters of Table 8 with those of Table 10).
Note that the 29Si NMR spectrum at 9.4 T (Figure 20a, Table 9) is consistent with a combination of resonances of almost fully ordered albite (47.8%) and disordered K-rich feldspar (52.2%) with chemical shifts similar to orthoclase. This is as expected from the EMPA composition, with chemical compositions not far from the end-members, according to the values of the chemical shifts. The line width of the resonances of the two components with nanometer size in specimen SRe1b is significantly greater than that observed in specimen SR9 (with two triclinic feldspars detected in XRD). The size of the lamellae of the two components is much larger in specimen SR9, particularly for the K-rich feldspar (Table 9). It means that the larger distribution in the values of chemical shift of specimen SRe1b arise when the size domains decrease, owing to strain from coherency. The 27Al NMR spectra at 35.2 T (Figure 20b) of this specimen can be decomposed into a wide signal from disordered K-rich feldspar centered at 61.6 ppm (i.e., similar to sanidine in specimen K-713r) with 53.1% area, and two signals from Na-feldspar at 63.1 ppm (i.e., a value very close to that of fully ordered albite in specimen CLBR) with 37.5% area, corresponding to the low-strain inner part of the albite lamellae. In addition, a signal at 64.7 ppm with 9.4% area could correspond to the strained parts of albite close to interfaces from the coherent boundaries with the K-feldspar lamellae.
Specimen SR31 features a perthitic intergrowth (Figure 18b,c) of lozenge-shaped K-feldspar lamellae; the Na-feldspar lamellae are oriented along the (110) and (10) directions, giving rise to an X-shaped configuration. Some Na-feldspar lamellae are coarsened in spatial association with some microporosity owing to interaction with an aqueous fluid also affecting larger K-feldspar domains. Structural coherency is mostly preserved in the specimen. The powder XRD pattern is difficult to interpret because of the mixture, but it is consistent with the intergrowth of monoclinic K-feldspar similar to orthoclase, and a triclinic Na-feldspar with anomalous obliquity (Figure 19c, Table 8). However, anomalous unit-cell dimensions are detected, particularly in the a cell parameters of the two alkali feldspars (Table 8). The 29Si spectrum of this specimen at 9.4 T (Figure 20c, Table 9) is consistent with ~40 wt.% K-feldspar with a structure similar to that of orthoclase, and ~60 wt.% Na-feldspar with three resonances close to those of fully ordered albite. The 27Al spectrum (Figure 20d, Table 9) can be deconvoluted into three signals, one from ordered Na-feldspar with 52.2% area, and two signals from K-feldspar including the resonances of orthoclase with 43.9% area and one signal from structural strain with 3.9% area. The proportion of the K-feldspar and Na-feldspar components in the perthitic mixture extracted from NMR spectra are similar to the values obtained by EMPA and the quantification by the Rietveld refinement, but the structural state found in the XRD pattern for the Na-feldspar is markedly different from that found in NMR. Thus, the structural coherency existing between albite and orthoclase inhibits the correct characterization of the degree of order at the local scale if described by XRD.
Specimen SR9 shows an exsolution pattern composed of a cryptoperthite with fine lamellae of Na-feldspar in a K-rich feldspar matrix with zig-zag interfaces, as well as a microperthite of coarse albite veins of diamond shape, developed by lateral coarsening of the fine lamellae. This pattern can be resolved by standard BSE electron microscopy at conventional conditions (Figure 18d), although a more detailed visualization is possible with TEM [103]. However, our BSE image allows the observation of much larger surfaces and shows that the albite domains with a diamond shape and a coherent interface with the K-rich matrix are produced by the development of exsolution along the (110) and (10) directions. This gave rise to an exsolution pattern with large X-shaped albite lamellae, where structural coherency is mostly retained (Figure 18b). The powder XRD pattern of this specimen is also complex, because of overlapping of the diffraction maxima contributed by the two components, as for instance in the (11) diffraction (Figure 19). The cell parameters acquired by a Rietveld refinement thus have a low quality, particularly those of the Na-feldspar (Table 8). They record a mixture of triclinic alkali feldspars for both Na- and K-feldspar lamellae, but with anomalous a-dimensions in the two phases, with a K-feldspar close to the “X-ray low microcline” variety. The 29Si spectrum of specimen SR9 at 9.4 T (Figure 20e, Table 9) is consistent with a mixture of alkali feldspars’ very close fully ordered structures, with a chemical composition close to the end-members. The Na-feldspar amounts to 26.5% and the K-feldspar, 73.5%. The 27Al NMR spectrum of this specimen at 35.2 T (Figure 20f) shows two resonances corresponding to fully ordered microcline at δiso = 58.9 ppm with an area of 72.4% and fully ordered albite at δiso = 62.9 ppm with an area of 20.1%, but with an anomalously wide line width of 1.5 ppm in comparison with the “X-ray low albite” variety. It shows another resonance at 60.3 ppm with 7.5% area that can be interpreted as structural strain in the K-feldspar component arising from coherency.
Figure 21 shows the 27Al MQMAS NMR spectra at 17.6 T of the three specimens of moonstone. It was not possible to resolve the resonances of the two alkali-feldspar phases in specimen SRe1b (Figure 21a). The one-dimension spectrum of this specimen, i.e., the projection on the Fiso isotropic dimension (Figure 21b), however, can be deconvoluted with the three resonances analogous to those used in the deconvolution at 35.2 T, to obtain a very similar result (Figure 20b). The one-dimension spectra in specimen SR31 (Figure 21c) and specimen SR9 (Figure 21d) are also very similar to those obtained at 35.2 T (Figure 20d,f). Hence, all of these different NMR experimental results are fully compatible with each other in each specimen.
All of these results thus suggest that the resolving power of the XRD technique is not sufficient to properly describe the local structure of alkali feldspars where they form fine coherent intergrowths, such as those in the cryptoperthitic moonstone specimens we studied. The anomalous cell dimensions and the X-ray varieties inferred from XRD data cannot be correlated with the NMR data in a simple way. It is important to note that there is a strong tendency in all cases to detect structures close to full order at the local scale in the Na-feldspar phase by NMR, although the XRD patterns do not concur. Thus, such robust and persistent atomic organizations such as those of the “X-ray low albite” variety must have a particular physical interpretation, which could be investigated by using high-quality specimens with fully ordered structures at all scales of observation.
4.4. Fully Ordered and Stoichiometric Structures
Natural and synthetic minerals are normally crystalline and thus form macroscopic morphological units with regular external shapes (i.e., a crystalline figure); they also have an indexable diffraction pattern [110]. However, natural and synthetic minerals do not invariably have a fully ordered state, owing to the time scale involved in achieving it. In fact, mineral structures with a stoichiometric chemical composition that are fully ordered are particularly rare in aluminosilicate compounds. These complex mineral structures contain several chemical elements located at various structural sites, as for instances in aluminosilicates such as in β-eucryptite and β-spodumene solid-solution series [22] and also in feldspars [79]. At a laboratory timescale, Ostwald’s step rule [28] progresses very slowly [111], as noted by Laves, who labeled the Gay–Lussac-Ostwald step rule of successive reactions [61]. The theme was developed in detail by Goldsmith in relation to his “simplexity principle” [28]. In some cases, such as orthoclase or labradorite, metastable structures need to overcome a potential barrier to achieve stabilization at low temperatures. The kinetic restrictions commonly limit possibilities and inhibit compliance of the state expected from thermodynamic laws, preventing their fulfillment. Such kinetic factors render thermodynamic predictions useless. As a consequence, it is generally not possible to synthesize fully ordered structures in the laboratory. These require long periods of geological time and later recrystallization to reach such an ordered structural state typical of low-temperature phases. Hence, nature is the best “laboratory” to produce those specimens, as geological time and geological processes work together to eventually produce a highly ordered organization of atoms. Even in feldspars, the most common mineral and most accessible to human experiments, fully ordered structures with a stoichiometric composition such as KAlSi3O8 and CaAl2Si2O8 are extremely rare. The same can be said in other minerals groups such as amphiboles, micas and clay minerals. Fully ordered NaAlSi3O8 is apparently more common.
In order to compare results with previous examples with disordered structures and non-stoichiometric compositions, we have selected the compositional end-members of the alkali feldspar minerals as examples of fully ordered and stoichiometric structures. We examine chemical compositions very close to the ideal formulae, such as NaAlSi3O8 and KAlSi3O8, with low albite and low microcline XRD patterns. These should be labeled “X-ray low albite” and “X-ray low microcline” variants [66], with a structure close to the maximum degree of obliquity in the α and γ cell angles (triclinicity). A triclinic lattice model with C space-group symmetry and four tetrahedral sites for the framework cations is inferred from RSTs. One site with Al atoms labeled T1O (4Si,0Al) is occupied by Al atoms, and the other three sites with Si atoms are labeled T1m (3Si,1Al), T2O (3Si,1Al) and T2m (2Si,2Al). In this model, one irregular cavity, the M1 site, hosts the K or Na atom. This lattice model perfectly matches the experimental results from NMR spectroscopy [4]. Not all specimens of alkali feldspars with these chemical compositions and XRD patterns, with close cell dimensions and similar obliquity in angles, have exactly the same NMR spectra, however.
Figure 22 compares two samples of “X-ray low microcline”, with similar chemical composition (specimen 9544 with Or94.8Ab5.2 in Figure 22a and specimen 11924 with Or96.4Ab3.6 in Figure 22b), very similar X-ray patterns and also close cell parameters (Table 10). Specimen 9544 is a euhedral green amazonite K-feldspar with the Zillertal habit from a Pikes Peak pegmatite (Pikes Peak Mountains, CO, USA), and specimen 11924 is a “white cap” on a specimen similar to 9544 also from a Pikes Peak pegmatite. The white cap constitutes an overgrowth of untwinned low microcline at low temperatures, thus it formed well within the field of low microcline, from a fluid phase containing a totally different set of trace elements (in particular no Pb) than the precursor, which does show evidence of having inverted from a monoclinic parent [112]. In the same way, two examples of “X-ray low albite” are compared, which have very close chemical composition (specimen CJ1 with Ab100 in Figure 22c and specimen CLBR with Ab100 in Figure 22d), similar X-ray patterns and parallel cell parameters (Table 10). Specimen CJ1 is Na-feldspar from a void in a skarn rock from Malaga (Spain), and it is compared with specimen CLBR, a Na-feldspar from a pocket in Golconda III granitic pegmatite from Governador Valadares (MG, Brazil).
For dilute dipolar nuclei, as is here the case for the 29Si nucleus, NMR records different degrees of high structural order using the spectroscopic properties of the resonances of the constituent atoms, in particular the line width. This parameter reveals a distribution in values of the chemical shifts, which correspond to the distribution of T–O–T angles in the structure. Figure 23 shows the small but important differences in NMR spectra between the two specimens of “X-ray low microcline”, which seemed to be almost identical by XRD (Figure 22a,b).
The 29Si spectrum of specimen 9544 at 9.4 T (Figure 23a) is composed of three resonances that can be simulated with three Voigt curves of similar area and line width corresponding to the three sites, labeled T1m, T2O and T2m, occupied with Si atoms (Table 11). This agrees with the conventional lattice model for low microcline with C symmetry. The 29Si spectrum of specimen 11924 at 9.4 T (Figure 23b) shows the same three resonances but with a heterogeneous character of the T2m site and clearly split T2O and T1m sites (Figure 23a, Table 11), i.e., in the two (3Si,1Al) chemical environments of the Si atoms.
At 9.4 T, similar differences are found in specimen CJ1, with three Voigt curves (Figure 24a) compared to specimen CLBR, where again there is a clear split in the resonances related to the two (3Si,1Al) sites (Figure 24b, Table 12). The doublets are separated by 0.5 ppm for Si in T2m (2Si,2Al) and T1m (3Si,1Al) and 0.6 ppm for Si in T2O (3Si,1Al) in the K-feldspar and 0.3 ppm for Si atoms in T2m (2Si,2Al) and 0.4 ppm for Si atoms in T1m (3Si,1Al) and T2O (3Si,1Al) in the Na-feldspar. These values are slightly lower than 0.65 ppm found in the split signals for Si atoms in the 29Si spectrum of a high-quality specimen of petalite LiAlSi4O10 with (3Si,1Al) environments [22]. The 29Si single-pulse (SP) spectrum without 27Al decoupling of specimen CLBR at 17.6 T shows lower line widths for the six resonances and also slightly lower splittings for each doublet (Figure 24c). However, when a multi-pulse (MP) sequence is applied for decoupling of spin 1/2 and half-integer quadrupolar nuclei [113], in our case between 29Si and 27Al nuclei at 17.6 T, to remove the J coupling arising from 2J (Si,Al), the peak splittings disappear and only one single resonance is resolved for each tetrahedral sites, as shown in the 29Si{27Al} MP 27Al decoupling MAS NMR spectrum in Figure 24d. Moreover, the 29Si{27Al} 1D R-INEPT MAS NMR spectrum of this specimen at 17.6 T (Figure 24e) shows even finer resonances and the peak splitting of the T2O and T1m sites has disappeared, whereas it is still resolved for the T2m site. It is important to note that in this spectrum, the number of peaks is coincident with the number of Al atoms in the Q4 environment of the sites, i.e., 2Al for T2m, 1Al for T2O and 1Al for T1m.
Thus, when the highest-quality specimens of “X-ray low microcline” are examined with 29Si NMR, the spectrum can be simulated with six signals as three doublets, arising from a scalar J-coupling with ~34 ± 3 Hz, ~44 ± 3 Hz and 38 ± 3 Hz for T2m, T2O and T1m sites, respectively. For the “X-ray low albite” in specimen CLBR, these values are ~22 ± 3 Hz, ~33 ± 3 Hz and 32 ± 3 Hz for T2m, T2O and T1m sites, respectively. In the case of petalite, the 29Si spectra between 7.05 T and 20 T reveal a J coupling of 41 ± 3 Hz, as the splitting is constant in these units, and the splitting disappears under 29Si{27Al} cross-polarization [22].
The origin of these doublets is still unclear, as the coupling of 29Si (I = ½, natural abundance ~4 %) with 27Al (I = 5/2) should involve a 1:1:1:1:1:1 sextet in the liquid state, but a 1:1 doublet is experimentally observed in the solid state (Figure 24). As an alternative explanation, the splittings in these NMR spectra could be explained from structurally similar sites that are no longer magnetically equivalent owing to lowered symmetry. In the case of alkali feldspars, detailed single-crystal X-ray diffraction experiments (unpublished data) have been performed by Prof. Javier Zúñiga (UPV/EHU) on specimen CLBR, with no evidence of a lower symmetry than C in this specimen. The lower splittings at a higher external magnetic field (17.6 T), the elimination of the splittings by using a MP 27Al decoupling sequence, and the partial elimination of those splittings in the 29Si{27Al} 1D R-INEPT spectrum at 17.6 T (Figure 24) indicate artifacts from J couplings, rather than site splittings from lower symmetry in these specimens.
The study of quadrupolar nuclei (here, 27Al, 39K and 23Na) at external magnetic fields, in which the resonances are broadened with a quadrupolar profile because of the quadrupolar interaction, allows the determination of the quadrupolar parameters, if the structures are fully ordered and thus with narrow distributions of the chemical shifts. A resonance with a well-defined quadrupolar profile is an indication of atomic order, i.e., all the atomic constituents have a close chemical environment in terms of surrounding atomic elements and bond distances. However, at ultrahigh external magnetic fields (i.e., at 35.2 T), the quadrupolar broadening is cancelled, as the second-order quadrupolar broadening is proportional to 1/B0 for the CQ values existing in alkali feldspars, resulting in spectra that show only distributions in the chemical shifts.
Figure 25a shows the 27Al MAS NMR spectra of specimen 11924 at two magnetic fields. At 9.4 T, the quadrupolar profile has been simulated with a resonance at c.g. = 53.0 ppm, δiso = 59.0 ppm, CQ = 3.21 MHz and η = 0.25 for Al atoms located at the T1O site. At 35.2 T, the quadrupolar interaction has been almost totally cancelled, and only a resonance remains that can be simulated with a Voigt curve (xG/(1 − x)L = 0.7) at c.g. ≈ δiso = 58.6 ppm with a 1.1 ppm line width as an expression of a fine distribution of the chemical shift values of the Al atoms at this site. The comparison of the 27Al MAS spectra at 35.2 T with the 27Al MQMAS in the 1D isotropic dimension at 35.2 T (not shown) shows that the two spectra are almost equal and suggests a similar reduction of the quadrupolar shift and broadening. The 27Al MQMAS NMR spectrum of specimen 9544 (Figure 11b) shows a δiso = 59.7 ppm in the isotropic dimension. Note that lw ~ 1 ppm is actually a value similar to that found in the 29Si spectrum of the same specimen, which is also close to the estimated experimental uncertainty in these NMR spectra.
Figure 25b displays the 27Al MAS NMR spectra of specimen CLBR at four magnetic fields (9.4 T, 17.6 T, 19.6 T and 35.2 T), and the corresponding spectral simulations (Table 13). These simulations give rise to very similar NMR parameters; they are consistent with the suggestion that for a CQ ~3.2 MHz, at 35.2 T the quadrupolar broadening is cancelled.
These values reveal the highest degree of order in specimens 11924 and CLBR, as the distribution in the chemical shifts is very narrow for the Al atoms with ~1 ppm of line width. The two mineral species also have a similar CQ ~3.2 MHz. Hence the difference of 4 ppm in the δiso value between LM and LA minerals is related to different shielding from a slightly different geometry among tetrahedra due to different alkali cations at the M site, which is also highlighted in the different η values.
Figure 26a displays the 39K spectrum of specimen 11924, in which a single M site for of K atoms was found. This resonance can be simulated with a quadrupolar profile that can be simulated with a c.g. = −82.3 ppm, δiso = −4.9 ppm, CQ = 1.9 MHz and η = 0.88. Figure 26b shows the 23Na spectrum of specimen CLBR at 9.4 T and 19.6 T, where a single M site for Na atoms was resolved, with very similar NMR parameters from the spectral simulations (Table 14).
These NMR parameters are consistent with the available simulations of the NMR spectra of ordered alkali feldspars in the literature [4,114]. The well-defined quadrupolar parameters of these spectra, and the almost identical simulations in different magnetic fields, indicate that these specimens have most of the alkali atoms at a single site, with very well-defined spectroscopic parameters. In other words, alkali atoms are located in well-defined spectroscopically distinct sites, which are very different from atoms located at sites with distributions in the NMR parameters. It has been shown that the disordering of the Si,Al distribution is linked to the formation of half-sites for the cavity cations, indicating that the state of order–disorder is not only related to atomic diffusion at the tetrahedral sites, but it is a polyatomic phenomenon in which local compensation of charges plays an essential role, with specific Si–Al–(K,Na) configurations at the medium-range scale [4,5].
Therefore, in some way, only special specimens of alkali feldspar with a fully ordered structure are close to the concept of a “perfect crystal” as presented in traditional crystallography. Only in these particular cases, the short-range and medium-range polyatomic arrangements are periodically reproduced by translational symmetry along the three dimensions of space, to give rise to total long-range order. This type of order is simply a monotonous repetition of the same ordered motif of atoms without the formation of domains in different orientations (twins) or other interruptions of the atomic correlations. Where such a high regularity and repetitiveness of the same local order exists, the atomic schemes can be inferred from the lattice model by using averaging procedures and with the available resolving power of the RSTs. In this case, the well-defined framework topology and bond distances of these lattice models in the fully ordered alkali aluminosilicates can perhaps be used to interpret the origin of such specific configurations of atoms that are formed so commonly in nature. Note that a similar order appears in other specimens and mineral species with a much lower degree of long-range order, i.e., as site distributions, as has been shown in moonstone.
5. Discussion
5.1. The Structures in Solids from the Perspective of Different Experimental Techniques
By using goniometry, it is only possible to distinguish crystalline morphological units as euhedral solids with external shapes at the macroscopic scale from amorphous (anhedral) materials or solids without an external geometrical form. After X-ray diffraction methods appeared, this sharp duality was inherited and maintained; in crystalline compounds, Bragg peaks are evident, and in non-crystalline compounds they are absent. After that discovery, crystals definitely became mathematical objects for many investigators. The discovery of exsolution phenomena in Sri Lanka moonstone in Laue photographs with double diffraction spots by Shukusuké Kôzu and Yoshitoshi Endô was totally unexpected and subsequently described as the foundation of “Kristallpathologie” [115,116]. Later, in connection with the observation of diffuse scattering in minerals and a discussion of the existing literature, Fritz Laves [64] reviewed the lack of homogeneity in minerals previously described as “perfect crystals” or crystals with minor and homogeneous perturbations. Labradorite and moonstone were described as an intimate mixture of phases with contrasting chemical formulae and mineral structures. These difficulties facing structural determinations were already addressed in the middle of the last century by some investigators. For instance, in 1965 or so, Heinz Jagodzinski indicated that condensed matter forms a continuous series of (order–disorder) states, ranging from amorphous materials to nearly perfect crystals, later hinting that traditional crystallography was already antiquated in the 21st century [117].
Diffuse scattering and related crystalline heterogeneities are better observed by means of electron-diffraction experiments and transmission electron microscopy. Three “aperiodic” crystals were defined: incommensurately modulated crystals, incommensurate composite crystals and intergrowth compounds [118], in addition to quasiperiodic crystals or quasicrystals [119]. One may ask: is the concept of “space group” valid and to what extent is it necessary if applied to disordered structures [120], i.e., in aperiodic structures? Many of these compounds have been described by means of the “average structure” concept, a way in which “real aperiodic minerals” are converted into “ideal periodic crystals”. Some of the essential information at the local scale is thus lost, at the cost of implementing a non-existent space group in the strict sense.
The previously suggested sequence of progressive order between a wide series of order–disorder states, where initial chemical mixtures can evolve step-by-step (following Ostwald’s rule) to give rise contingently to fully ordered structures, has not been previously presented and explained in that way. The reason may be the limited capabilities of resolving power in other experimental techniques, particularly if focused at the local scale. Moreover, the concept of a mathematical crystal, which may exist in perfect crystals and fully ordered structures, has been applied to any solid and stone with a euhedral shape and diffraction peaks.
As has been shown in the previous examples, just as reciprocal space techniques (RSTs) perceive no signs of order at various scales in amorphous glass because Bragg peaks are absent, they perceive too much long-range order once the Bragg peaks suddenly appear. It is frequently assumed that this long-range order results from the monotonous repetition of the same short-range order schemes. As a paradigmatic example, consider the structures formed from an amorphous precursor. As a consequence of Ostwald’s rule, or its expression as Goldsmith’s principle of simplexity (i.e., simplicity), its crystallization gives rise to the formation of non-stoichiometric homogeneous structures, appearing as intermediate members of solid-solution series with a high degree of chemical disorder. However, their description by diffractometric and spectroscopic methods differs substantially. If these structures are examined by RSTs, they are described with a strict periodicity, space-group symmetry and strict crystallographic sites according to the mathematical approach of the lattice model. This approach has been possible because of the implementation of the ambiguous concept of “positional disorder”. Then, modifications of the expected position of an atom are imposed, with respect to the exact node that corresponds to periodic correlations, although one assumes that a strict periodicity still exists, is preserved and is not lost.
The NMR methods do not perceive such an abrupt structural change between precursors and the first product of their crystallization; so much disorder does not exist in the amorphous precursors, nor does so much order exist in the first products of crystallization. In those first products examined by NMR, the resolved spectroscopically distinct site-distributions can differ markedly from the expected crystallographically distinct sites, as in sanidine KAlSi3O8. In fact, sanidine may be seen as a “stone with flat surfaces”, instead of a “crystal” with lattice symmetry and periodicity such as occurs in the “X-ray microcline” variant. Furthermore, more structural sites may appear than expected from the lattice model (as in NaBO2). Therefore, from the NMR point of view, “positional disorder” appears to be or could be interpreted as an ad hoc implementation, to preserve the main axiom of the lattice model. Hence, periodicity seems to be an essential a priori character that must be preserved in any case. With this apparent relaxation of the mathematical periodicity, the lack of strict periodicity in the aforementioned structures is hidden or, in other words, a real pseudoperiodicity is omitted in order to impose an ideal periodicity and a space group.
It is clear, however, that small deviations in stoichiometry and in local geometry introduced by additional elements (unexpected from the anticipated chemical formula), as needed for local compensation of charges, and structural modifications due to strain, have very large effects on the long-range order; these are not appropriately recorded by RSTs. In these cases, it is not possible to solve real structural measurements in terms of bond distances and bond angles using average values. There are important changes in local geometry compared to stoichiometric and ordered compounds, changes that are ignored in an average measurement, as in the case of beryl-group minerals. Consequently, we suggest that the large structural gap imagined between amorphous precursors and their first crystalline products inferred by RSTs is a misunderstanding due to the character of the experimental method.
The difficulties of RSTs are particularly evident in the structural characterization of heterogeneous crystalline intergrowths at the mesoscale with size domains close to the dimension for coherent diffraction, as has been shown in the case of labradorite and moonstone. If the method of average structures is used, the lattice models they produce are clearly inadequate. The similar local structures found in many different specimens of labradorite for compositions close to An50Ab50, or NaCaAl3Si5O16, taken as the most common composition among intermediate plagioclases in nature, again demonstrate the importance of local compensation of charges in pseudostoichiometric compounds. That apparently simple composition is actually extremely complex; the Si:Al ratio of 5:3 is fictitious at the local scale. On cooling, a transformation in the precursor leads to the (meta) stable coexistence of p1 and p2 plagioclases.
All of these previously noted difficulties in the characterization of solids by conventional RSTs and the appearance of a wide diversity of order–disorder structural states by NMR spectroscopy raise questions about the universally accepted but never proven hypothesis that explains the internal order of crystals by “periodic filling of space”. Actually, this explanation does not only refer to ionic crystals, but is a universally accepted explanation for the origin of internal order in crystals. It is found to be useful to define what a “crystal” is [118], and it thus includes ionic, covalent and metallic compounds. This explanation was complemented with a model for crystal structures based in the stacking of solid spheres, which seems reminiscent of Kepler’s ice crystal interpretation and also of horror vacui. In fact, close-packing of equal spheres, as in face-centered cubic close-packed and hexagonal close-packed arrays and their derivatives, have been used to describe many crystal structures in ionic, but also covalent and metallic compounds. In fact, equal (hard) spheres were also used to explain the dynamic behavior in crystal structures as grain boundaries, dislocations and the effect of impurity atoms by Bragg and Nye, who used the bubble model in three-dimensional assemblages [121].
5.2. Diversity in Order–Disorder States in Solids Inferred by NMR and the Role of Electrical Charges
The traditionally labeled “amorphous” solids, such as glasses and gel-like materials, lack a long-range periodic repetition of unit cells found in fully ordered crystalline solids, although basic structural arrangements are present throughout the whole extension of their microscopic network. Those structural features, used from the purely geometric point of view to describe extended order in inorganic solids, are in contradiction with the identification of glasses as amorphous materials. In these disordered solids at the long-range scale, at least short-range order exists in all cases, forming the first sphere of coordination or polyhedra.
Through the examples of non-crystalline structures given previously, it can be seen that different types of order can be resolved in glasses and amorphous materials. To date, two visions have dominated the scene of structural elucidation in glasses, the random network model on the one hand, and the crystallite model on the other. In an excellent recent review by Wright [122], the fundamentals and evolution of the two hypotheses are presented in terms of the levels of order in the structures of silicate glasses.
The “random network model” ideally describes a purely statistical and homogeneous distribution of atomic positions, whereas with the “crystallite model”, one assumes that the glass network is built up of higher-order regions, the so-called “crystallites”, separated from each other through grain boundaries of some kind. In fact, the latter view has evolved to a more general one involving cybotactic groupings, which would form a continuum of regions with differences in order to be characterized by density fluctuations. The term “cybotactic” is applied here to spatial regions within the glass that present higher order than their surroundings. Furthermore, the structure of these ordered groupings would actually resemble that of the crystalline phases of the given compositional system, and which has been represented in the thermodynamic model of associated solutions [123].
The highly disordered system observed in the KAlSi3O8 amorphous gel would indeed represent the type of amorphous solids in which no distinction of individual structural units can be made, as it is a case of a random and homogeneous distribution of sites. The large range of site distributions of Si and Al atoms in tetrahedral sites, from Q4n (nAl), n = 0…4 chemical environments in the second sphere of coordination, does not allow us to decipher any structural detail at the local scale, as a single broad Gaussian-like resonance is resolved for Si and Al atoms. Note also that a single and broad Gaussian-like signal is obtained in the 27Al spectrum of sanidine at 35.2 T (i.e., where only a site distribution of chemical shifts is recorded), the first detected crystalline solid to be formed from a glass of appropriate chemical composition.
Other dipolar nuclei can, however, allow better distinction between bonds of dissimilar elements through bridging oxygen atoms in glass networks. In aluminophosphate glasses, for instance, 31P resonances of phosphorus in P–O–Al bonds can readily be separated from those with P–O–P bridges only [124]. Not only can P–O–Al bonds be quantified, but phosphorus—aluminum correlation maps can also produce a medium-range pattern of structural order. The fact that P–O–Al bonds can be better resolved from P–O–P ones in phosphates may well be due to the larger differences between P and Al, as compared to Si and Al.
A higher level of order can be introduced where the structural building units are formed by groupings with different chemical environments, as represented in the 31P NMR spectra of oxynitride glasses in Figure 2. As oxygen atoms of the PO4 units are replaced by nitrogen, the 31P resonances of the new groups can be clearly resolved. The new groups are homogeneously distributed throughout the network; several studies point to a possible separation of nitride domains from oxide ones owing to some anomalous changes in properties [125,126]. However, even though there is a dependence of phosphorus speciation on the type of modifier element in the composition, and some clustering cannot be excluded definitively [36], no sign of microscopic segregation of structurally different networks has yet been made in these glasses.
Whereas chemically different coordination environments are usually separated in the element-specific NMR experiments, crystallographically distinct sites cannot be resolved in the glassy state unless some high degree of local ordering arises even in the absence of periodicity, as in the case of the KPO3 glass. A very rapid quench of its melt produced a sample free of Bragg peaks in its X-ray pattern. In the 31P NMR spectrum, one is able to distinguish the two phosphorus sites in the crystalline-like phase of KPO3, with chemical shifts very similar to the crystallographically distinct sites in the crystalline compound. It is the reason why we know that in the glass there are sites with different geometry like in crystalline structures [37]. It has been traditionally thought that the structure of the glassy solids resembles that of the liquids from which they are obtained. In the KPO3 melt, whose structure is assumed to be the one seen in its glass, the level of atomic order at the short to medium range is so high that crystal formation is thermodynamically very stable and kinetically allowed, such being the reason for its high rate of crystallization if allowed to cool down freely. The same is thought to apply in the NaBO2 composition, whose glass has been characterized by 11B NMR upon rapid quenching of its melt. In this case, the structure of the glass is extremely similar to the structure of the crystalline NaBO2 from the NMR point of view. These previous examples allow us to explain the so-called “simplexity principle of easy crystallization” [28], in terms of a similar local structure in the amorphous precursor and in the first crystalline phase to be formed after it. This explanation is also useful to understand why Ostwald’s rule takes place and for the interpretation of the successive sequences of order–disorder states, invoked in some of the previous examples and also in feldspars.
In the examples selected in this work, the second sphere of coordination is also shown to matter in the formation of mineral structures, in addition to the first sphere of coordination. It occurs in Q4 aluminosilicates and in the layer of tetrahedra of Q3 aluminosilicates, where tetrahedral sites can be occupied either by Si or Al atoms in at least three different configurations: (i) without restrictions about charge concentrations at the ångström scale, allowing for the formation of Al–O–Al bonds in random structures, where the bulk structure is only controlled by the Si:Al ratio; (ii) with restrictions about the formation of Al–O–Al bonds where Loewenstein’s rule is obeyed, i.e., in Loewenstein structures; and (iii) with long-distance restrictions on charge about the proximity of Al atoms, as in the maximum dispersion of charges (MDC) and homogeneous dispersion of charges (HDC), that do not give rise to strict long-range order [55]. That is the case in the example of “X-ray orthoclase” and “valencianite”, i.e., in charge-dispersed structures. Additional charge restrictions were observed during the transformation of disordered structures such as sanidine into more ordered structures such as microcline, throughout the coexistence of many orientation variants and their crossovers like in orthoclase and also during the crystallization at low temperatures in hydrothermal conditions like in “valencianite”, with one Al atom per four-membered ring with a favored sequence of “…1-1-1-1…” rings [4]. In these cases, the charge dispersions can involve more than the second sphere of coordination.
However, by considering the dispersion of charges including only valence electrons or outer-shell electrons, it is not possible to explain the formation strictly periodic structures, as in the case of the end-member and fully ordered alkali feldspars. In the case of the “X-ray low albite” and “X-ray low microcline” variants, the local structure consists of chains of four-membered rings of tetrahedral sites with two or zero Al atoms per ring, and then a strictly periodic sequence of “…2-0-2-0…” rings are favored, which cannot be explained if charge dispersion is mandatory. Actually, the formation of “X-ray low microcline” after orthoclase is commonly produced by a dissolution and recrystallization process [127], or a dry recrystallization mechanism as in avalanche-like units [79], and not by a continuous atom-by-atom growth process of order after disorder. It implies that additional causes involving the valence electrons must be at work to produce the ordered structures, in which a very particular atomic configuration at the local order is uniformly reproduced up to the macroscopic scale.
New physical explanations are needed, regardless of the experimental technique used to collect the essential facts to be explained. These new explanations may be derived from mineral structures with a low symmetry, as in fully ordered alkali feldspars with end-member compositions, instead of highly symmetric and simple crystals described with rigid spherical atoms. Here, we use the structural data from “perfect crystals” established by RSTs, which are totally coincident with “fully ordered structures” by NMR, as in “X-ray low microcline” and “X-ray low albite” occurs. In this case, the same local atomic order is regularly repeated throughout the three dimensions of space without changes to form homogeneous volumes larger than the size scale of coherent X-ray diffraction.
The local structures inferred from NMR spectra are identical to the unit-cell configurations deduced from the lattice models. Fully ordered structures in alkali feldspars have a primitive cell P(although it was described as a C cell in alkali feldspars by convention in order to compare it with the archetype C2/m structure) with an inversion center as the only symmetry element. However, one should expect a more symmetrical shape of the M site, if a spherical shape is suggested from the atomic configuration of alkali ions, and thus a higher symmetry in the overall structure, particularly at the K site, as occurs in many cubic aluminosilicate zeolites. It is important to note that the density of “X-ray low albite” (~2.613 g/cm3) is larger than that of “X-ray low microcline” (~2.557 g/cm3), as also inferred from differential Rayleigh scattering [108], although K is heavier than Na. It seems that the topology of the tetrahedral framework in feldspars is better coupled to the “non-spherical shape” of the Na atom than to that of the K atom, i.e., it fits like a glove on the hand. This is also correlated with the general observation that fully ordered end-members in nature are extremely common in Na-feldspar but extremely rare in K-feldspar.
All of these data indicate that the shape of the cavity site plays a crucial role in the geometry and symmetry of the topology in feldspar structures. The general description that regards alkali ions as “hard” ionic spherical species, with an ionic radius, is clearly insufficient. These are not unstable “rattle cations” but foundations, pillars or basic supportson which the fully ordered structure is built. Although is impossible to distinguish any possible cationic “shape” from the shape of the cavity site itself (which is directly related to the feldspar topology), we suggest that the “shape” of the alkali cations (i.e., the electron density distributions) dictates the shape of cavity, and not from an a priori assumed spherical shape with ionic character. As feldspars are so ubiquitous, we can ask why such a particular topological shape is so common in nature.
An answer to this question could be provided in Figure 27. It shows a general relationship between the distances between alkalis (Na, K, and Rb) or Ca with oxygen atoms in the cavity sites of the feldspar structures (calculated from the structure determinations from XRD in the literature (Figure 27a) and from the computer simulations (Figure 27b) of the same structures); these are shown with the values of the ionization energies of these elements [128] occupying the cavity sites. Linear correlations with approximately parallel lines are found, with a high internal graphical consistency for the whole family of compounds, when using the number of oxygen atoms in the polyhedral coordination, five for Na atoms in low albite, seven for K atoms in low microcline. This picture can be complemented by using the same relationship in P anorthite with six oxygen atoms, and in RbAlSi3O8 with seven oxygen atoms, as in KAlSi3O8. The separation between the straight lines corresponds approximately to the difference in ionic radii. The line from fully ordered low albite C is almost coincident with that of fully ordered P anorthite, in which the Ca–O distances for the four sites involving Ca have been averaged. Note that the best correlations also occur in the Na-feldspar. Hence, a “soft” covalent-like non-spherical character is inferred for these cations in the cavity M site.
If we impose strict periodicity in pseudoperiodic disordered structures in feldspars from average measurements by RSTs, these correlations are much less obvious because they have a much lower linearity. These representations of fully ordered structures are definitely inconsistent with a spherical shape for cavity cations and the site they occupy in the crystal structure. It is clear that the atomic organizations of disordered compounds are derived from the local compensation of electrical charges, involving mainly the valence electrons of the last shell, as defined by conventional oxidation stages. We here suggest that electrical charges and energies of the s electron and p electrons of alkali elements and Ca atoms in the cavity-site cations are responsible for the shape in the feldspar topology formed by oxygen and the framework cations; by extension, they also control the formation of long-range atomic correlations giving rise to perfect crystals, where simple charge dispersion criteria do not work. If this interpretation is correct, the effect of inner-shell electrons should also be considered to understand fully ordered structures.
The suggestion that alkali atoms in the cavity site of alkali feldspars cannot be explained by spherical atoms is in some ways predictable, if we take into account the voluminous available literature on non-spherical (charge density distributions) atoms, bond paths and bonded radii [134,135]. However, bonded radii are mainly described in the literature for electronegative atoms as oxygen. What is new here is a similar description for the “shape” of alkali atoms and Ca in the cavity M sites of the feldspar structure to produce the robustness of Figure 27 with such linear regressions, where r is in excess of 0.94 (up to r = 0.99 for the structure of “X-ray low albite” from computer simulations) to explain the shape of the framework topology of feldspars. It is also a novelty to suggest that there may be a connection between these correlations and the formation of fully ordered structures. Those correlations may simply be a fortuitous mathematical accident, or alternatively they may have a physical meaning, for instance the one that has been suggested here. From these correlations, it does not necessarily follow that inner electrons of alkali atoms participate in the shape of the cavity site, but it is a hypothesis that should be studied in detail in the future. If proven, it will imply that total chemical order, in strictly periodic structures with perfect long-range atomic order, does not develop only as a consequence of the low-energy external features of electronic structures of atoms, but also from the high energy within.
5.3. What Are Mineral Structures from the NMR Perspective
Minerals are currently described as crystalline if they have an atomic order on a scale that can produce an indexable diffraction pattern when the substance is traversed by a wave of a suitable radiation wavelength [110]. Some investigators are reluctant to accept that amorphous substances are minerals because of the difficulty in determining whether the substance is a true chemical compound or a mixture of several compounds [110], i.e., in using conventional techniques such as XRD and EMPA. Note that under this experimental perspective, a “true chemical compound” is referred to as a “stoichiometric compound”, and thus chemical elements unexpected from the ideal chemical formula are considered simply as imperfections or impurities relative to a certain perfect and pure a priori model. This is the reason why some mineralogists prefer to label such different solids “mineraloids”. Similar difficulties were found in the terminology of the intermediate members of solid-solutions series, as no defined and fixed stoichiometric formulae have been found. For instance, the IMA list of mineral species of 2009 included the traditional names of the intermediate plagioclases in addition to the end-members of albite and anorthite. Since the IMA list of 2012, those names have been removed. In the same way, it has been suggested that a dominant end-member formula can always be written for a crystal structure or a mineral [136], an idea that has been recently justified by ontological-metaphysical arguments [137].
Currently, as no official and precise definition for the word “mineral” exists, we have to infer what a mineral is from the accepted terms of “mineral species” in the IMA list, which is basically an approach from the perspective of the experimental capacities and resolving power of XRD and EMPA techniques. With some exceptions, two or more phases of a chemical composition are considered to be the same mineral species. For instance, α-cristobalite and β-cristobalite are not distinguished. The current procedure in the nomenclature of minerals consists mainly to correlate what we find in nature with what is supposed to be the ideal chemical formulae for a certain mineral species. However, at this macroscopic scale, most available minerals (and particularly most common minerals) actually seem to be singularities. In other words, when textures, microstructures and structures are considered in addition to chemical composition, each specimen seems to be unique. In addition, most experimentally determined chemical compositions in common minerals do not match easily that of the approved mineral species and their expected compositions as stoichiometric compounds. Together, all of these proposals suggest that the term “mineral” must be restricted to certain naturally occurring solids that have “a defined chemical composition”; the mineral names are thus becoming fully equivalent to particular chemical formulae. Perhaps they are simply redundant and unnecessary terms in comparison to a more informative chemical formula.
However, when we observe minerals at the microscopic and optical scales, we find that they are not simply chemical compounds, as they have microtextures inherited from exsolution processes [138]. Minerals also have microstructures or twin patterns inherited from transformations and recrystallization derived from order–disorder phenomena, as a structured dynamic medium behaving as a “complex system” [78,79]. Nowadays, there still exists a strong contrast between “ideal” and “real” approaches to describe the essential features of minerals, just as is the case with crystals.
Therefore, we have a sharp split between the real structures that occur in mineral specimens in nature studied by NMR, and the ideal lattices and chemical formulae that are anticipated by the conventional meaning of the “crystal” and “minerals species” concepts. Where a natural solid does not agree with those preconceptions, the current attitude is to eliminate the terms from the lists, as in intermediate plagioclases. Perhaps it would be wisest to preserve those old terms of mineral systematics, which have been so useful in scientific communications, but with additional nuances and novelties from new discoveries.
An alternative approach is derived from the variability of our experimental capabilities to study structures in the solid state and also the concepts used to understand and explain such experiments. As has been shown, the fundamental characteristics to be explained change with the nature of the experimental measurements obtained, as well as the necessary concepts to carry it out. By using NMR, we have empirically recorded a wide and continuous diversity in order–disorder states, between amorphous materials and glasses or mineraloids, and minerals with fully ordered structures at the different length-scales. This approach should be called the study of NMR mineral structures of the solid state, and it opens the possibility to develop the science of NMR mineralogy. Definitely, it is only a question of scale. In the same way as there are several minerals in a rock, there are often several NMR mineral structures in common mineral species, whether or not they have a recommended name.
6. Conclusions
The perception of the fundamental features in structures of the solid state changes with the resolving power of the experimental technique, giving rise to different perspectives of understanding. From the point of view of NMR, a continuous sequence of progressive long-range order at the local scale has been established by using examples of gels, glasses and products of their crystallization, beryl-group minerals, and feldspar-group minerals. Ostwald’s step rule of successive reactions is now explained by the similarity at the local scale from NMR data between immediately successive structural stages, i.e., in structures apparently very different such as glasses and crystals from data obtained by other experimental techniques.
Amorphous materials are shown to comprise a large variety of locally structured domains. Although not present with long-range periodicity, they constitute the building units that are repeated throughout the whole network. In particular, the elucidation of the structure of glasses can be considered to be far beyond Zachariasen’s postulates. New hypotheses should arise, involving not only the atomistic models but also considerations of the thermodynamic stability of cybotactic groupings, with structures similar to their crystalline counterparts.
The intermediate members of solid-solution series and order–disorder series are strictly aperiodic structures, and thus disordered at the long-range scale. Their atomic structures differ very markedly from those of the end-members, despite appearance from the RSTs data. The degree of order at the local scale in these long-range disordered glassy and crystalline solids, either with stoichiometric or non-stoichiometric compositions, is ruled by the local compensation of electrical charges (first sphere of coordination). In addition, charge restrictions occur from charge-dispersion criteria at moderate and large distances (second sphere of coordination), if considering only valence charges.
These criteria do not explain the formation of fully ordered structures in feldspars. We propose that the s and p electrons of the alkali cations and Ca located at the M site are involved in bonds with the oxygen anions that form this cavity. The ionization potentials of the M cations correlate linearly with the cation–anion bond distances, if only the number of oxygen atoms that form the coordination polyhedra is considered. The electronic structure of the cavity cations imposes a restriction on the shape of the structural cavity in which they are allocated. Therefore, they are also responsible for the topology of the framework of tetrahedra.
Many minerals have complex structures and intergrowths beyond the limits of resolution of conventional RSTs and EMPA, but NMR allows a certain structural determination of the coexisting local structures, in stoichiometric and non-stoichiometric compounds. The NMR techniques may thus allow for the discrimination of mineral structures at the local scale, giving rise to medium-range polyatomic organizations. This approach opens the possibility for the study of amorphous materials together with crystalline mineral structures in the same conceptual framework, i.e., from the NMR Mineralogy perspective.
Author Contributions
Conceptualization mainly by L.S.-M. and F.M.; the NMR experiments were performed by P.F. and Z.G.; synthesis of glasses by F.M. and collection of some of the studied minerals by L.S.-M.; analyses of the NMR spectra by L.S.-M., P.F., Z.G. and F.M.; the Rietveld refinements of cell parameters and mineral quantifications by L.S.-M. All authors contributed to discussing and writing the paper. All authors have read and agreed to the published version of the manuscript.
Funding
This research was partially funded by Ministerio de Ciencia, Investigación y Universidades, MAT2017-86450-C4-1-R, and MAT2016-78362-C4-2-R.
Data Availability Statement
Not applicable.
Acknowledgments
We give thanks to Aurelio Nieto of the Museo Nacional de Ciencias Naturales (MNCN-CSIC) for the mineral specimen AGM of “valencianite”, specimen ASGS of orthoclase, and specimen Elba of beryl; to Alfredo Fernández Larios from ICTS CNME (UCM) for the results of electron microprobe analyses using a JXA 8900 in the specimens used in this work; to Laura Tormo from MNCN-CSIC for the BSE SEM image of specimen SR31 in Figure 18c and specimen SR9 in Figure 18d; to Adrian Sandu, Thermo Fisher Scientific Eindhoven NanoPor for the electron microscopy image of moonstone SRe1b, acquired by using a Thermo Scientific Apreo 2S LoVac SEM in Figure 18a; to Isabel Sobrados from the Instituto de Ciencia de Materiales de Madrid (ICMM-CSIC) for the 29Si spectrum (Figure 1a) and the 27Al spectrum (Figure 1b) of the KAlSi3O8 gel; to Virginia Diez-Gómez from the Instituto de Ciencia de Materiales de Madrid (ICMM-CSIC) for the 29Si spectra in the two beryl specimens (Figure 5c,d); to Marta Furio of the Museo Nacional de Ciencias Naturales (MNCN-CSIC) for the help in the determination of the cell parameters with Rietveld refinement by using the TOPAS software; to Noemí González Díaz from Servicio Interdepartamental de Investigación (SIdI) Universidad Autónoma de Madrid for the powder XRD patterns in specimens of labradorite and moonstone (Figure 19); to G. Van Tendeloo and Leona Nistor from Electron Microsocpy for Material Research (EMAT) University of Antwerp (Antwerp, Belgium) the electron diffraction pattern in specimen AGM of “valencianite” in Figure 8, and the electron microscopy images and electron diffraction patterns of orthoclase in Figure 12 and Figure 13; to Javier Zúñiga (UPV/EHU) for a long discussion about the origin of the splitting in the 29Si spectrum and the space-group symmetry of the unit cell in “X-ray low albite” after detailed single-crystal XRD works in its laboratory using specimen CLBR; to Yusuke Nishiyama (JEOL Resonance Inc., Tokyo, Japan) for additional 29Si NMR spectra at 600 MHz in specimen CLBR and also for the suggestion of Al–Si J coupling as the origin the observed fine splitting in the 29Si spectra; to Kasun Beruwalage from Reruwalage Gems and Jewellery (Domanwila, Meetiyagoda, Sri Lanka) for the specimens SRe1b, Sr31 and SR9 of moonstone; to Museo Geo-Minero IGME (Madrid, Spain) for specimen 9544 of amazonite; to Ray Berry from Colorado Springs (CO, USA) for specimen 11924 of a white cup in such type of amazonite. In addition, we give thanks to Robert F. Martin and two anonymous reviewers for their suggestions, improvements and constructive comments for this work. ZG acknowledges the support by the National High Magnetic Field Laboratory, the National Science Foundation through NSF/DMR-1644779 and the State of Florida. LSM acknowledges the support by the Magnet LAB of the National High Magnetic Field Laboratory for the P19961 project.
Conflicts of Interest
The authors declare no conflict of interest.
References
- Grimm, U. Aperiodic crystals and beyond. Acta Crystallogr. 2015, B71, 258–274. [Google Scholar] [CrossRef] [Green Version]
- Steurer, W. What is a crystal? Introductory remarks to an ongoing discussion. Zeit. Kristallogr. 2007, 222, 308–309. [Google Scholar] [CrossRef]
- Ribbe, P. Aluminum-silicon order in feldspars; domain textures and diffraction patterns. Rev. Mineral. 1983, 2, 21–55. [Google Scholar]
- Sánchez-Muñoz, L.; Sanz, J.; Sobrados, J.; Gan, Z.H. Medium-range-order in disordered K-feldspars by multinuclear NMR. Am. Mineral. 2013, 98, 2115–2131. [Google Scholar] [CrossRef] [Green Version]
- Sánchez-Muñoz, L.; Sanz, J.; Sobrados, I.; Gan, Z.H.; Santos, J.I. Medium-range order in crystal structures of minerals. In Applications of NMR Spectroscopy in the Solid State; Consejo Superior de Investigaciones Científicas (CSIC): Madrid, Spain, 2019; Biblioteca de Ciencias 47; pp. 103–131. [Google Scholar]
- Eckert, H. Structural characterization of noncrystalline solids and glasses using solid state NMR. Prog. Nucl. Magn. Reson. Spectrosc. 1992, 24, 159–293. [Google Scholar] [CrossRef]
- Eckert, H. Short and medium range order in ion-conducting glasses studied by modern solid state NMR techniques. Zeit. Phys. Chem. 2010, 224, 1591–1654. [Google Scholar] [CrossRef]
- Phillips, B.L.; Kirkpatrick, R.J.; Xiao, Y.; Thompson, J.G. Investigation of structural phase transitions in oxide materials using high-resolution NMR Spectroscopy. In Nuclear Magnetic Shieldings and Molecular Structure; Springer: Dordrecht, The Netherlands, 1993; pp. 203–220. [Google Scholar]
- Phillips, B.L. NMR spectroscopy of phase transitions in minerals. Rev. Mineral. Geochem. 2000, 39, 203–240. [Google Scholar] [CrossRef]
- Ghose, S.; Tsang, T. Structural dependence of quadrupole coupling constant e2qQ/h for 27Al and crystal field parameter D for Fe3+ in aluminosilicates. Am. Mineral. 1973, 58, 748–755. [Google Scholar]
- Stebbins, J.F. NMR spectroscopy and dynamic processes in mineralogy and geochemistry. Rev. Mineral. Geochem. 1988, 18, 405–429. [Google Scholar]
- Stebbins, J.F. Nuclear magnetic resonance spectroscopy of geological materials. MRS Bull. 1992, 17, 45–52. [Google Scholar] [CrossRef]
- Stebbins, J.F. Nuclear magnetic resonance spectroscopy of silicates and oxides in geochemistry and geophysics. Mineral. Phys. Crystallogr. A Handbook Phys. Constants 1995, 2, 303–331. [Google Scholar]
- Stebbins, J.F.; Xue, X. NMR spectroscopy of inorganic Earth materials. Rev. Mineral. Geochem. 2014, 78, 605–653. [Google Scholar] [CrossRef]
- Kirkpatrick, R.J.; Kinsey, R.A.; Smith, K.A.; Henderson, D.M.; Oldfield, E. High resolution solid-state sodium-23, aluminum-27, and silicon-29 nuclear magnetic resonance spectroscopic reconnaissance of alkali and plagioclase feldspars. Am. Mineral. 1985, 70, 106–123. [Google Scholar]
- Kirkpatrick, R.J. NMR spectroscopy and dynamic processes in mineralogy and geochemistry. Rev. Mineral. Geochem. 1988, 18, 341–403. [Google Scholar]
- Ashbrook, S.E.; Dawson, D.M. NMR spectroscopy of minerals and allied materials. Nucl. Magn. Reson. 2016, 45, 1–52. [Google Scholar]
- Ashbrook, S.E.; Smith, M.E. Solid state 17O NMR—an introduction to the background principles and applications to inorganic materials. Chem. Soc. Rev. 2006, 35, 718–735. [Google Scholar] [CrossRef]
- Henderson, G.S.; Stebbins, J.F. The short-range order (SRO) and structure. Rev. Mineral. Geochem. 2022, 87, 1–53. [Google Scholar] [CrossRef]
- Sanz, J.; Massiot, D. Nuclear magnetic resonance spectroscopy. In Developments in Clay Science; Elsevier: Amsterdam, The Netherlands, 2013; Volume 5, pp. 233–274. [Google Scholar]
- Putnis, A. Solid state NMR spectroscopy and phase transitions in minerals. In Physical Properties and Thermodynamic Behaviour of Minerals; Springer: Dordrecht, The Netherlands, 1988; pp. 325–358. [Google Scholar]
- Sánchez-Muñoz, L.; Sanz, J.; Florian, P.; Diez-Gómez, V.; Furio, M.; Sobrados, I. Order−disorder in the structures of lithium aluminosilicate minerals by XRD and multinuclear NMR. Minerals 2022, 12, 427. [Google Scholar] [CrossRef]
- Gan, Z.; Hung, I.; Wang, X.; Paulino, J.; Wu, G.; Litvak, I.M.; Gor’kov, P.L.; Brey, W.W.; Lendi, P.; Schiano, J.F.; et al. NMR spectroscopy up to 35.2 T using a series-connected hybrid magnet. J. Magn. Reason. 2017, 284, 125–136. [Google Scholar] [CrossRef]
- Massiot, D.; Fayon, F.; Capron, M.; King, I.; Le Calvé, S.; Alonso, B.; Durand, J.O.; Bujoli, B.; Gan, Z.H.; Hoatson, G. Modelling one and two-dimensional solid-state NMR spectra. Magn. Reson. Chem. 2002, 40, 70–76. [Google Scholar] [CrossRef]
- Warren, B.E. X-ray diffraction study of the structure of glass. Chem. Rev. 1940, 26, 237–255. [Google Scholar] [CrossRef]
- Hamilton, D.L.; Henderson, C.M.B. The preparation of silicate compositions by a gelling method. Min. Mag. 1968, 36, 832–838. [Google Scholar] [CrossRef]
- Goldsmith, J.R. A “simplexity principle” and its relations to “ease” of crystallization. J. Geol. 1953, 61, 439–451. [Google Scholar] [CrossRef]
- Ostwald, W. Studien über die Bildung und Umwandlung fester Körper. Z. Phys. Chem. 1897, 22, 289–302. [Google Scholar] [CrossRef]
- Farnan, I.; Kohn, S.C.; Dupree, R. A study of the structural role of water in hydrous silica glass using cross-polarisation magic angle spinning NMR. Geochim. Cosmochim. Acta 1987, 51, 2869–2873. [Google Scholar] [CrossRef]
- Muñoz, F. The chemistry of melting oxynitride phosphate glasses. Pure Appl. Chem. 2022, 94, 189–195. [Google Scholar] [CrossRef]
- Jack, K.H. Sialons and related nitrogen ceramics. J. Mater. Sci. 1976, 11, 1135–1158. [Google Scholar] [CrossRef]
- Marchand, R. Mise en évidence de verres de phosphates contenant de l’azote. CR. Acad. Sc. Paris 1982, 294, 91. [Google Scholar]
- Marchand, R. Nitrogen-containing phosphate glasses. J. Non-Cryst. Solids 1983, 56, 173–178. [Google Scholar] [CrossRef]
- Muñoz, F.; Ren, J.; van Wüllen, L.; Zhao, T.; Kirchhain, H.; Rehfuß, U.; Uesbeck, T. Structure and dynamics of LiPON and NaPON oxynitride phosphate plasses by solid-state NMR. J. Phys. Chem. C 2021, 125, 4077–4085. [Google Scholar] [CrossRef]
- Xue, X.; Stebbins, J.F.; Kanzaki, M.; McMillan, P.F.; Poe, B. Pressure-induced silicon coordination and tetrahedral structural changes in alkali oxide-silica melts up to 12 GPa: NMR, Raman, and infrared spectroscopy. Am. Mineral. 1991, 76, 8–26. [Google Scholar]
- Muñoz, F.; Sánchez-Muñoz, L. The glass-forming ability explained from local structural differences by NMR between glasses and crystals in alkali metaphosphates. J. Non-Cryst. Solids 2019, 503, 94–97. [Google Scholar] [CrossRef]
- Wright, A.C. Borate structures: Crystalline and vitreous. Phys. Chem. Glasses: Eur. J. Glass Sci. Technol. B 2010, 51, 1–39. [Google Scholar]
- Vogel, W. Glass Chemistry, 2nd ed.; Springer: Berlin/Heidelberg, Germany, 1994. [Google Scholar]
- Stebbins, J.F.; Zhao, P.; Kroeker, S. Non-bridging oxygens in borate glasses: Characterization by 11B and 17O MAS and MQMAS NMR. Solid State Nuclear Magn. Reason. 2000, 16, 9–19. [Google Scholar] [CrossRef]
- Marezio, M.; Plettinger, H.A.; Zachariasen, W.H. The bond lengths in the sodium metaborate structure. Acta Crystallogr. 1963, 16, 594–595. [Google Scholar] [CrossRef]
- Kahr, B.; McBride, J.M. Optically anomalous crystals. Angew. Chim. 1992, 31, 1–26. [Google Scholar] [CrossRef]
- Shtukenberg, A.; Punin, Y.O. Optically Anomalous Crystals; Springer: Dordrecht, The Netherlands, 2007. [Google Scholar]
- Mallard, E. Explication des phénomènes optiques anomaux. Ann. Mines 1876, 10, 60–196. [Google Scholar]
- Foord, E.E.; Mills, B.A. Biaxiality in “isometric” and “diametric” crystals. Am. Mineral. 1978, 63, 316–325. [Google Scholar]
- Scandale, E.; Lucchesi, S.; Graziani, G. Optical anomalies of beryl crystals. Phys. Chem. Miner. 1984, 11, 60–66. [Google Scholar] [CrossRef]
- Sanchez-Munoz, L.; Sobrados, I.; Sanz, J.; Diez, V.; Santos, J.I.; Garcia-Guinea, J.; Pezzotta, F.; Brito Barreto, S.; Gan, Z. NMR crystallography of beryl minerals at 9.4 T and 19.6 T. Acta Crystallogr. A-Found. Adv. 2018, 74, E243–E244. [Google Scholar] [CrossRef]
- Bragg, W.L.; West, T.J. The structure of beryl Be3Al2Si6O18. Proc. Royal Soc. London Series A Contain. Papers Math. Phys. Character 1926, 111, 691–714. [Google Scholar]
- Artioli, G.; Rinaldi, R.; Stahl, K.; Zanazzi, P.F. Structure refinements of beryl by single-crystal neutron and X-ray diffraction. Am. Mineral. 1993, 7, 762–768. [Google Scholar]
- Hawthorne, F.C.; Černý, P. The alkali-metal positions in Cs-Li beryl. Can. Mineral. 1977, 15, 414–421. [Google Scholar]
- Youngman, R.E.; Smith, C.M. Multinuclear NMR studies of mixed Ca1−xSrxF2 crystals. Phys. Rev. B 2008, 78, 014112. [Google Scholar] [CrossRef]
- Klinowski, J.; Ramdas, S.; Thomas, J.M. A re-examination of Si, Al ordering in zeolite NaX and NaY. J. Chem. Soc. Faraday Trans. 1982, 78, 1025–1050. [Google Scholar] [CrossRef]
- Florian, P.; Veron, E.; Green, T.F.; Yates, J.R.; Massiot, D. Elucidation of the Al/Si ordering in gehlenite Ca2Al2SiO7 by combined 29Si and 27Al NMR spectroscopy/quantum chemical calculations. Chem. Mater. 2012, 24, 4068–4079. [Google Scholar] [CrossRef]
- Loewenstein, W. The distribution of aluminum in the tetrahedra of silicates and aluminates. Am. Mineral. 1954, 39, 92–96. [Google Scholar]
- Phillips, B.L.; Xu, H.; Heaney, P.; Navrostsky, A. 29Si and 27Al MAS-NMR spectroscopy of β-eucryptite (LiAlSiO4): The enthalpy of Si,Al ordering. Am. Mineral. 2000, 85, 181–188. [Google Scholar] [CrossRef]
- Herrero, C.P.; Gregorkiewitz, M.; Sanz, J.; Serratosa, J.M. 29Si MAS-NMR spectroscopy of mica-type silicates: Observed and predicted distribution of tetrahedral Al-Si. Phys. Chem. Miner. 1987, 15, 84–90. [Google Scholar] [CrossRef]
- Herrero, C.P.; Sanz, J.; Serratosa, J.M. Dispersion of charge deficits in a tetrahedral sheet of phyllosilicates: Analysis from silicon-29 NMR spectra. J. Phys. Chem. 1989, 93, 4311–4315. [Google Scholar] [CrossRef]
- Dempsey, E.; Kühl, G.H.; Olson, D.H. Variation of the lattice parameter with aluminum content in synthetic sodium faujasites. Evidence for ordering of the framework ions. J. Phys. Chem. 1969, 73, 387–390. [Google Scholar] [CrossRef]
- Rogers, A.F. Orthoclase-bearing veins from Rawhide, Nevada, and Weehawken, New Jersey. Econ. Geol. 1911, 6, 790–798. [Google Scholar] [CrossRef]
- Solé, J.; Pi-Puig, T.; Ortega-Rivera, A. A mineralogical, geochemical, and geochronological study of ‘valencianite’ from La Valenciana mine, Guanajuato, Mexico. Minerals 2021, 11, 741. [Google Scholar] [CrossRef]
- Laves, F. The lattice and twinning of microcline and other potash feldspars. J. Geol. 1950, 58, 548–571. [Google Scholar] [CrossRef]
- Laves, F. Phase relations of the alkali feldspars: I. Introductory remarks. J. Geol. 1952, 60, 436–450. [Google Scholar] [CrossRef]
- Laves, F. Phase relations of the alkali feldspars. II. The stable and pseudo-stable phase relations in the alkali feldspar system. J. Geol. 1952, 60, 549–574. [Google Scholar] [CrossRef]
- Laves, F.; Goldsmith, J.R. Polymorphism, order, disorder, diffusion and confusion in the feldspars. Cursillos Y Conf. 1961, 7, 71–80. [Google Scholar]
- Laves, F. The growing field of mineral structures. In Fifty Years of X-ray Diffraction; Springer: Boston, MA, USA, 1962; pp. 174–189. [Google Scholar]
- Laves, F. Domain and deformation textures in plagioclase and their investigation by photo-emission-electron-microscopy (PEEM) and by transmission electron microscopy. In The Feldspars; MacKenzie, W., Zussman, J., Eds.; Manchester University Press: Manchester, UK, 1974; pp. 536–550. [Google Scholar]
- Bambauer, H.U.; Krause, C.; Kroll, H. TEM investigation of the sanidine/microcline transition across metamorphic zones: The K feldspar varieties. Eur. J. Mineral. 1989, 1, 47–58. [Google Scholar] [CrossRef]
- Tanner, L.E.; Schryvers, D.; Shapiro, S.M. Electron microscopy and neutron scattering studies of premartensitic behavior in ordered Ni-Al β2 phase. Mater. Sci. Eng. A 1990, 127, 205–213. [Google Scholar] [CrossRef]
- Krekels, T.; Van Tendeloo, G.; Broddin, D.; Amelinckx, S.; Tanner, L.; Mehbod, M.; Deltour, R. Tweed structure of Fe-doped YBa2Cu3O7−δ. Phys. C Supercond. 1991, 173, 361–376. [Google Scholar] [CrossRef]
- Putnis, A. The distortion index in anhydrous Mg-cordierite. Contrib. Mineral. Petrol. 1980, 74, 135–141. [Google Scholar] [CrossRef]
- Xu, H.; Veblen, D.R.; Luo, G. A new commensurate modulated structure in orthoclase. Acta Crystallogr. 1995, A51, 53–60. [Google Scholar] [CrossRef]
- Barth, T.F.W. Polymorphic phenomena and crystal structure. Am. J. Sci. 1934, 127, 273–286. [Google Scholar] [CrossRef]
- Jones, J.B.; Taylor, W.H. The structure of orthoclase. Acta Crystallogr. 1961, 14, 443–456. [Google Scholar] [CrossRef]
- Brown, W.L.; Parsons, I. Alkali feldspars: Ordering rates, phase transformations and behaviour diagrams for igneous rocks. Mineral. Mag. 1989, 53, 25–42. [Google Scholar] [CrossRef]
- McConnell, J.D.C. Electron optical study of effects associated with partial inversion in a silicate phase. Philos. Mag. A J. Theor. Exp. Appl. Phys. 1965, 11, 1289–1301. [Google Scholar] [CrossRef]
- Nissen, H.U. Direct electron-microscopic proof of domain texture in orthoclase (KAlSi3O8). Contrib. Mineral. Petrol. 1967, 16, 354–360. [Google Scholar] [CrossRef]
- McLaren, A.C.; Fitz Gerald, J.D. CBED and ALCHEMI investigation of local symmetry and Al, Si ordering in K-feldspars. Phys. Chem. Miner. 1987, 14, 281–292. [Google Scholar] [CrossRef]
- Sánchez-Munoz, L.; Nistor, L.; Van Tendeloo, G.; Sanz, J. Modulated structures in KAlSi3O8: A study by high resolution electron microscopy and 29Si MAS-NMR spectroscopy. Microscopy 1998, 47, 17–28. [Google Scholar] [CrossRef]
- Sánchez-Muñoz, L.; García-Guinea, J.; Beny, J.M.; Rouer, O.; Campos, R.; Sanz, J.; De Moura, O.J. Mineral self-organization during the orthoclase-microcline transformation in a granite pegmatite. Eur. J. Mineral. 2008, 20, 439–446. [Google Scholar] [CrossRef]
- Sánchez-Munoz, L.; Garcia-Guinea, J.; Zagorsky, V.Y.; Juwono, T.; Modreski, P.J.; Cremades, A.; Van Tendeloo, G.; de Moura, O.J. The evolution of twin patterns in perthitic K-feldspar from granitic pegmatites. Can. Mineral. 2012, 50, 989–1024. [Google Scholar] [CrossRef]
- Laves, F.; Hafner, S. Infrared absorption effects, nuclear magnetic resonance and structure of feldspars. Nor. Geol. Tidsskr. 1962, 42, 57–72. [Google Scholar]
- Thompson, J.B. Biopyriboles and polysomatic series. Am. Mineral. 1978, 63, 239–249. [Google Scholar]
- Ferraris, G.; Makovicky, E.; Merlino, S. Crystallography of Modular Materials; Oxford University Press on Demand: Oxford, UK, 2004; Volume 15. [Google Scholar]
- Merlino, S. X-ray diffraction and the development of the mineral crystal chemistry. Rend. Lincei 2013, 24, 33–46. [Google Scholar] [CrossRef]
- Korekawa, M.; Jagodzinski, H. Die Satellitenreflexe des Labradorits. Schweiz. Mineral. Petrog. Mitt. 1967, 47, 269–278. [Google Scholar]
- Jagodzinski, H. Determination of modulated feldspars structures. Bull. De Minéralogie 1984, 107, 455–466. [Google Scholar] [CrossRef]
- Boysen, H.; Kek, S. The modulated structure of labradorite. Z. Für Krist.-Cryst. Mater. 2015, 230, 23–35. [Google Scholar] [CrossRef]
- Laves, F.; Nissen, H.U.; Bollmann, W. On schiller and submicroscopical lamellae of labradorite,(Na,Ca)(Si,Al)3O8. Naturwissenschaften 1965, 52, 427–428. [Google Scholar] [CrossRef]
- Wenk, H.R.; Joswig, W.; Tagai, T.; Korekawa, M.; Smith, B.K. The average structure of An62–66 labradorite. Am. Mineral. 1980, 65, 81–95. [Google Scholar]
- Jin, S.; Xu, H.; Wang, X.; Zhang, D.; Jacobs, R.; Morgan, D. The incommensurately modulated structures of volcanic plagioclase: Displacement, ordering and phase transition. Acta Crystallogr. Sect. B Struct. Sci. Cryst. Eng. Mater. 2019, 75, 643–656. [Google Scholar] [CrossRef]
- Fitz Gerald, J.D.; Parise, J.B.; MacKinnon, I.D. Average structure of an An48 plagioclase from the Hogarth Ranges. Am. Mineral. 1986, 71, 1399–1408. [Google Scholar]
- Kroll, H. Lattice parameters and determinative methods for plagioclase and ternary feldspars. Rev. Mineral. 1983, 2, 101–119. [Google Scholar]
- Chao, S.H.; Taylor, W.H. Isomorphous replacement and superlattice structures in the plagioclase feldspars. Proc. R. Soc. London A 1940, 176, 76–87. [Google Scholar]
- Xu, H. Direct observation of Ca-Na ordering and structure polarity in Ca-rich intermediate plagioclase feldspar with incommensurate modulated structure. Am. Mineral. 2015, 100, 510–515. [Google Scholar] [CrossRef]
- Grove, T.L. A periodic antiphase structure model for the intermediate plagioclases (An33 to An75). Am. Mineral. 1977, 62, 932–941. [Google Scholar]
- McConnell, J.D.C. The origin and characteristics of the incommensurate structures in the plagioclase feldspars. Can. Mineral. 2008, 46, 1389–1400. [Google Scholar] [CrossRef]
- Kirkpatrick, R.J.; Carpenter, M.A.; Yang, W.H.; Montez, B. 29Si magic-angle NMR spectroscopy of low-temperature ordered plagioclase feldspars. Nature 1987, 325, 236–238. [Google Scholar] [CrossRef]
- Jin, S.; Xu, H. Study on variations of incommensurately modulated labradorite feldspars with different cooling histories. Am. Mineral. 2017, 102, 1328–1339. [Google Scholar] [CrossRef]
- Kirkpatrick, R.J.; Smith, K.A.; Schramm, S.; Turner, G.; Yang, W.H. Solid-state nuclear magnetic resonance spectroscopy of minerals. Annu. Rev. Earth Planet. Sci. 1985, 13, 29. [Google Scholar] [CrossRef]
- Cliff, G.; Champness, P.E.; Nissen, H.U.; Lorimer, G.W. Analytical electron microscopy of exsolution lamellae in plagioclase feldspars. In Electron Microscopy in Mineralogy; Springer: Berlin/Heidelberg, Germany, 1976; pp. 258–265. [Google Scholar]
- Miura, Y.; Tomisako, T. Ion microprobe mass analysis of exsolution lamellae in labradorite feldspar. Am. Mineral. 1978, 63, 584–590. [Google Scholar]
- Jin, S.; Xu, H.; Lee, S. Revisiting the Bøggild intergrowth in iridescent labradorite feldspars: Ordering, kinetics, and phase equilibria. Minerals 2021, 11, 727. [Google Scholar] [CrossRef]
- Willaime, C.; Brown, W.L.; Gandais, M. An electron-microscopic and X-ray study of complex exsolution textures in a cryptoperthitic alkali feldspar. J. Mater. Sci. 1973, 8, 461–466. [Google Scholar] [CrossRef]
- Brown, W.L.; Parsons, I. Exsolution and coarsening mechanisms and kinetics in an ordered cryptoperthite series. Contrib. Mineral. Petrol. 1984, 86, 3–18. [Google Scholar] [CrossRef]
- Stewart, D.; Wright, T. Al/Si order and symmetry of natural potassic feldspars, and the relationship of strained cell parameters to bulk composition. Bull. Mineral. 1974, 97, 356–377. [Google Scholar] [CrossRef]
- Ribbe, P.H. The structure of a strained intermediate microcline in cryptoperthitic association with twinned plagioclase. Am. Mineral. 1979, 64, 402–408. [Google Scholar]
- Kroll, H.; Ribbe, P.H. Lattice parameters, composition and Al, Si order in alkali feldspars. Rev. Mineral. 1983, 2, 57–99. [Google Scholar]
- Griffen, D.T.; Johnson, B.T. Strain in triclinic alkali feldspars: A crystal structure study. Am. Mineral. 1984, 69, 1072–1077. [Google Scholar]
- Sánchez-Muñoz, L.; Del Campo, A.; Fernández, J.F. Symmetry constraints during the development of anisotropic spinodal patterns. Sci. Rep. 2016, 6, 1–10. [Google Scholar]
- Harder, H. Moonstone mining in Sri Lanka: New aspects. J. Gemmol. 1992, 23, 25–35. [Google Scholar] [CrossRef]
- Nickel, E.H. The definition of a mineral. Can. Mineral. 1995, 33, 689–690. [Google Scholar]
- Schmalzried, H. On the equilibration of solid phases. Some thoughts on Ostwald’s contributions. Z. Phys. Chem. 2003, 217, 1281–1302. [Google Scholar] [CrossRef]
- Blasi, A.; Brajkovic, A.; De Pol Blasi, C.; Foord, E.; Martin, R.; Zanazzi, P.F. Structure refinement and genetic aspects of a microcline overgrowth on amazonite from Pikes Peak batholith, Colorado, USA. Bull. Minéralogie 1984, 107, 411–422. [Google Scholar] [CrossRef]
- Kouvatas, C.; Kanwal, N.; Trebosc, J.; Roiland, C.; Delevoye, L.; Ashbrook, S.E.; Le Fur, E.; Le Pollès, L. Rationalization of solid-state NMR multi-pulse decoupling strategies: Coupling of spin I= ½ and half-integer quadrupolar nuclei. J. Magn. Reson. 2019, 303, 48–56. [Google Scholar] [CrossRef]
- Phillips, B.L.; Kirkpatrick, R.J.; Hovis, G.L. 27Al, 29Si, and 23Na MAS NMR study of an Al, Si ordered alkali feldspar solid solution series. Phys. Chem. Miner. 1988, 16, 262–275. [Google Scholar] [CrossRef]
- Kôzu, S.; Endô, Y. X-ray analysis of adularia and moonstone and the influence of temperature on the atomic arrangement of these minerals. Sci. Rep. Tokyo Imp. Univ. Ser. 3 1921, 1, 1–17. [Google Scholar]
- Yagi, K. Memorial of Shukusuké Kôzu. Am. Mineral. 1956, 41, 592–597. [Google Scholar]
- Jagodzinski, H. Antiquated Crystallography? Z. Krist.-Cryst. Mater. 2002, 217, 324–325. [Google Scholar] [CrossRef]
- Lifshitz, R. The rebirth of crystallography. Z. Krist.-Cryst. Mater. 2002, 217, 342–343. [Google Scholar] [CrossRef]
- Shechtman, D.; Blech, I.; Gratias, D.; Cahn, J.W. Metallic phase with long-range orientational order and no translational symmetry. Phys. Rev. Lett. 1984, 53, 1951–1953. [Google Scholar] [CrossRef] [Green Version]
- Welberry, T.R. Diffuse X-ray Scattering and Models of Disorder, IUCr Monographs on Crystallography 16; Oxford Univ. Press: Oxford, UK, 2004. [Google Scholar]
- Bragg, W.L.; Nye, J.F. A dynamic model of a crystal structure. Proc. R. Soc. London. Ser. A. Math. Phys. Sci. 1949, 190, 474–481. [Google Scholar]
- Wright, A.C. Silicate glass structure: Toward a working hypothesis for the 21st century. Phys. Chem. Glasses Eur. J. Glass Sci. Technol. B 2020, 61, 57–76. [Google Scholar]
- Wright, A.C.; Vedishcheva, N.M. The structure of glass: An opposite viewpoint. Phys. Chem. Glasses Eur. J. Glass Sci. Technol. B 2021, 62, 84–88. [Google Scholar]
- Wegner, S.; Van Wüllen, L.; Tricot, G. The structure of aluminophosphate glasses revisited: Application of modern solid state NMR strategies to determine structural motifs on intermediate length scales. J. Non-Cryst. Solids 2008, 354, 1703–1714. [Google Scholar] [CrossRef]
- Paraschiv, G.L.; Muñoz, F.; Jensen, L.R.; Yue, Y.; Smedskjaer, M.M. Impact of nitridation of metaphosphate glasses on liquid fragility. J. Non-Cryst. Solids 2016, 441, 22–28. [Google Scholar] [CrossRef]
- Muñoz, F.; Jiménez-Riobóo, R.J.; Balda, R. Chemical and structural heterogeneities in Nd-doped oxynitride phosphate laser glasses. J. Alloy. Compd. 2020, 816, 152657. [Google Scholar] [CrossRef]
- Waldron, K.I.M.; Parsons, I.; Brown, W.L. Solution-redeposition and the orthoclase-microcline transformation: Evidence from granulites and relevance to 18O exchange. Mineral. Mag. 1993, 57, 687–695. [Google Scholar] [CrossRef]
- Moore, C.E. Ionization Potentials and Ionization Limits Derived from the Analyses of Optical Spectra; NSRDS-NBS 34, US Department of Commerce: Washington, DC, USA, 1970.
- Gasperin, M. Structure crystalline de RbAlSi3O8. Acta Cryst. 1971, B27, 854–855. [Google Scholar] [CrossRef] [Green Version]
- Smith, J.V.; Artioli, G.; Kvick, Å. Low albite, NaAlSi3O8: Neutron diffraction study of crystal structure at 13 K. Am. Mineral. 1986, 71, 727–733. [Google Scholar]
- Angel, R.J.; Carpenter, M.A.; Finger, L.W. Structural variation associated with compositional variation and order−disorder behavior in anorthite-rich feldspars. Am. Mineral. 1990, 75, 150–162. [Google Scholar]
- Purton, J.; Catlow, C.R.A. Computer simulation of feldspar structures. Am. Mineral. 1990, 75, 1268–1273. [Google Scholar]
- Shannon, R.D. Revised effective ionic radii and systematic studies on the interatomic distances in halides and chalcogenides. Acta Cryst. 1976, A32, 751–767. [Google Scholar] [CrossRef]
- Gibbs, G.V.; Ross, N.L.; Cox, D.F.; Rosso, K.M. Insights into the crystal chemistry of Earth materials rendered by electron density distributions: Pauling’s rules revisited. Am. Mineral. 2014, 99, 1071–1084. [Google Scholar] [CrossRef]
- Gibbs, G.V.; Hawthorne, F.C.; Brown, G.E. Pauling’s rules for oxide-based minerals: A re-examination based on quantum mechanical constraints and modern applications of bond-valence theory to Earth materials. Am. Mineral. 2022, 107, 1219–1248. [Google Scholar] [CrossRef]
- Hawthorne, F.C. Proof that a dominant endmember formula can always be written for a mineral or a crystal structure. Can. Mineral. 2021, 59, 159–167. [Google Scholar] [CrossRef]
- Hawthorne, F.C.; Mills, S.J.; Hatert, F.; Rumsey, M.S. Ontology, archetypes and the definition of ‘mineral species’. Mineral. Mag. 2021, 85, 125–131. [Google Scholar] [CrossRef]
- Parsons, I.; Lee, M.R. Minerals are not just chemical compounds. Can. Mineral. 2005, 43, 1959–1992. [Google Scholar] [CrossRef]
Figure 1.
The 29Si and 27Al MAS NMR spectra of the KAlSi3O8 gel in comparison with those in sanidine. (a) The 29Si MAS NMR spectrum at 9.4 T and the simulation by a Gaussian curve with c.g. ~ −96 ppm and lw = 18 ppm of sample KAlSi3O8 gel, with a profile in dashed curve of the 29Si spectrum at 9.4 T of sanidine in specimen K-713r in red. (b) The 27Al MAS NMR spectrum at 9.4 T and the simulation with a Gaussian curve with c.g. = 53.5 ppm and lw = 15.4 ppm, of sample KAlSi3O8 gel, with a profile in dashed curve of the 27Al spectrum of sanidine in specimen K-714r, (c) The 27Al MAS NMR spectrum at 35.2 T of specimen K-713-r, the spectrum can be simulated with a single Gaussian curve (sim 1 in red) at c.g. = 61.6 ppm and lw = 4.7 ppm, but also with two Gaussian curves (sim 2 in green) at c.g. = 62.5 ppm and lw = 3.8 ppm and area 50.1% for T2 site, and at c.g. = 60.6 ppm and lw = 3.8 ppm and area 49.9 % for T1 site. The 27Al MAS NMR spectra at 35.2 T were obtained using a 3.2 mm rotor, υr = 12.5 kHz, π/2 at 20.4 µs and 218 W; for the experimental conditions of the 29Si and 27Al MAS NMR at 9.4 T see ref [4].

Figure 3.
31P MAS NMR spectra of crystalline potassium metaphosphate, c-KPO3, and as quenched from the melt vitreous sample, v-KPO3. Two main resonances appear at ca. −18 and −20 ppm, attributed to the two crystallographic sites of phosphorus in c-KPO3, as well as in v-KPO3. Very small signals are also visible at lower fields, −10 and 0 ppm; they are attributed to small amounts pyrophosphate and orthophosphate species, respectively. Reprinted with permission from Ref [36]. 2019, Elsevier. Experimental details for the acquisition of the 31P MAS NMR spectra are given in [36].

Figure 6.
The 27Al NMR MAS spectra at 19.6 T of beryl-group minerals. (a,b) Specimen Elba or alkali-poor beryl shows a well-developed quadrupolar shape in the STMAS profile, with the shape of the central transition 1/2 (green and inset up to the right) and the other two transitions 5/2 (red) and 3/2 (blue) in a satellite line as inset up to the left. Three Al sites, AlI, AlII and AlIII, are resolved in (b). (c,d) Specimen Araçuaí or alkali-rich beryl does not have a defined quadrupolar shape in the STMAS profile, with the same transitions and the same three Al sites, but also an additional AlIV site (see explanations in text). Experimental conditions: νr = 10 kHz, using a 1.0 μs excitation pulse, 4 mm rotor, recycling delay 5 s.

Figure 7.
The 9Be NMR MAS spectra at 19.6 T of beryl-group minerals, obtained using a 3.2 mm rotor, υr = 10 kHz. (a–c) Specimen Elba or alkali-poor beryl shows a well-developed quadrupolar shape in the STMAS profile, with the shape of the central transition 1/2, green in (b), and the transition 3/2 red in (c). Two sites for Be atoms are resolved, BeI and BeII in (b). (d–f) Specimen Araçuaí or alkali-rich beryl has a less defined quadrupolar shape in the STMAS profile, with the same transitions and the same sites for Be atoms (see explanations in text). Experimental conditions: spin rate νr = 10 kHz, using a 1.0 μs excitation pulse, 4 mm rotor, recycling delay 10 s.

Figure 8.
Left, specimen AGM, “valencianite” from Mina Valenciana, Guanajuato, México, in Museo Nacional de Ciencias Naturales (MNCN-CSIC). Right, electron-diffraction pattern along the [001] zone axis, showing the round shape of the diffraction spots. Diffuse scattering, typical of both orthoclase and (intermediate or strained) microcline, is absent, despite of chemical disorder. The electron-diffraction pattern was obtained with a JEOL 4000EX instrument at 400 kV.

Figure 9.
Powder XRD patterns of four specimens of K-rich feldspar between 20 and 32° 2θ (CuKα1 radiation) are shown with (hkl) values of the main Bragg diffraction maxima. Insets show the regions in which the (130)–(10) peak splitting between 23.3 and 23.7° 2θ can appear, and the (131)–(11) peak splitting between 29.6 and 30.0° 2θ. (a) Specimen K-713r (Or100) is an ion-exchanged sample using the Eifel sanidine (Germany) as a starting material (see [4] for details), with (hkl) values in green, corresponding to the sanidine mineral species with C2/m symmetry, as in the precursor, and additional peaks (*) from the KBr salt used in the ion-exchange experiment. (b) Specimen ASGS (Or90.6Ab9.4) from St. Gotthard (Switzerland) has an X-ray pattern typical of orthoclase. (c) Specimen 1123 (Or92.8Ab7.2) from Valais (Switzerland) has an X-ray pattern mainly consistent with that of orthoclase, i.e., without peak splitting in most of the (hkl), (hk0) and (0kl) maxima, but with a broad (130) peak and a heterogeneous character with visible peak splitting in the (131)–(11), consistent with a triclinic character as in the K-feldspar variety called “X-ray intermediate microcline”. Incipiently exsolved Na-feldspar is detected by the (002) peak in red. (d) Specimen AGM (Or97.5Ab2.5) from Guanajuato (Mexico) has an X-ray pattern distinct from the previous mineral species; it corresponds to “valencianite”, which shows (hkl) peaks in blue with incipient peak splitting, in comparison with those in “X-ray low microcline”. The experimental details of XRD patterns are in [4].

Figure 10.
The MAS NMR spectra of “valencianite” KAlSi3O8 (Or97.5Ab2.5) in specimen AGM, exp are the experimental spectra and sim are the simulated spectra, indicating the line positions of the resolved two or four T framework tetrahedral sites for Al and Si atoms, as well as two M cavity sites for K and Na atoms.: (a) the 29Si at 9.4 T, for T1O and T1m sites as dotted curves, T2O and T2m sites as dashed curves; (b) the 27Al at 35.2 T, for T1 site in dotted curve, and T2 site in dashed curve; (c) 39K at 19.6 T for M1 site in dotted curve, and M2 site in dashed curve, and (d) 23Na at 19.6 T for M1 site in dotted curve, and M2 site in dashed curve. The simulated area in the 29Si spectrum is ca. 86% of the total signal, and additional signals could be located at −91.6 ppm (~6.7%) and −104.4 ppm (~7.7%). The asterisk (*) indicates the resonance from quartz SiO2 at –107.1 ppm. The c.g. of the 27Al spectrum is at 62.1 ppm. See explanations in text and Table 5 for the deconvolution of the signals. The details of the experimental procedure for (a), (b,d) are given in [4]; for the 27Al spectrum at 35.2 T in (c), see Figure 1.

Figure 11.
The 27Al STMAS NMR (a) and 27Al MQMAS NMR (b) at 19.6 T of sanidine in specimen K-713r Or100Ab0.0, “valencianite” in specimen AGM Or97.5Ab2.5, orthoclase in specimen 1123 Or92.8Ab7.2, and (low) microcline in specimen 9544 Or94.8Ab5.2. In the MQMAS, the MAS spectra are on top as a projection the F2 axis, and the one-dimension spectra are at the right side as a projection on the Fiso isotropic dimension, where the second-order quadrupolar broadening effects are considerably attenuated. The red cross is the position of the site for Al atoms in T1O (4Si,0Al) in the fully ordered microcline from NMR or the “X-ray low microcline” variant by RSTs.

Figure 12.
(a) An SAED pattern and (b) a TEM image at high resolution along the [001] zone axis of orthoclase specimen ASGS, show diffuse streaks instead of diffraction spots and the tweed modulation with a low amplitude. The electron-diffraction patterns and the electron-microscopy images were obtained with a JEOL 4000EX instrument at 400 kV [77].

Figure 13.
(a) An SAED pattern and (b) a TEM image of specimen 5963 at low resolution along the [001] zone axis shows diffuse streaks at diffraction spots and also spot-splitting at high values of (hkl), as for instance with (480). The inset in (b) is a high-magnification image of the low-resolution tweed pattern; it shows crossovers as bright dots at the point of intersection between units. The electron-diffraction patterns and the electron-microscopy images were obtained in a JEOL 4000EX instrument at 400 kV [77]. Reprinted with permission from Ref. [79]. 2012, The Canadian Mineralogist.

Figure 14.
(a) High-resolution electron-microscopy image along the [001] zone axis in specimen 1123, with bright dots from different types of T rings. (b) High-resolution and high-magnification digital image from the upper right region of (a); three types of structural channels are marked with colors, as well as the a and b dimensions (see explanation in text), compared to the channels expected in the monoclinic lattice model in (c) by using XRD data from [72]. The K atoms are shown in red, T1 sites in green, T2 sites in dark blue, oxygen atoms in A1 site in pink, in A2 in orange, the rest in yellow. The electron-diffraction patterns and the electron-microscopy images were obtained with a JEOL 4000EX instrument at 400 kV, as explained in detail in [77].

Figure 15.
(a) The 29Si MAS NMR spectra at 9.4 T of specimens ASGS and K-ASGS with two simulations, sim L (Loewenstein restriction) and sim L+CD when additional charge dispersion (CD) is also considered, with four signals from the tour T sites in the C space-group symmetry. The resonances of the simulation that do not appear in the experimental spectra are indicated by *. (b) The 27Al spectrum of specimen K-ASGS and the simulated spectrum using the same restrictions as in the 29Si spectrum (see explanation in text). The four Voigt curves for xG/(1 − x)L = 0.7 correspond to the four T sites of the C space-group symmetry. The experimental procedure for the 27Al spectrum at 35.2 T is as in Figure 1; for the 29Si spectrum is as in ref [4].

Figure 16.
The 29Si MAS NMR spectra at 9.4 T in several specimens of labradorite between An50 and An57. The 29Si spectra were recorded at υr = 14.3 kHz in a 4 mm rotor, using a 0.5 μs excitation pulse, and a recycle delay of 0.75 s.
Figure 16.
The 29Si MAS NMR spectra at 9.4 T in several specimens of labradorite between An50 and An57. The 29Si spectra were recorded at υr = 14.3 kHz in a 4 mm rotor, using a 0.5 μs excitation pulse, and a recycle delay of 0.75 s.

Figure 17.
(a) The 27Al{29Si} HMQC NMR spectrum of specimen IN1 of labradorite An50, in which two compositions are recorded along the 27Al axis at 48 ppm for plagioclase p1 (blue) and at 53 ppm for plagioclase p2 (red). (b) The 29Si spectrum for a section at 53 ppm to show the spectral component of the p2 plagioclase ca. ~An40, with six Voigt curves at xG/(1 − x)L = 0.5. (c) The 29Si spectrum for a section at 48 ppm shows the spectral component of the p1 plagioclase ca. ~An50, with six Voigt curves at xG/(1 − x)L = 0.5. (d) Deconvolution of the 29Si MAS NMR spectrum by using 50% p1 + 50% p2 (see Table 7), with slight variations in the position and intensities of the signals with respect to the simulation of the sections in (b,c) from the 27Al{29Si} HMQC NMR spectrum. The spectrum was recorded at υr = 14 kHz in a 4 mm rotor, using a {9.0}13.5 μs excitation pulse, and a recycle delay of 1.0 s. For additional information about this type of experiment, see [52].

Figure 18.
(a) BSE image of the cryptoperthitic texture in specimen SRe1b in a (001) section, with Na lamellae in light gray and K-rich lamellae in dark gray of average thickness of about 30 nm, resolved by using a high-resolution field-emission SEM equipment (Thermo Scientific Apreo 2, HV at 1.5 kV, 13 pA, WD = 4.0 mm, HFW = 1.27 µm, and at ×100,000 magnification). (b) Optical micrograph close to the parallel position in a (001) section in specimen SR31, using transmitted light and parallel polarizers using a ×100 oil objective, in a Nikon Eclipse LV100 POL microscope. (c) BSE image of the crypto- and microperthitic texture of specimen SR31, with a contrast between the two compositional lamellae similar to the previous one, using a FEI Inspect SEM microscope, HV at 30.0 kV, WD = 7.9 mm, spot at 4.6, at ×5000 magnification. (d) BSE image of the crypto- and microperthitic texture of specimen SR9, using the same experimental conditions as in (c), at ×8000 magnification.

Figure 19.
Powder XRD patterns of the moonstone specimens (SRe1b, SR31, SR9), compared to that of orthoclase in specimen K-ASGS, in three regions of the patterns, i.e., between 20 and 26° 2θ, 27.2 and 28.2° 2θ, and 29 and 32° 2θ. (a) Specimen K-ASGS (Or100) is an ion-exchanged sample from specimen ASGS as a precursor, with (hkl) peaks in green from a monoclinic C2/m space-group symmetry. (b) Specimen SRe1b has been indexed with (hkl) peaks from a monoclinic K-rich feldspar in green and from a monoclinic Na-rich feldspar in violet; the reflection (11) is shared by the two components, as it also is in specimen SR31. (c) Specimen SR31 has been indexed with (hkl) peaks from a monoclinic K-rich feldspar in green, and a triclinic Na-feldspar with low obliquity in red. (d) Specimen SR9 has been indexed with (hkl) reflections from two triclinic feldspars, in red for the Na-feldspar and in blue for the K-feldspar.

Figure 20.
The NMR spectra of the three specimens of moonstone (NMR parameters in Table 9). (a) The 29Si NMR spectrum of specimen SRe1b at 9.4 T has been simulated with two phases, one with three resonances from Na-feldspar corresponding to Si atoms in T1m, T2O and T2m sites, the other with four resonances for K-feldspars related to Si atoms in T1O, T1m, T2O and T2m sites. (b) The 27Al NMR spectrum of specimen SRe1b at 35.2 T has been simulated with three resonances, one broad peak from the K-feldspar and two resonances from the Na-feldspar. (c) The 29Si NMR spectrum of specimen SR31 at 9.4 T has been simulated with two phases as in (a). (d) The 27Al NMR spectrum of specimen SR31 at 35.2 T can be deconvoluted by using a single resonance from the Na-feldspar, an asymmetric signal composed of four resonances like in orthoclase for the K-feldspar, and an additional resonance attributed to strain in the K-feldspar component. (e) The 29Si NMR spectrum of specimen SR9 at 9.4 T has been simulated with the same two phases (Na- and K-feldspar), each one with three resonances for Si atoms in T1m, T2O and T2m sites. (f) The 27Al NMR spectrum of specimen SR9 at 35.2 T has been deconvoluted into three resonances, two signals from K-feldspar, one from Al atoms at the T1O site and the other from structural strain, and one signal in Na-feldspar from Al atoms at the T1O site. All the resonances were simulated with Voigt curves at xG/(1 − x)L = 0.7. Dotted lines show the components of the Na-feldspar phase, and dashed lines show those of the K-feldspar phase; s are the resonances from structural strain; exp are used for the experimental spectra, and sim for the simulated spectra. Experimental procedure for the 27Al spectra at 35.2 T as in Figure 1; for the 29Si spectra as in ref [4].

Figure 21.
The 27Al MQMAS NMR spectra at 17.6 T of the three specimens of moonstone, the MAS spectra are on top as a projection the F2 axis, and the one-dimension spectra are at the right side as a projection on the Fiso isotropic dimension. (a) Specimen SRe1b with broad spectra in the two axes. (b) Deconvolution of the experimental spectrum (exp) in the Fiso dimension, simulated (sim) with three resonances as: the K-rich phase (dashed line in red) with δiso = 62.1 ppm, lw = 3.2 ppm and A = 52.5 %; the Na-rich phase (dotted lines in blue) with δiso = 63.5 ppm, lw = 2.2 ppm and A = 37.4 % for Al atoms in T1O site and δiso = 65.5 ppm, lw = 2.7 ppm and A = 10.1 % for strained sites. (c) Specimen SR31. (d) Specimen SR9. Red lines for the K-feldspar and blue lines for the Na-feldspar. Experimental conditions: νr = 30 kHz, νrf = 50 kHz, using a 0.5 μs excitation pulse, and a recycle delay of 0.5 s.

Figure 22.
The powder XRD patterns between 20 and 32° 2θ CuKα1 radiation of four specimens with chemical composition close to stoichiometry as end-members of the alkali feldspars, with (hkl) peaks in blue for “X-ray low microcline”, specimen 9544 in (a) and specimen 11924 in (b), both with triclinic C space-group symmetry, and with (hkl) diffraction maxima in red for “X-ray low albite”, specimens CJ1 in (c) and specimen CLBR in (d). Q represents quartz impurities in (a); * for impurities in (c); some Na-feldspar is detected in (a) by the (002) peak. The experimental conditions of the XRD patterns are described in [4].

Figure 23.
The 29Si MAS NMR spectra of K-feldspar in the “X-ray microcline” variant at 9.4 T. (a) Specimen 9544, spectral simulations require three components for Si atoms at T1m, T2O and T2M sites, rotor 4 mm, pulse 4 μs, νr = 10 kHz, recycling delay of 1800 s. (b) Specimen 11924, spectral simulations require three components (three doublets) for Si atoms at T1m, T2O and T2M sites, rotor 4 mm, pulse 0.5 μs, νr = 14 kHz, recycling delay of 45 s. See text and Table 11 for explanations.

Figure 24.
The 29Si MAS NMR spectra of Na-feldspar in the “X-ray albite” variant. (a) Single pulse spectrum in specimen CJ1 at 9.4 T, 4.0 mm rotor, using a recycle delay of 45 s, pulse 0.5 μs and νr = 14.3 kHz. (b) Single pulse spectrum in specimen CLBR at 9.4 T, 4.0 mm rotor, using a recycle delay of 90 s, pulse 0.5 μs and νr = 14.3 kHz. (c) 29Si SP-MAS NMR at 17.6 T in specimen CLBR, 4.0 mm rotor, using a recycle delay of 180 s, pulse 1.4 μs, and νr = 10 kHz. (d) 29Si{27Al} MP decoupling in specimen CLBR at 17.6 T, 4.0 mm rotor, using a recycle delay of 180 s, {90}30 μs, pulse 1.4 μs and νr = 10 kHz. (e) 29Si{27Al} 1D R-INEPT spectrum at 17.6 T, νr = 14 kHz, 4.0 mm rotor, recycle delay of 20 s, pulses {12.1}12.5 μs, νrf = {2.77}2.60 kHz. See text and Table 12 for explanations.

Figure 25.
(a) The 27Al MAS spectra (exp) of specimen 11924 of “X-ray low microcline” at 9.4 T (red) and at 35.2 T (black), with simulations (sim) as dotted curves below. (b) The 27Al MAS spectra (exp) of specimen CLBR of “X-ray low albite” at 9.4 T and υr = 12.8 kHz (red), at 17.6 T and υr = 30 kHz (green), at 19.6 T and υr = 10 kHz (blue) and at 35.2 T, υr = 12.5 kHz (black curve); * for the transition 3/2 recorded at 9.4 T in the two specimens; Al atoms in T1O site are recorded. See Figure 1 for the experimental conditions of the 27Al spectra at 35.2 T; ref. [4] for the spectra at 9.4 T; 4 mm rotor, pulses of 0.5 μs, νr = 10 kHz and a recycle delay of 2 s for the spectrum at 19.6 T; 4 mm rotor, pulses of 8 μs, νr = 30 kHz and a recycle delay of 30 s for the spectrum at 17.6 T.

Figure 26.
(a) The 39K MAS NMR spectrum of specimen 11924 at 19.6 T. The K atoms occupy a single M1 site, as inferred from the C lattice model of the “X-ray low microcline” variant of KAlSi3O8. (b) The 23Na MAS NMR spectrum of specimen CLBR at 9.4 T (red) and 19.6 T (blue) for Na atoms at a single M1 site, as inferred from the C lattice model of the “X-ray low albite” variant of NaAlSi3O8. See reference [4] for the experimental procedure for the spectra at 9.4 T and 19.6 T; νr = 10 kHz, recycle delay of 2 s, using a 3 μs excitation pulse and 4 mm rotor for the 23Na spectrum at 19.6 T.

Figure 27.
Relationship between the cation–oxygen distances of the cavity cations with their ionization energies, with values from [128]; (a) RbAlSi3O8 with a C2/m symmetry from [129]; KAlSi3O8 with low microcline C symmetry from [112]; NaAlSi3O8 with low albite C symmetry from [130]; CaAl2Si2O8 (An100 from Val Pesmeda, Monzoni Mountains, Italy) with primitive anorthite P symmetry from [131]. A single curve was obtained from the average of the four sites of Ca atoms. (b) The same applies to structures from computer simulations in [132]. For each linear plot, we provide the r value or regression coefficient and the x0 value; α is the line slope, and s.d. are the standard deviations. The effective ionic radii are for the expected number of oxygen atoms in the coordination polyhedron, from [133].

Table 1.
Diversity of order–disorder states found in glasses and minerals.
| Solid State Diversity by NMR | Glass and Mineral Examples | |
|---|---|---|
| I. Non-crystalline or amorphous structures | Highly disordered structures | KAlSi3O8 amorphous gels * |
| Chemically ordered structures | NaPO3-3x/2Nx glasses * | |
| Geometrically ordered structures | KPO3 glass * | |
| Chemically and geometrically ordered structures | NaBO2 glass * | |
| II. Long-range homogeneously disordered structures (mixed crystals or non-stoichiometric compounds and stoichiometric compounds or end-members) | Random structures | Ca1−xSrxF2 s.s. series Synthetic Gehlenite Ca2Al2SiO7 |
| Loewenstein structures | Synthetic β-spodumene LiAlSi2O6 Synthetic β-eucryptite s.s. series | |
| Charge-dispersed structures | Micas group s.s. series ”valencianite” KAlSi3O8 mineral * | |
| III. Heterogeneous crystalline intergrowths at the mesoscale (<50 nm) | Aperiodically modulated “tweed” structures | Orthoclase KAlSi3O8 mineral * |
| Periodically modulated composite structures | Labradorite (NaCaAl3Si5O16) Mineral * | |
| Coherent intergrowths of crystalline domains of two different phases at the mesoscale | Moonstone (K,Na)AlSi3O8 mineral * | |
| IV. Fully ordered and stoichiometric structures | End-members of the alkali feldspar o.d. series * | |
Note: * used in this work, in glasses and their devitrification crystalline products and mineral examples as order–disorder (o.d.) series and solid-solution (s.s.) series, particularly in the feldspar group of minerals.
Table 4.
Chemical composition of the two specimens of the beryl-group minerals used in Figure 5.
Table 4.
Chemical composition of the two specimens of the beryl-group minerals used in Figure 5.
| Specimens | Elba (Prismatic) | Araçuaí (Tabular) |
|---|---|---|
| SiO2 | 65.65 | 62.57 |
| Al2O3 | 18.87 | 18.32 |
| FeO | 0.21 | 0.43 |
| MnO | 0.04 | - |
| MgO | 0.02 | 0.02 |
| CaO | 0.01 | 0.01 |
| Na2O | 0.10 | 1.27 |
| K2O | 0.01 | 0.03 |
| Cs2O | 0.09 | 3.62 |
| BeO | 13.5 | 11.5 |
| Rb2O | - | - |
| Li2O | 0.08 | 1.90 |
| Total | 98.58 | 99.67 |
Note: These chemical compositions in wt.% were determined by EMPA (in four points), except for BeO and Li2O, which were established using Inductively Coupled Plasma-emission (ICP) spectrometry in a single aliquot for each specimen. Samples were dissolved in diluted hot hydrochloric acid and elemental analyses were performed by ICP spectrometry in a Thermo Jarrel Ash IRIS ADVANTAGE spectrometer. The experimental values obtained were not recalculated to give a 100% value; “-”: below the detection limit or not detected; the estimated uncertainties in the EMPA results are ±1%, whereas in the ICP results are ±2%.
Table 5.
NMR parameters from spectral simulations of the NMR spectra of specimen AGM with a ”valencianite” structure (Figure 10).
Table 5.
NMR parameters from spectral simulations of the NMR spectra of specimen AGM with a ”valencianite” structure (Figure 10).
| 29Si at 9.4 T | T1O (3Si,1Al) | T1m (3Si, 1Al) | T2O (3Si, 1Al) | T2m (2Si, 2Al) |
|---|---|---|---|---|
| δ (ppm) | −101.44 | −100.04 | −97.41 | −94.95 |
| Lw (ppm) | 2.4 | 2.3 | 2.3 | 2.3 |
| A (Area %) | 23.8 | 25.6 | 25.6 | 25.0 |
| 27Al at 35.2 T | T1 | T2 | ||
| δiso/c.g. (ppm) | 61.1 | 63.5 | ||
| Lw (ppm) | 2.9 | 2.9 | ||
| A (Area %) | 55.6 | 44.4 | ||
| 39K at 19.6 T | M1 | M2 | ||
| δiso/c.g. (ppm) | −65.2 | −98.6 | ||
| Em (ppm) | 50 | 72 | ||
| CQ (MHz) | 2.15 | - | ||
| η | 0.65 | - | ||
| A (Area %) | 56.6 | 43.4 | ||
| 23Na at 19.6 T | M1 | M2 | ||
| δiso/c.g. (ppm) | −21.9 | −21.0 | ||
| Em (ppm) | 80 | 6.8 | ||
| CQ (MHz) | 2.05 | - | ||
| η | 0.65 | - | ||
| A (Area %) | 53.0 | 47.0 | ||
Table 6.
Chemical composition and cell parameters of labradorite specimens, in Å for the cell dimensions and degrees for the cell angles.
Table 6.
Chemical composition and cell parameters of labradorite specimens, in Å for the cell dimensions and degrees for the cell angles.
| Specimens | EMPA Chemical Composition | Cell Parameters from Rietveld Refinement in the C Space Group Symmetry | Locality | |||||
|---|---|---|---|---|---|---|---|---|
| a | b | c | α | β | γ | |||
| IN1 | Or1Ab49An50 | 8.167 (1) | 12.856 (2) | 7.1113 (6) | 93.575 (8) | 116.273 (6) | 89.757 (9) | India |
| SKY | Or2 Ab47An51 | 8.164 (1) | 12.854 (1) | 7.1059 (7) | 93.53 (1) | 116.253 (7) | 89.827 (9) | Madagascar |
| PLG1 | Or3Ab45An52 | 8.169 (1) | 12.857 (2) | 7.1091 (9) | 93.56 (1) | 116.26 (1) | 89.74 (1) | unknown |
| MDG2 | Or3Ab44An53 | 8.168 (1) | 12.860 (1) | 7.1081 (7) | 93.546 (9) | 116.251 (6) | 89.896 (9) | Madagascar |
| BLUE | Or2Ab43An55 | 8.167 (1) | 12.859 (1) | 7.1067 (7) | 93.524 (10) | 116.234 (6) | 89.937 (10) | Madagascar |
| MDG1 | Or2Ab42An56 | 8.167 (1) | 12.859 (2) | 7.1087 (7) | 93.57 (1) | 116.259 (7) | 89.80 (1) | Madagascar |
| AMAR | Or2Ab41An57 | 8.165 (1) | 12.854 (2) | 7.1065 (7) | 93.546 (10) | 116.253 (6) | 89.816 (10) | unknown |
Note: Rietveld refinement by using BRUKER-AXS TOPAS v6 (2016).
Table 7.
Simulation of the 29Si spectrum from the 27Al{29Si} HMQC NMR spectrum at 17.6 T of specimen IN1 of labradorite An50 (Figure 17).
Table 7.
Simulation of the 29Si spectrum from the 27Al{29Si} HMQC NMR spectrum at 17.6 T of specimen IN1 of labradorite An50 (Figure 17).
| Plagioclase Modules | δ (ppm) | Line Width (ppm) | Area (%) | |
|---|---|---|---|---|
| p2-plagioclase (sim Figure 17b) | −82.7 | 2.5 | 7.15 | |
| −87.7 | 4.0 | 24.92 | ||
| −93.6 | 3.4 | 43.25 | ||
| −99.3 | 2.2 | 13.70 | ||
| −105.7 | 2.4 | 8.72 | ||
| −110.0 | 2.0 | 2.43 | ||
| p1-plagioclase (sim Figure 17c) | −83.1 | 2.7 | 17.51 | |
| −86.0 | 2.7 | 24.04 | ||
| −89.3 | 2.7 | 21.60 | ||
| −92.4 | 2.7 | 21.03 | ||
| −95.0 | 3.3 | 9.38 | ||
| −99.5 | 2.5 | 6.44 | ||
| Specimen IN1 (sim Figure 17d) | p2-plag. 49.67% | −82.4 | 2.0 | 3.40 |
| −87.9 | 3.0 | 7.92 | ||
| −93.6 | 3.6 | 19.58 | ||
| −98.9 | 3.0 | 9.52 | ||
| −105.2 | 2.4 | 7.84 | ||
| −110.5 | 2.7 | 1.41 | ||
| p1-plag. 50.33% | −83.5 | 3.0 | 7.94 | |
| −86.0 | 3.1 | 11.13 | ||
| −89.5 | 3.1 | 10.84 | ||
| −92.1 | 3.0 | 10.57 | ||
| −95.4 | 3.3 | 5.82 | ||
| 100.6 | 3.3 | 4.04 | ||
Table 8.
Unit-cell parameters from Rietveld refinement of the three moonstone specimens: SRe1b, SR31 and SR9, in Å for the cell dimensions and degrees for the cell angles.
Table 8.
Unit-cell parameters from Rietveld refinement of the three moonstone specimens: SRe1b, SR31 and SR9, in Å for the cell dimensions and degrees for the cell angles.
| Specimens | Bulk Compositions | a | b | c | α | β | γ |
|---|---|---|---|---|---|---|---|
| SRe1b | K-rich phase 63.4 % | 8.647 (1) | 12.896 (1) | 7.189 (1) | 90 | 116.34 (1) | 90 |
| Na-rich phase 36.6 % | 8.096 (2) | 12.917 (3) | 7.186 (1) | 90 | 116.98 (2) | 90 | |
| SR31 | K-rich phase 41.3 % | 8.638 (1) | 12.956 (1) | 7.197 (1) | 90 | 116.31 (1) | 90 |
| Na-rich phase 58.7 % | 8.121 (2) | 12.964 (3) | 7.191 (1) | 90.15 (4) | 117.02 (2) | 90.64 (3) | |
| SR9 | K-rich phase 67.5 % | 8.609 (2) | 12.960 (5) | 7.214 (1) | 90.48 (1) | 116.05 (1) | 87.67 (3) |
| Na-rich phase 32.5 % | 8.097 (5) | 12.955 (1) | 7.228 (3) | 89.91 (4) | 117.14 (1) | 90.36 (3) |
Note: Rietveld refinement by using BRUKER-AXS TOPAS v6 (2016).
Table 9.
Data of the simulations of the 29Si NMR spectra at 9.4 T and of the 27Al NMR spectra at 35.2 T, in specimens SRe1b, SR31 and SR9 (Figure 20).
Table 9.
Data of the simulations of the 29Si NMR spectra at 9.4 T and of the 27Al NMR spectra at 35.2 T, in specimens SRe1b, SR31 and SR9 (Figure 20).
| Mineral | Si Sites | Specimen SRe1b | Specimen SR31 | Specimen SR9 | ||||||
|---|---|---|---|---|---|---|---|---|---|---|
| δ (ppm) | lw (ppm) | A (%) | δ (ppm) | lw (ppm) | A (%) | δ (ppm) | lw (ppm) | A (%) | ||
| NaF | T2m | −92.8 | 1.2 | 16.2 | −92.7 | 1.00 | 21.6 | −92.9 | 1.00 | 9.5 |
| T2O | −96.8 | 1.3 | 15.7 | −96.8 | 1.00 | 21.8 | −96.8 | 1.00 | 9.3 | |
| T1m | −104.4 | 1.4 | 15.9 | −104.4 | 0.90 | 16.9 | −104.4 | 0.90 | 7.6 | |
| KF | T2m | −94.2 | 2.1 | 15.4 | −94.3 | 2.0 | 11.7 | −94.5 | 1.10 | 23.5 |
| T2O | −97.2 | 1.9 | 15.7 | −97.4 | 2.0 | 11.5 | −97.2 | 1.10 | 24.5 | |
| T1m | −100.0 | 2.2 | 11.8 | −100.2 | 2.0 | 11.1 | −100.2 | 1.10 | 25.6 | |
| T1O | −101.7 | 2.5 | 9.3 | −102.0 | 2.2 | 5.4 | - | - | - | |
| Mineral | Al Sites | Specimen SRe1b | Specimen SR31 | Specimen SR9 | ||||||
| δ (ppm) | lw (ppm) | A (%) | δ (ppm) | lw (ppm) | A (%) | δ (ppm) | lw (ppm) | A (%) | ||
| NaF | T1O | 63.1 | 1.5 | 37.5 | 62.4 | 1.6 | 52.2 | 61.9 | 1.5 | 20.1 |
| strain | 64.7 | 1.7 | 9.4 | |||||||
| KF | T1O | 61.6 | 2.6 | 53.1 | 59.4 | 2.2 | 19.5 | 58.9 | 1.1 | 72.4 |
| T1m | 60.3 | 2.2 | 11.0 | |||||||
| T2O | 61.3 | 2.2 | 9.1 | |||||||
| T2m | 62.6 | 2.2 | 4.3 | |||||||
| strain | 60.9 | 1.3 | 3.9 | 60.3 | 1.2 | 7.5 | ||||
Note: The resonances have been simulated with Voigt curves at xG/(1 − x)L = 0.7; lw is line width, NaF is Na-feldspar and KF is K-feldspar, A is area.
Table 10.
Cell parameters of the selected specimens of alkali feldspar acquired by Rietveld refinement; two consist of the “X-ray low microcline” variant of K-feldspar (LM), and two consist of the “X-ray low albite” variant of Na-feldspar (LA), in Å for the cell dimensions and degrees for the cell angles.
| Mineral | Specimen | a | b | c | α | β | γ |
|---|---|---|---|---|---|---|---|
| LM | 9544 | 8.581 (1) | 12.965 (1) | 7.222 (1) | 90.64 (1) | 115.94 (1) | 87.67 (1) |
| 11924 | 8.582 (1) | 12.964 (1) | 7.225 (1) | 90.65 (1) | 115.93 (1) | 87.68 (1) | |
| LA | CJ1 | 8.145 (1) | 12.804 (1) | 7.1601 (6) | 94.263 (1) | 116.61 (1) | 87.886 (1) |
| CLBR | 8.1387 (7) | 12.797 (1) | 7.1585 (5) | 94.236 (7) | 116.62 (1) | 87.710 (6) |
Table 11.
The NMR parameters of the simulation of the 29Si spectra in specimens 9544 and 11924, “X-ray low microcline” (LM) variant, at 9.4 T.
Table 11.
The NMR parameters of the simulation of the 29Si spectra in specimens 9544 and 11924, “X-ray low microcline” (LM) variant, at 9.4 T.
| Specimen 9544 | Specimen 11924 | |||||
|---|---|---|---|---|---|---|
| Sites | δ (ppm) | lw (ppm) | Area (%) | δ (ppm) | lw (ppm) | Area (%) |
| T2m | −95.2 | 1.1 | 33.1 | −95.1 | 0.9 | 16.5 |
| −95.7 | 0.9 | 16.3 | ||||
| T2O | −97.7 | 1.1 | 33.1 | −97.6 | 0.7 | 17.0 |
| −98.4 | 0.7 | 17.0 | ||||
| T1m | −100.9 | 1.1 | 33.8 | −100.8 | 0.7 | 16.2 |
| −101.5 | 0.7 | 16.5 | ||||
Note: Voigt curves at xG/(1 − x)L = 0.7 in all cases.
Table 12.
The NMR parameters of the simulation of the 29Si spectra in specimens CJ1 and CLBR, “X-ray low albite” (LA) variant, at 9.4 T and 17.6 T (see Figure 24).
Table 12.
The NMR parameters of the simulation of the 29Si spectra in specimens CJ1 and CLBR, “X-ray low albite” (LA) variant, at 9.4 T and 17.6 T (see Figure 24).
| Specimen CJ1 | Specimen CLBR | Specimen CLBR | Specimen CLBR | Specimen CLBR | |||||||||||
|---|---|---|---|---|---|---|---|---|---|---|---|---|---|---|---|
| SP MAS NMR at 9.4 T | SP MAS NMR at 9.4 T | SP MAS NMR at 17.6 T | MP 27Al Decoupling MAS NMR at 17.6 T | 29Si{27Al} 1D R-INEPT MAS NMR at 17.6 | |||||||||||
| Sites | δ | lw | Area | δ | lw | Area | δ | lw | Area | δ | lw | Area | δ | lw | Area |
| T2m (2Si,2Al) | −92.6 | 1.2 | 33.0 | −92.5 | 0.5 | 16.7 | −92.5 | 0.3 | 16.0 | −92.6 | 0.3 | 32.0 | −92.6 | 0.2 | 19.7 |
| −92.8 | 0.5 | 16.7 | −92.7 | 0.3 | 16.1 | −92.8 | 0.2 | 17.4 | |||||||
| T2O (3Si,1Al) | −96.9 | 1.2 | 33.9 | −96.6 | 0.5 | 16.5 | −96.7 | 0.3 | 16.2 | −96.8 | 0.3 | 32.6 | −97.0 | 0.2 | 32.5 |
| −97.1 | 0.5 | 16.7 | −96.9 | 0.3 | 16.8 | ||||||||||
| T1m (3Si,1Al) | −104.6 | 1.2 | 33.1 | −104.4 | 0.5 | 16.7 | −104.4 | 0.3 | 17.3 | −104.5 | 0.3 | 35.4 | −104.7 | 0.2 | 30.4 |
| −104.8 | 0.5 | 16.7 | −104.6 | 0.3 | 17.6 | ||||||||||
Note: Voigt curves at xG/(1 − x)L = 0.7 in all cases. SP single-pulse sequence, MP multi-pulse sequence. δ in ppm, lw in ppm, Area in %.
Table 13.
NMR parameters from the simulation of the 27Al spectra of specimen CLBR at four external magnetic fields (B0).
Table 13.
NMR parameters from the simulation of the 27Al spectra of specimen CLBR at four external magnetic fields (B0).
| B0 | c.g. (ppm) | δiso (ppm) | CQ (MHz) | η | lw |
|---|---|---|---|---|---|
| 9.4 T | 56.4 | 63.0 | 3.22 | 0.65 | - |
| 17.6 T | 61.5 | 63.3 | 3.32 | 0.65 | - |
| 19.6 T | 61.6 | 62.9 | 3.18 | 0.65 | - |
| 35.2 T | 63.0 | - | - | - | 1.0 |
Note: At 35.2 T, a single Voigt curve (xG/(1 − x)L = 0.7) was used.
Table 14.
NMR parameters from the simulation of the 23Na spectra of specimen CLBR at three external magnetic fields (B0).
Table 14.
NMR parameters from the simulation of the 23Na spectra of specimen CLBR at three external magnetic fields (B0).
| B0 | c.g. (ppm) | δiso (ppm) | CQ (MHz) | η |
|---|---|---|---|---|
| 9.4 T | −24.2 | −8.7 | 2.59 | 0.25 |
| 19.6 T | −13.0 | −9.2 | 2.64 | 0.28 |
Publisher’s Note: MDPI stays neutral with regard to jurisdictional claims in published maps and institutional affiliations. |
© 2022 by the authors. Licensee MDPI, Basel, Switzerland. This article is an open access article distributed under the terms and conditions of the Creative Commons Attribution (CC BY) license (https://creativecommons.org/licenses/by/4.0/).
Share and Cite
MDPI and ACS Style
Sánchez-Muñoz, L.; Florian, P.; Gan, Z.; Muñoz, F. Order–Disorder Diversity of the Solid State by NMR: The Role of Electrical Charges. Minerals 2022, 12, 1375. https://doi.org/10.3390/min12111375
AMA Style
Sánchez-Muñoz L, Florian P, Gan Z, Muñoz F. Order–Disorder Diversity of the Solid State by NMR: The Role of Electrical Charges. Minerals. 2022; 12(11):1375. https://doi.org/10.3390/min12111375
Chicago/Turabian StyleSánchez-Muñoz, Luis, Pierre Florian, Zhehong Gan, and Francisco Muñoz. 2022. "Order–Disorder Diversity of the Solid State by NMR: The Role of Electrical Charges" Minerals 12, no. 11: 1375. https://doi.org/10.3390/min12111375
Note that from the first issue of 2016, this journal uses article numbers instead of page numbers. See further details here.