Article

Alkali-Activated Metakaolins: Mineral Chemistry and Quantitative Mineral Composition

1
Institute of Environmental Technology, CEET, VSB—Technical University of Ostrava, 17. listopadu 15/2172, 708 00 Ostrava, Czech Republic
2
Department of Chemistry and Physico-Chemical Processes, Faculty of Material Science and Technology, VSB—Technical University of Ostrava, 17. listopadu 15/2172, 708 00 Ostrava, Czech Republic
3
Department of Thermal Engineering, Faculty of Material Science and Technology, VSB—Technical University of Ostrava, 17. listopadu 15/2172, 708 00 Ostrava, Czech Republic
4
Institute of Inorganic Chemistry, Slovak Academy of Science, Dúbravská cesta 9, 845 36 Bratislava, Slovakia
*
Author to whom correspondence should be addressed.
Minerals 2022, 12(11), 1342; https://doi.org/10.3390/min12111342
Submission received: 31 August 2022 / Revised: 26 September 2022 / Accepted: 21 October 2022 / Published: 23 October 2022
(This article belongs to the Special Issue Development in Geopolymer Materials and Applications)

Abstract

:
The reaction products resulting from the alkali-activation of metakaolin are impacted by the composition of the initial kaolin, and amount of alkali-activated kaolinite and water. The present study focused on analyzing these parameters on the metakaolins calcined at 800 °C from three kaolins, and the metakaolins’ alkali activation for 2, 3 and 28 days. The first objective was to evaluate the mineral chemistry and quantitative mineral phase composition from the bulk chemical analysis using the chemical quantitative mineral analysis (CQMA) procedure and conduct a comparison of the chemistry of the metakaolins after alkali activation for 28 days according to the elements Al, Si, Na and K, using the leaching test in distilled water. The second task was to search for possible relationships between the quantitative number of phases in alkali-activated metakaolins and compressive strength. The main methods used for the characterization of material were X-ray fluorescence, X-ray diffraction, thermal TG/DTA and infrared spectroscopy. Metakaolins alkali activated for 28 days contained crystalline quartz, muscovite, orthoclase, and unreacted metakaolinite contained zeolite A (Z-A), hydrosodalite (HS) and thermonatrite (TN) in the amorphous/weakly crystalline phase. The compressive strengths (CS) from 6.42 ± 0.33 to 9.97 ± 0.50 MPa are related positively to H2O+ and H2O bound in HS and TN.

1. Introduction

Kaolin minerals are safe and abundant natural materials that are excellent candidates for green technologies in the industry. Recent developments in the use of kaolin clay include the production of metakaolin as an artificial pozzolanic additive to cement-based systems. Over the last years, the research focus has been on the feasibility of using this “green” binder instead of, or as a supplement to, conventional cement applications [1]. In the literature, the terms alkali-activated material and geopolymers occur interchangeably and even as synonyms [2]. Alkali-activated materials are binders which can develop high compressive strength, chemical resistance, and thermal stability after preparation. The precursor of the alkali-activated materials is a mixture of a solid aluminosilicate and a solid alkali source, and their admixtures with water. The alkali-activation procedure is comparable to the preparation of ordinary Portland cement. In theory, the whole aluminosilicate precursor could potentially be dissolved and polymerized [3]. The process produces metastable amorphous and or “proto-zeolitic nuclei” in semi-crystalline alkali aluminosilicate hydrates, which are often termed zeolite precursor gels or geopolymer gels [4,5,6,7].
The common process, where metakaolin from high-quality kaolin is formed by calcination at 650–850 °C, is one of the conventional production methods [8,9,10,11]. The reaction products of the metakaolin alkali-activation process confirmed the presence of remaining kaolinite, not fully reacted with the alkali activator in metakaolin [12,13]. The alkaline activation of metakaolin with NaOH solution involves reactions that produce amorphous hydrated sodium aluminosilicates of the general formula Na2O∙3SiO2∙Al2O3∙3H2O with a predominant three-dimensional structure [14].
To explain and refine the phase composition of the activated products of kaolinite, analytical methods should be employed. X-ray diffraction (XRD) qualitative and quantitative phase analysis have limited capabilities for studying amorphous phases. Traditionally, powder XRD deals with the characterization of polycrystalline materials that contain amorphous or weakly crystalline phases. The contributions of the intensities of the amorphous phases to the diffraction pattern are not always obvious, especially at low concentrations. The available method for quantitative phase analysis of these materials is quantitative XRD coupled with Rietveld analysis. However, their accuracy is highly dependent on the ‘degree of crystallinity’ of the solids present. The X-ray amorphous phase cannot be directly measured, and the crystalline phases in the presence of amorphous/unidentified crystalline phases may be significantly overestimated [15].
Considering the quantity of the phases in the activated system, where a certain amount of amorphous matter is expected, the quantitative estimation can be performed using several approaches. Currently, the quantitative phase analysis of amorphous components in the mixture was performed using the direct-derivation method, including a background-subtracted halo pattern together with profile models for crystalline components [16].
In another study the combination of analytical methods, two XRD methods and point counting using SEM, was able to assess the fraction of reacted metakaolin quantitatively for four geopolymer samples [17]. One more study integrated the XRD data of identified minerals with relevant chemical analysis using the chemical quantitative mineral analysis (CQMA) procedure [18,19]. The CQMA procedure performs recalculation of the bulk chemical analyses (XRF) to the quantitative number of phases occurring in all crystallization stages and refines the mineral composition.
The present study focused on the experimental dehydroxylation of kaolins and the formation of metakaolins at 800 °C. The alkali activation of metakaolins to geopolymer precursors was characterized for 2, 3 and 28 days. The first objective was to evaluate the mineral chemistry and quantitative mineral phase composition from the bulk chemical analysis using the CQMA procedure and the comparison of the chemistry of metakaolins after alkali activation for 28 days according to the elements Al, Si, Na and K using the leaching test in distilled water. The second task was solving the relation between the quantitative mineral composition of metakaolins alkali activated for 28 days and compressive strengths. The study aims to be guide for further application of activated metakaolins in cements regarding composition.

2. Materials and Methods

2.1. Materials and Samples Preparation

The three kaolins denoted as samples 1–3 originated from the Sedlec, Kaznějov and Chlumčany kaolin deposits in the Czech Republic, respectively, was purchased from LB Minerals, Ltd. (Horní Bříza, Czech Republic). Sodium hydroxide (NaOH) was purchased from Lach-Ner Co. (Neratovice, Czech Republic).
Kaolin samples 13 were sieved to the size fraction ˂40 µm and then were calcined at 800 °C for 3 h to the metakaolin (M) samples, which were denoted as M1, M2 and M3, respectively. Alkali-activated metakaolin samples AM1, AM2 and AM3 were prepared by the mixing of each metakaolin M1, M2 and M3 (10 g) with 8M NaOH (8 mL). The fresh mixtures were formed into 2 cm × 2 cm × 2 cm cubic mold and left to activate for a period of 2, 3 and 28 days under laboratory conditions. Samples for analysis were taken out of the molds after 2, 3 and 28 days and marked as AM1-2, AM2-2, and AM3-2 at 2 days, AM1-3, AM2-3, and AM3-3 at 3 days, and AM1-28, AM2-28, and AM3-28 at 28 days; they were dried at 30 °C for 12 h, ground for 1 min on a vibrating mill, and then manually pulverized with an agate mortar and pestle.

2.2. Characterization Techniques

The elemental analysis was obtained using an ED-XRF spectrometer (Spectro Analytical Instruments, Kleve, Germany). Each sample (2 × 4 g) was mixed with wax (0.9 g) and pressed at 10 tons for 30 s using a manual hydraulic press BSL-2 (BrioHranice, Hranice, Czech Republic) to a cylindrical pellet. The concentration of elements Si, Al, K, Na in water leachates was determined using high-resolution continuum source AAS, contrAA® 700 (Analytik Jena AG, Jena, Germany).
The conversion of hydrocarbons to carbon dioxide and water vapor was determined at 1000 °C using a RC612 Multiphase Carbon and Hydrogen/Moisture Analyzer (LECO Instruments, St. Joseph, MI, USA) at oxygen of 99.95% purity and flow 3 L/min.
The specific surface area (S) was measured using the 3Flex physisorption set-up (Micromeritics Instrument Corporation, Norcross, GA, USA) and was quantified according to the classical Brunauer–Emmett–Teller (BET) theory for the p/p0 = 0.05–0.25 [20].
Simultaneous (TG/DTA) thermal analyzer STA 504 (BÄHR-Thermoanalyse GmbH, Hüllhorst, Germany) was used to measure changes in the kaolin mass and temperature at a heating rate of 10 °C/min between 25 and 1200 °C in an air flow of 5 L/h.
The X-ray diffraction (XRD) analyses were performed with a Rigaku SmartLab diffractometer (RIGAKU Corporation, Tokyo, Japan), which was equipped by detector D/teX Ultra 250 and operated at 40 kV and 40 mA in the symmetrical Bragg–Brentano geometry. The XRD measurements were performed in the 2θ range with the CoKα radiation at the speed of 0.5°/min and a step size of 0.01°. The samples were measured in the Si sample holder rotated with a speed of 15 rpm. The XRD patterns were evaluated using PDXL2 software No. 2.4.2.0 (Rigaku Corporation, Tokyo, Japan) and database PDF-2, 2015 (ICDD, Newton Square, PA, USA).
The infrared spectra of the samples were recorded using a Fourier transform infrared (FTIR) spectrometer Nicolet 6700 (Thermo Scientific, Waltham, MA, USA), equipped with the Thermo Scientific OMNIC™ software package. For each sample, 64 scans were recorded over the mid-IR (MIR, 4000–400 cm−1) or near-IR (NIR, 8000–4000 cm−1) range with a resolution of 4 cm−1. To obtain spectra in the MIR region, the KBr pressed disk technique (1 mg of sample and 200 mg of KBr) was used, while for NIR spectra, a diffuse reflectance accessory (DRIFT) was utilized.

2.2.1. Test of Metakaolins and Alkali-Activated Metakaolins in Water

The stability of Si, Na, Al, and K elements in the metakaolin M1, M2 and M3 samples and M1-28, M2-28 and M3-28 samples, alkali-activated for 28 days, was evaluated by the stirring of 1 g of a powder sample and 100 mL of distilled water for 24 h. The concentration of elements released into the water was determined after centrifugation of the solid sample using atomic absorption spectrometry (AAS).

2.2.2. Test of Alkali-Activated Metakaolins in Compressive Strength

The compressive strength values of 7 pieces of each sample were measured on the press machine (BRIO, Hranice, Czech Republic) at a loading rate of 500 N∙s−1. Two values (highest and lowest) were excluded, and the remaining five measurements were averaged [21].

2.3. CQMA Calculation

Chemical quantitative mineral analysis (CQMA procedure) was used for the recalculation of the bulk chemical analyses (XRF) to the quantitative mineral analyses of crystalline and semi-crystalline alkali aluminosilicate hydrate phases.
For this calculation, the identified (XRD) phases and their crystallochemical formulas were used. The CQMA procedure is based on two principial equations.
The oxides of elements in minerals (ci,calc) were calculated according to Equation (1):
c i , c a l c = j = 1 m c i , j × w j
where:
  • ci,calc—the calculated ith element oxide (wt.%) of the sample;
  • ci,jthe percentage (wt.%) of the ith element oxide in the jth mineral phase;
  • wjthe wt. fraction of the jth mineral in the sample;
  • m—the number of calculated minerals.
The wt. fraction of the ith element oxide in the jth mineral ci,j is calculated from the crystallochemical formula of the jth mineral.
The wt. fractions of the jth mineral (wj) were calculated according to Equation (2):
i = 1 n ( c i , e x p j = 1 m c i , j × w j ) 2 =   m i n
where:
  • ci,exp—the ith element oxide in the sample (wt.%) from bulk chemical analysis;
  • min—minimum calculated value of the sum of quadrates; n—the number of element oxides in the bulk chemical analysis used for the calculation; n ≥ m—calculation condition.
The calculation of the % wt. fraction (wj) of the jth mineral in the sample according to Equation (2) was performed using the least squares CQMA method [18].

3. Results and Discussion

3.1. TG/DTA Analysis
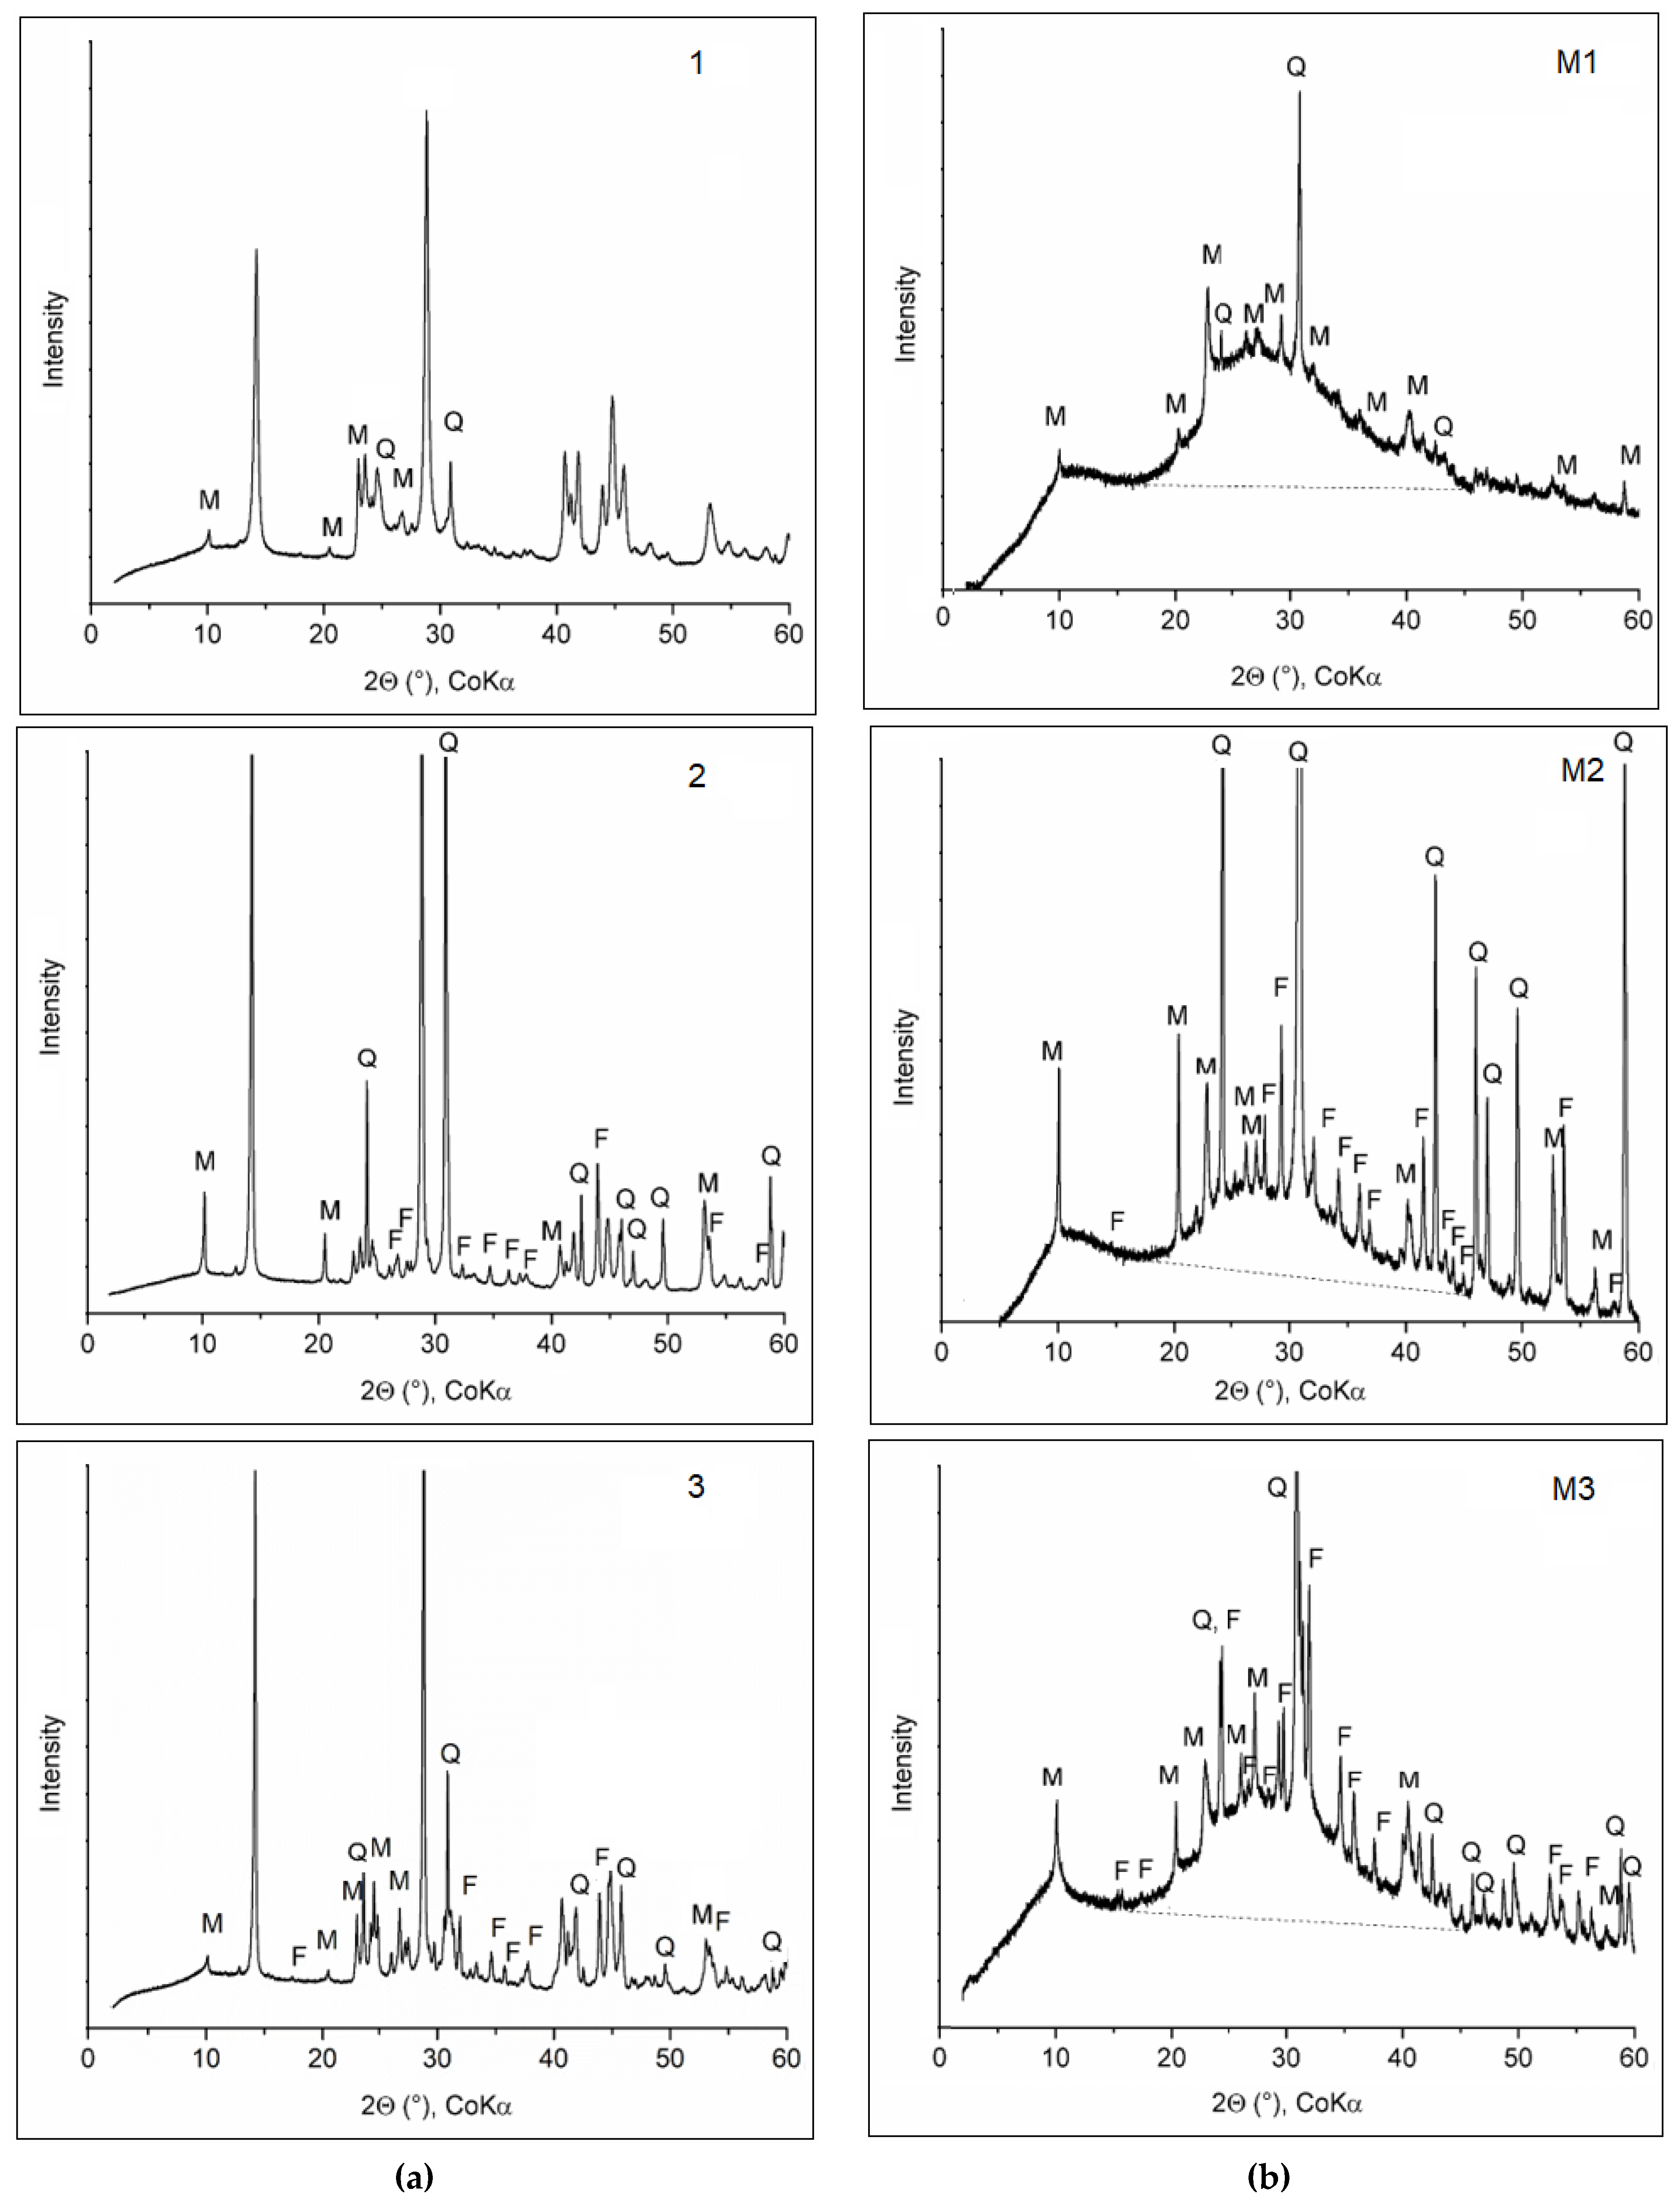
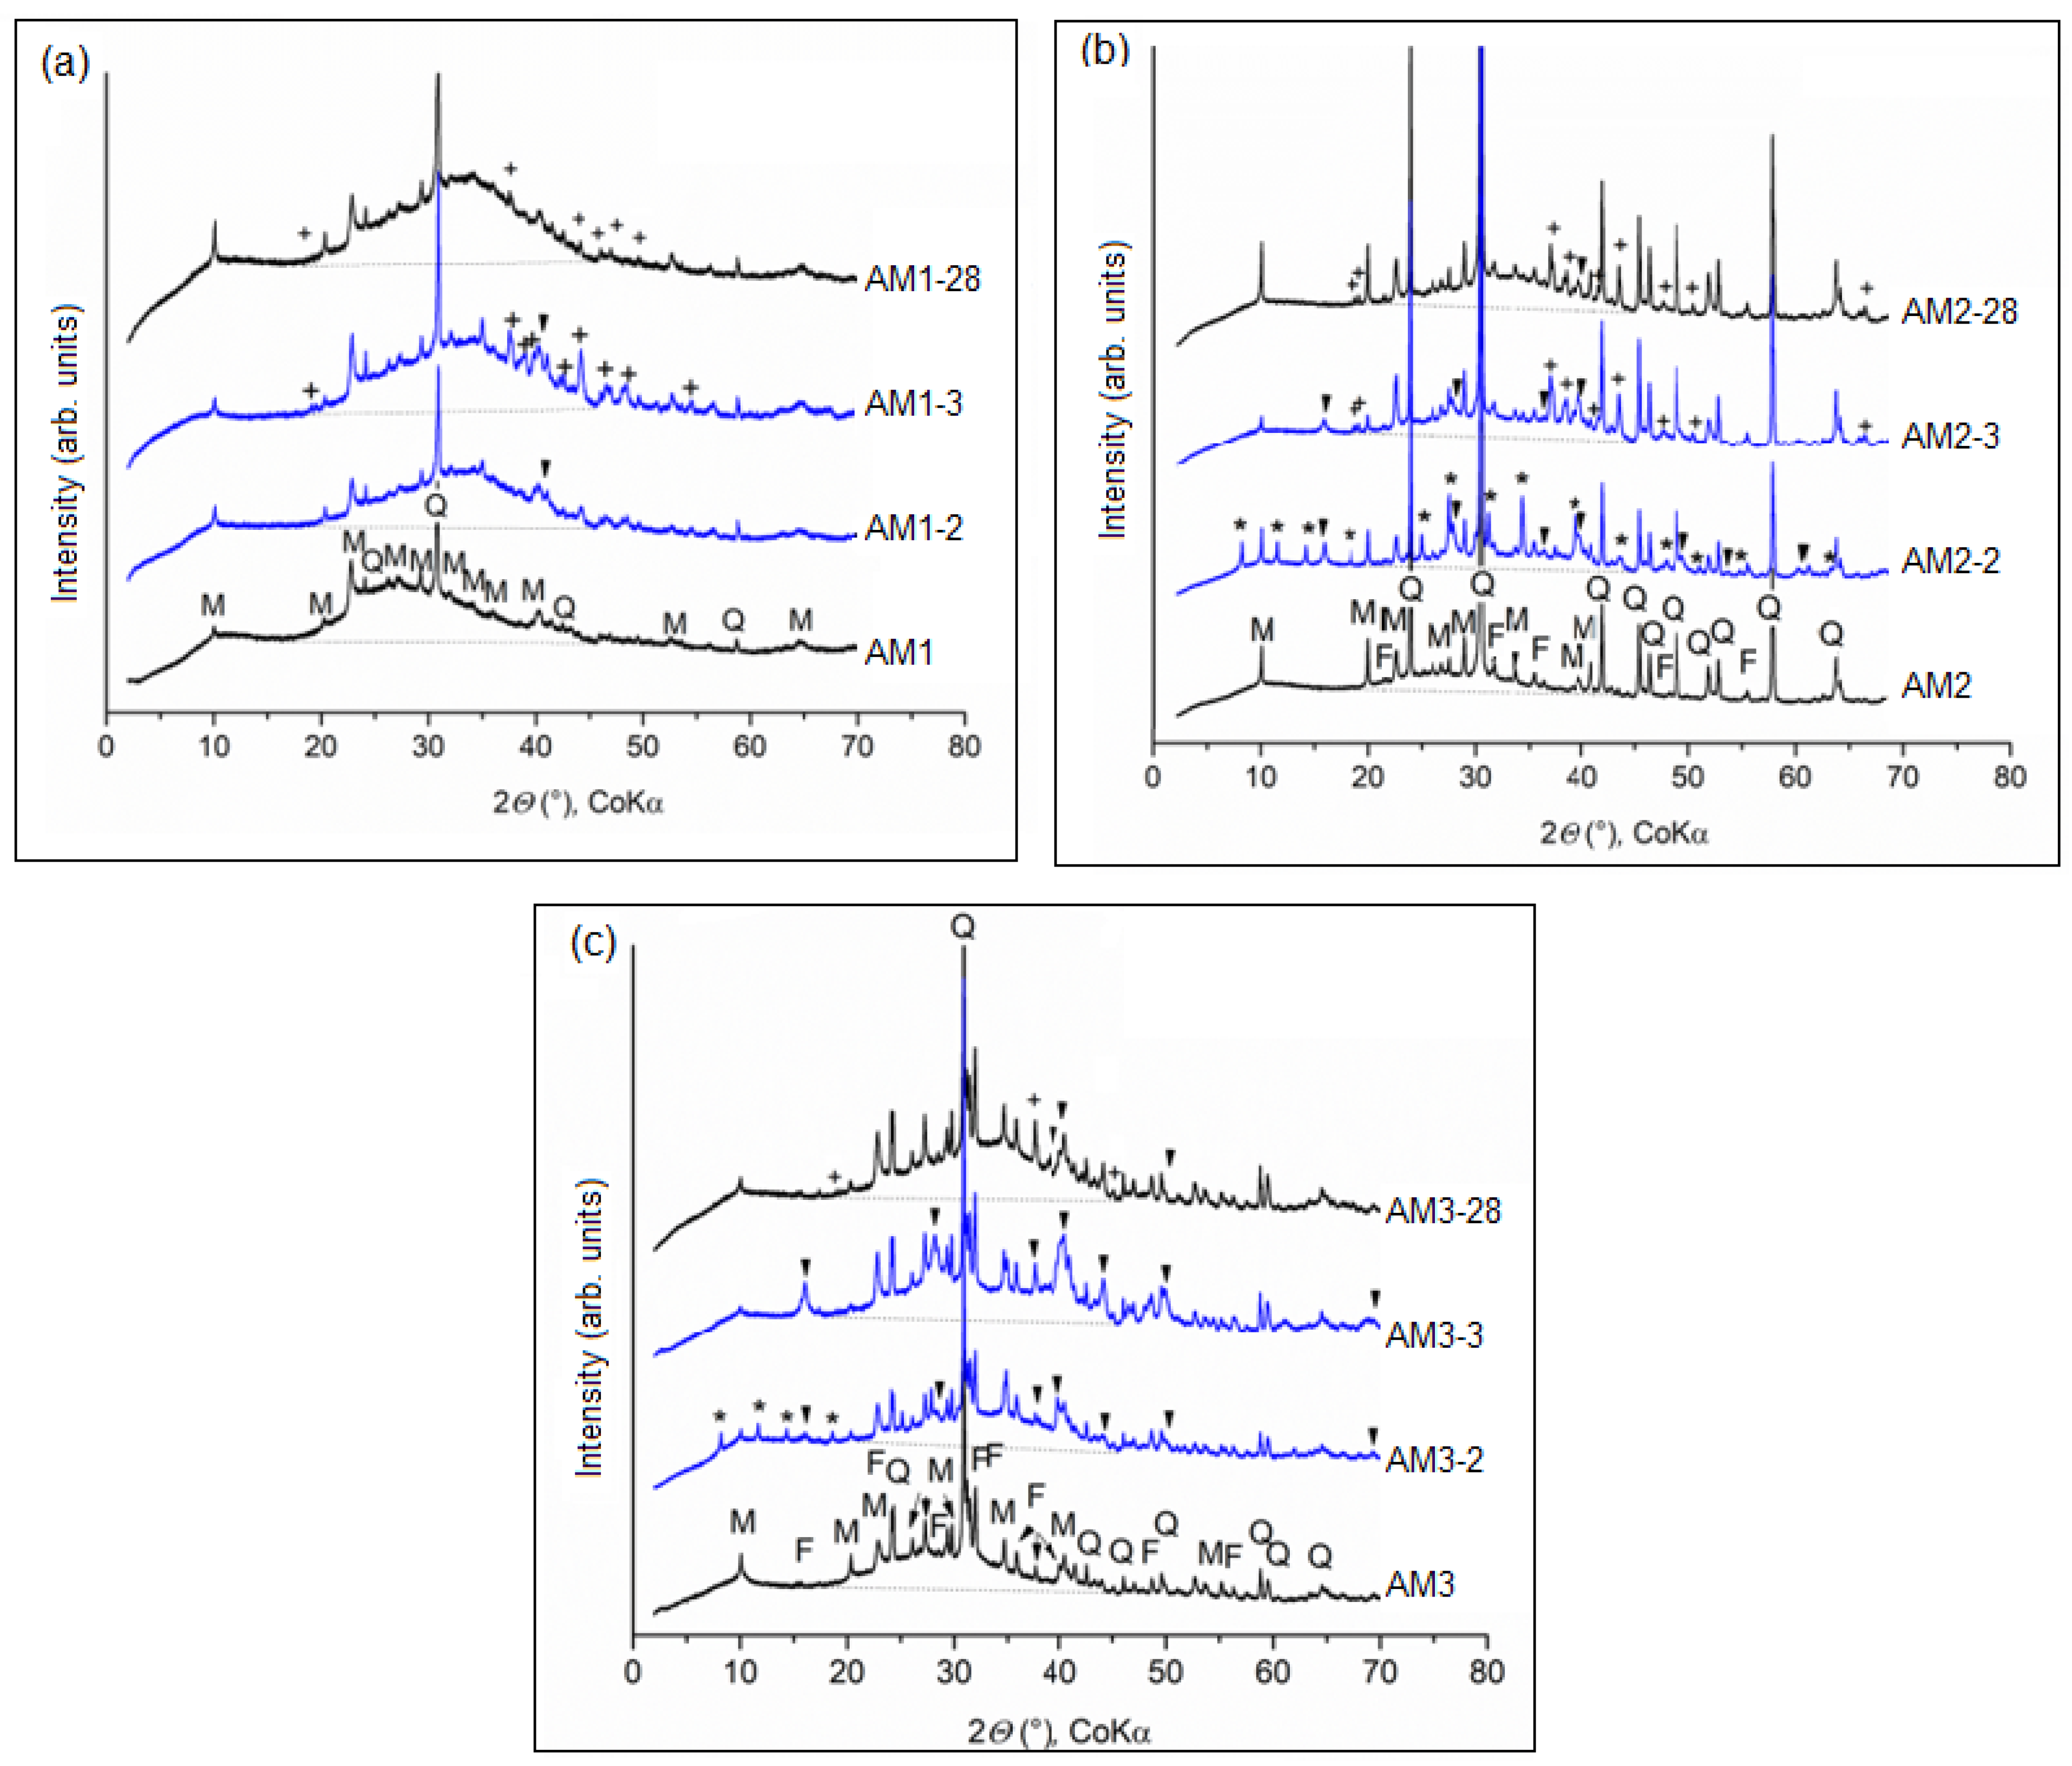
The thermal transformation of kaolin samples 1–3 was characterized according to TG and DTA curves (Figure 1). The shape of the endothermic peaks supports the concept of a different course of dehydroxylation of kaolinite [22].
The dehydration of adsorbed water can be observed on the small wt. loss to 400 °C. The dehydroxylation process in kaolin samples 1 and 2 forms a broad asymmetric DTA curve from about 400 °C to a maximum at about 518 °C and 537 °C, respectively, while from 400 °C to a maximum at 664 °C in kaolin 3, like in disordered kaolinites [23].
The weight losses on the TG thermograms were between 10 and 13.9% (13.9% correspond to the ideal kaolinite). The difference in the water loss is associated with a defect in the kaolinite structure.
At higher temperatures, an exothermic effect at a maximum of 991.0 °C in 1 and 999.9 °C in 2 and 3 was assigned to the recrystallization of metakaolin to primary mullite [24].
The DTA endotherm peak between 440 and 530 °C formed from the removal of hydroxyls from kaolinite in certain sequences resulted in a metakaolinite structure with the persistence of about 10% residual hydroxyls [25]. In the upper temperature regions, dehydration and dehydroxylation may overlap as well as dehydroxylation and recrystallization [26].
Muscovite in kaolins dehydroxylated in the temperature range from 300 to 1000 °C [27], according to the reaction in Equation (3):
KAl2(Si3Al)O10(OH)2  KAl2(Si3Al)O11 + H2O
The different shape of the DTA curve in the kaolin 3 can be formed due to the presence of the hydroxyl populations in this dehydroxylation temperature range [28] and/or the additional effects of the particle size, thickness of platelet and stacking [29].

3.2. XRD Analysis

The XRD patterns of kaolin samples (Figure 2a) showed kaolinite (Al4Si4O10(OH)8, PDF card No. 00-058-2005), muscovite (K(Al1.5Mg0.5)(Si3.5Al0.5)O10(OH)2, PDF card No. 01-076-0928), quartz (SiO2, PDF card No. 01-086-2237) and orthoclase (KAlSi3O8, PDF card No. 01-075-1592). Kaolinite layers stacked at the three-dimensional periodicity changed at the calcination temperature due to the structural water loss to the two-dimensional disordered metakaolin. Therefore, the metakaolin samples (Figure 2b) still contain muscovite, quartz, and orthoclase. Kaolinite transformed to metakaolin diffracts like wide peaks in the broad profile position (marked as the peaks halo) on 2θ axis from 27–29°.
Metakaolinite upon alkaline activation reacts in the dissociated NaOH solution to the H2SiO42– and Al(OH)4– ions according to Equation (4):
Al2Si2O7 + 6 OH + 3 H2O → 2 Al(OH)4 + 2 H2SiO42−
and simultaneously to the different zeolite precursors, e.g., according to [30] in Equation (5):
6 H2SiO42− + 6 Al(OH)4 + 6 NaOH → Na6(AlSiO4)6·2 H2O + 10 H2O + 18 OH
It was found that low NaOH concentrations promote the crystallization of zeolite A (Z-A), while very high concentrations favor the crystallization of hydrosodalite (HS) [31]. Another work [12] documented the formation of Z-A and sodalite in activated metakaolin, and only HS and no other intermediate phases in kaolinite.
In this work, XRD patterns of metakaolins (M1, M2 and M3) and their alkali-activated products are compared in Figure 3. All alkali-activated metakaolin samples contained HS, (Na6Al6Si6O24·8H2O, PDF card No. 01-083-5301). Z-A, (Na12Al12Si12O48, PDF card No. 01-083-2151) was only identified in AM2-2 and AM3-2.
In addition to the zeolites, thermonatrite (TN) (Na2CO3·H2O, PDF card No. 00-008-0448) was formed by the atmospheric carbonation of the excess NaOH [32]. Quartz, muscovite, and orthoclase, which were identified in the metakaolin samples, were retained after alkaline activation. The peaks halo was shifted to the higher 2θ angle position from 20–40°, which was ascribed to the alkali-activated products of metakaolin (geopolymers) [33].

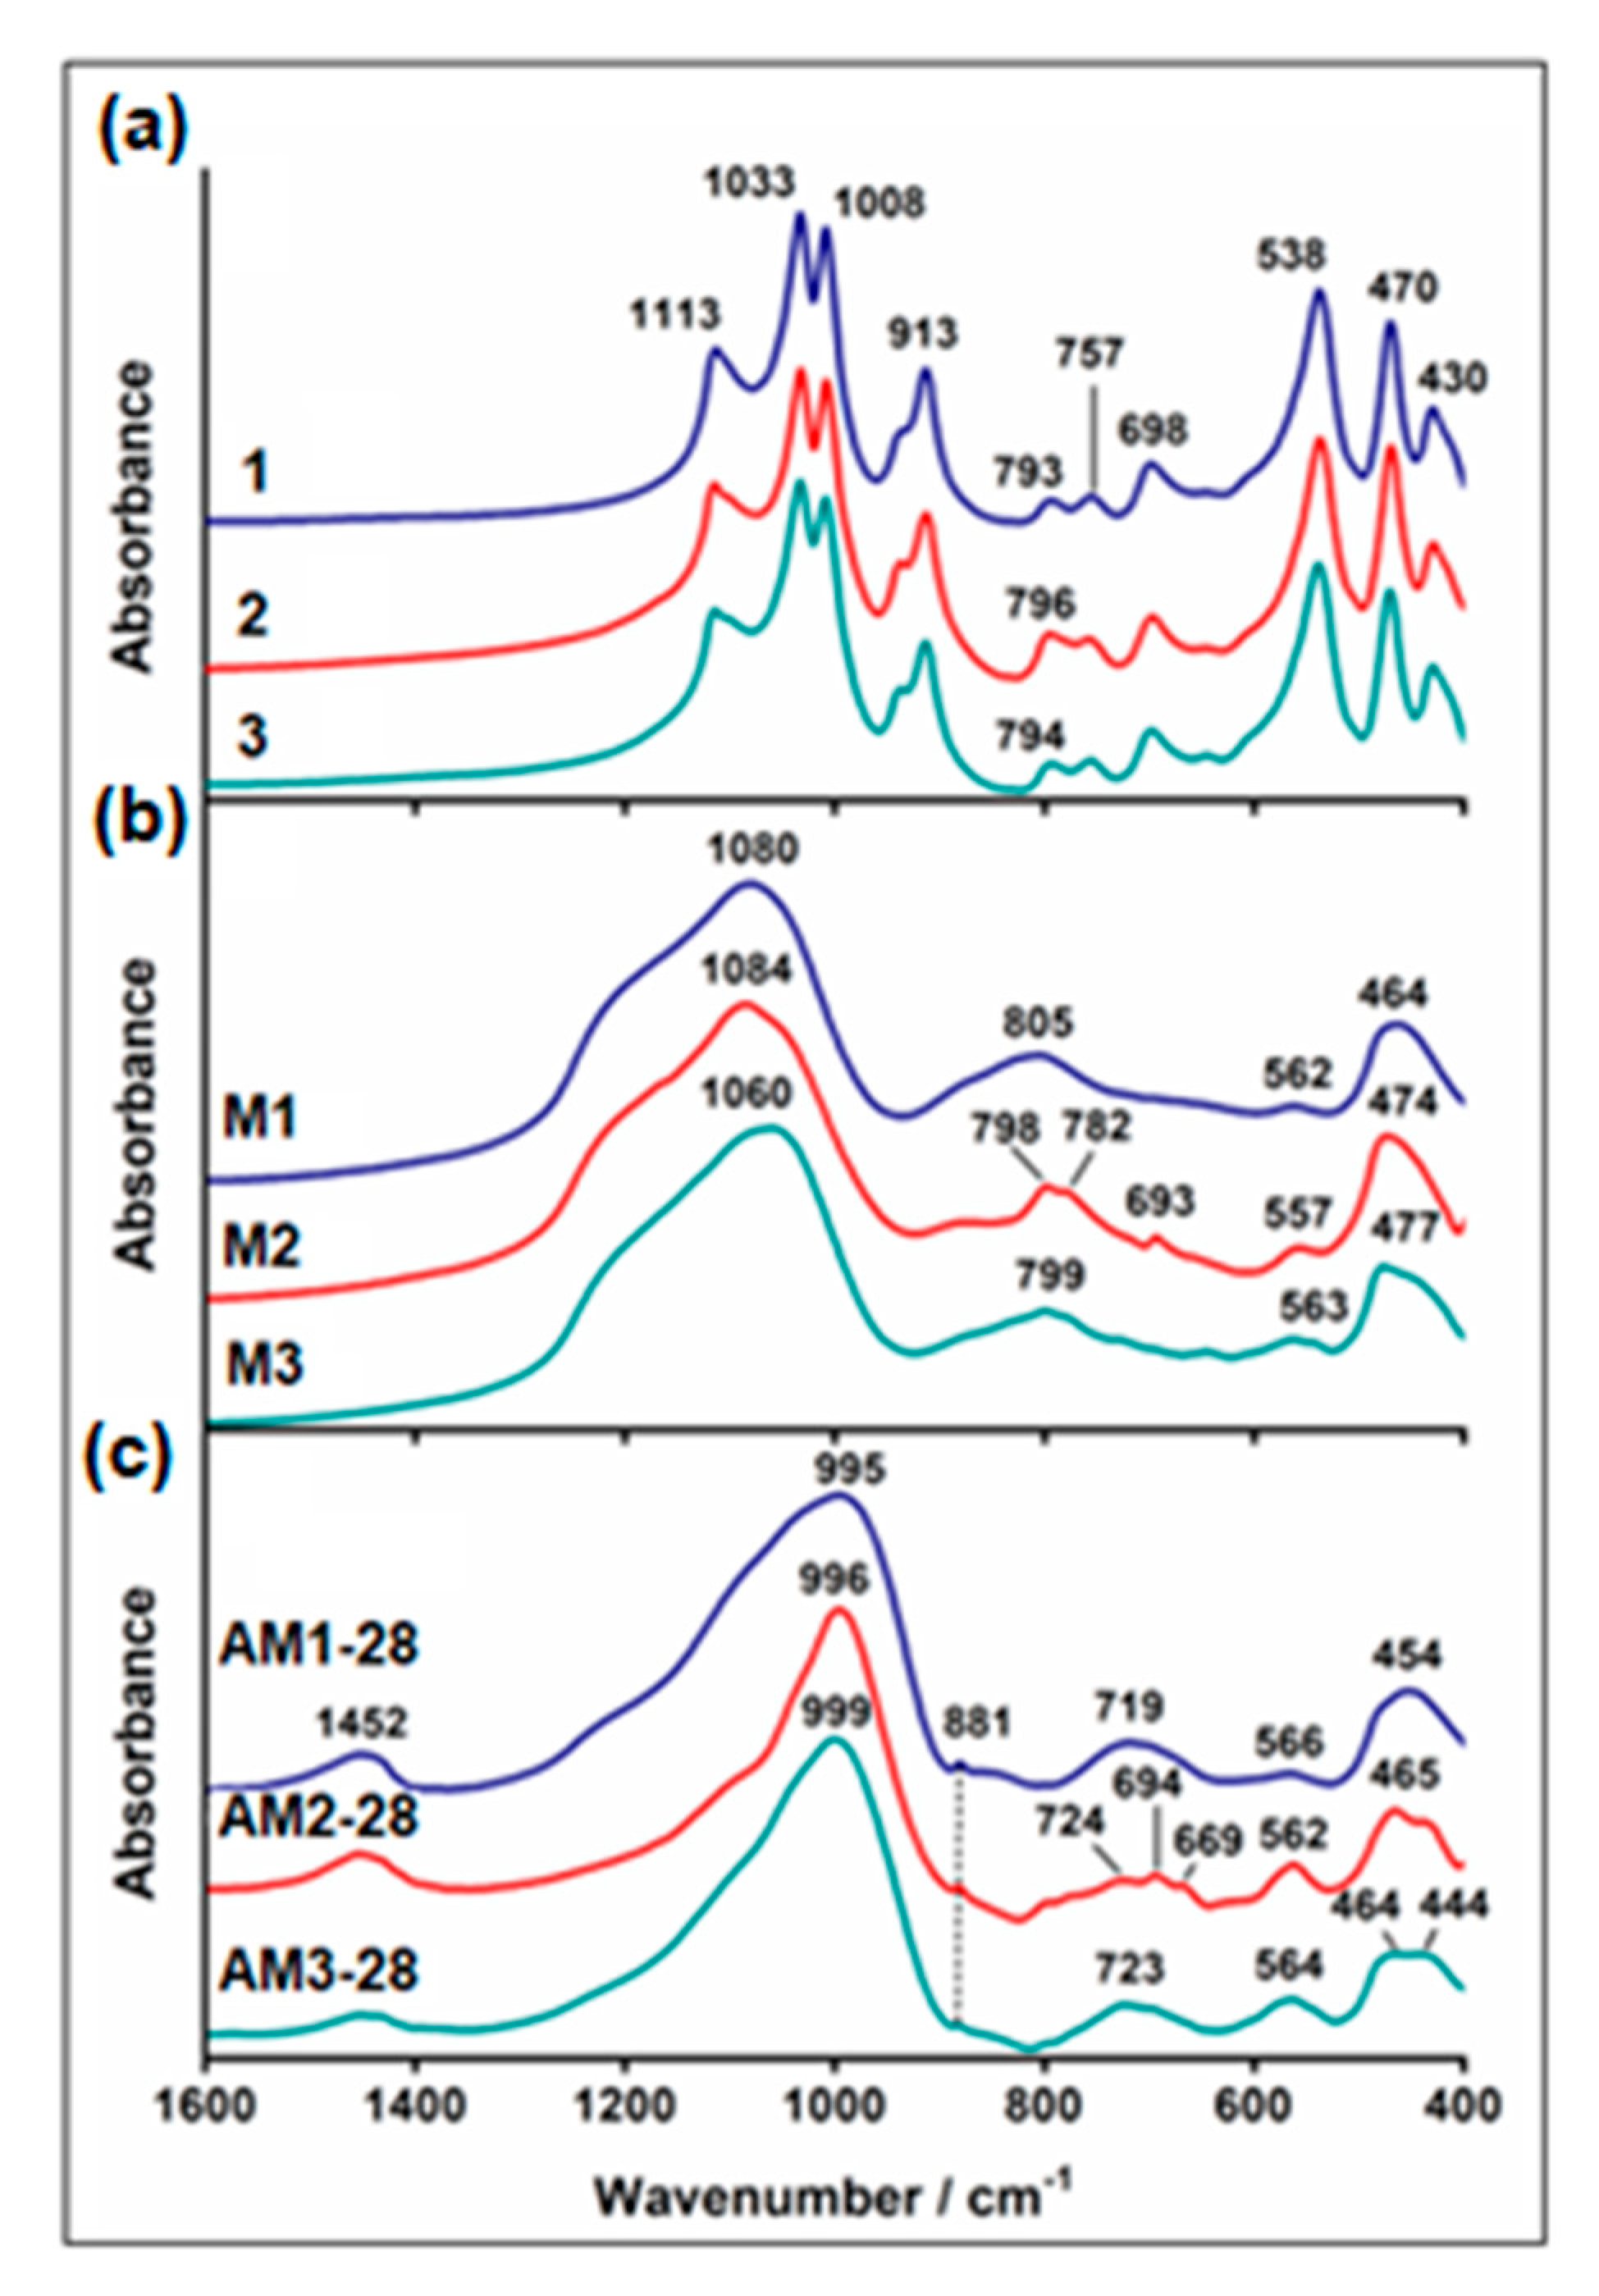
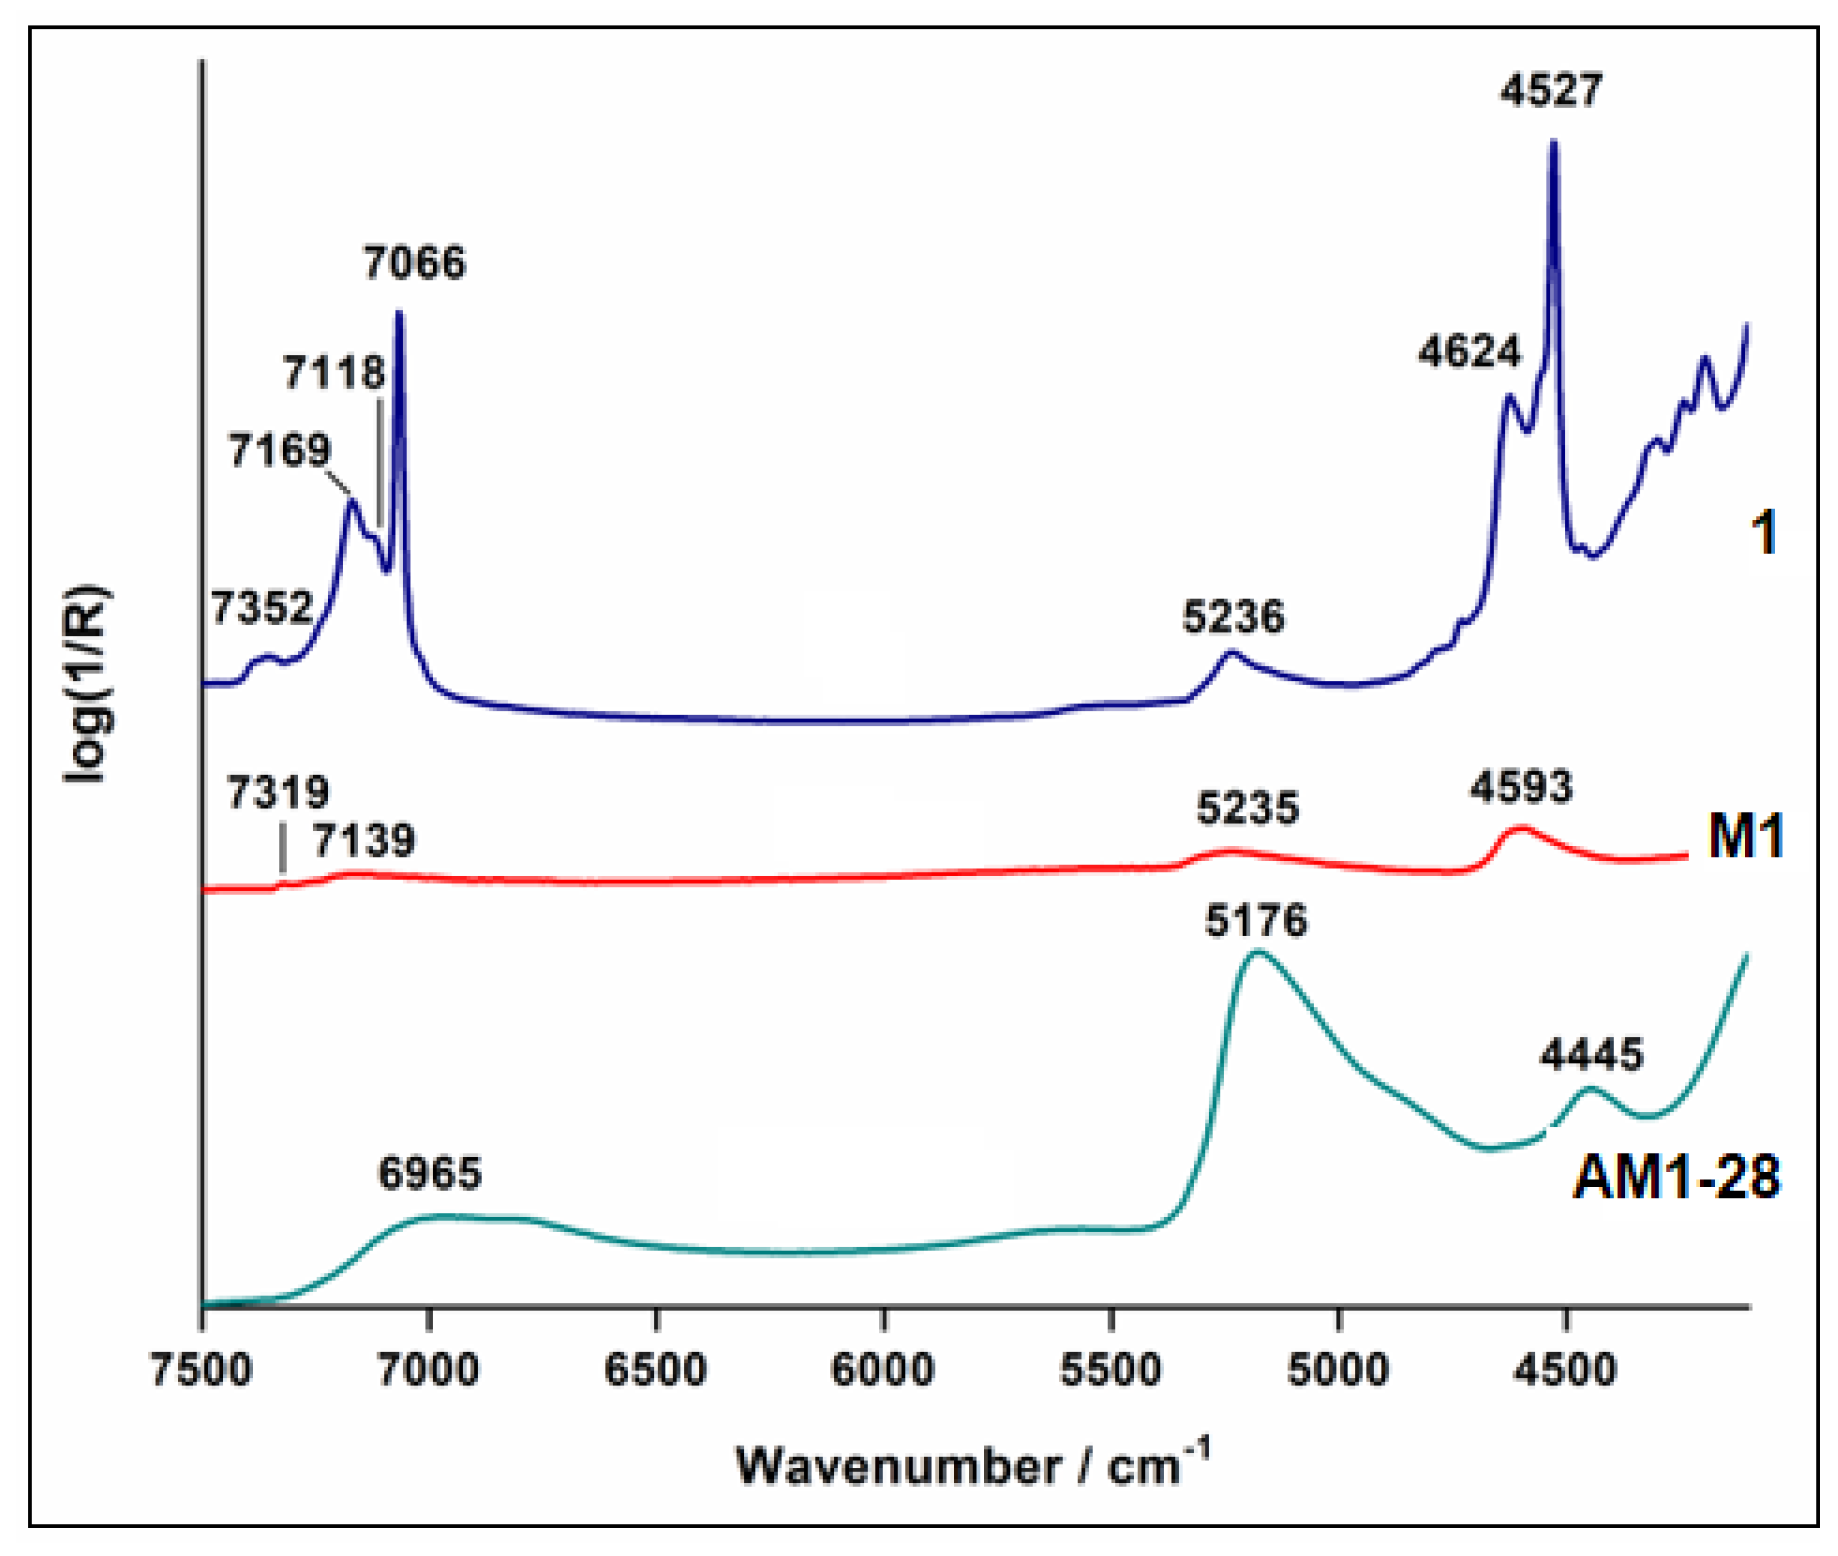
3.3. FTIR Spectroscopy Analysis

In addition to the XRD, the FTIR spectroscopy was used to investigate the structural changes of kaolins upon heating at 800 °C and alkali activation. In Figure 4, the MIR spectra of studied kaolins are remarkably similar either in the OH stretching (3700–3600 cm−1) or in the lattice (1200–400 cm−1) regions (Figure 4a). Four resolved intensive bands at 3696, 3670, 3653 and 3620 cm−1 (not shown), related to the OH stretching vibrations of inner-surface and inner groups, indicate well-ordered kaolinite as the dominant phase in all studied kaolins [34,35]. The same trend was observed also in the 1600–400 cm−1 region. The Si–O stretching vibrations give three strong and sharp bands in the 1120–1000 cm−1 region. The Al2OH bending bands of kaolinite at 913 and near 935 cm−1 arise from vibrations of the inner and inner-surface OH groups, respectively. The weak bands near 793, 755 and 697 cm−1 are related to the perpendicular Si–O vibrations. Two strong bands near 540 and 470 cm−1 are due to the bending vibrations of Si–O–AlVI (AlVI = Al in the octahedral position) and Si–O–Si groups, respectively [34].
The high intensity of the kaolinite bands, overlapping the bands of the minerals’ admixture, hinders the identification of the impurities in the kaolins. The only exception is kaolin 2, where an increase in intensity and a slight shift of the Si–O band to higher wavenumbers (796 cm−1) compared to kaolins 1 and 2 reflects a higher content of quartz in this sample. For quartz, a doublet near 800 and 780 cm−1 is diagnostic [36].
Heating of the kaolins at 800 °C induced significant changes in their structure reflected also in the MIR spectra. As a result of the dehydroxylation, the OH stretching and bending bands of kaolinite completely disappeared (not shown), while the range 1400–400 cm−1 did not show any features typical for unheated kaolinite (Figure 4b). The number of IR bands was reduced, and only several broad bands remained. The spectrum of M1 shows an exceptionally large band at 1080 cm−1 containing multiple overlapping components of the stretching vibrations of the Si–O and Al–O tetrahedra. The origin of a less intensive but still extremely broad band at 805 cm−1 is unclear; most likely, both the symmetric Si–O and Al–O stretching vibrations absorb in this region [34,37]. However, the assignment of the band near 800 cm−1 in metakaolinites to the Al–O bending mode of AlO6 octahedra was reported as well [9]. The absorption peak at 562 cm−1 corresponds to AlO6 stretching motions and the band at 464 cm−1 to deformation vibrations of the SiO4 tetrahedra [38]. The IR pattern of the M2 strongly resembles that of M1 (Figure 4b). The difference is in the 800–650 cm−1 region, where the characteristic bands of quartz at 798, 782 and 693 cm−1 appeared. Their presence confirms the highest content of this mineral in M2 within the studied samples, as indicated also by the XRD (Figure 1). Compared to M1 and M2, the IR spectrum of M3 shows a shift of the most intensive band to a lower wavenumber, i.e., to 1060 cm−1 (Figure 4b). Such a shift may result from the higher contribution of the tetrahedra-coordinated Al–O groups. Another possible explanation for this shift is the higher content of orthoclase in M3. The main Si–O stretching band of this mineral, appearing at 1035–1015 cm−1 [36], can lower the position of the complex Si–O–Al stretching band.
The alkali activation of metakaolins for 28 days induces significant changes in the IR spectra. A shift of the broad Si–O–Si(Al) asymmetric stretching band of metakaolinite from about 1080 cm−1 (Figure 4b) down to ~1000 cm−1 (Figure 4c) is usually considered to be the result of the formation of geopolymers, although it is also observed during the creation of zeolites from disordered aluminosilicate precursors [39]. The band near 720 cm−1 is supposed to indicate the formation of AlIV as the main Al environment in the geopolymers [36], while the peaks in the 460–440 cm−1 region can be assigned to the bending vibrations of the bridging O–Si–O and O–Al–O bonds [40]. The presence of alkaline carbonates was confirmed by a band near 1650 cm−1 and less intensive sharp peak at 881 cm−1 related to the asymmetric stretching and out-of-plane bending vibrations, respectively, of the CO32− ion of thermonatrite as confirmed by the XRD results.
The bands present in the NIR spectra (8000–4000 cm−1) of kaolins (Figure 5) are related to the first overtones of the kaolinites OH stretching vibrations (2νOH) of the structural OH groups, or to the combinations involving stretching and bending modes of the adsorbed water molecules, (ν+δ)OH, and structural OH groups (ν+δ)OH) [35]. The NIR spectra of all kaolins, metakaolins as well as their alkali-activated metakaolins are remarkably similar; therefore, only the results for 1, M1 and AM1-28 are discussed.
Untreated kaolinite shows a strong band at 7066 assigned to the 2νOH overtones of the OH stretching modes of inner hydroxyl groups, while a complex band with several more or less resolved peaks in the 7400–7100 cm−1 region corresponds to the first overtones of the coupled inner-surface OH groups [41]. The weak band at 5236 cm−1 is due to the combination band of water molecules (ν+δ)H2O; the intensive band at 4527 cm−1 is associated with the (ν+δ)OH of inner OH groups, and the band at 4624 cm−1 corresponds to the combination mode of the inner surface hydroxyls. The bands observed below 4500 cm−1 are probably combinations of the OH stretching bands with lattice deformation vibrations involving octahedral atoms [42].
The heating of kaolins at 800 °C resulted in the removal of the structural OH groups of kaolinites evidenced by the almost complete disappearance of the OH bands from the NIR spectra of M1. The very weak band at 7319 cm−1 can be assigned to the first overtone of the isolated (free) surface silanol groups, while that at 7139 cm−1, to the silanol groups hydrogen bonded to the adsorbed water molecules. The presence of a small amount of water confirms also a weak (ν+δ)H2O band at 5235 cm−1. The slightly more intensive band at 4593 cm−1 may possibly be due to the combination of the OH stretching vibration of free silanol groups and siloxane (Si–O–Si) bending vibrations [43].
Creation of new phases because of the kaolins’ dissolution in NaOH also affects the shape of the NIR spectrum of AM1-28. Broad bands at 6965 cm−1 corresponding to the 2νH2O overtone and at 5176 cm−1 due to the (ν+δ)H2O combination mode reflect the presence of water molecules in hydrosodalite and thermonatrite. The weaker band at 4445 cm−1 possibly arises from the combination mode of the Si–OH and Al–OH groups.

3.4. Test of Metakaolins and Alkali-Activated Metakaolins (M-28) in Water

Leaching tests are a very powerful tool to determine the degree of elements immobilization within an alkali-activated system to distilled water [44]. The chemical compositions of metal elements obtained from XRF analysis were calculated to the stoichiometric metal oxides concentration in the kaolin and metakaolin samples (Table 1) and in the alkali-activated AM-28 samples (Table 2).
Figure 6 illustrates the Si, Na, Al, and K releasing from metakaolins M1, M2 and M3 (Figure 6a) and their alkali-activated products AM1-28, AM2-28, and AM3-28 (Figure 6b).
The stability of metakaolins M1 and M2 in water at higher pH 9.39 and pH 9.83, respectively, was manifested by the Si/Al ratio of 2.068 (Table 3). The slightly higher release of elements Si and Al from M3 was observed at pH 8.9 (Figure 6a) at the Si/Al ratio of 3.782 (Table 3), probably due to the bonding properties of Si-Al-O in the tetrahedra (Figure 4b).
Metakaolin samples alkali-activated for 28 days exhibited good stability in water, which can be documented on the leached Si/Al ratio = 0.39 of AM1-28 at pH 10.17, in comparison with the slightly higher Si/Al ratio = 0.65 of AM2-28 and AM3-28 at higher pH 10.76 and 10.95, respectively (Table 3, Figure 6b). The highest release of Na 4.98 wt.% during leaching of AM3-28 in distilled water relates to the highest Na2O content in this sample (15.28 wt.% in Table 2). Similarly, the lowest release of Na2O 2.68 wt.% from AM1-28 corresponds to the lowest content of Na2O in this sample (14.21 wt.% in Table 2).
The ratios between leached elements wt.% from metakaolins alkali-activated AM-28 and metakaolins (e.g., AM1-28:M1 ratio in Table 3) showed higher leached content of Na from AM2-28, probably due to the lowest amount of kaolinite being in kaolins, and therefore, metakaolinite in metakaolins (Table 4).

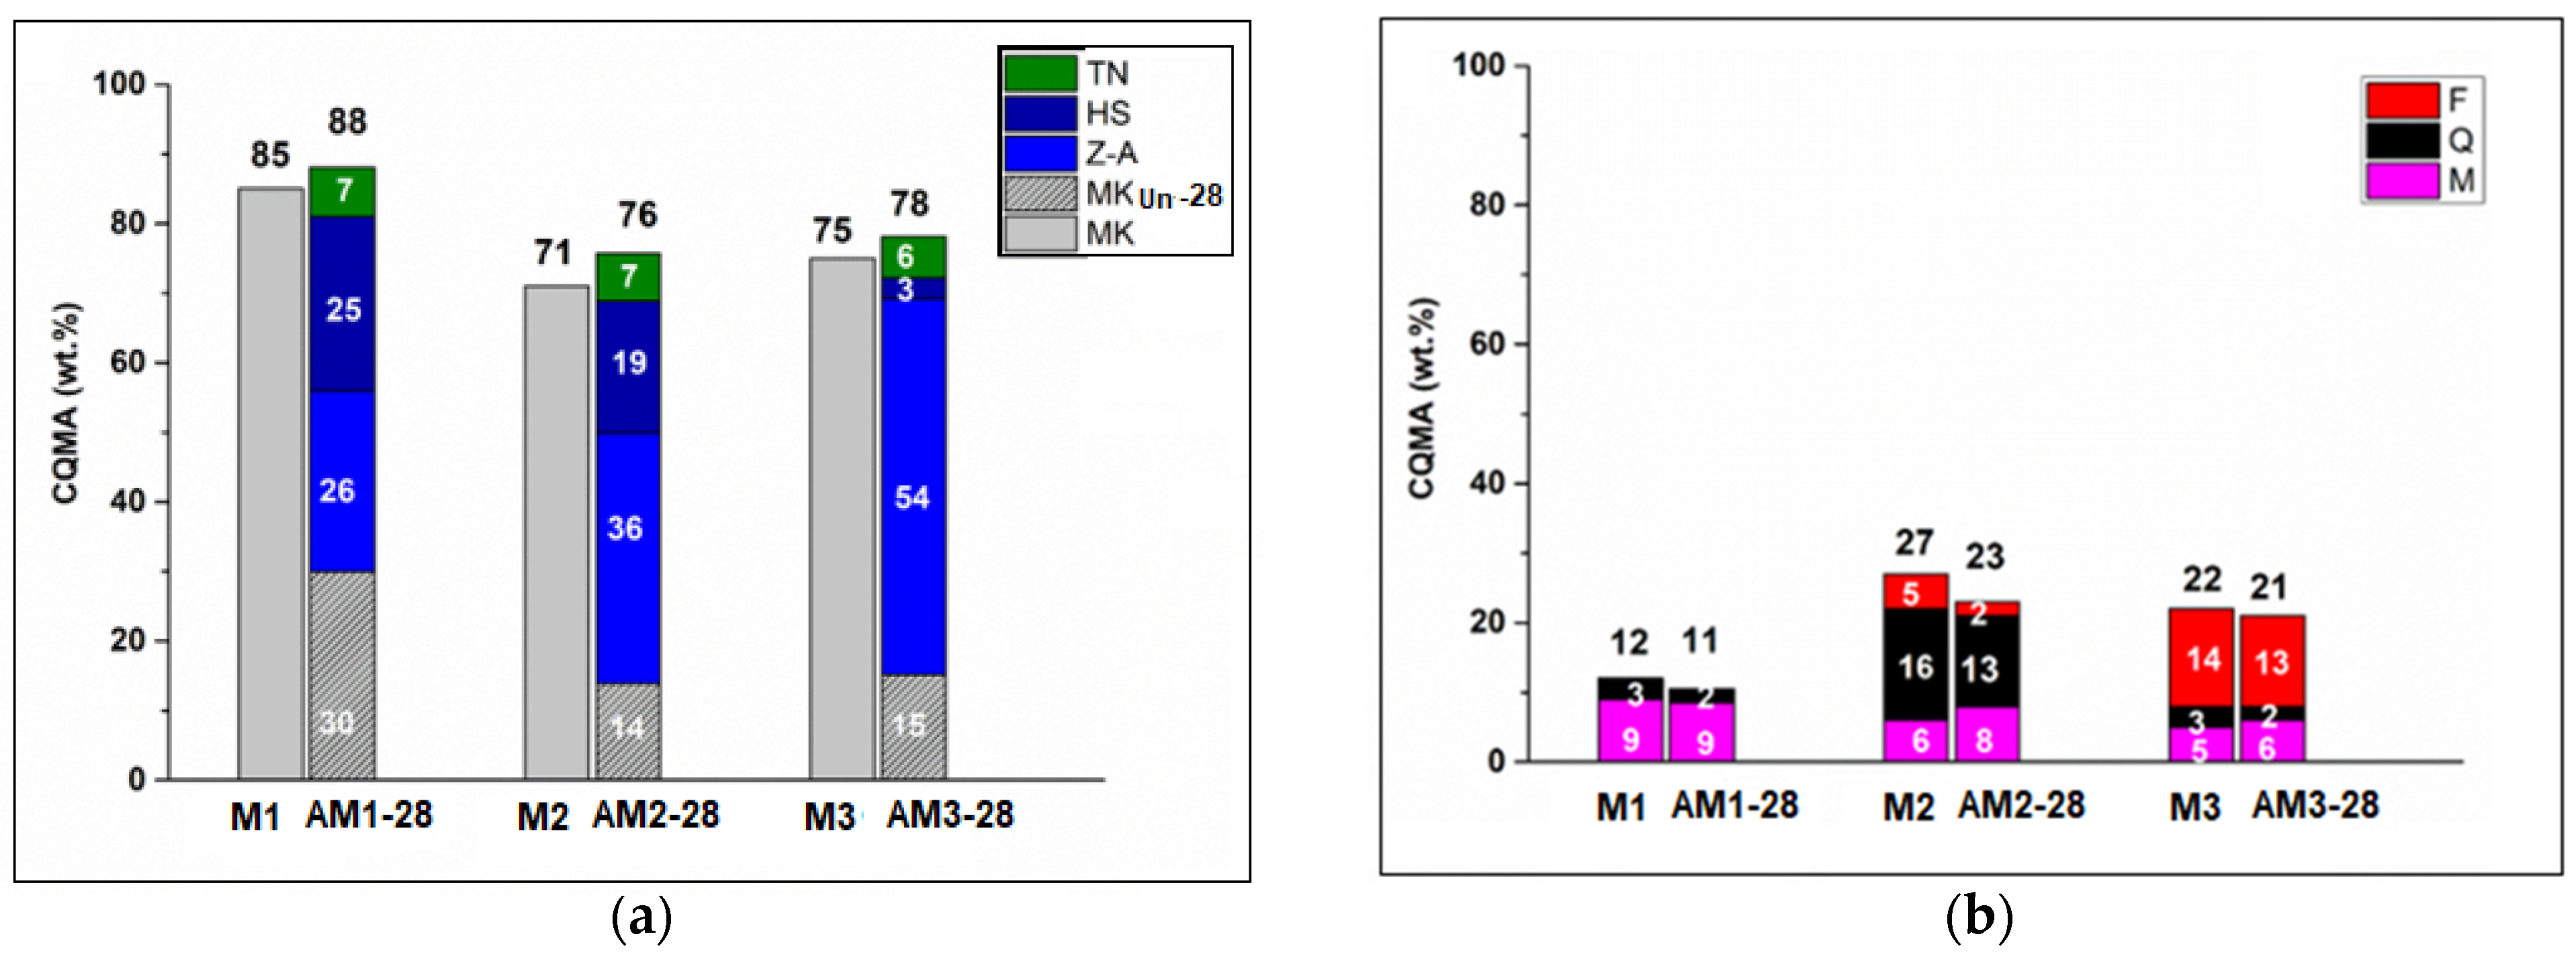
3.5. CQMA Calculations

The crystalline phases identified in XRD patterns of the kaolin samples (Figure 2a) and in the metakaolin samples (Figure 2b) were recalculated using the CQMA procedure from the elemental oxides (Table 1) using their crystallochemical formulas. The percentages of minerals in kaolin samples 1, 2 and 3 and in metakaolin samples M1, M2 and M3 (Table 4) were calculated according to Equation (2). Different amounts of metakaolinite 85.4, 70.5 and 75.0 (wt.%) produce a proportionally intensive XRD halo (Figure 2b) as well as the specific surface areas, S(BET), of 16.7, 5.2 and 11.3 (m2/g), respectively (Table 1).
Similarly, the bulk chemical analyses of metakaolin samples alkali-activated for 28 days (AM-28 in Table 2), mineral phases identified in XRD patterns (Figure 3) and their crystallochemical formulas were used for the calculation of a quantitative number of phases (Equation (2), Table 5). The chemistry of crystalline and metastable fragments (amorphous) of proto-zeolitic phases of zeolites Z-A (Na12Al12Si12O48) and HS (Na6Al6Si6O24·8H2O) was calculated according to the reaction of metakaolinite with the NaOH solution, according to Equation (6):
Al4Si4O14 + 4 NaOH + xH2O → Na4Al4Si4O16 (x + 2) H2O
NaOH reacts also with gaseous CO2 in laboratory ambient environment to the crystalline thermonatrite, TN, (Na2CO3·H2O), according to Equation (7):
2 NaOH + CO2 + H2O → Na2CO3·H2O
The bar graph in Figure 7 proves that MK in M1, M2, M3 (left bar in Figure 7a) did not react completely with NaOH in AM1-28, AM2-28, AM3-28 and transformed to the products containing different amounts of HS, Z-A and MKUn-28 (right bar). Nevertheless, the wt.% of MK in metakaolin samples (left bar) and the sums of wt.% of MKUn-28 + Z-A + HS + TN (right bar) were in good agreement and confirmed the accuracy of the chemical reaction (Equation (6)).
Regarding the quantity of accompanying minerals M, Q, and F (Figure 7b), the wt.% in MK (left bar) and in alkali-activated metakaolins AM-28 (right bar) are in good agreement, which confirms their-non-reactivity during alkaline activation.

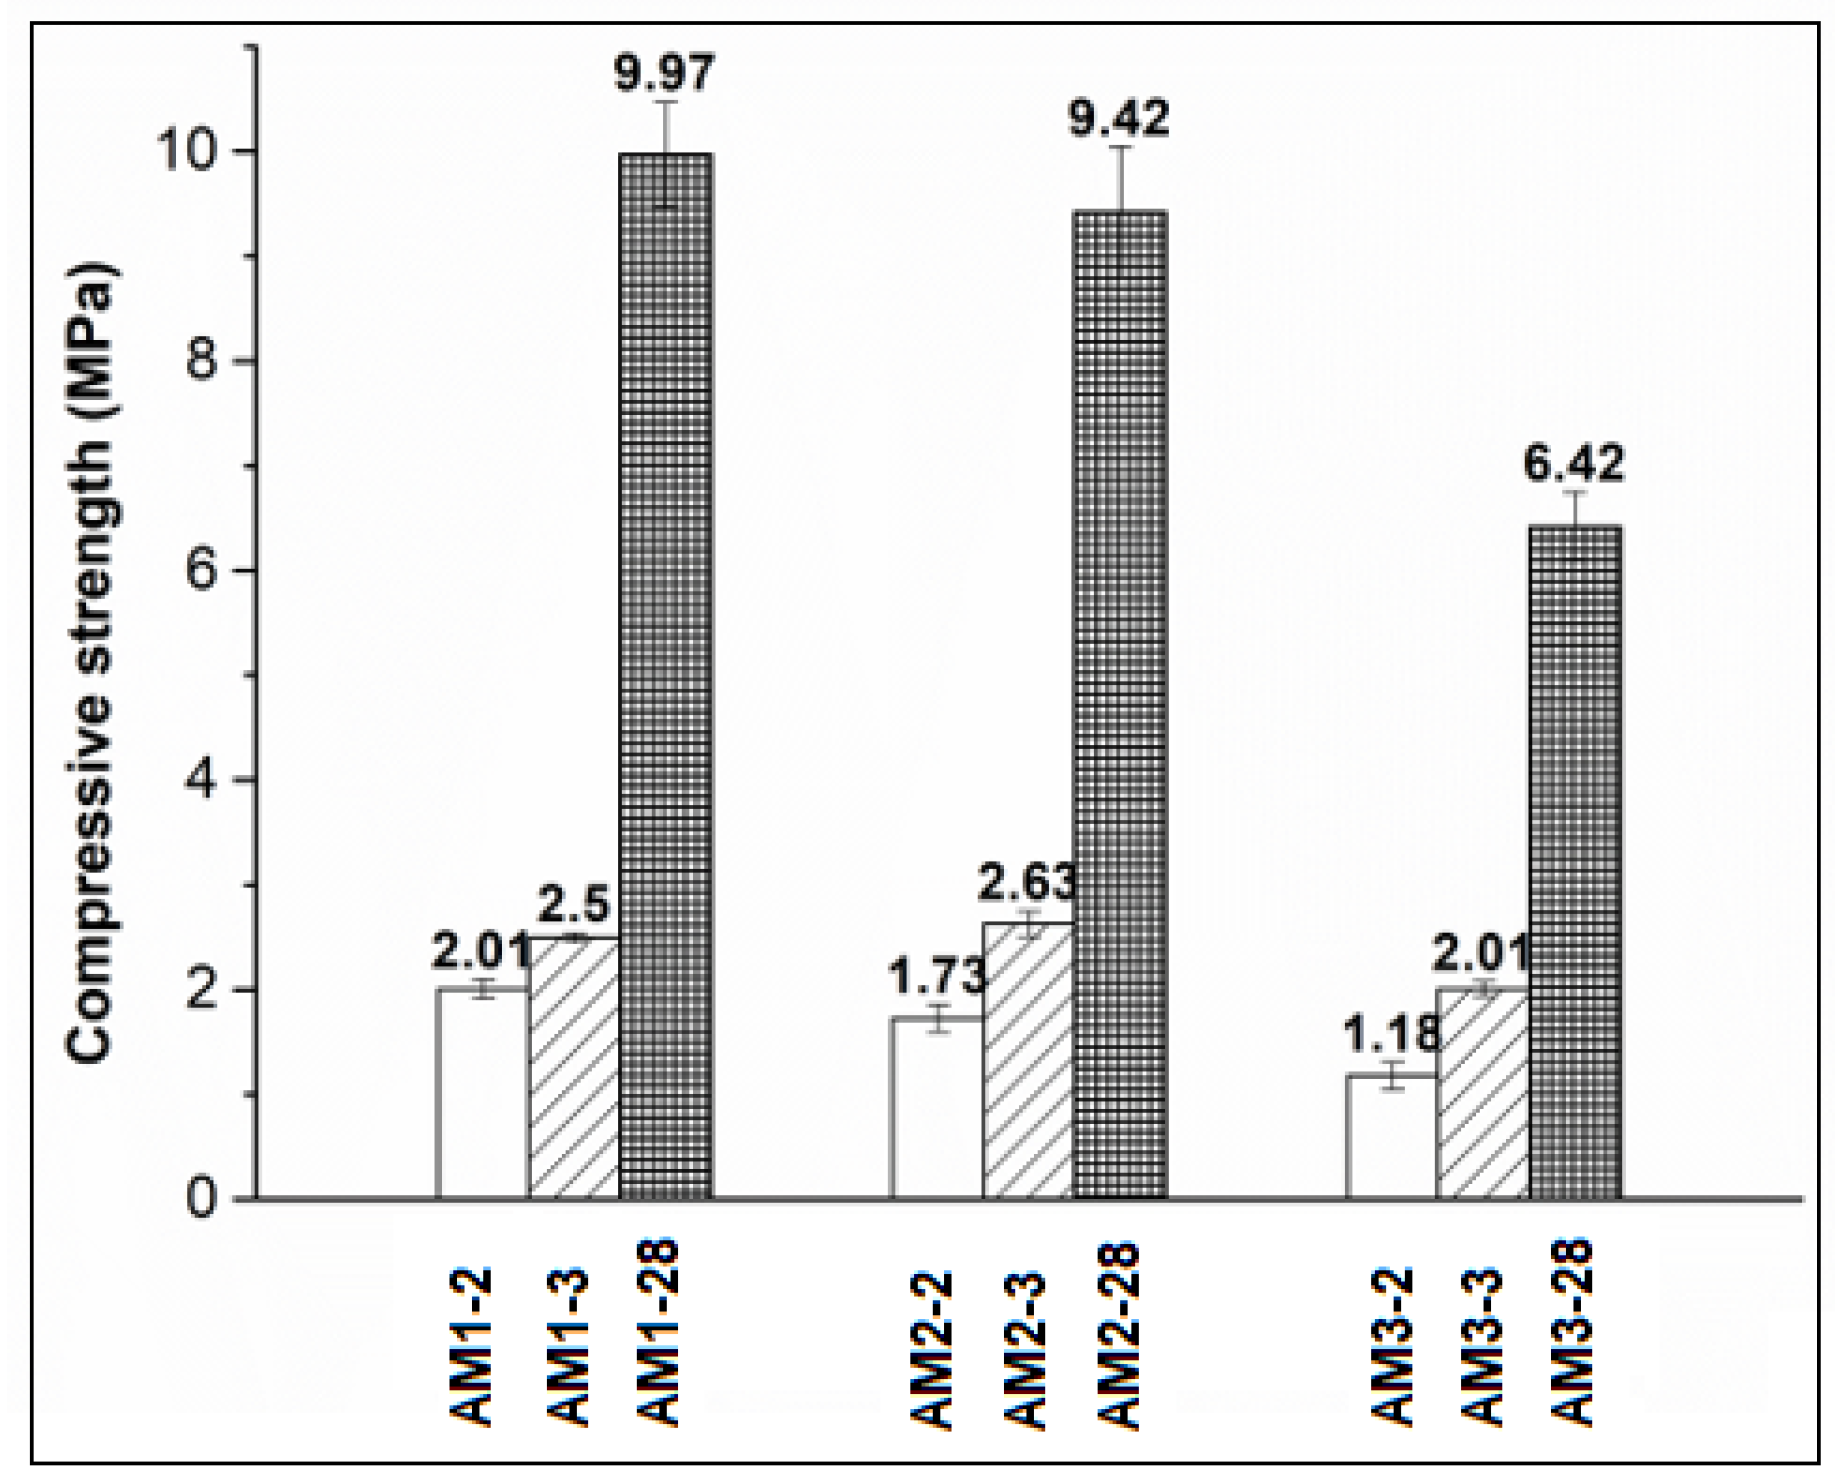
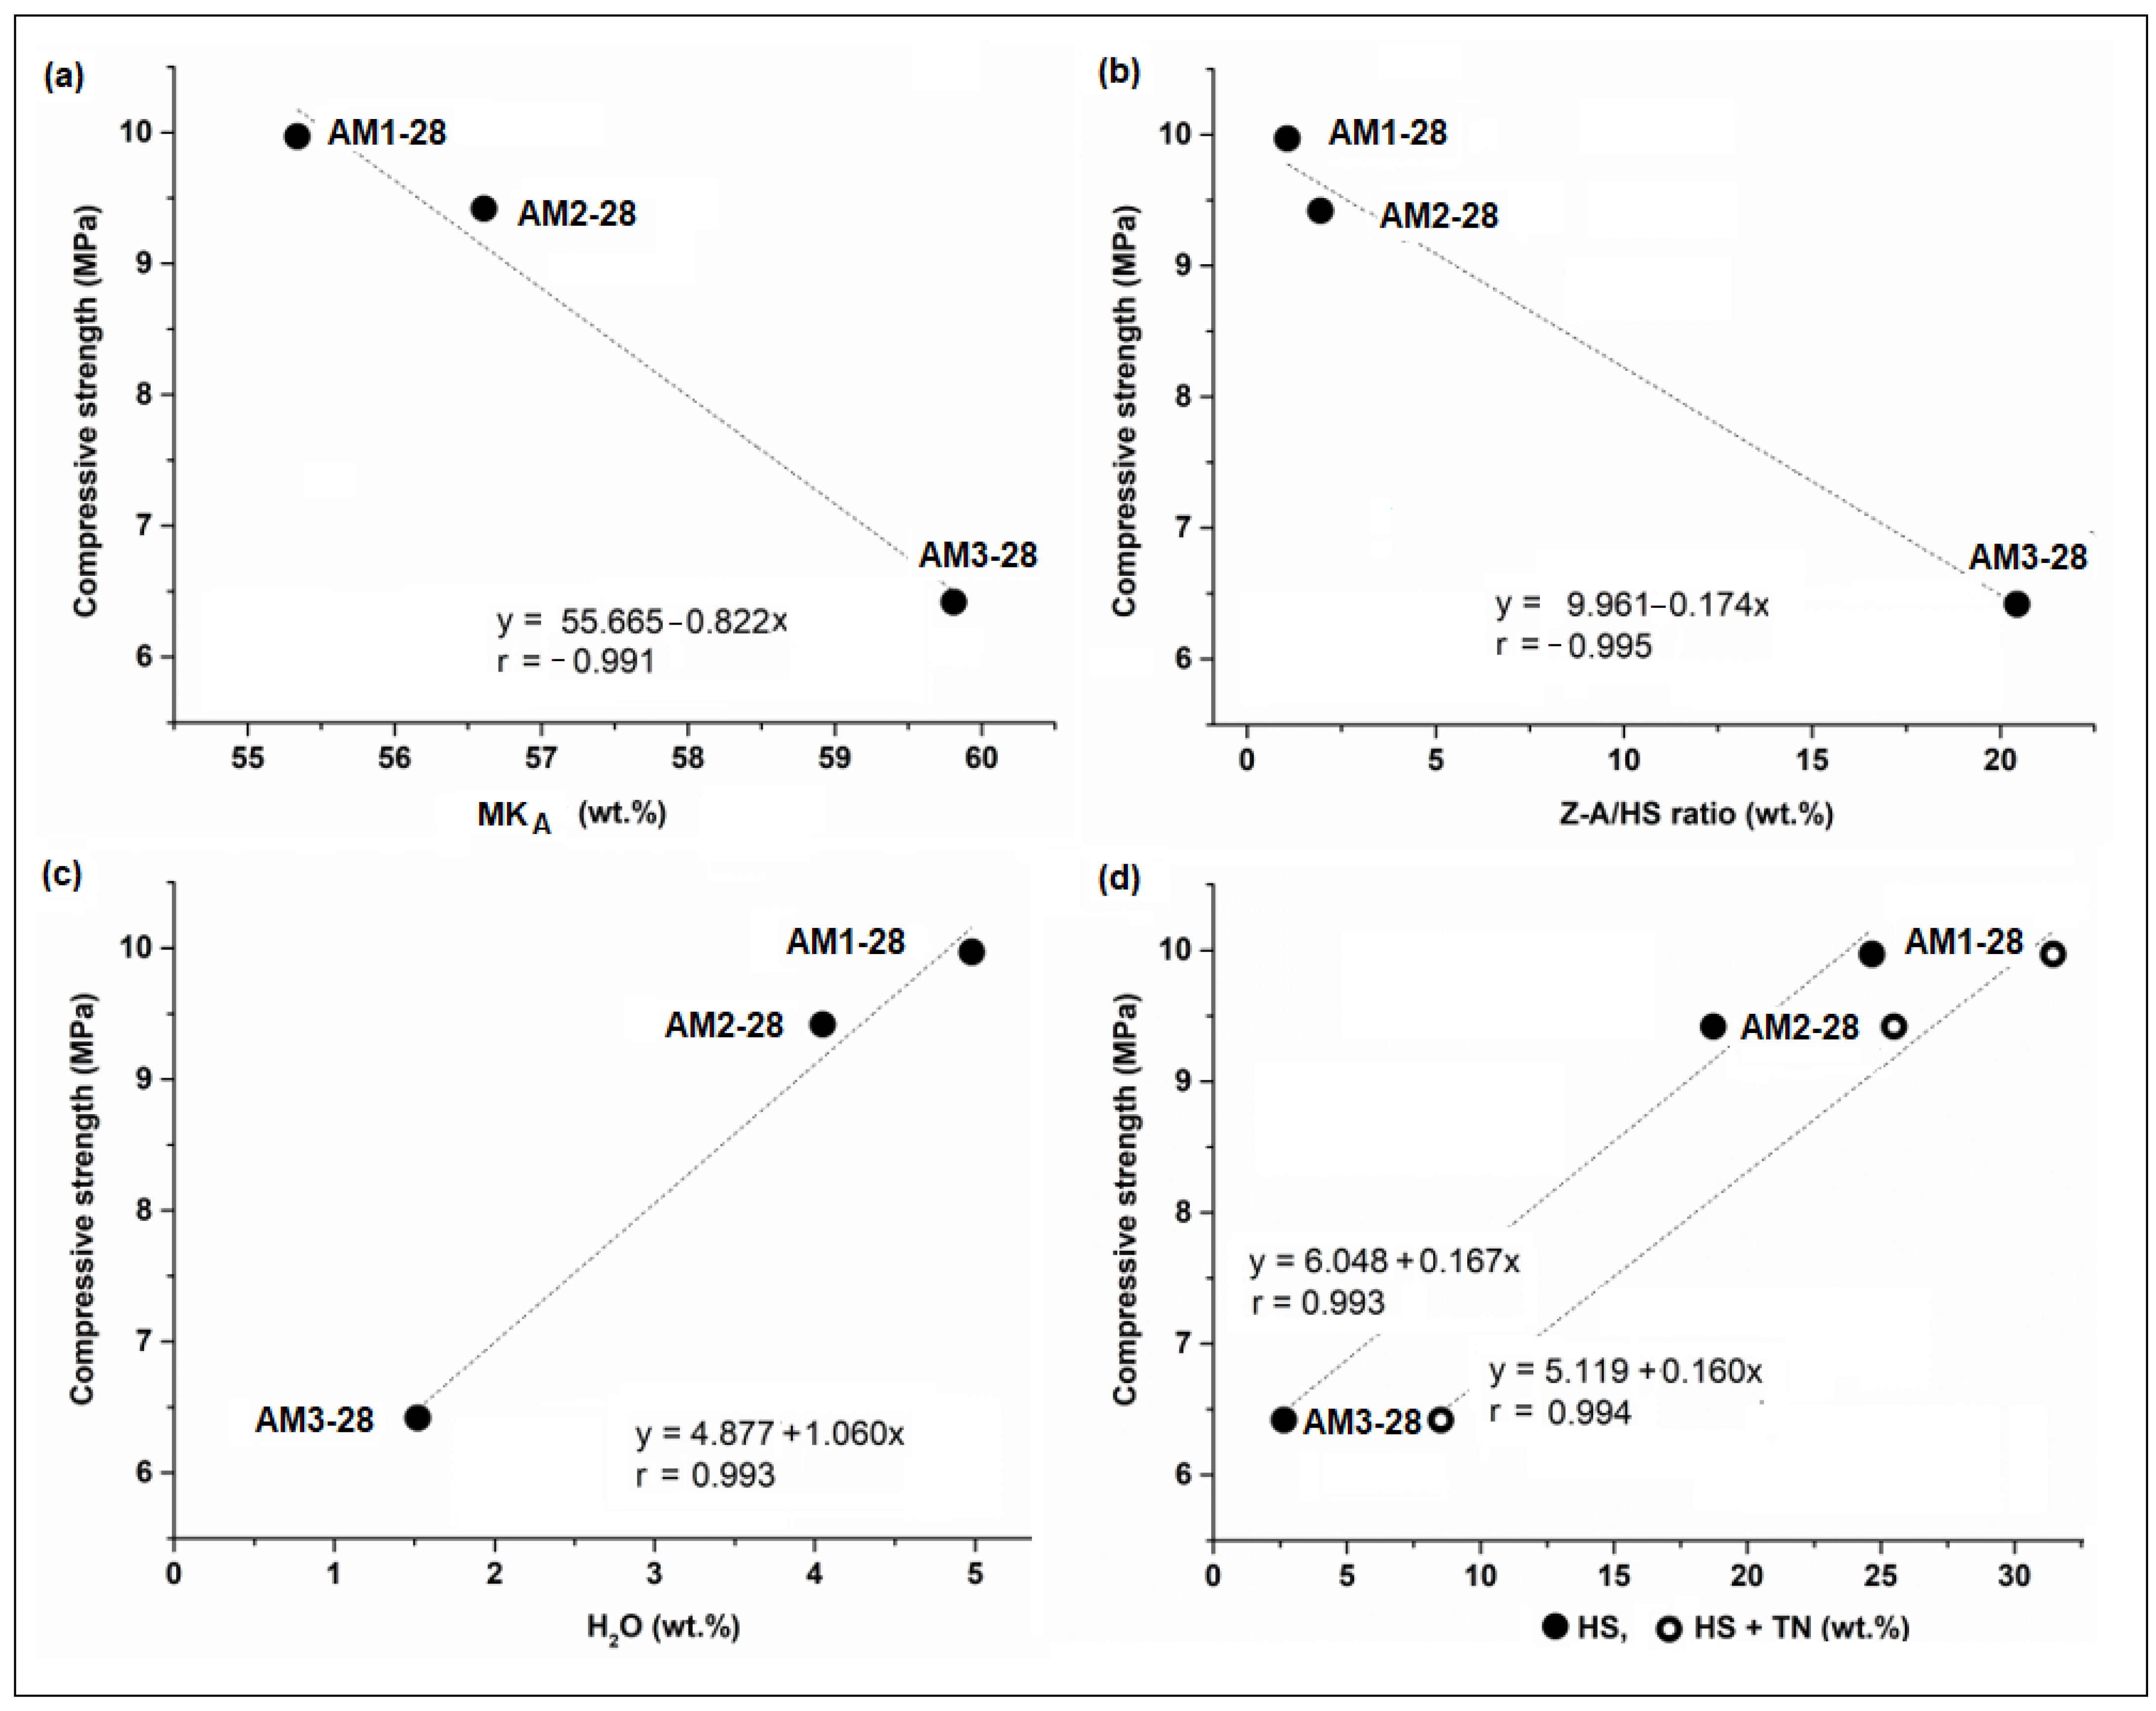
3.6. Test of Alkali-Activated Metakaolins in Compressive Strength

In the literature, several works demonstrated the effect of alkali-activated kaolins and metakaolins on compressive strength. As an example, the fraction of reacted metakaolin varied from 2.6 to 38% for geopolymers with compressive strengths varying from 3.1 to 67 MPa [17]; kaolin-based geopolymers produced low compressive strength assigned to the unreacted material and CS increase linearly with more than 50% of metakaolinite [10]; kaolin activated with 8M NaOH for 28 days showed the highest CS value of 3.38 MPa at optimized SiO2/Na2O molar ratio of 3.58 [44]; and metakaolin calcined at 700 °C and activated with 8M NaOH for 28 days expressed a CS value of 5.56 MPa [45].
In this work, the compressive strength MPa values of the three alkali-activated metakaolin samples (Figure 8) were different already after 2 days (2.01 ± 0.09; 1.73 ± 0.09 and 1.18 ± 0.13 MPa). These MPa values after three days increased by 0.5 in AM1-3, 0.9 in AM2-3 and 0.8 in AM3-3. After 28 days, CS reached 9.97 ± 0.50 MPa, 9.42 ± 0.62 MPa and 6.42 ± 0.33 MPa in AM1-28, AM2-28, and AM3-28, respectively, similar to the values with [45].
The different CS MPa values of the metakaolins alkali activated for 28 days will be related to the phase composition calculated using CQMA (Figure 9).
In alkali-activated metakaolins, metakaolinite alkali activated (MKA) to the zeolites according to Equation (6) can be calculated to MKA wt.% as the difference between MK wt.% in metakaolins (Table 2) and unreacted MKUn-28 wt.% in alkali-activated AM-28 (Table 4), according to Equation (8)
MKA = MK − Kun
CS showed a strong negative relationship to the MKA wt.% (Figure 9a), which can be supported by Equation (9). Therefore, CS is negatively related to zeolites (Z-A/HS ratio) produced from MKA (Figure 9b, Equation (10)).
CS = 55.665 − 0.822 MKA
CS = 9.961 − 0.174 Z-A/HS
The CS positive relationship was found with H2O wt.% in alkali-activated AM-28 samples (Figure 9c, Equation (11)) and bound in HS and TN (Figure 9d, Equations (12) and (13)).
CS = 4.877 + 1.060 H2O
CS = 6.048 + 0.167HS
CS = 5.119 + 0.160 (HS + TN)
Both of the previously used variables, MKA wt.% (Equation (11)) and H2O wt.% (Table 2), were used to calculate the predicted CS MPa according to Equation (14).
CS = 5.898 MKA + 8.646 H2O − 359.5
The compressive strength (CS) (MPa) of metakaolins alkali activated for 28 days (experimental (CSexp)), and CS calculated using Equations (9), (11) and (14) in Table 6 confirmed the good agreement between the CSexp and predicted CS(14) values.

4. Conclusions

The work is devoted to the structural properties of kaolins calcined at 800 °C to the metakaolins, and their alkali-activated (for 2, 3 and 28 days) products. The alkali-activated metakaolins for 28 days in distilled water were well stable. The quantitative crystalline and semi-crystalline alkali aluminosilicate hydrate phase composition was calculated from the bulk chemical analysis using the CQMA procedure with high accuracy.
The quantitative phase composition of the metakaolins alkali activated for 28 days was well related to the different compressive strength values. The regression relationships proved that the compressive strength values are higher due to a larger amount of free water and water bound in the zeolite structure and lower due to a larger amount of alkaline-activated metakaolinite, transformed into zeolite A. Other accompanying minerals (muscovite, quartz, and feldspars) were not affected by alkaline activation.

Author Contributions

Conceptualization, M.V. and Z.K.; methodology, Z.K. and J.M.; software, Z.K.; validation, J.V., L.M. and H.P.; formal analysis, Z.K.; M.V.; investigation, M.T.; resources, M.T.; data curation, Z.K. and J.V.; writing—original draft preparation, M.V.; writing—review and editing, M.V.; Z.K., J.M.; visualization, M.V.; supervision, M.V. and J.V.; project administration, M.V. and J.V. All authors have read and agreed to the published version of the manuscript.

Funding

This work was supported by EU structural funding in Operational Programme Research, Development and Education, project No. CZ.02.1.01./0.0/0.0/17_049/0008419 “COOPERATION”, and by the ERDF “Institute of Environmental Technology –Excellent Research” (No. CZ.02.1.01/0.0/0.0/16_019/0000853), Large Research Infrastructure ENREGAT (project No. LM2018098) and Ministry of Education Youth and Sports (project SP2022/13). Financial support of the Slovak Grant Agency VEGA (project No. 2/0166/21) is acknowledged.

Data Availability Statement

Not applicable.

Acknowledgments

The authors thank Jiří Burda for DTA/TG analysis and Alexandr Martaus for XRD and XRF analyses.

Conflicts of Interest

The authors declare no conflict of interest.

References

  1. Aldred, J.; Day, J. Is geopolymer concrete a suitable alternative to traditional concrete? In Proceedings of the 37th Conference on Our World in Concrete & Structures, Singapore, 29–31 August 2012. [Google Scholar]
  2. Luukkonen, T.; Abdollahnejad, Z.; Yliniemi, J.; Kinnunen, P.; Illikainen, M. One-part alkali-activated materials: A review. Cem. Concr. Res. 2018, 103, 21–34. [Google Scholar] [CrossRef]
  3. Ranjbar, N.; Kuenzel, C.; Spangenberg, J.; Mehrali, M. Hardening evolution of geopolymers from setting to equilibrium: A review. Cem. Concr. Comp. 2020, 114, 103729. [Google Scholar] [CrossRef]
  4. Davidovits, J. Geopolymers—Inorganic polymeric new materials. J. Therm. Anal. 1991, 37, 1633–1656. [Google Scholar] [CrossRef]
  5. Palomo, A.; Glasser, F.P. Chemically-bonded cementitious materials based on metakaolin. Br. Ceram. Trans. J. 1992, 91, 107–112. [Google Scholar]
  6. Provis, J.L.; Duxson, P.; Van Deventer, J.S.J.; Lukey, G.C. The role of mathematical modelling and gel chemistry in advancing geopolymer technology. Chem. Eng. Res. Des. 2005, 83, 853–860. [Google Scholar] [CrossRef]
  7. Khale, D.; Chaudhary, R. Mechanism of geopolymerization and factors influencing its development: A review. J. Mater. Sci. 2007, 42, 729–746. [Google Scholar] [CrossRef]
  8. Duxon, P.J.; Provis, J. Designing precursors for geopolymer cements. J. Am. Ceram. Soc. 2008, 91, 3864–3869. [Google Scholar] [CrossRef]
  9. Zhang, Z.; Wang, H.; Provis, J.L.; Bullen, F.; Reid, A.; Zhu, Y. Quantitative kinetic and structural analysis of geopolymers. Part 1. The activation of metakaolin with sodium hydroxide. Thermochim. Acta 2012, 539, 23–33. [Google Scholar] [CrossRef]
  10. Shvarzman, A.; Kovler, K.; Grader, G.S.; Shter, G.E. The effect of dehydroxylation/amorphization degree on pozzolanic activity of kaolinite. Cem. Concr. Res. 2003, 33, 405–416. [Google Scholar] [CrossRef]
  11. Gasparini, E.; Tarantino, S.C.; Ghigna, P.; Riccardi, M.P.; Cedillogonzalez, E.I.; Siligardi, C.; Zema, M. Thermal dehydroxylation of kaolinite under isothermal conditions. Appl. Clay Sci. 2013, 80–81, 417–425. [Google Scholar] [CrossRef]
  12. Rashad, A.M. Alkali-activated metakaolin: A short guide for civil Engineer—An overview. Constr. Build. Mater. 2013, 41, 751–765. [Google Scholar] [CrossRef]
  13. Rakhimova, N.R.; Rakhimov, R.Z. Reaction products, structure and properties of alkali-activated metakaolin cements incorporated with supplementary materials—A review. J. Mater. Res. Technol. 2019, 8, 1522–1531. [Google Scholar] [CrossRef]
  14. Granizo, M.L.; Blanco-Varela, M.T.; Martínez-Ramírez, S. Alkali activation of metakaolins: Parameters affecting mechanical, structural and microstructural properties. J. Mater. Sci. 2007, 42, 2934–2943. [Google Scholar] [CrossRef]
  15. Madsen, I.C.; Scarlett, N.V.Y.; Kern, A. Description and survey of methodologies for the determination of amorphous content via X-ray powder diffraction. Z. Krist. 2011, 266, 944–955. [Google Scholar] [CrossRef]
  16. Toraya, H.; Omote, K. Quantitative phase analysis of amorphous components in mixtures by using the direct-derivation method. J. Appl. Cryst. 2019, 52, 13–22. [Google Scholar] [CrossRef]
  17. Williams, R.P.; Hart, R.D.; Van Riessen, A. Quantification of the extent of reaction of metakaolin-based geopolymers using X-ray diffraction, scanning electron microscopy, and energy-dispersive spectroscopy. J. Am. Ceram. Soc. 2011, 94, 2663–2670. [Google Scholar] [CrossRef]
  18. Klika, Z.; Kolomazník, I.; Matýsek, D.; Kliková, C. Critical evaluation of a new method for quantitative determination of minerals in solid samples. Cryst. Res. Technol. 2016, 51, 249–264. [Google Scholar] [CrossRef]
  19. Klika, Z.; Valášková, M.; Bartoňová, L.; Maierová, P. Quantitative evaluation of crystalline and amorphous phases in clay-based cordierite ceramic. Minerals 2020, 10, 1122. [Google Scholar] [CrossRef]
  20. Brunauer, S.; Emmett, P.H.; Teller, E. Adsorption of gases in multimolecular layers. J. Am. Chem. Soc. 1938, 60, 309–319. [Google Scholar] [CrossRef]
  21. Vlček, J.; Topinková, M.; Klárová, M.; Maierová, P.; Ovčačíková, H.; Matějka, V.; Martaus, S.; Blahůšková, V. Alkali-activated metakaolin and fly ash as unfired ceramic bonding systems. Minerals 2021, 11, 197. [Google Scholar] [CrossRef]
  22. Frost, R.L.; Vassallo, A.M. The dehydroxylation of the kaolinite clay minerals using infrared emission spectroscopy. Clay Clay Min. 1996, 44, 635–651. [Google Scholar] [CrossRef]
  23. Brindley, G.W.; Porter, A.R.D. Occurrence of dickite in Jamaica-ordered and disordered varieties. Am. Miner. 1978, 63, 554–562. [Google Scholar]
  24. Balek, V.; Murat, M. The emanation thermal analysis of kaolinite clay minerals. Thermochim. Acta 1996, 282–283, 385–397. [Google Scholar] [CrossRef]
  25. MacKenzie, K.J.D.; Brown, I.W.M.; Meinhold, R.H.; Bowden, M.E. Outstanding problems in the kaolinite-mullite reaction sequence investigated by 29Si and 27Al Solid-state nuclear magnetic resonance: I, Metakaolinite. J. Am. Ceram. Soc. 1985, 68, 293–297. [Google Scholar] [CrossRef]
  26. Maiti, G.C.; Freund, F. Dehydration-related proton conductivity in kaolinite. Clay Min. 1981, 16, 395–413. [Google Scholar] [CrossRef]
  27. Guggenheim, S.; Chang, Y.H.; Koster van Groos, A.F. Muscovite dehydroxylation: High-temperature studies. Am. Miner. 1987, 72, 537–550. [Google Scholar]
  28. Suitch, P.R. Mechanism for the dehydroxylation of kaolinite, dickite, and nacrite from room temperature to 455 °C. J. Am. Ceram. Soc. 1986, 69, 61–65. [Google Scholar] [CrossRef]
  29. Chen, P.Y.; Wang, M.K.; Yang, D.S. Mineralogy of dickite and nacrite from Northern Taiwan. Clay Clay Min. 2001, 49, 586–595. [Google Scholar] [CrossRef]
  30. Peng, H.; Vaughan, J.; Vogrin, J. The effect of thermal activation of kaolinite on its dissolution and reprecipitation as zeolites in alkaline aluminate solution. Appl. Clay Sci. 2018, 157, 189–197. [Google Scholar] [CrossRef]
  31. Živica, V.; Balkovic, S.; Drabik, M. Properties of metakaolin geopolymer hardened paste prepared by high-pressure compaction. Constr. Build. Mater. 2011, 25, 2206–2213. [Google Scholar] [CrossRef]
  32. Fletcher, R.A.; MacKenzie, K.J.D.; Nicholson, C.L.; Shimada, S. The composition range of aluminosilicate geopolymer. J. Eur. Ceram. Soc. 2005, 25, 1471–1477. [Google Scholar] [CrossRef]
  33. Hajimohammadi, A.; Provis, J.L.; van Deventer, J.S.J. The effect of silica availability on the mechanism of geopolymerization. Cem. Concr. Res. 2011, 41, 210–216. [Google Scholar] [CrossRef]
  34. Farmer, V.C. The layer silicates. In Infrared Spectra of Minerals; Farmer, V.C., Ed.; Mineralogical Society: London, UK, 1974; pp. 331–363. [Google Scholar]
  35. Madejová, J.; Gates, W.P.; Petit, S. IR spectra of clay minerals. In Infrared and Raman Spectroscopies of Clay Minerals. Developments in Clay Science; Gates, W.P., Klopproge, J.T., Madejová, J., Bergaya, F., Eds.; Elsevier: Amsterdam, The Netherlands, 2017; Volume 8, pp. 107–149. [Google Scholar]
  36. Russell, J.D.; Fraser, A.R. Infrared methods. In Clay Mineralogy: Spectroscopic and Chemical Determinative Methods; Wilson, M.J., Ed.; Chapman & Hall: London, UK, 1994; pp. 11–67. [Google Scholar]
  37. Aredes, F.G.M.; Campos, T.M.B.; Machado, J.P.B.; Sakane, K.K.; Thim, G.P.; Brunelli, D.D. Effect of cure temperature on the formation of metakaolinite-based geopolymer. Ceram. Int. 2015, 41, 7302–7311. [Google Scholar] [CrossRef]
  38. Lecomte, I.; Liégeois, M.; Rulmont, A.; Cloots, R.; Maseri, F. Synthesis and characterization of new inorganic polymer composites based on kaolin or white clay and on the ground-granulated blast furnace slag. J. Mater. Res. 2003, 18, 2571–2579. [Google Scholar] [CrossRef]
  39. Alkan, M.; Hopa, C.; Yilmaz, Z.; Güler, H. The effect of alkali concentration and solid/liquid ratio on the hydrothermal synthesis of zeolite NaA from natural kaolinite. Micro. Mesoporous Mater. 2005, 86, 176–184. [Google Scholar] [CrossRef]
  40. Guo, X.; Navrotsky, A. Hydration dynamics in zeolite A—An X-ray diffraction and infrared spectroscopic study. Micro. Mesoporous Mater. 2018, 268, 197–201. [Google Scholar] [CrossRef]
  41. Balan, E.; Fritsch, E.; Juillot, F.; Allard, T.; Petit, S. Local mode interpretation of the OH overtone spectrum of 1:1 phyllosilicates. Eur. J. Mineral. 2021, 33, 209–220. [Google Scholar] [CrossRef]
  42. Baron, F.; Petit, S. Interpretation of the infrared spectra of the lizardite-nepouite series in the near- and mid-infrared range. Am. Miner. 2016, 101, 423–430. [Google Scholar] [CrossRef]
  43. Christy, A.A. Near infrared spectroscopic characterisation of surface hydroxyl groups on hydrothermally treated silica gel. Int. J. Chem. Environ. Eng. 2011, 2, 27–32. [Google Scholar]
  44. Heah, C.Y.; Kamarudin, H.; Mustafa Al Bakri, A.M.; Bnhussain, M.; Luqman, M.; Khairul Nizar, I.; Ruzaidi, C.M.; Liew, Y.M. Study on solids-to-liquid and alkaline activator ratios on kaolin-based geopolymers. Constr. Build. Mater. 2012, 35, 912–922. [Google Scholar] [CrossRef]
  45. Ayeni, O.; Onwualu, A.P.; Boakye, E. Characterization and mechanical performance of metakaolin-based geopolymer for sustainable building applications. Constr. Build. Mater. 2021, 272, 121938. [Google Scholar] [CrossRef]
Figure 1. Thermal curves of kaolin samples 1–3.
Minerals 12 01342 g001
Figure 2. XRD patterns of: (a) kaolin samples 1–3 (for clarity, peaks of kaolinite are unmarked) and (b) metakaolin samples M1, M2 and M3. Q—quartz, M—muscovite, F—orthoclase. Metakaolinite peaks halo was separated from the background by a dotted line.
Minerals 12 01342 g002
Figure 3. XRD patterns of alkali-activated metakaolins: (a) M1, (b) M2 and (c) M3. Q—quartz, M—muscovite, F—orthoclase, *—zeolite A, ꞌ—hydrosodalite, +—thermonatrite. The area of halo under the amorphous scattering hump is separated from the background by a dotted line.
Minerals 12 01342 g003
Figure 4. MIR spectra of: (a) kaolins, (b) metakaolins, and (c) alkali-activated metakaolins for 28 days.
Minerals 12 01342 g004
Figure 5. NIR spectra of: kaolin 1, metakaolin M1 and alkali-activated AM1-28.
Minerals 12 01342 g005
Figure 6. Relation between the elements in distilled water leached from (a) metakaolins (M) and (b) alkali activated AM-28.
Minerals 12 01342 g006
Figure 7. Graphical comparison of phases (wt. %) calculated by CQMA in: (a) MK in metakaolins (M) (left bar) and alkali-activated AM-28 products TN, HS, Z-A and MKUn-28 (right bar); (b) muscovite (M), quartz (Q) and orthoclase (F) in metakaolins (M) (left bar) and in alkali-activated AM-28 products (right bar).
Minerals 12 01342 g007
Figure 8. Compressive strength of alkali-activated metakaolins.
Minerals 12 01342 g008
Figure 9. Compressive strength of AM-28 metakaolins in relation to wt.% (a) MKA; (b) Z-A/HS; (c) H2O; and (d) HS and HS + TN.
Minerals 12 01342 g009
Table 1. The oxides composition of kaolin and metakaolin samples and the specific surface area, S(BET).
Oxides (wt.%)123M1M2M3
SiO246.9653.8049.4054.1160.3555.70
TiO20.260.900.880.301.280.70
Al2O336.4531.6034.7241.8034.9638.42
Fe2O31.060.620.861.180.701.02
CaO0.300.090.190.280.100.25
MgO0.330.270.310.360.360.36
Na2O<0.01<0.01<0.01<0.01<0.01<0.01
K2O0.961.402.601.101.502.95
L.O.I. 113.3011.1010.620.570.290.17
Total99.6299.7899.5899.7099.5499.57
S(BET)
(m2/g)
17.95.612.716.75.211.3
1 Loss on ignition at 1000 °C.
Table 2. The oxides composition of alkali-activated AM-28 samples.
Oxides (wt.%)AM1-28AM2-28AM3-28
SiO242.7347.7145.31
TiO20.241.010.57
Al2O333.0027.6431.25
Fe2O30.930.550.83
CaO0.230.080.20
MgO0.290.290.29
Na2O14.2114.8615.28
K2O0.871.182.40
CO22.342.231.94
H2O4.984.051.52
Total99.8299.6099.59
Table 3. Metakaolins and alkali-activated metakaolins AM-28: elements (wt. %) leached at pH in distilled water.
SamplespHAlSiNaK
M19.390.00590.01220.00850.0108
M29.830.00590.01220.00570.0133
M38.900.01420.05370.01940.0083
AM1-2810.170.35900.14002.680.0312
AM2-2810.760.26600.17403.530.0365
AM3-2810.950.28600.18804.940.0404
AM1-28:M1 61113152.88
AM2-28:M2 45146192.74
AM3-28:M3 203.52544.86
Table 4. CQMA of minerals in kaolin and metakaolin samples.
Minerals
(wt.%)
123M1M2M3
Metakaolinite (MK)0.000.000.0085.4470.5475.02
Kaolinite (K)88.6575.5177.280.000.000.00
Muscovite (M)6.403.766.829.956.445.32
Orthoclase (F)0.005.1212.320.004.9814.22
Quartz (Q)2.4413.431.982.8315.703.20
TiO20.230.890.850.261.250.68
Fe2O31.000.580.791.080.640.97
Total98.7299.29100.0599.5799.5499.41
sumDiff0.6530.2130.3380.2290.0230.084
sumDiff not exceeding 1.0 indicates the correctness of the calculation.
Table 5. CQMA of alkali-activated AM-28 samples.
Phases (wt.%)AM1-28AM2-28AM3-28
Metakaolinite (MKUn-28)30.0613.8915.19
Muscovite (M)8.457.946.32
Orthoclase (F)0.002.1613.02
Quartz (Q)2.1312.591.58
Zeolite A (Z-A)26.3036.3854.17
Hydrosodalite (HS)24.6718.722.65
Thermonatrite (TN)7.116.785.87
TiO20.240.240.57
CaO0.270.080.20
Fe2O30.270.080.20
Total99.2398.8199.50
sumDiff0.8390.8260.613
Table 6. Compressive strength CS (MPa) of metakaolins alkali-activated for 28 days experimental (CSexp) and predicted CS using Equations (9), (11) and (14).
SamplesCSexpCS(9)CS(11)CS(14)
AM1-289.97 ± 0.5010.18a10.159.96
AM2-289.42 ± 0.629.139.179.42
AM3-286.42 ± 0.336.506.496.42
Publisher’s Note: MDPI stays neutral with regard to jurisdictional claims in published maps and institutional affiliations.

