
Lithium Enrichment by the Carbothermal Reduction of Spodumene Ore and the Preparation of Manganese-Silicon Alloy

 ,
,
Abstract
:1. Introduction
2. Materials and Methods
2.1. Materials
2.2. Methods
2.3. Characterization Methods
2.3.1. Lithium Volatilization Rate
2.3.2. Lithium Enrichment Rate
2.3.3. Alloy Direct Yield
2.3.4. Testing Equipment
3. Results and Discussion
3.1. Thermodynamic Calculations
3.2. Condensate Analysis
3.3. The Effect of Temperature
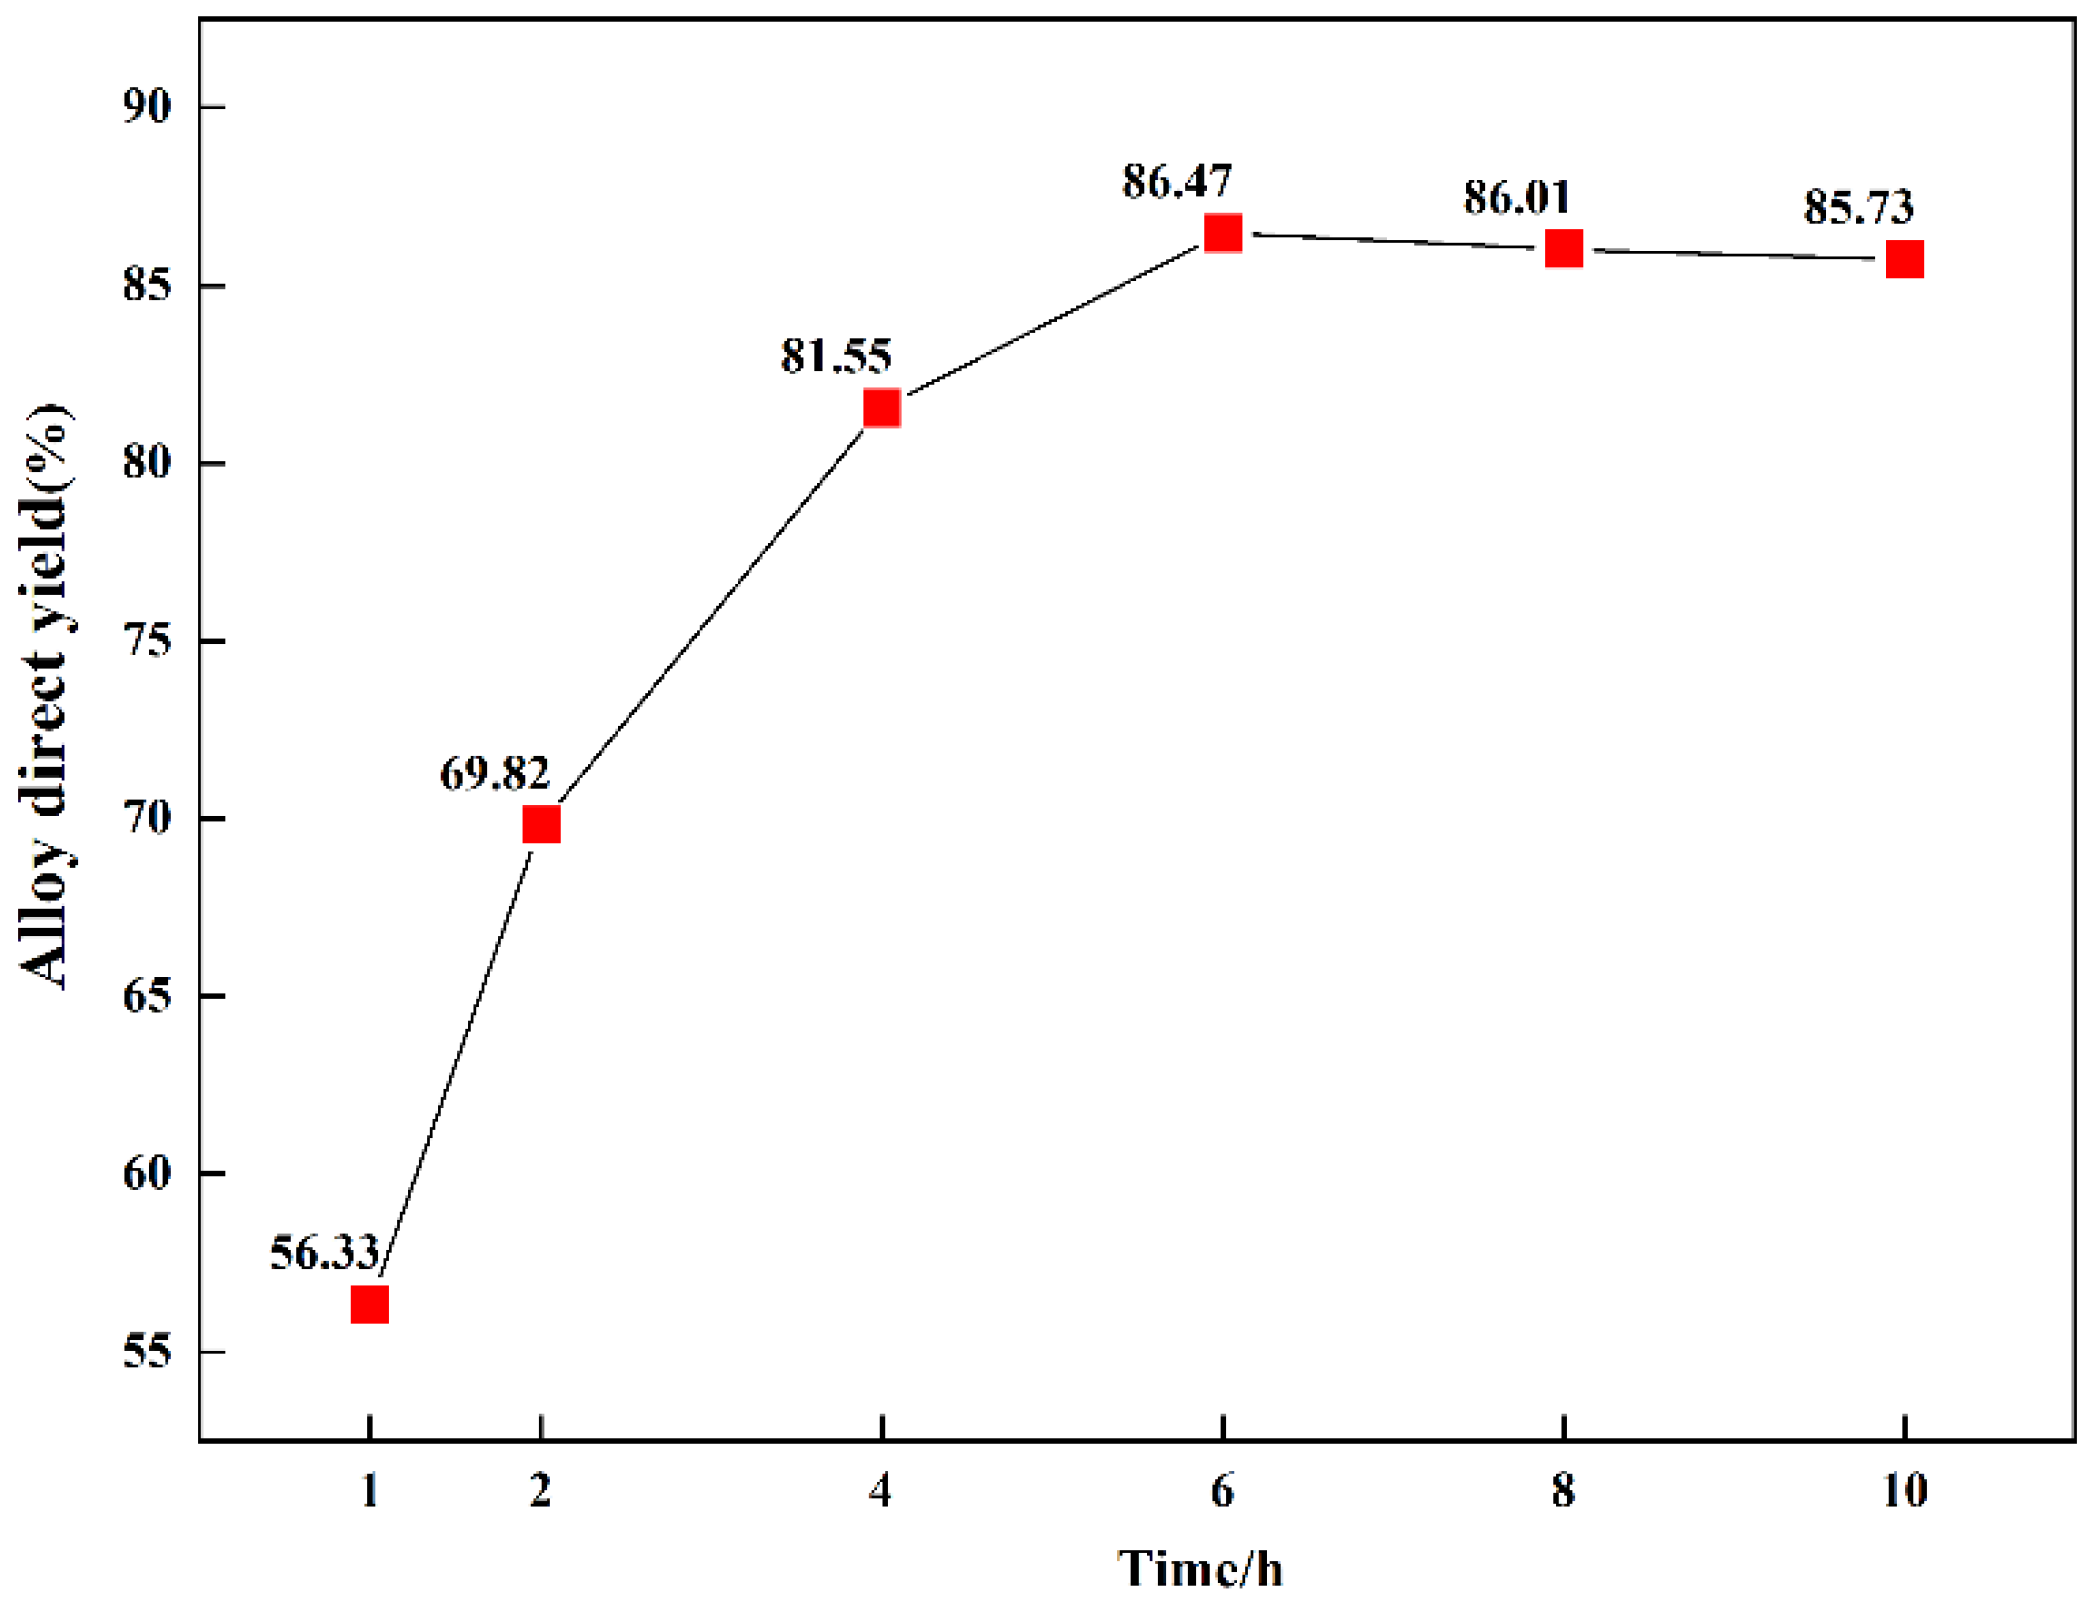
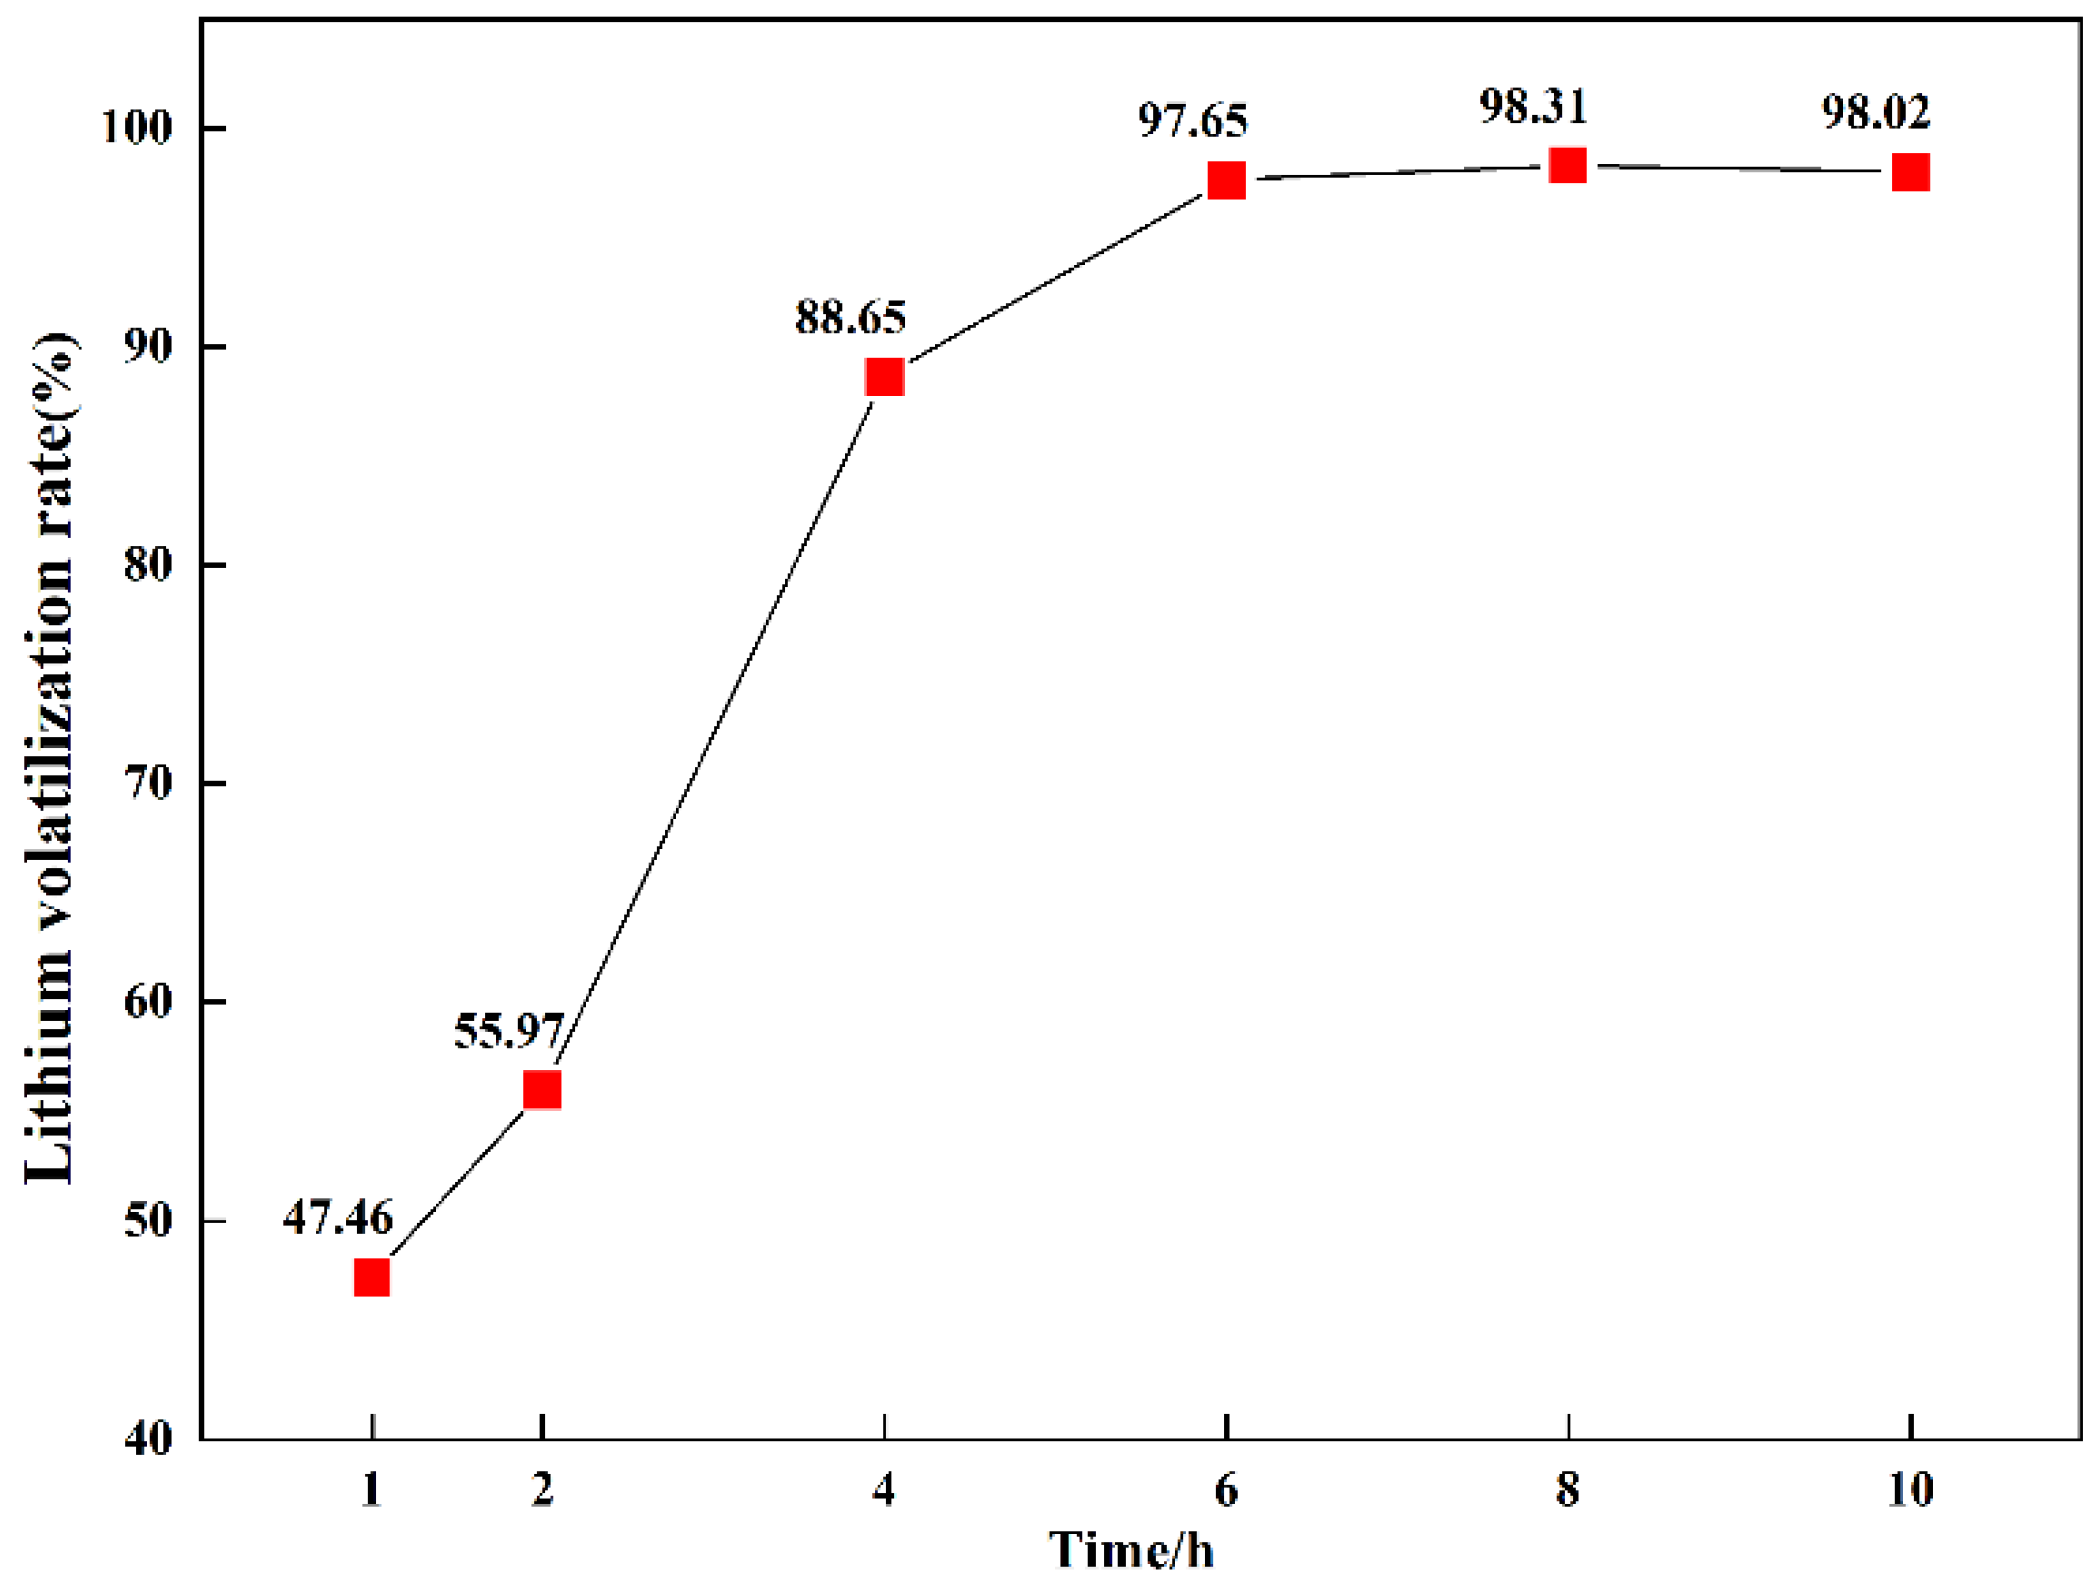
3.4. The Effect of Time
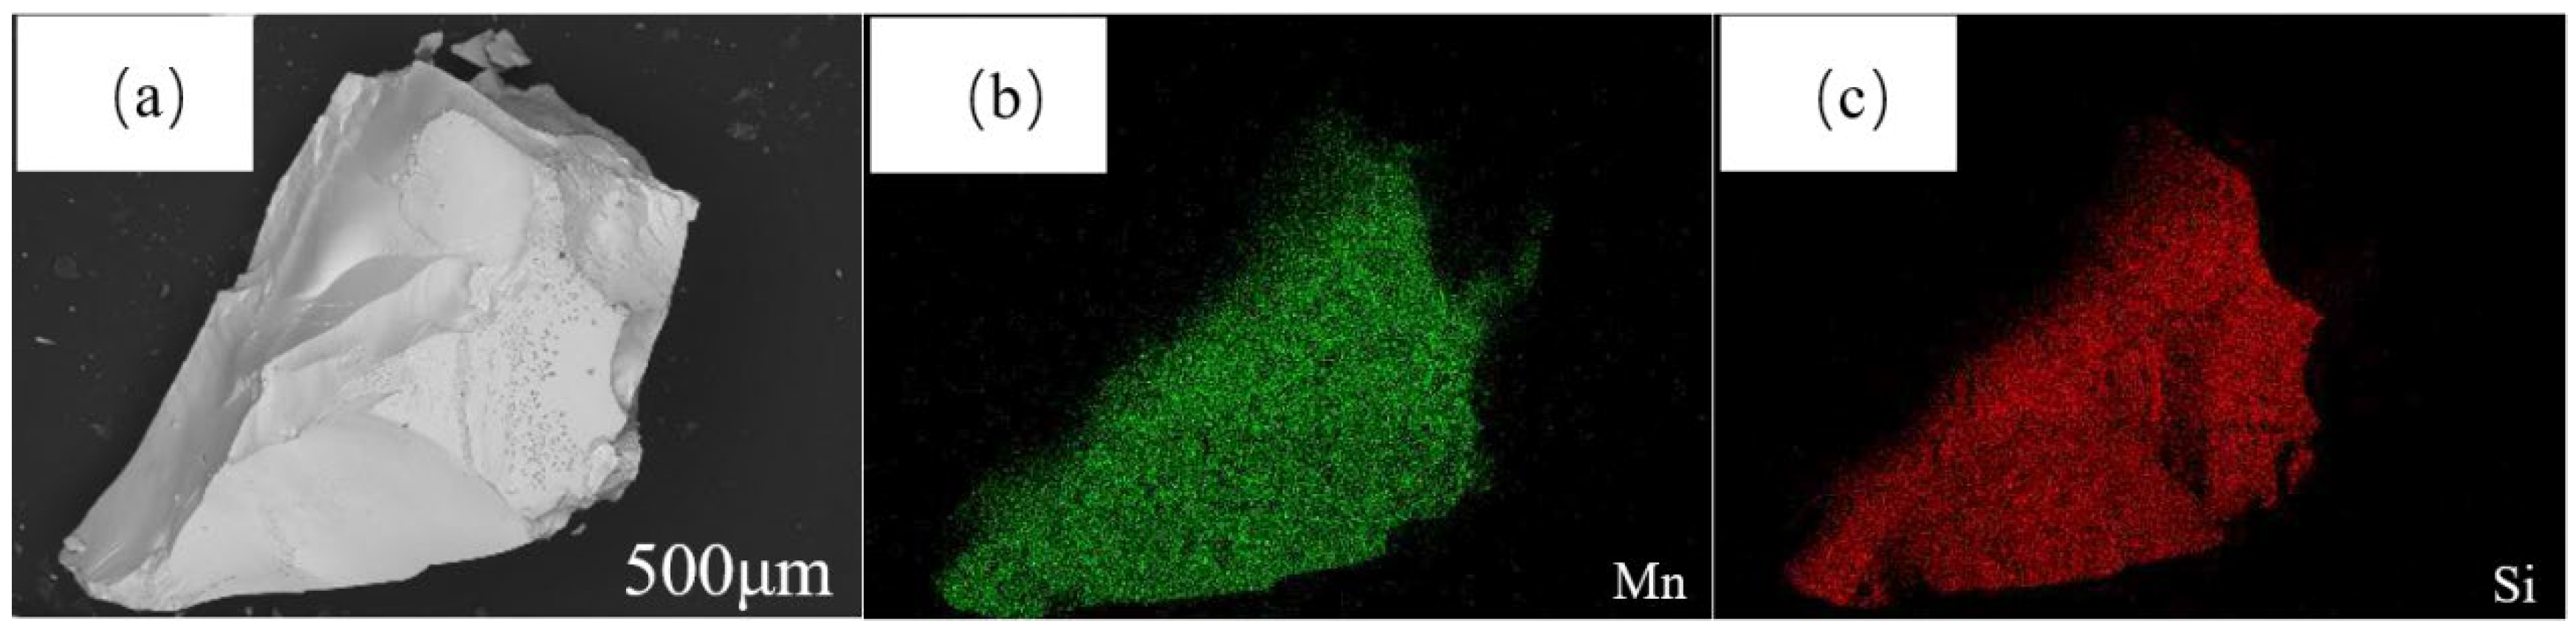
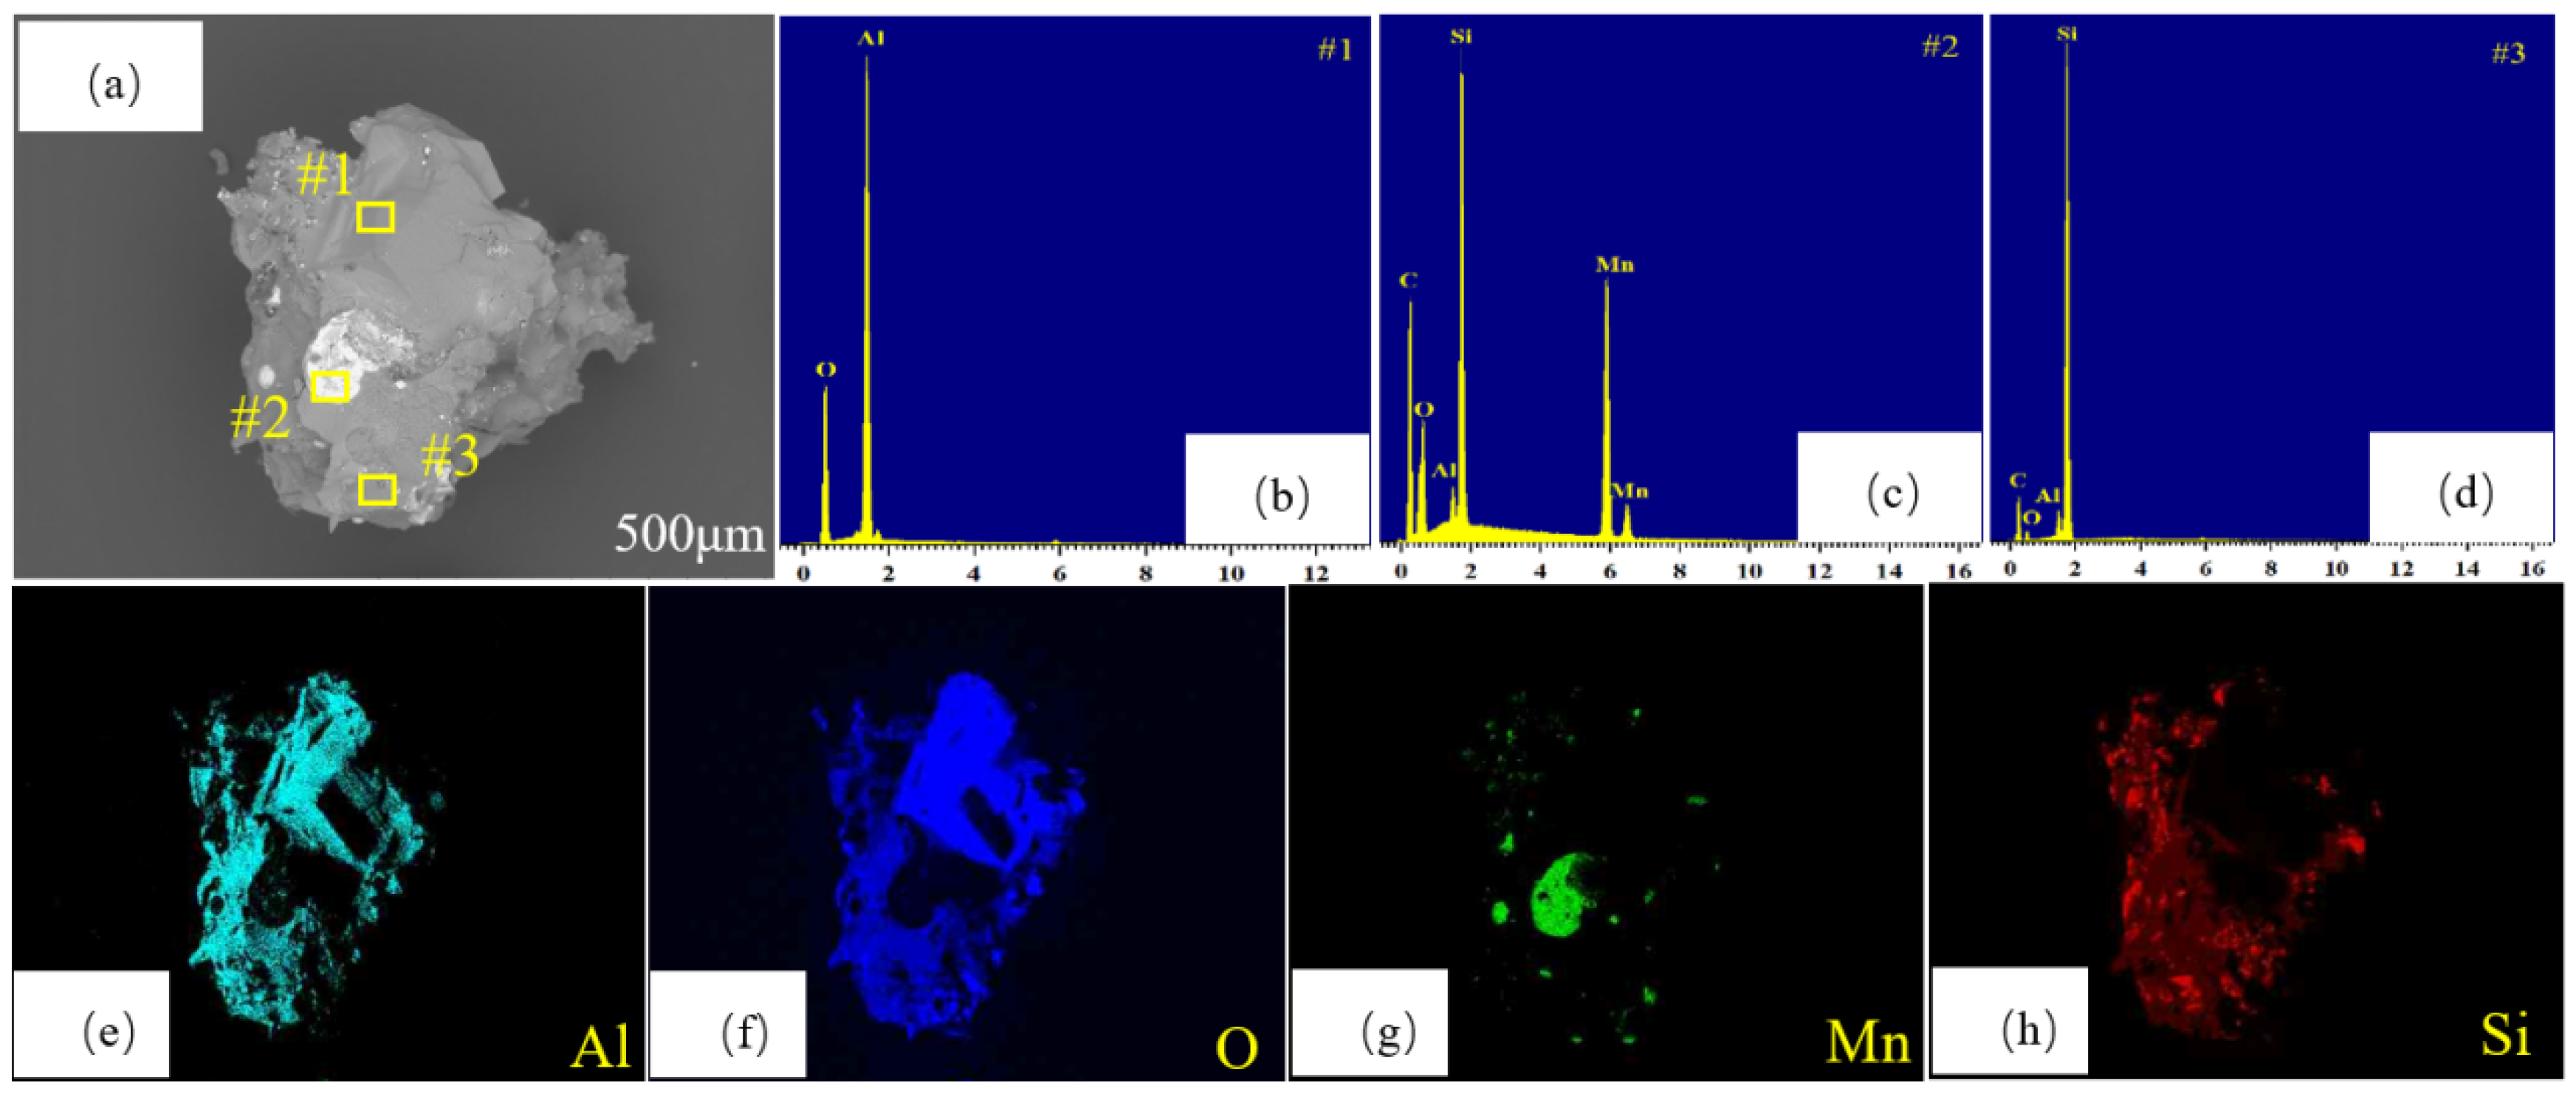
3.5. SEM-EDS Analysis
4. Conclusions
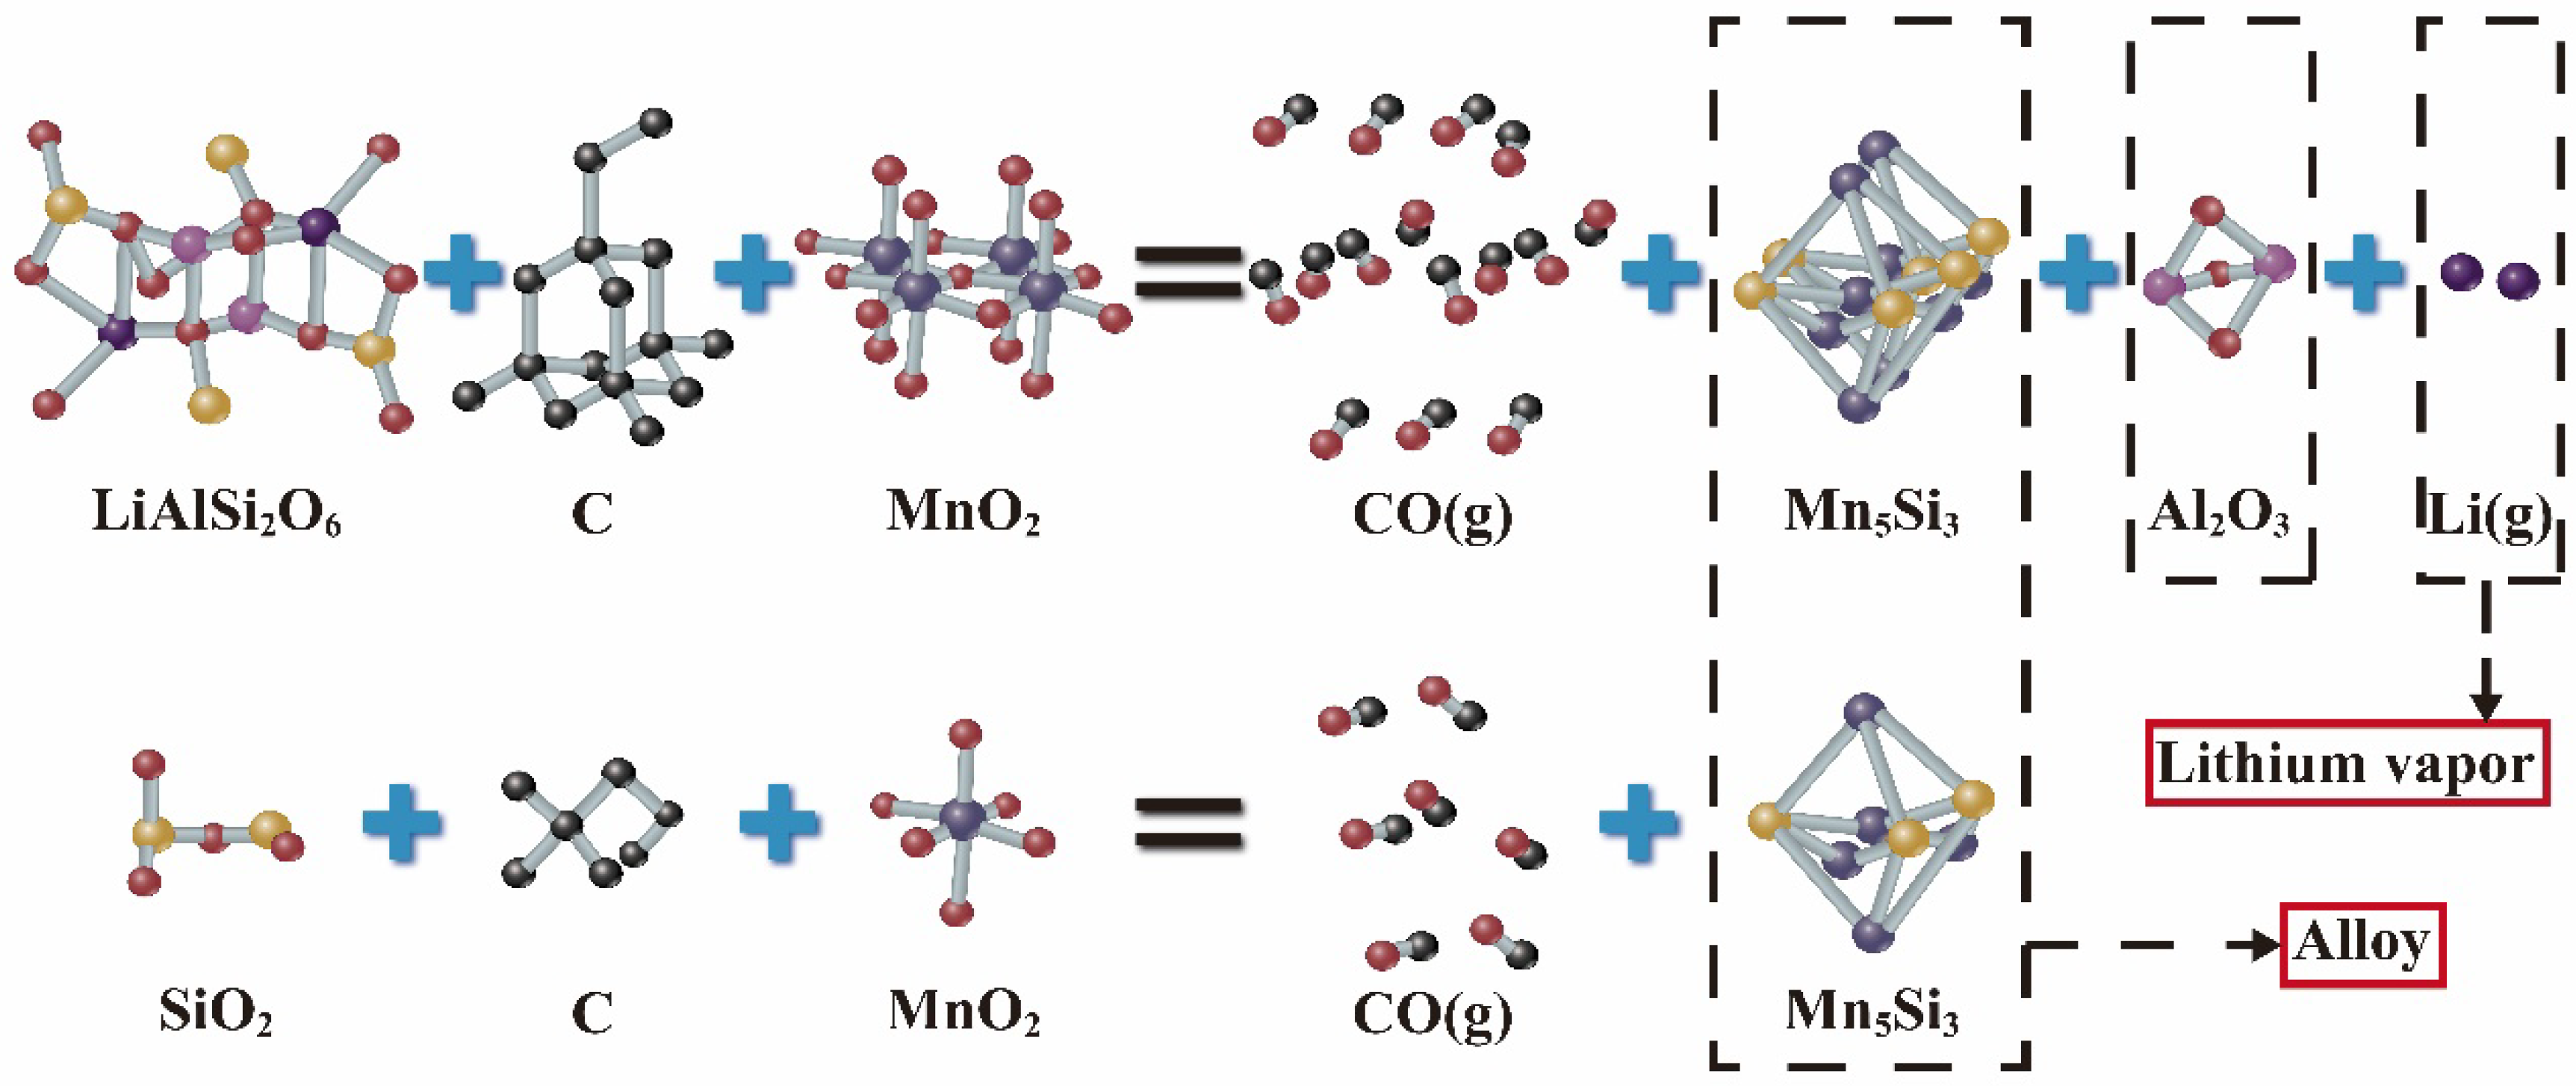
- Thermodynamic calculations were carried out using HSC6.0 thermodynamic software. We found that SiO2 in the ore preferentially participated in the reaction compared with LiAlSi2O6. Compared with the reaction of SiO2 + C and LiAlSi2O6 + C, the decrease was 651 K and 667 K, respectively, indicating that the addition of MnO2 reduced the reaction temperature and increased the feasibility of the reaction.
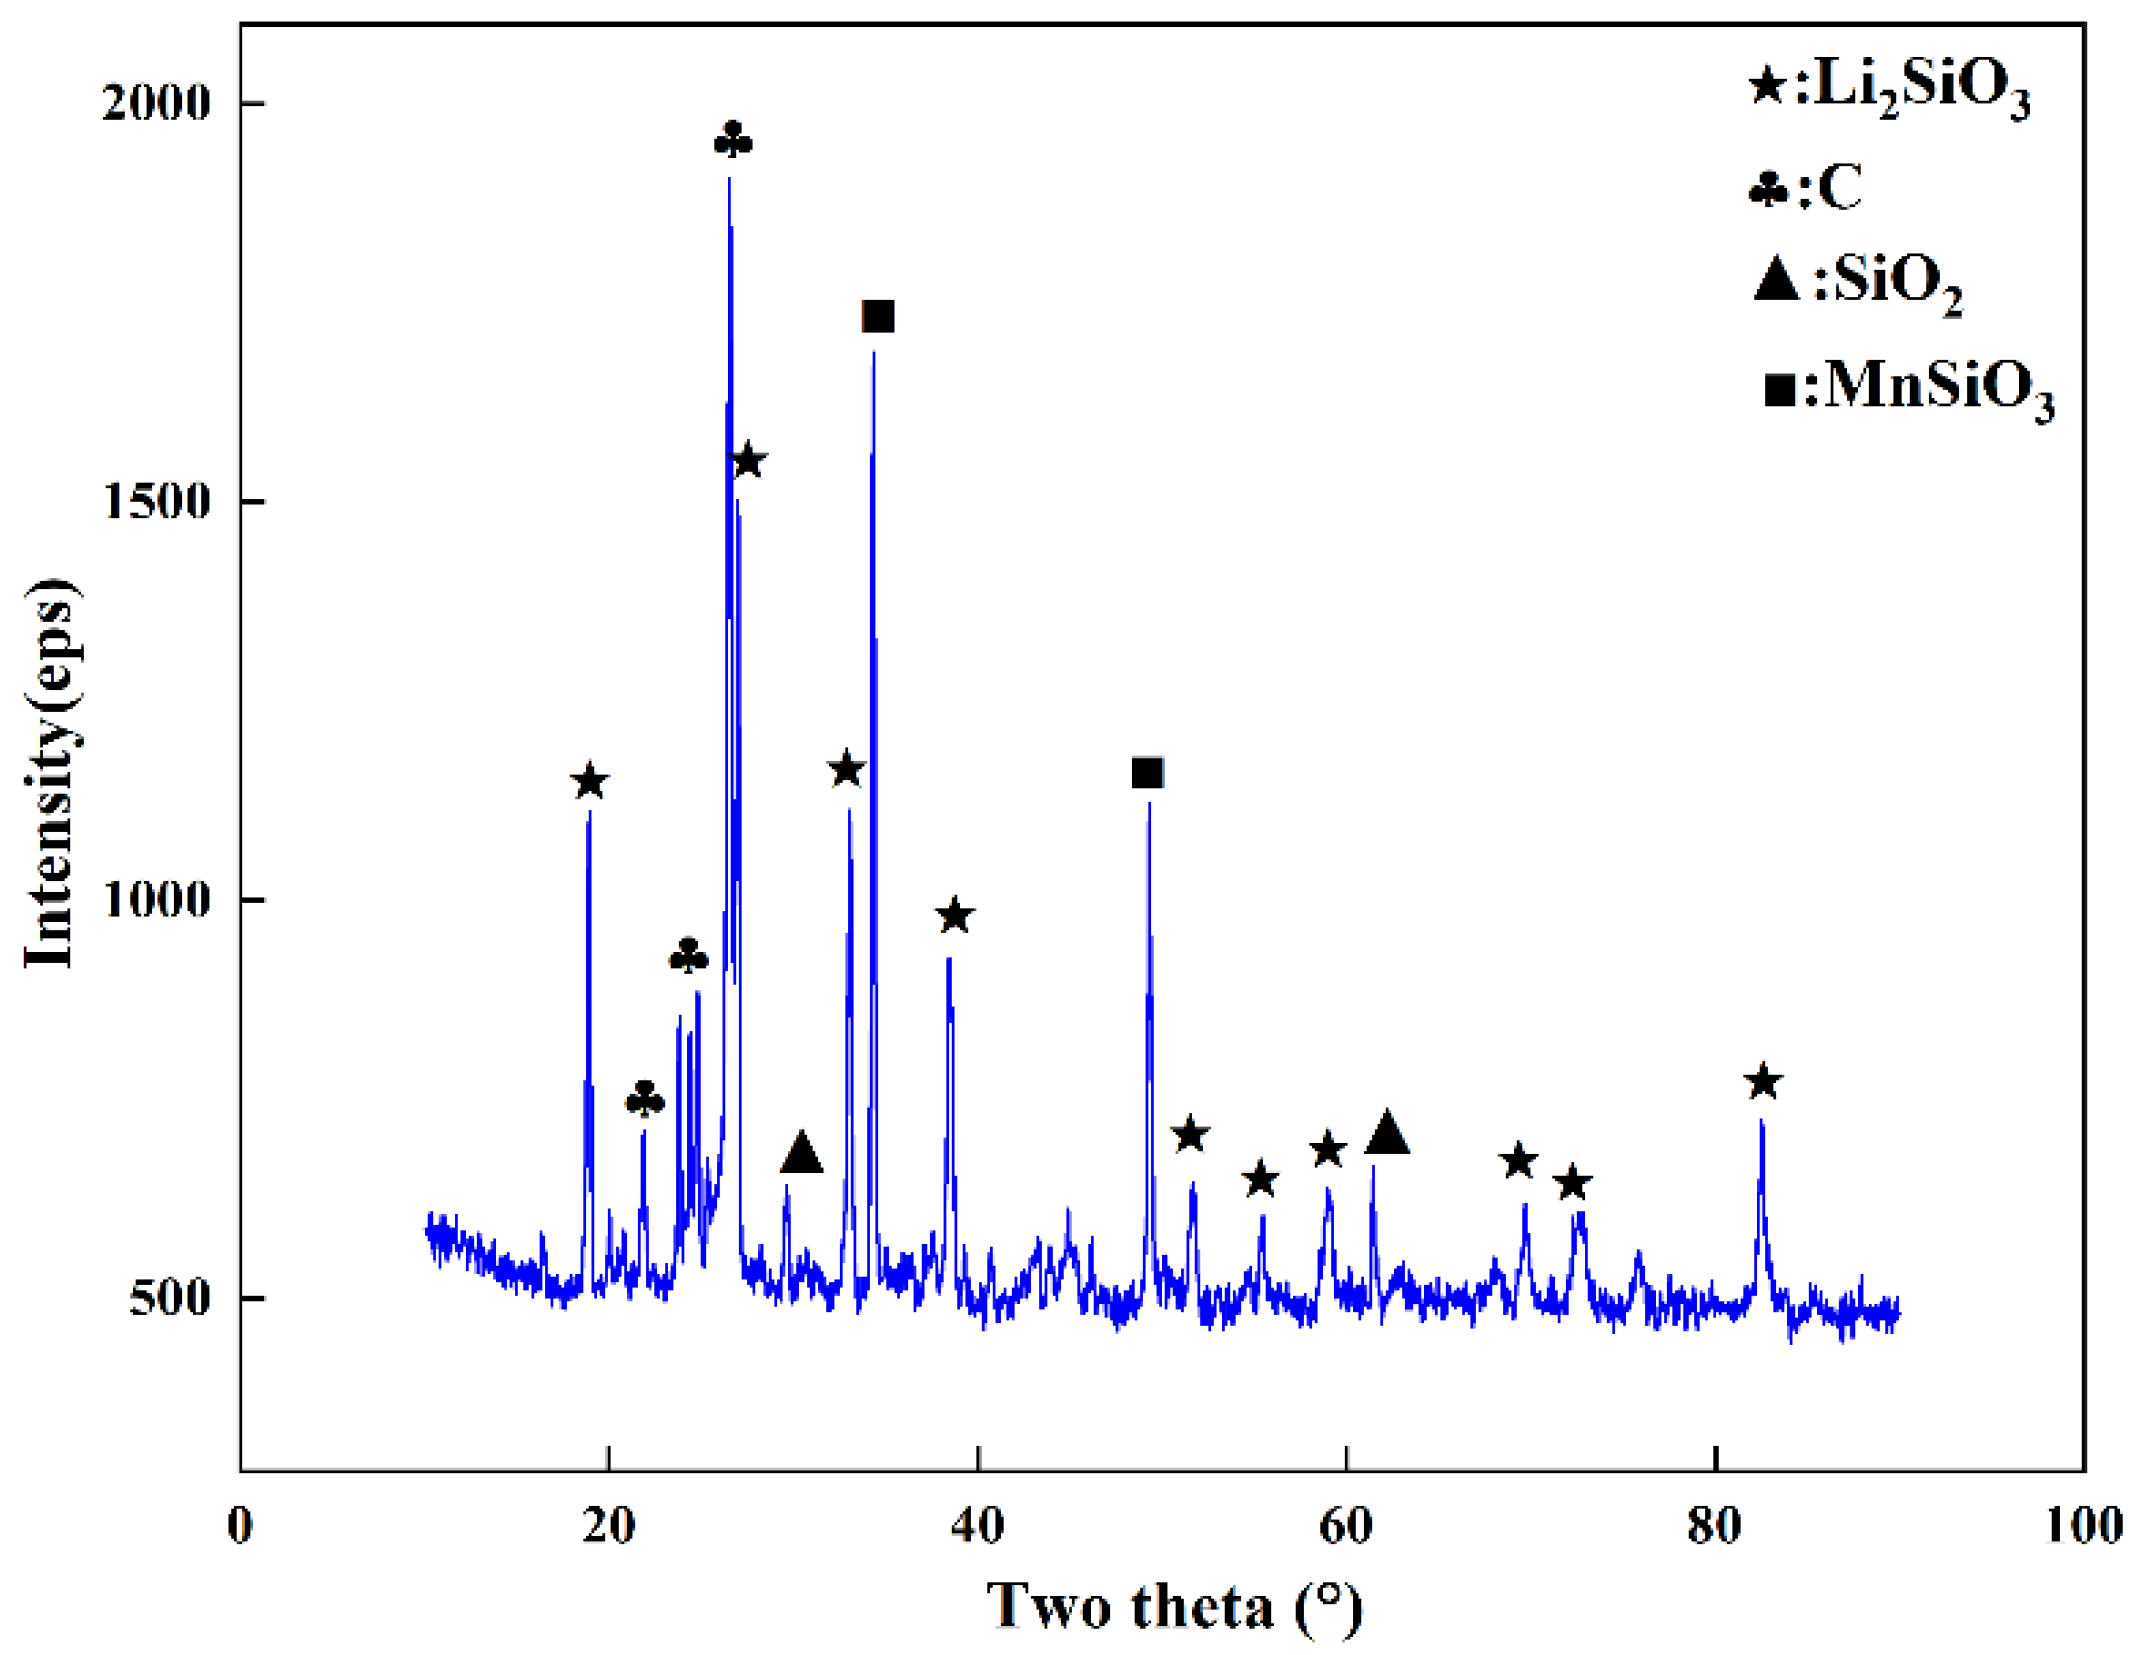
- Due to the limited feed amount and the low lithium content in spodumene ore, it was difficult to collect the lithium condensate in a single step, so the lithium-rich condensate was collected through multiple experiments. The collected condensate contained 19.47% Li, which was 10.85 times more enriched compared with spodumene.
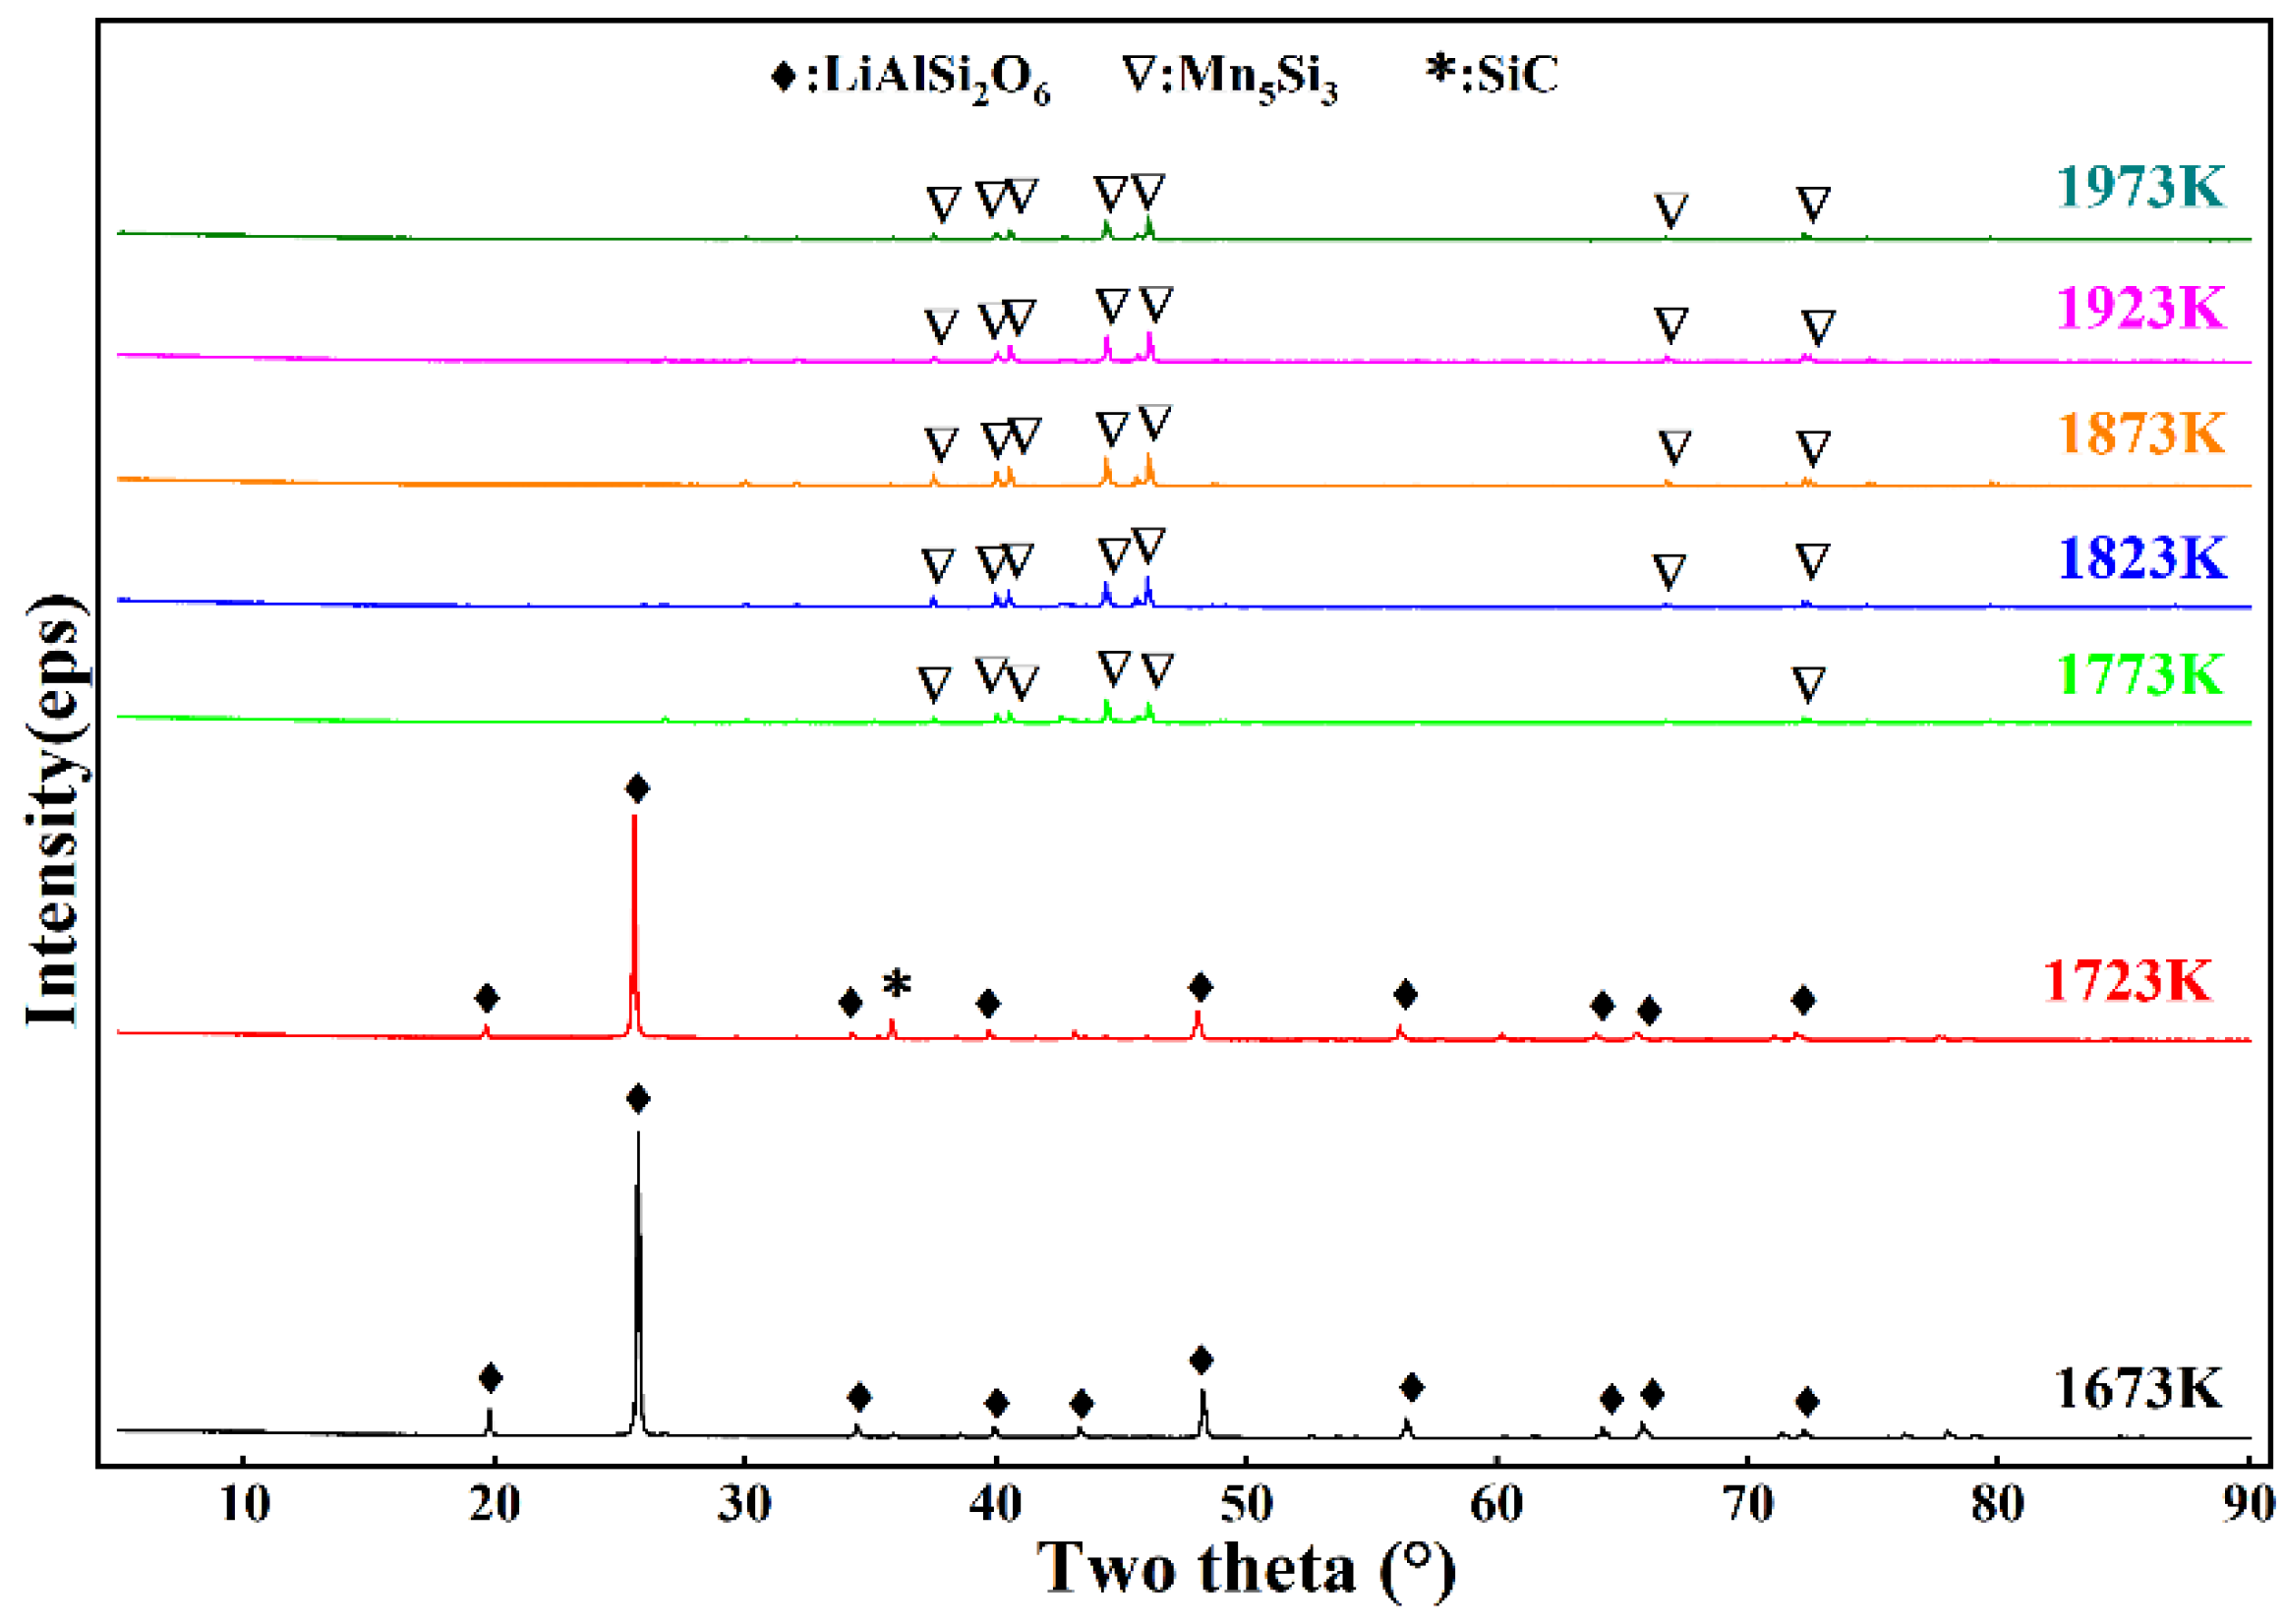
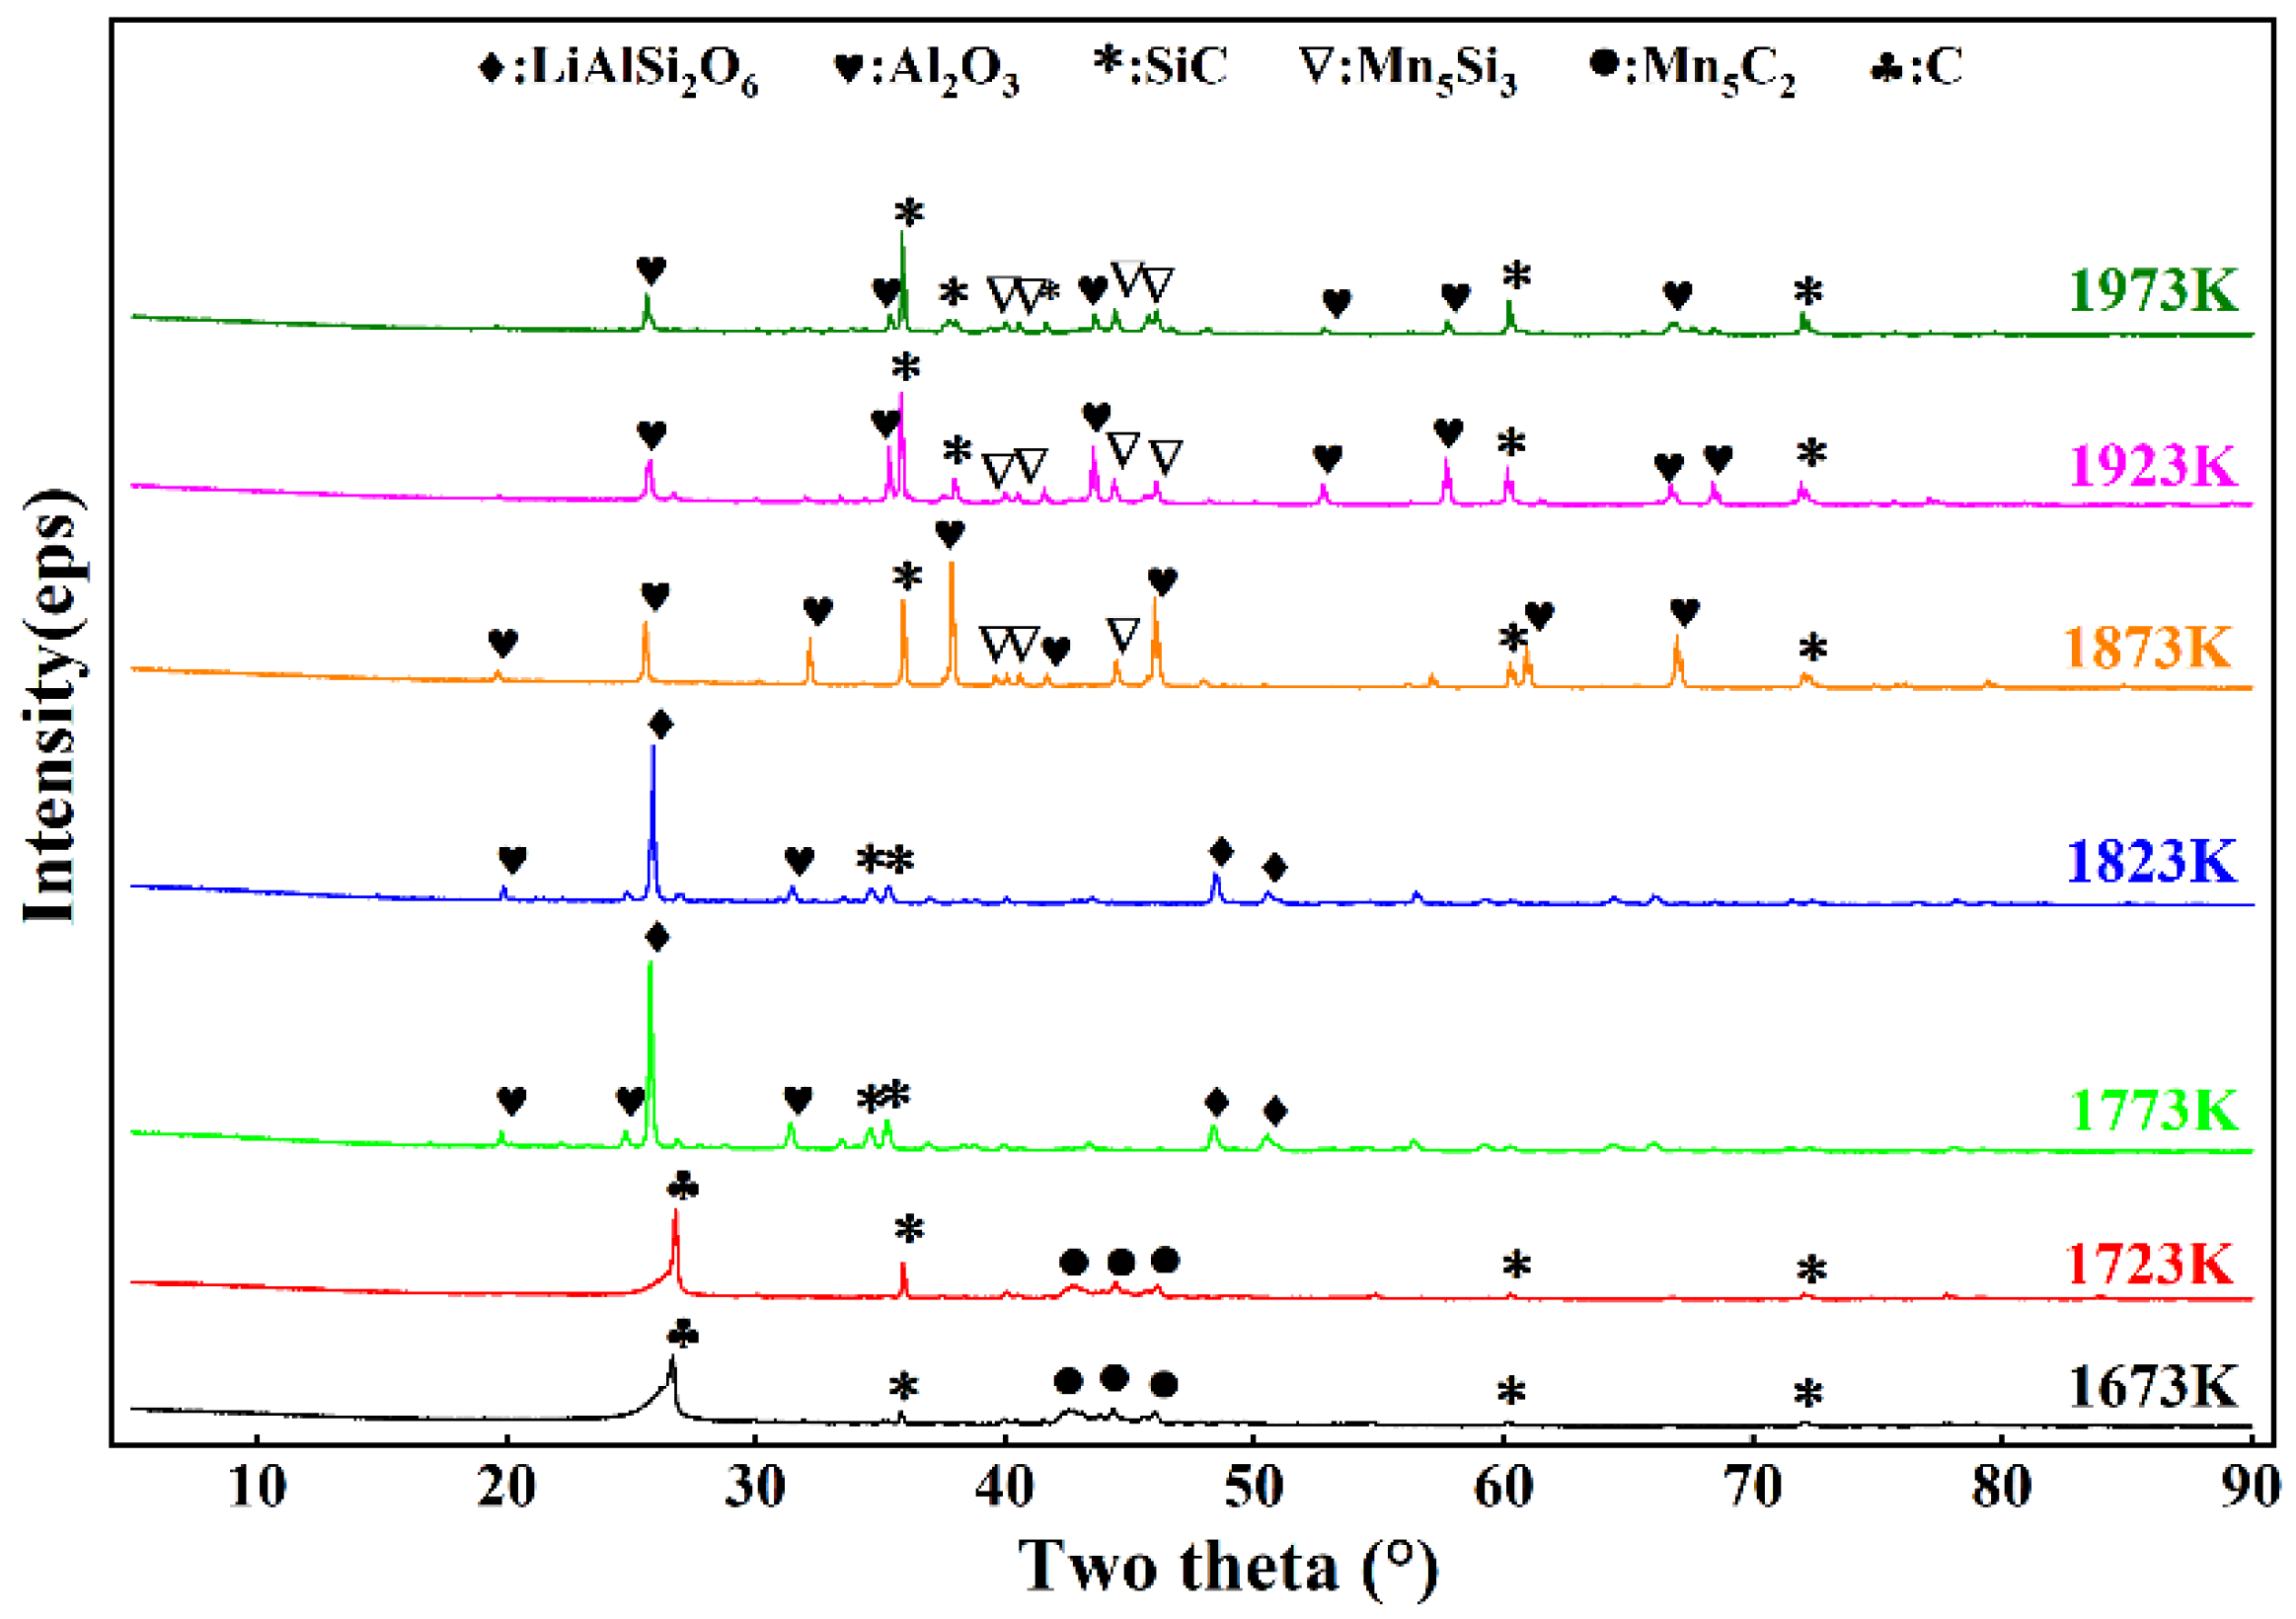
- Reduction temperature and time were two important factors affecting the reaction. With increased temperature and time, spodumene ore was gradually reduced; when the reduction temperature was 1873 K and the reduction time was 6 h, the spodumene ore reaction was complete, the volatilization rate of lithium was 97.65%, and the direct yield of Mn5Si3 was 86.47%.
Author Contributions
Funding
Data Availability Statement
Conflicts of Interest
References
- Xie, R.; Zhu, Y.; Liu, J.; Li, Y. The flotation behavior and adsorption mechanism of a new cationic collector on the separation of spodumene from feldspar and quartz. Sep. Purif. Technol. 2021, 264, 118445. [Google Scholar] [CrossRef]
- Lajoie-Leroux, F.; Dessemond, C.; Soucy, G.; Laroche, N.; Magnan, J.F. Impact of the impurities on lithium extraction from β-spodumene in the sulfuric acid process. Miner. Eng. 2018, 129, 1–8. [Google Scholar] [CrossRef]
- Fosu, A.Y.; Kanari, N.; Vaughan, J.; Chagnes, A. Literature Review and Thermodynamic Modelling of Roasting Processes for Lithium Extraction from Spodumene. Metals 2020, 10, 1312. [Google Scholar] [CrossRef]
- Xie, R.; Zhu, Y.; Liu, J.; Li, Y.; Wang, X.; Shumin, Z. Research Status of Spodumene Flotation: A Review. Miner. Process. Extr. Metall. Rev. 2020, 42, 321–334. [Google Scholar] [CrossRef]
- Salakjani, N.K.; Singh, P.; Nikoloski, A.N. Acid roasting of spodumene: Microwave vs. conventional heating. Miner. Eng. 2019, 138, 161–167. [Google Scholar] [CrossRef]
- Rosales, G.D.; Resentera, A.C.J.; Gonzalez, J.A.; Wuilloud, R.G.; Rodriguez, M.H. Efficient extraction of lithium from β-spodumene by direct roasting with NaF and leaching. Chem. Eng. Res. Des. 2019, 150, 320–326. [Google Scholar] [CrossRef]
- Guo, H.; Kuang, G.; Wang, H.; Yu, H.; Zhao, X. Investigation of Enhanced Leaching of Lithium from α-Spodumene Using Hydrofluoric and Sulfuric Acid. Minerals 2017, 7, 205. [Google Scholar] [CrossRef] [Green Version]
- Fosu, A.Y.; Kanari, N.; Bartier, D.; Vaughan, J.; Chagnes, A. Novel extraction route of lithium from alpha-spodumene by dry chlorination. RSC Adv. 2022, 12, 21468–21481. [Google Scholar] [CrossRef]
- Abdullah, A.A.; Oskierski, H.C.; Altarawneh, M.; Senanayake, G.; Lumpkin, G.; Dlugogorski, B.Z. Phase transformation mechanism of spodumene during its calcination. Miner. Eng. 2019, 140, 105883. [Google Scholar] [CrossRef]
- Fosu, A.Y.; Kanari, N.; Bartier, D.; Hodge, H.; Vaughan, J.; Chagnes, A. Physico-Chemical Characteristics of Spodumene Concentrate and Its Thermal Transformations. Materials 2021, 14, 7423. [Google Scholar] [CrossRef]
- Qiu, S.; Liu, C.; Yu, J. Conversion from α-spodumene to intermediate product Li2SiO3 by hydrothermal alkaline treatment in the lithium extraction process. Miner. Eng. 2022, 183, 107599. [Google Scholar] [CrossRef]
- Guo, H.; Lv, M.; Kuang, G.; Wang, H. Enhanced lithium extraction from α-spodumene with fluorine-based chemical method: A stepwise heat treatment for fluorine removal. Miner. Eng. 2021, 174, 107246. [Google Scholar] [CrossRef]
- Rezaee, M.; Han, S.; Sagzhanov, D.; Vaziri Hassas, B.; Slawecki, T.M.; Agrawal, D.; Akbari, H.; Mensah-Biney, R. Microwave-assisted calcination of spodumene for efficient, low-cost and environmentally friendly extraction of lithium. Powder Technol. 2022, 397, 116992. [Google Scholar] [CrossRef]
- Barbosa, L.I.; Valente, G.; Orosco, R.P.; González, J.A. Lithium extraction from β-spodumene through chlorination with chlorine gas. Miner. Eng. 2014, 56, 29–34. [Google Scholar] [CrossRef]
- Chen, Y.; Tian, Q.; Chen, B.; Shi, X.; Liao, T. Preparation of lithium carbonate from spodumene by a sodium carbonate autoclave process. Hydrometallurgy 2011, 109, 43–46. [Google Scholar] [CrossRef]
- Song, Y.; Zhao, T.; He, L.; Zhao, Z.; Liu, X. A promising approach for directly extracting lithium from α-spodumene by alkaline digestion and precipitation as phosphate. Hydrometallurgy 2019, 189, 105141. [Google Scholar] [CrossRef]
- Dessemond, C.; Lajoie-Leroux, F.; Soucy, G.; Laroche, N.; Magnan, J.-F. Spodumene: The Lithium Market, Resources and Processes. Minerals 2019, 9, 334. [Google Scholar] [CrossRef] [Green Version]
- Kuang, G.; Liu, Y.; Li, H.; Xing, S.; Li, F.; Guo, H. Extraction of lithium from β-spodumene using sodium sulfate solution. Hydrometallurgy 2018, 177, 49–56. [Google Scholar] [CrossRef]
- Guo, H.; Yu, H.-Z.; Zhou, A.-A.; Lü, M.-H.; Wang, Q.; Kuang, G.; Wang, H.-D. Kinetics of leaching lithium from α-spodumene in enhanced acid treatment using HF/H2SO4 as medium. Trans. Nonferrous Met. Soc. China 2019, 29, 407–415. [Google Scholar] [CrossRef]
- Grasso, M.L.; González, J.A.; Gennari, F.C. Lithium extraction from β-LiAlSi2O6 using Na2CO3 through thermal reaction. Miner. Eng. 2022, 176, 107349. [Google Scholar] [CrossRef]
- Rosales, G.D.; Resentera, A.C.J.; Wuilloud, R.G.; Rodriguez, M.H.; Esquivel, M.R. Optimization of combined mechanical activation-leaching parameters of low-grade α-spodumene/NaF mixture using response surface methodology. Miner. Eng. 2022, 184, 107633. [Google Scholar] [CrossRef]
- Salakjani, N.K.; Singh, P.; Nikoloski, A.N. Production of Lithium—A Literature Review. Part 2. Extraction from Spodumene. Miner. Process. Extr. Metall. Rev. 2019, 42, 268–283. [Google Scholar] [CrossRef]
- Zhang, X.; Zeng, X.; Shan, Y.; Li, Z.; Zeng, Y.; Asselin, E. Solubility and Modeling of Li2SO4·H2O in Aqueous H2SO4–MgSO4 Solutions for Lithium Extraction from Spodumene. J. Chem. Eng. Data 2022, 67, 919–931. [Google Scholar] [CrossRef]
- Wang, X.; Hu, H.; Liu, M.; Li, Y.; Tang, Y.; Zhuang, L.; Tian, B. Comprehensive utilization of waste residue from lithium extraction process of spodumene. Miner. Eng. 2021, 170, 06986. [Google Scholar] [CrossRef]
- Meshram, P.; Pandey, B.D.; Mankhand, T.R. Extraction of lithium from primary and secondary sources by pre-treatment, leaching and separation: A comprehensive review. Hydrometallurgy 2014, 150, 192–208. [Google Scholar] [CrossRef]
- Han, G.; Gu, D.; Lin, G.; Cui, Q.; Wang, H. Recovery of lithium from a synthetic solution using spodumene leach residue. Hydrometallurgy 2018, 177, 109–115. [Google Scholar] [CrossRef]
- Kracek, F.C. The Binary System Li2O–SiO2. J. Phys. Chem. 1930, 34, 2641–2650. [Google Scholar] [CrossRef]


| Component | SiO2 | Al2O3 | Li2O | Fe2O3 | Na2O | K2O | CaO | Other |
|---|---|---|---|---|---|---|---|---|
| Content(wt.%) | 72.50 | 18.60 | 3.84 | 0.94 | 0.36 | 0.62 | 0.01 | 3.13 |
| Component | Ash | Volatile | Moisture | Solid Carbon |
|---|---|---|---|---|
| Content (wt.%) | 11.64 | 1.54 | 0.5 | 86.32 |
Publisher’s Note: MDPI stays neutral with regard to jurisdictional claims in published maps and institutional affiliations. |
© 2022 by the authors. Licensee MDPI, Basel, Switzerland. This article is an open access article distributed under the terms and conditions of the Creative Commons Attribution (CC BY) license (https://creativecommons.org/licenses/by/4.0/).
Share and Cite
Yang, M.; Yan, K.; Ji, R.; Cui, X.; Zhang, W.; Qu, T. Lithium Enrichment by the Carbothermal Reduction of Spodumene Ore and the Preparation of Manganese-Silicon Alloy. Minerals 2022, 12, 1324. https://doi.org/10.3390/min12101324
Yang M, Yan K, Ji R, Cui X, Zhang W, Qu T. Lithium Enrichment by the Carbothermal Reduction of Spodumene Ore and the Preparation of Manganese-Silicon Alloy. Minerals. 2022; 12(10):1324. https://doi.org/10.3390/min12101324
Chicago/Turabian StyleYang, Mingliang, Ke Yan, Rui Ji, Xi Cui, Wenzheng Zhang, and Tao Qu. 2022. "Lithium Enrichment by the Carbothermal Reduction of Spodumene Ore and the Preparation of Manganese-Silicon Alloy" Minerals 12, no. 10: 1324. https://doi.org/10.3390/min12101324