
Structural and Elastic Behaviour of Sodalite Na8(Al6Si6O24)Cl2 at High-Pressure by First-Principle Simulations

Centro di Ricerche Interdisciplinari di Biomineralogia, Cristallografia e Biomateriali, Dipartimento di Scienze Biologiche, Geologiche e Ambientali, Università di Bologna “Alma Mater Studiorum”, Piazza di Porta San Donato 1, 40126 Bologna, Italy
*
Authors to whom correspondence should be addressed.
Minerals 2022, 12(10), 1323; https://doi.org/10.3390/min12101323
Submission received: 6 October 2022
/
Revised: 16 October 2022
/
Accepted: 19 October 2022
/
Published: 20 October 2022
(This article belongs to the Section Clays and Engineered Mineral Materials)
Abstract
:Sodalite Na8(Al6Si6O24)Cl2 (space group ) is an important mineral belonging to the zeolite group, with several and manyfold fundamental and technological applications. Despite the interest in this mineral from different disciplines, very little is known regarding its high-pressure elastic properties. The present study aims at filling this knowledge gap, reporting the equation of state and the elastic moduli of sodalite calculated in a wide pressure range, from −6 GPa to 22 GPa. The results were obtained from Density Functional Theory simulations carried out with Gaussian-type basis sets and the well-known hybrid functional B3LYP. The DFT-D3 a posteriori correction to include the van der Waals interactions in the physical treatment of the mineral was also applied. The calculated equation of state parameters at 0 GPa and absolute zero (0 K), i.e., K0 = 70.15(7) GPa, K’ = 4.46(2) and V0 = 676.85(3) Å3 are in line with the properties derived from the stiffness tensor, and in agreement with the few experimental data reported in the literature. Sodalite was found mechanically unstable when compressed above 15.6 GPa.
Keywords:
sodalite; zeolite group; equation of state; stiffness tensor; seismic wave velocities; DFT; B3LYP1. Introduction
Zeolites are both natural and synthetic nanoporous crystalline aluminosilicates (framework silicates) that are frequently used in important chemical industry applications, such as catalysis, separation (“molecular sieves”), and ion exchange [1,2]. From the crystal chemistry perspective, zeolites are made of a network of corner-sharing TO4 tetrahedra, where T = Si, Al, or other tetrahedrally coordinated atoms (see for instance [3]).
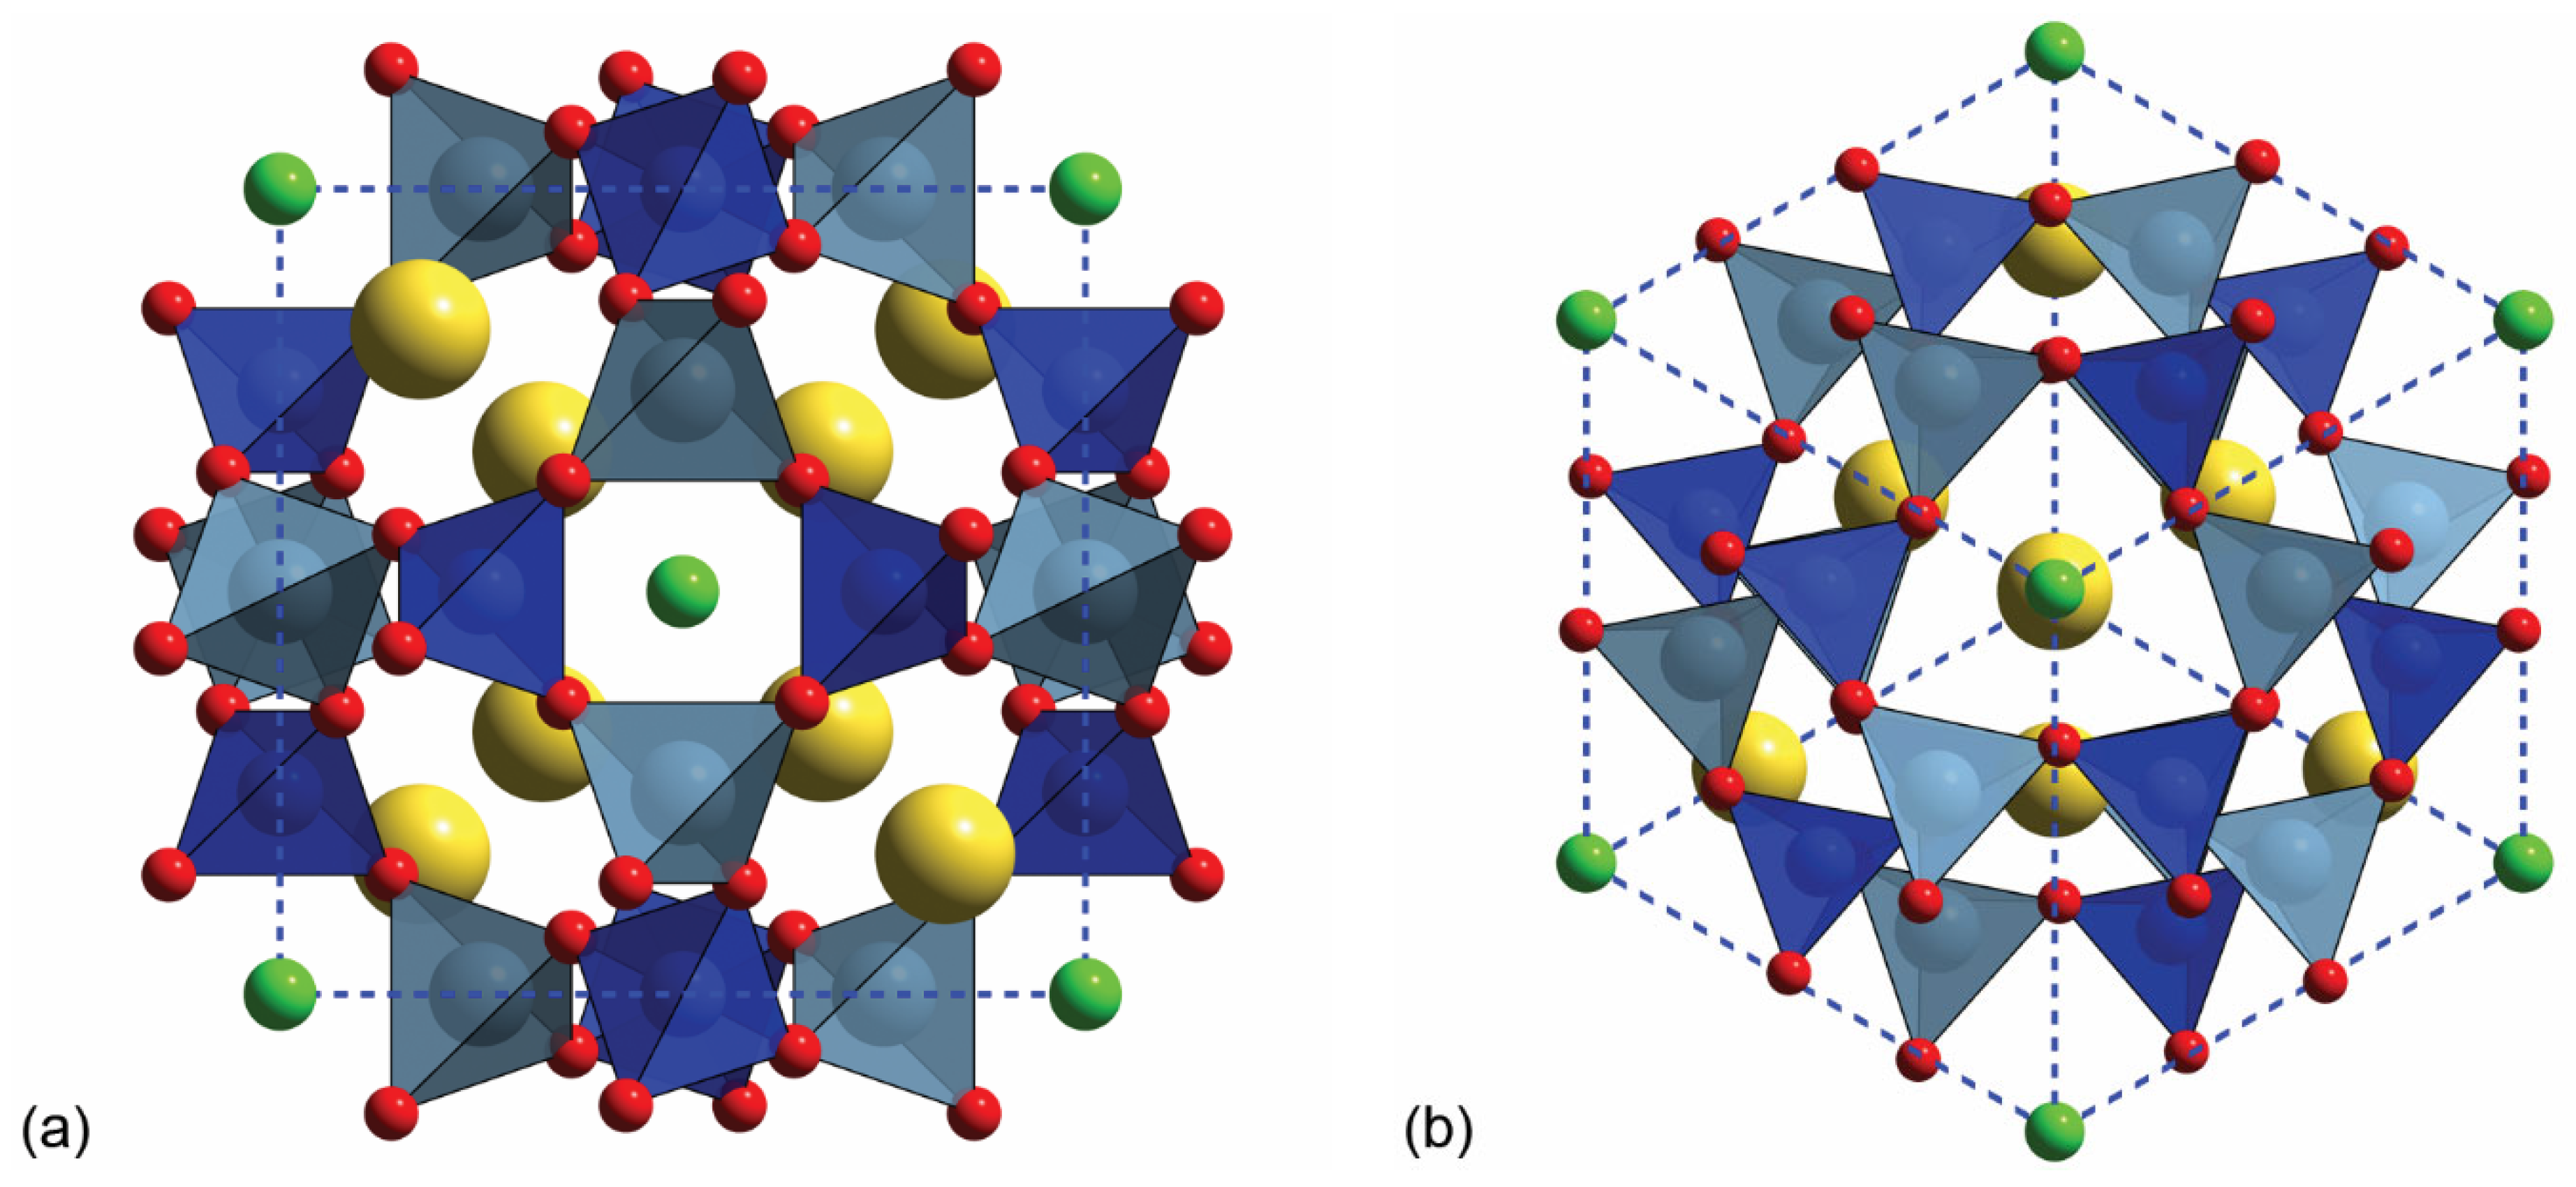
The present work focuses on sodalite, whose chemical formula is Na8(Al6Si6O24)Cl2 and cubic structure (space group ). As determined by different structural refinements over the past century [4,5,6,7], this mineral is characterized by a β-cage that is made of four-membered (Al,Si)O4 rings on the (100) plane (see Figure 1a) linked together in six-membered rings along the [111] direction (Figure 1b), leading to the (AlSiO4)66– framework. The negative charge (–6) induced by the Al3+/Si4+ substitutions is balanced by two tetrahedral (Na4Cl)3+ clusters. The structure is highly symmetric, with just five atoms in the asymmetric unit, i.e., Cl (Wyckoff site 2a) in (0,0,0), Al (6d) in (1/4,0,1/2), Si (6c) in (1/4,1/2,0), Na (8e) in (x,x,x) and O (24i) in (x,y,z).
In addition, sodalite and the hydrated variant known as hydrosodalite Na6(AlSiO4)6·8H2O [8] are among the possible mineral phases synthesized during geopolymerisation [9]. This process requires kaolinite or metakaolin precursors that provide SiO2 and Al2O3 in ratio 2:1 and a strong basic solution (pH > 12.5) of sodium hydroxide (NaOH) that hydrolyses the silicon and aluminium oxides [10], as observed with several techniques, such as X-ray diffraction and scanning electron microscopy [11,12,13].
Despite the diversified and multidisciplinary interest in sodalite, to the author’s knowledge, only two experimental works addressed and investigated the elasticity of this mineral. Hazen and Sharp [14] reported the hydrostatic compression behaviour of a natural sodalite sample with composition Na7.99K0.01(Al5.98Fe0.04Si5.98)O23.99Cl1.96(SO4)0.02, from room to 2.6 GPa, but limited to the measurements of the unit cell volume and the a lattice parameter variations. No other works reported the equation of the state of sodalite at higher pressures. The second work is that of Li et al. [15], who provided the second-order elastic moduli of the mineral from ultrasound measurements. On the contrary, there have been several theoretical studies on sodalite, but they were mainly focused on the stoichiometric Si12O24 phase, which was selected as a prototype for framework silicates because of its simplicity [3,16]. The only available investigation on the elastic properties of sodalite with ideal formula Na8(Al6Si6O24)Cl2 is the theoretical one of Willams and co-workers [17], which was however conducted with classical mechanics methods (force fields). The knowledge of the elastic behaviour of sodalite is fundamental to assessing its mechanical stability, which ultimately affects the possible applications of this zeolite, for example in building materials (see geopolymers), water treatment, soil remediation, gas separation, and catalysis [18]. It is also worth remembering that sodalite and, in general, natural zeolites also occur as secondary minerals in several geological environments in the Earth’s crust.
The present work aims at filling these knowledge gaps, providing the readers with an ab initio analysis at the Density Functional Theory (DFT) level of the crystal chemistry and elastic properties of sodalite. Regarding the mechanical behaviour, the equation of state of the mineral up to about 22 GPa is here reported, investigating the effects of pressure on the internal geometry, i.e., bond distances and angles, and polyhedral volumes. Then, at each hydrostatically compressed state, the second-order elastic moduli were calculated and analysed to obtain other important properties, such as Young’s and shear moduli, the compressibility, Poisson’s ratio and the seismic wave velocities. This paper is organised as follows: after a brief description of the employed computational parameters (Section 2), the results related to the crystal chemistry, the equation of state and the elastic moduli (Section 3) will be presented and discussed against the few experimental and theoretical data available in the literature. Finally, some general conclusions will be presented in Section 4.
2. Computational Methods
The ab initio (DFT) simulations performed in the present study were carried out with the CRYSTAL17 code [19]. We selected the hybrid B3LYP functional [20,21] because it is known to provide structural, vibrational and elastic data that are in very good agreement with the experimental counterparts (see for instance [22,23,24,25]). The CRYSTAL code builds the multi-electronic wave function using the so-called linear combination of atomic orbitals (LCAO) approach, which employs Gaussian-type orbitals basis sets. Throughout the simulations, an 88-31G* [26], an 85-11G* [27] an 8-411d11G [28] an 8-511G [29] and an 86-311G [30] basis sets were employed to describe Si, Al, O, Na and Cl, respectively. They are double-ζ quality basis sets, i.e., they contain a double amount of Gaussian-type functions that describe the atomic orbitals, which ensure high accuracy with affordable computational costs. Furthermore, the basis sets for silicon, aluminium and oxygen were previously adopted for the simulations of the crystal chemical and elastic properties of other minerals, in particular talc [31], pyrophyllite [32,33], chlorite [34,35], topaz [36], brucite and portlandite [37].
The exchange–correlation contribution to the total energy is calculated within CRYSTAL code by numerical integration of the electron density and its gradient, a task performed on a pruned grid whose angular points are generated from the quadrature scheme of Gauss–Legendre, whereas the Lebedev approach is adopted to obtain the radial points [19]. The default grid of CRYSTAL17 was employed, which is made of 75 radial points and 974 angular points and represents a good compromise between accuracy and cost of calculation. The thresholds controlling the accuracy of the calculation of the Coulomb and exchange integrals were set to 10−8 (Coulomb series) and 10−16 (exchange series). The Hamiltonian matrix was diagonalized in 35 k points (reciprocal lattice points), corresponding to a shrinking factor of 8 [38]. To properly include the effects of long-range interactions in the simulations, typically neglected by both GGA and hybrid DFT functionals, we employed the DFT-D3 scheme proposed by Grimme and co-workers [39], which adds the following contribution term to the total energy of the system:
The sums run over the atoms N in the unit cell, with rij,g the internuclear distance between atom i in cell g = 0 (reference cell) and atom j in cell g, and Cnij (n = 6, 8) terms are the 6th- and 8th-order dispersion coefficients for atom pairs ij, which depends on the geometry of the system. The damping function here adopted is the one proposed by Becke and Johnson [40,41,42]:
with and , s6 = 1, s8, whereas α1 and α2 are adjustable parameters. The choice of including the long-range interactions is dictated by the need for the correct treatment of all the forces acting on the system because the elastic properties depend on their gradient (second derivatives of the energy with respect to the deformation). In fact, we observed that these weak forces play a non-negligible role even for those minerals and materials where long-range interactions are not predominant. We recently demonstrated this behaviour for calcite [43] and aragonite [44], and we expect the same for sodalite.
The lattice constants and the atomic coordinates were optimized within the same run with a numerical gradient method and an analytical gradient approach, respectively. The starting geometry used to create the sodalite model was taken from the experimental XRD refinements of Hassan and collaborators [4]. The upgrade of the Hessian matrix was performed by means of the well-known BFGS algorithm [45,46,47,48,49]. For the optimization of both the equilibrium (0 GPa) and hydrostatically compressed/expanded unit cell, the tolerances for the maximum allowed gradient and the maximum atomic displacement for considering the geometry as converged have been set to 1 × 10⁻⁵ hartree bohr−1 and 4 × 10⁻⁵ bohr, respectively [50,51].
Second-order elastic moduli were calculated according to the scheme proposed by Perger and co-workers [52], which is implemented in the CRYSTAL code. The elastic moduli are the components of the 4th-rank stiffness tensor C that, according to the Voigt’s 6 × 6 matrix representation, can be written as:
where the indices v,u run from 1 to 6 (1 = xx, 2 = yy, 3 = zz, 4 = yz, 5 = xz and 6 = xy), σv and ηu are the components of the stress and pure strain second-rank tensors. The interested reader can find more information on the theory [53], implementation in the CRYSTAL code [52,54] and recent applications [36,37,51,55] in dedicated literature. Single-crystal elastic properties, namely Young’s modulus (E), linear compressibility (β), shear modulus (μ) and Poisson’s ratio (υ) were calculated from the elastic moduli using the QUANTAS code [56], with well-known directional relations [34,53,55,57,58]. Voigt and Reuss equations were employed to calculate the average elastic properties considering the system as a polycrystalline aggregate as explained by Nye [53].
Graphical representations of the sodalite structure were made with the molecular graphics program VESTA [59].
3. Results
3.1. Crystal Chemistry
The crystal structure data (unit cell parameter a, atomic distances, bond angles, polyhedral volumes and relevant atomic fractional coordinates) of sodalite obtained from geometry optimization at equilibrium (0 K and 0 GPa) within the DFT/B3LYP-D3 approach is reported in Table 1, alongside previous theoretical [17] and experimental crystal chemical analyses [4,5,6].
As expected from static ab initio simulations carried out at 0 K and without including zero-point effects, the unit cell volume is about 3.5% smaller than that found from the refinements of the structural data collected from synchrotron radiation X-ray powder diffraction (SR-XRPD) of Hassan et al. [4]. By analysing the internal geometry, it is possible to note the interplay between the Si–O and Al–O bond lengths, slightly larger than the experimental ones (less than 1%), and the Na–O and Na–Cl distances, which are instead underestimated by about 3%. The mean O–Si–O and O–Al–O bond angles are in excellent agreement with the experimental ones, and very close to the ideal tetrahedral angle (109.47°) whereas the bridging Si–O–Al angle is slightly underestimated (about −3%). The bridging angle is the one that showed the greatest variation as a function of temperature, a behaviour that was modelled with a parabolic function in the range of 28–1000 °C in the work of Hassan and collaborators [4]. By extrapolating at 0 K (−273.15 °C) with the functional form proposed by the cited authors, we obtained a Si–O–Al angle of 137.47°, which is still larger than that at the B3LYP-D3 level. This could be due to the absence of any thermal effects, including zero-point energy, i.e., the ground-state vibrational contribution to the total internal energy, and the associated isotropic displacement parameters that were not taken into account in the present investigation. The volumes of the SiO4 and AlO4 tetrahedra are also in line with the XRD refinements. Our results are also in good agreement with the statistical data collected for hundreds of zeolites, including sodalite-like structures reported by Baur and Fischer [60]. The authors calculated a mean T–O bond distance of 1.617(7) Å (1.629 Å by applying a correction for bond distances) for SOD zeolites and observed O–Si–O and O–Al–O angles in the ranges 101.0°–117.7° and 94.6°–123.7°, respectively. Our simulations on stoichiometric sodalite provided both distances and angular values that fall in these ranges.
The present results at the DFT/B3LYP-D3 level of theory are in line with the force field (classical mechanics) simulations of Willams et al. [17], and provide a better mean absolute deviation of the structural features of sodalite (1.28%) in comparison to the cited work (1.49%). Unfortunately, despite recent ab initio studies on sodalite performed in the last decade [61,62,63], none of them reported the crystal chemistry of the optimized zeolite structure for a proper comparison, focusing on other properties of the mineral (electronic band structure and optical properties, spectroscopic models of localized defects in the structure, reactivity towards sulphur).
3.2. Equation of State
The equation of the state of sodalite was obtained with a two-step process. In the first one, it was performed a volume-constrained geometry optimization on a series of mineral unit cells with larger (expansion) and smaller (compression) volumes. Here, eleven models between 0.82·Veq and 1.12·Veq, with Veq the equilibrium unit cell volume, were simulated using the internal routines of CRYSTAL [54]. The geometry optimization results at different hydrostatic compression/expansion states are reported in Table 2.
Then, in the second step of the procedure, the unit cell internal energy as a function of volume, U(V), was fitted to a volume-integrated 3rd-order Birch–Murnaghan (BM3) formulation [64], as proposed by Hebbache and Zemzemi [65]:
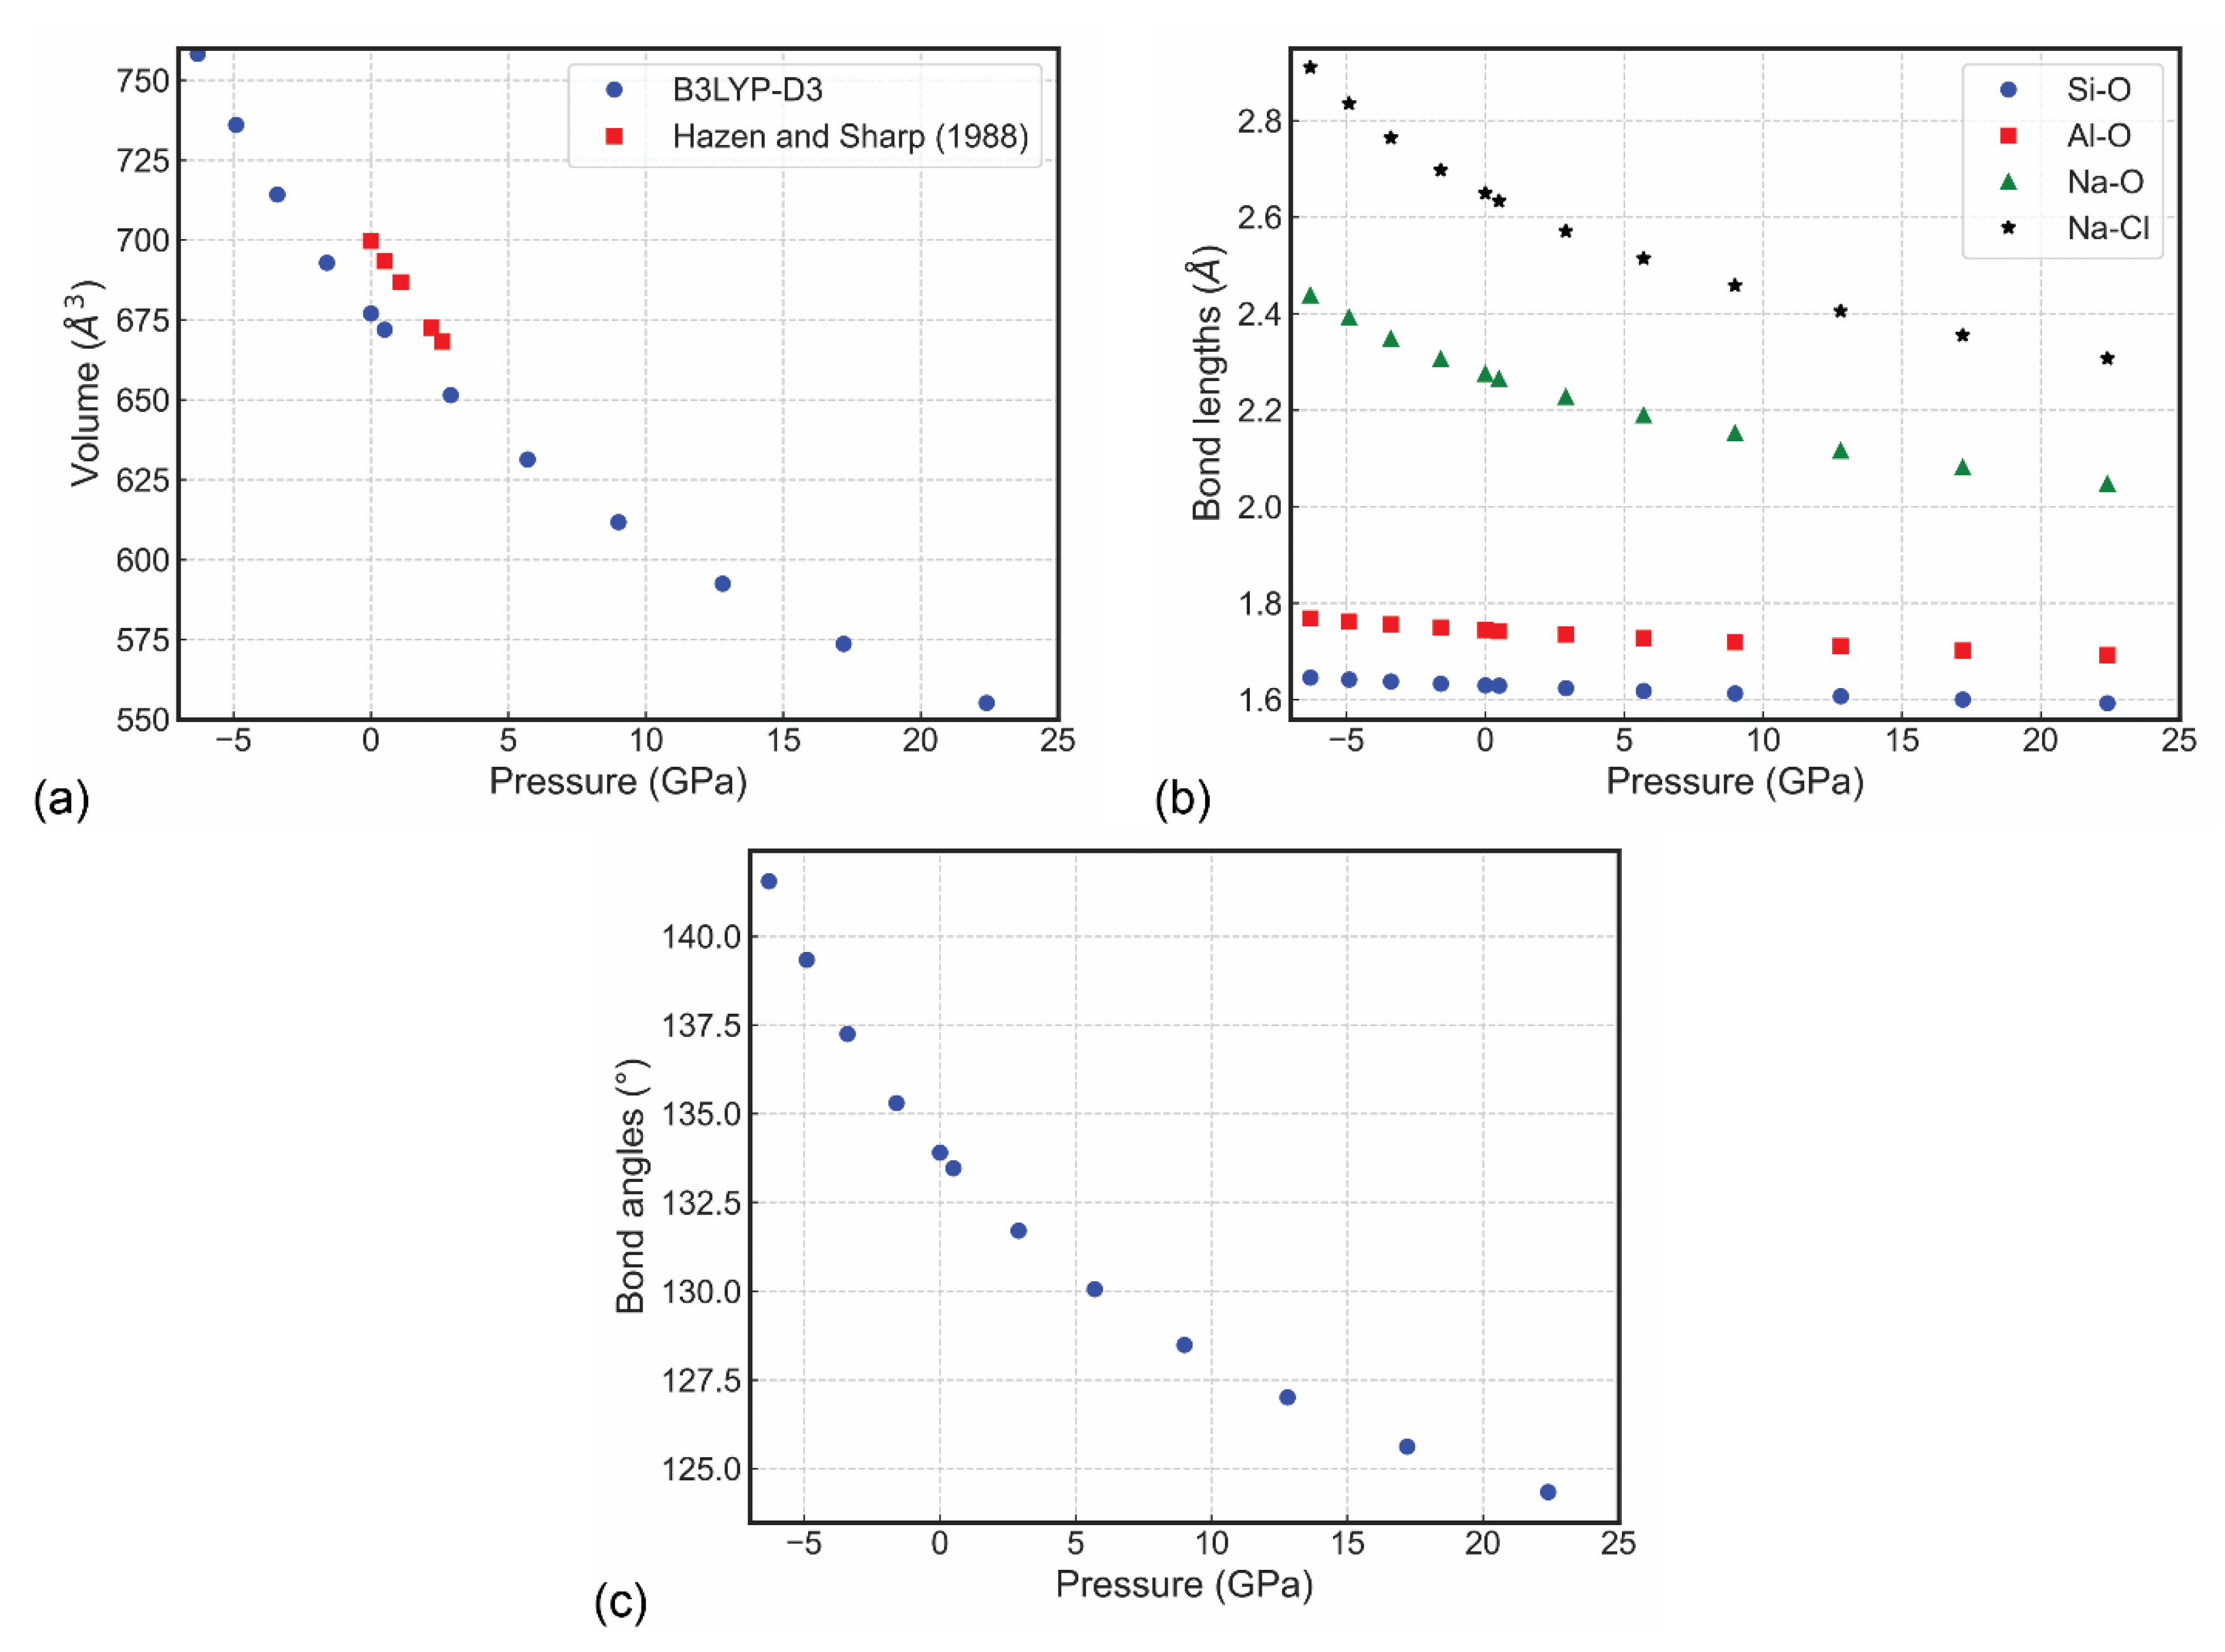
with X = (V0/V)−1/3. In this equation, the fitting parameters are U0 (internal energy), K0 (bulk modulus), K’ (pressure derivative of the bulk modulus) and V0 (unit cell volume), with the subscript zero meaning they were obtained at 0 GPa. This operation was performed using the QUANTAS code [56], obtaining K0 = 70.15(7) GPa, K’ = 4.46(2) and V0 = 676.85(3) Å3. This result is in quite good agreement with that reported by Hazen and Sharp [14], with second-order Birch–Murnaghan equation of state fitting parameters K0 = 52(8) GPa and K’ = 4 (fixed). The difference between the fitting results could be due to several reasons, the first one the absence of thermal effects in the simulations, as previously introduced during the discussion of the sodalite crystal chemistry. Then, the composition of the experimental sample and the theoretical model is slightly different, because the former has some percentages of other elements [chemical formula Na7.99K0.01(Al5.98Fe0.04Si5.98)O23.99Cl1.96(SO4)0.02, as obtained from microprobe analysis], whereas the present DFT investigation considered an ideal, stoichiometric sodalite. Finally, the present study considered a very wide pressure range, up to about 22 GPa, whereas the high-pressure XRD refinements were carried out only up to 2.6 GPa, as can be noted from Figure 2a.
The bulk modulus calculated at the DFT level is also in line with the adiabatic bulk modulus (KS = 55.3 GPa) calculated from the elastic moduli measured by ultrasonic methods by Li et al. [15]. To the authors’ knowledge, no other theoretical and experimental data on the equation of state were reported in literature regarding sodalite with the ideal chemical formula [Na8(Al6Si6O24)Cl2] here reported. Albeit the different cage structure, the elastic behaviour of sodalite is in line with that of cancrinite-group zeolites as recently reviewed by Chukanov and co-workers [66], whose bulk moduli fall in the range 30–48 GPa.
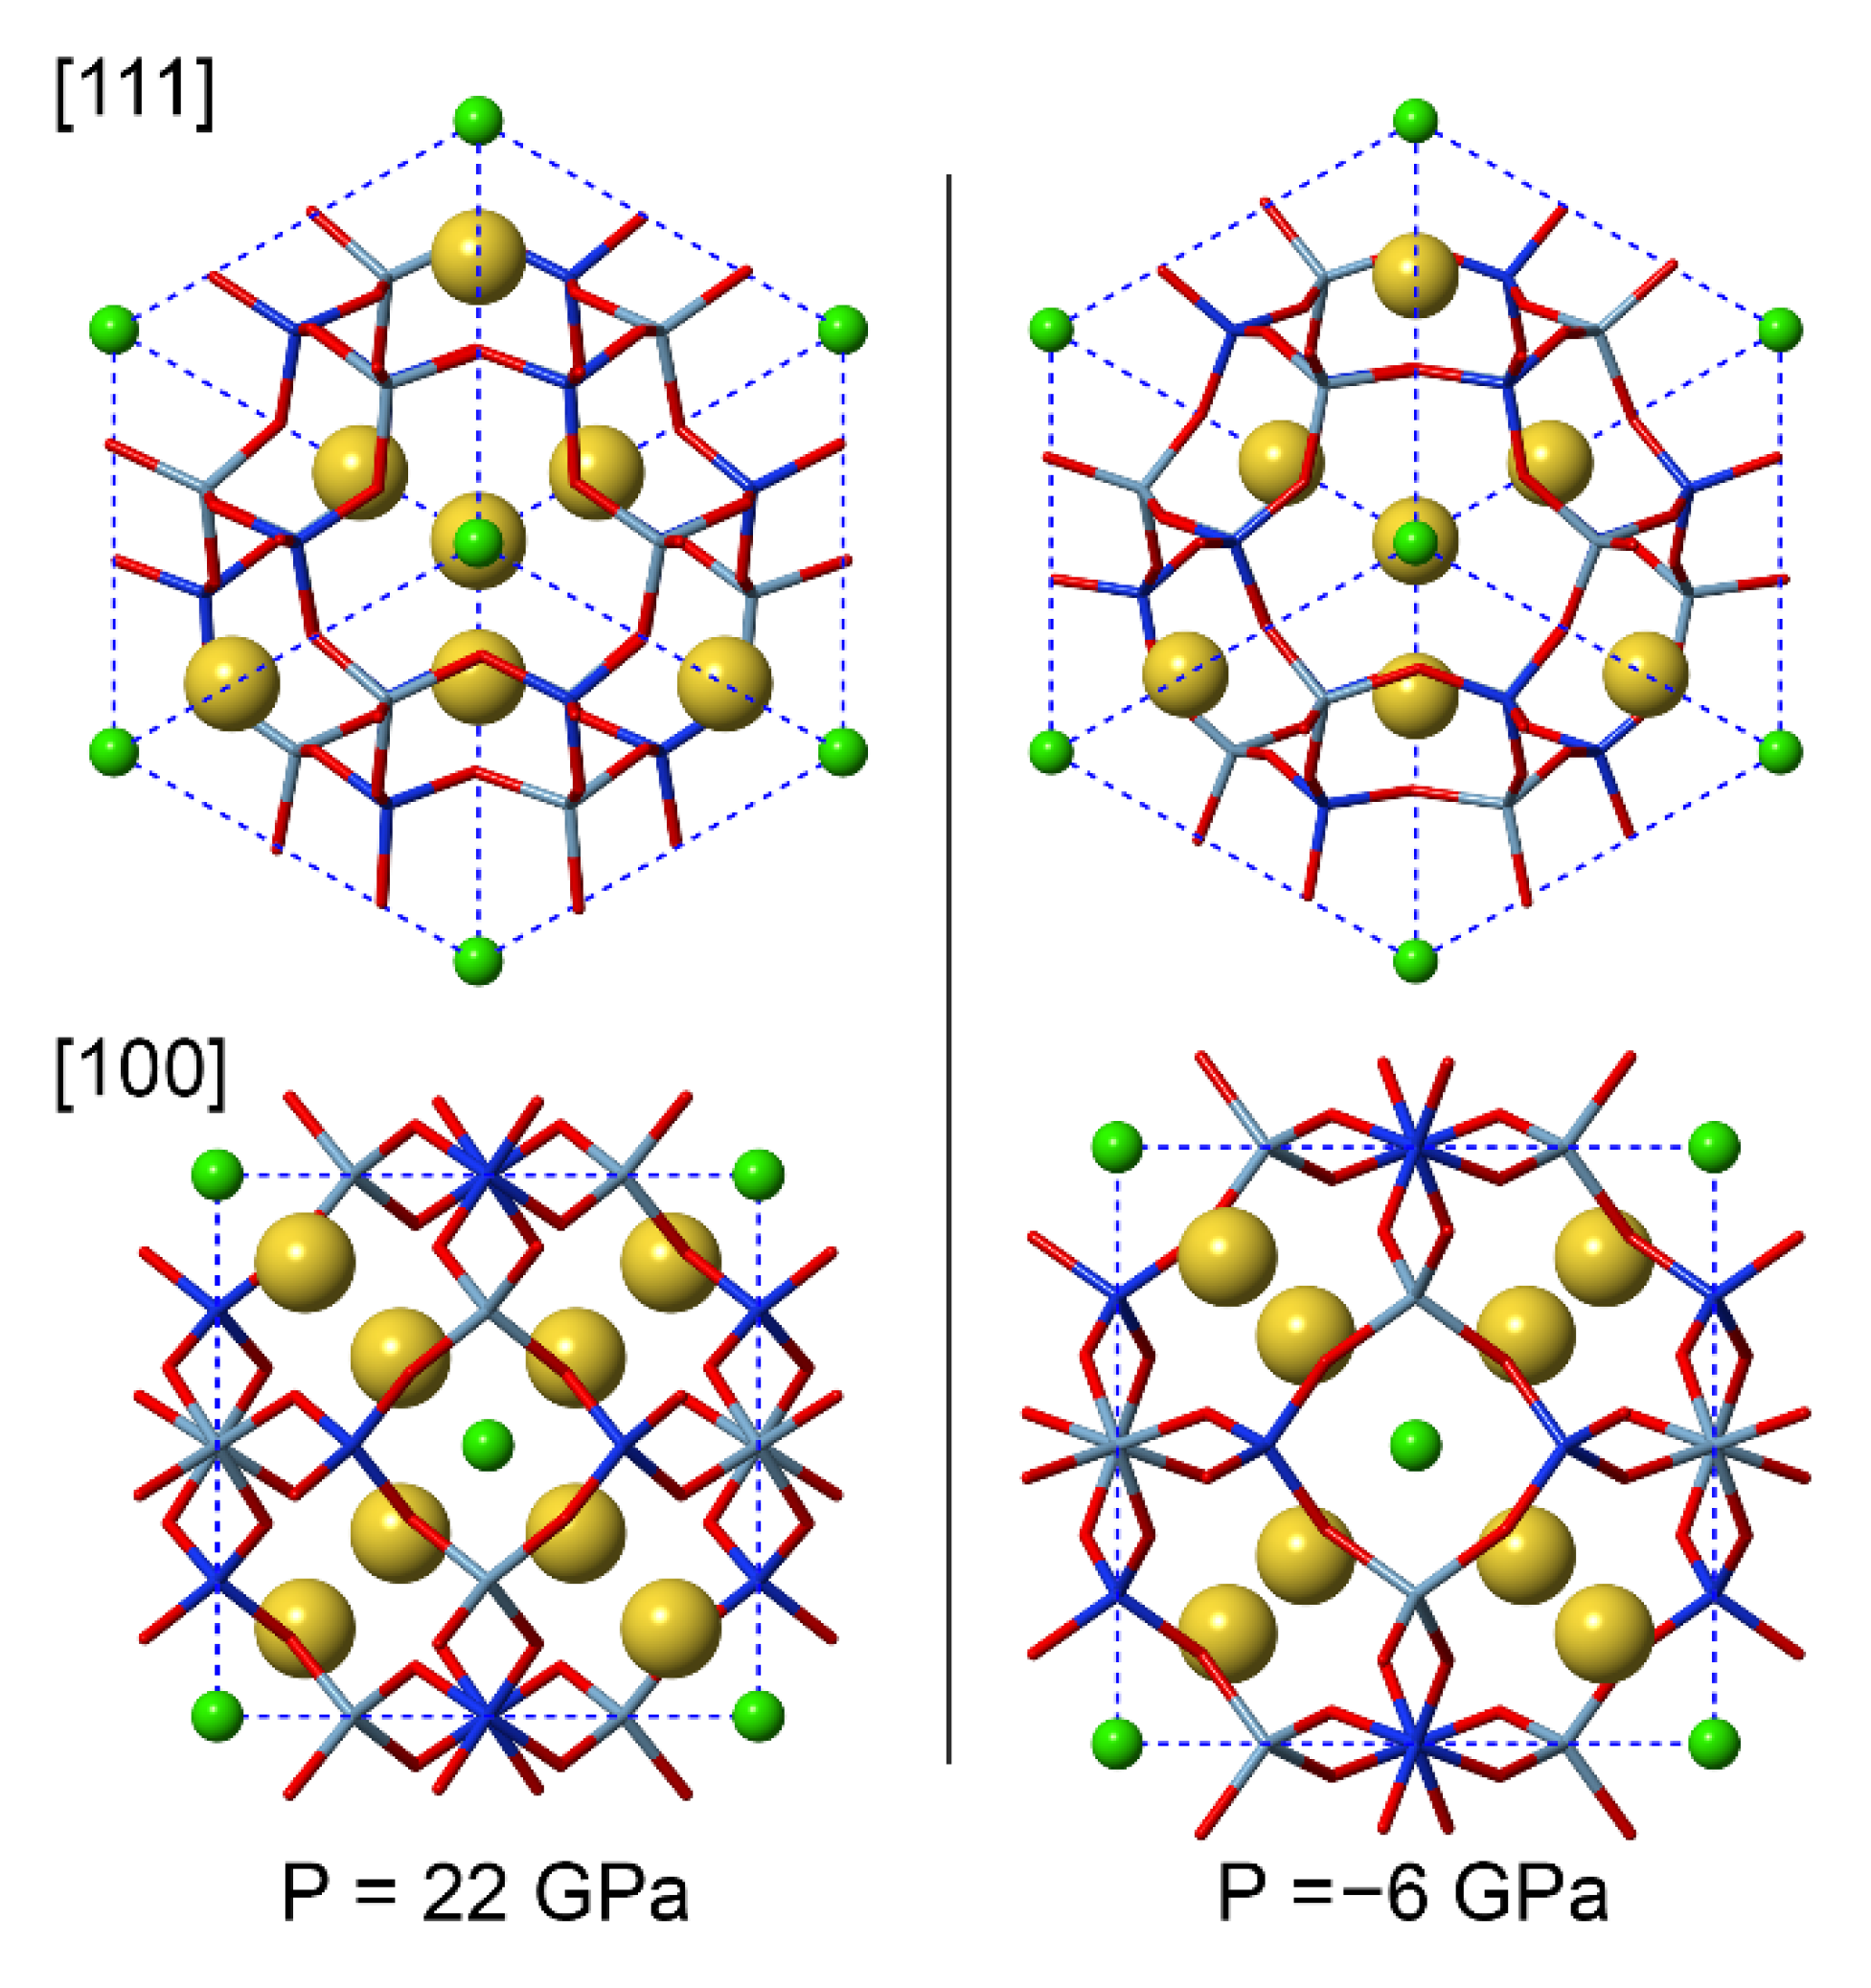
An inspection of the variation of the internal geometry (Figure 2b,c and Table 2) provides more insights into the compression mechanism. The structural features that are affected the most by hydrostatic pressure are the Si–O–Al bridging angles (–7.1% at about 22 GPa with respect to the equilibrium geometry), the Na–O (–10.0%) and Na–Cl (–12.9%) bond distances and the Na4Cl polyhedral volume (–33.9%). Conversely, the SiO4 and AlO4 bond lengths are just slightly affected by compression (up to about −3%), whereas the O–Si–O and O–Al–O angles remain constant. A graphical representation of the sodalite structure at the extremes of the compression regime investigated here is reported in Figure 3. All these observations agree with the general behaviour of framework silicates, such as zeolites and feldspathoids. Indeed, these minerals undergo a small distortion of the framework on the T–O–T angles, with more or less rigid T–O bonds, and high compression of the cation sites [14].
3.3. Elastic Moduli and their Variation with Pressure
Cubic crystals have three independent elastic moduli (C11, C44 and C12) that can be represented in a 6 × 6 matrix C using Voigt’s notation [53]:
where the dots indicate the Cij value is zero. For symmetry reasons, two lattice deformations are sufficient to obtain all the independent elastic moduli:
and
with ε1 and ε4 being uniaxial and biaxial (shear) strains, respectively. The factor δ controls the amount of applied strain, which was varied between ±0.015 with a step of 0.005, hence seven configurations for each lattice strain were simulated.
The calculated elastic moduli of sodalite in equilibrium conditions (0 K and 0 GPa) and by varying pressure are reported in Table 3, together with the polycrystalline properties calculated with the Voigt, Reuss and Hill averaging schemes. According to the Born criteria [67], a cubic crystalline structure is stable when the following necessary and sufficient conditions are met:
C11 − C12 > 0, C11 + 2C12 > 0, C44 > 0.
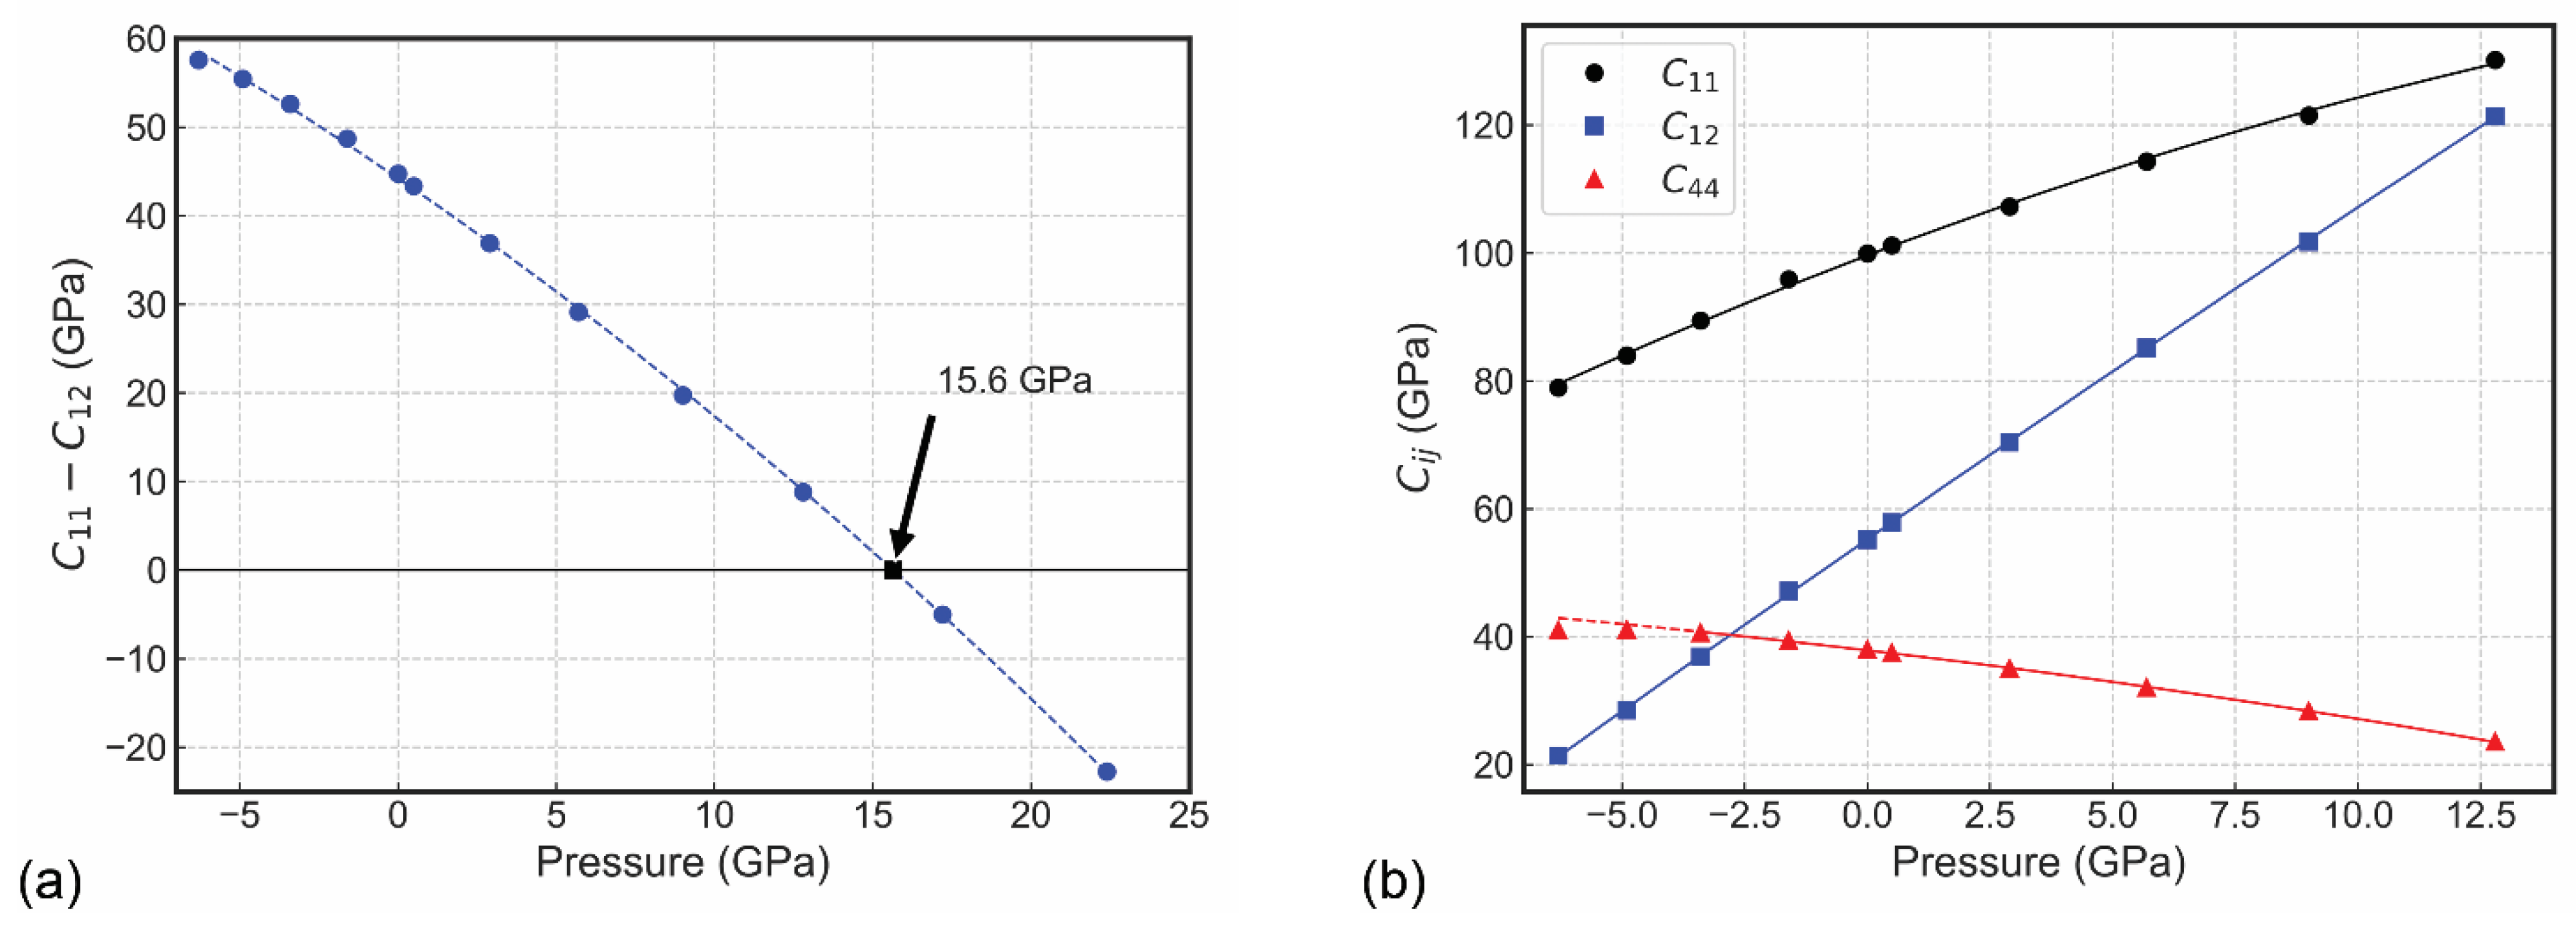
The second and third criteria are satisfied throughout the pressure conditions explored in the present work. However, the first condition is not met at 17.2 GPa and 22.4 GPa (see Figure 4a) and, by fitting the data with a second-order polynomial, it was observed that the maximum allowed compression is about 15.6 GPa (black square in Figure 4a). Hence, it is expected that sodalite is not mechanically stable above this pressure threshold and it could undergo a phase transition or decomposition, according to our symmetry-constrained simulations at absolute zero.
The value of the bulk modulus at equilibrium geometry, KR = KV = KVRH = 70.08 GPa, can be exploited to assess the quality of the simulation approach by comparing it to the K0 equation of state parameter. Since their difference is extremely low (0.1%), the computational methods here employed are consistent and physically valid.
Further positive assessment of the simulated stiffness components comes from the comparison with the experimental ones determined by Li and co-workers [15] with ultrasound techniques (C11 = 88.52 GPa C44 = 36.46 GPa and C12 = 38.72 GPa). In detail, the DFT/B3LYP-D3 results at zero temperature and pressure differ by about +13%, +4% and +42% for the C11, C44 and C12 moduli, respectively, an observation in line with the equation of state previously discussed.
The graph showing the evolution of the elastic moduli with pressure is presented in Figure 4b, with the uniaxial components C11 and C12 increasing with P, whereas an inverse trend is observed for the shear component C44. The functional description of the variation of the stiffness matrix with pressure was obtained for each Cij(P) curve by means of a finite strain fit of the type:
where Cij0 is the elastic modulus value at zero pressure (in GPa units), Cij′ is the pressure derivative of Cij (dCij/dP) is dimensionless and is the pressure second derivative of the elastic modulus (d2Cij/d2P, in GPa−1 units). The regression of the data resulted in a0 = 99.59 GPa, a1 = 2.9102 and a2 = −4.4238·10−2 GPa−1 for C11 (R2 = 0.9988); a0 = 37.86 GPa, a1 = −0.9051 and a2 = −1.6801·10−2 GPa−1 for C44 (R2 = 0.9997); and a0 = 55.19 GPa, a1 = 5.3134 and a2 = −1.1938·10−2 GPa−1 for C12 (R2 = 0.9999). Hence, the rate of stiffening of the off-diagonal C12 modulus, i.e., C12′, is higher than that of the C11 term by about 1.8 times, explaining the mechanical instability previously discussed.
Cij(P) = Cij0 + Cij′P + Cij″P2
Finally, the wave velocities were calculated for single-crystal sodalite by solving the Christoffel’s equation in the case a monochromatic plane wave with wave vector q, which is the propagation direction [68]:
where Mij is a component of the Christoffel matrix M:
Cijkl are the elastic moduli (in 4th-rank notation), ρ is the crystal density, vp is the wave velocity (known as phase velocity), δij is the Kronecker’s delta function and s is the polarization. Since the velocities are independent of the wavelength, q is assumed as a dimensionless unit vector denoting only the direction of travel of a monochromatic plane wave. The solutions of Christoffel’s equation above reported are one primary (P-wave, longitudinal, vP) and two secondary (S-wave, transverse, vS) acoustic wave velocities, with the eigenvectors describing the polarization directions. However, since sound waves are never purely monochromatic, it is more realistic to calculate the so-called group velocities, vg, which consider the sound as a wave packet with a small spread in wavelength and direction of travel, according to the formula [69]:
The gradient of the phase velocities is a derivative to the components of q, which is calculated in the reciprocal space (assumed dimensionless). It is worth noting that, while vp is a scalar function of q, vg is a vector that is not necessarily parallel to q, and the angle between the two velocities (phase and group) is given by
with ψ being called the power flow angle. The power flow angle varies as a function of the direction because q and vg are not parallel, thus there are some directions showing concentration of the energy flux, whereas others are characterized by its dispersion. This effect, also known as the phonon focusing effect, is quantified by the enhancement factor A [70]:
where ΔΘp and ΔΘg are defined as the solid angles that are crossed phase wave vectors np and group wave vectors ng, respectively. np and ng are the normalized vectors of the phase and group velocities, respectively. More details can be found in the dedicated literature [69,70,71].
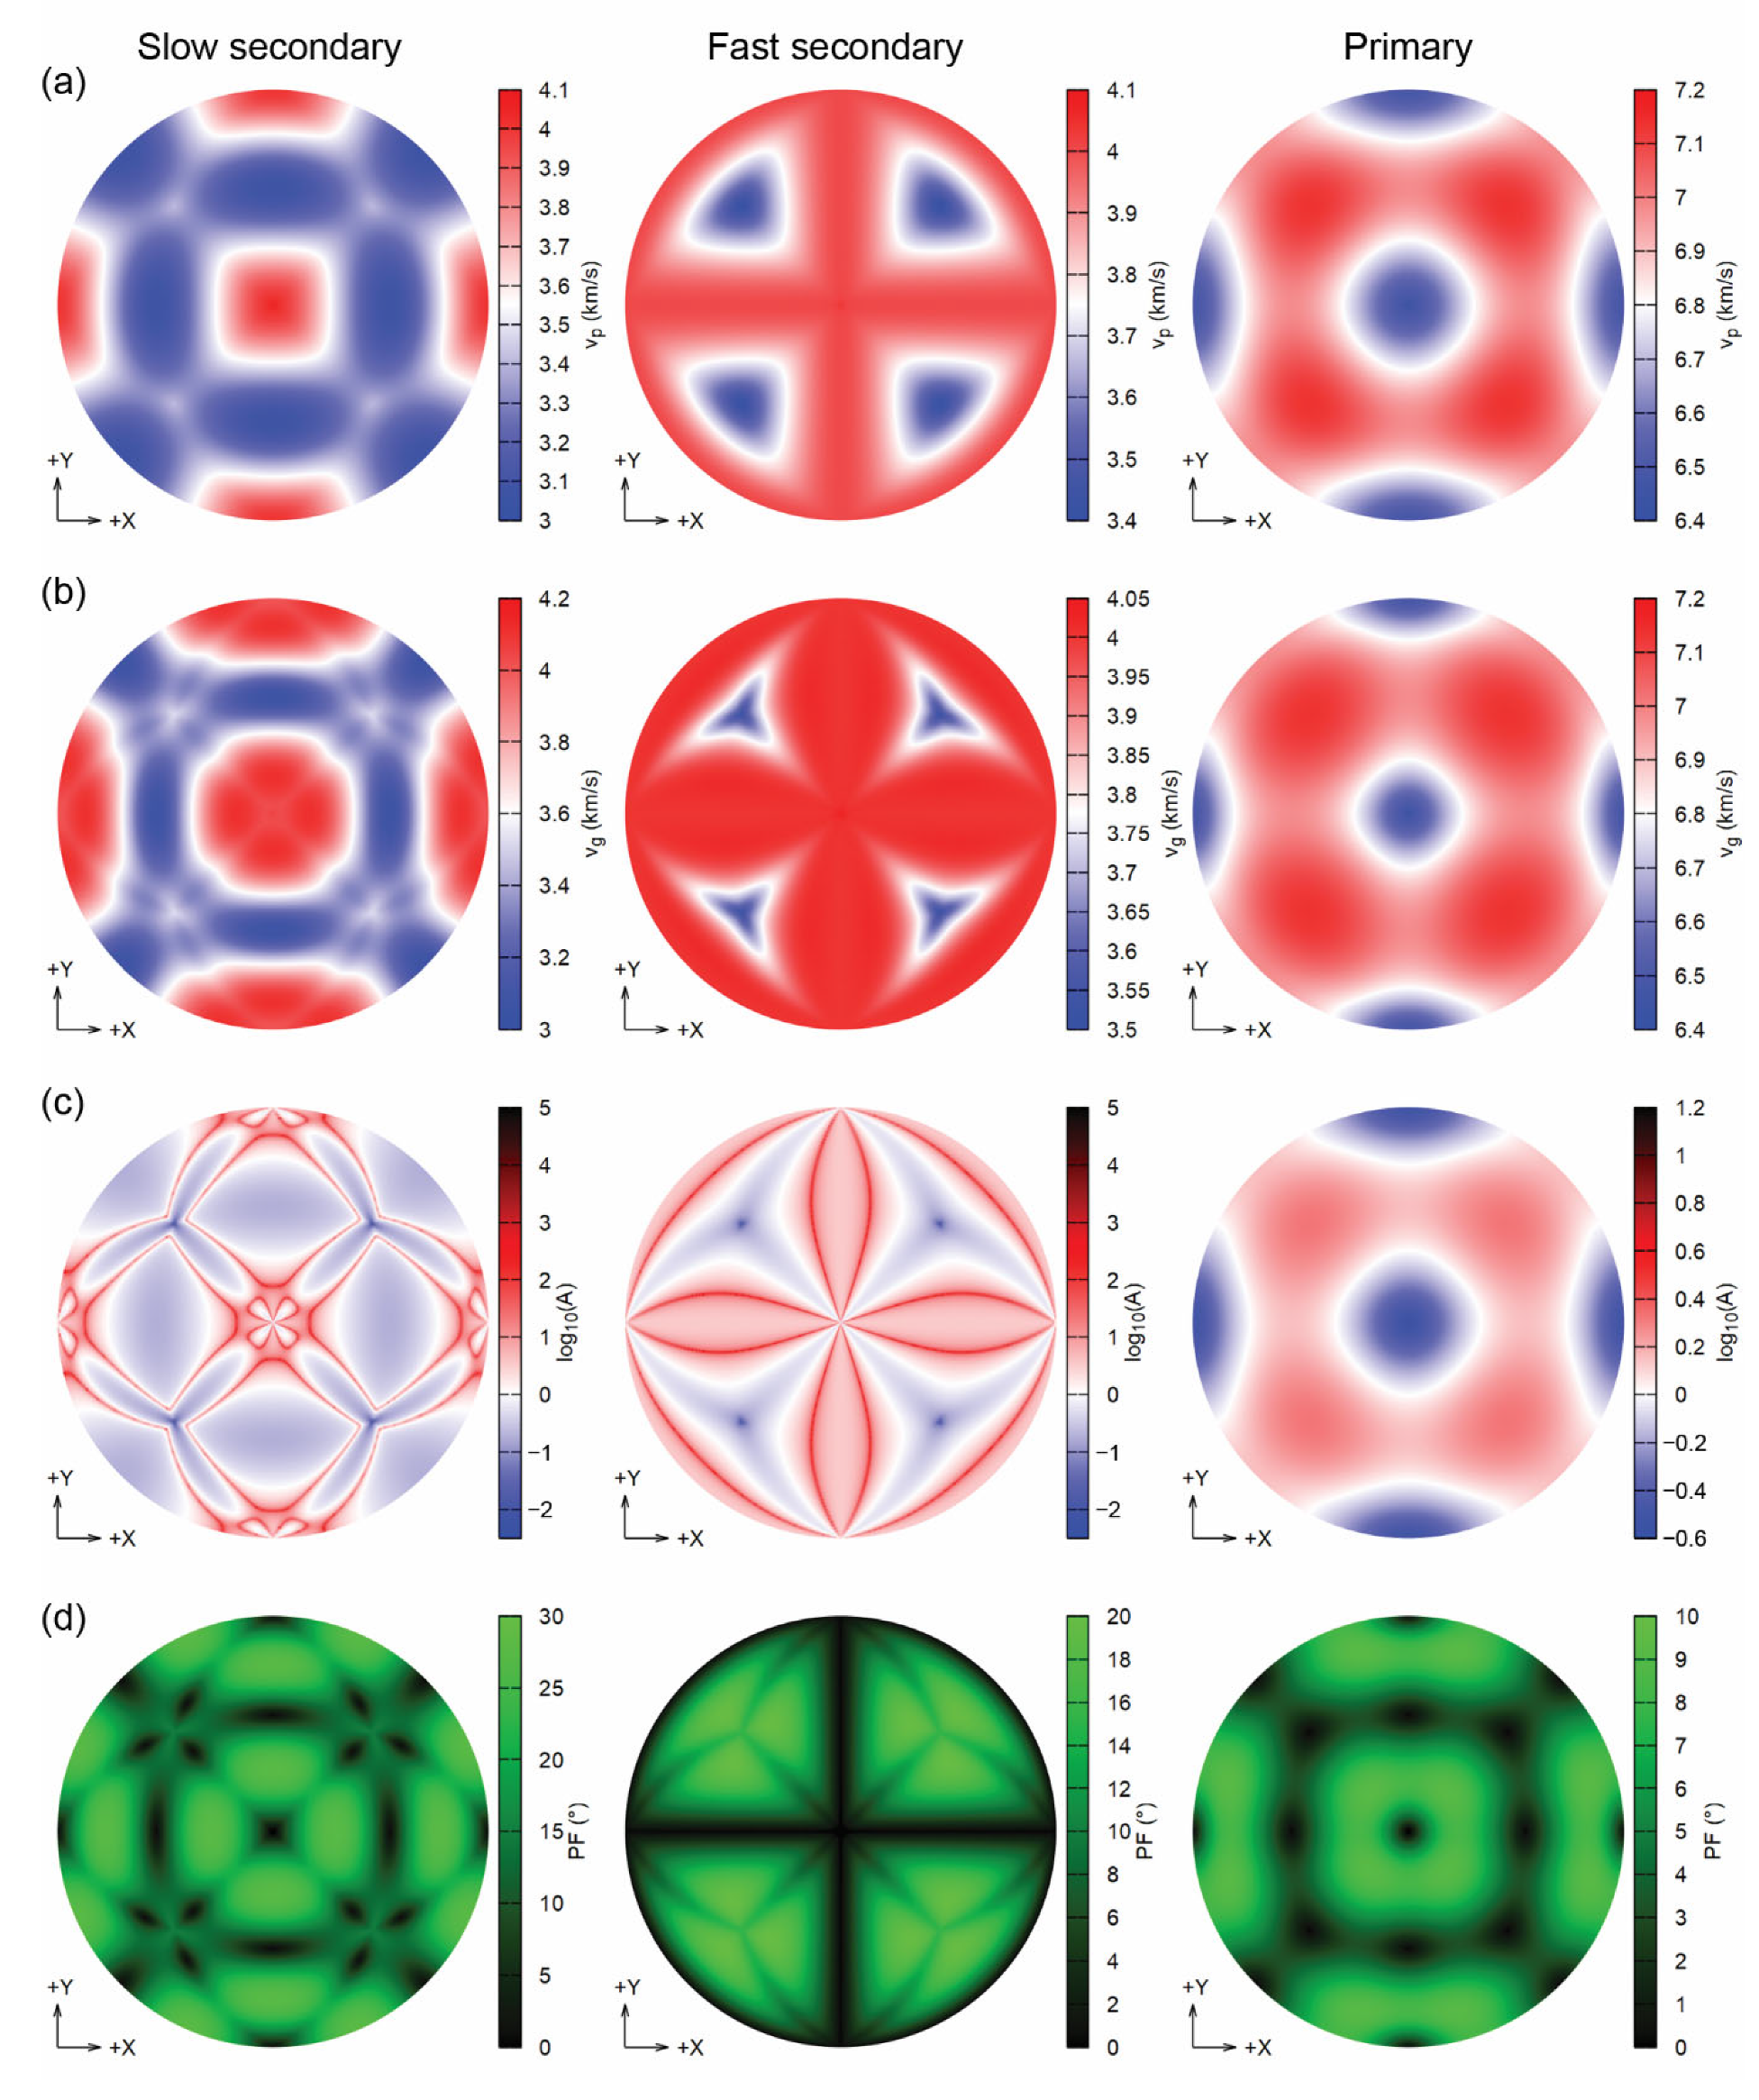
The seismic velocity results, i.e., phase velocity vp, group velocity vg, enhancement factor A and power flow angle ψ for sodalite at 0 GPa are reported in Figure 5, as upper hemisphere (Z > 0) Lambert equal-area projections on the XY plane. The cubic symmetry of the mineral is immediately recognizable from the patterns in each panel and for longitudinal and transverse acoustic waves. The enhancement factor is different according to the type of wave. For the P-mode, A is lowest along the Cartesian [100], [010] and [001] directions (Cartesian X, Y and Z) and the highest along the [111] direction. While the distribution of the enhancement factor is simple for P-waves, when considering the transverse modes there are complex patterns, with the lowest A value along the [111] direction.
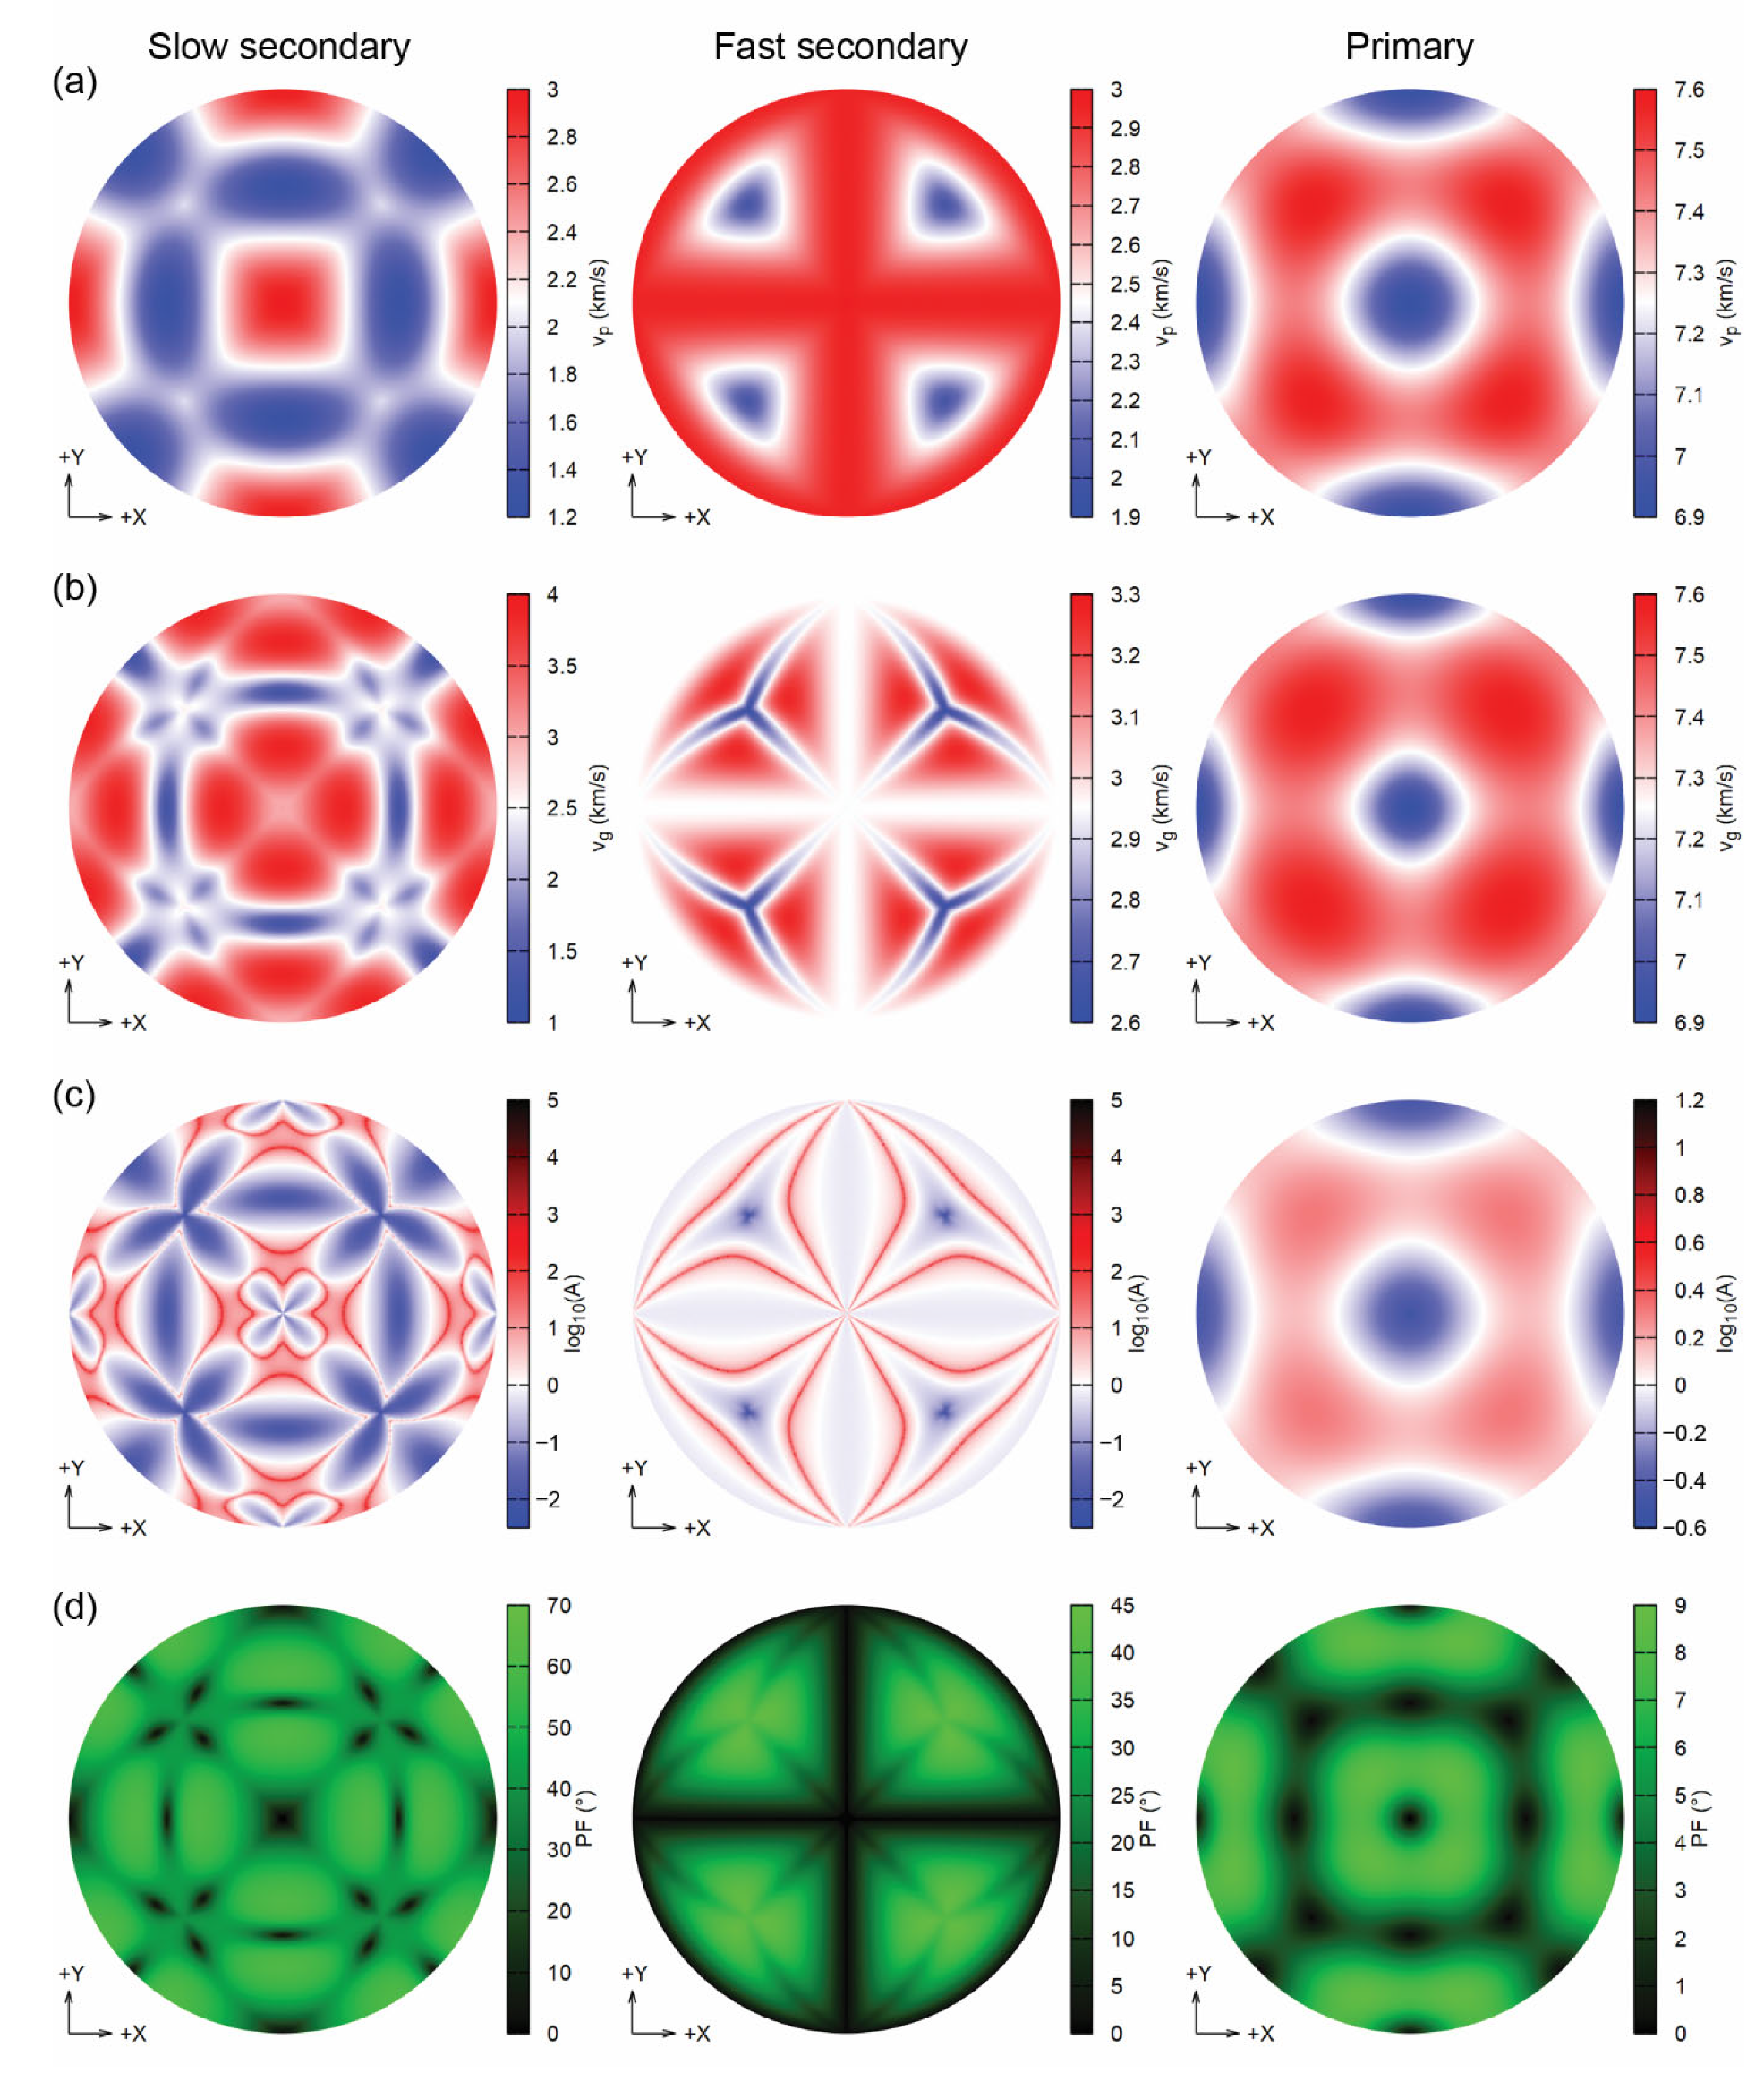
By increasing pressure, the phase velocities change their minimum–maximum value ranges, but their directional distribution is almost unvaried, as shown in Figure 6 relatively to the mineral compressed at 12.8 GPa. However, there are striking differences in the group velocities vg, especially for the slow and fast S-waves (Figure 6b), maintaining the cubic symmetry. These variations are due to the power flow angle values increasing up to about 70° (slow waves) and 45° (fast waves) at the maximum pressure investigated (12.8 GPa), whereas they were much lower (30° and 20°, respectively), at 0 GPa. Conversely, primary waves are less affected by pressure effects. The enhancement factor A clearly shows higher variations of the power flow angle, as reported in the logarithmic plots in Figure 5c and Figure 6c.
4. Conclusions
In the present work, we provided for the first time an ab initio investigation of the crystal chemical and elastic properties of sodalite [Na8(Al6Si6O24)Cl2, space group ], a zeolite mineral with important fundamental (geological and minero-petrographic) and technological (e.g., catalysis and separation, building and construction materials) applications. The knowledge of the elastic behaviour of this mineral under pressure is important to assess its mechanical stability and guide the possible use of the material in specific applications. The study was conducted at the Density Functional Theory level, using the well-known hybrid functional B3LYP corrected with the DFT-D3 scheme to include the contributions arising from van der Waals interactions.
Albeit being at absolute zero (0 K), the third-order Birch–Murnaghan equation of the state of the mineral calculated from the U(V) curves up to about 22 GPa is in line with the few experimental studies reported in the literature. The analysis of the internal geometry showed that the compression mechanism is controlled by both the Na–O and Na–Cl distances, and hence on the respective tetrahedral volumes, and the T–O–T bridging angle. Conversely, the aluminosilicate framework, i.e., the Si–O and Al–O bonds, was the least affected by pressure. No sign of abrupt structural variations in the considered hydrostatic pressure range suggested a possible phase transition or decomposition. However, it must be recalled that the simulations were conducted by constraining the symmetry, thus the unit cell and its atoms were free to relax within the symmetry operations of the space group. In fact, from the elastic point of view, the necessary and sufficient Born stability criteria were not satisfied above 15.6 GPa, meaning that sodalite is not mechanically stable above this pressure threshold. In future, high-pressure simulations and thermodynamic analyses will be performed to check if other possible, more energetically favourable crystal structures exist.
Finally, the second-order elastic moduli of sodalite and their functional variation with pressure were reported, information of utmost relevance for both geophysical studies and applications of the zeolite. The variation of the elastic moduli is well described by a finite-strain fit using second-order polynomial functions. In addition, single-crystal and polycrystalline elastic properties derived from the stiffness tensor were calculated as a reference for future studies on this mineral phase.
Author Contributions
Conceptualization, G.U. and G.V.; methodology, G.U.; validation, G.U. and G.V.; formal analysis, G.U.; investigation, G.U. and G.V.; data curation, G.U.; writing—review and editing, G.U. and G.V.; visualization, G.U.; supervision, G.V. All authors have read and agreed to the published version of the manuscript.
Funding
This research received no external funding.
Institutional Review Board Statement
Not applicable.
Informed Consent Statement
Not applicable.
Data Availability Statement
Data are available within the present article.
Acknowledgments
The authors wish to thank the University of Bologna for supporting the present research.
Conflicts of Interest
The authors declare no conflict of interest.
References
- Barrer, R.M. Hydrothermal Chemistry of Zeolites; Academic Press: London, UK; New York, NY, USA, 1982; p. 360. [Google Scholar]
- Auerbach, S.M.; Carrado, K.A.; Dutta, P.K. Handbook of Zeolite Science and Technology; CRC Press: New York, NY, USA, 2003. [Google Scholar]
- Astala, R.; Auerbach, S.M.; Monson, P.A. Density functional theory study of silica zeolite structures: Stabilities and mechanical properties of SOD, LTA, CHA, MOR, and MFI. J. Phys. Chem. B 2004, 108, 9208–9215. [Google Scholar] [CrossRef]
- Hassan, I.; Antao, S.M.; Parise, J.B. Sodalite: High-temperature structures obtained from synchrotron radiation and Rietveld refinements. Am. Miner. 2004, 89, 359–364. [Google Scholar] [CrossRef]
- Hassan, I.; Grundy, H.D. The crystal structures of sodalite-group minerals. Acta Crystallogr. Sect. B Struct. Sci. 1984, B40, 6–13. [Google Scholar] [CrossRef]
- McMullan, R.K.; Ghose, S.; Haga, N.; Schomaker, V. Sodalite, Na4Si3Al3O12Cl: Structure and ionic mobility at high temperatures by neutron diffraction. Acta Crystallogr. Sect. B Struct. Sci. 1996, 52, 616–627. [Google Scholar] [CrossRef] [Green Version]
- Pauling, L. The structure of sodalite and helvite. Z. Kristallogr. 1930, 74, 213–225. [Google Scholar] [CrossRef]
- Felsche, J.; Luger, S.; Baerlocher, C. Crystal structures of the hydro-sodalite Na6[AlSiO4]6 8H2O and of the anhydrous sodalite Na6[AlSiO4]6. Zeolites 1986, 6, 367–372. [Google Scholar] [CrossRef]
- Davidovits, J. Geopolymers Chemistry and Applications, 5th ed.; Institute Géopolymère: Saint-Quentin, France, 2020. [Google Scholar]
- Nagy, K.L.; Blum, A.E.; Lasaga, A.C. Dissolution and precipitation kinetics of kaolinite at 80 degrees C and pH 3; The dependence on solution saturation state. Am. J. Sci. 1991, 291, 649–686. [Google Scholar] [CrossRef]
- Armigliato, A.; Valdré, G. Analytical electron microscopy of Al/TiN contacts on silicon for applications to very large scale integrated devices. J. Appl. Phys. 1987, 61, 390–396. [Google Scholar] [CrossRef]
- Burciaga-Díaz, O.; Escalante-García, J.I. Structural transition to well-ordered phases of NaOH-activated slag-metakaolin cements aged by 6 years. Cem. Concr. Res. 2022, 156, 106791. [Google Scholar] [CrossRef]
- Gatti, A.M.; Valdrè, G.; Tombesi, A. Importance of microanalysis in understanding mechanism of transformation in active glassy biomaterials. J. Biomed. Mater. Res. 1996, 31, 475–480. [Google Scholar] [CrossRef]
- Hazen, R.M.; Sharp, Z.D. Compressibility of sodalite and scapolite. Am. Mineral. 1988, 73, 1120–1122. [Google Scholar]
- Li, Z.; Nevitt, M.V.; Ghose, S. Elastic constants of sodalite Na4Al3Si3O12Cl. Appl. Phys. Lett. 1989, 55, 1730–1731. [Google Scholar] [CrossRef]
- Sangthong, W.; Limtrakul, J.; Illas, F.; Bromley, S.T. Stable nanoporous alkali halide polymorphs: A first principles bottom-up study. J. Mater. Chem. 2008, 18, 5871–5879. [Google Scholar] [CrossRef]
- Williams, J.J.; Evans, K.E.; Walton, R.I. On the elastic constants of the zeolite chlorosodalite. Appl. Phys. Lett. 2006, 88, 021914. [Google Scholar] [CrossRef] [Green Version]
- Gatta, G.D.; Lee, Y. Zeolites at high pressure: A review. Miner. Mag. 2014, 78, 267–291. [Google Scholar] [CrossRef] [Green Version]
- Dovesi, R.; Erba, A.; Orlando, R.; Zicovich-Wilson, C.M.; Civalleri, B.; Maschio, L.; Rerat, M.; Casassa, S.; Baima, J.; Salustro, S.; et al. Quantum-mechanical condensed matter simulations with CRYSTAL. Wires Comput. Mol. Sci. 2018, 8, e1360. [Google Scholar] [CrossRef]
- Becke, A.D. Density-Functional Thermochemistry. III. The Role of Exact Exchange. J. Chem. Phys. 1993, 98, 5648. [Google Scholar] [CrossRef] [Green Version]
- Lee, C.; Yang, W.; Parr, R.G. Development of the Colle-Salvetti Correlation-Energy Formula into a Functional of the Electron-Density. Phys. Rev. B 1988, 37, 785–789. [Google Scholar] [CrossRef] [Green Version]
- Prencipe, M.; Pascale, F.; Zicovich-Wilson, C.M.; Saunders, V.R.; Orlando, R.; Dovesi, R. The vibrational spectrum of calcite (CaCO3): An ab initio quantum-mechanical calculation. Phys. Chem. Miner. 2004, 31, 559–564. [Google Scholar] [CrossRef]
- Ulian, G.; Moro, D.; Valdrè, G. Thermodynamic, elastic, and vibrational (IR/Raman) behavior of mixed type-AB carbonated hydroxylapatite by density functional theory. Am. Miner. 2021, 106, 1928–1939. [Google Scholar] [CrossRef]
- Ulian, G.; Valdrè, G. Thermomechanical, electronic and thermodynamic properties of ZnS cubic polymorphs: An ab initio investigation on the zinc-blende—Rock-salt phase transition. Acta Crystallogr. Sect. B Struct. Sci. 2019, 75, 1042–1059. [Google Scholar] [CrossRef]
- Pascale, F.; Zicovich-Wilson, C.M.; Orlando, R.; Roetti, C.; Ugliengo, P.; Dovesi, R. Vibration frequencies of Mg3Al2Si3O12 pyrope. An ab initio study with the CRYSTAL code. J. Phys. Chem. B 2005, 109, 6146–6152. [Google Scholar] [CrossRef] [PubMed]
- Nada, R.; Nicholas, J.B.; McCarthy, M.I.; Hess, A.C. Basis sets for ab initio periodic Hartree-Fock studies of zeolite/adsorbate interactions: He, Ne, and Ar in silica sodalite. Int. J. Quantum Chem. 1996, 60, 809–820. [Google Scholar] [CrossRef]
- Catti, M.; Valerio, G.; Dovesi, R.; Causà, M. Quantum-mechanical calculation of the solid-state equilibrium MgO+α-Al2O3⇄MgAl2O4 (spinel) versus pressure. Phys. Rev. B 1994, 49, 14179–14187. [Google Scholar] [CrossRef] [PubMed]
- Valenzano, L.; Torres, F.J.; Doll, K.; Pascale, F.; Zicovich-Wilson, C.M.; Dovesi, R. Ab initio study of the vibrational spectrum and related properties of crystalline compounds; the case of CaCO3 calcite. Z Phys. Chem. 2006, 220, 893–912. [Google Scholar] [CrossRef]
- Dovesi, R.; Roetti, C.; Freyria Fava, C.; Prencipe, M.; Saunders, V.R. On the elastic properties of lithium, sodium and potassium oxide. An ab initio study. Chem. Phys. 1991, 156, 11–19. [Google Scholar] [CrossRef]
- Aprà, E.; Causa, M.; Prencipe, M.; Dovesi, R.; Saunders, V.R. On the structural properties of NaCl: An ab initio study of the B1-B2 phase transition. J. Phys. Condens. Matter 1993, 5, 2969–2976. [Google Scholar] [CrossRef]
- Ulian, G.; Valdrè, G. Density functional investigation of the thermophysical and thermochemical properties of talc [Mg3Si4O10(OH)2]. Phys. Chem. Miner. 2015, 42, 151–162. [Google Scholar] [CrossRef]
- Ulian, G.; Valdrè, G. Structural, vibrational and thermophysical properties of pyrophyllite by semi-empirical density functional modelling. Phys. Chem. Miner. 2015, 42, 609–627. [Google Scholar] [CrossRef]
- Gatta, G.D.; Lotti, P.; Merlini, M.; Liermann, H.-P.; Lausi, A.; Valdrè, G.; Pavese, A. Elastic behaviour and phase stability of pyrophyllite and talc at high pressure and temperature. Phys. Chem. Miner. 2015, 42, 309–318. [Google Scholar] [CrossRef]
- Ulian, G.; Moro, D.; Valdrè, G. First principle investigation of the mechanical properties of natural layered nanocomposite: Clinochlore as a model system for heterodesmic structures. Compos. Struct. 2018, 202, 551–558. [Google Scholar] [CrossRef]
- Ulian, G.; Moro, D.; Valdrè, G. Infrared and Raman spectroscopic features of clinochlore Mg6Si4O10(OH)8: A density functional theory contribution. Appl. Clay Sci. 2020, 197, 105779. [Google Scholar] [CrossRef]
- Ulian, G.; Valdrè, G. Effects of fluorine content on the elastic behavior of topaz [Al2SiO4(F,OH)2]. Am. Miner. 2017, 102, 347–356. [Google Scholar] [CrossRef]
- Ulian, G.; Valdrè, G. Equation of state and second-order elastic constants of portlandite Ca(OH)2 and brucite Mg(OH)2. Phys. Chem. Miner. 2019, 46, 101–117. [Google Scholar] [CrossRef]
- Monkhorst, H.J.; Pack, J.D. Special points for Brillouin-zone integrations. Phys. Rev. B 1976, 13, 5188. [Google Scholar] [CrossRef]
- Grimme, S.; Antony, J.; Ehrlich, S.; Krieg, H. A consistent and accurate ab initio parametrization of density functional dispersion correction (DFT-D) for the 94 elements H-Pu. J. Chem. Phys. 2010, 132, 154104. [Google Scholar] [CrossRef] [Green Version]
- Becke, A.D.; Johnson, E.R. A density-functional model of the dispersion interaction. J. Chem. Phys. 2005, 123, 154101. [Google Scholar] [CrossRef]
- Johnson, E.R.; Becke, A.D. A post-Hartree-Fock model of intermolecular interactions. J. Chem. Phys. 2005, 123, 024101. [Google Scholar] [CrossRef]
- Johnson, E.R.; Becke, A.D. A post-Hartree-Fock model of intermolecular interactions: Inclusion of higher-order corrections. J. Chem. Phys. 2006, 124, 174104. [Google Scholar] [CrossRef]
- Ulian, G.; Valdrè, G. Study of the variation of the optical properties of calcite with applied stress, useful for specific rock and material mechanics. Sci. Rep. 2022, 12, 299. [Google Scholar] [CrossRef]
- Ulian, G.; Valdrè, G. Structural and elastic behaviour of aragonite at high-pressure: A contribution from first-principle simulations. Comput. Mater. Sci. 2022, 212, 111600. [Google Scholar] [CrossRef]
- Broyden, C.G. The convergence of a class of double-rank minimization algorithms: 2. The new algorithm. IMA J. Appl. Math. 1970, 6, 222–231. [Google Scholar] [CrossRef] [Green Version]
- Broyden, C.G. The convergence of a class of double-rank minimization algorithms: 1. General considerations. IMA J. Appl. Math. 1970, 6, 76–90. [Google Scholar] [CrossRef] [Green Version]
- Fletcher, R. A new approach to variable metric algorithms. Comput. J. 1970, 13, 317–322. [Google Scholar] [CrossRef] [Green Version]
- Goldfarb, D. A family of variable-metric methods derived by variational means. Math. Comput. 1970, 24, 23–26. [Google Scholar] [CrossRef]
- Shanno, D.F. Conditioning of quasi-Newton methods for function minimization. Math. Comput. 1970, 24, 647–656. [Google Scholar] [CrossRef]
- Ulian, G.; Moro, D.; Valdrè, G. Benchmarking dispersion-corrected DFT methods for the evaluation of materials with anisotropic properties: Structural, electronic, dielectric, optical and vibrational analysis of calcite (CaCO3, space group: R3c). Phys. Chem. Chem. Phys. 2021, 23, 18899–18907. [Google Scholar] [CrossRef]
- Ulian, G.; Moro, D.; Valdrè, G. Elastic properties of heterodesmic composite structures: The case of calcite CaCO3 (space group R3¯c). Compos. Part C Open Access 2021, 6, 100184. [Google Scholar] [CrossRef]
- Perger, W.F.; Criswell, J.; Civalleri, B.; Dovesi, R. Ab-initio calculation of elastic constants of crystalline systems with the CRYSTAL code. Comput. Phys. Commun. 2009, 180, 1753–1759. [Google Scholar] [CrossRef]
- Nye, J.F. Physical Properties of Crystals; Oxford University Press: Oxford, UK, 1957. [Google Scholar]
- Erba, A.; Mahmoud, A.; Belmonte, D.; Dovesi, R. High pressure elastic properties of minerals from ab initio simulations: The case of pyrope, grossular and andradite silicate garnets. J. Chem. Phys. 2014, 140, 124703. [Google Scholar] [CrossRef]
- Ulian, G.; Valdrè, G. Second-order elastic constants of hexagonal hydroxylapatite (P63) from ab initio quantum mechanics: Comparison between DFT functionals and basis sets. Int. J. Quantum Chem. 2018, 118, e25500. [Google Scholar] [CrossRef]
- Ulian, G.; Valdrè, G. QUANTAS: A Python software for the analysis of thermodynamics and elastic behavior of solids from ab initio quantum mechanical simulations and experimental data. J. Appl. Crystallogr. 2022, 55, 386–396. [Google Scholar] [CrossRef] [PubMed]
- Marmier, A.; Lethbridge, Z.A.D.; Walton, R.I.; Smith, C.W.; Parker, S.C.; Evans, K.E. ElAM: A computer program for the analysis and representation of anisotropic elastic properties. Comput. Phys. Commun. 2010, 181, 2102–2115. [Google Scholar] [CrossRef]
- Gaillac, R.; Pullumbi, P.; Coudert, F.X. ELATE: An open-source online application for analysis and visualization of elastic tensors. J. Phys. Condens. Matter 2016, 28, 275201. [Google Scholar] [CrossRef] [Green Version]
- Momma, K.; Izumi, F. VESTA: A three-dimensional visualization system for electronic and structural analysis. J. Appl. Crystallogr. 2008, 41, 653–658. [Google Scholar] [CrossRef]
- Baur, W.H.; Fischer, R.X. The Floppiness of It All: Bond Lengths Change with Atomic Displacement Parameters and the Flexibility of Various Coordination Tetrahedra in Zeolitic Frameworks. An Empirical Structural Study of Bond Lengths and Angles. Chem. Mater. 2019, 31, 2401–2420. [Google Scholar] [CrossRef]
- Cano, N.F.; Ayta, W.E.F.; Watanabe, S. The electronic and optical properties of sodalite (Na8 Al6 Si6 O24 Cl2) from first principles. Solid State Commun. 2010, 150, 195–197. [Google Scholar] [CrossRef]
- Colinet, P.; Gheeraert, A.; Curutchet, A.; Le Bahers, T. On the Spectroscopic Modeling of Localized Defects in Sodalites by TD-DFT. J. Phys. Chem. C 2020, 124, 8949–8957. [Google Scholar] [CrossRef]
- Stoliaroff, A.; Schira, R.; Blumentritt, F.; Fritsch, E.; Jobic, S.; Latouche, C. Point Defects Modeling Explains Multiple Sulfur Species in Sulfur-Doped Na4(Al3Si3O12)Cl Sodalite. J. Phys. Chem. C 2021, 125, 16674–16680. [Google Scholar] [CrossRef]
- Birch, F. Finite elastic strain of cubic crystals. Phys. Rev. 1947, 71, 809. [Google Scholar] [CrossRef]
- Hebbache, M.; Zemzemi, M. Ab initio study of high-pressure behavior of a low compressibility metal and a hard material: Osmium and diamond. Phys. Rev. B 2004, 70, 224107. [Google Scholar] [CrossRef]
- Chukanov, N.V.; Aksenov, S.M.; Rastsvetaeva, R.K. Structural chemistry, IR spectroscopy, properties, and genesis of natural and synthetic microporous cancrinite- and sodalite-related materials: A review. Microporous Mesoporous Mater. 2021, 323, 111098. [Google Scholar] [CrossRef]
- Born, M.; Huang, K. Dynamical Theory of Crystal Lattices; Clarendon Press: Oxford, UK, 1954. [Google Scholar]
- Musgrave, M.J.P. Crystal Acoustics: Introduction to the Study of Elastic Waves and Vibrations in Crystals; Holden-Day: San Francisco, CA, USA, 1970. [Google Scholar]
- Jaeken, J.W.; Cottenier, S. Solving the Christoffel equation: Phase and group velocities. Comput. Phys. Commun. 2016, 207, 445–451. [Google Scholar] [CrossRef] [Green Version]
- Muñoz-Santiburcio, D.; Hernández-Laguna, A.; Soto, J.I. AWESoMe: A code for the calculation of phase and group velocities of acoustic waves in homogeneous solids. Comput. Phys. Commun. 2015, 192, 272–277. [Google Scholar] [CrossRef]
- Muñoz-Santiburcio, D.; Hernández-Laguna, A. AWESOME 1.1: A code for the calculation of phase and group velocities of acoustic waves in homogeneous solids. Comput. Phys. Commun. 2017, 217, 212–214. [Google Scholar] [CrossRef]
Figure 1.
Sodalite Na8(Al6Si6O24)Cl2 polyhedral model seen along (a) the [100] and (b) the [111] directions. The dashed blue lines show the mineral lattice. Colour code for atoms: Blue—Si; cyan—Al; red—O; yellow—Na and green—Cl.
Figure 1.
Sodalite Na8(Al6Si6O24)Cl2 polyhedral model seen along (a) the [100] and (b) the [111] directions. The dashed blue lines show the mineral lattice. Colour code for atoms: Blue—Si; cyan—Al; red—O; yellow—Na and green—Cl.

Figure 2.
Sodalite (a) unit cell volume, (b) bond lengths and (c) Si–O–Al bridging angle variations as a function of pressure. In panel (a), the results of Hazen and Sharp [14] are reported for a direct comparison.
Figure 2.
Sodalite (a) unit cell volume, (b) bond lengths and (c) Si–O–Al bridging angle variations as a function of pressure. In panel (a), the results of Hazen and Sharp [14] are reported for a direct comparison.

Figure 3.
Sodalite framework at 22 GPa (left) and −6 GPa (right), as seen from the [111] and [100] directions. The wireframe structure is composed by Al (cyan), Si (blue) and O (red), whereas the Na and Cl atoms are shown as yellow and green spheres, respectively.
Figure 3.
Sodalite framework at 22 GPa (left) and −6 GPa (right), as seen from the [111] and [100] directions. The wireframe structure is composed by Al (cyan), Si (blue) and O (red), whereas the Na and Cl atoms are shown as yellow and green spheres, respectively.

Figure 4.
(a) Evolution of the mechanical stability criterion C11 − C12 > 0, with the black square showing the occurrence of instability above 15.6 GPa. (b) Elastic moduli of sodalite as a function of pressure, within the stability region. The lines are 2nd-order polynomial fit of the data (see text for details).

Figure 5.
Analysis of the seismic wave velocities (Lambert equal-area upper hemisphere projections) of sodalite at 0 GPa, showing (a) the phase velocities vP (km/s), (b) the group velocities vP (km/s), (c) the enhancement factor A and (d) the power flow angle (PF, °).
Figure 5.
Analysis of the seismic wave velocities (Lambert equal-area upper hemisphere projections) of sodalite at 0 GPa, showing (a) the phase velocities vP (km/s), (b) the group velocities vP (km/s), (c) the enhancement factor A and (d) the power flow angle (PF, °).

Figure 6.
Analysis of the seismic wave velocities (Lambert equal-area upper hemisphere projections) of sodalite at 12.8 GPa, showing (a) the phase velocities vP (km/s), (b) the group velocities vP (km/s), (c) the enhancement factor A and (d) the power flow angle (PF, °).
Figure 6.
Analysis of the seismic wave velocities (Lambert equal-area upper hemisphere projections) of sodalite at 12.8 GPa, showing (a) the phase velocities vP (km/s), (b) the group velocities vP (km/s), (c) the enhancement factor A and (d) the power flow angle (PF, °).


Table 1.
Zero-pressure (equilibrium) structure of sodalite Na8(Al6Si6O24)Cl2, with a the lattice parameter and V the unit cell volume, and internal geometry (atomic distances, bond angles, polyhedral volumes and relevant atomic fractional coordinates).
Table 1.
Zero-pressure (equilibrium) structure of sodalite Na8(Al6Si6O24)Cl2, with a the lattice parameter and V the unit cell volume, and internal geometry (atomic distances, bond angles, polyhedral volumes and relevant atomic fractional coordinates).
| B3LYP-D3 | Δ | FF 1 | SR-XRPD 2 | ND 3 | XRD 4 | ||
|---|---|---|---|---|---|---|---|
| a (Å) | 8.78091 | −1.19% | 8.848 | 8.88696 | 8.882 | 8.8823 | |
| V (Å3) | 677.0477 | −3.54% | 692.684 | 701.875 | 700.700 | 700.771 | |
| Si–O (Å) | (×4) | 1.6298 | 0.60% | 1.598 | 1.6201 | 1.620 | 1.620 |
| Al–O (Å) | (×4) | 1.7437 | 0.10% | 1.758 | 1.7419 | 1.740 | 1.742 |
| Na–O (Å) | (×3) | 2.2750 | −3.48% | 2.316 | 2.357 | 2.354 | 2.353 |
| Na–Cl (Å) | (×4) | 2.6486 | −2.52% | 2.749 | 2.717 | 2.735 | 2.716 |
| O–Si–O (°) | (×4) | 107.53 | 0.06% | 108.66 | 107.466 | 107.66 | 107.7 |
| (×2) | 113.42 | −0.12% | 111.11 | 113.560 | 113.15 | 113.0 | |
| Mean | 109.50 | 0.00% | 109.48 | 109.50 | 109.49 | 109.47 | |
| O–Al–O (°) | (×4) | 108.49 | 0.05% | 109.88 | 108.442 | 108.62 | 108.7 |
| (×2) | 111.45 | −0.09% | 108.66 | 111.550 | 111.18 | 111.0 | |
| Mean | 109.48 | 0.00% | 109.47 | 109.48 | 109.47 | 109.47 | |
| Si–O–Al (°) | 133.90 | −3.17% | 137.49 | 138.288 | 138.24 | ||
| VSiO4 (Å3) | 2.2208 | 2.18% | 2.0951 | 2.1734 | 2.1730 | - | |
| VAlO4 (Å3) | 2.7207 | 0.38% | 2.7840 | 2.7103 | 2.7033 | - | |
| Na1 (8e) | x/a | 0.17414 | −2.11% | 0.17937 | 0.1779 | 0.17780 | 0.1778 |
| O1 (24i) | x/a | 0.13816 | −1.13% | 0.13416 | 0.13974 | 0.13925 | 0.1390 |
| y/b | 0.14813 | −1.33% | 0.14782 | 0.15013 | 0.14954 | 0.1494 | |
| z/c | 0.42940 | −2.18% | 0.43525 | 0.43895 | 0.43851 | 0.4383 |
Table 2.
Unit cell volume V, lattice parameter a, differences in internal energy (ΔU) and enthalpy (ΔH) with respect to the equilibrium geometry (0 GPa), mean bond lengths and angles, polyhedron volume of SiO4 and AlO4 tetrahedra and position of the sodium and oxygen atoms as a function of pressure.
| P (GPa) | 22.4 | 17.2 | 12.8 | 9.0 | 5.7 | 2.9 | 0.5 | 0.0 | −1.6 | −3.4 | −4.9 | −6.3 | |
|---|---|---|---|---|---|---|---|---|---|---|---|---|---|
| a (Å) | 8.21885 | 8.30886 | 8.39887 | 8.48889 | 8.57890 | 8.66891 | 8.75892 | 8.78091 | 8.84893 | 8.93895 | 9.02896 | 9.11897 | |
| V (Å3) | 555.1791 | 573.6204 | 592.4656 | 611.7191 | 631.3853 | 651.4685 | 671.9731 | 677.0477 | 692.9035 | 714.2641 | 736.0593 | 758.2934 | |
| ΔU (Ha) | 0.25216 | 0.17133 | 0.10779 | 0.06053 | 0.02783 | 0.00821 | 0.00029 | 0.00000 | 0.00293 | 0.01512 | 0.03580 | 0.06407 | |
| ΔH (Ha) | 3.10532 | 2.43655 | 1.84532 | 1.32244 | 0.85921 | 0.44818 | 0.08293 | 0.00000 | −0.24208 | −0.53150 | −0.78961 | −1.02002 | |
| Si–O (Å) | (×4) | 1.593 | 1.600 | 1.607 | 1.613 | 1.618 | 1.624 | 1.629 | 1.630 | 1.633 | 1.638 | 1.642 | 1.646 |
| Al–O (Å) | (×4) | 1.692 | 1.702 | 1.711 | 1.719 | 1.727 | 1.735 | 1.742 | 1.744 | 1.749 | 1.756 | 1.762 | 1.768 |
| Na–O (Å) | (×3) | 2.047 | 2.081 | 2.116 | 2.152 | 2.189 | 2.227 | 2.265 | 2.275 | 2.306 | 2.348 | 2.392 | 2.438 |
| Na–Cl (Å) | (×4) | 2.307 | 2.355 | 2.405 | 2.458 | 2.514 | 2.571 | 2.633 | 2.649 | 2.697 | 2.764 | 2.835 | 2.910 |
| O–Si–O (°) | (×4) | 107.51 | 107.53 | 107.52 | 107.52 | 107.52 | 107.52 | 107.53 | 107.53 | 107.54 | 107.55 | 107.57 | 107.59 |
| (×2) | 113.46 | 113.44 | 113.45 | 113.46 | 113.45 | 113.44 | 113.43 | 113.42 | 113.41 | 113.38 | 113.34 | 113.30 | |
| Mean | 109.50 | 109.50 | 109.50 | 109.50 | 109.50 | 109.50 | 109.50 | 109.50 | 109.50 | 109.50 | 109.49 | 109.49 | |
| O–Al–O (°) | (×4) | 108.50 | 108.51 | 108.50 | 108.50 | 108.50 | 108.49 | 108.49 | 108.49 | 108.49 | 108.50 | 108.50 | 108.51 |
| (×2) | 111.43 | 111.41 | 111.42 | 111.43 | 111.44 | 111.44 | 111.45 | 111.45 | 111.44 | 111.43 | 111.42 | 111.41 | |
| Mean | 109.48 | 109.48 | 109.48 | 109.48 | 109.48 | 109.48 | 109.48 | 109.48 | 109.48 | 109.48 | 109.48 | 109.48 | |
| Si–O–Al (°) | 124.34 | 125.62 | 127.01 | 128.49 | 130.06 | 131.71 | 133.46 | 133.90 | 135.30 | 137.25 | 139.34 | 141.56 | |
| VSiO4 (Å3) | 2.0743 | 2.1018 | 2.1273 | 2.1513 | 2.1739 | 2.1956 | 2.216 | 2.2208 | 2.2354 | 2.2539 | 2.2714 | 2.2879 | |
| VAlO4 (Å3) | 2.4868 | 2.5300 | 2.5698 | 2.6078 | 2.6442 | 2.6792 | 2.7127 | 2.7207 | 2.7454 | 2.7769 | 2.8069 | 2.8361 | |
| VNa4Cl (Å3) | 6.3022 | 6.6986 | 7.1392 | 7.6251 | 8.1519 | 8.7258 | 9.3685 | 9.5350 | 10.0683 | 10.8319 | 11.6879 | 12.6480 | |
| Na (8e) | x/a | 0.16207 | 0.16361 | 0.16533 | 0.16720 | 0.16917 | 0.17126 | 0.17356 | 0.17414 | 0.17597 | 0.17850 | 0.18125 | 0.18425 |
| O (24i) | x/a | 0.13402 | 0.13458 | 0.13524 | 0.13592 | 0.13660 | 0.13729 | 0.13799 | 0.13816 | 0.13868 | 0.13937 | 0.14006 | 0.14075 |
| y/b | 0.14366 | 0.14432 | 0.14505 | 0.14578 | 0.14651 | 0.14723 | 0.14796 | 0.14813 | 0.14867 | 0.14937 | 0.15008 | 0.15077 | |
| z/c | 0.40887 | 0.41163 | 0.41464 | 0.41783 | 0.42118 | 0.42472 | 0.42845 | 0.42940 | 0.43239 | 0.43657 | 0.44107 | 0.44591 |
Table 3.
Elastic moduli Cij (GPa), density ρ (kg m−3), bulk modulus (K, GPa), linear compressibility (β, TPa−1), Young’s modulus (E, GPa), shear modulus (μ, GPa), Poisson’s ratio (υ), and average longitudinal and shear wave velocities (vP and vS, respectively), of sodalite as a function of pressure P (GPa).
| P | 22.4 * | 17.2 * | 12.8 | 9.0 | 5.7 | 2.9 | 0.5 | 0.0 | −1.6 | −3.4 | −4.9 | −6.3 |
|---|---|---|---|---|---|---|---|---|---|---|---|---|
| C11 | 146.00 | 138.78 | 130.19 | 121.50 | 114.29 | 107.26 | 101.19 | 99.91 | 95.88 | 89.45 | 83.98 | 78.95 |
| C44 | 5.94 | 16.91 | 23.57 | 28.35 | 32.05 | 35.02 | 37.49 | 37.99 | 39.39 | 40.58 | 41.09 | 41.00 |
| C12 | 168.76 | 143.79 | 121.38 | 101.79 | 85.16 | 70.39 | 57.85 | 55.16 | 47.18 | 36.85 | 28.52 | 21.38 |
| ρ | 2894 | 2801 | 2712 | 2626 | 2544 | 2466 | 2391 | 2373 | 2319 | 2249 | 2183 | 2119 |
| K | - | - | 124.32 | 108.36 | 94.87 | 82.68 | 72.30 | 70.08 | 63.41 | 54.38 | 47.01 | 40.57 |
| β | - | - | 2.68 | 3.08 | 3.51 | 4.03 | 4.61 | 4.76 | 5.26 | 6.13 | 7.09 | 8.22 |
| EV | - | - | 45.76 | 59.05 | 69.08 | 76.41 | 81.74 | 82.74 | 85.18 | 86.18 | 85.55 | 83.55 |
| ER | - | - | 25.21 | 46.28 | 60.36 | 69.99 | 76.77 | 78.07 | 81.27 | 83.04 | 83.05 | 81.64 |
| EVRH | - | - | 35.58 | 52.71 | 64.74 | 73.22 | 79.26 | 80.42 | 83.23 | 84.62 | 84.30 | 82.60 |
| μV | - | - | 15.90 | 20.95 | 25.05 | 28.39 | 31.16 | 31.75 | 33.38 | 34.87 | 35.74 | 36.12 |
| μR | - | - | 8.60 | 16.20 | 21.65 | 25.75 | 29.01 | 29.70 | 31.59 | 33.34 | 34.45 | 35.05 |
| μVRH | - | - | 12.25 | 18.57 | 23.35 | 28.07 | 30.09 | 30.72 | 32.48 | 34.10 | 35.09 | 35.58 |
| υV | - | - | 0.439 | 0.409 | 0.379 | 0.346 | 0.312 | 0.303 | 0.276 | 0.236 | 0.197 | 0.157 |
| υR | - | - | 0.466 | 0.429 | 0.394 | 0.359 | 0.323 | 0.314 | 0.286 | 0.245 | 0.206 | 0.165 |
| υVRH | - | - | 0.452 | 0.419 | 0.386 | 0.352 | 0.317 | 0.309 | 0.281 | 0.241 | 0.201 | 0.161 |
| vS | - | - | 2.125 | 2.660 | 3.030 | 3.313 | 3.547 | 3.598 | 3.743 | 3.894 | 4.010 | 4.098 |
| vP | - | - | 7.202 | 7.120 | 7.038 | 6.940 | 6.857 | 6.841 | 6.784 | 6.663 | 6.555 | 6.445 |
Note: the bulk modulus values are the same between the three polycrystalline averaging schemes (KV = KR = KVRH). The elastic properties were not calculated for the mechanically unstable sodalite models (marked with an asterisk).
Publisher’s Note: MDPI stays neutral with regard to jurisdictional claims in published maps and institutional affiliations. |
© 2022 by the authors. Licensee MDPI, Basel, Switzerland. This article is an open access article distributed under the terms and conditions of the Creative Commons Attribution (CC BY) license (https://creativecommons.org/licenses/by/4.0/).
Share and Cite
MDPI and ACS Style
Ulian, G.; Valdrè, G. Structural and Elastic Behaviour of Sodalite Na8(Al6Si6O24)Cl2 at High-Pressure by First-Principle Simulations. Minerals 2022, 12, 1323. https://doi.org/10.3390/min12101323
AMA Style
Ulian G, Valdrè G. Structural and Elastic Behaviour of Sodalite Na8(Al6Si6O24)Cl2 at High-Pressure by First-Principle Simulations. Minerals. 2022; 12(10):1323. https://doi.org/10.3390/min12101323
Chicago/Turabian StyleUlian, Gianfranco, and Giovanni Valdrè. 2022. "Structural and Elastic Behaviour of Sodalite Na8(Al6Si6O24)Cl2 at High-Pressure by First-Principle Simulations" Minerals 12, no. 10: 1323. https://doi.org/10.3390/min12101323
Note that from the first issue of 2016, this journal uses article numbers instead of page numbers. See further details here.