
Mineralogy and Geochemistry of the Upper Ordovician and Lower Silurian Wufeng-Longmaxi Shale on the Yangtze Platform, South China: Implications for Provenance Analysis and Shale Gas Sweet-Spot Interval

Abstract
:1. Introduction
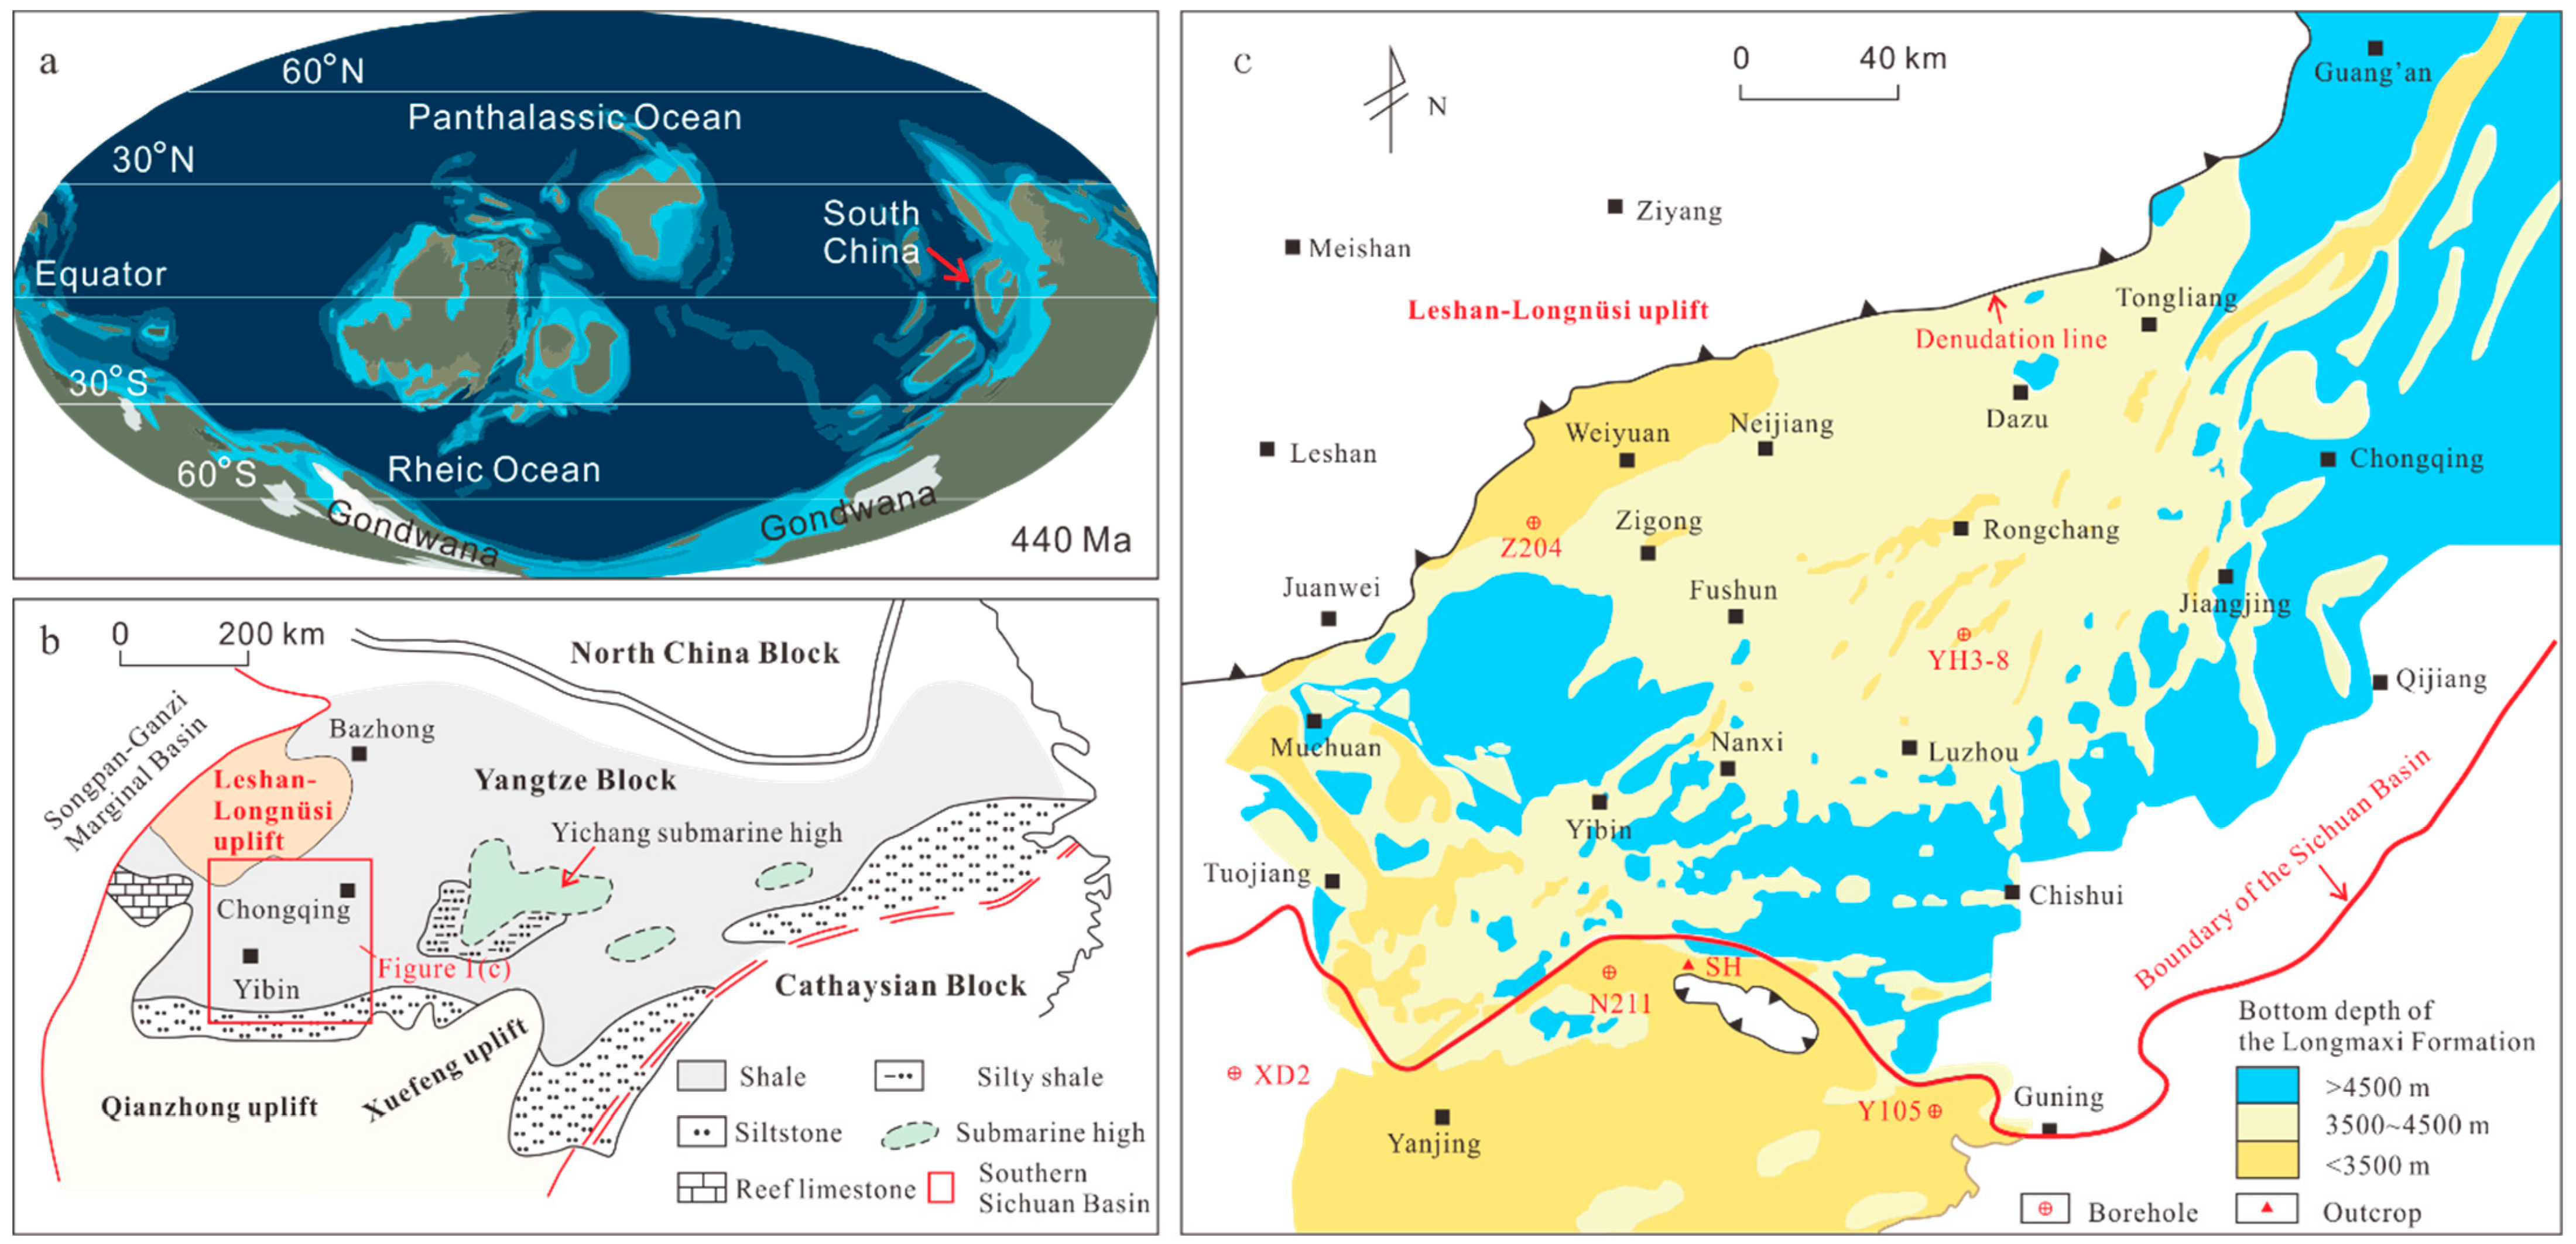
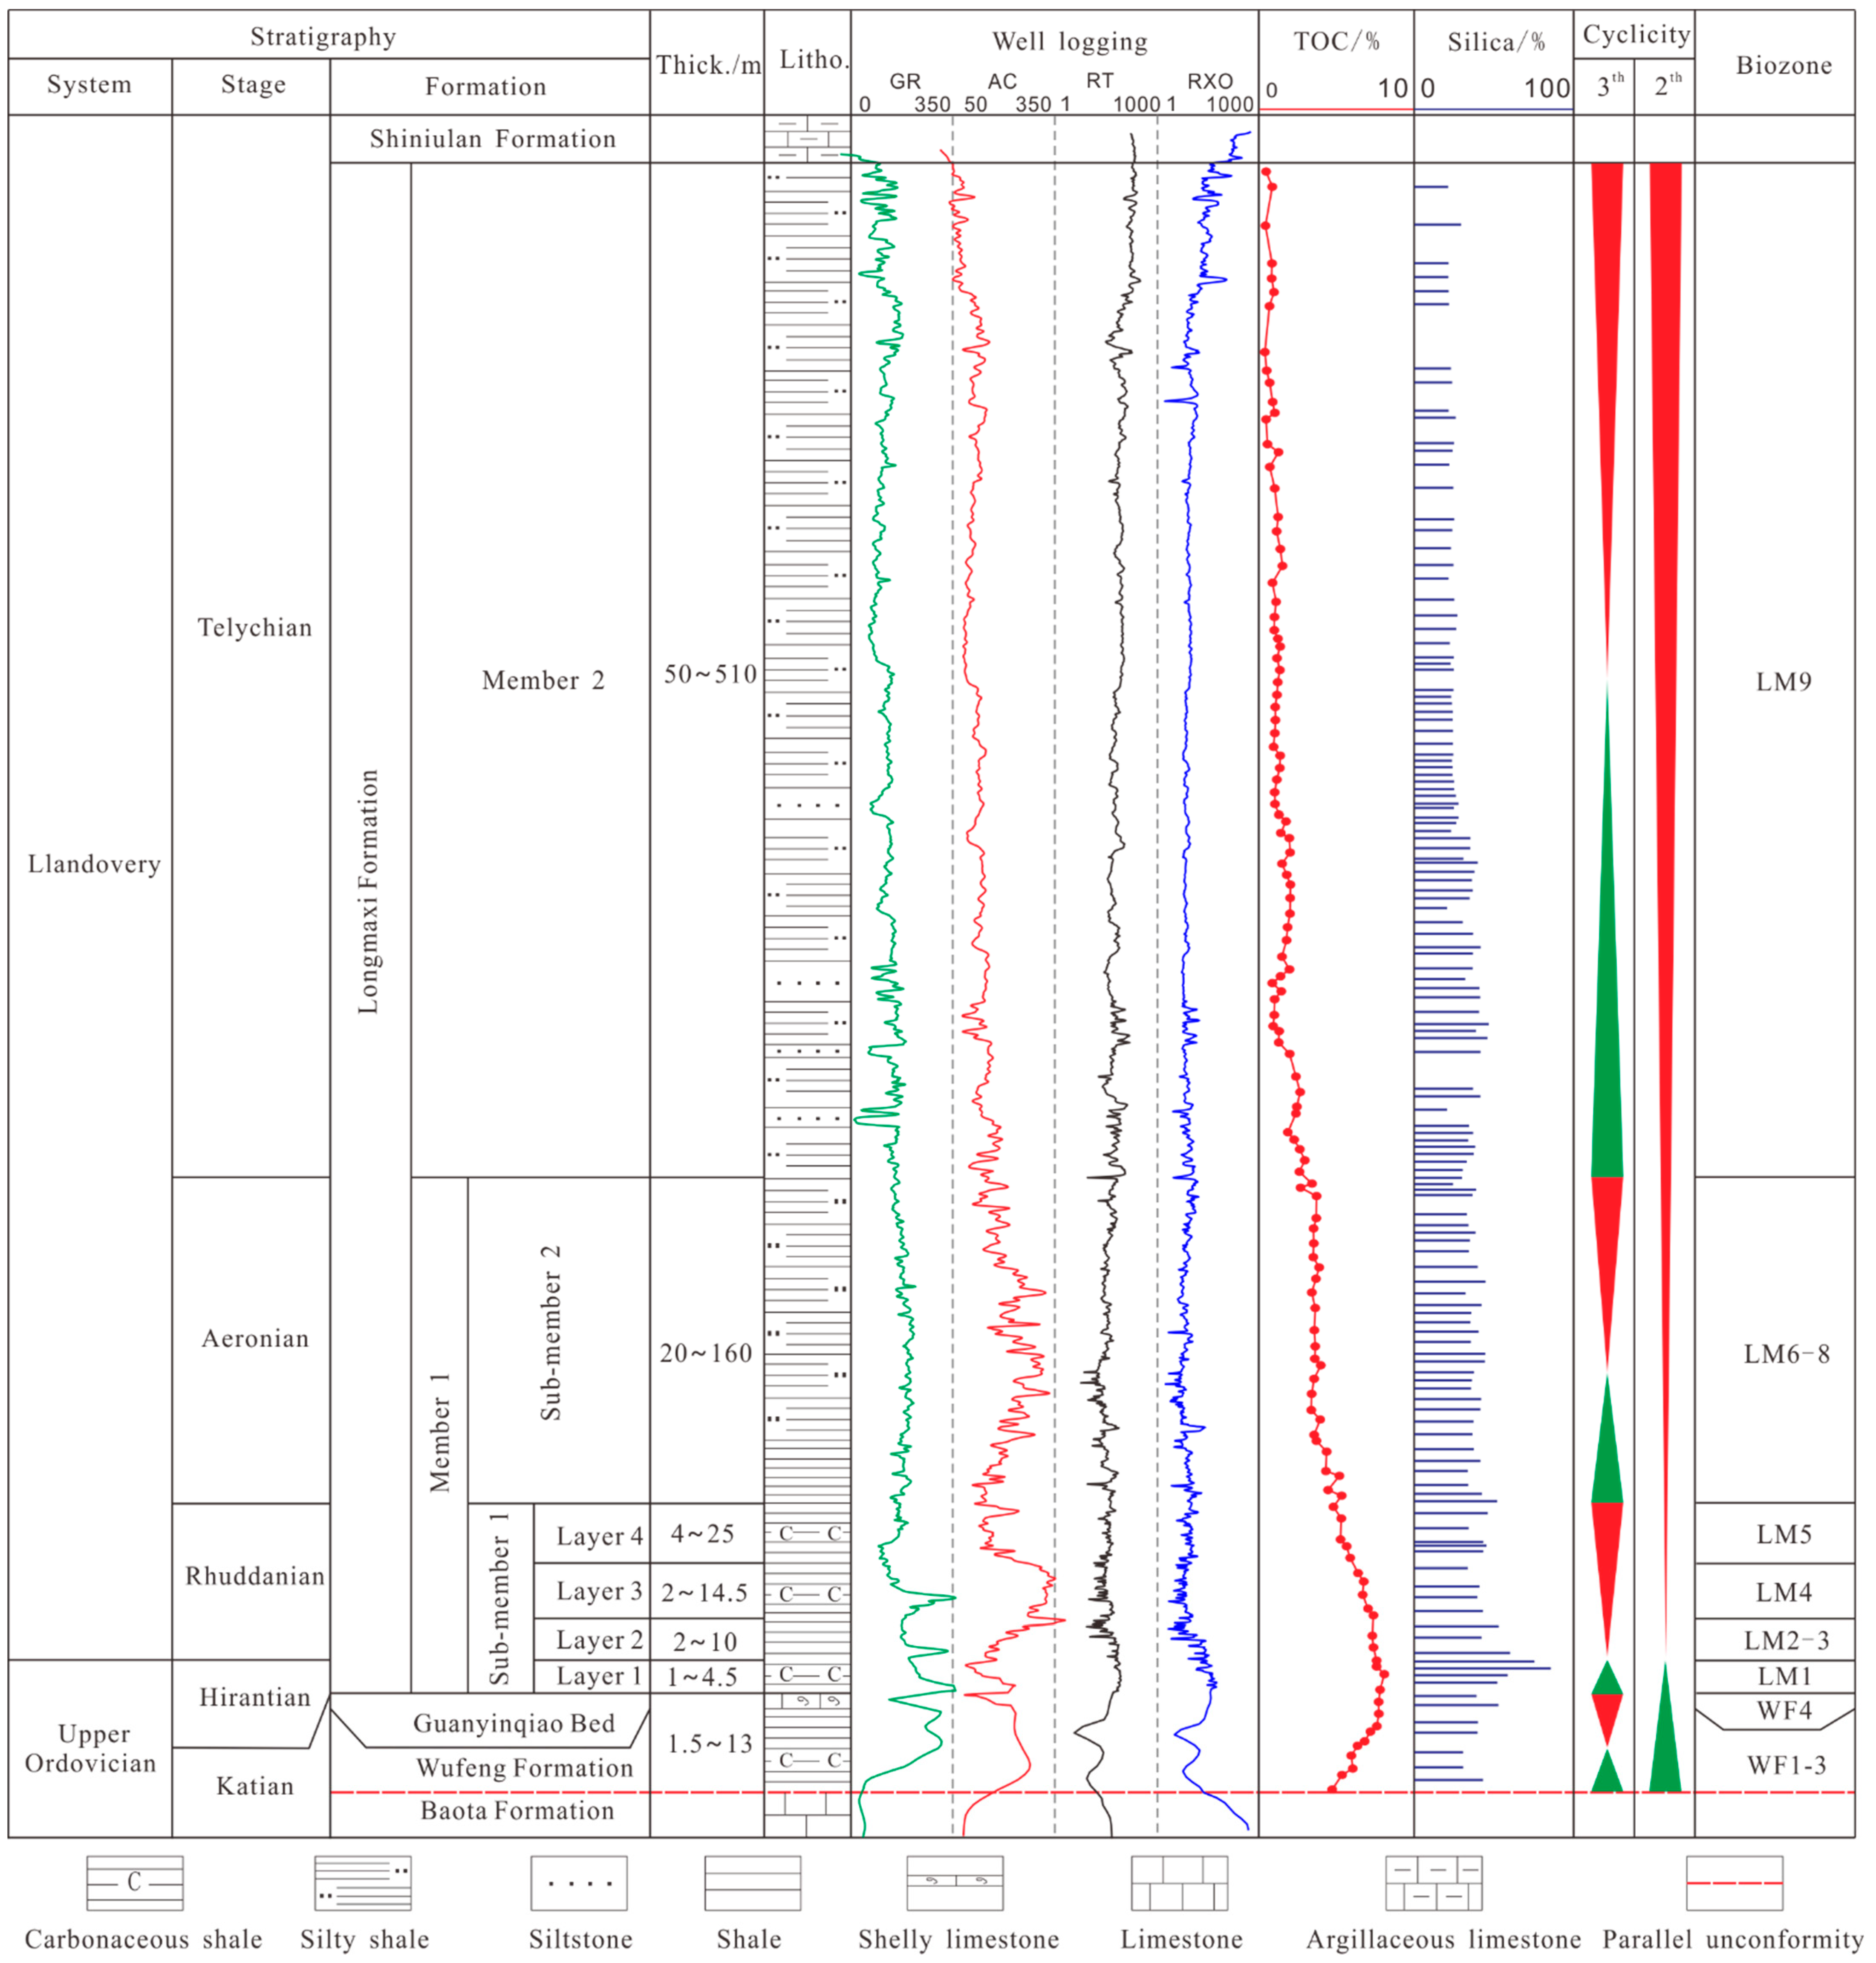
2. Geological Setting

3. Samples and Methods
3.1. Mineral Composition and Morphological Analysis
3.2. Geochemistry Analysis
3.3. Depositional Structures Analysis
4. Results
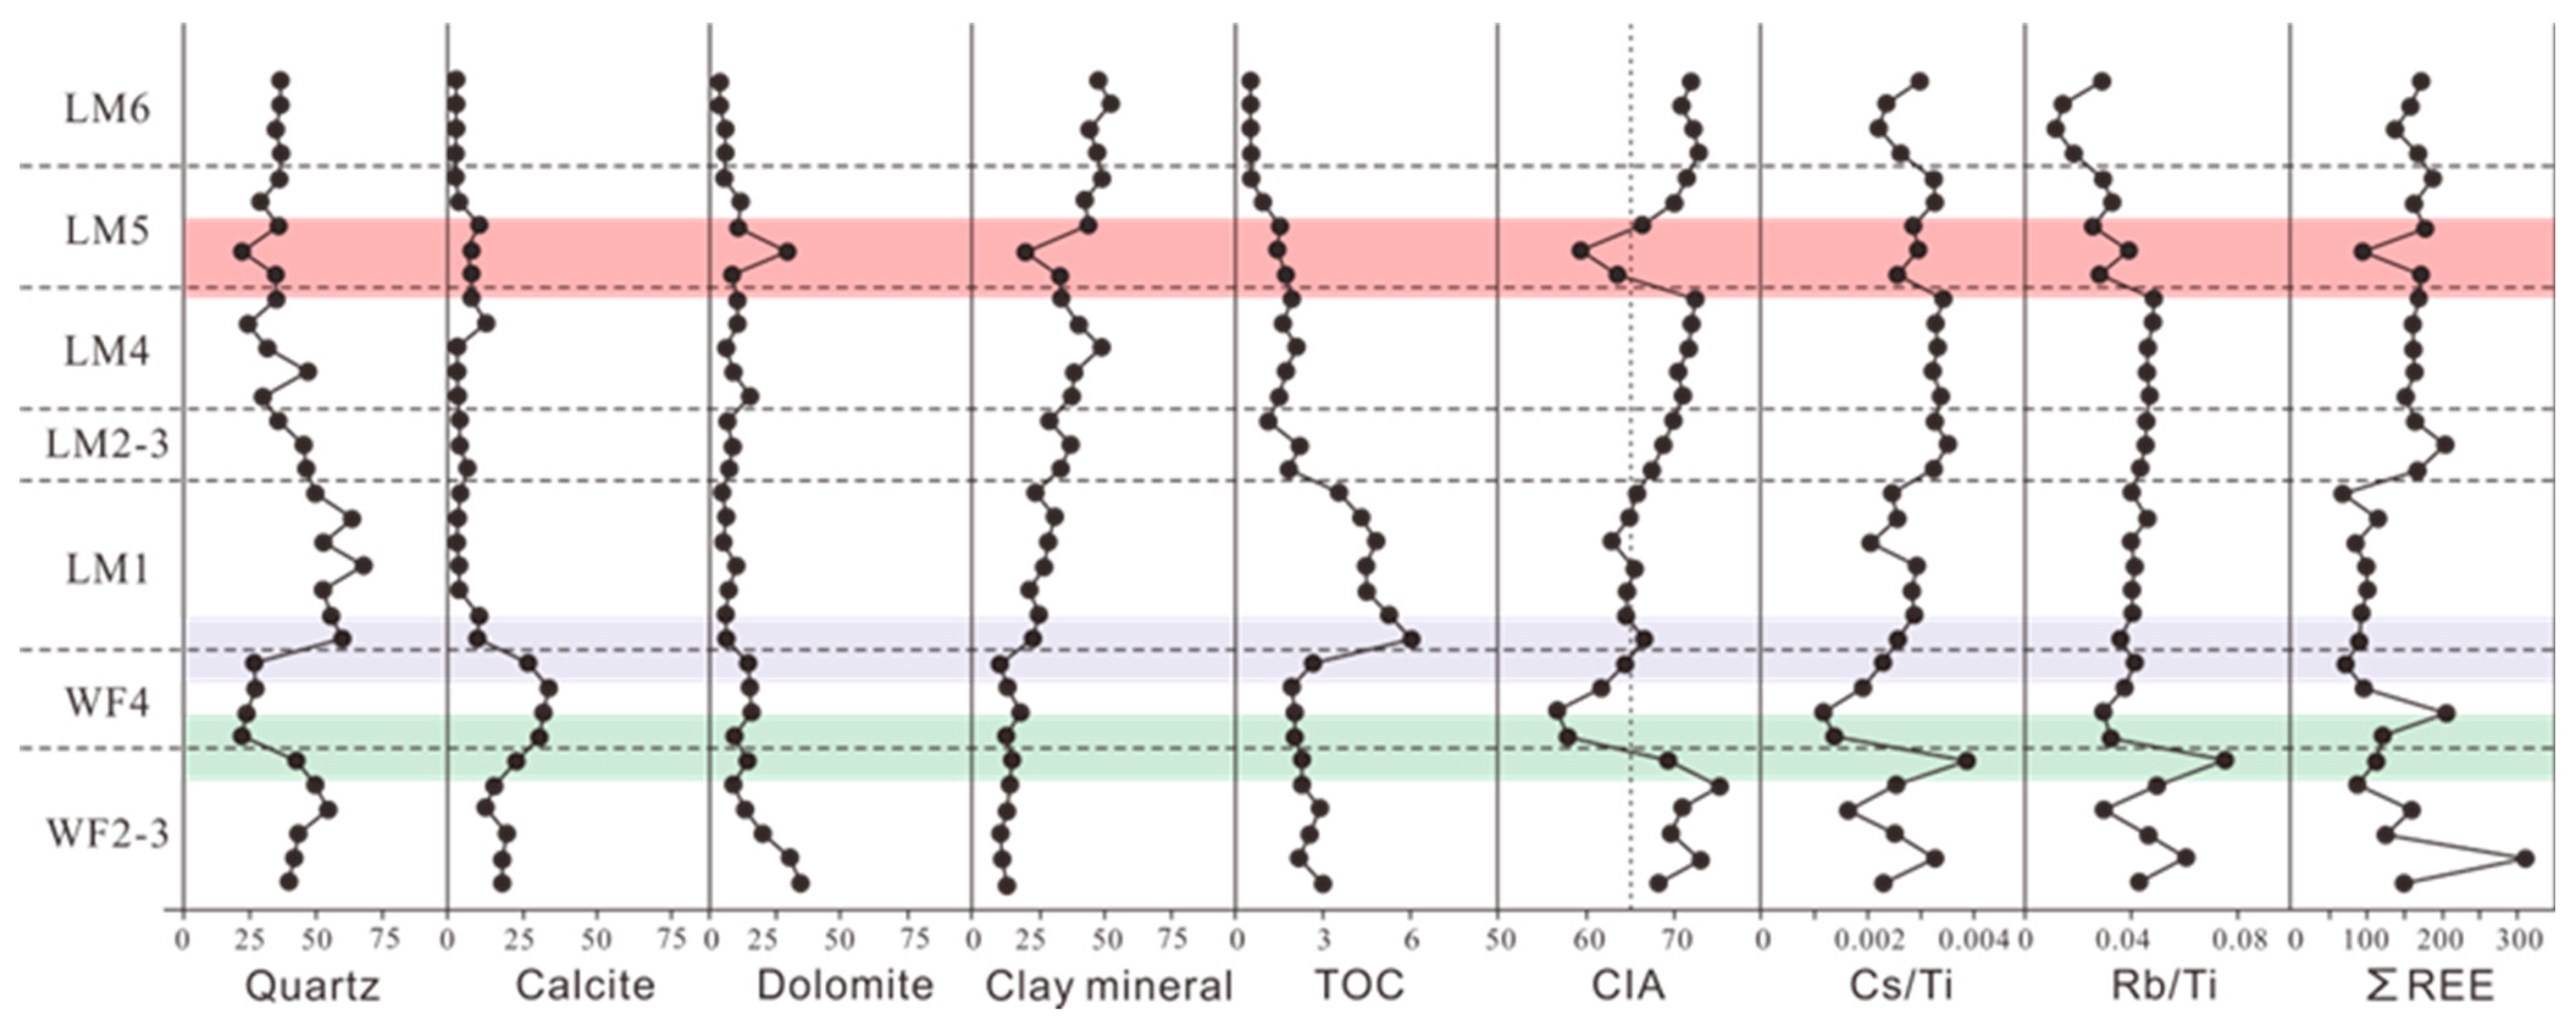
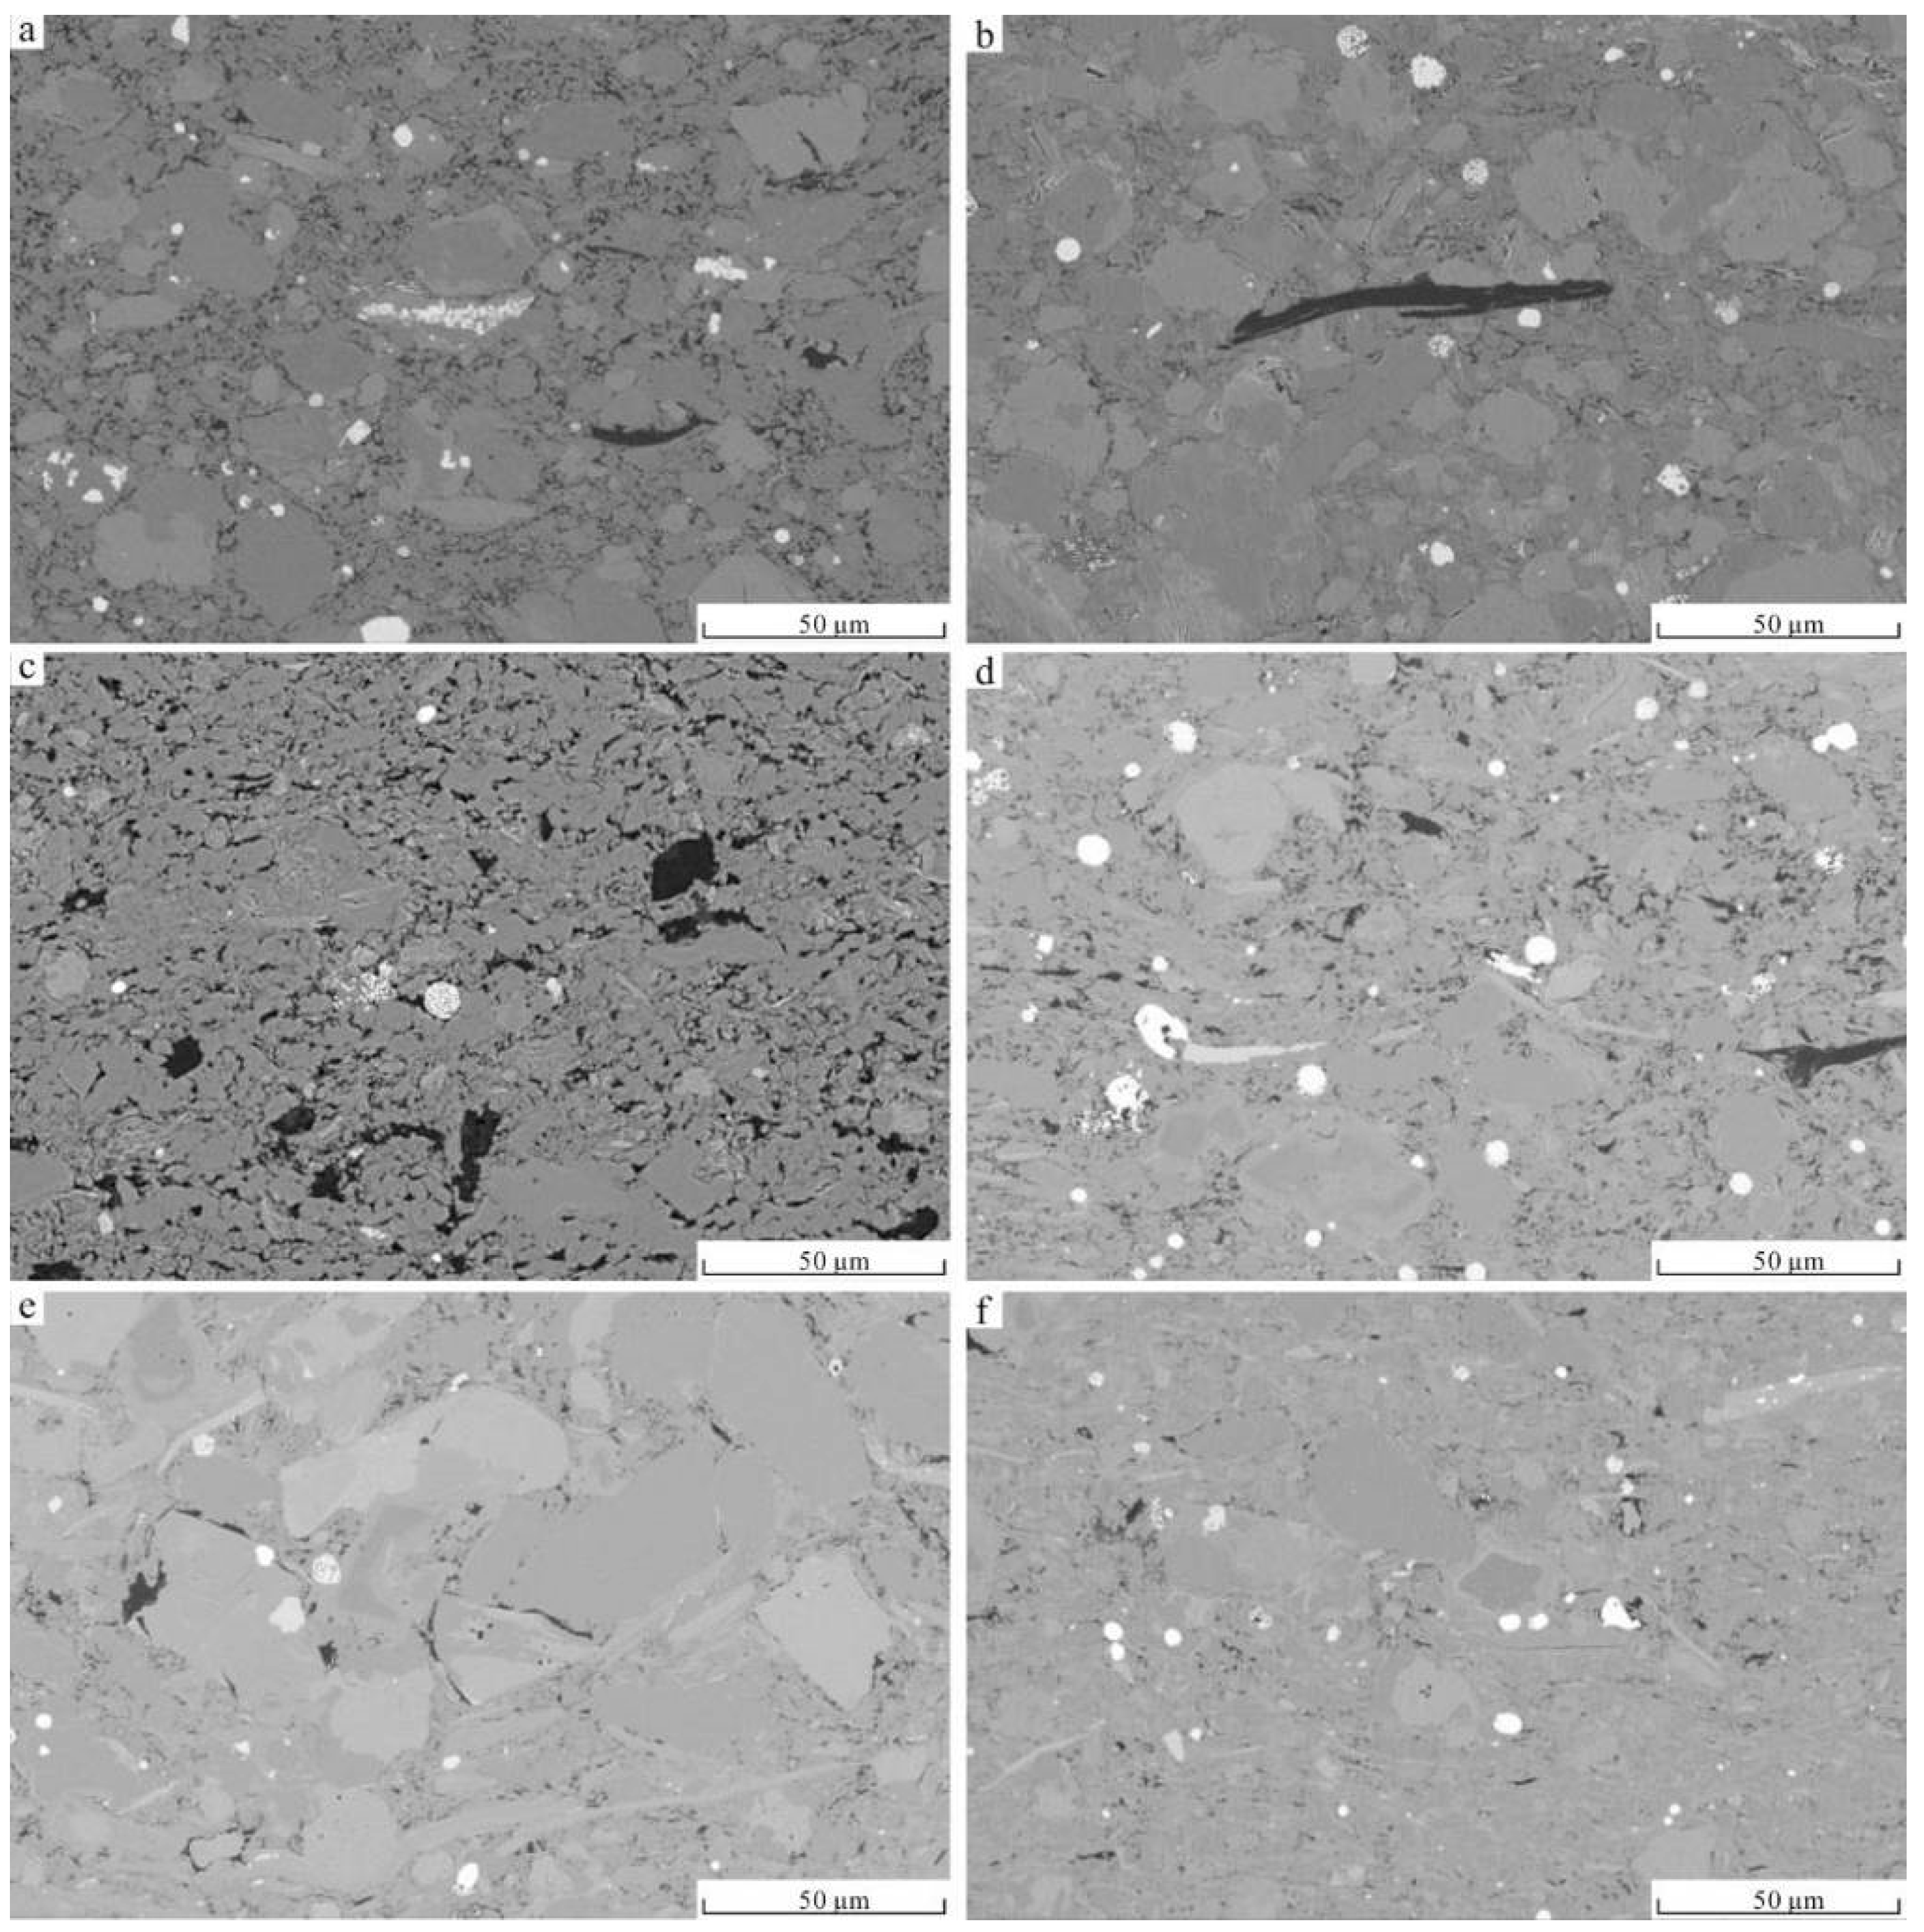
4.1. Mineral Compositions
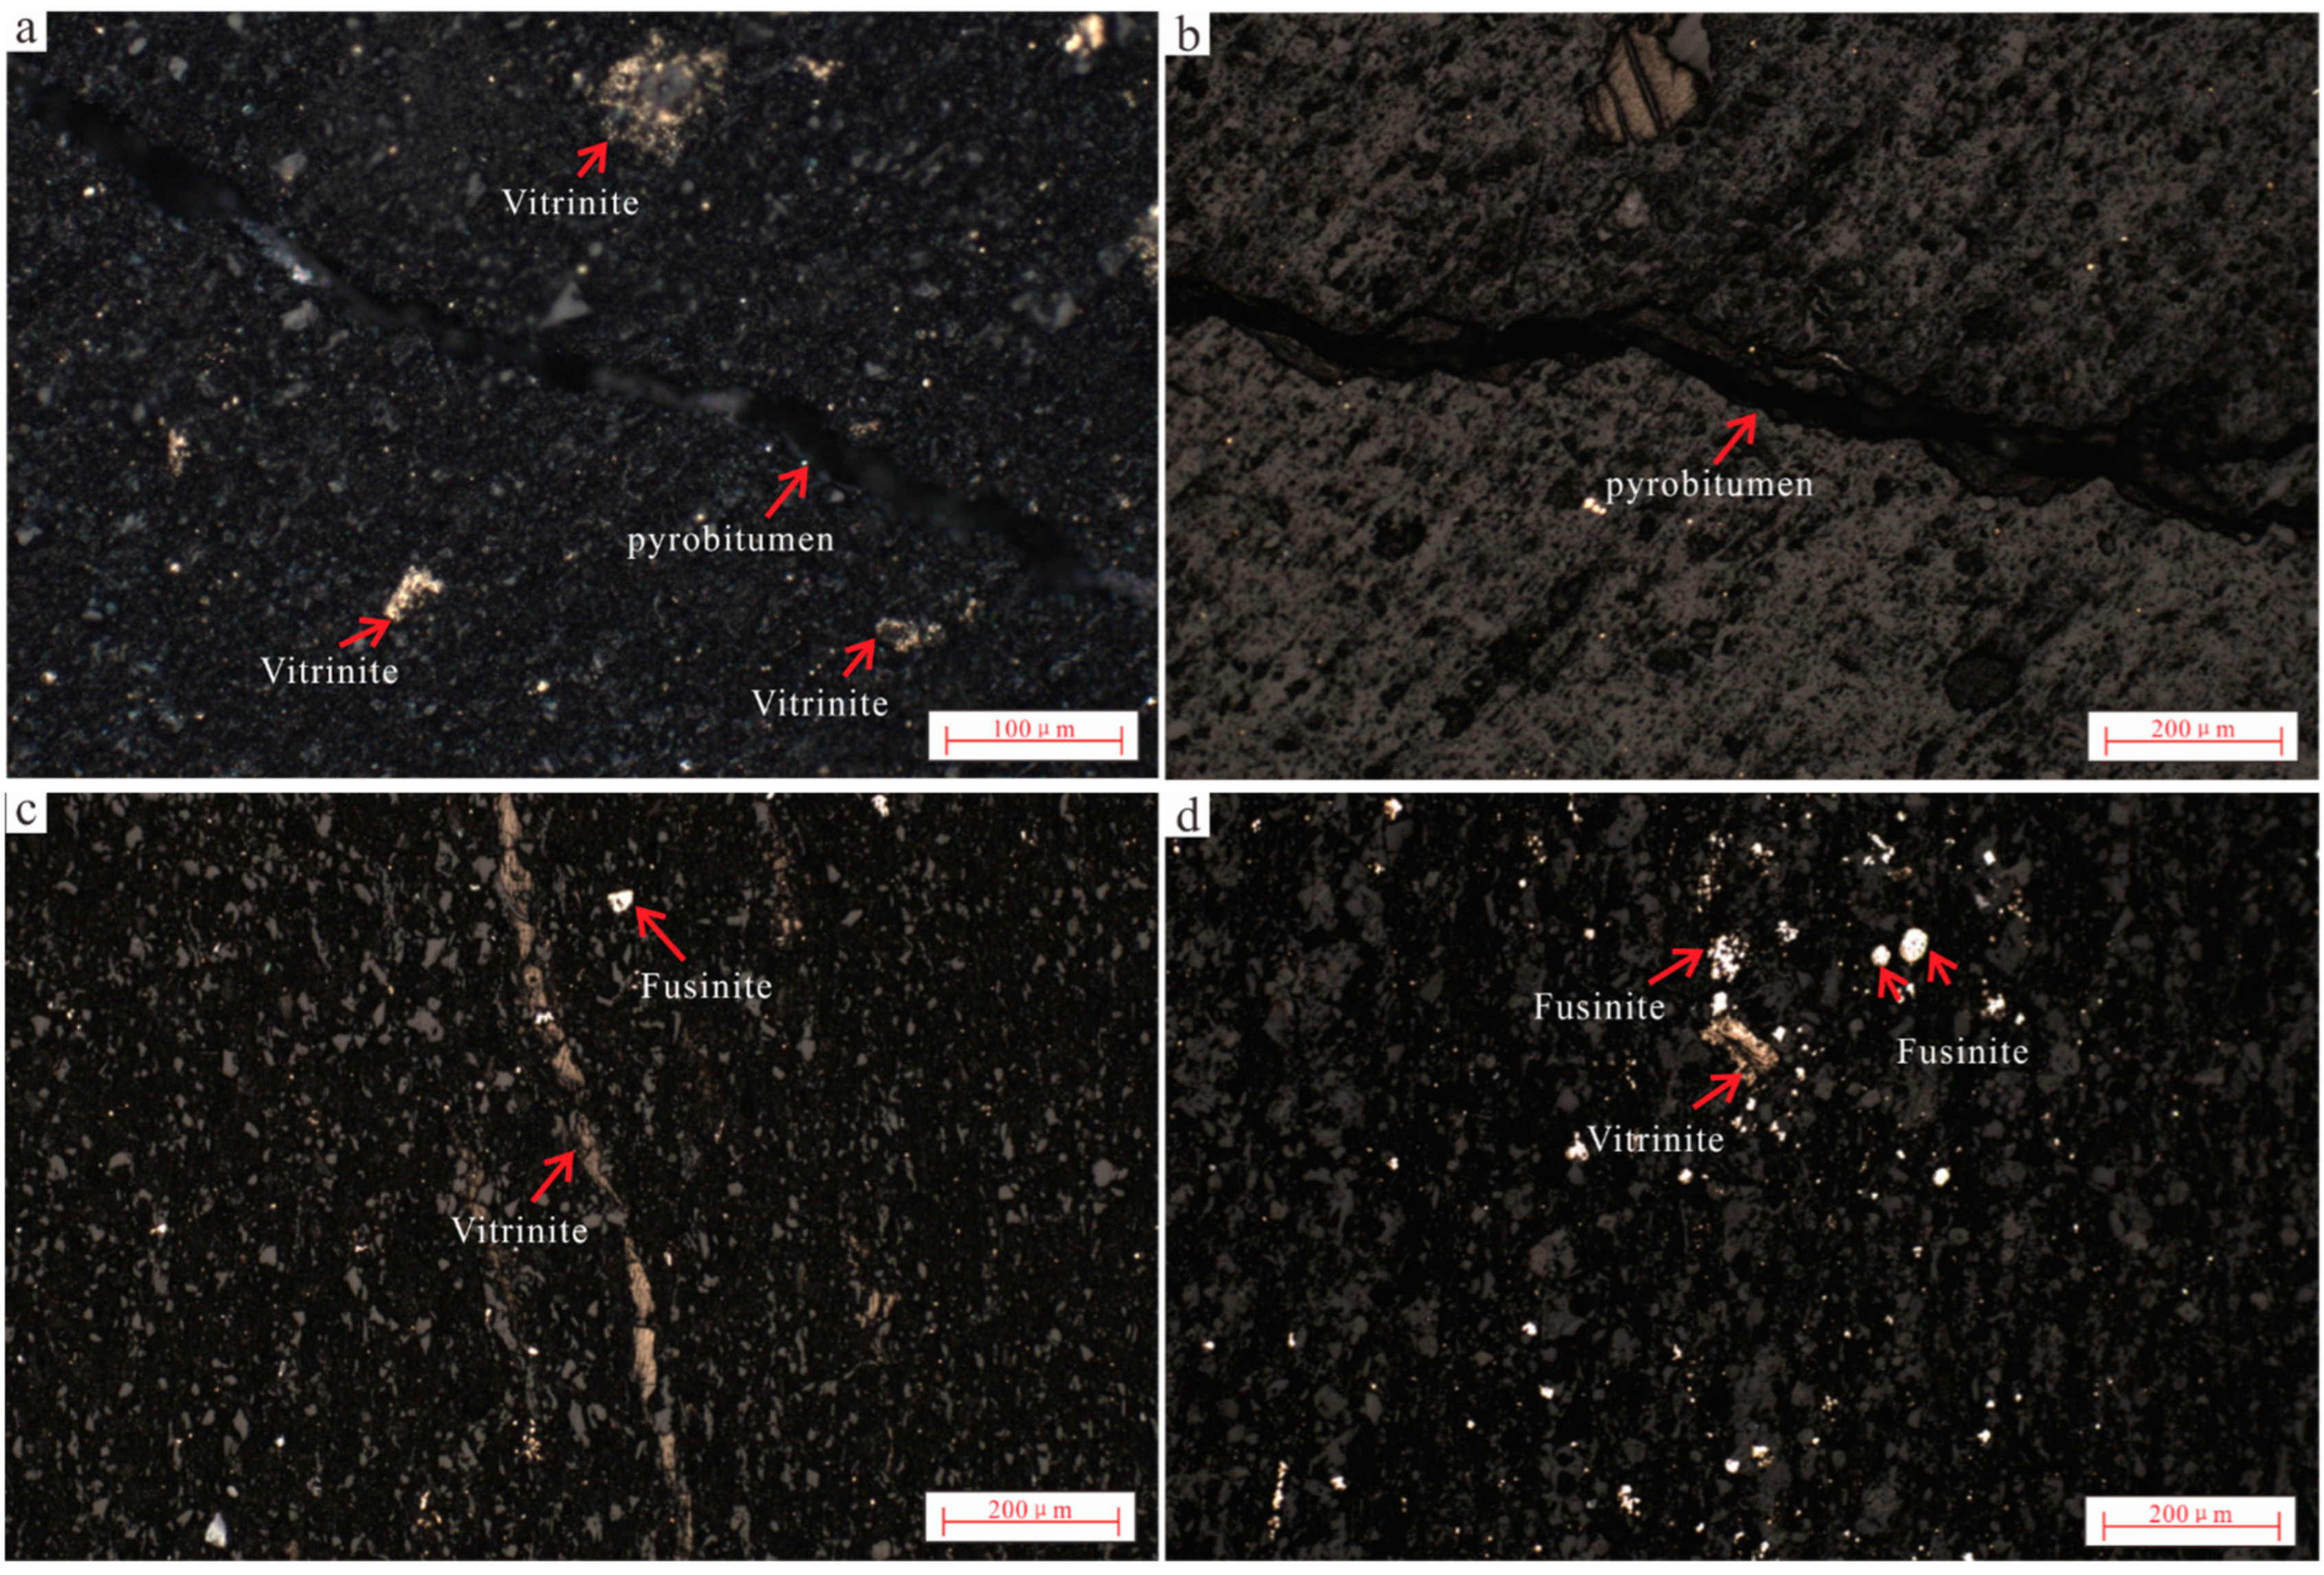
4.2. TOC Content and Dispersed Organic Matter
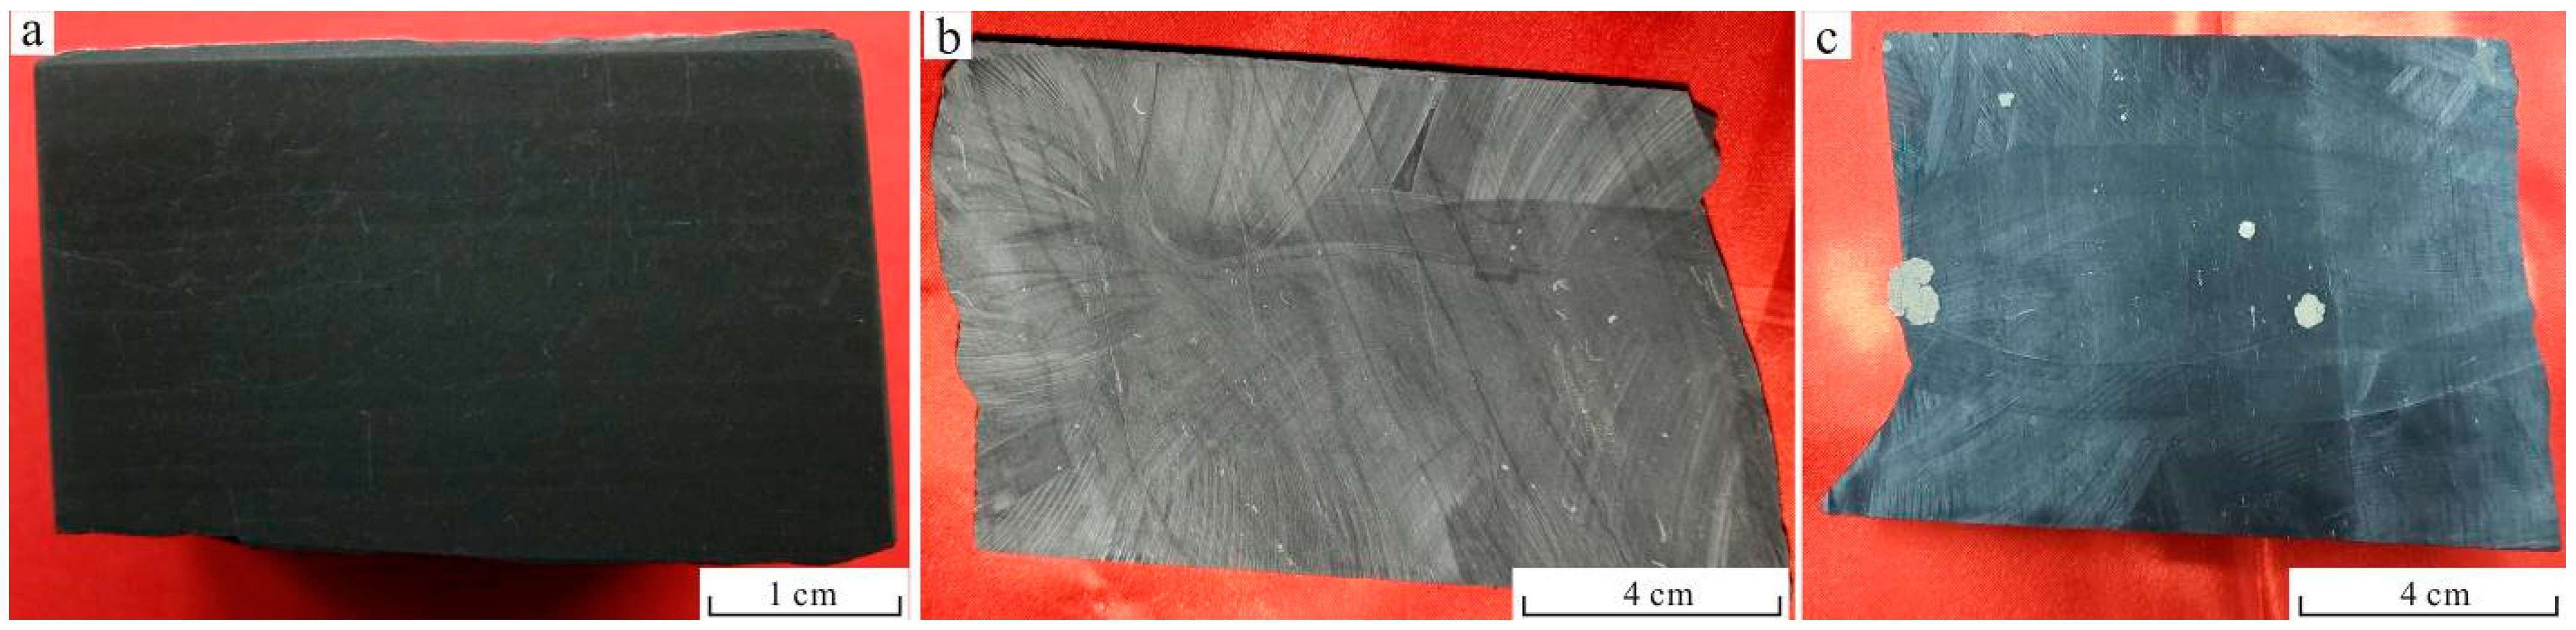
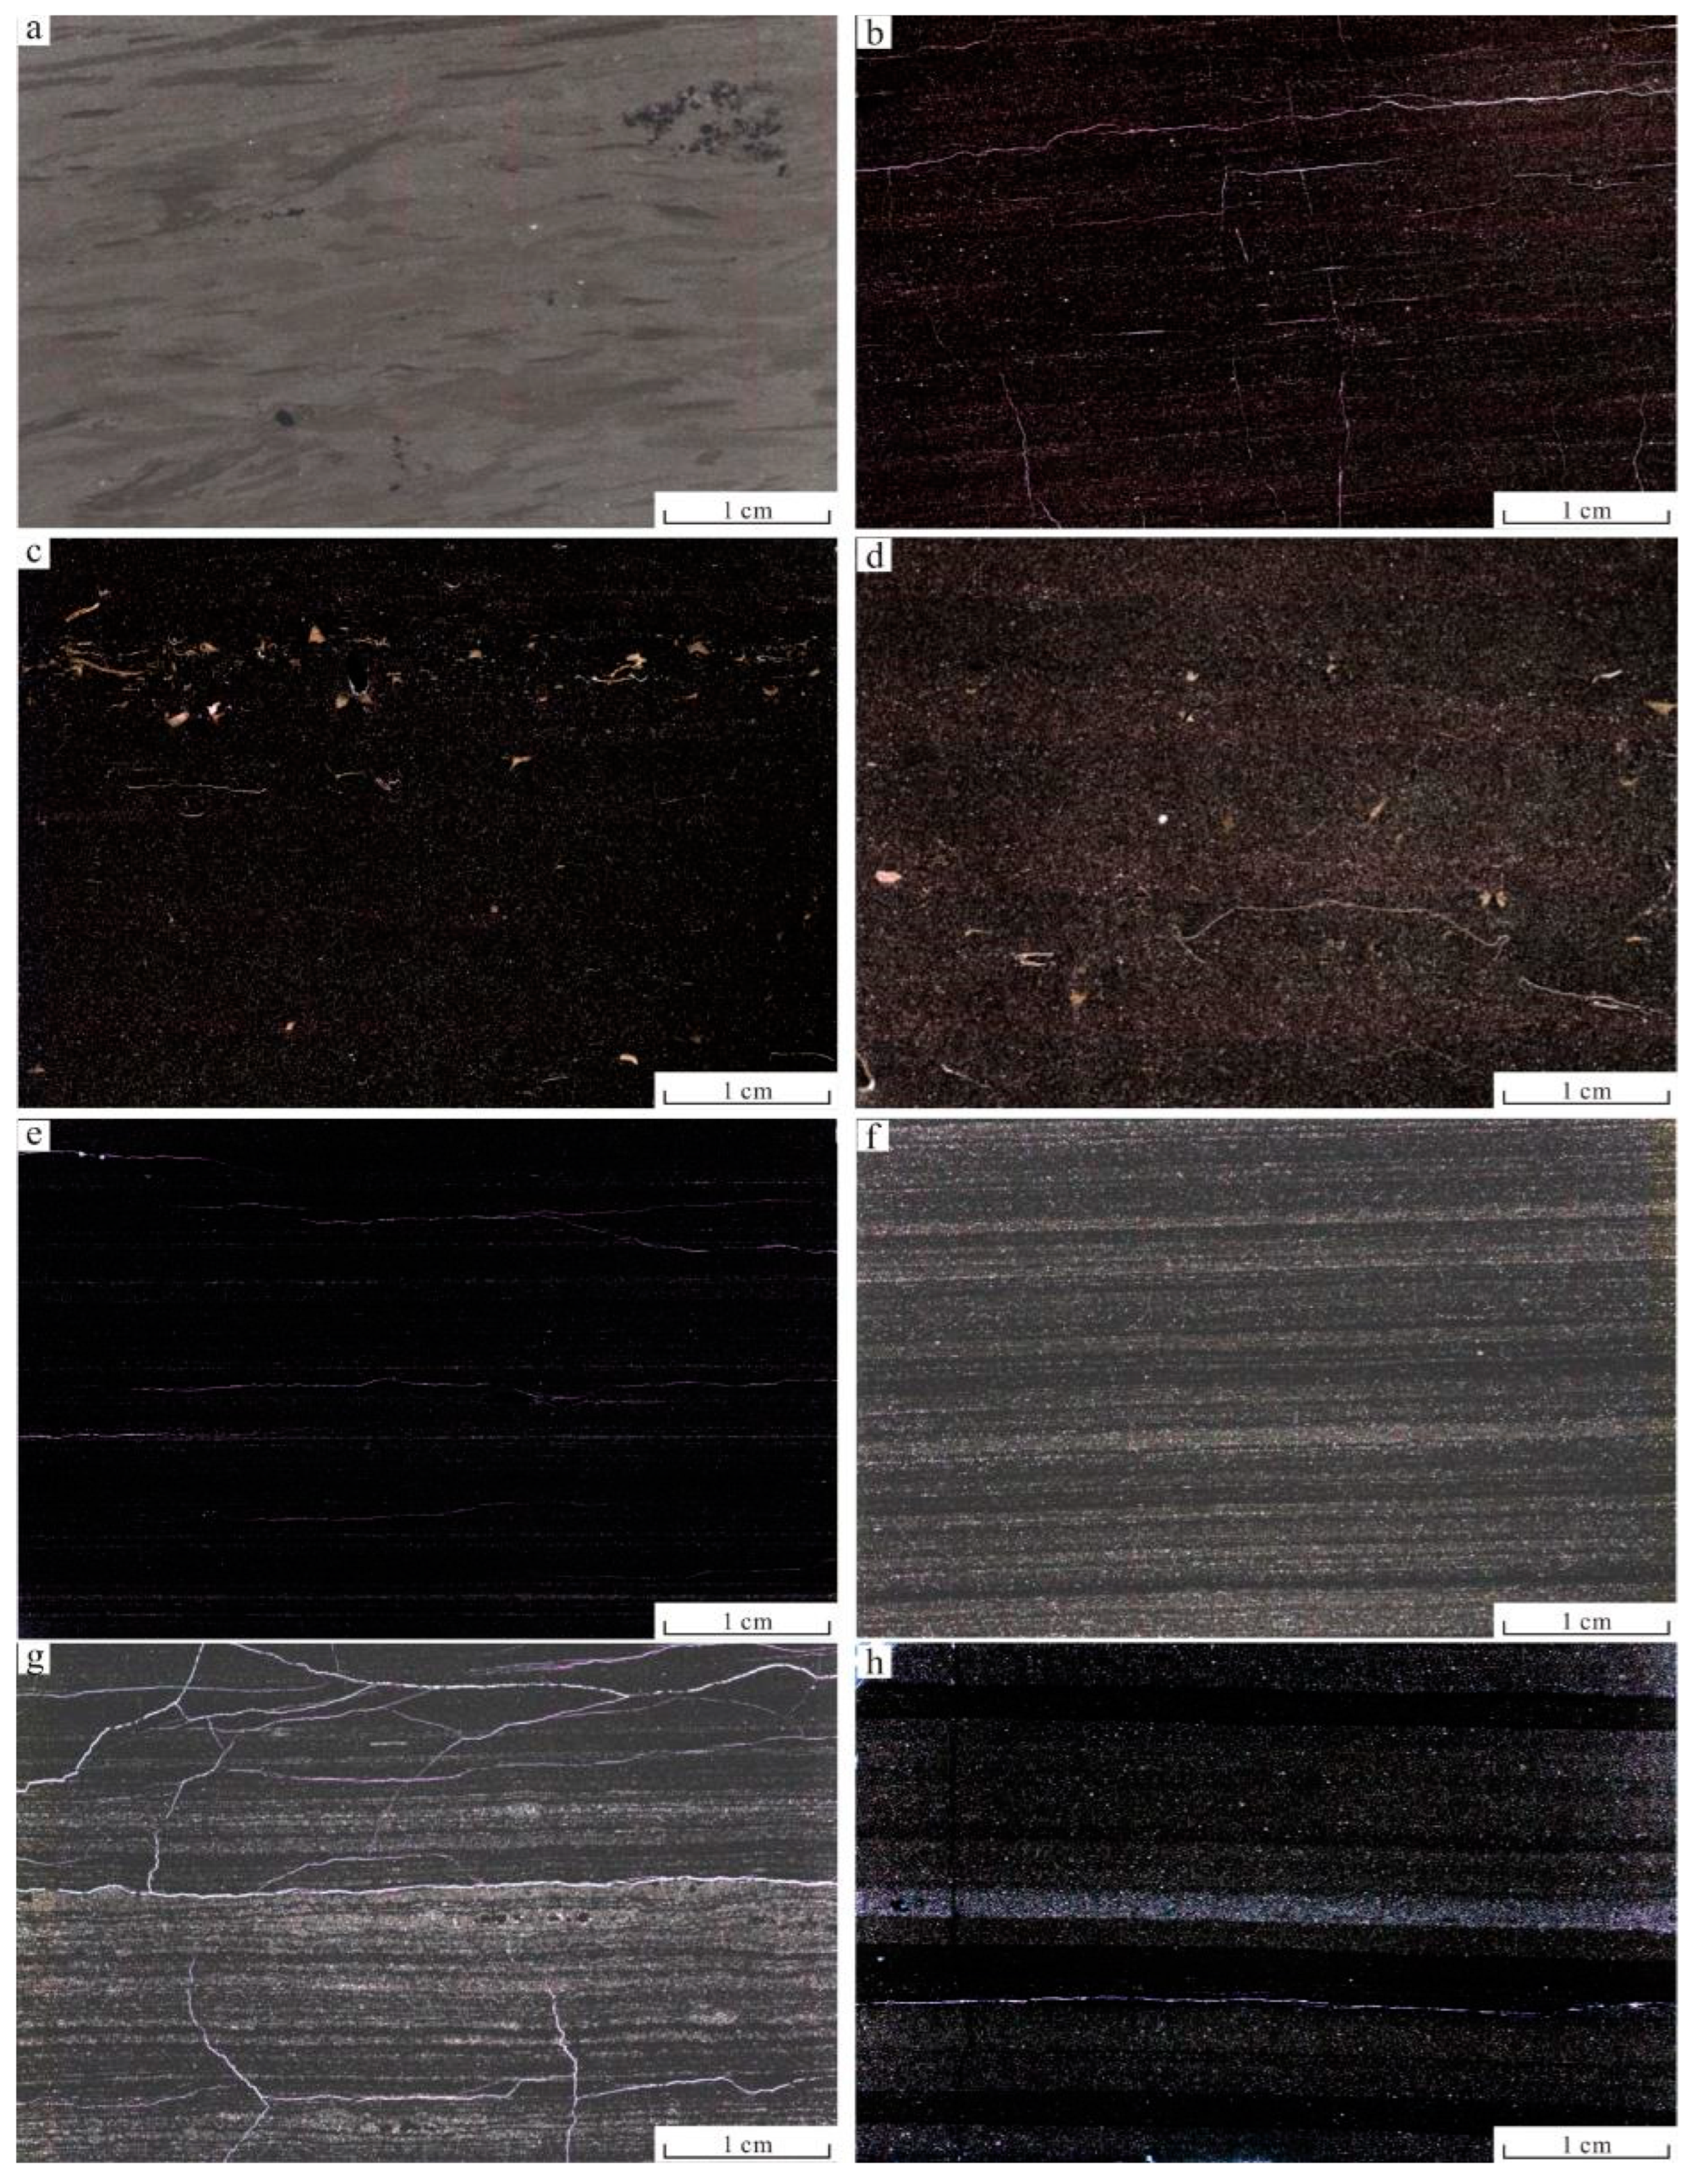
4.3. Lithology and Depositional Structures
4.4. Geochemistry
5. Discussion
5.1. Sedimentary Sorting and Recycling
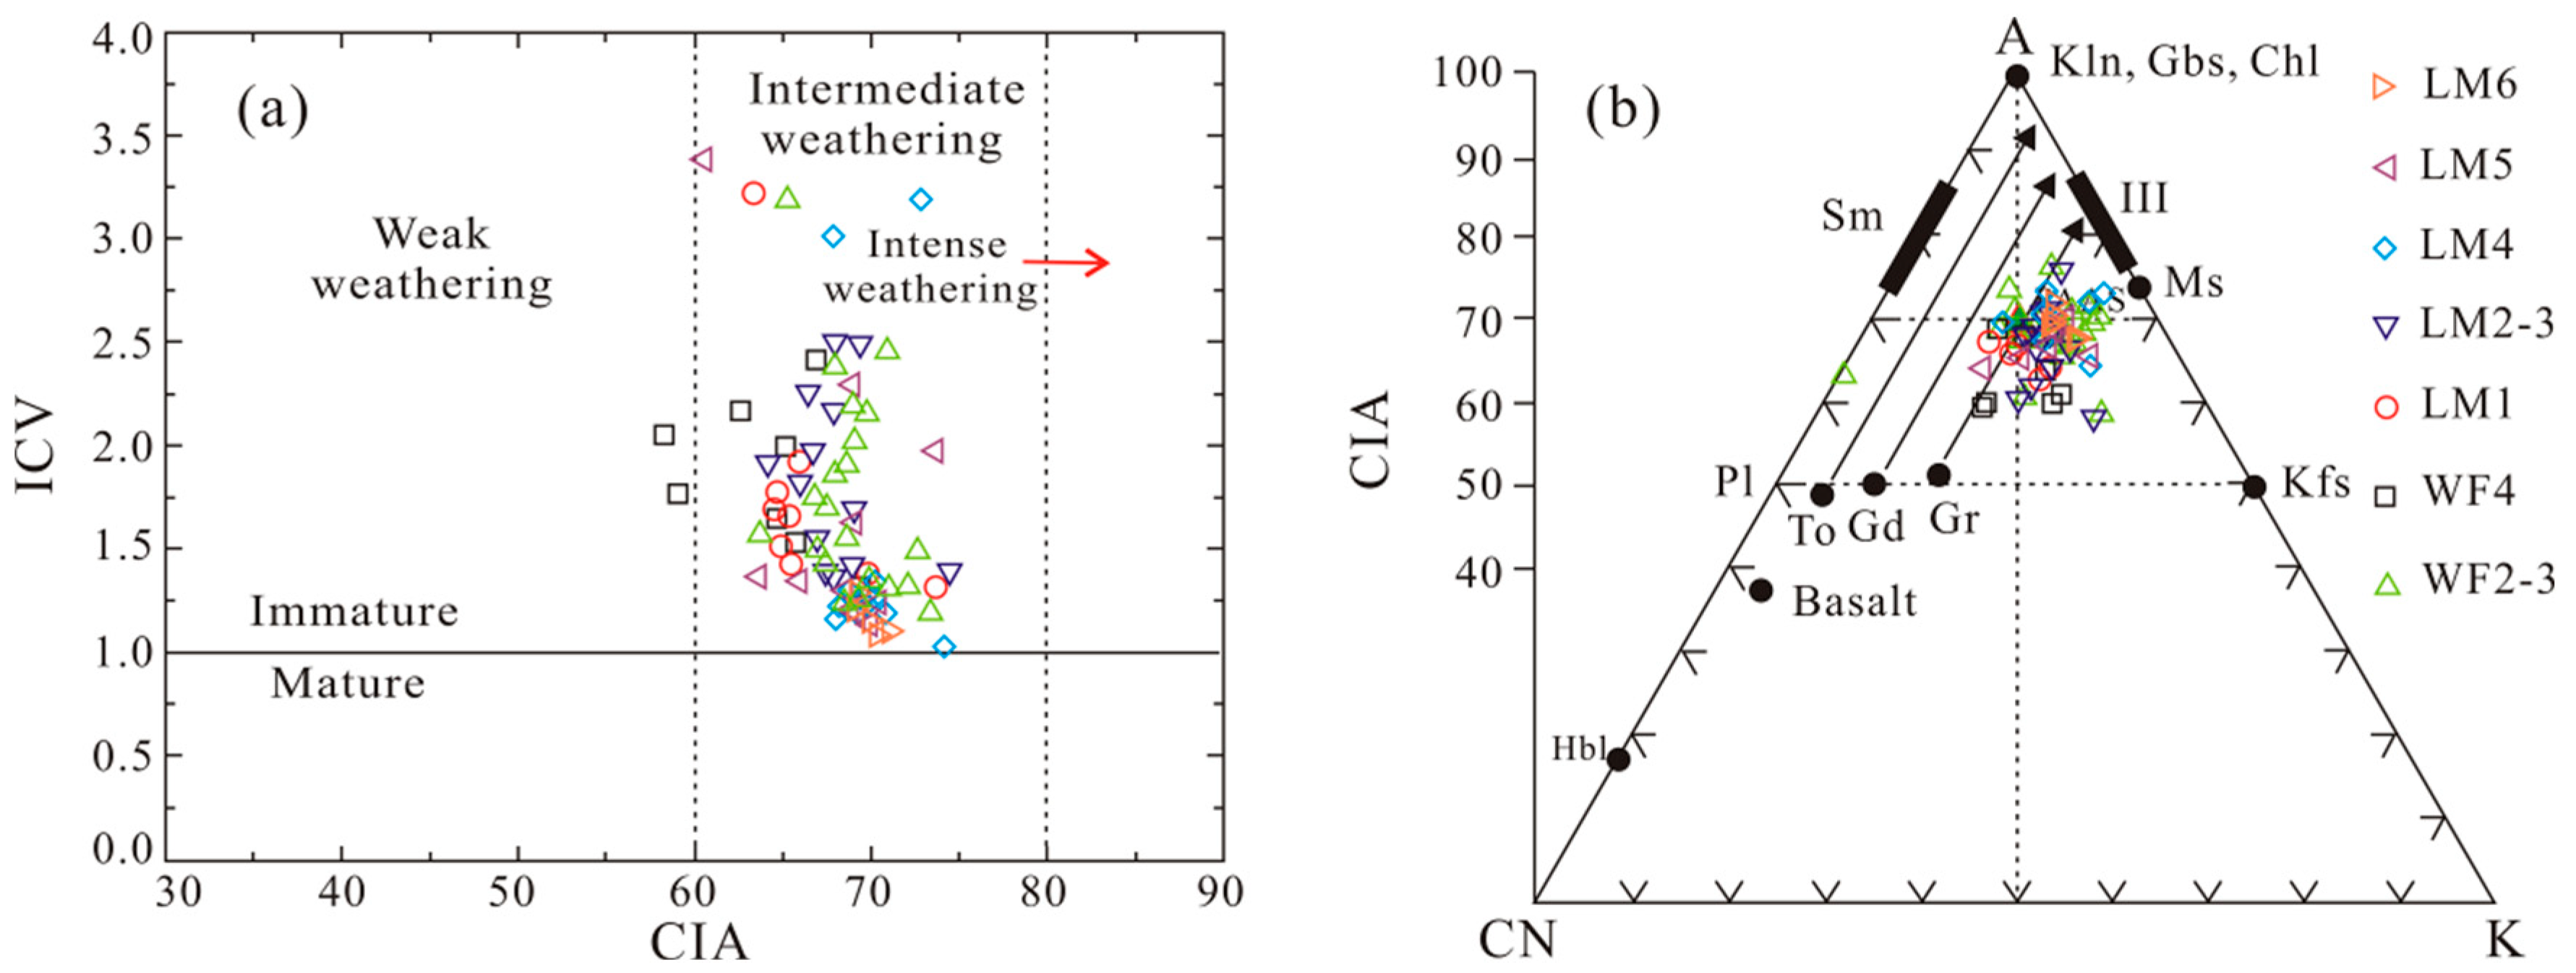
5.2. Weathering and Paleoclimate
5.3. Protoliths
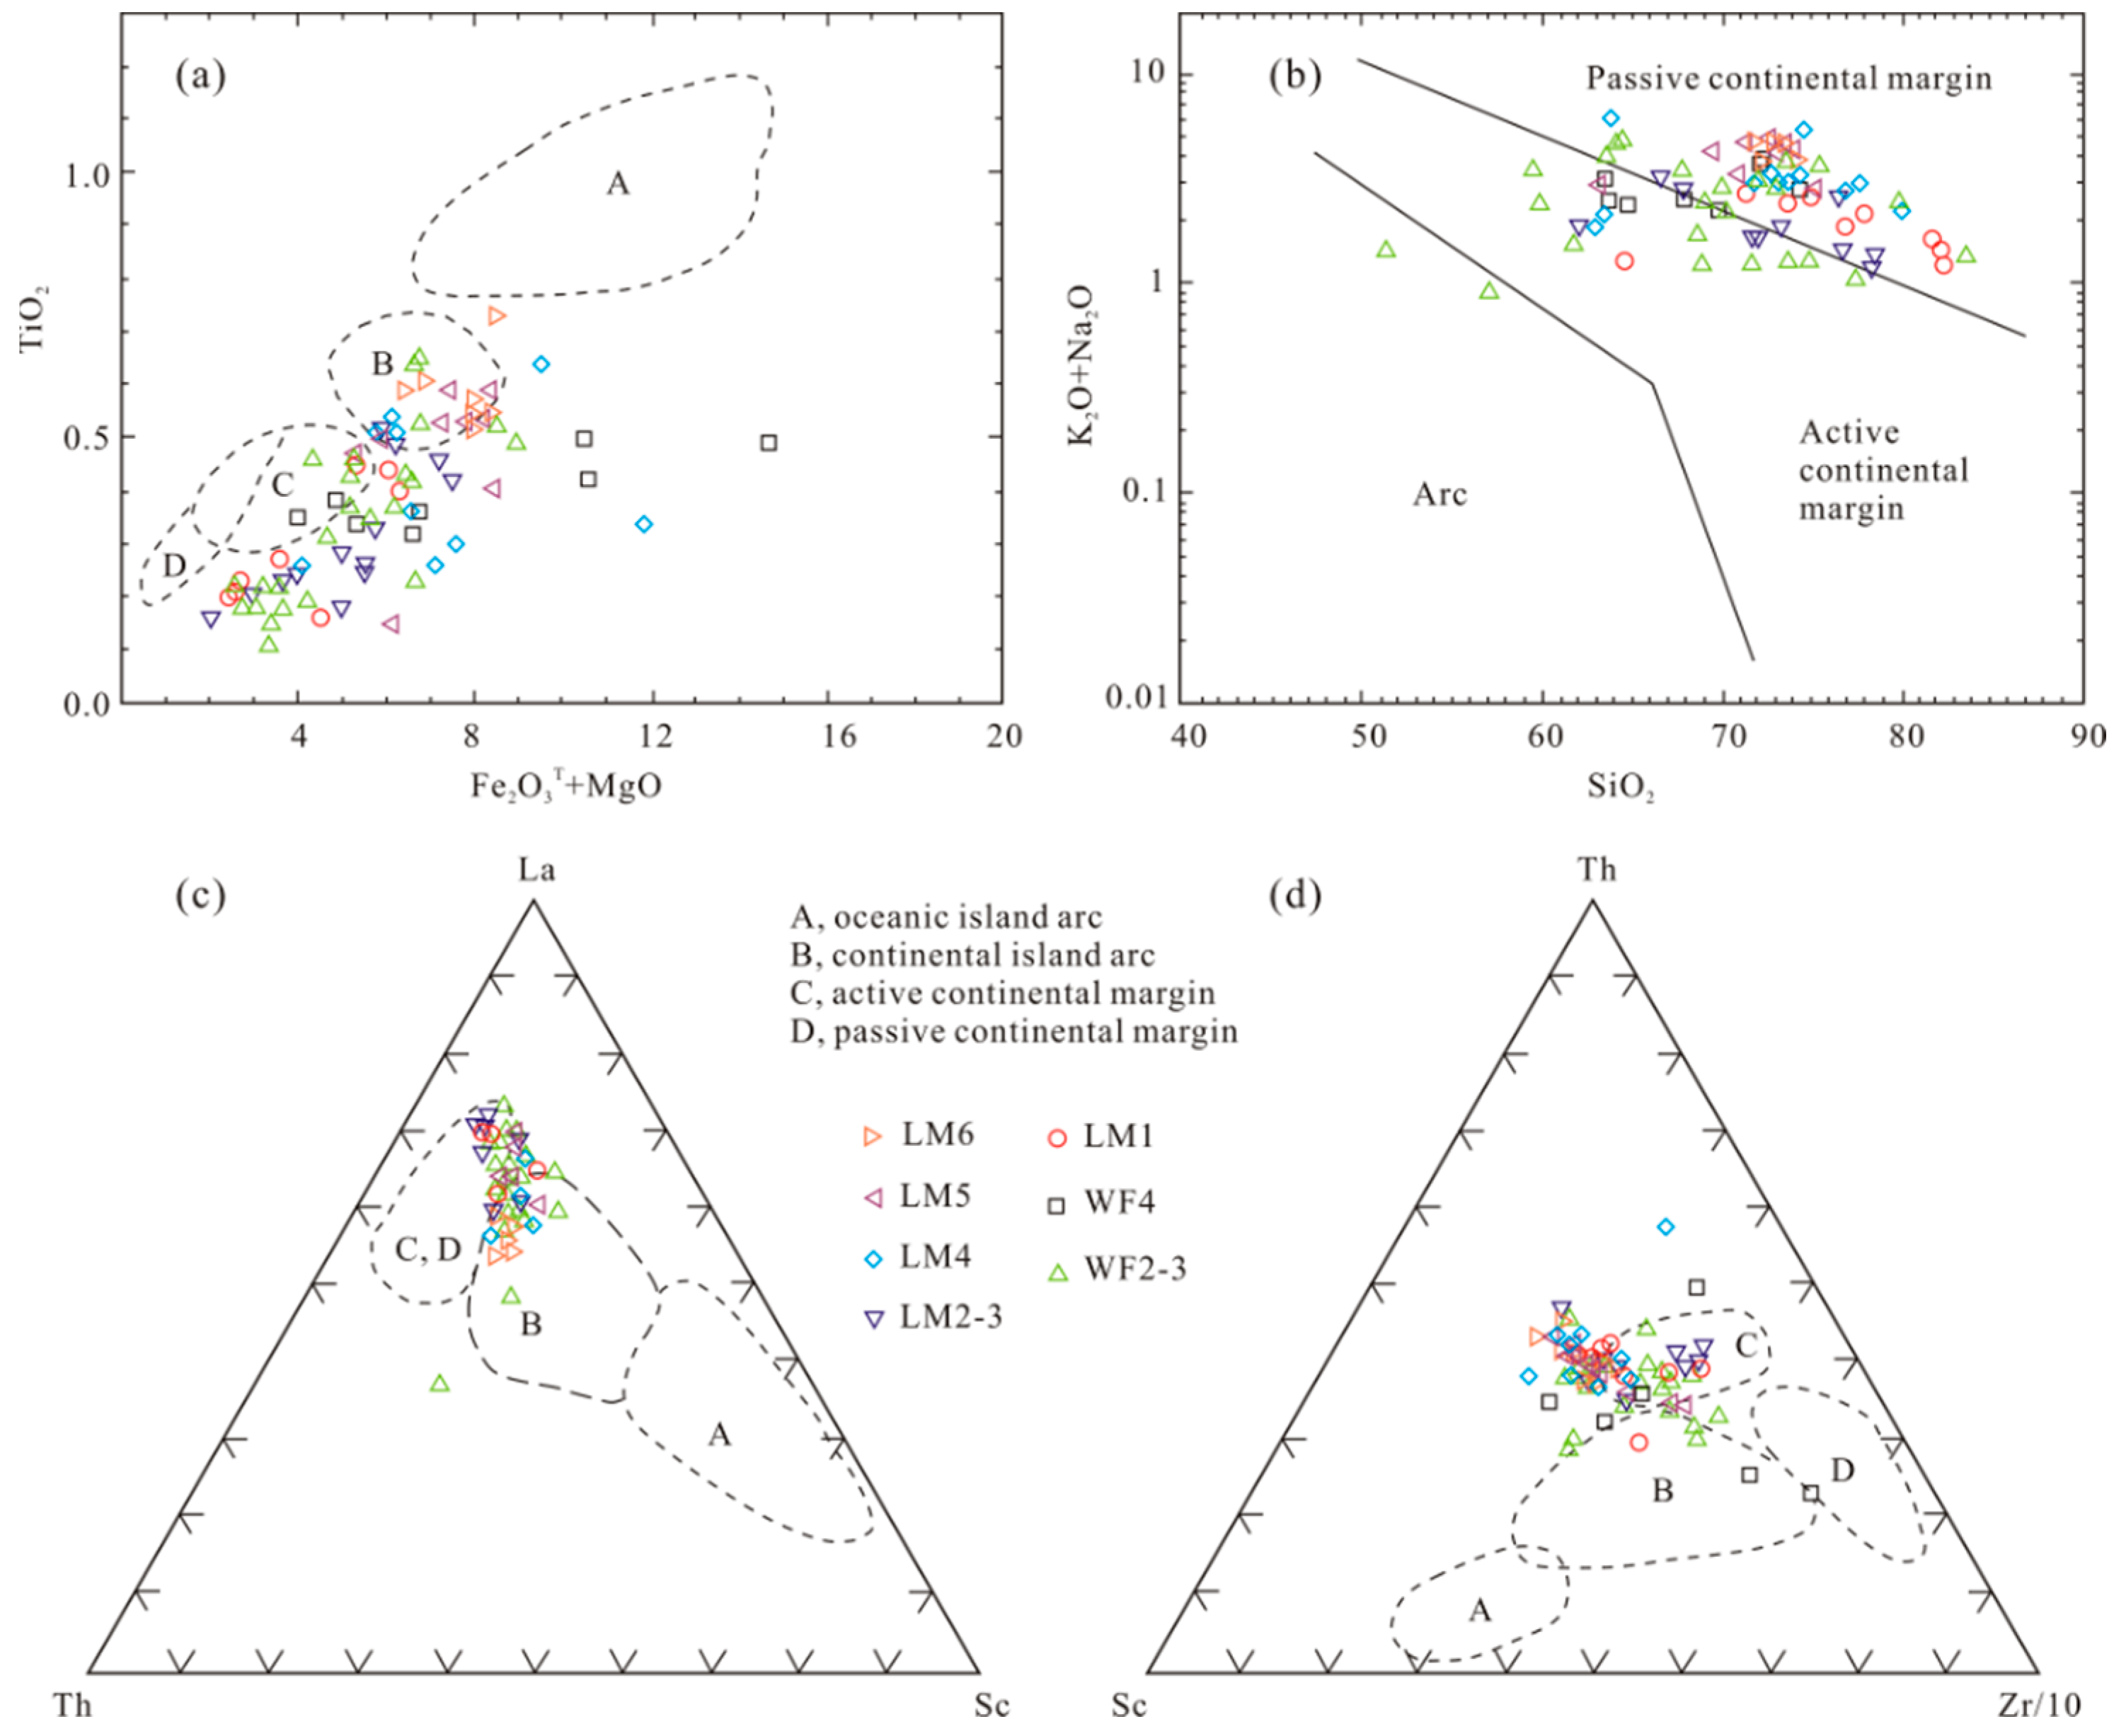
5.4. Tectonic Setting
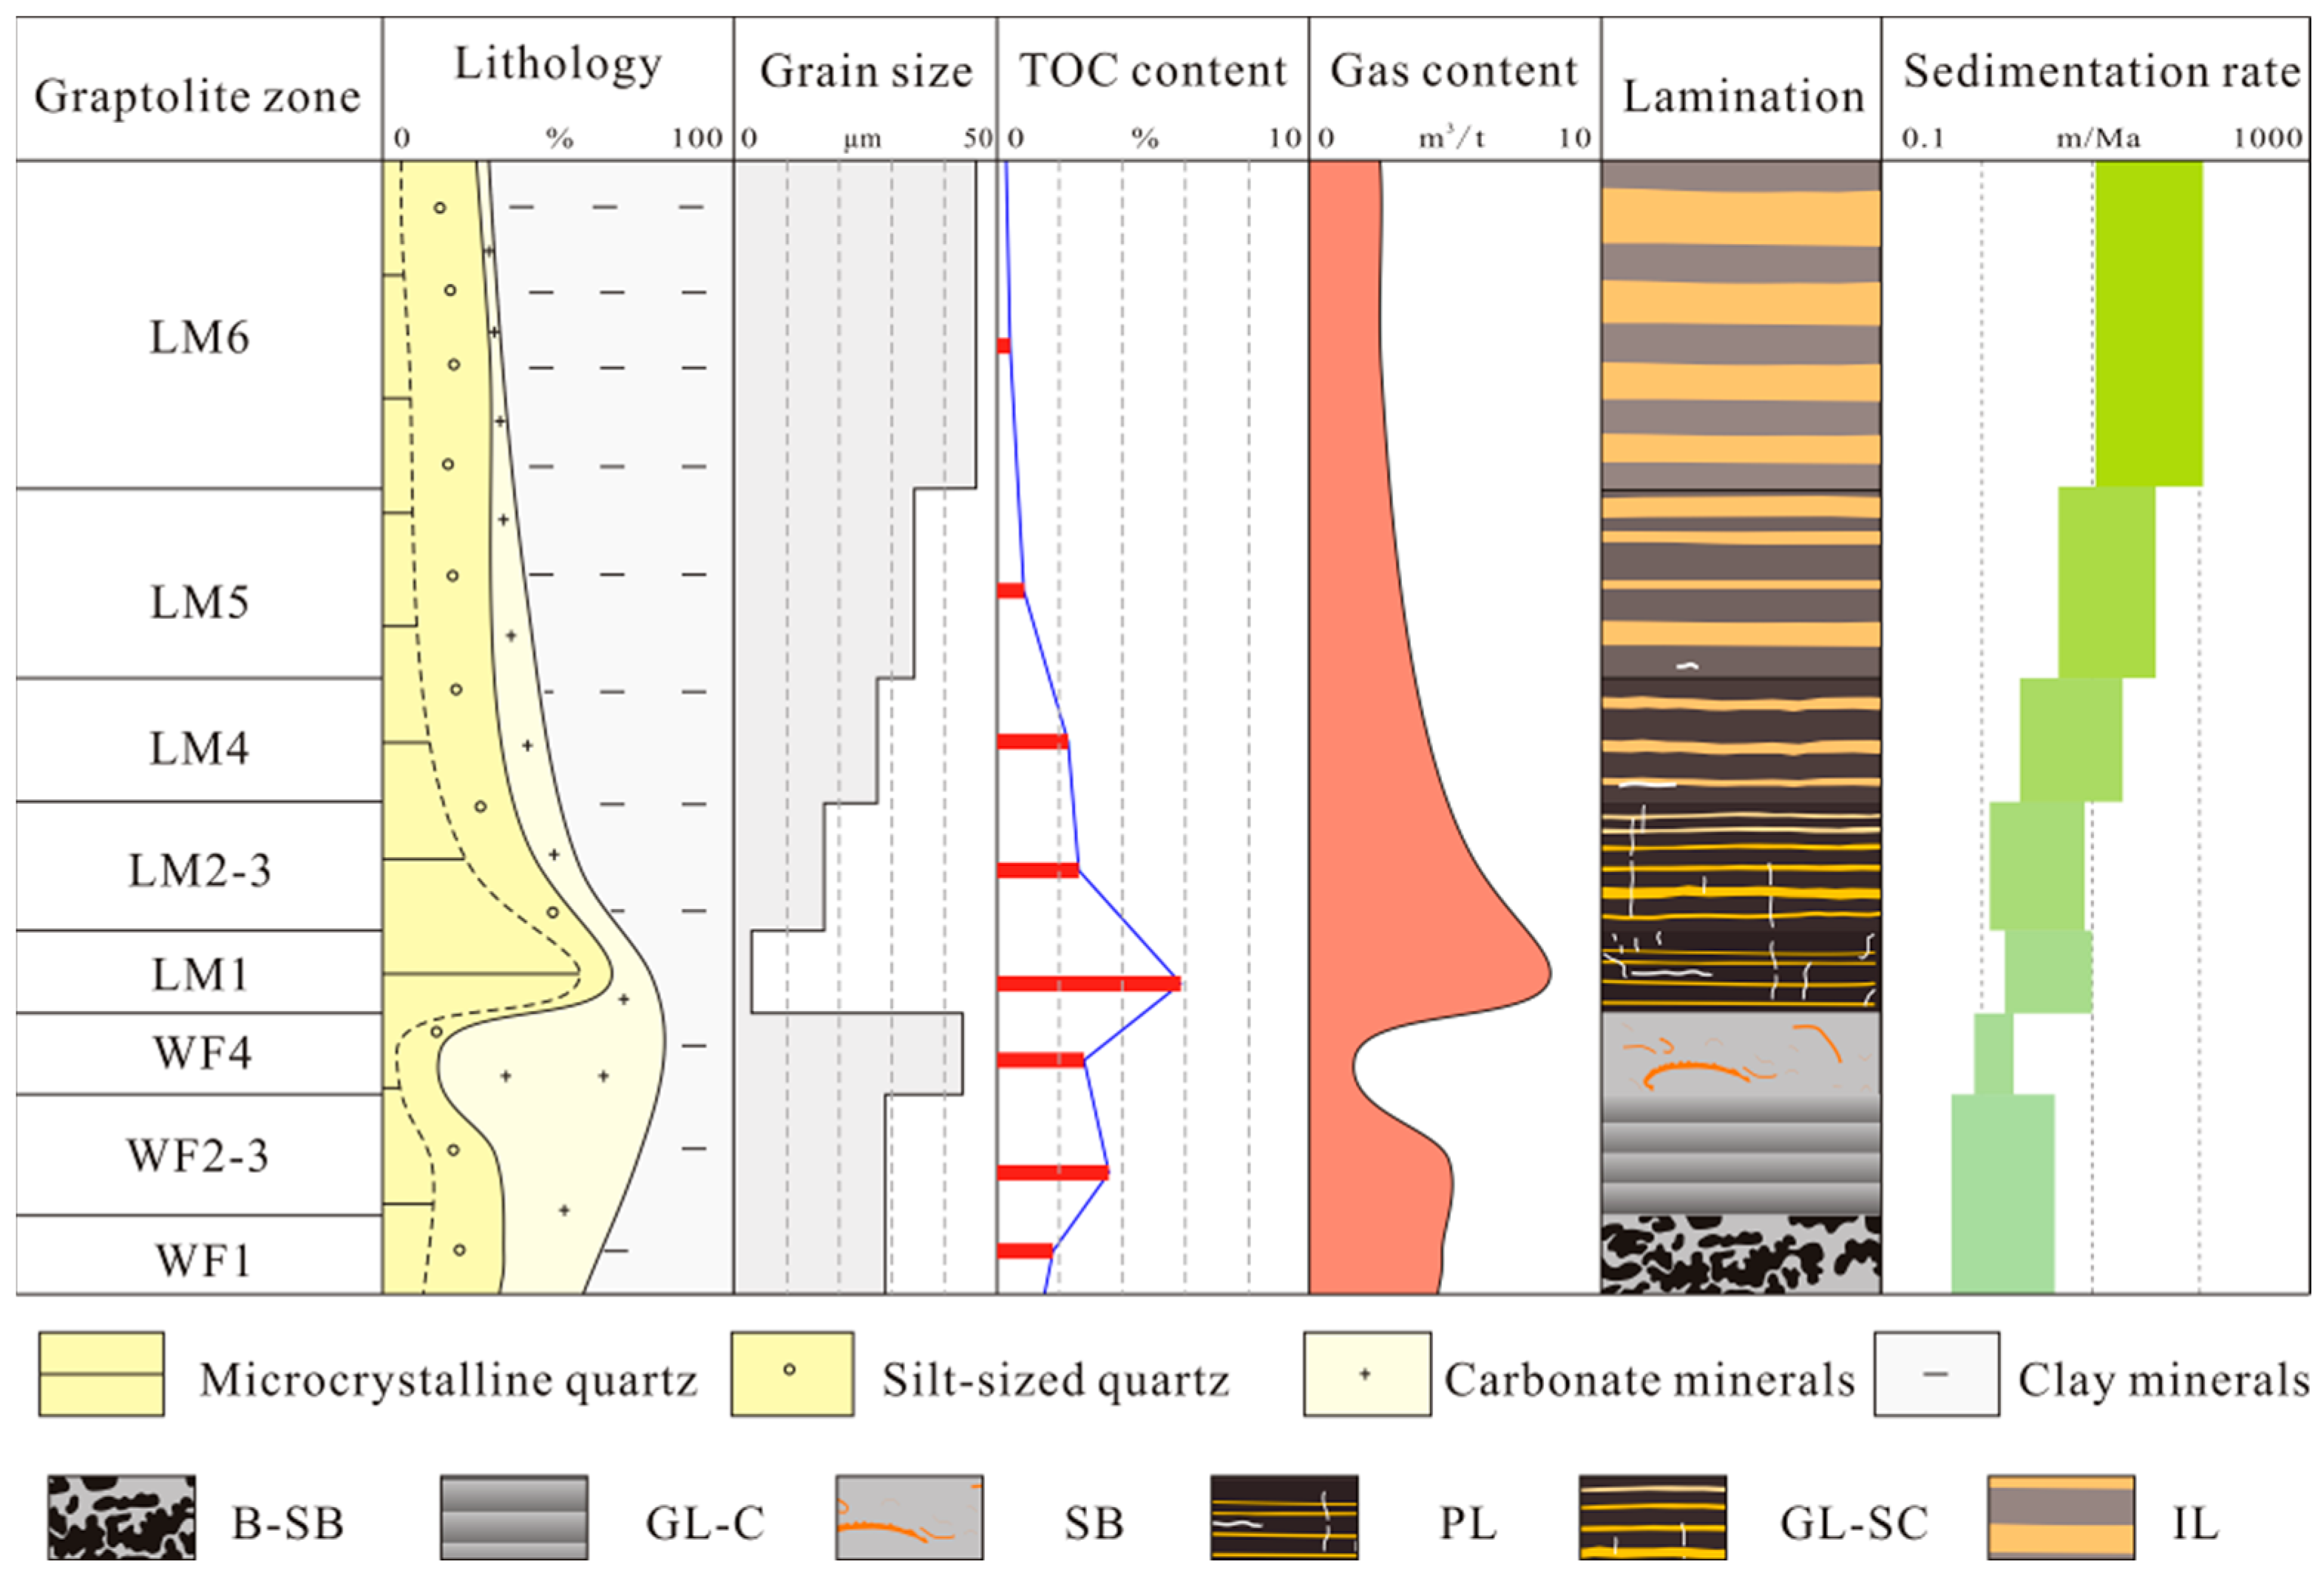
5.5. Genesis of Shale Gas Sweet-Spot Interval
6. Conclusions
- (1)
- The Wufeng–Longmaxi shale is predominantly composed of quartz, calcite, dolomite, and clay minerals. LM1 is a sweet-spot interval and has the highest contents of total quartz, microcrystalline quartz, and TOC.
- (2)
- The Wufeng–Longmaxi shale was derived from compositionally immature and first-cycle sediment source rocks and underwent weak to moderate weathering and sorting. Sedimentary sorting has a limited impact on the geochemical features of the shale.
- (3)
- The dominant protoliths of the Wufeng–Longmaxi shale were acidic igneous rocks, and the tectonic setting was an active continental margin and continental island arc.
- (4)
- Apart from expanded anoxia and transgression, the limited terrigenous supply caused by the inactive tectonic setting is an alternative cause of the formation of the sweet-spot interval.
Supplementary Materials
Author Contributions
Funding
Institutional Review Board Statement
Data Availability Statement
Acknowledgments
Conflicts of Interest
References
- Bai, Y.; Liu, Z.; George, S.C.; Meng, J. A Comparative Study of Different Quality Oil Shales Developed in the Middle Jurassic Shimengou Formation, Yuqia Area, Northern Qaidam Basin, China. Energies 2022, 15, 1231. [Google Scholar] [CrossRef]
- Çelik, Y.; Karayigit, A.I.; Oskay, R.G.; Kayseri-Özer, M.S.; Christanis, K.; Hower, J.C.; Querol, X. A multidisciplinary study and palaeoenvironmental interpretation of middle Miocene Keles lignite (Harmancık Basin, NW Turkey), with emphasis on syngenetic zeolite formation. Int. J. Coal Geol. 2021, 237, 103691. [Google Scholar] [CrossRef]
- Döner, Z.; Hu, Q.; Kumral, M.; Kibria, M.G.; Qiao, H.; Sun, M. Petrophysical Characteristics of Silurian Mudstones from Central Taurides in Southern Turkey. J. Earth Sci.-China 2021, 32, 778–798. [Google Scholar] [CrossRef]
- Song, Y.; Zhu, K.; Xu, Y.; Meng, Q.; Liu, Z.; Sun, P.; Ye, X. Paleovegetational Reconstruction and Implications on Formation of Oil Shale and Coal in the Lower Cretaceous Laoheishan Basin (NE China): Evidence from Palynology and Terpenoid Biomarkers. Energies 2021, 14, 4704. [Google Scholar] [CrossRef]
- Arthur, M. Marine Shales: Depositional Mechanisms and Environments of Ancient Deposits. Annu. Rev. Earth Planet. Sci. 1994, 22, 499–551. [Google Scholar] [CrossRef]
- Paris, F.; Verniers, J.; Miller, M.A.; Al-Hajri, S.; Melvin, J.; Wellman, C.H. Late Ordovician–earliest Silurian chitinozoans from the Qusaiba-1 core hole (North Central Saudi Arabia) and their relation to the Hirnantian glaciation. Rev. Palaeobot. Palyno. 2015, 212, 60–84. [Google Scholar] [CrossRef]
- Geert, K.; Afifi, A.M.; Al-Hajri, S.I.A.; Droste, H.J. Paleozoic stratigraphy and hydrocarbon habitat of the Arabian Plate. GeoArabia 2001, 6, 407–442. [Google Scholar] [CrossRef]
- Yıldız, G. Late Paleozoic-Early Mesozoic paleotectonics of the northern Arabian Plate (SE Turkey) and its role in the Paleozoic petroleum system. Mar. Petrol. Geol. 2022, 137, 105529. [Google Scholar] [CrossRef]
- Rahmani, A.; Naderi, M.; Hosseiny, E. Shale gas potential of the lower Silurian hot shales in southern Iran and the Arabian Plate: Characterization of organic geochemistry. Petroleum 2022. [Google Scholar] [CrossRef]
- Melchin, M.J.; Mitchell, C.E.; Holmden, C.; Štorch, P. Environmental changes in the Late Ordovician–early Silurian: Review and new insights from black shales and nitrogen isotopes. Bulletin 2013, 125, 1635–1670. [Google Scholar] [CrossRef]
- Bond, D.P.; Grasby, S.E. Late Ordovician mass extinction caused by volcanism, warming, and anoxia, not cooling and glaciation. Geology 2020, 48, 777–781. [Google Scholar] [CrossRef]
- Brett, C.E. Sedimentology, facies and depositional environments of the Rochester Shale (Silurian; Wenlockian) in western New York and Ontario. J. Sediment. Res. 1983, 53, 947–971. [Google Scholar]
- Porebski, S.J.; Prugar, W.; Zacharski, J.; Gasiewicz, A. Silurian shales of the East European Platform in Poland; some exploration problems. Przegląd Geol. 2013, 61, 630–638. [Google Scholar]
- Yan, D.; Chen, D.; Wang, Q.; Wang, J. Large-scale climatic fluctuations in the latest Ordovician on the Yangtze block, south China. Geology 2011, 38, 599–602. [Google Scholar] [CrossRef]
- Zou, C.; Qiu, Z.; Poulton, S.W.; Dong, D.; Wang, H.; Chen, D.; Lu, B.; Shi, Z.; Tao, H. Ocean euxinia and climate change “double whammy” drove the Late Ordovician mass extinction. Geology 2018, 46, 535–538. [Google Scholar] [CrossRef]
- Brenchley, P.J.; Marshall, J.D.; Carden, G.; Robertson, D.; Long, D.; Meidla, T.; Hints, L.; Anderson, T.F. Bathymetric and isotopic evidence for a short-lived Late Ordovician glaciation in a greenhouse period. Geology 1994, 22, 295–298. [Google Scholar] [CrossRef]
- Blumenberg, M.; Wiese, F. Imbalanced nutrients as triggers for black shale formation in a shallow shelf setting during the OAE 2 (Wunstorf, Germany). Biogeosciences 2012, 9, 4139–4153. [Google Scholar] [CrossRef]
- Ozaki, K.; Tajima, S.; Tajika, E. Conditions required for oceanic anoxia/euxinia: Constraints from a one-dimensional ocean biogeochemical cycle model. Earth Planet. Sci. Lett. 2011, 304, 270–279. [Google Scholar] [CrossRef]
- Turgeon, S.C.; Creaser, R.A. Cretaceous oceanic anoxic event 2 triggered by a massive magmatic episode. Nature 2008, 454, 323–326. [Google Scholar] [CrossRef]
- Jenkyns, H.C. Geochemistry of oceanic anoxic events. Geochem. Geophys. Geosystems 2010, 11. [Google Scholar] [CrossRef]
- Weissert, H.; Erba, E. Volcanism, CO2 and palaeoclimate: A Late Jurassic–Early Cretaceous carbon and oxygen isotope record. J. Geol. Soc. Lond. 2004, 161, 695–702. [Google Scholar] [CrossRef]
- Han, S.; Zhang, J.; Wang, C.; Tang, X. Elemental geochemistry of lower Silurian Longmaxi shale in southeast Sichuan Basin, South China: Constraints for Paleoenvironment. Geol. J. 2018, 53, 1458–1464. [Google Scholar] [CrossRef]
- Yan, D.; Li, S.; Fu, H.; Jasper, D.M.; Zhou, S.; Yang, X.; Zhang, B.; Mangi, H.N. Mineralogy and geochemistry of Lower Silurian black shales from the Yangtze platform, South China. Int. J. Coal Geol. 2021, 237, 103706. [Google Scholar] [CrossRef]
- Shi, Z.; Wang, H.; Sun, S.; Guo, C. Graptolite zone calibrated stratigraphy and topography of the late Ordovician-early Silurian Wufeng-Lungmachi shale in Upper Yangtze area, South China. Arab. J. Geosci. 2021, 14, 213. [Google Scholar] [CrossRef]
- Wang, N.; Li, M.; Tian, X.; Hong, H.; Wen, L.; Wang, W. Climate-ocean control on the depositional watermass conditions and organic matter enrichment in lower cambrian black shale in the upper Yangtze Platform. Mar. Petrol. Geol. 2020, 120, 104570. [Google Scholar] [CrossRef]
- Wang, H.; Shi, Z.; Zhao, Q.; Liu, D.; Sun, S.; Guo, W.; Liang, F.; Lin, C.; Wang, X. Stratigraphic framework of the Wufeng-Longmaxi shale in and around the Sichuan Basin, China: Implications for targeting shale gas. Energy Geosci. 2020, 1, 124–133. [Google Scholar] [CrossRef]
- Ma, X.; Wang, H.; Zhou, T.; Zhao, Q.; Shi, Z.; Sun, S.; Cheng, F. Geological Controlling Factors of Low Resistivity Shale and Their Implications on Reservoir Quality: A Case Study in the Southern Sichuan Basin, China. Energies 2022, 15, 5801. [Google Scholar] [CrossRef]
- Qiu, Z.; Zou, C. Controlling factors on the formation and distribution of “sweet-spot areas” of marine gas shales in South China and a preliminary discussion on unconventional petroleum sedimentology. J. Asian Earth Sci. 2020, 194, 103989. [Google Scholar] [CrossRef]
- Shi, Z.; Zhou, T.; Wang, H.; Sun, S. Depositional Structures and Their Reservoir Characteristics in the Wufeng–Longmaxi Shale in Southern Sichuan Basin, China. Energies 2022, 15, 1618. [Google Scholar] [CrossRef]
- Chuanlin, Z.; Santosh, M.; Qingbo, Z.; Xiangyan, C.; Wencheng, H. The Gondwana connection of south China; evidence from monazite and zircon geochronology in the Cathaysia Block. Gondwana Res. 2015, 28, 1137–1151. [Google Scholar]
- Yao, W.; Li, Z.; Li, W.; Su, L.; Yang, J. Detrital provenance evolution of the Ediacaran-Silurian Nanhua foreland basin, south China. Gondwana Res. 2015, 28, 1449–1465. [Google Scholar] [CrossRef]
- Yu, J.; O’Reilly, S.Y.; Wang, L.; Griffin, W.L.; Zhang, M.; Wang, R.; Jiang, S.; Shu, L. Where was South China in the Rodinia supercontinent? Precambrian Res. 2008, 164, 1–15. [Google Scholar] [CrossRef]
- Wu, H. Reinterpretation of the Guangxian Orogeny. Chin. Sci. Bull. 2000, 45, 1244–1248. [Google Scholar] [CrossRef]
- Zhou, L.; Kang, Z.; Wang, Z.; Peng, Y.; Xiao, H. Sedimentary geochemical investigation for paleoenvironment of the Lower Cambrian Niutitang Formation shales in the Yangtze Platform. J. Petrol. Sci. Eng. 2017, 159, 376–386. [Google Scholar] [CrossRef]
- Munnecke, A.; Calner, M.; Harper, D.A.; Servais, T. Ordovician and Silurian sea–water chemistry, sea level, and climate: A synopsis. Palaeogeogr. Palaeoclimatol. Palaeoecol. 2010, 296, 389–413. [Google Scholar] [CrossRef]
- Zhang, T.; Shen, Y.; Algeo, T.J. High-resolution carbon isotopic records from the Ordovician of South China: Links to climatic cooling and the Great Ordovician Biodiversification Event (GOBE). Palaeogeogr. Palaeoclimatol. Palaeoecol. 2010, 289, 102–112. [Google Scholar] [CrossRef]
- Xu, C.; Jiayu, R.; Yue, L.; Boucot, A.J. Facies patterns and geography of the Yangtze region, South China, through the Ordovician and Silurian transition. Palaeogeogr. Palaeoclimatol. Palaeoecol. 2004, 204, 353–372. [Google Scholar] [CrossRef]
- Tang, X.; Jiang, Z.; Huang, H.; Jiang, S.; Yang, L.; Xiong, F.; Chen, L.; Feng, J. Lithofacies characteristics and its effect on gas storage of the Silurian Longmaxi marine shale in the southeast Sichuan Basin, China. J. Nat. Gas Sci. Eng. 2016, 28, 338–346. [Google Scholar] [CrossRef]
- Zhou, K.; Mou, C.; Xu, X.; Ge, X.; Liang, W. Early Silurian paleogeography and source-reservoir-cap rocks of the Middle-Upper Yangtze region in South China. Petrol. Explor. Dev. 2014, 41, 684–694. [Google Scholar] [CrossRef]
- Ma, X.; Xie, J. The progress and prospects of shale gas exploration and exploitation in southern Sichuan Basin, SW China. Petrol. Explor. Dev. 2018, 45, 161–169. [Google Scholar] [CrossRef]
- Dong, D.; Shi, Z.; Sun, S.; Guo, C.; Zhang, C.; Guo, W.; Guan, Q.; Zhang, M.; Jiang, S.; Zhang, L. Factors controlling microfractures in black shale: A case study of Ordovician Wufeng Formation–Silurian Longmaxi Formation in Shuanghe Profile, Changning area, Sichuan Basin, SW China. Petrol. Explor. Dev. 2018, 45, 818–829. [Google Scholar] [CrossRef]
- Zhao, W.; Zhang, S.; He, K.; Zeng, H.; Hu, G.; Zhang, B.; Wang, Z.; Li, Y. Origin of conventional and shale gas in Sinian–lower Paleozoic strata in the Sichuan Basin: Relayed gas generation from liquid hydrocarbon cracking. AAPG Bull. 2019, 103, 1265–1296. [Google Scholar] [CrossRef]
- Ma, X.; Xie, J.; Yong, R.; Zhu, Y. Geological characteristics and high production control factors of shale gas reservoirs in Silurian Longmaxi Formation, southern Sichuan Basin, SW China—ScienceDirect. Petrol. Explor. Dev. 2020, 47, 901–915. [Google Scholar] [CrossRef]
- Wang, H.; Shi, Z.; Sun, S. Biostratigraphy and reservoir characteristics of the Ordovician Wufeng Formation-Silurian Longmaxi Formation shale in the Sichuan Basin and its surrounding areas, China. Petrol. Explor. Dev. 2021, 48, 14. [Google Scholar] [CrossRef]
- Taylor, S.R.; Mclennan, S.M. The Continental Crust: Its Composition and Evolution; Blackwell Scientific Publications: Oxford, UK, 1985; p. 312. [Google Scholar]
- Gromet, L.P.; Haskin, L.A.; Korotev, R.L.; Dymek, R.F. The “North American shale composite”: Its compilation, major and trace element characteristics. Geochim. Cosmochim. Acta 1984, 48, 2469–2482. [Google Scholar] [CrossRef]
- Shi, Z.; Dong, D.; Wang, H.; Sun, S.; Wu, J. Reservoir characteristics and genetic mechanisms of gas-bearing shales with different laminae and laminae combinations: A case study of Member 1 of the Lower Silurian Longmaxi shale in Sichuan Basin, SW China. Petrol. Explor. Dev. 2020, 47, 888–900. [Google Scholar] [CrossRef]
- Bhatia, M.R. Rare earth element geochemistry of Australian Paleozoic graywackes and mudrocks: Provenance and tectonic control. Sediment. Geol. 1985, 45, 97–113. [Google Scholar]
- Mclennan, S.M. Relationship between the trace element composition of sedimentary rocks and upper continental crust. Geochem. Geophys. Geosystems 2001, 2, 203–236. [Google Scholar]
- Dai, S.; Seredin, V.V.; Ward, C.R.; Hower, J.C.; Xing, Y.; Zhang, W.; Song, W.; Wang, P. Enrichment of U–Se–Mo–Re–V in coals preserved within marine carbonate successions: Geochemical and mineralogical data from the Late Permian Guiding Coalfield, Guizhou, China. Miner. Depos. 2015, 50, 159–186. [Google Scholar] [CrossRef]
- Sun, S.S.; McDonough, W.F. Chemical and isotopic systematics of oceanic basalts: Implications for mantle composition and processes. Geol. Soc. Lond. Spec. Publ. 1989, 42, 313–345. [Google Scholar]
- Roser, B.P.; Korsch, R.J. Provenance signatures of sandstone-mudstone suites determined using discriminant function analysis of major-element data. Chem. Geol. 1988, 67, 119–139. [Google Scholar] [CrossRef]
- Mclennan, S.M.; Hemming, S.R.; Mcdaniel, D.K.; Hanson, G.N. Geochemical Approaches to Sedimentation, Provenance, and Tectonics. In Processes Controlling the Composition of Clastic Sediments; Special Papers-Geological Society of America: Austin, TX, USA, 1993. [Google Scholar]
- Dostal, J.; Keppie, J.D. Geochemistry of low-grade clastic rocks in the Acatlán Complex of southern Mexico: Evidence for local provenance in felsic–intermediate igneous rocks. Sediment. Geol. 2009, 222, 241–253. [Google Scholar] [CrossRef]
- Garcia, D.; Fonteilles, M.; Moutte, J. Sedimentary fractionations between Al, Ti, and Zr and the genesis of strongly peraluminous granites. J. Geol. 1994, 102, 411–422. [Google Scholar] [CrossRef]
- La Fleche, M.R.; Camire, G. Geochemistry and provenance of metasedimentary rocks from the Archean Golden Pond Sequence (Casa Berardi mining district, Abitibi Subprovince). Can. J. Earth Sci. 1996, 33, 676–690. [Google Scholar] [CrossRef]
- Wronkiewicz, D.J. Geochemistry and provenance of sediments from the Pongola Supergroup, South Africa: Evidence for a 3.0-Ga-old continental craton. Geochim. Cosmochim. Acta 1989, 53, 1537–1549. [Google Scholar] [CrossRef]
- Floyd, P.A.; Leveridge, B.E. Tectonic environment of the Devonian Gramscatho basin, south Cornwall: Framework mode and geochemical evidence from turbiditic sandstones. J. Geol. Soc. Lond. 1987, 144, 531–542. [Google Scholar] [CrossRef]
- Condie, K.C.; Wronkiewicz, D.J. The Cr/Th ratio in Precambrian pelites from the Kaapvaal Craton as an index of craton evolution. Earth Planet. Sci. Lett. 1990, 97, 256–267. [Google Scholar] [CrossRef]
- Condie, K.C. Chemical composition and evolution of the upper continental crust: Contrasting results from surface samples and shales. Chem. Geol. 1993, 104, 1–37. [Google Scholar] [CrossRef]
- Cullers, R.L.; Podkovyrov, V.N. The source and origin of terrigenous sedimentary rocks in the Mesoproterozoic Ui group, southeastern Russia. Precambrian Res. 2002, 117, 157–183. [Google Scholar] [CrossRef]
- Cullers, R.L.; Podkovyrov, V.N. Geochemistry of the Mesoproterozoic Lakhanda shales in southeastern Yakutia, Russia: Implications for mineralogical and provenance control, and recycling. Precambrian Res. 2000, 104, 77–93. [Google Scholar] [CrossRef]
- Nesbitt, H.W.P.; Young, G.M. Early Proterozoic climates and plate motions inferred from major element chemistry of lutites. Nature 1982, 299, 715–717. [Google Scholar]
- Young, G.M.; Nesbitt, H.W.P. Paleoclimatology and provenance of the glaciogenic Gowganda Formation (Paleoproterozoic), Ontario, Canada: A chemostratigraphic approach. GSA Bull. 1999, 111, 264–274. [Google Scholar] [CrossRef]
- Nesbitt, H.W.P.; Young, G.M. Prediction of some weathering trends of plutonic and volcanic rocks based on thermodynamic and kinetic considerations. Geochim. Cosmochim. Acta 1984, 48, 1523–1534. [Google Scholar] [CrossRef]
- Nesbitt, H.W.; Young, G.M.; Mclennan, S.M.; Keays, R.R. Effects of Chemical Weathering and Sorting on the Petrogenesis of Siliciclastic Sediments, with Implications for Provenance Studies. J. Geol. 1996, 104, 525–542. [Google Scholar] [CrossRef]
- Nesbitt, H.W.; Markovics, G.; Price, R.C. Chemical processes affecting alkalis and alkaline earths during continental weathering. Geochim. Cosmochim. Acta 1980, 44, 1659–1666. [Google Scholar] [CrossRef]
- Yan, Y.; Xia, B.; Lin, G.; Cui, X.; Hu, X.; Yan, P.; Zhang, F. Geochemistry of the sedimentary rocks from the Nanxiong Basin, South China and implications for provenance, paleoenvironment and paleoclimate at the K/T boundary. Sediment. Geol. 2007, 197, 127–140. [Google Scholar] [CrossRef]
- Fedo, C.M.; Wayne Nesbitt, H.; Young, G.M. Unraveling the effects of potassium metasomatism in sedimentary rocks and paleosols, with implications for paleoweathering conditions and provenance. Geology 1995, 23, 921–924. [Google Scholar]
- Barash, M.S. Mass extinction of the marine biota at the Ordovician-Silurian transition due to environmental changes. Oceanology 2014, 54, 780–787. [Google Scholar]
- Harper, D.A.T.; Hammarlund, E.U.; Rasmussen, C.M.Ø. End Ordovician extinctions: A coincidence of causes. Gondwana Res. 2014, 25, 1294–1307. [Google Scholar]
- Wang, Y.; Wang, H.; Qiu, Z.; Shen, J.; Zhang, Q.; Zhang, L.; Wang, C.; Li, X. Basic characteristics of key interfaces in Upper Ordovician Wufeng Formation—Lower Silurian Longmaxi Formation in Sichuan Basin and its periphery, SW China. Petrol. Explor. Dev. 2022, 49, 37–51. [Google Scholar]
- Cullers, R.L. The controls on the major-and trace-element evolution of shales, siltstones and sandstones of Ordovician to Tertiary age in the Wet Mountains region, Colorado, USA. Chem. Geol. 1995, 123, 107–131. [Google Scholar] [CrossRef]
- Cullers, R.L. The geochemistry of shales, siltstones and sandstones of Pennsylvanian–Permian age, Colorado, USA: Implications for provenance and metamorphic studies. Lithos 2000, 51, 181–203. [Google Scholar] [CrossRef]
- Bhatia, M.R.; Crook, K.A.W. Trace element characteristics of graywackes and tectonic setting discrimination of sedimentary basins. Contrib. Mineral. Petrol. 1986, 92, 181–193. [Google Scholar] [CrossRef]
- Bhatia, M.R. Plate tectonics and geochemical composition of sandstones. J. Geol. 1983, 91, 611–626. [Google Scholar] [CrossRef]
- Roser, B.P.; Korsch, R.J. Determination of tectonic setting of sandstone-mudstone suites using SiO2 content and K2O/Na2O ratio. J. Geol. 1986, 94, 635–650. [Google Scholar] [CrossRef]
- Elderfield, H.; Greaves, M.J. The rare earth elements in seawater. Nature 1982, 196, 214–219. [Google Scholar] [CrossRef]
- Condie, K.C. Another look at rare earth elements in shales. Geochim. Cosmochim. Acta 1991, 55, 2527–2531. [Google Scholar] [CrossRef]
- Shurr, G.W.; Ridgley, J.L. Unconventional shallow biogenic gas systems. AAPG Bull. 2002, 86, 1939–1969. [Google Scholar]
- Pollastro, R.M. Total petroleum system assessment of undiscovered resources in the giant Barnett Shale continuous (unconventional) gas accumulation, Fort Worth Basin, Texas. AAPG Bull. 2007, 91, 551–578. [Google Scholar] [CrossRef]
- Zou, C.; Zhao, Q.; Dong, D.; Yang, Z.; Qiu, Z.; Liang, F.; Wang, N.; Huang, Y.; Duan, A.; Zhang, Q. Geological characteristics, main challenges and future prospect of shale gas. J. Nat. Gas Geosci. 2017, 2, 273–288. [Google Scholar] [CrossRef]
- Ma, Y.; Cai, X.; Zhao, P. China’s shale gas exploration and development: Understanding and practice. Petrol. Explor. Dev. 2018, 45, 589–603. [Google Scholar] [CrossRef]
- Qiu, Z.; Zou, C.; Mills, B.J.W.; Xiong, Y.; Tao, H.; Lu, B.; Liu, H.; Xiao, W.; Poulton, S.W. A nutrient control on expanded anoxia and global cooling during the Late Ordovician mass extinction. Commun. Earth Environ. 2022, 3, 82. [Google Scholar] [CrossRef]
- Wignall, P.B. Model for transgressive black shales? Geology 1991, 19, 167–170. [Google Scholar] [CrossRef]
- Leonowicz, P. Nearshore transgressive black shale from the Middle Jurassic shallow-marine succession from southern Poland. Facies 2016, 62, 16. [Google Scholar] [CrossRef]
- Aplin, A.C.; Macquaker, J.H. Mudstone diversity: Origin and implications for source, seal, and reservoir properties in petroleum systems. AAPG Bull. 2011, 95, 2031–2059. [Google Scholar] [CrossRef]


| No. | Well | Depth | Lithology | Formation | Graptolite Zone | Quartz | Calcite | Dolomite | Clay Minerals | Potassium Feldspar | Plagioclase | Pyrite | TOC |
|---|---|---|---|---|---|---|---|---|---|---|---|---|---|
| 1 | Y105 | 1650.5 | Shale | Longmaxi | LM6 | 39.0 | / | / | 45.0 | / | 8.0 | 2.0 | 0.5 |
| 2 | Y105 | 1655.1 | Shale | Longmaxi | LM6 | 39.0 | / | 1.0 | 50.0 | / | 7.0 | 2.0 | 0.6 |
| 3 | Y105 | 1658.4 | Shale | Longmaxi | LM6 | 36.0 | / | 1.0 | 51.0 | / | 7.0 | 3.0 | 0.8 |
| 4 | YH3–8 | 3742.4 | Shale | Longmaxi | LM6 | 38.0 | / | / | 53.0 | / | 7.0 | 1.0 | 0.3 |
| 5 | YH3–8 | 3744.4 | Shale | Longmaxi | LM6 | 36.0 | 1.0 | 4.0 | 54.0 | / | 7.0 | 2.0 | 0.80 |
| 6 | YH3–8 | 3746.9 | Shale | Longmaxi | LM6 | 43.0 | / | / | 50.0 | / | 8.0 | 3.0 | 0.66 |
| 7 | YH3–8 | 3747.3 | Shale | Longmaxi | LM6 | 36.0 | / | 3.0 | 46.0 | / | 8.0 | 3.0 | 0.70 |
| 8 | XD2 | 2052.5 | Shale | Longmaxi | LM5 | 40.0 | / | 0.0 | 50.0 | / | 8.0 | 3.0 | 0.77 |
| 9 | XD2 | 2055.3 | Shale | Longmaxi | LM5 | 36.0 | 2.0 | 3.0 | 49.0 | / | 8.0 | 2.0 | 1.09 |
| 10 | Y105 | 1664.1 | Shale | Longmaxi | LM5 | 34.0 | 2.0 | 3.0 | 49.0 | / | 10.0 | 2.0 | 0.83 |
| 11 | Y105 | 1668.1 | Shale | Longmaxi | LM5 | 39.0 | 0.0 | / | 49.0 | / | 7.0 | 3.0 | 0.63 |
| 12 | Y105 | 1673.1 | Shale | Longmaxi | LM5 | 36.0 | 2.0 | 1.0 | 51.0 | / | 6.0 | 2.0 | 1.00 |
| 13 | YH3–8 | 3749.4 | Shale | Longmaxi | LM5 | 34.0 | 3.0 | 12.0 | 53.0 | / | 6.0 | 2.0 | 0.95 |
| 14 | YH3–8 | 3753.4 | Shale | Longmaxi | LM5 | 29.0 | 3.0 | 11.0 | 43.0 | / | 7.0 | 3.0 | 1.22 |
| 15 | YH3–8 | 3757.1 | Shale | Longmaxi | LM5 | 35.0 | 3.0 | 5.0 | 47.0 | / | 7.0 | 3.0 | 1.38 |
| 16 | YH3–8 | 3761.7 | Shale | Longmaxi | LM5 | 37.0 | 2.0 | 4.0 | 47.0 | / | 6.0 | 5.0 | 2.06 |
| 17 | YH3–8 | 3766.0 | Shale | Longmaxi | LM5 | 26.0 | 12.0 | 13.0 | 46.0 | / | 8.0 | 3.0 | 2.54 |
| 18 | Z204 | 3398.6 | Shale | Longmaxi | LM4 | 33.0 | 4.0 | 6.0 | 38.0 | / | 8.0 | 2.0 | 1.53 |
| 19 | XD2 | 2058.6 | Shale | Longmaxi | LM4 | 23.0 | 15.0 | 33.0 | 44.0 | / | 9.0 | 2.0 | 2.70 |
| 20 | XD2 | 2061.1 | Shale | Longmaxi | LM4 | 34.0 | 11.0 | 12.0 | 18.0 | / | 8.0 | 2.0 | 2.83 |
| 21 | XD2 | 2062.6 | Shale | Longmaxi | LM4 | 34.0 | 10.0 | 9.0 | 33.0 | / | 8.0 | 3.0 | 2.04 |
| 22 | Y105 | 1674.6 | Shale | Longmaxi | LM4 | 27.0 | 16.0 | 12.0 | 36.0 | / | 7.0 | 3.0 | 2.06 |
| 23 | Y105 | 1676.3 | Shale | Longmaxi | LM4 | 34.0 | 8.0 | 16.0 | 35.0 | / | 7.0 | 2.0 | 2.39 |
| 24 | Y105 | 1677.7 | Shale | Longmaxi | LM4 | 28.0 | 10.0 | 5.0 | 33.0 | / | 7.0 | 8.0 | 2.90 |
| 25 | Y105 | 1679.5 | Shale | Longmaxi | LM4 | 24.0 | 14.0 | 9.0 | 42.0 | / | 7.0 | 4.0 | 2.13 |
| 26 | Y105 | 1681.8 | Shale | Longmaxi | LM4 | 25.0 | 16.0 | 12.0 | 42.0 | / | 4.0 | 4.0 | 2.04 |
| 27 | YH3–8 | 3769.8 | Shale | Longmaxi | LM4 | 30.0 | 3.0 | 2.0 | 39.0 | / | 8.0 | 6.0 | 2.78 |
| 28 | YH3–8 | 3773.7 | Shale | Longmaxi | LM4 | 32.0 | 4.0 | 6.0 | 51.0 | / | 7.0 | 5.0 | 2.49 |
| 29 | YH3–8 | 3775.8 | Shale | Longmaxi | LM4 | 37.0 | 4.0 | 9.0 | 46.0 | / | 10.0 | 5.0 | 2.11 |
| 30 | Z204 | 3406.8 | Shale | Longmaxi | LM2–3 | 46.0 | 2.0 | 11.0 | 35.0 | / | 11.0 | 3.0 | 1.73 |
| 31 | XD2 | 2065.4 | Shale | Longmaxi | LM2–3 | 41.0 | 4.0 | 4.0 | 27.0 | / | 8.0 | 4.0 | 2.43 |
| 32 | XD2 | 2067.8 | Shale | Longmaxi | LM2–3 | 29.0 | 3.0 | 28.0 | 39.0 | / | 5.0 | 3.0 | 1.70 |
| 33 | Y105 | 1685.0 | Shale | Longmaxi | LM2–3 | 36.0 | 7.0 | 10.0 | 32.0 | / | 8.0 | 3.0 | 1.32 |
| 34 | Y105 | 1687.0 | Shale | Longmaxi | LM2–3 | 47.0 | 6.0 | 8.0 | 36.0 | / | 9.0 | 3.0 | 2.09 |
| 35 | Y105 | 1688.2 | Shale | Longmaxi | LM2–3 | 35.0 | 4.0 | 6.0 | 27.0 | / | 10.0 | 4.0 | 1.06 |
| 36 | YH3–8 | 3779.1 | Shale | Longmaxi | LM2–3 | 37.0 | 6.0 | 9.0 | 41.0 | / | 12.0 | 3.0 | 2.05 |
| 37 | YH3–8 | 3781.0 | Shale | Longmaxi | LM2–3 | 43.0 | 3.0 | 7.0 | 33.0 | / | 7.0 | 4.0 | 2.69 |
| 38 | SH outcrop | / | Shale | Longmaxi | LM2–3 | 38.0 | 9.0 | 7.0 | 36.0 | / | 10.0 | 4.0 | 2.14 |
| 39 | SH outcrop | / | Shale | Longmaxi | LM2–3 | 47.0 | 7.0 | 7.0 | 32.0 | / | 9.0 | 3.0 | 2.10 |
| 40 | SH outcrop | / | Shale | Longmaxi | LM2–3 | 44.0 | 6.0 | 8.0 | 27.0 | / | 9.0 | 3.0 | 2.19 |
| 41 | SH outcrop | / | Shale | Longmaxi | LM2–3 | 48.0 | 5.0 | 4.0 | 30.0 | / | 10.0 | 3.0 | 2.22 |
| 42 | SH outcrop | / | Shale | Longmaxi | LM2–3 | 47.0 | 4.0 | 6.0 | 30.0 | / | 11.0 | 3.0 | 2.73 |
| 43 | XD2 | 2068.5 | Shale | Longmaxi | LM1 | 61.0 | 3.0 | 10.0 | 29.0 | / | 5.0 | 4.0 | 3.14 |
| 44 | XD2 | 2069.0 | Shale | Longmaxi | LM1 | 63.0 | 2.0 | 4.0 | 23.0 | / | 4.0 | 4.0 | 3.32 |
| 45 | XD2 | 2069.3 | Shale | Longmaxi | LM1 | 53.0 | 2.0 | 6.0 | 30.0 | / | 6.0 | 3.0 | 3.16 |
| 46 | Y105 | 1688.9 | Shale | Longmaxi | LM1 | 48.0 | 2.0 | 4.0 | 31.0 | / | 7.0 | 8.0 | 6.03 |
| 47 | Y105 | 1689.3 | Shale | Longmaxi | LM1 | 71.0 | 4.0 | 7.0 | 12.0 | / | 3.0 | 3.0 | 4.21 |
| 48 | Y105 | 1689.8 | Shale | Longmaxi | LM1 | 69.0 | 3.0 | 10.0 | 12.0 | / | 3.0 | 3.0 | 4.97 |
| 49 | YH3–8 | 3782.2 | Shale | Longmaxi | LM1 | 56.0 | 8.0 | 15.0 | 14.0 | / | 4.0 | 3.0 | 4.76 |
| 50 | SH outcrop | / | Shale | Longmaxi | LM1 | 65.0 | 7.0 | 13.0 | 9.0 | / | 3.0 | 3.0 | 5.21 |
| 51 | SH outcrop | / | Shale | Longmaxi | LM1 | 73.0 | 4.0 | 5.0 | 10.0 | / | 6.0 | 2.0 | 7.11 |
| 52 | XD2 | 2069.5 | Shale | Guanyingqiao | WF4 | 36.0 | 29.0 | 18.0 | 13.0 | / | 2.00 | 2.00 | 2.34 |
| 53 | XD2 | 2069.6 | Shale | Guanyingqiao | WF4 | 25.0 | 27.0 | 18.0 | 17.0 | 1.0 | 7.00 | 5.00 | 2.40 |
| 54 | XD2 | 2069.7 | Shale | Guanyingqiao | WF4 | 25.0 | 32.0 | 18.0 | 16.0 | 1.0 | 3.00 | 5.00 | 1.97 |
| 55 | XD2 | 2069.9 | Shale | Guanyingqiao | WF4 | 22.0 | 32.0 | 17.0 | 17.0 | 1.0 | 5.00 | 6.00 | 2.26 |
| 56 | Y105 | 1690.2 | Shale | Guanyingqiao | WF4 | 24.0 | 34.0 | 15.0 | 19.0 | 1.0 | 4.00 | 3.00 | 2.18 |
| 57 | SH outcrop | / | Shale | Guanyingqiao | WF4 | 23.0 | 32.0 | 15.0 | 22.0 | 1.0 | 5.00 | 2.00 | 5.90 |
| 58 | YH3–8 | 3783.0 | Shale | Guanyingqiao | WF4 | 23.0 | 35.0 | 16.0 | 17.0 | 1.0 | 5.00 | 3.00 | 3.70 |
| 59 | YH3–8 | 3783.7 | Shale | Guanyingqiao | WF4 | 23.0 | 33.0 | 16.0 | 21.0 | 1.0 | 4.00 | 2.00 | 4.30 |
| 60 | Z204 | 3409.6 | Shale | Wufeng | WF2–3 | 50.0 | 26.0 | 10.0 | 13.0 | / | 1.00 | / | 4.20 |
| 61 | XD2 | 2070.3 | Shale | Wufeng | WF2–3 | 48.0 | 26.0 | 11.0 | 14.0 | / | 1.00 | / | 4.40 |
| 62 | XD2 | 2072.9 | Shale | Wufeng | WF2–3 | 34.0 | 21.0 | 17.0 | 23.0 | 1.00 | 3.00 | 1.00 | 3.90 |
| 63 | XD2 | 2075.6 | Shale | Wufeng | WF2–3 | 60.0 | 16.0 | 9.0 | 12.0 | / | 1.00 | 2.00 | 3.90 |
| 64 | XD2 | 2078.8 | Shale | Wufeng | WF2–3 | 58.0 | 18.0 | 9.0 | 12.0 | / | 1.00 | 2.00 | 3.10 |
| 65 | XD2 | 2080.6 | Shale | Wufeng | WF2–3 | 55.0 | 17.0 | 15.0 | 13.0 | / | / | / | 3.20 |
| 66 | XD2 | 2081.8 | Shale | Wufeng | WF2–3 | 50.0 | 19.0 | 15.0 | 12.0 | 1.00 | 1.00 | 2.00 | 3.10 |
| 67 | Y105 | 1690.5 | Shale | Wufeng | WF2–3 | 47.0 | 22.0 | 18.0 | 12.0 | / | 1.00 | / | 3.00 |
| 68 | Y105 | 1691.2 | Shale | Wufeng | WF2–3 | 51.0 | 22.0 | 11.0 | 15.0 | / | 1.00 | / | 3.50 |
| 69 | Y105 | 1691.5 | Shale | Wufeng | WF2–3 | 58.0 | 19.0 | 9.0 | 13.0 | / | / | 1.00 | 2.60 |
| 70 | Y105 | 1691.9 | Shale | Wufeng | WF2–3 | 41.0 | 23.0 | 16.0 | 16.0 | 1.00 | 1.00 | 2.00 | 4.60 |
| 71 | YH3–8 | 3784.5 | Shale | Wufeng | WF2–3 | 56.0 | 14.0 | 13.0 | 14.0 | / | 1.00 | 2.00 | 3.20 |
| 72 | YH3–8 | 3788.2 | Shale | Wufeng | WF2–3 | 37.0 | 19.0 | 26.0 | 14.0 | 1.00 | 1.00 | 2.00 | 4.10 |
| 73 | YH3–8 | 3791.5 | Shale | Wufeng | WF2–3 | 42.0 | 23.0 | 20.0 | 12.0 | 1.00 | 1.00 | 1.00 | 3.10 |
| 74 | YH3–8 | 3792.6 | Shale | Wufeng | WF2–3 | 42.0 | 24.0 | 19.0 | 13.0 | / | 1.00 | 1.00 | 3.40 |
| 75 | SH outcrop | / | Shale | Wufeng | WF2–3 | 47.0 | 23.0 | 16.0 | 12.0 | / | 1.00 | 1.00 | 3.00 |
| 76 | SH outcrop | / | Shale | Wufeng | WF2–3 | 42.0 | 25.0 | 19.0 | 13.0 | / | / | 1.00 | 2.80 |
| 77 | SH outcrop | / | Shale | Wufeng | WF2–3 | 33.0 | 28.0 | 16.0 | 21.0 | / | 1.00 | 1.00 | 3.70 |
| 78 | SH outcrop | / | Shale | Wufeng | WF2–3 | 40.0 | 20.0 | 26.0 | 13.0 | / | / | 1.00 | 4.00 |
| 79 | SH outcrop | / | Shale | Wufeng | WF2–3 | 37.0 | 20.0 | 27.0 | 12.0 | 1.00 | 1.00 | 2.00 | 3.60 |
| 80 | SH outcrop | / | Shale | Wufeng | WF2–3 | 33.0 | 19.0 | 34.0 | 12.0 | / | 1.00 | 1.00 | 3.30 |
| 81 | SH outcrop | / | Shale | Wufeng | WF2–3 | 27.0 | 24.0 | 35.0 | 10.0 | / | 2.00 | 2.00 | 2.50 |
| 82 | SH outcrop | / | Shale | Wufeng | WF2–3 | 30.0 | 25.0 | 35.0 | 10.0 | / | / | / | 2.40 |
| 83 | SH outcrop | / | Shale | Wufeng | WF2–3 | 25.0 | 27.0 | 34.0 | 12.0 | / | / | 2.00 | 2.50 |
| Average | 39.94 | 12.29 | 11.75 | 28.31 | 0.16 | 5.19 | 2.66 | 2.64 | |||||
| No. | Well | Depth | Lithology | Formation | Graptolite Zone | Sample No. | SiO2 | Al2O3 | CaO | Fe2O3T | K2O | MgO | MnO | Na2O | P2O5 | TiO2 | LOI | TOTAL | K2O/Na2O | SiO2/Al2O3 | CIA | ICV |
|---|---|---|---|---|---|---|---|---|---|---|---|---|---|---|---|---|---|---|---|---|---|---|
| 1 | Y105 | 1650.5 | Shale | Longmaxi | LM6 | Y105–1 | 57.36 | 15.83 | 3.93 | 5.52 | 3.98 | 2.96 | 0.03 | 0.71 | 0.10 | 0.73 | 8.62 | 99.77 | 5.61 | 3.62 | 70.40 | 1.18 |
| 2 | Y105 | 1655.1 | Shale | Longmaxi | LM6 | Y105–11 | 61.76 | 12.14 | 5.08 | 4.01 | 3.29 | 2.42 | 0.03 | 0.56 | 0.11 | 0.59 | 9.71 | 99.70 | 5.88 | 5.09 | 69.16 | 1.23 |
| 3 | Y105 | 1658.4 | Shale | Longmaxi | LM6 | Y105–18 | 58.30 | 11.93 | 6.88 | 4.47 | 3.25 | 2.41 | 0.04 | 0.54 | 0.13 | 0.61 | 11.10 | 99.66 | 6.02 | 4.89 | 69.23 | 1.27 |
| 4 | YH3–8 | 3742.4 | Shale | Longmaxi | LM6 | YH–1 | 60.52 | 15.81 | 2.16 | 5.37 | 3.75 | 2.57 | 0.03 | 0.78 | 0.10 | 0.55 | 8.28 | 99.91 | 4.81 | 3.83 | 70.44 | 1.10 |
| 5 | YH3–8 | 3744.4 | Shale | Longmaxi | LM6 | YH–10 | 59.86 | 15.42 | 2.51 | 5.34 | 3.86 | 2.67 | 0.03 | 0.76 | 0.11 | 0.57 | 8.79 | 99.92 | 5.08 | 3.88 | 69.74 | 1.15 |
| 6 | YH3–8 | 3746.9 | Shale | Longmaxi | LM6 | YH–30 | 60.41 | 15.17 | 2.38 | 5.28 | 3.77 | 2.64 | 0.03 | 0.69 | 0.10 | 0.52 | 8.58 | 99.57 | 5.46 | 3.98 | 70.46 | 1.13 |
| 7 | YH3–8 | 3747.3 | Shale | Longmaxi | LM6 | YH–33 | 59.45 | 16.38 | 2.18 | 5.54 | 3.97 | 2.77 | 0.03 | 0.72 | 0.10 | 0.55 | 8.28 | 99.98 | 5.51 | 3.63 | 71.04 | 1.10 |
| 8 | XD2 | 2052.5 | Shale | Longmaxi | LM5 | XD–B54 | 53.24 | 13.05 | 5.73 | 4.25 | 3.59 | 3.00 | 0.03 | 0.64 | 0.08 | 0.53 | 13.31 | 97.45 | 5.61 | 4.08 | 68.50 | 1.31 |
| 9 | XD2 | 2055.3 | Shale | Longmaxi | LM5 | XD–B50 | 41.93 | 8.70 | 14.61 | 3.15 | 2.52 | 5.31 | 0.07 | 0.36 | 0.08 | 0.40 | 21.22 | 98.35 | 7.00 | 4.82 | 68.94 | 2.31 |
| 10 | Y105 | 1664.1 | Shale | Longmaxi | LM5 | Y105–31 | 60.23 | 11.60 | 6.81 | 3.61 | 3.26 | 2.27 | 0.03 | 0.48 | 0.10 | 0.50 | 11.10 | 99.99 | 6.79 | 5.19 | 69.39 | 1.20 |
| 11 | Y105 | 1668.1 | Shale | Longmaxi | LM5 | Y105–40 | 55.73 | 10.10 | 8.43 | 5.00 | 2.76 | 3.19 | 0.07 | 0.47 | 0.13 | 0.54 | 13.40 | 99.82 | 5.87 | 5.52 | 68.98 | 1.65 |
| 12 | Y105 | 1673.1 | Shale | Longmaxi | LM5 | Y105–52 | 63.46 | 9.58 | 6.78 | 3.23 | 2.33 | 2.05 | 0.03 | 0.45 | 0.12 | 0.47 | 11.22 | 99.72 | 5.18 | 6.62 | 70.50 | 1.25 |
| 13 | YH3–8 | 3749.4 | Shale | Longmaxi | LM5 | YH–44 | 58.84 | 15.75 | 2.92 | 5.46 | 3.89 | 2.82 | 0.03 | 0.78 | 0.09 | 0.55 | 8.62 | 99.75 | 4.99 | 3.74 | 69.88 | 1.16 |
| 14 | YH3–8 | 3753.4 | Shale | Longmaxi | LM5 | YH–67 | 61.23 | 14.31 | 3.01 | 5.02 | 3.51 | 2.77 | 0.04 | 0.81 | 0.09 | 0.53 | 8.62 | 99.94 | 4.33 | 4.28 | 68.85 | 1.22 |
| 15 | YH3–8 | 3757.1 | Shale | Longmaxi | LM5 | YH–85 | 56.42 | 14.75 | 4.66 | 5.11 | 3.48 | 3.27 | 0.05 | 1.16 | 0.11 | 0.59 | 10.26 | 99.85 | 3.00 | 3.83 | 66.02 | 1.36 |
| 16 | YH3–8 | 3761.7 | Shale | Longmaxi | LM5 | YH–117 | 25.33 | 3.84 | 33.17 | 3.03 | 0.76 | 3.08 | 0.39 | 0.51 | 0.07 | 0.15 | 29.42 | 99.75 | 1.49 | 6.60 | 60.54 | 3.40 |
| 17 | YH3–8 | 3766.0 | Shale | Longmaxi | LM5 | YH–142 | 59.51 | 13.06 | 5.03 | 4.93 | 3.02 | 2.54 | 0.04 | 1.26 | 0.11 | 0.59 | 9.88 | 99.98 | 2.40 | 4.56 | 63.76 | 1.37 |
| 18 | Z204 | 3398.6 | Shale | Longmaxi | LM4 | Z4–23 | 62.41 | 18.43 | 0.83 | 6.62 | 4.98 | 2.93 | 0.06 | 0.31 | 0.10 | 0.64 | 1.28 | 98.60 | 15.83 | 3.39 | 74.09 | 1.03 |
| 19 | XD2 | 2058.6 | Shale | Longmaxi | LM4 | XD–B44 | 43.03 | 20.55 | 4.67 | 8.95 | 5.36 | 2.91 | 0.08 | 0.56 | 0.03 | 0.34 | 11.69 | 98.17 | 9.57 | 2.09 | 72.85 | 1.04 |
| 20 | XD2 | 2061.1 | Shale | Longmaxi | LM4 | XD–B41 | 41.49 | 5.44 | 18.85 | 1.97 | 1.58 | 5.19 | 0.05 | 0.26 | 0.05 | 0.26 | 23.36 | 98.50 | 6.08 | 7.63 | 67.92 | 3.21 |
| 21 | XD2 | 2062.6 | Shale | Longmaxi | LM4 | XD–B38 | 42.42 | 6.24 | 17.27 | 2.03 | 1.82 | 5.57 | 0.05 | 0.29 | 0.05 | 0.30 | 22.98 | 99.02 | 6.28 | 6.80 | 68.05 | 3.03 |
| 22 | Y105 | 1674.6 | Shale | Longmaxi | LM4 | Y105–58 | 60.26 | 12.14 | 6.02 | 3.75 | 3.03 | 2.41 | 0.03 | 0.52 | 0.11 | 0.54 | 11.14 | 99.95 | 5.83 | 4.96 | 70.83 | 1.18 |
| 23 | Y105 | 1676.3 | Shale | Longmaxi | LM4 | Y105–64 | 60.23 | 10.87 | 6.84 | 4.08 | 2.74 | 2.04 | 0.03 | 0.49 | 0.13 | 0.52 | 11.49 | 99.46 | 5.59 | 5.54 | 70.33 | 1.20 |
| 24 | Y105 | 1677.7 | Shale | Longmaxi | LM4 | Y105–69 | 60.54 | 10.28 | 7.15 | 4.22 | 2.56 | 2.03 | 0.03 | 0.48 | 0.13 | 0.51 | 11.67 | 99.60 | 5.33 | 5.89 | 70.23 | 1.26 |
| 25 | Y105 | 1679.5 | Shale | Longmaxi | LM4 | Y105–75 | 59.89 | 9.89 | 7.55 | 3.62 | 2.53 | 2.33 | 0.04 | 0.50 | 0.13 | 0.50 | 12.77 | 99.75 | 5.06 | 6.06 | 69.26 | 1.35 |
| 26 | Y105 | 1681.8 | Shale | Longmaxi | LM4 | Y105–82 | 61.83 | 10.69 | 6.10 | 3.68 | 2.76 | 2.07 | 0.03 | 0.49 | 0.12 | 0.51 | 11.99 | 100.27 | 5.63 | 5.78 | 69.88 | 1.21 |
| 27 | YH3–8 | 3769.8 | Shale | Longmaxi | LM4 | YH–169 | 67.83 | 9.98 | 2.31 | 4.83 | 2.38 | 1.74 | 0.03 | 0.59 | 0.10 | 0.36 | 9.81 | 99.95 | 4.03 | 6.80 | 68.81 | 1.26 |
| 28 | YH3–8 | 3773.7 | Shale | Longmaxi | LM4 | YH–190 | 66.41 | 9.17 | 3.60 | 3.97 | 2.15 | 1.81 | 0.03 | 0.59 | 0.15 | 0.35 | 11.65 | 99.88 | 3.64 | 7.24 | 68.21 | 1.30 |
| 29 | YH3–8 | 3775.8 | Shale | Longmaxi | LM4 | YH–202 | 72.10 | 7.47 | 3.05 | 2.74 | 1.70 | 1.37 | 0.03 | 0.50 | 0.06 | 0.26 | 10.59 | 99.87 | 3.40 | 9.65 | 68.16 | 1.22 |
| 30 | Z204 | 3406.8 | Shale | Longmaxi | LM2–3 | Z4–8 | 48.04 | 12.24 | 13.50 | 3.75 | 2.80 | 3.73 | 0.31 | 0.35 | 0.09 | 0.42 | 2.97 | 88.20 | 7.93 | 3.93 | 74.48 | 1.40 |
| 31 | XD2 | 2065.4 | Shale | Longmaxi | LM2–3 | XD–B35 | 39.90 | 5.43 | 21.80 | 1.81 | 1.62 | 3.73 | 0.06 | 0.24 | 0.05 | 0.25 | 23.84 | 98.73 | 6.75 | 7.35 | 68.07 | 2.51 |
| 32 | XD2 | 2067.8 | Shale | Longmaxi | LM2–3 | XD–B32 | 69.10 | 3.47 | 9.87 | 0.91 | 1.00 | 1.13 | 0.03 | 0.19 | 0.05 | 0.16 | 13.28 | 99.19 | 5.26 | 19.91 | 66.98 | 1.56 |
| 33 | Y105 | 1685.0 | Shale | Longmaxi | LM2–3 | Y105–92 | 57.51 | 9.64 | 7.43 | 3.69 | 2.46 | 2.51 | 0.04 | 0.51 | 0.13 | 0.49 | 13.86 | 98.27 | 4.82 | 5.97 | 68.92 | 1.43 |
| 34 | Y105 | 1687.0 | Shale | Longmaxi | LM2–3 | Y105–98 | 58.72 | 10.55 | 6.71 | 3.21 | 2.70 | 2.70 | 0.03 | 0.65 | 0.10 | 0.52 | 14.09 | 99.98 | 4.15 | 5.57 | 67.55 | 1.39 |
| 35 | Y105 | 1688.2 | Shale | Longmaxi | LM2–3 | Y105–102 | 50.30 | 8.68 | 11.00 | 3.27 | 2.17 | 3.97 | 0.06 | 0.60 | 0.11 | 0.46 | 19.05 | 99.67 | 3.62 | 5.79 | 66.72 | 1.98 |
| 36 | YH3–8 | 3779.1 | Shale | Longmaxi | LM2–3 | YH–226 | 65.69 | 8.47 | 4.71 | 3.96 | 2.00 | 1.81 | 0.03 | 0.56 | 0.09 | 0.33 | 11.86 | 99.51 | 3.57 | 7.76 | 67.85 | 1.37 |
| 37 | YH3–8 | 3781.0 | Shale | Longmaxi | LM2–3 | YH–236 | 66.22 | 5.02 | 9.07 | 2.34 | 1.06 | 2.63 | 0.07 | 0.37 | 0.10 | 0.18 | 12.57 | 99.63 | 2.86 | 13.19 | 67.95 | 2.17 |
| 38 | SH outcrop | / | Shale | Longmaxi | LM2–3 | SH11–9–1 | 60.24 | 5.56 | 10.43 | 1.80 | 1.49 | 3.23 | 0.03 | 0.36 | 0.08 | 0.28 | 16.24 | 99.74 | 4.14 | 10.83 | 66.50 | 2.26 |
| 39 | SH outcrop | / | Shale | Longmaxi | LM2–3 | SH11–1–2 | 57.50 | 5.45 | 11.72 | 1.74 | 1.39 | 3.80 | 0.03 | 0.27 | 0.07 | 0.26 | 17.64 | 42.37 | 5.15 | 10.55 | 69.46 | 2.49 |
| 40 | SH outcrop | / | Shale | Longmaxi | LM2–3 | SH10–8–1 | 57.38 | 5.09 | 14.28 | 2.00 | 1.29 | 1.98 | 0.03 | 0.37 | 0.11 | 0.24 | 17.14 | 42.53 | 3.49 | 11.27 | 66.04 | 1.83 |
| 41 | SH outcrop | / | Shale | Longmaxi | LM2–3 | SH9–23–2 | 57.15 | 4.80 | 14.76 | 1.58 | 1.25 | 2.04 | 0.03 | 0.40 | 0.08 | 0.23 | 17.51 | 42.68 | 3.13 | 11.91 | 64.24 | 1.92 |
| 42 | SH outcrop | / | Shale | Longmaxi | LM2–3 | SH9–15–1 | 69.29 | 4.30 | 9.09 | 1.28 | 1.11 | 1.68 | 0.02 | 0.22 | 0.07 | 0.20 | 13.19 | 31.16 | 5.05 | 16.11 | 69.04 | 1.70 |
| 43 | XD2 | 2068.5 | Shale | Longmaxi | LM1 | XD–B31 | 75.11 | 4.57 | 4.48 | 1.21 | 1.31 | 1.22 | 0.02 | 0.30 | 0.05 | 0.20 | 10.84 | 99.31 | 4.37 | 16.44 | 65.49 | 1.44 |
| 44 | XD2 | 2069.0 | Shale | Longmaxi | LM1 | XD–B30 | 68.41 | 5.98 | 5.53 | 1.91 | 1.74 | 1.68 | 0.02 | 0.41 | 0.10 | 0.27 | 13.18 | 99.23 | 4.24 | 11.44 | 64.88 | 1.52 |
| 45 | XD2 | 2069.3 | Shale | Longmaxi | LM1 | XD–B29 | 44.40 | 3.39 | 20.11 | 1.47 | 1.04 | 3.06 | 0.06 | 0.25 | 0.10 | 0.16 | 25.33 | 99.37 | 4.16 | 13.10 | 63.47 | 3.24 |
| 46 | Y105 | 1688.9 | Shale | Longmaxi | LM1 | Y105–104 | 56.62 | 8.04 | 9.71 | 3.57 | 2.06 | 2.47 | 0.04 | 0.62 | 0.10 | 0.44 | 15.92 | 99.59 | 3.32 | 7.04 | 65.28 | 1.68 |
| 47 | Y105 | 1689.3 | Shale | Longmaxi | LM1 | Y105–106 | 60.75 | 7.20 | 8.04 | 4.02 | 1.82 | 2.28 | 0.04 | 0.59 | 0.11 | 0.40 | 14.40 | 99.65 | 3.08 | 8.44 | 64.77 | 1.79 |
| 48 | Y105 | 1689.8 | Shale | Longmaxi | LM1 | Y105–108 | 62.95 | 7.66 | 5.08 | 2.84 | 1.98 | 2.48 | 0.04 | 0.62 | 0.09 | 0.45 | 15.46 | 99.65 | 3.19 | 8.22 | 64.65 | 1.69 |
| 49 | YH3–8 | 3782.2 | Shale | Longmaxi | LM1 | YH–242 | 66.53 | 5.93 | 7.06 | 3.42 | 1.42 | 2.27 | 0.04 | 0.46 | 0.07 | 0.25 | 12.13 | 99.58 | 3.09 | 11.22 | 66.00 | 1.92 |
| 50 | SH outcrop | / | Shale | Longmaxi | LM1 | SH8–12–1 | 76.22 | 4.35 | 2.42 | 1.39 | 1.13 | 1.19 | 0.01 | 0.10 | 0.12 | 0.21 | 12.74 | 99.88 | 11.30 | 17.52 | 73.66 | 1.32 |
| 51 | SH outcrop | / | Shale | Longmaxi | LM1 | SH8–10–1 | 75.89 | 4.67 | 2.15 | 1.45 | 1.22 | 1.26 | 0.01 | 0.21 | 0.11 | 0.23 | 12.59 | 99.79 | 5.81 | 16.25 | 69.86 | 1.38 |
| 52 | XD2 | 2069.5 | Shale | Guanyingqiao | WF4 | XD–B28 | 50.43 | 6.88 | 16.74 | 1.72 | 2.01 | 2.31 | 0.06 | 0.48 | 0.10 | 0.35 | 17.69 | 98.77 | 4.19 | 7.33 | 64.66 | 1.64 |
| 53 | XD2 | 2069.6 | Shale | Guanyingqiao | WF4 | XD–B27 | 44.73 | 6.15 | 18.26 | 3.99 | 1.81 | 2.61 | 0.07 | 0.52 | 0.14 | 0.32 | 18.70 | 97.30 | 3.48 | 7.27 | 62.60 | 2.18 |
| 54 | XD2 | 2069.7 | Shale | Guanyingqiao | WF4 | XD–B26 | 57.88 | 8.88 | 2.28 | 13.82 | 2.61 | 0.91 | 0.06 | 1.07 | 0.94 | 0.49 | 9.53 | 98.47 | 2.44 | 6.52 | 58.30 | 2.05 |
| 55 | XD2 | 2069.9 | Shale | Guanyingqiao | WF4 | XD–B24 | 58.11 | 9.36 | 4.94 | 9.21 | 2.74 | 1.33 | 0.06 | 1.07 | 0.30 | 0.50 | 10.32 | 97.94 | 2.56 | 6.21 | 59.04 | 1.76 |
| 56 | Y105 | 1690.2 | Shale | Guanyingqiao | WF4 | Y105–109 | 53.82 | 6.68 | 14.72 | 3.26 | 1.70 | 1.61 | 0.07 | 0.50 | 0.15 | 0.38 | 16.82 | 99.71 | 3.40 | 8.06 | 65.68 | 1.54 |
| 57 | SH outcrop | / | Shale | Guanyingqiao | WF4 | SH7–4–1 | 42.89 | 7.26 | 20.46 | 3.75 | 1.91 | 3.00 | 0.09 | 0.55 | 0.12 | 0.36 | 19.52 | 99.91 | 3.47 | 5.91 | 65.16 | 2.00 |
| 58 | YH3–8 | 3783.0 | Shale | Guanyingqiao | WF4 | YH–247 | 42.59 | 9.83 | 12.54 | 4.61 | 2.46 | 6.02 | 0.10 | 0.67 | 0.10 | 0.42 | 20.16 | 99.50 | 3.67 | 4.33 | 66.85 | 2.43 |
| 59 | YH3–8 | 3783.7 | Shale | Guanyingqiao | WF4 | YH–250 | 61.80 | 9.29 | 7.44 | 3.13 | 2.29 | 2.24 | 0.04 | 0.49 | 0.12 | 0.34 | 12.76 | 99.94 | 4.67 | 6.65 | 69.39 | 1.32 |
| 60 | Z204 | 3409.6 | Shale | Wufeng | WF2–3 | Z4–1 | 35.25 | 12.22 | 20.41 | 3.53 | 3.05 | 2.64 | 0.48 | 0.33 | 0.82 | 0.37 | 5.57 | 84.67 | 9.17 | 2.89 | 73.47 | 1.19 |
| 61 | XD2 | 2070.3 | Shale | Wufeng | WF2–3 | XD–B22 | 44.14 | 14.39 | 12.25 | 1.96 | 4.12 | 3.70 | 0.03 | 0.63 | 0.09 | 0.35 | 17.40 | 99.06 | 6.54 | 3.07 | 68.74 | 1.23 |
| 62 | XD2 | 2072.9 | Shale | Wufeng | WF2–3 | XD–B19 | 51.57 | 6.05 | 17.55 | 1.41 | 1.46 | 2.15 | 0.07 | 0.21 | 0.05 | 0.22 | 18.66 | 99.40 | 6.95 | 8.52 | 72.67 | 1.49 |
| 63 | XD2 | 2075.6 | Shale | Wufeng | WF2–3 | XD–B15 | 36.01 | 7.10 | 21.78 | 5.37 | 2.11 | 3.12 | 0.13 | 0.24 | 0.14 | 0.52 | 21.41 | 97.93 | 8.79 | 5.07 | 69.75 | 2.16 |
| 64 | XD2 | 2078.8 | Shale | Wufeng | WF2–3 | XD–B10 | 57.67 | 8.97 | 9.42 | 2.13 | 2.73 | 3.08 | 0.07 | 0.34 | 0.07 | 0.43 | 14.05 | 98.96 | 8.03 | 6.43 | 68.73 | 1.55 |
| 65 | XD2 | 2080.6 | Shale | Wufeng | WF2–3 | XD–B6 | 42.59 | 12.86 | 14.87 | 2.88 | 3.58 | 3.53 | 0.11 | 0.41 | 0.65 | 0.43 | 16.27 | 98.18 | 8.73 | 3.31 | 71.07 | 1.30 |
| 66 | XD2 | 2081.8 | Shale | Wufeng | WF2–3 | XD–B2 | 43.63 | 13.55 | 13.84 | 2.91 | 3.98 | 3.89 | 0.09 | 0.67 | 0.05 | 0.65 | 15.31 | 98.57 | 5.94 | 3.22 | 67.50 | 1.42 |
| 67 | Y105 | 1690.5 | Shale | Wufeng | WF2–3 | Y105–110 | 31.02 | 1.95 | 31.19 | 1.65 | 0.51 | 1.68 | 0.11 | 0.41 | 0.03 | 0.11 | 30.92 | 99.58 | 1.24 | 15.91 | 50.62 | 3.86 |
| 68 | Y105 | 1691.2 | Shale | Wufeng | WF2–3 | Y105–112 | 54.67 | 6.77 | 11.63 | 2.88 | 1.78 | 2.29 | 0.04 | 0.41 | 0.11 | 0.37 | 19.14 | 100.09 | 4.34 | 8.08 | 67.36 | 1.70 |
| 69 | Y105 | 1691.5 | Shale | Wufeng | WF2–3 | Y105–113 | 52.49 | 7.60 | 9.86 | 2.91 | 2.06 | 3.71 | 0.07 | 0.35 | 0.09 | 0.42 | 20.08 | 99.64 | 5.89 | 6.91 | 69.17 | 2.02 |
| 70 | Y105 | 1691.9 | Shale | Wufeng | WF2–3 | Y105–G1 | 60.54 | 11.88 | 2.29 | 3.66 | 3.30 | 3.00 | 0.03 | 0.46 | 0.14 | 0.64 | 13.96 | 99.90 | 7.17 | 5.10 | 69.99 | 1.34 |
| 71 | YH3–8 | 3784.5 | Shale | Wufeng | WF2–3 | YH–255 | 71.70 | 8.22 | 2.36 | 2.91 | 1.89 | 1.75 | 0.03 | 0.48 | 0.10 | 0.31 | 10.05 | 99.80 | 3.94 | 8.72 | 69.37 | 1.26 |
| 72 | YH3–8 | 3788.2 | Shale | Wufeng | WF2–3 | YH–270 | 50.25 | 10.66 | 10.91 | 4.69 | 2.83 | 4.27 | 0.22 | 0.59 | 0.29 | 0.49 | 14.70 | 99.90 | 4.80 | 4.71 | 68.02 | 1.86 |
| 73 | YH3–8 | 3791.5 | Shale | Wufeng | WF2–3 | YH–288 | 63.89 | 12.03 | 5.06 | 4.44 | 2.97 | 2.36 | 0.09 | 0.69 | 0.06 | 0.53 | 7.76 | 99.87 | 4.30 | 5.31 | 68.65 | 1.26 |
| 74 | YH3–8 | 3792.6 | Shale | Wufeng | WF2–3 | YH–295 | 20.56 | 4.85 | 30.95 | 2.05 | 1.02 | 1.18 | 0.18 | 0.39 | 0.05 | 0.22 | 38.55 | 99.98 | 2.62 | 4.24 | 66.99 | 1.49 |
| 75 | SH outcrop | / | Shale | Wufeng | WF2–3 | SH6–7–2 | 54.25 | 8.44 | 12.35 | 2.99 | 2.14 | 2.31 | 0.04 | 0.75 | 0.18 | 0.46 | 16.11 | 100.02 | 2.85 | 6.43 | 63.80 | 1.57 |
| 76 | SH outcrop | / | Shale | Wufeng | WF2–3 | SH6–3–1 | 59.61 | 9.25 | 8.47 | 2.27 | 2.33 | 2.07 | 0.03 | 0.52 | 0.16 | 0.46 | 14.70 | 99.87 | 4.48 | 6.44 | 68.57 | 1.25 |
| 77 | SH outcrop | / | Shale | Wufeng | WF2–3 | SH5–33–2 | 39.58 | 4.57 | 20.60 | 2.78 | 1.21 | 3.91 | 0.06 | 0.34 | 0.13 | 0.23 | 26.66 | 100.07 | 3.56 | 8.66 | 65.27 | 3.18 |
| 78 | SH outcrop | / | Shale | Wufeng | WF2–3 | SH5–30–2 | 52.08 | 3.89 | 17.48 | 1.51 | 1.03 | 2.16 | 0.06 | 0.19 | 0.10 | 0.18 | 21.41 | 100.09 | 5.42 | 13.39 | 69.06 | 2.19 |
| 79 | SH outcrop | / | Shale | Wufeng | WF2–3 | SH5–26–2 | 57.34 | 3.82 | 15.63 | 1.37 | 1.06 | 1.70 | 0.05 | 0.18 | 0.08 | 0.18 | 18.45 | 99.86 | 5.89 | 15.01 | 68.67 | 1.90 |
| 80 | SH outcrop | / | Shale | Wufeng | WF2–3 | SH5–20–1 | 60.96 | 3.82 | 14.01 | 1.28 | 1.05 | 1.45 | 0.04 | 0.23 | 0.08 | 0.18 | 16.74 | 99.84 | 4.57 | 15.96 | 66.83 | 1.75 |
| 81 | SH outcrop | / | Shale | Wufeng | WF2–3 | SH4–32–1 | 78.69 | 4.44 | 3.61 | 1.42 | 1.24 | 1.16 | 0.02 | 0.11 | 0.07 | 0.22 | 9.01 | 99.99 | 11.27 | 17.72 | 72.22 | 1.32 |
| 82 | SH outcrop | / | Shale | Wufeng | WF2–3 | SH4–24–1 | 67.52 | 3.23 | 11.11 | 1.41 | 0.88 | 1.97 | 0.05 | 0.17 | 0.05 | 0.15 | 13.62 | 100.16 | 5.18 | 20.90 | 68.08 | 2.38 |
| 83 | SH outcrop | / | Shale | Wufeng | WF2–3 | SH4–16–1 | 63.13 | 4.02 | 11.31 | 1.55 | 1.15 | 2.71 | 0.05 | 0.12 | 0.06 | 0.19 | 15.45 | 99.74 | 9.58 | 15.70 | 70.99 | 2.45 |
| Average | 56.11 | 8.89 | 10.07 | 3.46 | 2.31 | 2.60 | 0.06 | 0.49 | 0.13 | 0.39 | 14.68 | 96.27 | 5.22 | 7.88 | 67.87 | 1.70 | ||||||
| PAAS | 62.8 | 18.80 | 1.29 | 6.50 | 3.68 | 2.19 | 0.11 | 1.19 | 0.16 | 0.99 | / | / | / | / | / | / | ||||||
| NASC | 64.8 | 16.90 | 3.63 | / | 3.97 | 2.86 | 0.06 | 1.14 | / | 0.70 | / | / | / | / | / | / | ||||||
Publisher’s Note: MDPI stays neutral with regard to jurisdictional claims in published maps and institutional affiliations. |
© 2022 by the authors. Licensee MDPI, Basel, Switzerland. This article is an open access article distributed under the terms and conditions of the Creative Commons Attribution (CC BY) license (https://creativecommons.org/licenses/by/4.0/).
Share and Cite
Shi, Z.; Zhao, S.; Zhou, T.; Ding, L.; Sun, S.; Cheng, F. Mineralogy and Geochemistry of the Upper Ordovician and Lower Silurian Wufeng-Longmaxi Shale on the Yangtze Platform, South China: Implications for Provenance Analysis and Shale Gas Sweet-Spot Interval. Minerals 2022, 12, 1190. https://doi.org/10.3390/min12101190
Shi Z, Zhao S, Zhou T, Ding L, Sun S, Cheng F. Mineralogy and Geochemistry of the Upper Ordovician and Lower Silurian Wufeng-Longmaxi Shale on the Yangtze Platform, South China: Implications for Provenance Analysis and Shale Gas Sweet-Spot Interval. Minerals. 2022; 12(10):1190. https://doi.org/10.3390/min12101190
Chicago/Turabian StyleShi, Zhensheng, Shengxian Zhao, Tianqi Zhou, Lihua Ding, Shasha Sun, and Feng Cheng. 2022. "Mineralogy and Geochemistry of the Upper Ordovician and Lower Silurian Wufeng-Longmaxi Shale on the Yangtze Platform, South China: Implications for Provenance Analysis and Shale Gas Sweet-Spot Interval" Minerals 12, no. 10: 1190. https://doi.org/10.3390/min12101190