
In Situ X-ray Diffraction at High Temperatures: Formation of Ca2SiO4 and Ternesite in Recycled Autoclaved Aerated Concrete

Institute for Technical Chemistry, Karlsruhe Institute of Technology, 76344 Karlsruhe, Germany
*
Author to whom correspondence should be addressed.
Minerals 2021, 11(8), 789; https://doi.org/10.3390/min11080789
Submission received: 17 May 2021
/
Revised: 7 July 2021
/
Accepted: 16 July 2021
/
Published: 21 July 2021
(This article belongs to the Special Issue Cement Related Minerals—in Memory of Herbert Pöllmann)
Abstract
:This study provides an insight into possible recycling processes for autoclaved aerated concrete (AAC) at low temperatures (<1000 °C). Belite binders were synthesized from wastes of AAC by the addition of CaCO3 and adaption of the molar CaO/SiO2 (C/S ratio) in the range of 2 to 2.5. An in situ XRD study performed during heating up to 1000 °C and subsequent quenching to room temperature evidenced the formation of ternesite besides C2S in sulfate-containing systems. Several factors influencing the reaction kinetics and the evolution of the phase composition were investigated thoroughly. Increased sulfate content and dwelling time during heating increase the ternesite content and promote the formation of highly crystalline α’H-C2S. The C/S-ratio of the starting materials has to be adjusted to the sulfate content in order to prevent the formation of ternesite at the expense of C2S. Ternesite remains stable during quenching to room temperature or even increases in amount, except in cases of very low cooling rates or high residual quartz contents (C/S-ratio ≤ 2). Temperature and range of α’H-C2S to β-C2S phase transition on quenching strongly depend on the cooling rate. The onset temperature for β-C2S formation varies between 540 °C (slow quench) and 450 °C (fast quench). Thermal expansion coefficients of ternesite are calculated showing similarity with C2S. The incorporation of CaSO4 modules in the structure switches the direction of maximum compression.
1. Introduction
Chemical recycling of cementitious wastes, i.e., their use as secondary raw materials for the production of C2S-based (C2S = Ca2SiO4 according to the Cement nomenclature, i.e., C = CaO, S = SiO2, = SO3, H = H2O) binders, is a promising approach to reduce the environmental impact of the cement industry in several aspects. Firstly, cement production is at a very high level, with increasing usage. In 2018, 3.99 Gt cement were produced from primary raw materials SiO2 and CaCO3 [1]. As a result, the CO2 emissions from the cement industry amount to 8% of the global CO2 emissions [2]. These emissions include the “process emissions”, due to the calcination of CaCO3, and the “energy emissions” from the firing process at 1450 °C. Secondly, even though the wastes from mineralogical building materials have a high recycling rate, the recycling possibilities are limited essentially to the production of aggregates that are only suitable for addition, e.g., in asphalt production. There is hardly any application for the fines and the use of recycled material as secondary raw materials for the production of a high-quality recycling product to replace the binder is still demanding. In particular, autoclaved aerated concrete (AAC) has a comparably low recycling rate. For example, German production of ACC in 2016 was 2.5 Mt [3], and the recycling rate was less than 40%.
The recirculation of these wastes in the production of C2S-cements not only saves primary raw materials but also saves energy and reduces the CO2 emissions in the production process. C2S dominated cement types contain less calcium than ordinary Portland cement (OPC). Compared to the main binding phase in OPC which is C3S (alite), the synthesis of C2S (belite) reduces the CO2 “process emissions” by 12%. Additionally, C2S crystallizes kinetically faster at much lower temperatures, which opens up the possibility to produce a recycled cement at low firing temperatures of 800–1200 °C.
Belite rich cement types have been studied for more than three decades [4,5,6]. However, the hydraulic reactivity of belite is comparably slow and it does not contribute significantly to strength in the first 28 days of hydration. Due to the low mechanical strength of belite clinkers at early ages, numerous studies focus on the activation of C2S. One approach is the stabilization of highly reactive modifications of C2S for example by synthesis of α’H-C2S at low annealing temperatures and long residence times [7], doping with alkaline oxides [8] or hydraulic activation with sulfate anions [9]. Another approach is to bridge the slow strength development of C2S by adding fast-reacting phases like ye’elimite (Ca4Al6O12(SO4)) or ternesite (Ca5(SiO4)2SO4). Calciumsulfoaluminate (CSA) cements based on the reactivity of ye’elimite were investigated since about 1960 and even achieved industrial application in China [10]. To improve the technology, particularly its need for high purity raw materials with its associated costs, the application of belite-calciumsulfoaluminate (CSAB, [11]) cement was investigated up to the industrial kiln trial level. The cement contains belite as the main phase and ye’elimite to achieve early strength. Simultaneously, cementitious properties for ternesite have been proven [12]. In the presence of aluminum hydroxide, ternesite forms ettringite, AFm phases like strätlingite and C-S-H. Therewith, belite-calciumsulfoaluminate-ternesite (BCT) technology was developed as a new low-carbon-emission clinker processing possibility [13,14,15,16]. However, these clinkers are still produced at relatively high temperatures above 1200 °C compared to the fact that ternesite and C2S formation take place at 930 °C [17] and 600 °C, respectively, in chemically recycled cementitious materials [18].
With the use of AAC as a raw material for the synthesis of a C2S binder at temperatures below 1000 °C, sulfate reaction enables the formation of ternesite besides C2S. AAC usually contains CaSO4 added for achieving an initial strength of the green body and, further, recycled AAC contains additional CaSO4 due to inevitable contamination with masonry. Therefore, no addition of sulfate to the raw material feed is required. In the calcination process, ternesite fixes the sulfur oxides released by the reaction of anhydrite and quartz to calcium silicates, which starts at temperatures of about 900 °C, depending on the quartz content [19]. Such C2S binders from wastes of AAC could be directly recirculated in the hydrothermal process of AAC production or they could be used as feedstock for hydrothermal based binders, e.g., Celitement [20,21,22,23].
The ternesite structure, as well as the formation and hydration characteristics of phases in the CaO-SiO2-CaSO4 system, were subject to several studies [24,25,26,27]. Ternesite, a calcium-silicate-sulfate is isostructural with silicocarnotite [28,29] and is built up of isolated SiO4 and SO4 tetrahedra connected via calcium atoms that are 6- or 7-fold coordinated. Ternesite can accommodate various chemical partners in its structure and is stable under a wide range of thermal conditions. High-temperature investigations by in situ Raman spectroscopy proved the transformation of natural ternesite to the high-temperature polymorph of dicalcium silicate between 730 °C and 1120 °C [17]. In the system CaO, SiO2, and CaSO4 ternesite formation was observed at 930 °C. The phase transition to C2S took place at higher temperatures between 1020 °C and 1100 °C where ternesite and C2S coexist. This study also includes a semi-quantitative analysis of the phase contents. However, quantitative data from Raman spectroscopy is strongly influenced by factors like the crystal orientation, grain sizes, and the temperature dependence of peak positions and widths. Whereas hyperspectral Raman imaging provides high-resolved information about the crystal growths and lateral phase distribution, exact quantification is restrained due to these factors and due to the small sample volume probed (100 μm × 100 μm).
In the present study, sample mixtures of autoclaved aerated concrete with CaCO3 were heated to 950–1000 °C. The reactions were monitored in situ by X-ray diffraction. This allows the determination of the quantitative crystalline phase content, crystallite sizes, and lattice parameters during the high-temperature-solid state reactions. Linear thermal expansion coefficients for ternesite were calculated. In addition, the influence of heating and cooling rate, as well as the effect of changes in C/S-ratio on the growth and stability of C2S and ternesite, was investigated.
2. Materials and Methods
2.1. Raw Material Analysis
Four samples of industrial waste materials with different sulfate contents were chosen for the high-temperature experiments. Three samples were demolition wastes from the solid waste management company Otto Dörner (secondary material SM(D1,D2,D3)) and one sample was residue from the production process of autoclaved aerated concrete provided by Xella (SM(P)). All raw material samples were dried at 260 °C. Chemical analyses were performed by X-ray fluorescence analysis (XRF) (AXS S8 Tiger, Bruker, Mannheim, Germany). Two beads per sample were prepared by mixing sample material 200 mg and 400 mg, respectively, with 6 g Li-borate salt. These mixtures were melted in a Claisse M4 fluxer. Due to different concentration in the samples two calibration curves according to the concentration range of the samples were prepared. Eight calibration beads per calibration curve were produced by mixing and melting ultraclean substances, mainly oxides, with Li-borate salt.
The quantitative phase content of the raw materials was determined by X-ray diffraction. Approximately 1.2 g of the samples were measured using an Empyrean diffractometer (Malvern-PANalytical, Almelo, Netherlands) equipped with a multistrip PIXcel3D detector (255 channels, simultaneously covering 3.347° 2θ), CuKα-radiation, and Bragg-Brentano optics. Measurements were conducted in the range of 5° to 120° 2θ with slits of 0.125°, Soller slits of 0.04 rad (2.3°) and sample spinning. Kβ-radiation was eliminated by Bragg-Brentano HD optics. Phase identification was performed with the software packages Highscore-Plus V. 4.9 (PANalytical) and Diffrac-Plus (Bruker-AXS, Karlsruhe, Germany) using PDF 2004 (ICDD) and COD 2019 databases. Bulk quantitative phase analyses of the four samples mixed with an internal standard (20 wt.% α-Al2O3) were performed with the Rietveld method following the fundamental parameters approach implemented in TOPAS V4.2 (Bruker-AXS) to determine crystalline and amorphous contents. The structure models and additional parameters used for the Rietveld refinement are listed in the Supplementary Material Table S1.
For comparison, thermal analysis (TA) was performed in Al2O3 crucibles from ambient temperature to 1400 °C with a heating rate of 10 °C per minute under nitrogen flux (DSC-TG; STA 449 F3 Jupiter, Netzsch, Selb, Hanau, Germany).
2.2. High-Temperature XRD
For the in situ experiments up to 1000 °C the Empyrean diffractometer (see Section 2.1) was equipped with a high-temperature chamber HTK1200N (Anton Paar). The raw material samples SM(P) and SM(D1,D2,D3) were homogenized with CaCO3 (Merck) to receive a C/S-ratio of 2 for the starting mixtures (P, D1, D2 and D3). For comparison of different C/S-ratios, another sample was prepared with SM(D3) and CaCO3 in a C/S-ratio of 2.5 (D3_2.5). Since the reaction rate of sulfates depends strongly on the sample composition, crystallinity, and heating rate, all phases were assumed to be potentially reactive at 1000 °C. Specific surface area (SSA) was measured at the raw material mixtures using a Quantachrome Nova 4000e (Quantachrome Instruments, Boynton Beach, FL, USA) with Nitrogen as probe and liquid nitrogen as coolant. All samples were dried under vacuum at 105 °C prior to analysis. Subsequently, fitting was performed according to the BET theory [30]. Surface areas are 6.5, 5.8, 6.2, and 7.2 m2/g for the samples P, D1, D2, and D3, respectively.
Approximately 0.2 g of the sample was compressed in an aluminum oxide sample holder. After measurement of the starting mixture at 25 °C (4–70° 2θ in 18 min), all samples were heated to 550 °C with 50 °C/min. The highest possible heating rate was chosen in our standard experiments (step50) to keep comparability with the rotary kilns that would be used for large-scale recycling. Between 550 °C and 1000 °C, the heating rate is 50 °C/4 min. Powder patterns were recorded every 50 °C (20–50° 2θ in 9 min). After 20 min dwell time at 1000 °C and one measurement (5–70° 2θ in 18 min) the cooling process to room temperature was monitored accordingly. Since the high-temperature chamber is only cooled by water, the quench rate decelerates with lower temperatures (20 min for 100–50 °C). Another experiment with a lower heating rate was conducted on sample D3 (step10). After heating to 150 °C in 22 min, the heating rate was reduced to 50 °C/7 min and data were collected every 50 °C (20–50° 2θ in 9 min). Between 600 °C and 950 °C, the heating rate was decelerated once more to 50 °C/10 min and data were collected every 10 °C (5–70° 2θ in 18 min). After a dwell time of 4 days at 950 °C, the cooling process to 150 °C was monitored in 10 °C steps accordingly.
Quantitative contents of the crystalline phases were refined by the Rietveld method (see Section 2.1) at every temperature step that was measured in the in situ experiments. Since there is no sample spinning possible in the high-temperature experiments texture and orientation effects have to be accounted for. The effects of preferred orientation are included by expanding the orientation distribution in spherical harmonics (4th order) for α’H-C2S, quartz, wollastonite, ternesite, and anhydrite. As the quantitative result for β-C2S is strongly influenced by the correction of preferred orientation, it was included in the refinement only in the case of phase contents > 40 wt.%. For the high-temperature experiments, no standard was added to avoid reactions of the sample with Al2O3. In order to determine the amorphous content of the synthesized products, additional XRD measurements with standard were performed at room temperature under the same conditions as described for the starting materials.
3. Results
3.1. Raw Material Composition
The results from chemical analyses are presented in Table 1. The sulfate content of the individual samples varies between 1 and 11 wt.% with the highest values for SM(D2) and SM(D3). Amounts of SiO2 vary between 43 and 56 wt.% and for CaO between 25 and 31 wt.%, respectively. The molar C/S-ratio ranges from 0.47 to 0.68.
Table 2 shows the results from Rietveld refinements. All samples contain the crystalline phases 11 Å tobermorite, quartz, calcite, vaterite, aragonite, feldspars, and the sulfates bassanite and anhydrite. Corresponding to XRF and thermal analysis data the highest sulfate contents were observed for samples SM(D2) and SM(D3). The amorphous contents according to the XRD data vary between 52 and 65 wt.%. The amorphous component consists essentially of the binding phase C-S-H, but also contains low-crystalline carbonate and sulfates.
Selected weight losses determined by thermal analysis are given in Table 3. The weight loss between 30 °C and 950 °C and the weight loss between 830 °C and 1400 °C correlate with the loss of ignition (LoI) and the sulfate content, respectively. Discrepancies between LoI and TA results are due to differences in the heating rates. The content of amorphous CaCO3 and CaSO4 was calculated from the difference between thermal analysis and CO2 and SO3 in crystalline phases determined by XRD. Large amounts of amorphous carbonate were found in the waste materials, whereas amorphous sulfate increases with the total sulfate content. The residual amorphous phase varies between 35 and 59 wt.% and can be ascribed to the C-S-H binding phase.
3.2. Qualitative Phase Contents In Situ at 1000 °C and 25 °C after Heating Experiments
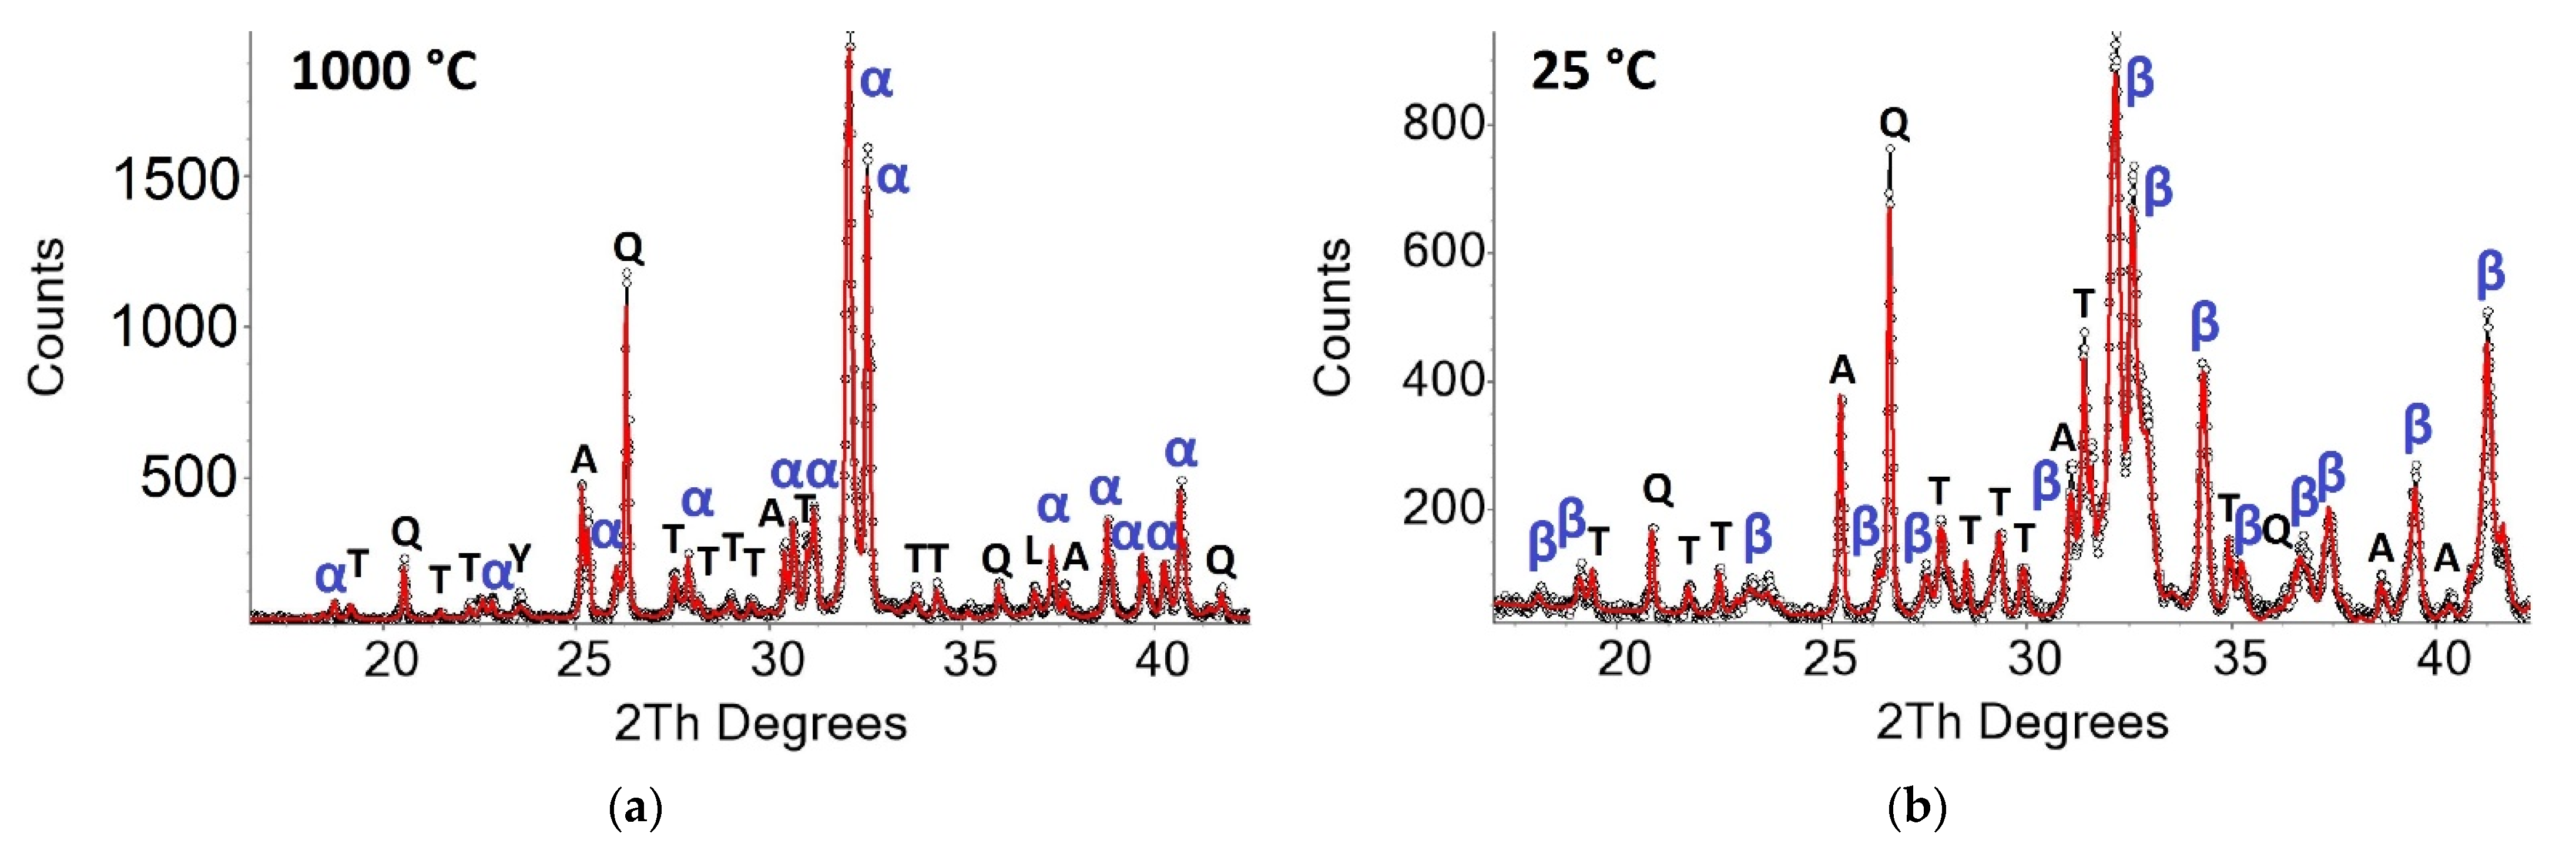
Figure 1 shows the powder patterns of sample D3 at 1000 °C and 25 °C after the heating experiment (step50). The measurement at 1000 °C proves the formation of C2S. According to the literature [31,32,33], the formation of x- or α’L-structure of C2S (P21/a) was expected at 1000 °C. However, the split-model structure of α’H-C2S fits the observed intensities much better. Since the use of low-crystalline calcium silicate hydrate, instead of clinker raw materials, promotes the formation of α’H-C2S at lower temperatures [7], this structure was used in the refinements. It consists of two distinct domains with a space group P21/a, which are interconnected by a mirror plane orthogonal to b [34]. The high sulfate content of sample D3 results in residual amounts of anhydrite besides ternesite. In addition, minor residues of raw materials like quartz and lime were observed. The sample is almost free of ye`elimite (phase content < 2 wt.% in all samples). Comparison to the powder pattern measured at 25 °C shows the appearance of a characteristic β-C2S peak at 34.4° 2θ proving the transformation of α’H-C2S into β-C2S during cooling [35].
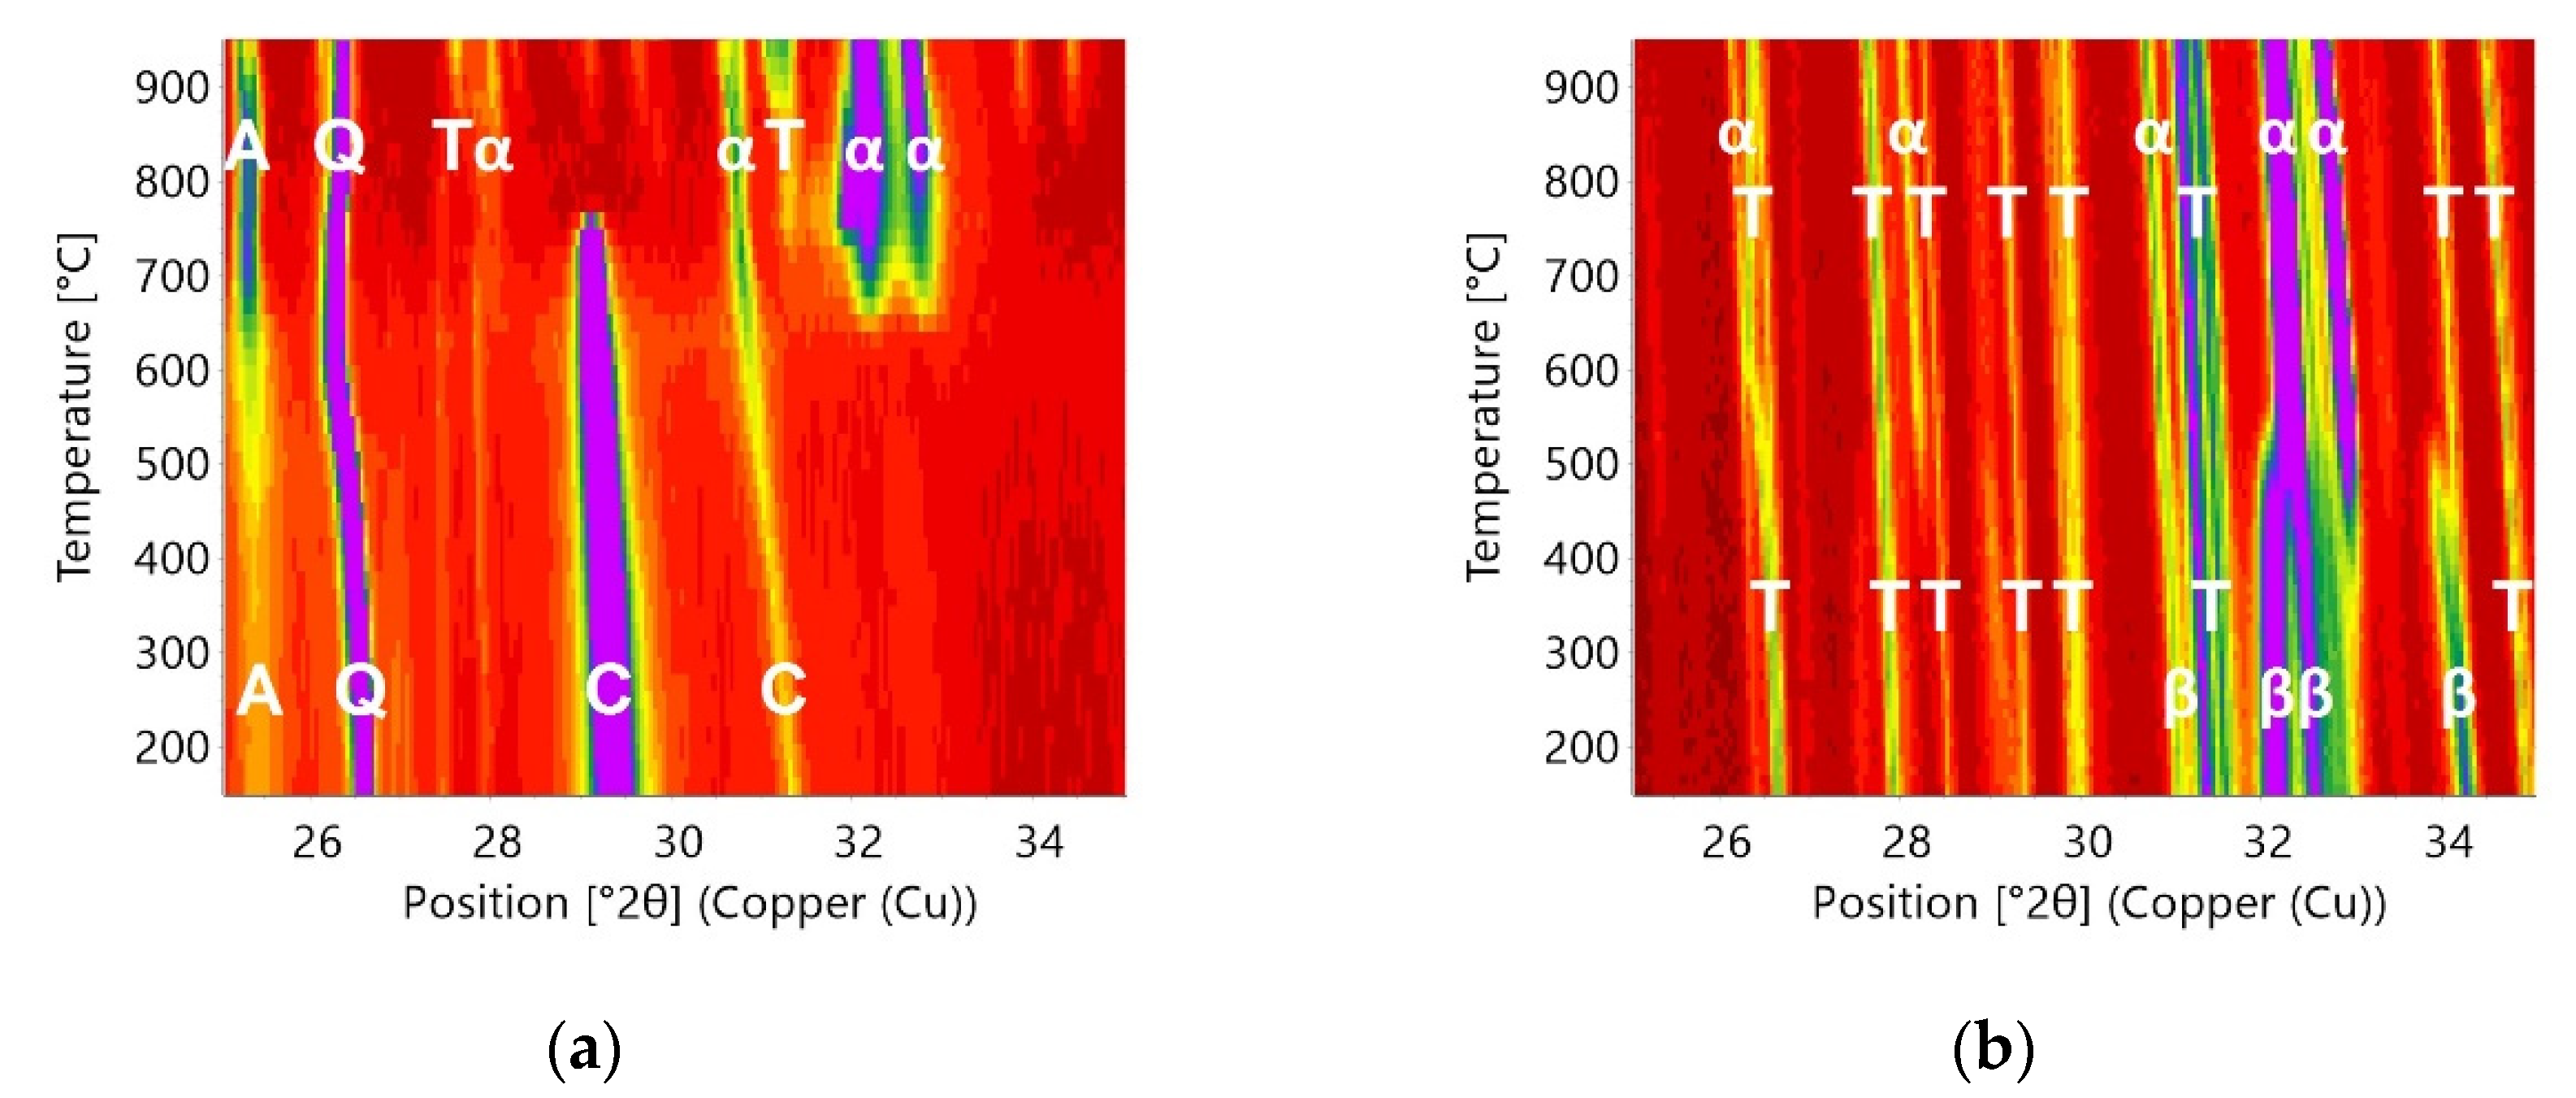
Figure 2 depicts the variation in peak intensities and positions with temperature (step10) and reveals the formation of low-crystalline α’H-C2S around 700 °C. At temperatures above 850 °C ternesite formation starts and C2S emerges as high-crystalline α’H-C2S. During cooling of the sample from 1000 °C to room temperature, there is no change in the ternesite peak intensities visible. Between 400 °C and 350 °C, the appearance of the peak at 34° 2θ denotes the beginning of the transformation from α’H-C2S to β-C2S.
3.3. In Situ Measurements during Heating
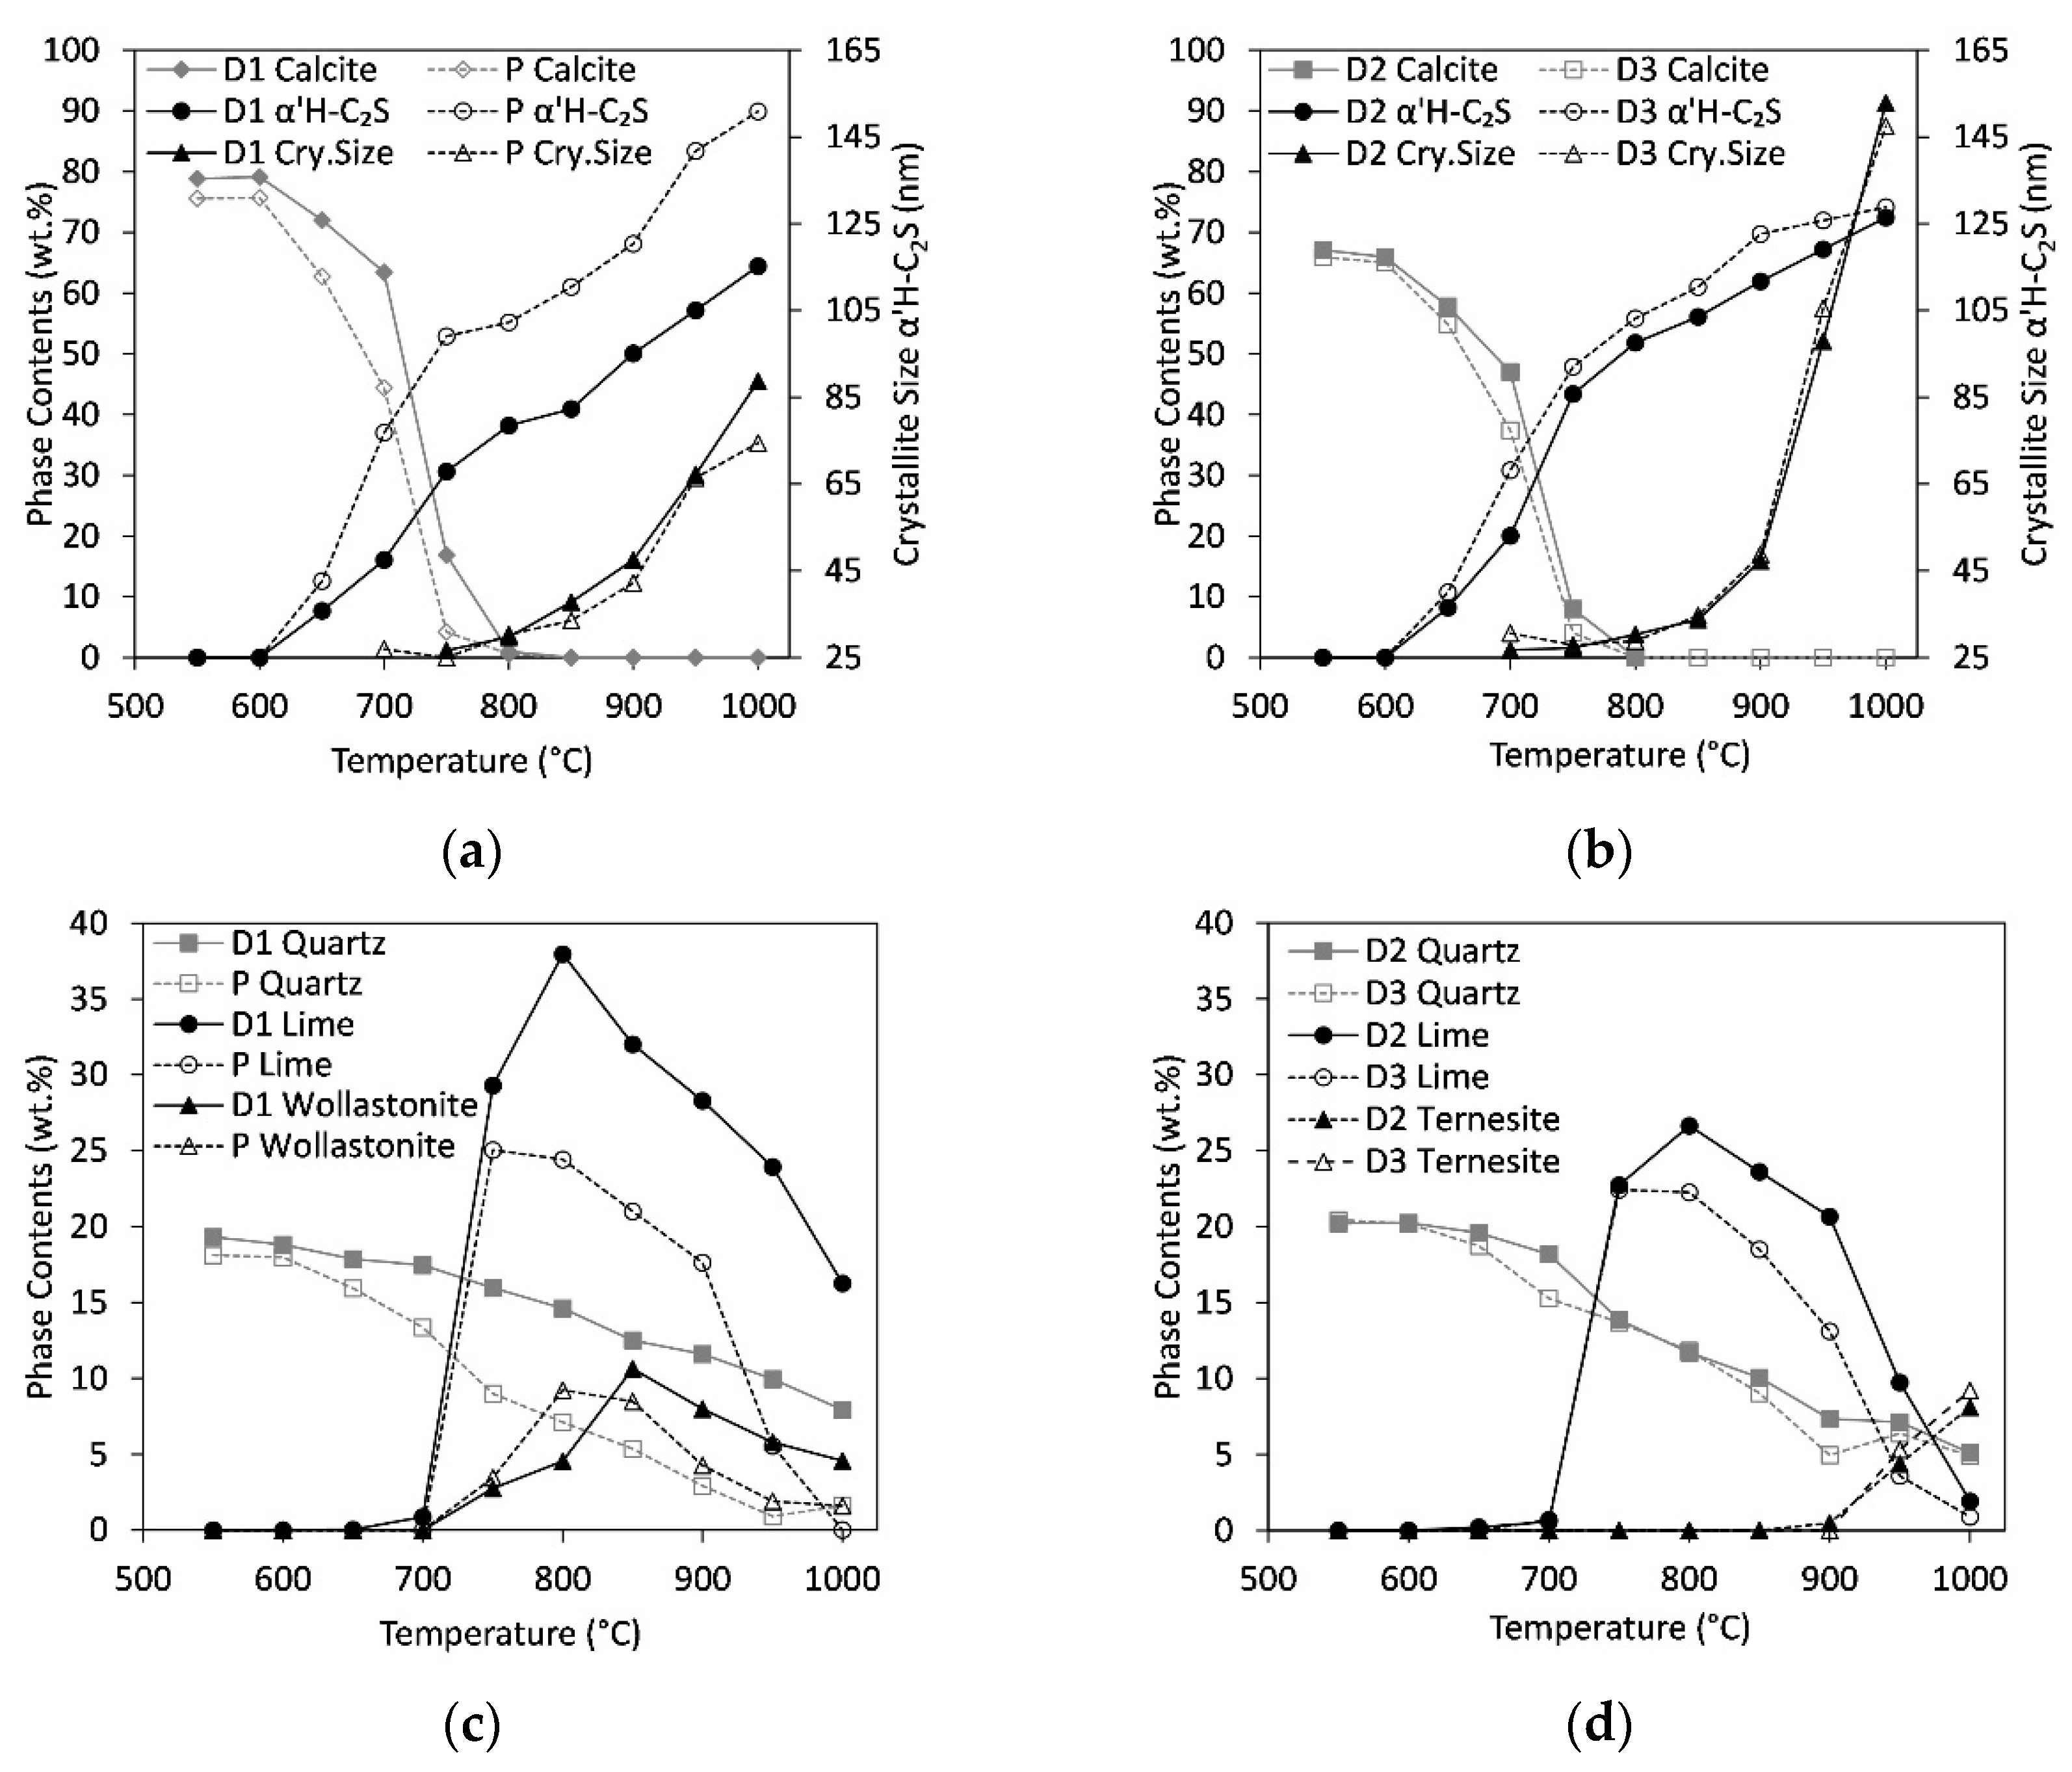
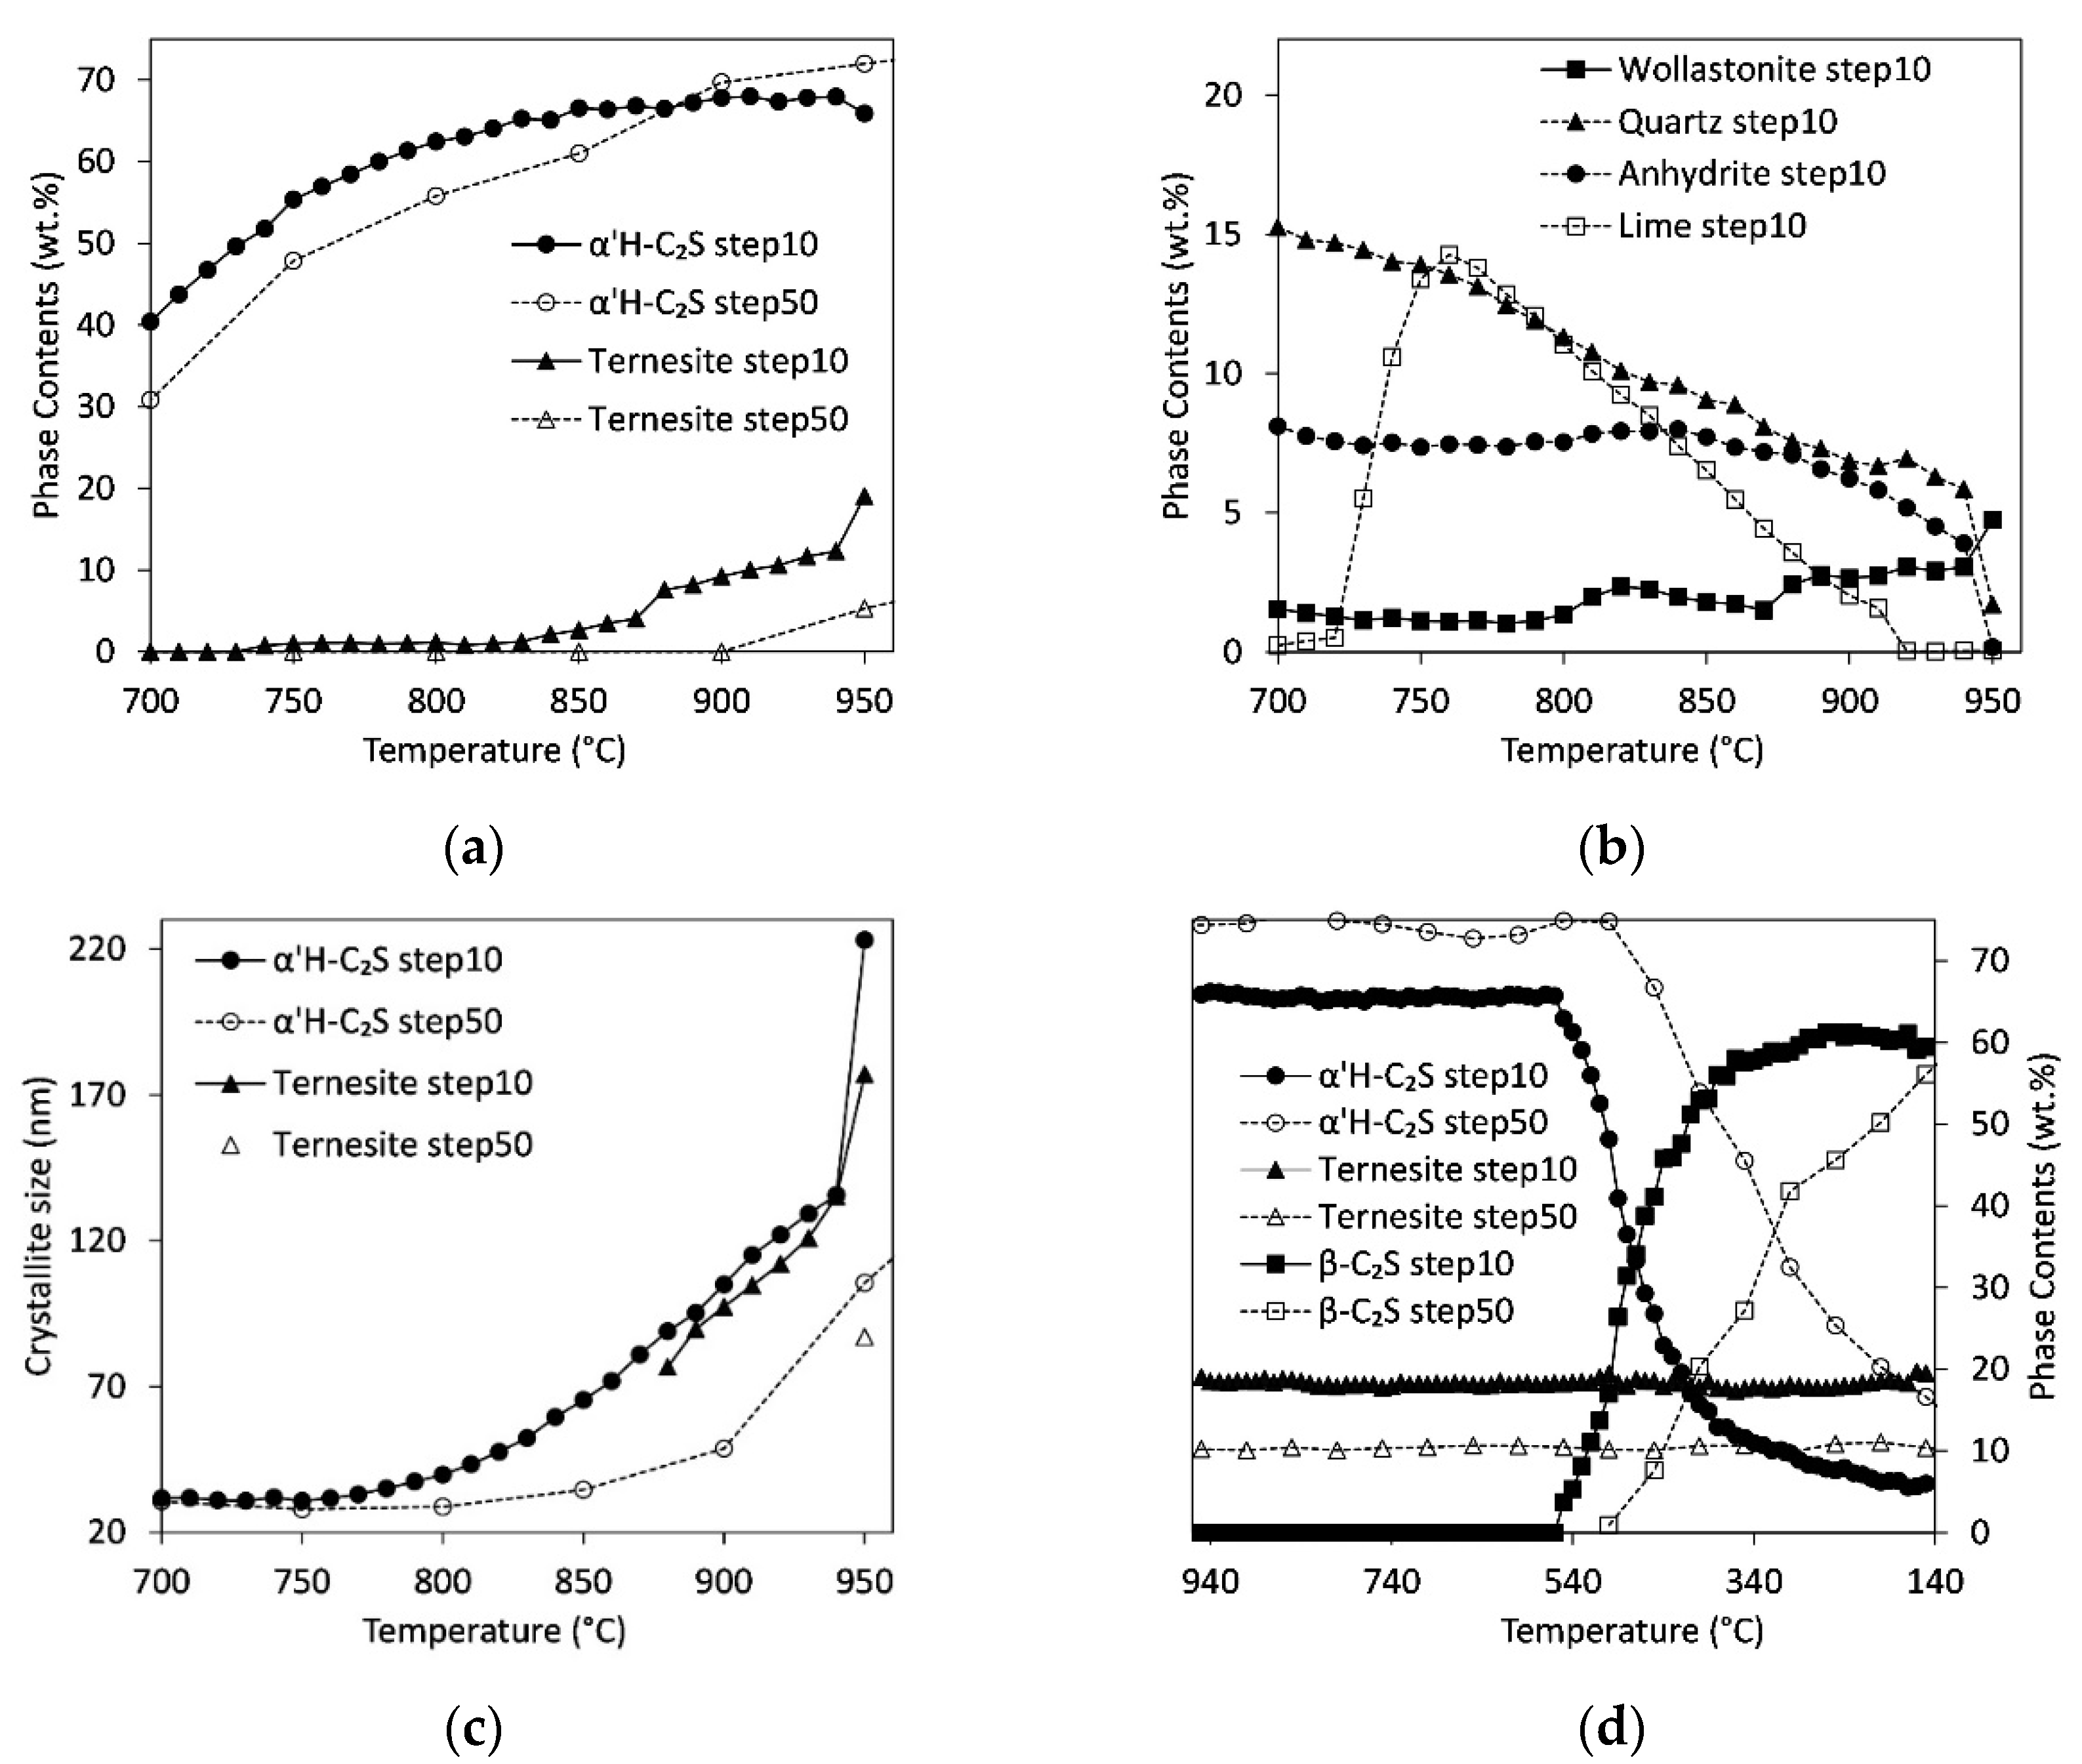
Variations of selected phase contents and crystallite sizes as a function of temperature are shown in Figure 3. Selected quantitative results from Rietveld refinements are summarized in Table 4 (detailed data in steps of 100 °C is listed in the Supplementary Material Table S2). All samples show a decrease in calcite content accompanied by first signs of C2S formation starting at 650 °C (Figure 3a,b). At 800 °C there is almost no calcite left. The slowest decrease in calcite content was observed for sample D1. In all samples, the C2S content increases between 650 °C and 1000 °C. However, between 650 °C and 900 °C, the crystallite sizes calculated by Rietveld, i.e., the sizes of the coherent scattering domains of C2S are below 50 nm. This confirms the growth of C2S with extremely low crystallinity at the beginning and implies the risk of overestimation. The formation of the crystalline structure of α’H-C2S is not observed unequivocally before 950 °C. The highest content in α’H-C2S of almost 90 wt.% was found for sample P followed by samples D2 and D3 with contents around 73% at 1000 °C. The low-sulfate sample D1 shows the lowest value of 64%. Comparison between the crystallite sizes of α’H-C2S at 1000 °C indicates high values of about 150 nm for the high sulfate samples, D2 and D3, and values below 100 nm for samples with lower sulfate content, P and D1.
Figure 3c depicts the variation of quartz, lime, and wollastonite contents for samples P and D1. The sulfate contents are low in these samples resulting in lower amounts of anhydrite and ternesite, respectively (<4 wt.%). Whereas the content of quartz decreases continuously, both lime and wollastonite form between 750 °C and 800 °C. Comparison to Figure 3a reveals the coincidence of this range with a deceleration of the α’H-C2S formation. In particular, sample D1 shows high lime and wollastonite contents of 40 wt.% and 10 wt.% at 800 °C, respectively. In the three samples P, D2, and D3 (Figure 3d) only about 25 wt.% lime is formed, and samples D2 and D3 show almost no wollastonite (<3 wt.% in the whole temperature range). At temperatures above 800 °C, both lime and wollastonite decompose to form C2S. In accordance with their higher sulfate content, samples D2 and D3 contain anhydrite and ternesite at 950 °C. The anhydrite content decreases from 10 wt.% at 550 °C to 7 and 5 wt.% at 1000 °C in samples D2 and D3, respectively. Hence, only a part of the Ca-sulfate has transformed to ternesite. Maximum ternesite contents are 8 and 9 wt.% in D2 and D3, respectively.
3.4. In Situ Measurements during Cooling
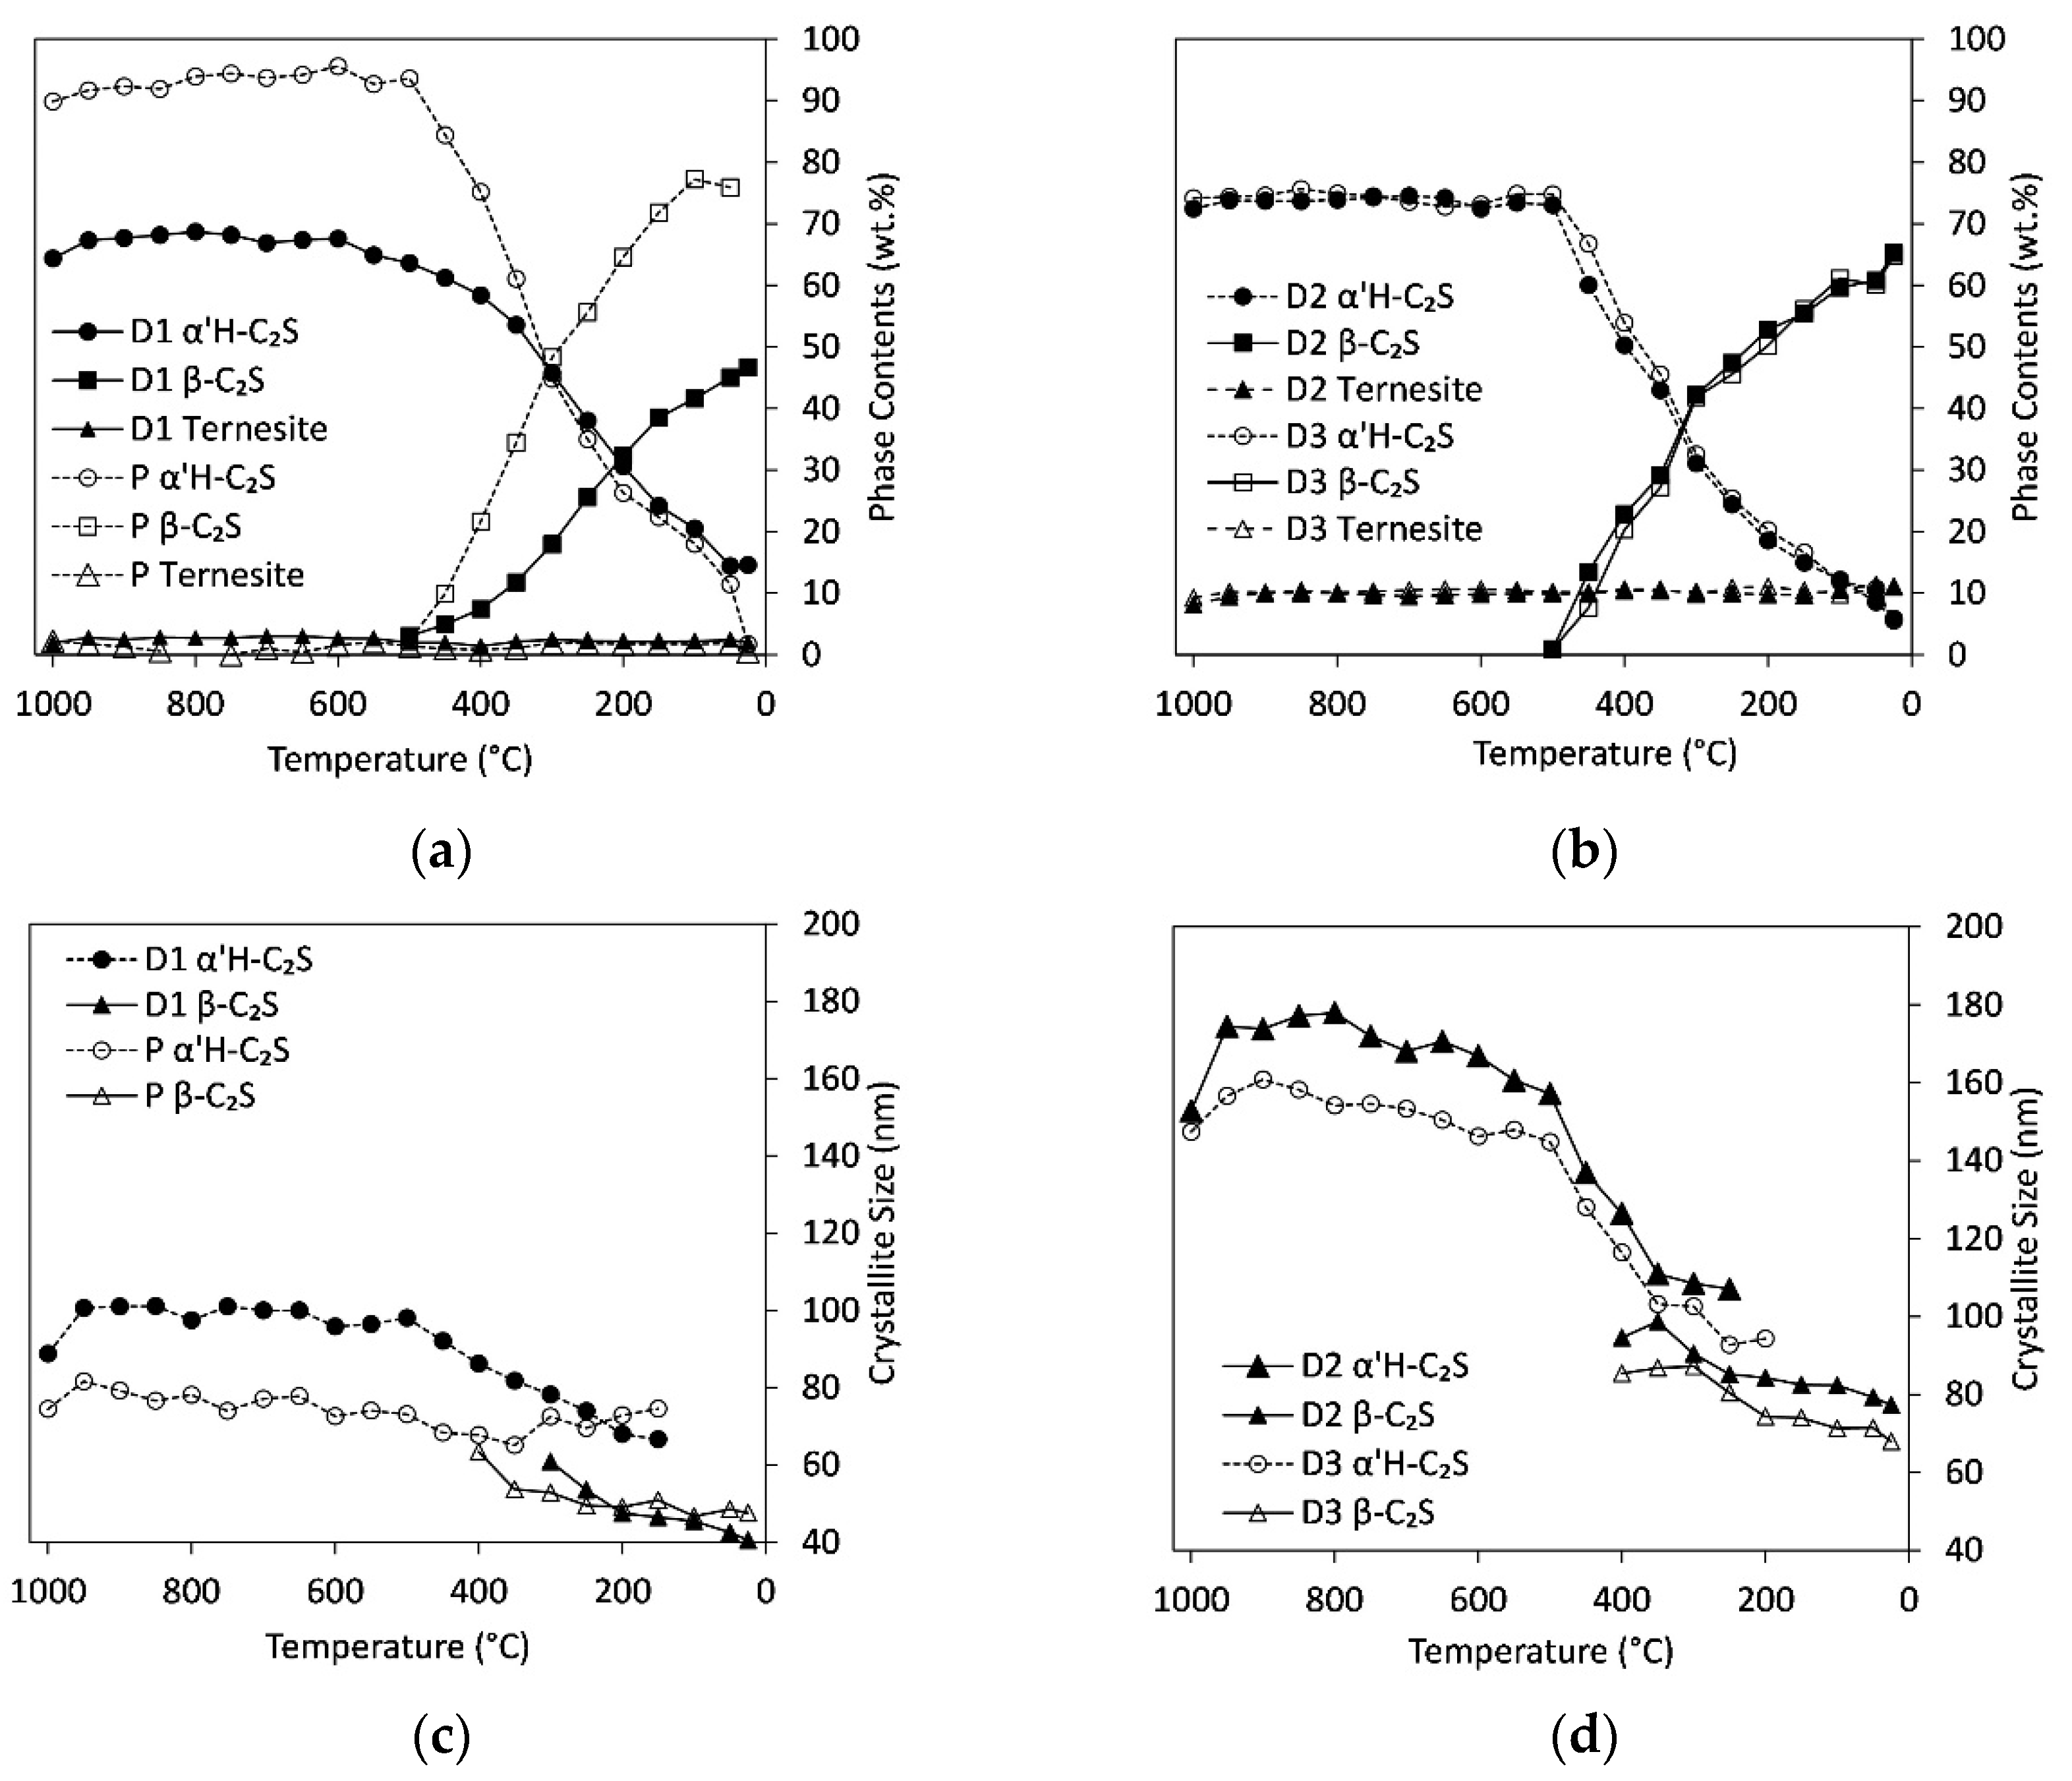
Figure 4a,b show the variation in phase content of ternesite and C2S during cooling from 1000 °C to room temperature. The ternesite content shows no variation in the whole temperature range whereas the content of α’H-C2S starts to decrease at 450 °C. Simultaneously the formation of β-C2S starts. Between 300 °C and 350 °C, the contents of α’H-C2S and β-C2S are similar in all samples followed by a further increase in β-C2S content towards room temperature where there are only minor amounts of α’H-C2S left.
As observed during heating, the crystallite sizes of α’H-C2S are much smaller in the sulfate-poor samples P and D1 (Figure 4c,d). Between 1000 °C and 500 °C the values range around 76, 98, 168, and 152 nm for P, D1, D2, and D3, respectively. At 500 °C low crystalline β-C2S starts to form, therewith the crystallite sizes of α’H-C2S in D1, D2 and D3 start to decrease and approach the ones of β-C2S that are below 60 and 100 nm for D1 and D2/D3, respectively. There is a further decrease in crystallinity of β-C2S towards room temperature, which results in crystallite sizes below 50 nm for P and D1 and below 80 nm for D2 and D3.
The results from comparative measurements with added standard at room temperature (Table 4; (P,D1,D2,D3)Std) show that the amorphous content varies from 0 wt.% in (P)Std and (D3)Std to about 10 wt.% in sample (D1)Std. The phase contents differ in some aspects from the in situ measurements. The content of α’H-C2S is much smaller in all standard measurements. In addition, there are minor non-systematic differences in β-C2S, anhydrite, quartz, ternesite, and wollastonite contents in individual samples. These deviations can be ascribed to different aspects. First of all, due to the low crystallinity of β-C2S differentiation between amorphous and C2S is not unambiguous. Secondly, the sample was removed from the sample holder and was ground with the standard prior to the second measurement. Therefore, sample inhomogeneities could account for differences in measurements. Finally, since all samples show lower contents in α’H-C2S in the second measurement, further conversion of α’H- to β-C2S during repeated XRD measurement is conceivable.
3.5. Influence of Heating Rate/Residence Time
Figure 5a shows a comparison between C2S and ternesite formation in sample D3 during low and high heating rates. The sample was measured every 10 °C and 20 min (step10) and every 50 °C and 12 min (step50), respectively. Whereas the influence of the heating rate on the phase content of α’H-C2S is small, it has a strong impact on the formation of ternesite. At a low heating rate, ternesite starts to form at 850 °C instead of 950 °C as observed with a high heating rate. In addition, the total amount of ternesite is much higher. The sample measured at 940 °C with a low heating rate already contains more than 10 wt.% ternesite. After a residence time of 4 days at 950 °C, the sample contains almost 20 wt.% ternesite. However, this growth is at the expense of α’H-C2S. Whereas between 700 °C and 850 °C the content in α’H-C2S is slightly higher in the samples heated with the low heating rate the formation of ternesite consumes calcium at temperatures exceeding 850 °C and less α’H-C2S is found in these samples. Instead of α’H-C2S, calcium-poor phases like wollastonite (Figure 5b) and åkermanite-gehlenite (Table 4) are formed. The raw materials, quartz, anhydrite, calcite/lime are consumed almost completely. Although the contents of α’H-C2S show only a minor response to the heating rate, the crystal sizes shown in Figure 5c indicate that there is an influence of the heating rate on the α’H-C2S-formation. A high heating rate produces low-crystalline α’H-C2S with crystallite sizes below 50 nm up to temperatures of 900 °C. With the low heating rate, crystallites are larger than 100 nm at these temperatures. Crystallite sizes of ternesite show similar high-temperature behavior as these of α’H-C2S at temperatures above 880 °C although the values are slightly smaller. Below 880 °C (step10) and below 950 °C (step50) the phase contents of ternesite range below 5 wt.% and, therefore, the crystallite sizes were restrained to the minimum of 50 nm.
The changes in phase contents of C2S and ternesite during fast and slow cooling are shown in Figure 5d. As observed in the previous experiments, there is no change in the ternesite amount with temperature decrease down to 150 °C. However, in contrast to all other experiments the room temperature measurement after slow heating and cooling (Table 4) shows a drop in ternesite content between 150 °C and 25 °C where ternesite reacts with small amounts of residual quartz to β-C2S. The phase transition from α’H-C2S to β-C2S depends on the cooling rate. It starts at 550 °C for the sample cooled slowly, compared to 470 °C for the rapidly cooled sample, respectively. At 470 °C, the slowly cooled sample already shows almost equal contents of α’H-C2S and β-C2S. At 150 °C the contents of β-C2S are similar in both samples, but the content of residual α’H-C2S decreases with decreasing cooling rate.
3.6. Increase in C/S-Ratio
Since ternesite formation consumes calcium and silicon in a ratio higher than 2, its formation promotes phases with low C/S-ratio at the expense of C2S-phases. Therefore, another experiment with a C/S = 2.5 (high heating rate) was performed in order to investigate if an increase in C/S would lead to higher contents in C2S besides ternesite (Table 4). Whereas the ternesite content at 1000 °C is slightly higher compared to the sample with C/S = 2 (high heating rate), the content of α’H-C2S is significantly lower. Instead, this sample contains with 7 wt.% a large amount of unreacted lime. During cooling to room temperature, even more ternesite forms at the expense of C2S. This underlines the importance of the sulfate content as a limiting factor for ternesite and C2S formation.
3.7. Lattice Parameters
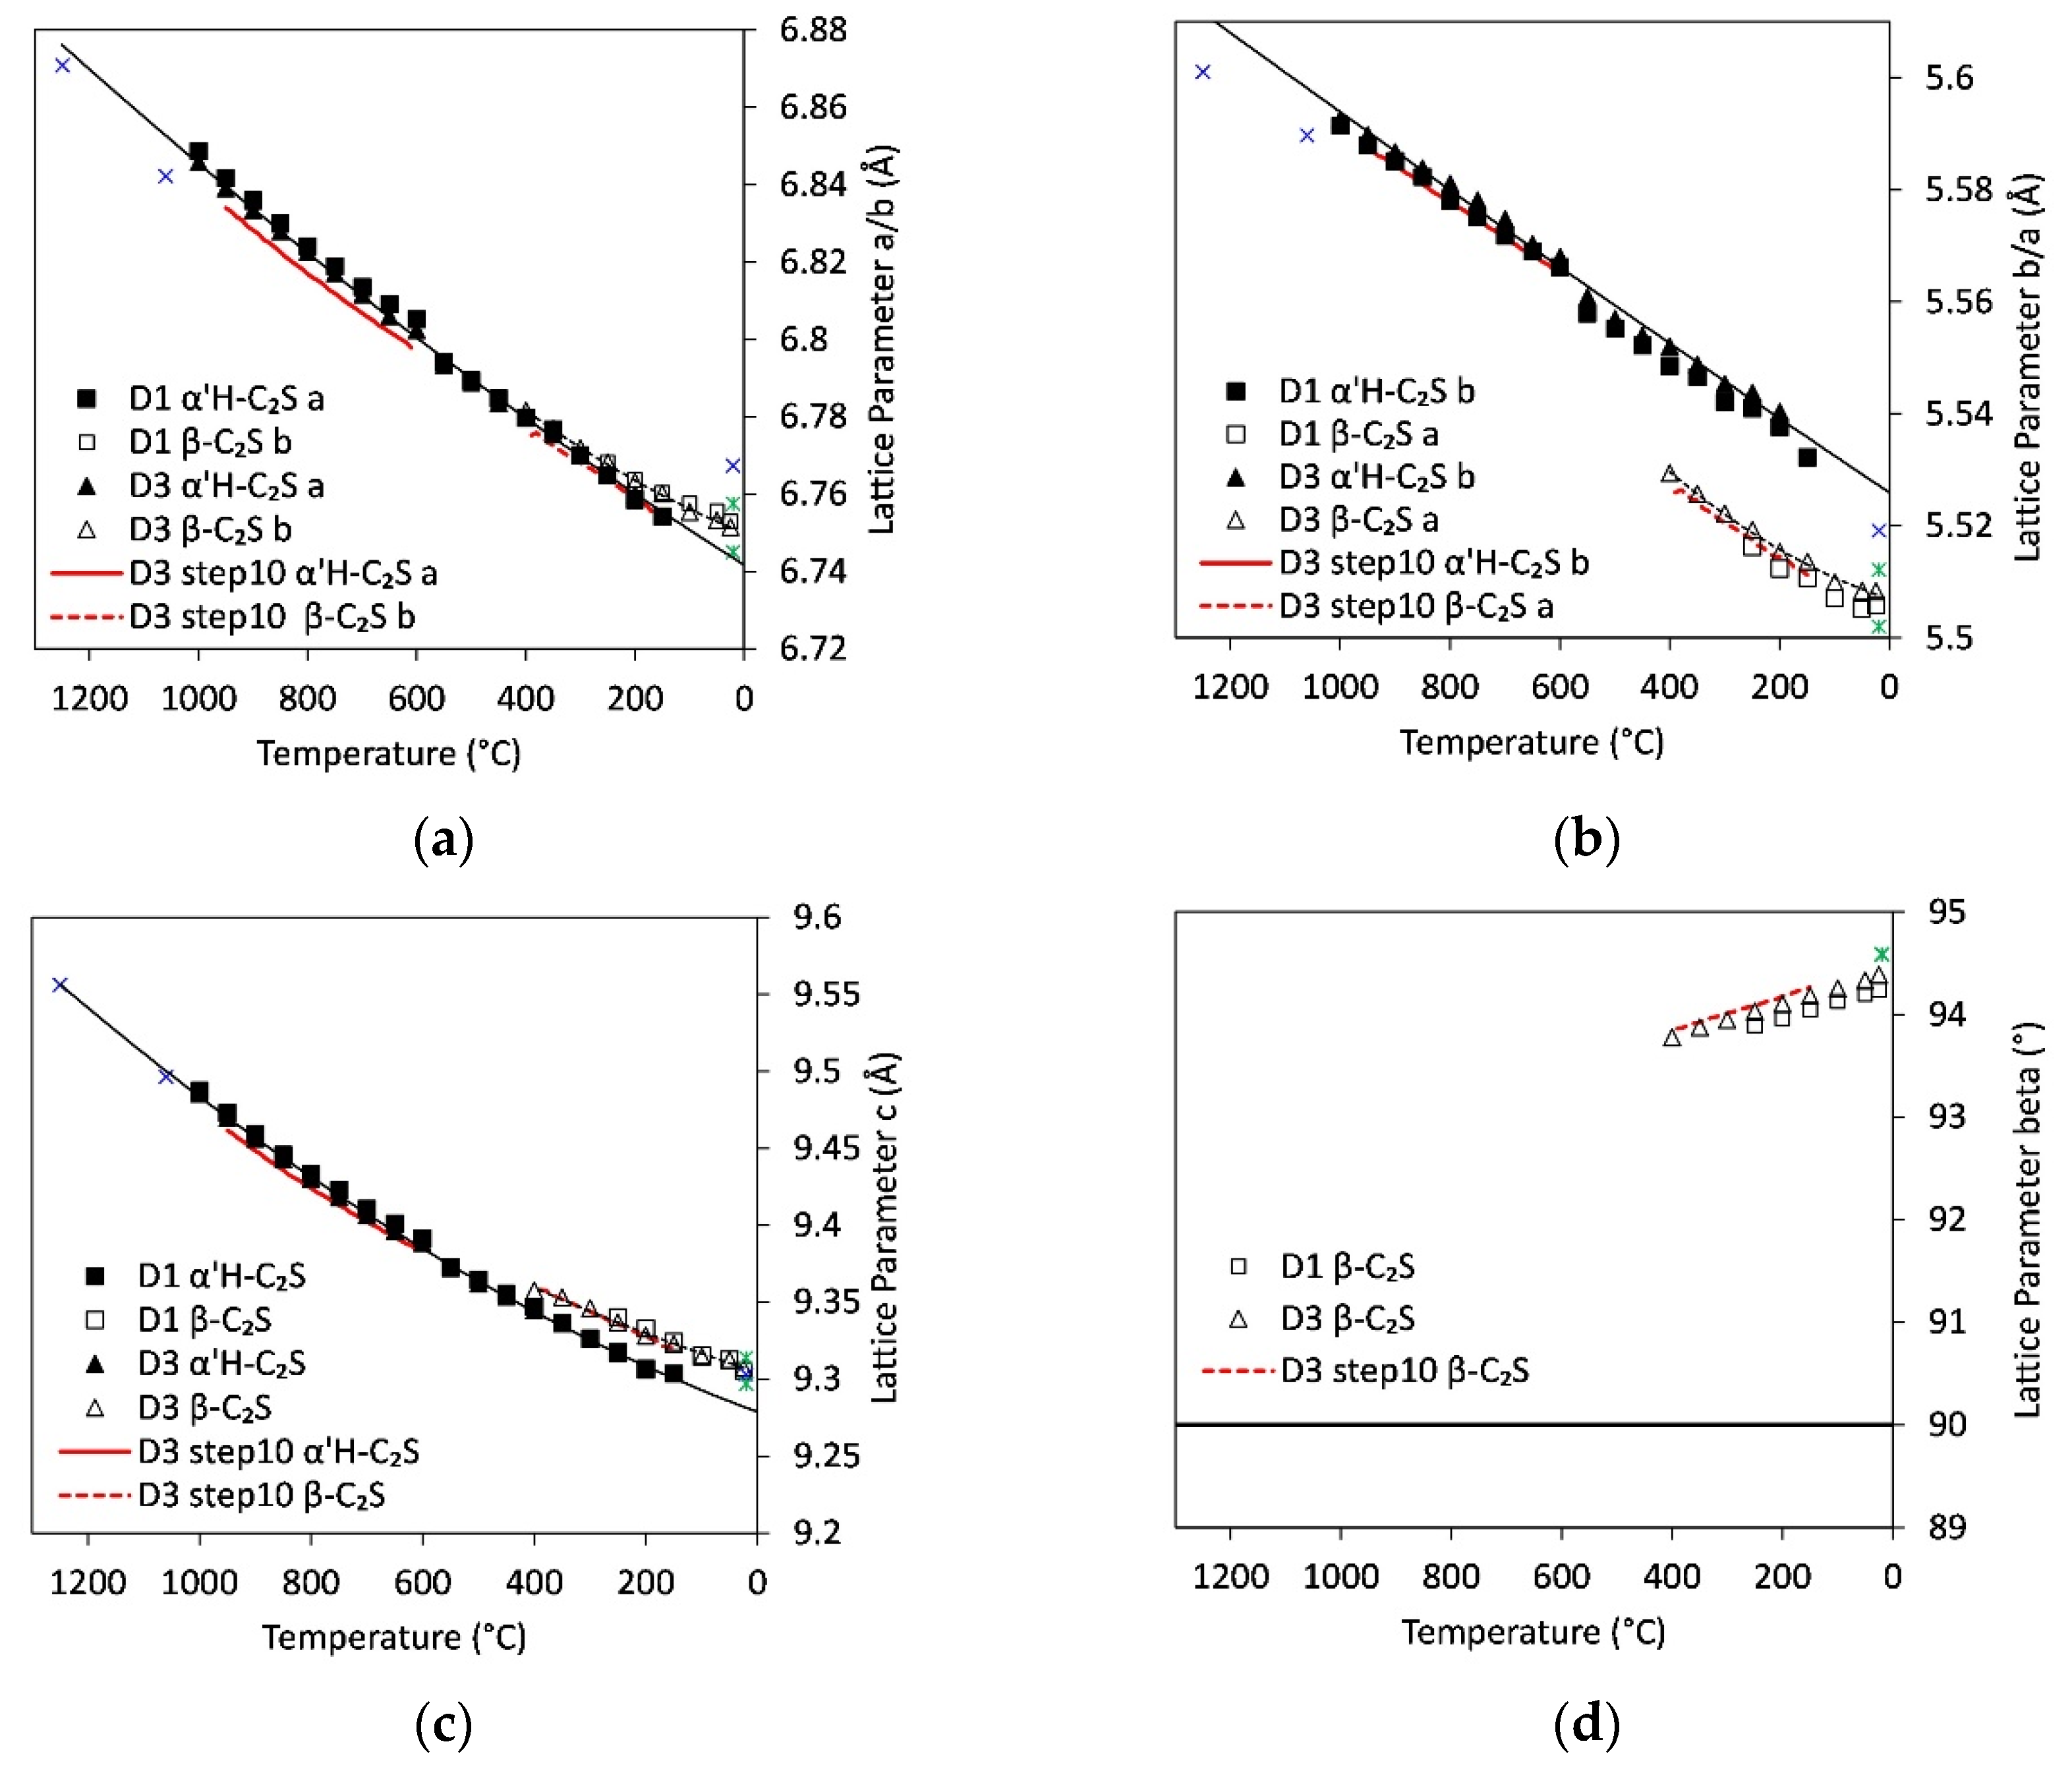
High-temperature lattice parameters of α’H-C2S and β-C2S were refined for samples D1, D2 and D3. Values for a-, b-, and c-axes and the β-angle in β-C2S are shown in Figure 6a–d. For exact correction of the values for sample height, the lattice parameters of quartz were fixed to those corresponding to high-temperature literature data during the refinements. Between 1000 °C and 550 °C the high-quartz structure [36] was used. Data between 550 °C and 25 °C were fitted with the low-quartz structure [37]. The temperature-dependent lattice parameters from high-temperature X-ray studies of quartz [38] were fixed for each temperature step. Based on these assumptions the orthorhombic unit cell of α’H-C2S and the monoclinic cell of β-C2S were refined for phase contents exceeding 20 wt.%. Due to the low quartz contents in sample P, no lattice parameters could be refined for this sample.
All lattice parameters decrease with decreasing temperature. Within the range of high- to low-quartz transition (~575 °C) a slight discontinuity was determined in all lattice parameters. This is ascribed to deviations between literature data and real lattice parameters of quartz related to the transition. In addition, these deviations are in the range of maximum errors determined in the Rietveld refinement, which are 0.003, 0.003, and 0.004Å for axes a, b, and c, respectively. These comparably high values are due to the coexistence of both phases over a wide temperature range.
The α’H-C2S to β-C2S transition between 500 °C and 150 °C is characterized by distinct discontinuities in unit cell axes and an increase in β-angle from 90° in the orthorhombic structure to almost 94° in the monoclinic structure. Common to all structures of C2S modifications is the framework of interconnected M(1) and M(2) Ca polyhedra with isolated (SiO4) tetrahedra [41]. The mechanisms of the transition from high- to low-temperature C2S can be described in terms of distorted heterogeneous close-packed layers of these polyhedra [42]. In both structures layers of M(1) eight-vertex polyhedra are threaded by a framework of M(2) polyhedra. With the transition from α’H-C2S to β-C2S, the deformation of these close-packed layers increases as the size of the coordination spheres around Ca and the number of shared polyhedral edges decrease. In addition, the transition from α’H-C2S to β-C2S causes a change in the setting of the unit cell. The structural relationship between the Pnma (orthorhombic) α’H-C2S and the P121/n1 (monoclinic) β-C2S, which does not involve change of Z, could be represented as a(α’H) = b(β), b(α’H) = a(β), c(α’H) = c(β), in terms of unit cell parameters. Comparison of the a-axis for α’H-C2S to the b-axis for β-C2S shows an almost continuous decrease with temperature even in the range of the phase transition, but the a-axis in β-C2S is much shorter than the b-axis in α’H-C2S. As the M(2) polyhedra form zigzag columns along the a-axis of β-C2S this reflects the decrease in the number of nearest neighbors of Ca in the M(2) position from eight to seven. The c-axis shows only a small step to higher values with the transition from orthorhombic to the monoclinic structure. The main difference between the structures is the increase in β-angle that indicates the symmetry reduction. This results from the changes in the type of connection of M polyhedra and the associated rotation of Si tetrahedra. As the temperature decreases from 400 °C to 25 °C, the β-angle increases further from 93.8° to 94.4° in D2 and D3. The values for the low-sulfate sample D1 are slightly smaller although all other lattice parameters are similar to the high-sulfate samples.
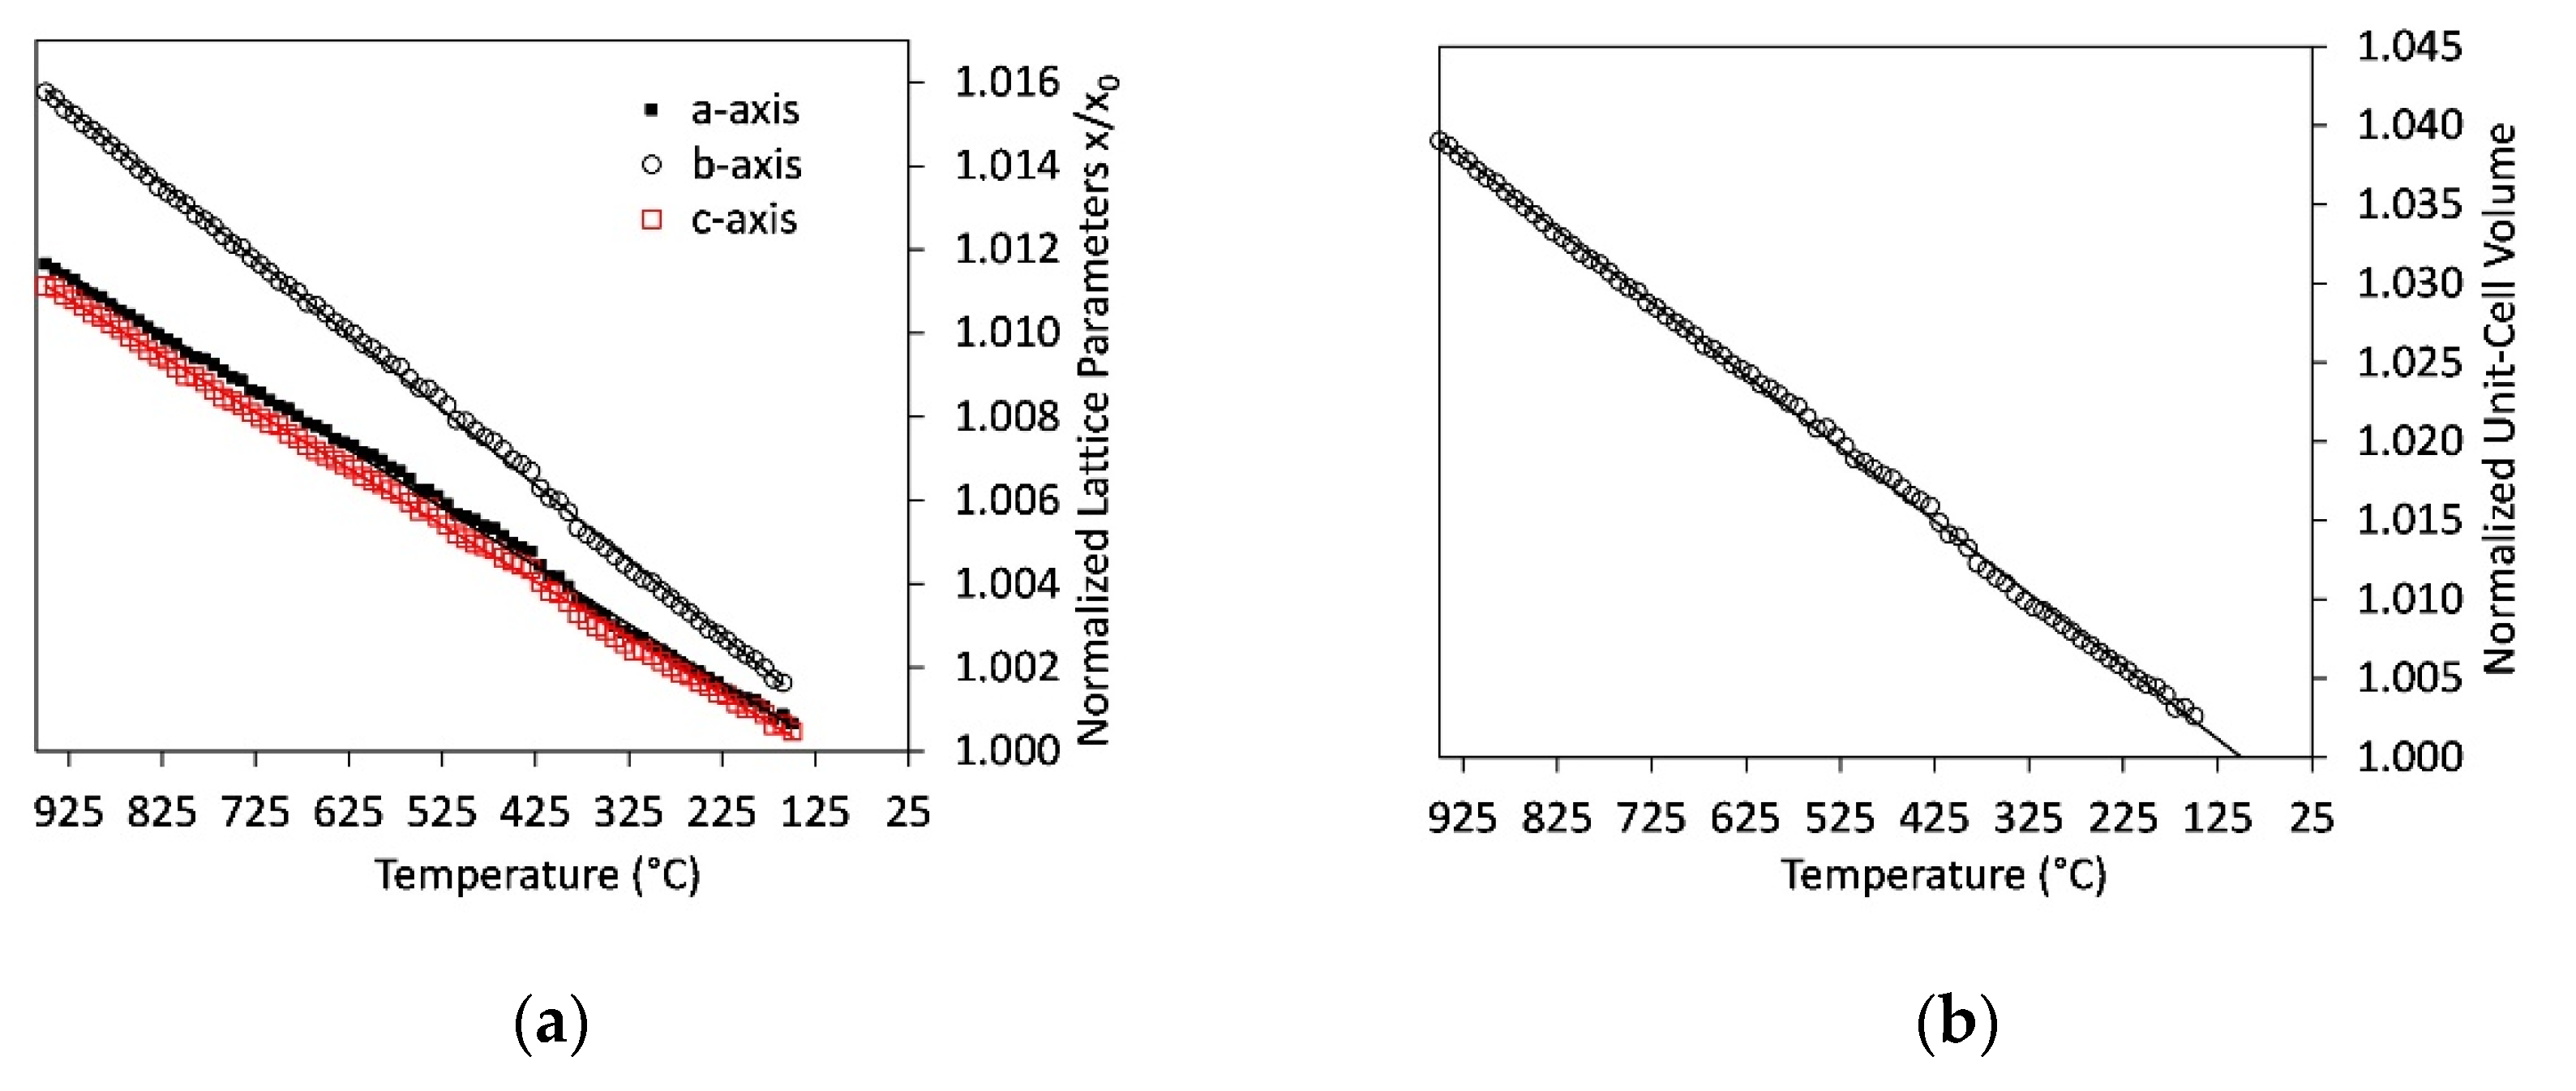
The lattice parameters determined during the experiment with slow cooling rate (step10) show smaller values especially for the unit cell of α’H-C2S. This indicates a stronger influence of the residence time on the adaption of lattice parameters to the temperature conditions. As this slow heating and cooling experiment contains about 20 wt.% ternesite, it also enables the determination of crystallite sizes (Figure 5) and lattice parameters for ternesite (Figure 7). Crystallite size is 198 ± 16 nm and remains constant within the error during cooling. Lattice parameters for the orthorhombic unit cell of ternesite were refined for each temperature step. In order to eliminate the discontinuity around α-β-quartz transition, which leaves a distinct imprint on the linear behavior of ternesite lattice parameters, the data between 600 °C and 300 °C were re-refined with fixed lattice parameters of gehlenite. The sample contains about 5 wt.% gehlenite and a linear evolution of melilite lattice parameters was demonstrated in previous experiments [43]. Therefore, the temperature-dependent unit-cell parameters from a linear fit to gehlenite data could be used for the correction of the ternesite lattice parameters. Figure 7 shows the unit-cell parameters of ternesite normalized to the parameters at room temperature. All of the lattice parameters decrease linearly at temperatures between 950 °C and 150 °C. However, the room temperature measurement indicates deviation from linear thermal expansion behavior between 150 °C and 25 °C as measured room temperature lattice parameters are 6.8426(4), 15.3852(7), 10.1711(5) Å for the a-, b-, and c-axis, respectively. As expected the thermal expansion is anisotropic with higher expansion for the b-axis compared to the a- and c-axis.
4. Discussion
Our in situ heating experiments on mixtures of wastes from autoclaved aerated concrete with calcite were aimed at the synthesis of a low-temperature C2S binder with only minor amounts of ternesite for a better early age strength. Therefore, we limited the temperature range in our experiments to the maximum temperature of 1000 °C and chose a C/S-ratio of 2 for the most of the experiments. For a comprehensive overview, we discuss our results in the context of the Raman spectroscopic study of Böhme et al. within the pure CaSO4-SiO2-CaO system and C/S of 2.5 [17].
4.1. Formation Mechanisms of C2S and Ternesite
X-ray diffraction data evidences the formation of C2S together with the decomposition of CaCO3 at temperatures below 700 °C. This is consistent with Raman spectroscopic observations and confirms that the availability of free lime enables the formation of C2S at lower temperatures compared to experiments with anhydrite as the CaO source only. Raman images show the first growth of C2S as rims at the interface between quartz and lime. Our quantitative results show a rapidly starting formation of C2S at 650 °C, the rate of which slows significantly between 750 °C and 800 °C. This can be explained by the fact that such C2S rims form barriers between the reactants that restrain further diffusion of Ca2+ ions [44,45]. Instead, significant amounts of the low-calcium phase wollastonite form besides residual lime. C2S formation is merely enabled by small quartz grains embedded in the CaO matrix. This C2S is of very low crystallinity. At higher firing temperatures, around 850 °C, the decomposition of anhydrite starts, and the diffusion of Ca2+ through the barrier is facilitated. High crystalline C2S forms by wollastonite transformation with Ca2+ besides C2S from the further reaction of quartz with lime. This causes another increase in the C2S formation rate with temperature. The positive effect of longer dwell times on the formation of C2S was found for temperatures below 900 °C only. At higher temperatures, ternesite formation starts at the expense of C2S. The influence of dwell times on ternesite formation is much more significant.
We observed the first ternesite formation from C2S and anhydrite in the high sulfate samples D2 and D3 during slow heating at 850 °C and during fast heating at 950 °C. Given the temperature steps that are 50 °C in most of the experiments, this is in accordance with the results obtained by Raman spectroscopy where first signs of ternesite were found around 880 °C and 930 °C in experiments with low and high heating rate. However, the C/S-ratio and heating rates in Raman spectroscopic experiments differ considerably from ours as they reach a temperature of 950 °C in 29 and 6 h compared to 12 and 2 h in our experiments. This shows that the onset temperature of ternesite formation depends strongly on the heating rate but is additionally limited to the anhydrite decomposition temperature. This temperature in turn depends on the quartz content of the sample, which would explain the lowest ternesite formation temperature in our slow heating experiments with low C/S-ratio. However, data at 850 °C is lacking in Raman spectroscopic experiments. In addition, there is probably an influence of differences in gas fugacities arising from the different sample and sulfate amounts and different geometries of the devices for Raman and XRD experiments.
Since there is a continuous increase in the amount of ternesite as long as SO3 is available, no recrystallization of ternesite to C2S was obtained in our experiments, neither at 1000 °C nor after a dwell time of 4 days at 950 °C. This confirms the data from in situ Raman measurements [17], which show that the decomposition of ternesite to C2S does not take place below 1016 °C.
4.2. Quantitative Results: Influence of Heating Rate, C/S-Ratio, and Sulfate Content
Comparison of the quantitative results from Raman and X-ray diffraction studies with different heating rates and different C/S-ratios proves that a maximum amount of ternesite forms in samples with high C/S-ratio or after very long dwell times. In our experiments, after 4 days at 950 °C maximum ternesite amounts of about 20 wt.% were found. These values are similar to Raman spectroscopic data with a higher C/S-ratio of 2.5. As mentioned above, the decomposition of anhydrite and the availability of SO3 in the vicinity of C2S particles, i.e., the diffusion of SO3 are the limiting factors for the formation of ternesite in both experiments. Therefore, longer dwell times lead not only to ternesite formation at lower temperatures, but also to an increase in total ternesite amount. This results in the complete consumption of anhydrite in our long-time experiment whereas in all other samples with C/S-ratio of 2 and 2.5 residual anhydrite was observed. As Raman spectroscopic data evidence the formation of ternesite as a reaction product of C2S with anhydrite, the observed decrease in the C2S content after complete consumption of the raw materials is expected. The increase in low-calcium phases, wollastonite, and åkermanite-gehlenite besides the complete consumption of all raw materials after 4 days dwell time, indicates that the C/S-ratio should be adapted to the desired ternesite content.
However, our experiments showed that whereas a similar ternesite amount is observed in both samples with C/S-ratio of 2.5 and 2.0 at the same heating rate, less C2S is formed in the former. Large amounts of lime remain unreacted in the high-calcium sample that certainly would inhibit the formation of low Ca silicates like wollastonite upon ternesite conversion from C2S and CaSO4 at longer dwell times, but at the same time, further C2S formation is also limited by the low quartz content. This illustrates the importance of precise adaption of the C/S-ratio to the aimed C2S and ternesite amounts.
As expected from the C/S-ratios, the amount of C2S is comparably high in our experiments. Quantification of Raman spectroscopic data yield only phase contents below 40 wt.% C2S, besides comparably large amounts of residual raw materials in all samples [17]. In our experiments, we determined β-C2S phase contents between 47 wt.% (sample D1) and 87 wt.% (sample P). As our raw materials differ predominantly in the amount of sulfate, we could evidence the positive effect of its content on the formation of β-C2S. The largest amount of β-C2S was found for sample P with intermediate SO3 content of 4 wt.%. Nevertheless, the powder pattern of this sample shows a merely weak indication for ternesite formation of low crystallinity. The samples with higher SO3 contents of about 10 wt.% show besides high C2S amounts also ternesite contents of 10–20 wt.%. In addition, the sulfate content shows a positive correlation to the crystallite size of C2S. Larger quantities of raw material residues remain only in the SO3 poor sample where significant amounts of CaO and SiO2 together with wollastonite were observed. Since the wollastonite to C2S transition is strongly bound to the local CaO content [46], this shows differences in the availability of Ca2+ ions depending on whether they are bound in calcite or anhydrite.
4.3. Foreign Ion Incorporation in C2S
None of the samples shows the formation of γ-C2S that takes place in the pure SiO2-CaO system during cooling. This evidences the stabilization of the high temperature modifications α’H- and β-C2S by incorporation of foreign ions in the C2S structure. In general, the substitution of Ca2+ by larger cations and Si4+ by smaller cations leads to stabilization of high temperature structures [47]. Substitution of Ca2+ by K+ and Na+ was shown to stabilize the β-C2S [48] and even the α’H-C2S modification [49]. However, the amounts of Na2O and K2O are comparably low in our samples (0.58–0.75 wt.%) and K+ and Na2+ are bound with Al3+ in the feldspar structure. There is also evidence for stabilization of β-C2S by incorporation of Al3+, Mg+, or Fe3+ in the literature [49,50,51]. The content of MgO is below 1 wt.% in all samples and Mg+ is bound in åkermanite. A potentially positive effect of the iron content on the formation of α’H-C2S could be deduced from the fact that samples P and D3 with Fe2O3 contents of more than 1 wt.% show fast growth of α’H-C2S compared to D1 and D2 with Fe2O3 contents below 1wt.%. However, the amount of α’H-C2S at 1000 °C and the variation in phase contents with decreasing temperature are similar in samples D2 and D3. In addition, our samples contain up to 3 wt.% brownmillerite. Therefore, at most, a stabilizing effect on the β-C2S structure by coupled substitution, including Fe2O3 in combination with other components, like Na2O and Al2O3 [52,53], is conceivable, but the effect of SO3 contents between 1.4 and 10.7 wt.% is expected to be much more significant.
Comparison of crystallite sizes and lattice parameters of C2S show slight differences between samples with high and low sulfate contents that could be indicative for partial substitution of SiO44− by SO42−. Prior investigations disclosed the substitution of SiO44− groups by joint replacement with AlO45− and SO42− with overcharge compensation by vacancies or by involving the calcium ions [9]. In addition, further investigations of the coupled substitution of Si4+ by S6+ and Al3+ in C2S [49,54] revealed the stabilization of the β-C2S, or rather, the high-temperature α’H-C2S modification with increasing sulfate content. Our investigations of lattice parameters show slightly higher values for the b-axis of α’H-C2S and the beta angle in β-C2S for the high-sulfate samples D2 and D3 compared to the low-sulfate sample D1 (Figure 6). All other parameters are similar within the range of errors. This could be an indication for a coupled substitution with Al3+ involved. Incorporation of S6+ only would decrease the size of tetrahedra and result in a decrease in lattice parameters. Comparison to literature data of Mumme et al. [35,39] and Jost et al. [40] shows that all room temperature lattice parameters of β-C2S lie in the range of the observed values. In the case of α’H-C2S, we observe higher values for the a- and b-unit cell parameters regardless of whether they are compared to the high-temperature data of α’H-C2S or α’L-C2S. Since literature data for α’H-C2S were collected at much higher temperatures, a comparison was only possible by extrapolation of our data. However, indication for an increase in unit cell volume of α’H-C2S with the incorporation of Al3+ and S6− was already observed before [49]. For comparison we determined the unit cell volumes of α’H-C2S for samples with phase contents >5 wt.% at room temperature. The values are 346.13(12) Å3, 346.75(12) Å3, and 346.67(13) Å3 for samples D1,D2 and D3, respectively. Considering the sulfate and aluminum contents of these samples, the unit cell volume of α’H-C2S is slightly larger for the samples with high sulfate and high aluminum content (D2 + 3). This is in accordance with literature and strong evidence for the incorporation of sulfate and alumina. The unit cell volumes of β-C2S at room temperature are 344.98(6) Å3, 344.97(3) Å3, 345.12(3) Å3 for samples D1, D2 and D3 with aluminum contents below 3 wt.% and only 344.31(9) Å3 for sample P with more than 3 wt.% aluminum. This rather indicates the incorporation of sulfur in the sample with high aluminum content. However, for that matter literature data are inconsistent. Pöhler [49] observed just slightly larger unit cell volumes compared to our data, with values around 345.4Å3 for β-C2S that decrease with increasing sulfate content. Stanĕk et al. [9] found much higher unit cell volume (348.7Å) for β-C2S with sulfur and aluminum incorporation. In addition, in the former study, negative correlation between alumina content and sulfate incorporation was shown, whereas in the latter positive correlation between the content of sulfur and aluminum was evidenced. Further studies are necessary to clear this contradiction.
4.4. Influence of Cooling Rate and Reaction Progress on Quench Product
Raman spectroscopic data [17] evidenced that the reaction progress determines whether ternesite remains during quenching or C2S forms. In our experiments with a C/S-ratio of 2 and a high heating rate, ternesite amounts of about 10 wt.% remained stable during cooling to room temperature. Moreover, our experiment with a C/S-ratio of 2.5 prove the growth of ternesite during temperature decrease from 12 wt.% at 1000 °C to 19 wt.% at room temperature (Table 4). This is contrary to the results from Böhme et al., where ternesite crystallization during cooling occurred only in samples heated to temperatures exceeding 1100 °C. It was suggested that ternesite crystallization during cooling occurs only as recrystallization in samples where high-temperature α’H-C2S-formation from ternesite already started. In all other Raman experiments, ternesite was not stable during quenching. Our results prove that the formation of ternesite by consumption of CaO, SiO2, and CaSO4 during cooling is also possible as we observed ternesite formation during quenching in experiments of samples heated up to 1000 °C, i.e., below the decomposition temperature of ternesite. These discrepancies in results underline the strong influence of other factors like differences in gas fugacity. The sulfate content in our experiments was low compared to the Raman spectroscopic experiments and the sample chamber volume in the HTK1200N is larger compared to the LINKAM heating stage used for Raman spectroscopy. Therefore, SO2 partial pressure is assumed to be smaller in our experiments. Only in the experiment with low heating and cooling rate and a very long dwell time at 950 °C we observed that ternesite is not stable in the cooling process. This is the sample with the highest reaction progress where almost all raw material has been consumed. However, during the very slow cooling procedure (from 950 °C to 25 °C in 30 h) minor amounts of quartz are sufficient for the partial reaction of ternesite to C2S and gehlenite. Of the 19 wt.% ternesite determined at 950 °C only 14 wt.% remained stable at room temperature, i.e., in such low-calcium systems, high amounts of ternesite are not stable besides quartz during slow quenching.
The phase transition from high-temperature α’H-C2S to low-temperature β-C2S was observed in all samples and depends strongly on the heating and cooling rate. Significant reduction in both caused a shift in the onset temperature of the transformation from 450 °C to 540 °C. However, both transition temperatures are lower compared to literature data [49] where the transition takes place at 600 °C. In our study, both phases were found to coexist over a wide temperature range, which also depends on the cooling rate. Slow cooling increased the reaction progress for the temperatures below the transition temperature. Whereas in the sample with a low heating rate at 350 °C most of the α’H-C2S transformed into β-C2S, the phase contents are not even equal in the samples with a fast heating rate. Phase contents of residual α’H-C2S in room temperature measurements with standard vary between 0 and 4 wt.%. This is consistent with literature data [7] on quenched samples, where the contents of α’H-C2S were below 10 wt.% in samples heated to temperatures above 860 °C. Similar to our observations on samples D1, D2 and D3, the authors found a negative correlation between the high surface area of the low crystalline α’H-C2S and its transformation to β-C2S at low temperatures. However, sample P fits not in this trend. Moreover, the influence of the sulfate content on the transformation can be deduced from the fact that the highest α’H-C2S/β-C2S-ratio of 0.3 was found in the sample with almost no sulfate. This indicates that the formation of high crystalline α’H-C2S is favored in samples with high sulfate contents but also low crystalline α’H-C2S transforms completely to β-C2S during cooling if the sample contains smaller amount of sulfate. Since our experiments with different cooling rates (D3_step10 and step50) both started from high crystalline α’H-C2S (>150 nm), the shift of transition temperature is a direct response to the change in cooling rate. It was shown that the formation of ternesite occurs in the same temperature range where high crystalline α’H-C2S starts to form. Therefore, a decrease in residence time or temperature to retain low crystalline α’H-C2S would be at the expense of ternesite amount. Therefore, the synthesis of low crystalline α’H-C2S besides ternesite was not pursued in this study.
4.5. Thermal Expansion of Ternesite
The thermal expansion of ternesite has been measured over a range of temperatures from 150 °C to 950 °C (Figure 7). The temperature-induced changes are larger for the normalized lattice parameter b/b0 than for a/a0 or c/c0. This reflects the layered arrangement of the ternesite structure. The calcium-silicate-sulfate is built of double layers of isolated silicate tetrahedra that alternate along the b-axis with single layers of sulfate tetrahedra both connected via 6- and 7-fold coordinated calcium polyhedra [24]. The silicate layers are similar to the layers in α’H-C2S. However, as they are inter-sliced by CaSO4 modules, the direction of maximum expansion switches from the c-axis in α’H-C2S to the stacking direction, i.e., the b-axis in ternesite.
All x/x0-plots are linear within the range of experimental errors in the temperature range between 150 °C and 950 °C. Thus, the thermal expansion coefficients for all lattice parameters (αx) can be expressed as the mean coefficient of linear expansion for this temperature range:
where x950 and x150 represent the lattice parameters (a,b,c, and the unit cell volume) at 950 °C and 150 °C, respectively. x25 corresponds to the measured lattice parameters at the reference temperature 25 °C. The expansion coefficient for the unit cell volume is 45.7(9)×10−6/°C. This is only slightly larger than literature data for the volumetric thermal expansion coefficient of pure larnite, which was determined as 39.6–42.8×10⁻⁶/°C in the temperature range 25 °C to 720 °C [41,55,56,57] or the one obtained for high-temperature α’H-C2S which is 40.0×10⁻⁶/°C [55]. However, unlike in C2S, the thermal expansion coefficient of ternesite is not temperature-dependent between 150 °C and 950 °C. Only the room temperature measurement deviates from the linear trend, which indicates temperature dependency of thermal expansion below 150 °C.
Linear thermal expansion coefficients calculated accordingly are 13.8(3), 17.9(4), and 13.3(3)×10−6/°C for the a-, b-, and c-axis, respectively. These values indicate anisotropic expansion and are also similar to literature data of larnite. However, in the larnite structure, the highest value of 17.9×10⁻⁶/°C was observed in the c-direction with slightly smaller expansion in the a- and b-direction [55]. In C2S phases this anisotropy is explained by much higher expansion for the Ca-polyhedra compared to the rigid Si-tetrahedra. In the ternesite structure, the incorporation of the comparably expansive CaSO4 modules in the layering changes the direction of maximum expansion from diagonal to parallel stacking of these layers.
5. Conclusions
The high-temperature in situ XRD study gave insights into the possibilities in the recycling of wastes from autoclaved aerated concrete as a low-heat C2S binder. The experiments up to the maximum temperature of 1000 °C evidenced the formation of ternesite besides C2S in sulfate-containing systems. Different factors that influence the phase evolution were obtained:
- Increased residence time during heating increases the ternesite content but promotes also the formation of high crystalline α’H-C2S;
- The sulfate content has a positive effect on the formation of α’H-C2S (phase content and crystallinity);
- The C/S-ratio has to be adapted carefully to the sulfate content, otherwise the formation of ternesite takes place at the expense of C2S;
- The ternesite stability during quench depends on the C/S-ratio and cooling rate: Ternesite stays stable or even increases in amount in experiments with residual quartz and lime. In the case of a low C/S-ratio where only residual quartz is present, a decrease in ternesite amount during very slow cooling was observed;
- The temperature and range of the α’H-C2S→β-C2S transformation depend strongly on the cooling rate. The first formation of β-C2S was observed at 540 °C (slow quench) and 450 °C (fast quench);
- Thermal expansion coefficients of ternesite are similar to literature data of larnite. However, the incorporation of CaSO4 modules in the structure switches the direction of maximum compression.
As ternesite can be hydraulically activated with alumina, such low-temperature ternesite-C2S binders are highly suitable for recirculation in a subsequent hydrothermal process. However, this study focuses on the recycling of concrete wastes with high lime and silica contents in combination with sulfate. Further experiments are required to determine the influence of increasing contamination.
Supplementary Materials
The following are available online at https://www.mdpi.com/article/10.3390/min11080789/s1, Table S1: Structure models and additional parameters used for the Rietveld refinement [58,59,60,61,62,63,64,65,66,67,68,69,70,71,72,73], Table S2: Crystalline phase contents determined in situ in 100 °C steps.
Author Contributions
Conceptualization, A.U. and K.G.; formal analysis, A.U.; investigation, A.U. and B.B.; writing—original draft preparation, A.U.; writing—review and editing, K.G. and B.B.; All authors have read and agreed to the published version of the manuscript.
Funding
This research was funded by BMBF, grant number 033R249D (REPOST Project, 1 June 2019–31 May 2022, https://innovative-produktkreislaeufe.de/Projekte/REPOST.html accessd on 1 July 2021).
Acknowledgments
The authors appreciate the critical reading and valuable suggestions of Peter Stemmermann. Many thanks go to Stefanie Kaufmann, Julia Podszuweit, and Günter Beuchle for RFA and BET measurements. Furthermore, we would like to thank Michael Köhler for the preparation of the sample mixtures.
Conflicts of Interest
The authors declare no conflict of interest. The funders had no role in the design of the study; in the collection, analyses, or interpretation of data; in the writing of the manuscript, or in the decision to publish the results.
References
- Activity Report 2019. Cembureau 2020. Available online: https://cembureau.eu/media/clkdda45/activity-report-2019.pdf (accessed on 25 March 2021).
- Robbie, M.A. Global CO2 emissions from cement production, 1928–2018. Earth Syst. Sci. Data 2019, 11, 1675–1710. [Google Scholar]
- Kreft, O. REPOST Recycling-Cluster Porenbeton 2019. Available online: https://innovative-produktkreislaeufe.de/Projekte/REPOST/_/REPOST_Vortrag_ReziProK_Kick-off.pdf (accessed on 25 March 2021).
- Chatterjee, A.K. High-belite cements—Present status and future technological options: Part I. Cem. Concr. Res. 1996, 26, 1213–1225. [Google Scholar] [CrossRef]
- Chatterjee, A.K. Future technological options: Part II. Cem. Concr. Res. 1996, 26, 1227–1237. [Google Scholar] [CrossRef]
- Chatterjee, A.K. High-belite Portland cement: An update on development characterization and applications. In Proceedings of the 11th International Congress on the Chemistry of Cement (ICCC), Durban, South Africa, 11–16 May 2003; pp. 31–40. [Google Scholar]
- Serpell, R.; Zunino, F. Recycling of hydrated cement pastes by synthesis of α’H-C2S. Cem. Concr. Res. 2017, 100, 398–412. [Google Scholar] [CrossRef]
- Cuberos, A.J.M.; De la Torre, Á.G.; Martín-Sedeño, M.C.; Moreno-Real, L.; Merline, M.; Ordónez, L.M.; Aranda, M.A.G. Phase development in conventional and active belite cement pastes by Rietveld analysis and chemical constraints. Cem. Concr. Res. 2009, 39, 833–842. [Google Scholar] [CrossRef]
- Stanĕk, T.; Sulovský, P. Active low-energy belite cement. Cem. Concr. Res. 2015, 68, 203–210. [Google Scholar] [CrossRef]
- Sorensen, A.; Thomas, R.; Maguire, M.; Quezada, I. Calcium Sulfoaluminate (CSA) Cement: Benefits and Applications. Concr. Int. 2018, 40, 65–69. [Google Scholar]
- Hanein, T.; Galan, I.; Elhoweris, A.; Khare, S. Production of belite calcium sulphoaluminate cement using sulfur as a fuel and as a source of clinker sulfur trioxide: Pilot kiln trial. Adv. Cem. Res. 2016, 28, 643–653. [Google Scholar] [CrossRef] [Green Version]
- Dienemann, W.; Schmitt, D.; Bullerjahn, F.; Haha, M.B. Belite-Calciumsulfoaluminate-Ternesite (BCT)—A new low-carbon clinker Technology. Cem. Int. 2013, 11, 100–109. [Google Scholar]
- Hanein, T.; Galan, I.; Glasser, F.P.; Skalamprinos, S.; Elhoweris, A.; Imabi, M.S.; Bannermann, M.N. Stability of ternesite and the production at scale of ternesite-based clinkers. Cem. Concr. Res. 2017, 98, 91–100. [Google Scholar] [CrossRef]
- Bullerjahn, F.; Schmitt, D.; Haha, M.B. Effect of raw mix design and of clinkering process on the formation and mineralogical composition of (ternesite) belite calcium sulphoaluminate ferrite clinker. Cem. Concr. Res. 2014, 59, 87–95. [Google Scholar] [CrossRef]
- Bullerjahn, F.; Schmitt, D.; Haha, M.B. CSA raw mix design: Effect on clinker formation and reactivity. Mater. Struct. 2015, 48, 3895–3911. [Google Scholar] [CrossRef]
- Haha, M.B.; Bullerjahn, F.; Zajac, M. On the reactivity of ternesite. In Proceedings of the 14th International Congress on the Chemistry of Cement, Beijing, China, 13–16 October 2015. [Google Scholar]
- Böhme, N.; Hauke, K.; Neuroth, M.; Geisler, T. In Situ Hyperspectral Raman Imaging of Ternesite Formation and Decomposition at High Temperatures. Minerals 2020, 10, 287. [Google Scholar] [CrossRef] [Green Version]
- Serpell, R.; Lopez, M. Properties of mortars with reactivated cementitious materials. Cem. Concr. Res. 2015, 64, 16–26. [Google Scholar] [CrossRef]
- Böhme, N.; Hauke, K.; Neuroth, M.; Geisler, T. In Situ Raman imaging of high-temperature solid-state reactions in the CaSO4-SiO2 system. Int. J. Coal Sci. Technol. 2019, 6, 247–259. [Google Scholar] [CrossRef] [Green Version]
- Garbev, K.; Beuchle, G.; Schweike, U.; Merz, D.; Dregert, O.; Stemmermann, P. Preparation of a Novel Cementitious Material from Hydrothermally Synthesized C-S-H Phases. J. Am. Ceram. Soc. 2014, 97, 2298–2307. [Google Scholar] [CrossRef]
- Stemmermann, P.; Schweike, U.; Garbev, K.; Beuchle, G.; Möller, H. Celitement—A sustainable prospect fort the cement industry. Cem. Int. 2010, 8, 52–67. [Google Scholar]
- Beuchle, G.; Stemmermann, P.; Schweike, U.; Garbev, K. Single-Phase Hydraulic Binder, Methods for the Production Thereof and Structural Material Produced Therewith. U.S. Patent 8,382,892, 26 February 2013; U.S. Patent 8,226,763, 24 July 2012; U.S. Patent 8,226,764, 24 July 2012.
- Hunsinger, H.; Beuchle, G.; Stemmermann, P.; Schweike, U.; Giziewicz, K.; Garbev, K. Method for Producing Dicalcium Silicate. U.S. Patent 975,177,1B2, 5 September 2017. [Google Scholar]
- Irran, E.; Tillmanns, E.; Hentschel, G. Ternesite, Ca5(SiO4)2SO4, a new mineral from the Ettringer Bellerberg/Eifel, Germany. Mineral. Petrol. 1997, 60, 121–132. [Google Scholar] [CrossRef]
- Skalamprinos, S.; Galan, I.; Hanein, T.; Glasser, F. Enthalpy of formation of ye’elimite and ternesite. J. Therm. Anal. Calor. 2018, 313, 2345–2359. [Google Scholar] [CrossRef] [Green Version]
- Blanco-Varela, M.T.; Carmona-Quiroga, P.M. Ternesite as a component of sulfobelitic cements. MATEC Web Conf. 2018, 149, 01011. [Google Scholar] [CrossRef]
- Galuskin, E.; Galuskina, I.O.; Gfeller, F.; Krüger, B.; Kusz, J.; Vapnik, Y.; Dulski, M.; Dzierżanowski, P. Silicocarnotite, Ca5[(SiO4)(PO4)](PO4), a new “old” mineral from the Negev Desert, Israel, and the ternesite-silicocarnotite solid solution: Indicators of high-temperature alteration of pyrometamorphic rocks of the Hatrurim Complex, Southern Levan. Eur. J. Mineral. 2015, 28, 105–123. [Google Scholar] [CrossRef]
- Dickens, B.; Brown, W.E. The crystal structure of Ca5(PO4)2(SiO4) (silico-carnotite). Tschermaks Min. Petr. Mitt. 1971, 16, 1–27. [Google Scholar] [CrossRef]
- Brotherton, P.D.; Epstein, J.M.; Pryce, M.W.; White, A.H. Crystal structure of ‘calcium sulphosilicate’ Ca5(SiO4)2SO4. Aust. J. Chem. 1974, 27, 657–660. [Google Scholar] [CrossRef]
- Brunauer, S.; Emmett, P.; Teller, E. Adsorption of Gases in Multimolecular Layers. J. Amer. Chem. Soc. 1938, 60, 309–319. [Google Scholar] [CrossRef]
- Toraya, H.; Yamazaki, S. Simulated annealing structure solution of a new phase of dicalcium silicate Ca2SiO4 and the mechanism of structural changes from α-dicalcium silicate hydrate to α’L-dicalcium silicate via the new phase. Acta Crystallogr. Sect. A Cryst. Phys. Diffr. Theor. Gen. Crystallogr. 2002, 58, 613–621. [Google Scholar] [CrossRef]
- Kriven, W.M. Possible alternative transformation tougheners to zirconia: Crystallographic aspects. J. Am. Ceram. Soc. 1988, 71, 1021–1030. [Google Scholar] [CrossRef]
- Ishida, H.; Yamazaki, S.; Sasaki, K.; Okade, Y.; Mitsuda, T. α-Dicalcium silicate hydrate: Praparation, decomposed phase, and its hydration. J. Am. Ceram. Soc. 1993, 76, 1707–1712. [Google Scholar] [CrossRef]
- Yamnova, N.A.; Zubkova, N.V.; Eremin, N.N.; Zadov, A.E.; Gazeev, V.M. Crystal structure of larnite β-C2S and specific features of polymorphic transitions in dicalcium orthosilicate. Kristallografiya 2011, 56, 235–245. [Google Scholar]
- Mumme, W.G.; Hill, R.J.; Bushnell, G.W.; Segnit, E.R. Rietveld crystal structure refinements, crystal chemistry and calculated powder diffraction data for the polymorphs of dicalcium silicate and related phases. Neues Jahrb. Mineral. 1995, 169, 35–68. [Google Scholar]
- Wright, A.F.; Lehmann, M.S. The structure of quartz at 25 and 590 °C determined by neutron diffraction. J. Sol. State Chem. 1981, 36, 371–380. [Google Scholar] [CrossRef]
- Le Page, Y.; Donnay, G. Refinement of the crystal structure of quartz. Acta Crystallogr. Sect. A Cryst. Phys. Diffr. Theor. Gen. Crystallogr. 1976, 32, 2456–2459. [Google Scholar] [CrossRef]
- Ackermann, R.J.; Sorrell, C.A. Thermal expansion and the high-low transformation in quartz. I. High-temperature X-ray studies. J. Appl. Cryst. 1974, 7, 461–467. [Google Scholar] [CrossRef] [Green Version]
- Mumme, W.G.; Cranswick, L.; Chakoumakos, B. Rietveld crystal structure refinement from high temperature neutron powder diffraction data for the polymorphs of dicalcium silicate. Neues Jahrb. Fuer Mineral. Abh. 1996, 170, 171–188. [Google Scholar]
- Jost, K.H.; Ziemer, B.; Deydel, R. Redetermination of beta-dicalcium silicate. Acta Cryst. B 1977, 33, 1696–1700. [Google Scholar] [CrossRef] [Green Version]
- Barnes, P.; Fentiman, C.H.; Jeffery, J.W. Structurally related dicalcium silicate phases. Acta Crystallogr. Sect. A Cryst. Phys. Diffr. Theor. Gen. Crystallogr. 1980, 36, 353–356. [Google Scholar] [CrossRef]
- Yamnova, N.A.; Yu, K.; Egorow-Tismanko, E.R.; Gobechiya, E.R.; Zadov, A.E.; Gazeev, V.M. New data on polymorphs of anhydrous dicalcium orthosilicate. New Data Miner. 2008, 43, 54–71. [Google Scholar]
- Merlini, M.; Gemmi, M.; Cruciani, G.; Artioli, G. High-temperature behaviour of melilite: In situ X-ray diffraction study of gehlenite-åkermanite-Na melilite solid solution. Phys. Chem. Miner. 2008, 35, 147–155. [Google Scholar] [CrossRef]
- Hauke, K.; Kehren, J.; Böhme, N.; Zimmer, S.; Geisler, T. In Situ Hyperspectral Raman Imaging: A new method to investigate sintering processes of ceramic material at high temperature. Appl. Sci. 2019, 9, 1310. [Google Scholar] [CrossRef] [Green Version]
- Fierens, P.; Picquet, P. Kinetic studies of the thermal synthesis of calcium silicates above 1400 °C: I, Dynamic thermal synthesis of Ca2SiO4. J. Am. Ceram. Soc. 1975, 58, 50–51. [Google Scholar] [CrossRef]
- Rashid, A.R.; Shamsudin, R.; Abdul Hamid, M.A.; Jalar, A. Low temperature production of wollastonite from limestone and silica sand through solid-state reaction. J. Asian Ceram. Soc. 2014, 2, 77–81. [Google Scholar] [CrossRef] [Green Version]
- Schwiete, H.E.; Krönert, W.; Deckert, K. Existenzbereiche und Stabilisierung von Hochtemperaturmodifikationen des Dicalciumsilicates. Zem. Kalk Gips 1986, 9, 359–366. [Google Scholar]
- Lai, G.-C.; Nojiri, T.; Nakano, K. Studies of the stability of β-Ca2SiO4 doped by minor ions. Cem. Concr. Res. 1992, 22, 743–754. [Google Scholar] [CrossRef]
- Pöhler, K. Fremdionenstabilisierte Dicalciumsilicate: Synthese und Hydraulische Reaktion. Ph.D. Thesis, Martin-Luther-Universität Halle-Wittenberg, Halle, Germany, 2016. [Google Scholar]
- Zhao, Y.; Lu, L.; Wang, S.; Gong, C.; Huang, Y. Modification of Dicalcium Silicates Phase Composition by BaO, SO3, and MgO. J. Inorg. Organomet. Polym. 2013, 23, 930–936. [Google Scholar] [CrossRef]
- Kim, Y.-M.; Hong, S.-H. Influence of Minor Ions on the Stability and Hydrations Rates of β-Dicalcium Silicate. J. Am. Ceram. Soc. 2004, 87, 900–905. [Google Scholar] [CrossRef]
- Fukuda, K.; Maki, I.; Ito, S. Thermoelastic Behavior in Ca2SiO4 Solid Solutions. J. Am. Ceram. Soc. 1996, 79, 2925–2928. [Google Scholar] [CrossRef]
- Fukuda, K.; Ito, S. Highly reactive Remelted Belite. J. Am. Ceram. Soc. 1999, 82, 637–640. [Google Scholar] [CrossRef]
- Garbev, K. Struktur, Eigenschaften und Quantitative Rietveldanalyse von Hydrothermal Kristallisierten Calciumsilikathydraten (C-S-H-Phasen). Ph.D. Thesis, Forschungszentrum Karlsruhe Bericht FZKA 6877 2004. Forschungszentrum Karlsruhe, Karlsruhe, Germany, 2003. [Google Scholar]
- Remy, C.; Andrault, D.; Madon, M. High-Temperature, High-Pressure X-ray Investigation of Dicalcium Silicate. J. Am. Ceram. Soc. 1997, 80, 851–860. [Google Scholar] [CrossRef]
- Forest, J. Connaissance de l’Orthosilicate de Calcium (Knowledge of Dicalcium Silicate). Bull. Soc. Fr. Mineral. Cristallogr. 1971, 94, 118–137. [Google Scholar]
- Xiong, Z.; Liu, X.; Shieh, S.R.; Wang, S.; Chang, L.; Tang, J.; Hong, X.; Zhang, Z.; Wang, H. Some thermodynamic properties of larnite (β-Ca2SiO4) constrained by high T/P experiment and/or theoretical simulation. Am. Min. 2016, 101, 277–288. [Google Scholar] [CrossRef]
- Ishizawa, N.; Miyata, T.; Minato, I.; Marumo, F.; Iwai, S.I. Acta Cryst. 1980, 36, 228–230. [CrossRef]
- Chessin, H.; Hamilton, W.C. Position and thermal parameters of oxygen atoms in calcite. Acta Cryst. 1965, 18, 689–693. [Google Scholar] [CrossRef] [Green Version]
- Merlino, S.; Bonaccorsi, E.; Armbruster, T. The real structure of tobermorite 11 A: Normal and anomalous forms, OD. character and polytypic modifications. Eur. J. Mineral. 2001, 13, 577–590. [Google Scholar] [CrossRef] [Green Version]
- De Villiers, J.P.R. Crystal structures of aragonite, strontianite, and witherite. Am. Min. 1971, 56, 758–766. [Google Scholar]
- Kamhi, S.R. On the structure of vaterite, CaCO3. Acta Cryst. 1963, 16, 770–772. [Google Scholar] [CrossRef]
- Hawthorne, F.C.; Ferguson, R.B. Anhydrous Sulfates II. Refinement of the Crystal Structure of Anhydrite. Can. Min. 1975, 13, 289–292. [Google Scholar]
- Bezou, C.; Norlund Christensen, A.; Cox, D.; Lehmann, M.; Nonat, A. Structures cristallines de Ca SO4 * 0.5(H2O) et CaSO4 * 0.6(H2O). C. R. Seances l’Acad. Sci. 1991, 312, 43–48. [Google Scholar]
- Allan, D.R.; Angel, R.J. A high-pressure structural study of microcline (KAlSi3O8) to 7 GPa. Eur. J. Min. 1997, 9, 263–275. [Google Scholar] [CrossRef]
- Winter, J.K.; Okamura, F.P.; Ghose, S. A high temperature structural study of high albite, monalbite, and the analbite-monalbite phase transition. Am. Min. 1979, 64, 409–423. [Google Scholar]
- Huang, Q.; Chmaissem, O.; Caponi, J.J.; Chaillout, C.; Marezio, M.; Tholence, J.L.; Santoro, A. Neutron powder diffraction study of the crystal structure of Hg Ba2Ca4Cu5O12+d at room temperature and at 10K. Physica C 1994, 227, 1–9. [Google Scholar] [CrossRef]
- Hesse, K.F. Refinement of the crystal structure of wollastonite-2M (parawollastonite). Zeitschr. Kristallogr. 1984, 168, 93–98. [Google Scholar] [CrossRef] [Green Version]
- Smith, J.V. Reexamination of the crystal structure of melilite. Am. Min. 1953, 38, 643–661. [Google Scholar]
- Louisnathan, S.J. Refinement of the crystal structure of a natural gehlenite, Ca2Al(Al,Si)2O7. Can. Min. 1971, 10, 822–837. [Google Scholar]
- Grice, J.-D. The structure of spurrite, tilleyite and scawtite, and relationships to other silicate-carbonate minerals. Can. Min. 2005, 43, 1489–1500. [Google Scholar] [CrossRef]
- Colville, A.A.; Geller, S. The crystal structure of brownmillerite, Ca2FeAlO5. Acta Cryst. 1971, 27, 2311–2315. [Google Scholar] [CrossRef]
- Cuesta, A.; de la Torre, A.G.; Losilla, E.R.; Santacruz, I.; Aranda, M.A.G. Pseudocubic crystal structure and phase transition in doped ye’elimite. Cry. Growth Design 2014, 14, 5158–5163. [Google Scholar] [CrossRef] [Green Version]
Figure 1.
Powder pattern of Sample D3 at 1000 °C (a) and 25 °C after the heating experiment in steps of 50 °C (b). Peaks of the main phases are marked as α-α’H-C2S, β-β-C2S, A-anhydrite, Q-quartz, T-ternesite, L-lime, Y-ye’elimite.
Figure 1.
Powder pattern of Sample D3 at 1000 °C (a) and 25 °C after the heating experiment in steps of 50 °C (b). Peaks of the main phases are marked as α-α’H-C2S, β-β-C2S, A-anhydrite, Q-quartz, T-ternesite, L-lime, Y-ye’elimite.

Figure 2.
Isolines plot of the in situ X-ray diffraction measurements in HTK1200N: Heating (a) and cooling (b) of Sample D3 (step10). Main phases are marked at the lines as α-α’H-C2S, β-β-C2S, A-anhydrite, Q-quartz, T-ternesite, C-calcite.
Figure 2.
Isolines plot of the in situ X-ray diffraction measurements in HTK1200N: Heating (a) and cooling (b) of Sample D3 (step10). Main phases are marked at the lines as α-α’H-C2S, β-β-C2S, A-anhydrite, Q-quartz, T-ternesite, C-calcite.

Figure 3.
Thermal treatment of autoclaved aerated concrete with calcite (C/S = 2, step50). Variation of calcite and α’H-C2S phase contents and crystal size of α’H-C2S for samples D1 and P (a) and D2 and D3 (b). Variation of phase contents of quartz, lime, and wollastonite for samples D1 and P (c) and phase contents of quartz, lime, and ternesite for samples D2 and D3 (d).

Figure 4.
Cooling of autoclaved aerated concrete with calcite (C/S = 2, step50). Phase contents of α’H-C2S, β-C2S, and ternesite for samples D1 and P (a) and D2 and D3 (b), respectively. Crystallite sizes for α’H-C2S and β-C2S with phase contents >20 wt.% for samples D1 and P (c) and D2 and D3 (d), respectively.

Figure 5.
Long-time experiment with heating and cooling steps of 10 °C/20 min compared to standard experiment with 50 °C/12 min (D3). (a) Comparison of the formation of α’H-C2S and ternesite with slow (step10) and high (step50) heating rate. (b) Variation of wollastonite, quartz, anhydrite, and lime phase contents with low heating rate. (c) Comparison of crystallite sizes for ternesite (for phase contents >5 wt.%) and α’H-C2S. (d) Effect of the decrease in heating rate on β-C2S formation during cooling.

Figure 6.
Variation of lattice parameters of α’H-C2S and β-C2S in D1 and D3 with cooling. Lattice parameters of D2 are similar to D3. Experiment with low heating and cooling rate is shown between 950 °C and 600 °C and 400 °C and 150 °C as red lines. (a) a-/b-axis, (b) b-/a-axis for α’H-C2S and β-C2S, (c) c-axis, and (d) beta angle. For comparison, the line at 90° for the β-angle in the orthorhombic structure of α’H-C2S is depicted. Literature data of α’H-C2S, α’L-C2S (blue crosses), and β-C2S (green stars) are shown in the graphs [35,39,40].

Figure 7.
Temperature-dependent variation of lattice parameters of ternesite (experiment D3_step10) normalized to the parameters at ambient conditions. (a) a-, b, and c-axis and (b) unit-cell volume. Errors for the normalized lattice parameters are 0.0002 and for the normalized volume 0.0003.
Figure 7.
Temperature-dependent variation of lattice parameters of ternesite (experiment D3_step10) normalized to the parameters at ambient conditions. (a) a-, b, and c-axis and (b) unit-cell volume. Errors for the normalized lattice parameters are 0.0002 and for the normalized volume 0.0003.


Table 1.
Chemical composition of the raw materials determined by XRF. Loss of ignition = LoI. Additional phase content of TiO2 < 0.2 wt.%. Samples were dried at 105 °C prior to analysis.
Table 1.
Chemical composition of the raw materials determined by XRF. Loss of ignition = LoI. Additional phase content of TiO2 < 0.2 wt.%. Samples were dried at 105 °C prior to analysis.
| Sample | LoI (wt.%) | SiO2 (wt.%) | CaO (wt.%) | SO3 (wt.%) | Al2O3 (wt.%) | Fe2O3 (wt.%) | MgO (wt.%) | K2O (wt.%) | Na2O (wt.%) |
|---|---|---|---|---|---|---|---|---|---|
| SM(P) | 6.68 | 49.2 | 31.4 | 4.20 | 3.14 | 1.29 | 0.96 | 0.75 | 0.75 |
| SM(D1) | 11.6 | 56.1 | 24.7 | 1.44 | 2.00 | 0.63 | 0.40 | 0.60 | 0.60 |
| SM(D2) | 9.90 | 47.0 | 26.3 | 10.7 | 2.28 | 0.84 | 0.48 | 0.58 | 0.58 |
| SM(D3) | 14.3 | 43.3 | 25.7 | 9.42 | 2.84 | 1.12 | 0.57 | 0.60 | 0.60 |
Table 2.
Quantitative phase contents determined by XRD analysis of the raw materials. The e.s.d.’s. are shown in parentheses (Toberm. = 11 Å tobermorite).
Table 2.
Quantitative phase contents determined by XRD analysis of the raw materials. The e.s.d.’s. are shown in parentheses (Toberm. = 11 Å tobermorite).
| Sample | Amorphous (wt.%) | Quartz (wt.%) | Calcite (wt.%) | Vaterite (wt.%) | Aragonite (wt.%) | Toberm. (wt.%) | Feldspars (wt.%) | Anhydrite (wt.%) | Bassanite (wt.%) |
|---|---|---|---|---|---|---|---|---|---|
| SM(P) | 64.7(1.0) | 13.2(2) | 3.20(16) | 1.16(11) | 0.21(6) | 13.3(3) | 0.5(3) | 2.38(14) | 1.36(13) |
| SM(D1) | 52.0(6) | 25.9(2) | 3.95(11) | 2.82(11) | 4.97(17) | 5.33(17) | 2.7(4) | 0.48(10) | 1.87(12) |
| SM(D2) | 60.5(6) | 22.2(2) | 4.25(13) | 2.30(13) | 1.80(14) | 2.4(2) | 5.00(13) | 1.59(16) | |
| SM(D3) | 60.4(6) | 19.64(2) | 4.01(12) | 2.64(12) | 2.69(14) | 3.5(2) | 3.37(12) | 3.75(15) |
Table 3.
Results from thermal analysis of the raw materials. Weight losses between 30 °C and 450 °C, 450 °C and 830 °C, and 830 °C and 1400 °C are assumed to be representative for the weight losses due to the release of H2O, CO2, and SO3 with errors of ±0.5 wt.% that result from overlap in the ranges 450 °C to 500 °C and 830 °C to 900 °C. Amorphous CaCO3, CaSO4, and C-S-H were calculated from the results of TG and XRD.
| Sample | Weight Loss 30–950 °C (wt.%) | H2O 30–450 °C (wt.%) | CO2 450–830 °C (wt.%) | SO3 830–1400 °C (wt.%) | Amorphous CaCO3 (wt.%) | Amorphous CaSO4 (wt.%) | Amorphous C-S-H (wt.%) |
|---|---|---|---|---|---|---|---|
| SM(P) | 6.3 | 2.9 | 2.4 | 4.9 | 1.4 | 5.6 | 59.1 |
| SM(D1) | 13.9 | 3.7 | 9.7 | 1.6 | 9.0 | 1.4 | 41.2 |
| SM(D2) | 10.2 | 2.0 | 7.6 | 10.9 | 8.6 | 12.5 | 39.6 |
| SM(D3) | 15.9 | 2.5 | 9.9 | 11.3 | 11.8 | 13.3 | 34.9 |
Table 4.
Selected crystalline phase contents determined in situ and quantitative analysis with standard at room temperature (Std). Anh. = anhydrite and Wollast. = wollastonite. Additional minor phase contents in all samples are <4 wt.% spurrite and gehlenite, <3 wt.% browmillerite and microcline, <2 wt.% ye’elimite, åkermanite, and albite. D3_step10: experiment with slow heating rate (additional 5.3(4) and 8.6(4) wt.% åkermanite-gehlenite at 950 °C and 25 °C, respectively). D3_2.5: experiment with C/S-ratio of 2.5.
| Sample and Temperature (°C) | Amorph | α’H-C2S | β-C2S | Ternesite | Quartz | Calcite | Lime | Anh. | Wollast. |
|---|---|---|---|---|---|---|---|---|---|
| P 600 | 18.0(8) | 75.7(1.2) | 2.7(4) | ||||||
| P 700 | 37.0(1.0) | 13.4(6) | 44.4(1.1) | 2.8(3) | |||||
| P 800 | 55.2(1.0) | 7.1(4) | 0.6(2) | 24.4(5) | 1.84(15) | 9.2(4) | |||
| P 1000 | 89.9(8) | 2.2(4) | 1.6(2) | 0.03(2) | 1.5(3) | ||||
| P 600 | 95.6(7) | 1.5(3) | 0.25(9) | ||||||
| P 500 | 93.6(1.0) | 2.3(8) | 1.4(3) | 0.26(10) | |||||
| P 400 | 75.2(1.0) | 21.6(8) | 0.8(2) | 0.32(15) | 0.5(3) | ||||
| P 25 | 1.7(9) | 87.4(1.3) | 0.5(3) | 1.3(2) | 1.1(3) | 1.0(3) | |||
| (P)Std | - | 90.0(6) | 0.44(13) | 2.52(7) | 0.63(11) | 0.14(5) | |||
| D1 600 | 18.8(6) | 79.1(7) | 0.52(16) | ||||||
| D1 700 | 16.1(7) | 17.5(2) | 63.4(9) | 0.9(2) | 0.42(14) | ||||
| D1 800 | 38.2(6) | 14.6(4) | 1.0(2) | 38.0(5) | 0.25(8) | 4.6(4) | |||
| D1 1000 | 64.4(5) | 1.9(2) | 7.9(2) | 16.26(17) | 0.21(6) | 4.6(2) | |||
| D1 600 | 67.6(7) | 2.7(2) | 8.3(3) | 4.02(13) | 11.44(17) | 2.09(19) | |||
| D1 500 | 63.6(7) | 3.1(4) | 1.9(2) | 9.8(5) | 3.9(2) | 10.28(17) | 2.3(3) | ||
| D1 400 | 58.4(7) | 7.4(6) | 1.40(17) | 10.0(4) | 4.3(2) | 10.59(18) | 2.5(2) | ||
| D1 25 | 14.6(8) | 46.7(1.6) | 1.95(18) | 9.4(4) | 6.7(3) | 12.0(4) | 0.52(14) | 2.46(19) | |
| (D1)Std | 10.2(1.7) | 4.2(3) | 47.2(9) | 1.17(11) | 8.76(16) | 7.02(15) | 12.07(17) | 4.32(12) | |
| D2 600 | 20.3(6) | 65.9(1.0) | 10.6(9) | ||||||
| D2 700 | 20.0(1.0) | 18.2(6) | 47.0(1.1) | 0.6(2) | 11.6(9) | ||||
| D2 800 | 51.8(1.0) | 11.7(4) | 26.7(6) | 5.9(4) | 2.9(4) | ||||
| D2 1000 | 72.5(7) | 8.1(2) | 5.1(3) | 1.93(6) | 6.90(17) | 1.13(14) | |||
| D2 600 | 72.5(6) | 9.8(3) | 4.87(18) | 0.37(10) | 5.1(2) | 0.44(17) | |||
| D2 500 | 73.0(7) | 0.8(3) | 9.9(2) | 4.4(4) | 0.65(6) | 4.7(2) | 0.57(17) | ||
| D2 400 | 50.3(6) | 22.8(5) | 10.4(3) | 4.9(4) | 0.3(2) | 0.66(6) | 5.0(2) | 0.6(2) | |
| D2 25 | 5.9(5) | 65.2(9) | 11.0(3) | 3.7(2) | 0.84(16) | 1.10(7) | 4.47(17) | 0.86(18) | |
| (D2)Std | 4.8(1.3) | 1.08(1.7) | 62.6(6) | 11.36(17) | 5.62(12) | 1.49(11) | 2.52(5) | 4.50(9) | 0.64(10) |
| D3 600 | 20.2(6) | 65.0(1.0) | 11.2(9) | ||||||
| D3 700 | 30.8(9) | 15.3(5) | 37.4(1.0) | 0.7(2) | 13.3(8) | ||||
| D3 800 | 55(2) | 11.8(6) | 22.3(9) | 7.3(5) | 1.9(5) | ||||
| D3 1000 | 74.2(6) | 9.2(3) | 4.9(2) | 0.90(10) | 5.1(2) | 1.2(2) | |||
| D3 600 | 73.2(7) | 10.6(3) | 4.7(3) | 0.25(5) | 3.8(2) | 0.7(3) | |||
| D3 500 | 74.8(8) | 0.9(3) | 10.2(3) | 3.0(4) | 0.25(6) | 3.6(29 | 0.74(19) | ||
| D3 400 | 53.9(7) | 20.3(5) | 10.6(3) | 3.2(4) | 1.0(3) | 0.23(6) | 3.6(2) | 0.9(3) | |
| D3 25 | 5.6(5) | 64.7(1.0) | 11.1(3) | 4.1(2) | 0.77(16) | 0.50(7) | 4.00(17) | 1.06(18) | |
| (D3)Std | - | 1.35(18) | 65.4(6) | 8.31(16) | 5.57(13) | 1.23(12) | 1.84(5) | 7.46(11) | 0.99(11) |
| D3_step10 950 | 65.9(5) | 19.0(2) | 1.71(9) | 0.04(2) | 0.18(7) | 4.7(3) | |||
| D3_step10 25 | 1.1(2) | 67.3(5) | 14.10(15) | 0.45(10) | 0.41(9) | 0.16(7) | 4.43(10) | ||
| D3_2.5 950 | 62.9(5) | 4.5(3) | 6.0(2) | 15.6(2) | 6.2(2) | 0.9(2) | |||
| D3_2.5 1000 | 66.7(5) | 11.8(2) | 3.14(18) | 6.77(9) | 5.61(15) | 1.17(18) | |||
| D3_2.5 25 | 10.2(5) | 49.9(1.1) | 18.6(5) | 1.6(29 | 1.83(15) | 4.68(12) | 4.23(15) | 0.90(17) |
Publisher’s Note: MDPI stays neutral with regard to jurisdictional claims in published maps and institutional affiliations. |
© 2021 by the authors. Licensee MDPI, Basel, Switzerland. This article is an open access article distributed under the terms and conditions of the Creative Commons Attribution (CC BY) license (https://creativecommons.org/licenses/by/4.0/).
Share and Cite
MDPI and ACS Style
Ullrich, A.; Garbev, K.; Bergfeldt, B. In Situ X-ray Diffraction at High Temperatures: Formation of Ca2SiO4 and Ternesite in Recycled Autoclaved Aerated Concrete. Minerals 2021, 11, 789. https://doi.org/10.3390/min11080789
AMA Style
Ullrich A, Garbev K, Bergfeldt B. In Situ X-ray Diffraction at High Temperatures: Formation of Ca2SiO4 and Ternesite in Recycled Autoclaved Aerated Concrete. Minerals. 2021; 11(8):789. https://doi.org/10.3390/min11080789
Chicago/Turabian StyleUllrich, Angela, Krassimir Garbev, and Britta Bergfeldt. 2021. "In Situ X-ray Diffraction at High Temperatures: Formation of Ca2SiO4 and Ternesite in Recycled Autoclaved Aerated Concrete" Minerals 11, no. 8: 789. https://doi.org/10.3390/min11080789
Note that from the first issue of 2016, this journal uses article numbers instead of page numbers. See further details here.