
Amp-TB2: An Updated Model for Calcic Amphibole Thermobarometry


Institut für Mineralogie, Leibniz Universität Hannover, 30167 Hannover, Germany
Minerals 2021, 11(3), 324; https://doi.org/10.3390/min11030324
Submission received: 2 March 2021
/
Revised: 15 March 2021
/
Accepted: 18 March 2021
/
Published: 20 March 2021
(This article belongs to the Section Mineral Exploration Methods and Applications)
Abstract
:Amphibole (Amp) plays a crucial role in the study of several earth and planetary processes. One of its most common applications is in thermobarometry, especially for volcanic-magmatic systems. However, many thermobarometers require the input of melt composition, which is not always available in volcanic products (e.g., partially crystallized melts or devitrified glasses), or show rather high errors for characterizing the depth of magma chambers. In this work, a new version of amphibole thermobarometry based on the selection of recently published high-quality experimental data is reported. It is valid for Mg-rich calcic amphiboles in magmatic equilibrium with calc-alkaline or alkaline melts across a wide P-T range (up to 2200 MPa and 1130 °C) and presents the advantage of being a single-phase model with relatively low errors (P ±12%, T ±22 °C, logfO2 ±0.3, H2O in the melt ±14%). A user-friendly spreadsheet (Amp-TB2.xlsx) for calculating the physico-chemical parameters from the composition of natural amphiboles is also reported. It gives warnings whenever the input composition is incorrect or diverges from that of the calibration data and includes diagrams for an easy graphical representation of the results.
1. Introduction
Amphibole (Amp) is one of the most common mafic minerals in the lithosphere, the major component of some types of rocks (e.g., amphibolite and hornblendite), and plays a crucial role in the understanding of several planetary, earth, and health issues [1,2,3,4,5,6,7]. The word “amphibole” means ambiguous, from the Greek αμφιβολος (Réné J. Haüy, 1743–1822), and presently refers to a supergroup of complex silicate minerals (more than 100 end-members) with the general formula AB2C5T8O22W2 (where A = vacancy, Na, K, Ca, Pb, Li; B = Na, Ca, Mn2+, Fe2+, Mg, Li; C = Mg, Fe2+, Mn2+, Al, Fe3+, Mn3+, Cr3+, Ti4+, Li; T = Si, Al, Ti4+, Be; W = OH, F, Cl, O2–) [8]. Amphibole crystal chemistry is controlled by complex mutual relationships between the composition of the system (minerals and melt) and physico-chemical parameters such as pressure (P), temperature (T), water (fH2O), and oxygen (fO2) fugacity [3,9,10,11].
Because of the large variety of possible substitution mechanisms, Amp offers many applications in geosciences. For example, the composition of Amp can be used as a tracer for volatile concentrations in melts and fluids, but one of its most common applications is in geothermobarometry, especially for volcanic systems, e.g., [9,12,13]. Recent single-phase thermobarometric developments valid for Mg-rich calcic amphiboles in equilibrium with calc-alkaline or alkaline melts (hereafter single-Amp) have been in growing demand because of their user-friendly application across a wide P-T range [10,11,12,13]. In fact, although thermobarometric models based on chemical equilibria among coexisting mineral-mineral or mineral-melt pairs [9,14,15,16,17] are useful tools widely used to estimate the P-T path and chemical evolution during igneous processes, their application is difficult whenever different magmas interact within the crust and erupt to form mixed (hybrid) products [18,19,20]. In addition, the composition of the melt formed at magma storage conditions is not preserved in many volcanic rocks. These problems favored the development of several single-phase thermobarometric applications [21,22,23,24] which, when properly used, better highlight the sub-volcanic processes recorded in the minerals of hybrid products [25,26]. Nevertheless, Ridolfi and Renzulli [10] showed that previous Amp applications indicate large uncertainties when tested against high-quality experimental results obtained in a large P-T range (up to 2200 MPa and 1130 °C), typical of worldwide volcanic plumbing systems.
The single-Amp application, developed by [10], relies on an empirical procedure to estimate the pressure calculated from a series of five barometric equations, obtained through multivariate least-squares regression of literature and experimental data and account for an overall error of about 12%. The same composition of natural Amp is then used to obtain estimates of T (±24 °C), fO2 (±0.4 log units) and coexisting melt composition by other empirical equations. The applications of the approach proposed by Ridolfi and co-authors [10,13] produce P-T results consistent with independent high-quality experimental data [27,28,29] and appear to be in agreement with constraints from complementary methodologies, including depth estimates of sub-volcanic magma bodies located by geophysical data [13,19,26,30,31,32,33,34,35,36,37]. Criticisms have been advanced [20,38,39], and replies were given by Gorini et al. together with warnings to avoid amphibole crystallized at disequilibrium conditions and on the correct application of Amp thermobarometry (in their Supplementary discussion, [26]). However, the barometric procedure proposed by [10] works well for low pressures (<500 MPa) and above 900 MPa, but may result in a few shortcomings because of the lack of moderate temperature data at intermediate pressures; only one high-T (1050 °C) amphibole obtained at 700 MPa is included in the calibration dataset of [10].
In this article, an updated version of the single-Amp model of [10], based on recently published high-quality experimental data, is reported together with a user-friendly spreadsheet to calculate crystallizing P, T, fO2, and H2Omelt (volatile content in the melt) conditions of Mg-rich calcic amphiboles in equilibrium with calc-alkaline or alkaline melts.
2. Methods
Recent experimental data in literature were first checked according to a series of criteria aimed at selecting high-quality experimental data of amphiboles in equilibrium with the melt [10,13,26,40]. For instance, amphibole and coexisting phases have been checked for their compositional homogeneity by comparing the standard deviations of their multiple analyses (major element oxides measured by Electron MicroProbe (EMP)) to those of experimental amphiboles selected in [10], and the composition of the recently published experimental amphiboles were plotted in a multitude of variation diagrams to check their consistency with the natural magmatic ones [10,13]. In addition, their quality was checked using the application AMFORM.xlsx, allowing the calculation of the Amp formula and reporting of warnings for bad analyses and deviations from the correct stoichiometry [40].
The result of this selection was a series of 12 experimental Amp compositions synthesized by [27,28,29,41,42,43,44] in the ranges of 885–1060 °C, 200–1000 MPa, and 2.4–3.2 ∆NNO (logfO2-logfO2 at Ni-NiO buffer; e.g., [45]). These amphibole data were reported in the electronic supplement Amp-TB2.xlsx together with the other 61 experimental samples selected by [10]. The overall database was used to refine the single-Amp application following the work of [10] that took into account the relative errors of the five pressure equations and minimized the overall barometric uncertainty.
3. Results and Discussion
Ridolfi and Renzulli [10] reported five logarithmic and linear P-equations calibrated with Amp data obtained in different pressure ranges (P1a:130–2200 MPa; P1b and P1c: 130–500 MPa; P1d: 400–1500 MPa; P1e: 930–2200 MPa) and defined parameters such as ΔPdb (P1d-P1b) and XPae (P1a-P1e/P1a), a procedure to calculate a P2 (using the results of the above P-equations and parameters), and the final pressure values (i.e., P) based on the ‘‘apparent’’ percentage error, APE, i.e., (P1a − P2) × 200/(P1a + P2). Since these equations were calibrated within physico-chemical and compositional fields with a homogeneous density of data, new P calibrations (including the newly selected 12 amphiboles) were not needed as they can result in biased equations. However, when the newly selected experimental amphiboles were used to test this procedure, P and T errors were on average 32% and 29 °C and could be as high as 100% and 67 °C, respectively. These uncertainties were much higher than those predicted by the method (see Section 1).
In this new version of single-Amp thermobarometry, the procedure to estimate the final P values of [10] was modified by changing the parameter thresholds as follows:
- (i)
- if P1b < 335 MPa, then P = P1b;
- (ii)
- if P1b < 399 MPa, then P = (P1b + P1c)/2;
- (iii)
- if P1c < 415 MPa, then P = P1c;
- (iv)
- if P1d < 470 MPa, then P = P1c;
- (v)
- if XPae > 0.22, then P = (P1c + P1d)/2;
- (vi)
- if ΔPdb > 350 MPa, then P = P1e;
- (vii)
- if ΔPdb > 210 MPa, then P = P1d;
- (viii)
- if ΔPdb < 75 MPa, then P = P1c;
- (ix)
- if XPae > −0.2, then P = (P1b + P1c)/2;
- (x)
- if XPae > 0.05, then P = (P1c + P1d)/2;
- (xi)
- if none of the above conditions are satisfied, then P = P1a.
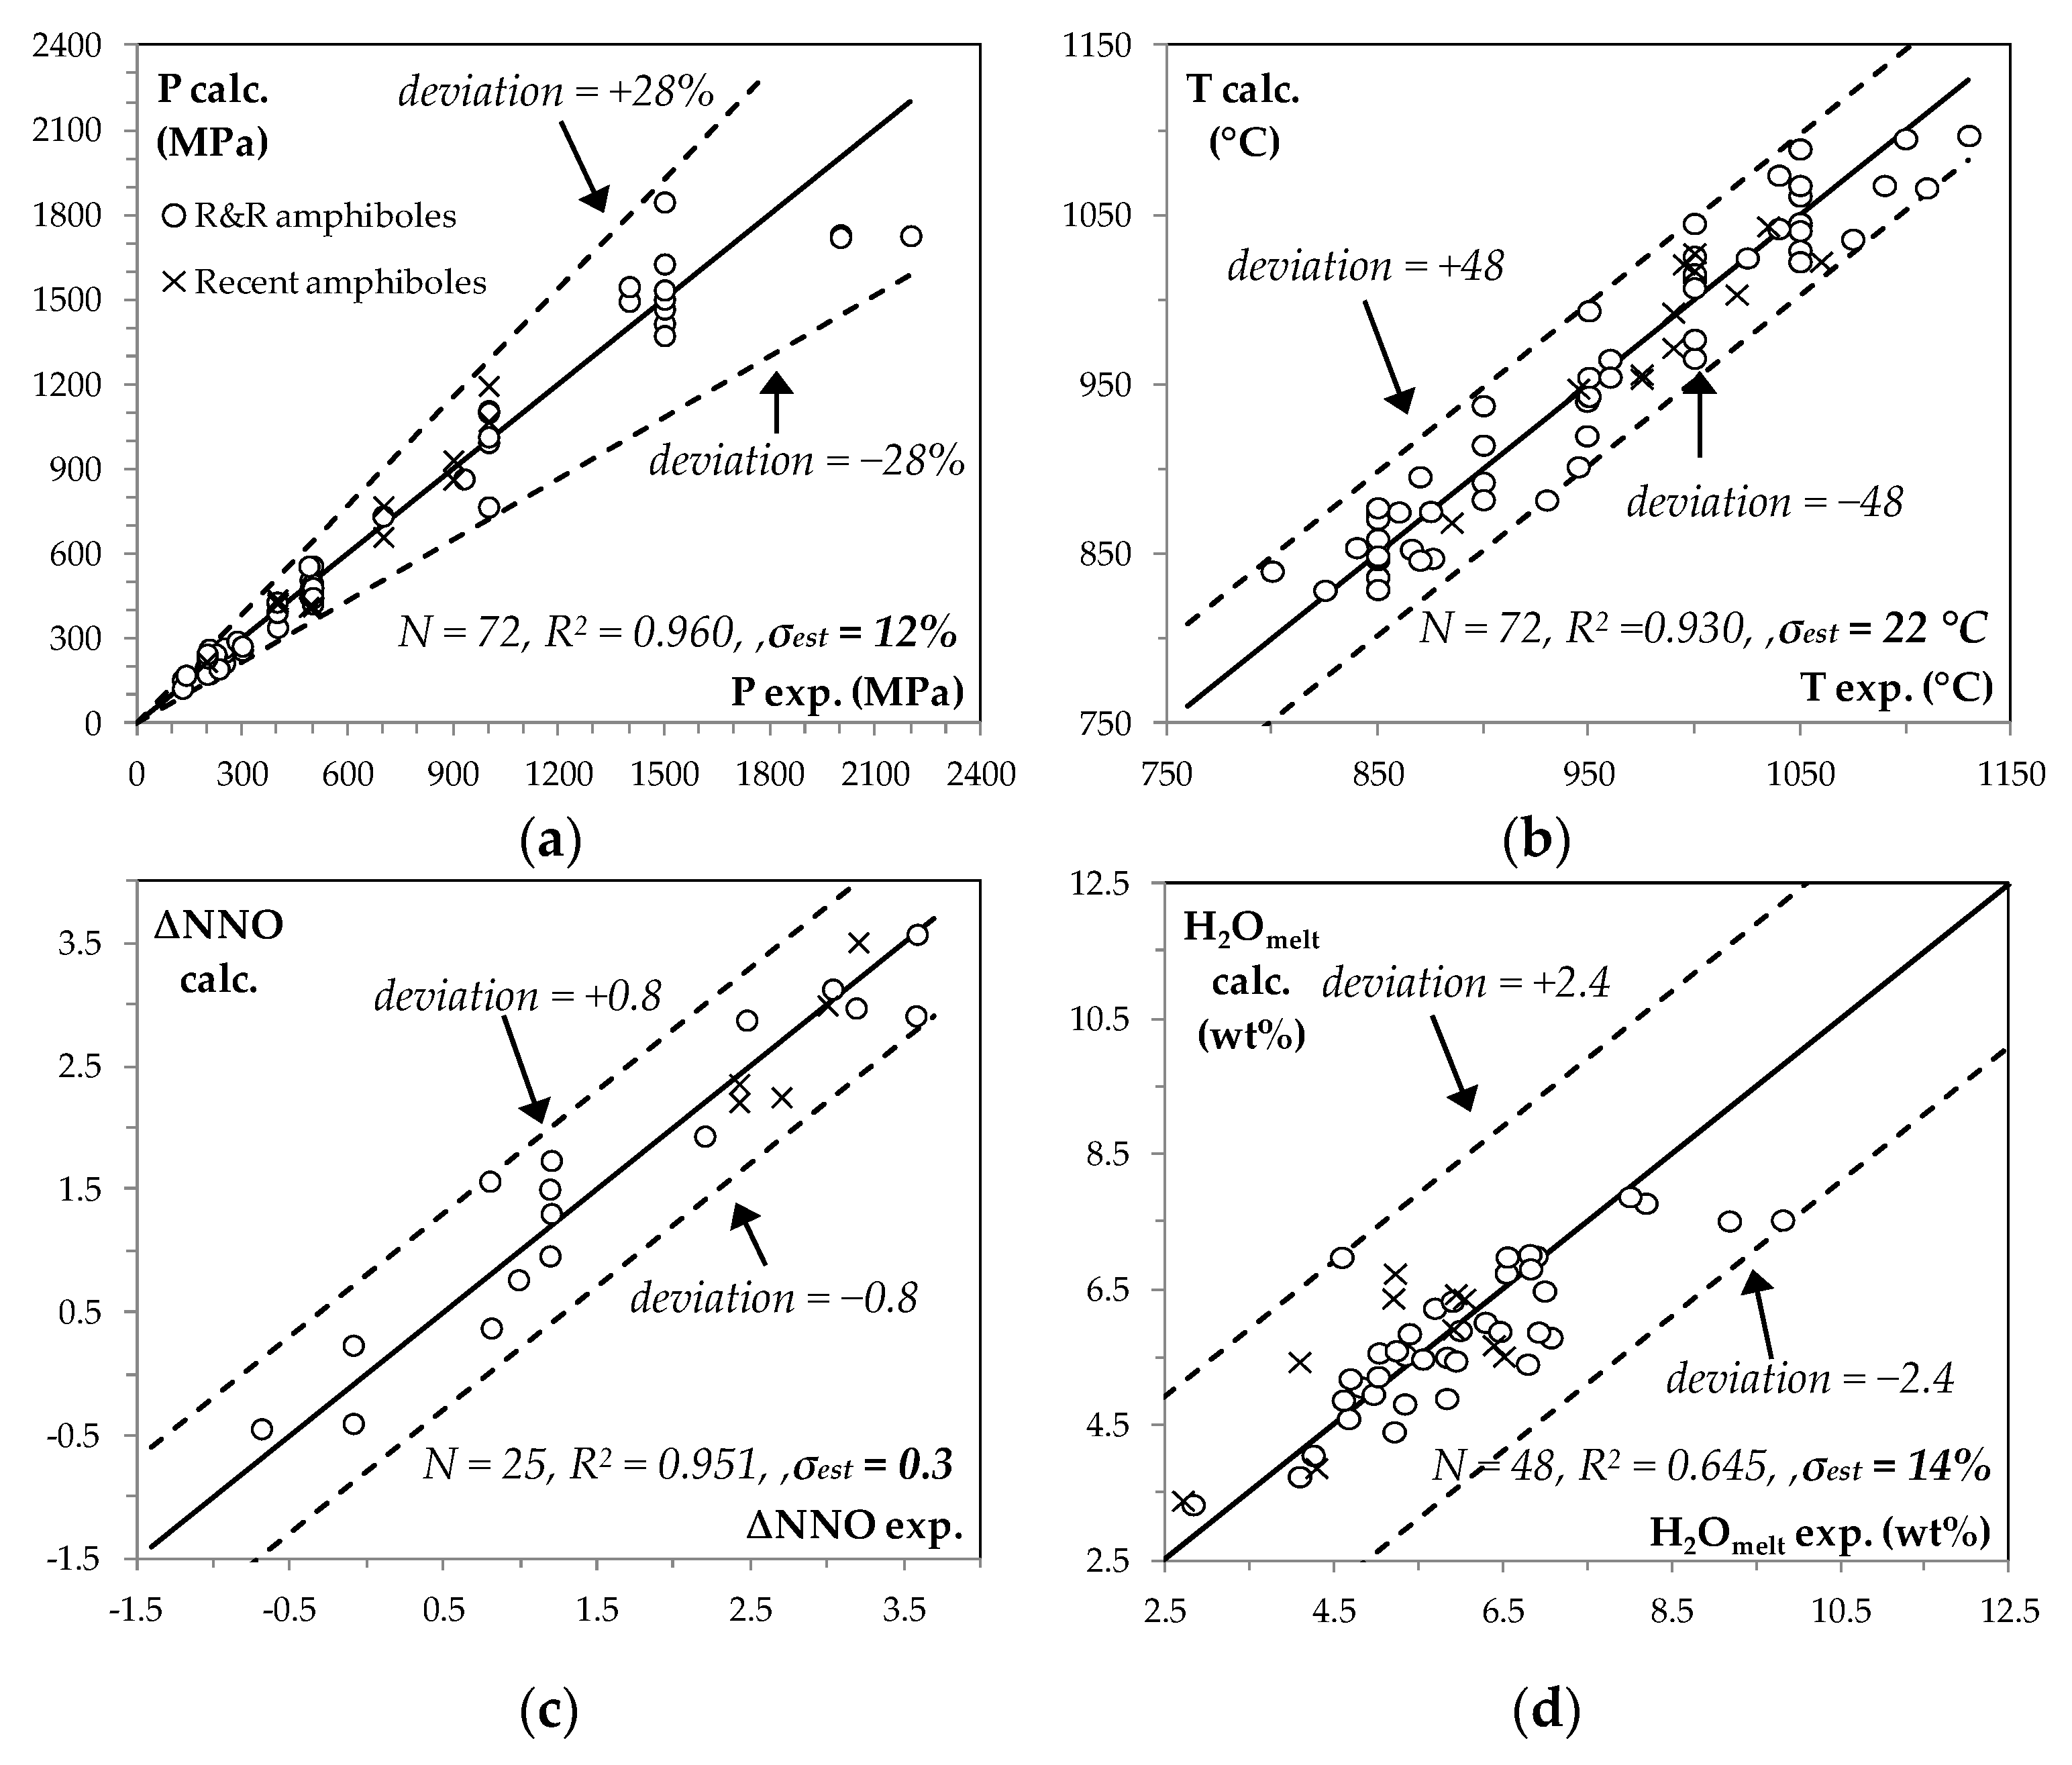
This method indicated an overall pressure uncertainty of ±12% (i.e., σest calculated on the % error of all selected data; Figure 1a), similar to those reported in [10]. APE should be lower than 60% and was only used as a warning in the spreadsheet Amp-TB2.xlsx (see below).
Once P was estimated, T was calculated using the equations two of [10]. The overall T uncertainty of ±22 °C (Figure 1b) results improved slightly with respect to that reported in [10], i.e., ±24 °C (see Section 1).
For fO2 and H2Omelt, new equations independent of P and T were calibrated by multivariate least-square analyses [10,24,40] using all the data available in Amp-TB2.xlsx:
where AlIV to K were the atoms per formula unit as calculated using the 13-cations method (see Amp-TB2.xlsx). Equation (1) accounted for an σest of ± 0.3 log units, whereas H2Omelt showed an overall uncertainty of ±14% (Figure 1c,d). Both uncertainties were lower than those reported by [10] who used a smaller amount of data.
ΔNNO = −10.321 × AlIV + 4.470 × AlVI + 7.551 × Ti + 5.463 × Fe3+ − 4.739 × Mg − 7.203 × Fe2+ − 17.561 × Mn + 13.762 × Ca
+ 13.756 × NaA + 27.594 × K (R2 = 0.951)
+ 13.756 × NaA + 27.594 × K (R2 = 0.951)
ln(H2Omelt) = −1.375 × AlIV + 1.710 × AlVI + 0.859 × Ti + 1.189 × Fe3+ − 0.676 × Mg − 0.390 × Fe2+ − 6.402 × Mn +
2.549 × Ca + 1.371 × NaA + 1.257 × K (R2 = 0.988);
2.549 × Ca + 1.371 × NaA + 1.257 × K (R2 = 0.988);
All of the above calculations can be easily performed using the spreadsheet Amp-TB2.xlsx (Supplementary Materials), in addition, reporting warnings in case the stoichiometry of the input amphiboles is not satisfied (most probably wrong analyses) and/or the composition diverges too much from those of the experimental amphiboles selected in this work. In these cases, the uncertainty of the calculated physico-chemical parameters is unknown, and the input amphibole data should be discarded or treated with caution as very strong deviations can occur when any amphibole composition departs from the experimental database used for calibrating an empirical thermobarometer (e.g., [10]). For this reason, Amp-TB2.xlsx reports warnings whenever the input Amp is outside the compositional ranges used to calibrate the model. This is particularly useful to evaluate the quality of the output ΔNNO and H2Omelt values since Equations (1) and (2) are calibrated using lower amounts of data (25 and 48, respectively; Figure 1c,d) representing smaller compositional ranges; see Amp-TB2.xlsx for practical and additional information.
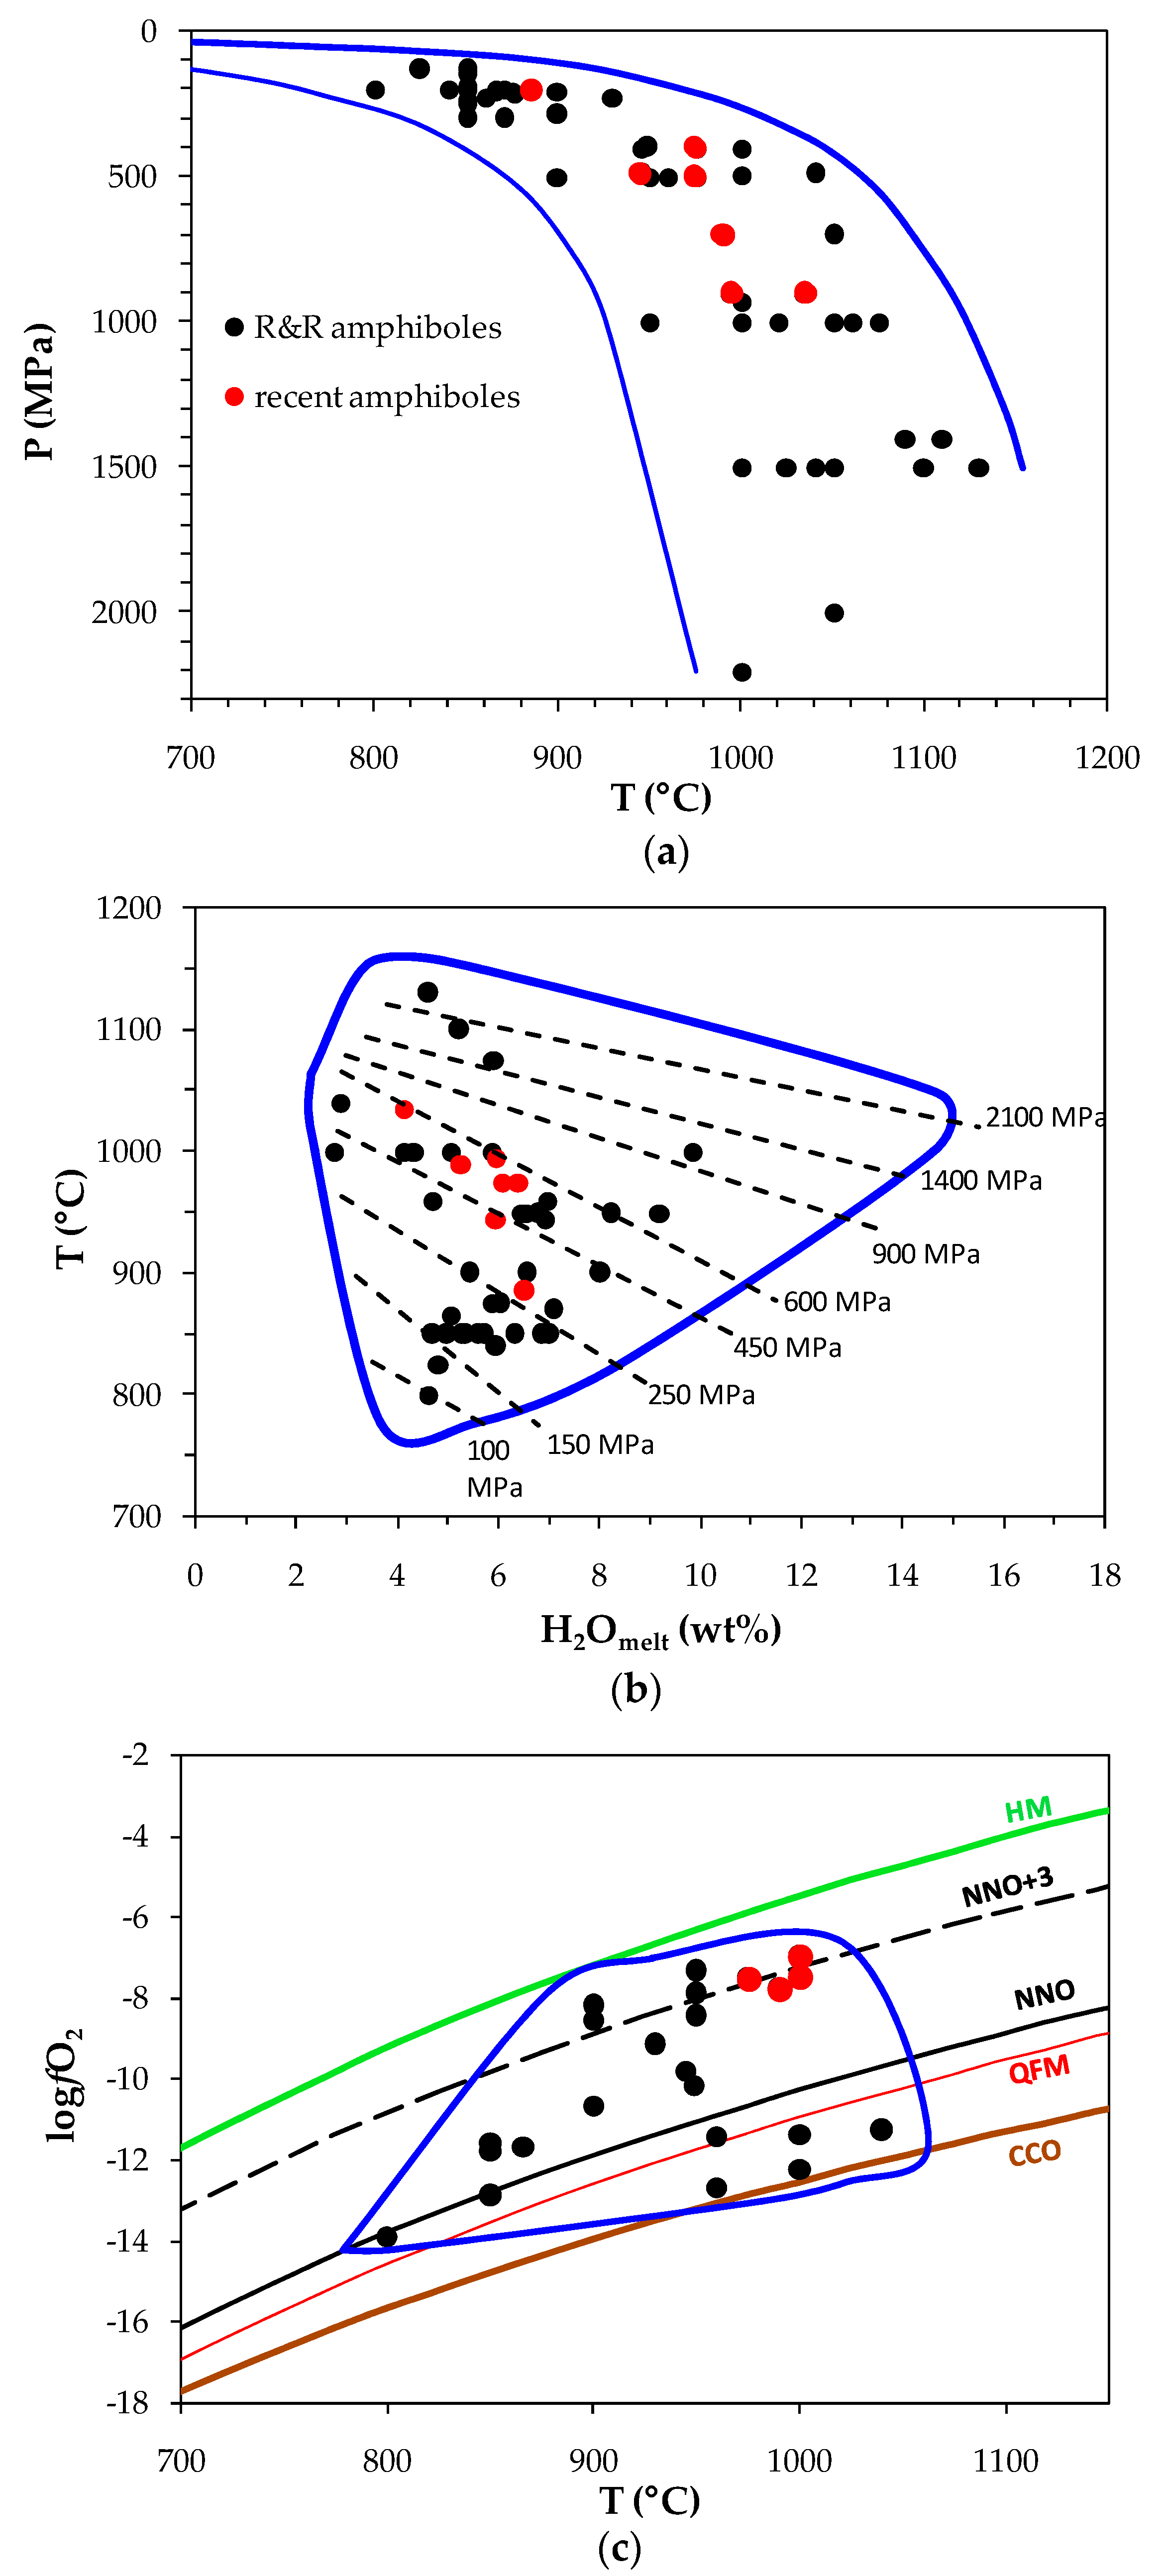
As an additional check, Figure 2 (and Amp-TB2.xlsx) reports the calibration amphiboles in diagrams such as P-T (Figure 2a), logfO2-T (Figure 2b), and T-H2Omelt (Figure 2c). The physico-chemical conditions estimated with Amp-TB2.xlsx using the composition of natural amphiboles should fall within the blue curves reported in all diagrams. Outside these curves, the uncertainties of the thermobarometric method are unknown. In Figure 2a the blue curves most probably indicate the stability of Mg-rich calcic amphibole crystallizing at magmatic steady-state (equilibrium) conditions since the experimental amphiboles cover most of the compositional and physico-chemical condition fields of volcanic ones [10,13]. To some extent, this is also valid for the field included in Figure 2b as the related experimental amphiboles were synthesized at conditions up to 1500 MPa (Amp-TB2.xlsx). In contrast, the blue curves in Figure 2c only delimit the application field of the method since they include a much smaller sample of experimental amphiboles (25; Figure 1c synthesized in narrower condition ranges i.e., 800–1040 °C; 200–700 MPa; −2.1 < ∆NNO < 3.6). In practice, Equation (1) is mostly valid for magmatic amphiboles crystallizing in the crust and upper mantle since its behavior and uncertainty at shallow (<200 MPa) and deep mantle conditions (>700 MPa) are not predictable.
The diagrams in Figure 2 are commonly used in petrology and volcanology to display changes in physico-chemical conditions in the magma feeding systems [13,20,25,26,46]. For this reason, Amp-TB2.xlsx includes additional P-T, T-H2Omelt, and logfO2-T diagrams which can be easily used to input amphibole thermobarometric results. In addition, the T-H2Omelt diagram (Figure 2b) includes isobars calculated according to Amp-Tb2.xlsx, which can be used to countercheck the results.
For the application of this thermobarometric model, it is highly recommended to check the quality of the natural Amp compositions using AMFORM.xlsx [40] and follow the approach suggested by [25,26]. To get tight, physico-chemical constraints, it is suggested to avoid the application of Amp-TB2.xlsx to amphiboles crystallized hydrothermally (i.e., from a gaseous phase; e.g., [13]) and to volcanic amphiboles showing disequilibrium textures (e.g., microlites, phenocrysts with acicular, elongate, and hopper morphologies). It is also highly recommended to perform rim-rim or core-rim transect EMP analyses for identifying intra-crystal domains with a homogeneous composition and evaluate (and display into the diagrams of Figure 2) the average and standard deviation of the calculated physico-chemical parameters for each crystal [25].
The results of this single-Amp application to recently erupted volcanic products should be in agreement with constraints from complementary methodologies such as magma storage depths estimates by geophysical data [13,19,26,30,31,32,33,34,35,36,37].
Finally, it is worth noting that testing Amp-TB2.xlsx with experimental amphiboles may lead to misleading results [26,38]. To obtain a homogeneous density of data within the calibration physico-chemical ranges of the five P equations (see above), several literature experimental amphiboles were, discarded although they show relatively high-quality [10]. This means that the application of Amp-TB2.xlsx to additional experimental amphibole data with moderately high-quality will show P, T, fO2, and H2Omelt values consistent with the experimental ones. In contrast, the application of Amp-thermobarometry to inhomogeneous experimental amphiboles and/or showing disequilibrium textures will apparently (and erroneously) result in physico-chemical large deviations since the chemical equilibrium was not sufficiently approached during the experiments [26].
Supplementary Materials
Funding
This research was funded by the Alexander von Humboldt-Stiftung, with a research fellowship to the author, and the Deutsche Forschungsgemeinschaft (DFG), grant number 60422335.A.
Data Availability Statement
Data supporting reported results can be found in the Supplementary Materials Amp-TB2.xlsx.
Acknowledgments
F. Holtz and many other scientists at the Institut für Mineralogie at LUH are thanked for their support.
Conflicts of Interest
The authors declare no conflict of interest.
References
- Foley, S.; Tiepolo, M.; Vannucci, R. Growth of early continental crust controlled by melting of amphibolite in subduction zones. Nature 2002, 417, 837–840. [Google Scholar] [CrossRef] [PubMed]
- Forbes, W.C.; Starmer, R.J. Kaersutite is a possible source of alkali olivine basalts. Nature 1974, 250, 209–210. [Google Scholar] [CrossRef]
- Hawthorne, F.C.; Oberti, R.; Della Ventura, G.; Mottana, A. Amphibole: Crystal Chemistry, Occurrence, and Health Issues; Rosso, J.J., Ed.; Mineralogical Society of America: Chantilly, VA, USA, 2007; Volume 67, pp. 1–545. [Google Scholar]
- Jackson, C.R.M.; Parman, S.W.; Kelley, S.P.; Cooper, R.F. Noble gas transport into the mantle facilitated by high solubility in amphibole. Nat. Geosci. 2013, 6, 562–565. [Google Scholar] [CrossRef]
- McCanta, M.C.; Treiman, A.H.; Dyar, M.D.; Alexander, C.M.O.; Rumble, D., III; Essene, E.J. The LaPaz Icefield 04840 meteorite: Mineralogy, metamorphism, and origin of an amphibole-and biotite-bearing R chondrite. Geochim. Cosmochim. Acta 2008, 72, 5757–5780. [Google Scholar] [CrossRef]
- Rutherford, M.J.; Hill, P.M. Magma ascent rates from amphibole breakdown; an experimental study applied to the 1980–1986 Mount St. Helens eruptions. J. Geophys. Res. 1993, 98, 19667–19685. [Google Scholar] [CrossRef]
- Smith, D.J. Clinopyroxene precursors to amphibole sponge in arc crust. Nat. Comm. 2014, 5, 4329. [Google Scholar] [CrossRef] [Green Version]
- Hawthorne, F.C.; Oberti, R.; Harlow, G.E.; Maresch, W.V.; Martin, R.F.; Schumacher, J.C.; Welch, M.D. IMA Report—Nomenclature of the amphibole supergroup. Am. Mineral. 2012, 97, 2031–2048. [Google Scholar] [CrossRef]
- Holland, T.J.B.; Blundy, J.D. Non-ideal interactions in calcic amphiboles and their bearing on amphibole-plagioclase thermometry. Contrib. Mineral. Petrol. 1994, 116, 433–447. [Google Scholar] [CrossRef]
- Ridolfi, F.; Renzulli, A. Calcic amphiboles in calc-alkaline and alkaline magmas: Thermobarometric and chemometric empirical equations valid up to 1130 °C and 2.2 GPa. Contrib. Mineral. Petrol. 2012, 163, 877–895. [Google Scholar] [CrossRef]
- Zhang, J.; Humphreys, M.C.S.; Cooper, G.F.; Davidson, J.P.; Macpherson, C.G. Magma mush chemistry at subduction zones, revealed by new melt major element inversion from calcic amphiboles. Am. Miner. 2017, 102, 1353–1367. [Google Scholar] [CrossRef] [Green Version]
- Johnson, M.C.; Rutherford, M.J. Experimental calibration of the aluminum-in-hornblende geobarometer with application to Long Valley caldera (California) volcanic rocks. Geology 1989, 17, 837–841. [Google Scholar] [CrossRef]
- Ridolfi, F.; Renzulli, A.; Puerini, M. Stability and chemical equilibrium of amphibole in calc-alkaline magmas: An overview, new thermobarometric formulations and application to subduction-related volcanoes. Contrib. Mineral. Petrol. 2010, 160, 45–66. [Google Scholar] [CrossRef]
- Andersen, D.J.; Lindsley, D.H. Internally consistent solution models for Fe-Mg-Mn-Ti oxides: Fe-Ti oxides. Am. Mineral. 1988, 73, 714–726. [Google Scholar]
- Beattie, P. Olivine-melt and orthopyroxene-melt equilibria. Contrib. Mineral. Petrol. 1993, 115, 103–111. [Google Scholar] [CrossRef]
- Putirka, K.D.; Mikaelian, H.; Ryerson, F.; Shaw, H. New clinopyroxene-liquid thermobarometers for mafic, evolved, and volatile-bearing lava compositions, with applications to lavas from Tibet and the Snake River Plain, Idaho. Am. Mineral. 2003, 88, 1542–1554. [Google Scholar] [CrossRef]
- Putirka, K.D. Igneous thermometers and barometers based on plagioclase+ liquid equilibria: Tests of some existing models and new calibrations. Am. Mineral. 2005, 90, 336–346. [Google Scholar] [CrossRef]
- Rutherford, M.J.; Devine, J.D. Magmatic conditions and magma ascent as indicated by hornblende phase equilibria and reactions in the 1995–2002 Soufriere Hills magma. J. Petrol. 2003, 44, 1433–1454. [Google Scholar] [CrossRef] [Green Version]
- Ridolfi, F.; Puerini, M.; Renzulli, A.; Menna, M.; Toulkeridis, T. The magmatic feeding system of El Reventador volcano (Sub-Andean zone, Ecuador) constrained by texture, mineralogy and thermobarometry of the 2002 erupted products. J. Volcanol. Geotherm. Res. 2008, 176, 94–106. [Google Scholar] [CrossRef]
- Kiss, B.; Harangi, S.; Ntaflos, T.; Mason, P.R.D.; Pál-Molnár, E. Amphibole perspective to unravel pre-eruptive processes and conditions in volcanic plumbing systems beneath intermediate arc volcanoes: A case study from Ciomadul volcano (SE Carpathians). Contrib. Mineral. Petrol. 2014, 167, 986. [Google Scholar] [CrossRef]
- Bédard, J.H. Trace element partitioning between silicate melts and orthopyroxene: Parameterizations of D variations. Chem. Geol. 2007, 244, 263–303. [Google Scholar] [CrossRef]
- Putirka, K.D. Thermometers and barometers for volcanic systems. Rev. Mineral. Geochem. 2008, 69, 61–120. [Google Scholar] [CrossRef]
- Lee, C.-T.A.; Luffi, P.; Plank, T.; Dalton, H.; Leeman, W.P. Constraints on the depths and temperatures of basaltic magma generation on Earth and other terrestrial planets using new thermobarometers for mafic magmas. Earth Plan. Sci. Lett. 2009, 279, 20–33. [Google Scholar] [CrossRef]
- Ridolfi, F.; Renzulli, A.; Acosta-Vigil, A. On the stability of magmatic cordierite and new thermobarometric equations for cordierite-saturated liquids. Contrib. Mineral. Petrol. 2014, 167, 996. [Google Scholar] [CrossRef]
- Ridolfi, F.; Renzulli, A.; Perugini, D.; Cesare, B.; Braga, R.; Del Moro, S. Unravelling the complex interaction between mantle and crustal magmas encoded in the lavas of San Vincenzo (Tuscany, Italy). Part I: Petrography and Thermobarometry. Lithos 2016, 244, 218–232. [Google Scholar] [CrossRef]
- Gorini, A.; Ridolfi, F.; Piscaglia, F.; Taussi, M.; Renzulli, A. Application and reliability of calcic amphibole thermobarometry as inferred from calc-alkaline products of active geothermal areas in the Andes. J. Volcanol. Geotherm. Res. 2018, 358, 58–76. [Google Scholar] [CrossRef]
- Almeev, R.R.; Holtz, F.; Ariskin, A.A.; Limura, J.-I. Storage conditions of Bezymianny Volcano parental magmas: Results of phase equilibria experiments at 100 and 700 MPa. Contrib. Mineral. Petrol. 2013, 166, 1389–1414. [Google Scholar] [CrossRef]
- Blatter, D.L.; Sisson, T.W.; Hankins, W.B. Crystallization of oxidized, moderately hydrous arc basalt at mid to lower-crustal pressures: Implications for andesite genesis. Contrib. Mineral. Petrol. 2013, 166, 861–886. [Google Scholar] [CrossRef]
- Krawczynski, M.J.; Grove, T.L.; Behrens, H. Amphibole stability in primitive arc magmas: Effects of temperature, H2O content, and oxygen fugacity. Contrib. Mineral. Petrol. 2012, 164, 317–339. [Google Scholar] [CrossRef]
- Innocenti, S.; del Marmol, M.-A.; Voight, B.; Andreastuti, S.; Furman, T. Textural and mineral chemistry constraints on evolution of Merapi Volcano, Indonesia. J. Volcanol. Geotherm. Res. 2013, 261, 20–37. [Google Scholar] [CrossRef]
- Trua, T.; Marani, M.; Barca, D. Lower crustal differentiation processes beneath a back-arc spreading ridge (Marsili seamount, Southern Tyrrhenian Sea). Lithos 2014, 190–191, 349–362. [Google Scholar] [CrossRef]
- Burns, D.H.; de Silva, S.L.; Tepley, F., III; Schmitt, A.K.; Loewen, M.W. Recording the transition from flare-up to steady-state arc magmatism at the Purico–Chascon volcanic complex, northern Chile. Earth Plan. Sci. Lett. 2015, 422, 75–86. [Google Scholar] [CrossRef]
- Harangi, S.; Novák, A.; Kiss, B.; Seghedi, I.; Lukács, R.; Szarka, L.; Wesztergom, V.; Metwaly, M.; Gribovszki, K. Combined magnetotelluric and petrologic constrains for the nature of the magma storage system beneath the Late Pleistocene Ciomadul volcano (SE Carpathians). J. Volcanol. Geotherm. Res. 2015, 290, 82–96. [Google Scholar] [CrossRef]
- Dobretsov, N.L.; Simonov, V.A.; Koulakov, I.Y.; Kotlyarov, A.V. Migration of fluids and melts in subduction zones and general aspects of thermophysical modeling in geology. Rus. Geol. Geophys. 2017, 58, 571–585. [Google Scholar] [CrossRef]
- Mata, J.; Martins, S.; Mattielli, N.; Madeira, J.; Faria, B.; Ramalho, R.S.; Silva, P.; Moreira, M.; Caldeira, R.; Moreira, M.; et al. The 2014-15 eruption and the short-term geochemical evolution of the Fogo volcano (Cape Verde): Evidence for small-scale mantle heterogeneity. Lithos 2017, 288–289, 91–107. [Google Scholar] [CrossRef]
- Nagasaki, S.; Ishibashi, H.; Suwa, Y.; Yasuda, A.; Hokanishi, N.; Ohkura, T.; Takemura, K. Magma reservoir conditions beneath Tsurumi volcano, SW Japan: Evidence from amphibole thermobarometry and seismicity. Lithos 2017, 278–281, 153–165. [Google Scholar] [CrossRef]
- Stechern, A.; Just, T.; Holtz, F.; Blume-Oeste, M.; Namur, O. Decoding magma plumbing and geochemical evolution beneath the Lastarria volcanic complex (Northern Chile)—Evidence for multiple magma storage regions. J. Volcanol. Geotherm. Res. 2017, 338, 25–45. [Google Scholar] [CrossRef]
- Erdmann, S.; Martel, M.; Pichavant, M.; Kushnir, A. Amphibole as an archivist of magmatic crystallization conditions: Problems, potential, and implications for inferring magma storage prior to the paroxysmal 2010 eruption of Mount Merapi, Indonesia. Contrib. Mineral. Petrol. 2014, 167, 1016. [Google Scholar] [CrossRef] [Green Version]
- Putirka, K.D. Amphibole thermometers and barometers for igneous systems and some implications for eruption mechanisms of felsic magmas at arc volcanoes. Am. Mineral. 2016, 101, 841–858. [Google Scholar] [CrossRef]
- Ridolfi, F.; Zanetti, A.; Renzulli, A.; Perugini, D.; Holtz, F.; Oberti, R. AMFORM, a new mass-based model for the calculation of the unit formula of amphiboles from Electron Micro-Probe analyses. Am. Mineral. 2018, 103, 1112–1125. [Google Scholar] [CrossRef]
- Andujar, J.; Scaillet, B.; Pichavant, M.; Druitt, T.H. Differentiation conditions of a basaltic magmafrom santorini, and its bearing on theproduction of andesite in arc settings. J. Petrol. 2015, 56, 765–794. [Google Scholar] [CrossRef] [Green Version]
- Riker, J.M.; Blundy, J.D.; Rust, A.C.; Botcharnikov, R.E.; Humphreys, M.C.S. Experimental phase equilibria of a Mount St. Helens rhyodacite: A framework for interpreting crystallization paths in degassing silicic magmas. Contrib. Mineral. Petrol. 2015, 170, 6. [Google Scholar] [CrossRef] [Green Version]
- Iacovino, K.; Oppenheimer, C.; Scaillet, B.; Kyle, P. Storage and evolution of mafic and intermediate alkaline magmas beneath Ross Island, Antarctica. J. Petrol. 2016, 57, 93–118. [Google Scholar] [CrossRef] [Green Version]
- Ulmer, P.; Kägi, R.; Müntener, O. Experimentally derived intermediate to silicarich arc magmas by fractional and equilibrium crystallization at 1.0 GPa: An evaluation ofphase relationships, compositions, liquid linesof descent and oxygen fugacity. J. Petrol. 2018, 59, 11–58. [Google Scholar] [CrossRef] [Green Version]
- Hirschmann, M.M.; Ghiorso, M.S.; Davis, F.A.; Gordon, S.M.; Mukherjee, S.; Grove, T.L.; Krawczynski, M.; Medard, E.; Till, C.B. Library of Experimental Phase Relations (LEPR): A database and Web portal for experimental magmatic phase equilibria Data. G3 2008, 9, 3. [Google Scholar] [CrossRef]
- Costa, F.; Andreastuti, S.; Bouvet de Maisonneuve, C.; Pallister, J.S. Petrological insights into the storage conditions, and magmatic processes that yielded the centennial 2010 Merapi explosive eruption. J. Volcanol. Geotherm. Res. 2013, 261, 209–235. [Google Scholar] [CrossRef]
- Adam, J.; Green, T.H. The effects of pressure and temperature on the partitioning of Ti, Sr and REE between amphibole, clinopyroxene and basanitic melts. Chem. Geol. 1994, 117, 219–233. [Google Scholar] [CrossRef]
- Gardner, J.E.; Carey, S.; Sigurdsson, H.; Rutherford, M.J. Influence of magma composition on the eruptive activity of Mount St. Helens, Washington. Geology 1995, 23, 523–526. [Google Scholar] [CrossRef]
- Moore, G.; Carmichael, I.E.S. The hydrous phase equilibria (to 3 kbar) of an andesite and basaltic andesite from western Mexico: Constraints on water content and conditions of phenocryst growth. Contrib. Mineral. Petrol. 1998, 130, 304–319. [Google Scholar] [CrossRef]
- Martel, C.; Pichavant, M.; Holtz, F.; Scaillet, B.; Bourdier, J.L.; Traineau, H. Effects of fO2 and H2O on andesite phase relation between 2 and 4 kbar. J. Geophys. Res. 1999, 104, 29453–29470. [Google Scholar] [CrossRef] [Green Version]
- Scaillet, B.; Evans, B.W. The 15 June 1991 eruption of Mount Pinatubo; I, Phase equilibria and pre-eruption P–T–fO2–fH2 conditions of the dacite magmas. J. Petrol. 1999, 40, 381–411. [Google Scholar] [CrossRef]
- Dalpé, C.; Baker, D.R. Experimental investigation of large-ion-lithophile-element-, high-field-strength-element- and rare-earthelement-partitioning between calcic amphibole and basaltic melt: The effects of pressure and oxygen fugacity. Contrib. Mineral. Petrol. 2000, 140, 233–250. [Google Scholar]
- Kaszuba, J.P.; Wendlandt, R.F. Effect of carbon dioxide on dehydration melting reactions and melt compositions in the lower crust and the origin of alkaline rocks. J. Petrol. 2000, 41, 363–386. [Google Scholar] [CrossRef] [Green Version]
- Pichavant, M.; Martel, C.; Bourdier, J.L.; Scaillet, B. Physical conditions, structure, and dynamics of a zoned magma chamber: Mount Pelee‘ (Martinique, Lesser Antilles Arc). J. Geophys. Res. 2002, 107, 2093. [Google Scholar] [CrossRef]
- Costa, F.; Scaillet, B.; Pichavant, M. Petrological and experimental constraints on the pre-eruption compositions of Holocene dacite from Volca‘n San Pedro (36S, Chilean Andes) and importance of sulphur in silicic subduction-related magmas. J. Petrol. 2004, 45, 855–881. [Google Scholar] [CrossRef]
- Nekvasil, H.; Dondolini, A.; Horn, J.; Filiberto, J.; Long, H.; Lindsley, D.H. The origin and evolution of silica-saturated alkalic suites: An experimental study. J. Petrol. 2004, 45, 693–721. [Google Scholar] [CrossRef] [Green Version]
- Sato, H.; Holtz, F.; Beherens, H.; Botcharnikov, R.; Nakada, S. Experimental petrology of the 1991–1995 Unzen Dacite, Japan. Part II: Cl/OH partitioning between hornblende and melt and its implications for the origin of oscillatory zoning of hornblende phenocrysts. J. Petrol. 2005, 42, 339–354. [Google Scholar] [CrossRef] [Green Version]
- Caricchi, L.; Ulmer, P.; Peccerillo, A. A high-pressure experimental study on the evolution of the silicic magmatism of the Main Ethiopian Rift. Lithos 2006, 91, 46–58. [Google Scholar] [CrossRef]
- Adam, J.; Oberti, R.; Ca´mara, F.; Green, T.H. An electron microprobe, LAM-ICP-MS and single-crystal X-ray structure refinement study of the effect of pressure, melt-H2O concentration and fO2 on experimentally produced basaltic amphiboles. Eur. J. Mineral. 2007, 19, 641–655. [Google Scholar] [CrossRef]
- McCanta, M.C.; Rutherford, M.J.; Hammer, J.E. Pre-eruptive and syn-eruptive conditions in the Black Butte, California dacite: Insight into crystallization kinetics in a silicic magma system. J. Volcanol. Geotherm. Res. 2007, 160, 263–284. [Google Scholar] [CrossRef]
- Irving, A.J.; Green, D.H. Phase relationships of hydrous alkali magmas at high pressures: Production of nepheline hawaiitic to mugearitic liquids by amphibole-dominated fractional crystallization within the lithospheric mantle. J. Petrol. 2008, 49, 741–756. [Google Scholar] [CrossRef] [Green Version]
- Rutherford, M.J.; Devine, J.D. Magmatic conditions and processes in the storage zone of the 2004–2006 Mount St. Helens Dacite. In A Volcano Rekindled: The Renewed Eruption of Mount St. Helens, 2004–2006; US Geological Survey Professional Paper, 2007–2008; Sherrod, D.R., Scott, W.E., Stauffer, P.H., Eds.; US Geological Survey: Reston, VA, USA, 2008; Chapter 31; p. 24. [Google Scholar]
- Mercer, C.; Johnston, A.D. Experimental studies of the P–T–H2O near-liquidus phase relations of basaltic andesite from North Sister Volcano, High Oregon Cascades: Constraints on lower-crustal mineral assemblages. Contrib. Mineral. Petrol. 2008, 155, 571–592. [Google Scholar] [CrossRef]
- Freise, M.; Holtz, F.; Nowak, M.; Scoates, J.S.; Strauss, H. Differentiation and crystallization conditions of basalts from the Kerguelen large igneous province: An experimental study. Contrib. Mineral. Petrol. 2009, 158, 505–527. [Google Scholar] [CrossRef]
- Pietranik, A.; Holtz, F.; Koepke, J.; Puziewicz, J. Crystallization of quartz dioritic magmas at 2 and 1 kbar: Experimental results. Mineral. Petrol. 2009, 97, 1–21. [Google Scholar] [CrossRef]
- Pilet, S.; Ulmer, P.; Villiger, S. Liquid line of descent of a basanitic liquid at 1.5 Gpa: Constraints on the formation of metasomatic veins. Contrib. Mineral. Petrol. 2010, 159, 621–643. [Google Scholar] [CrossRef] [Green Version]
Figure 1.
Correlations between calculated (calc. Using Amp-TB2.xlsx) and experimental (exp.) physico-chemical conditions ((a) P; (b) T; (c) ΔNNO; (d) H2Omelt). R&R indicates amphibole data selected by [10], whereas recent amphiboles represent the newly selected data in this work (see text and Amp-TB2-xlsx). Overall statistic parameters such as sample size (N; i.e., the overall number of data), determination coefficient (R2), and standard error of the estimate (σest) are also reported (note that the % value is σest calculated on the percentage error). The 1:1 line (solid) is reported in all diagrams. Dashed lines indicate maximum and minimum deviations (errors) shown and expected by the model.

Figure 2.
(a) P vs. T, (b) T vs. H2Omelt, and (c) logfO2 vs. T diagrams for the experimental amphiboles selected in this work (both recent and those in [10], i.e., R&R). The blue curves are drawn by considering the uncertainties of Amp-TB2.xlsx and delimit the validity of the method. The dashed lines in (b) show isobars, whereas (c) reports the most common metal-metal oxide buffers according to [45].

Publisher’s Note: MDPI stays neutral with regard to jurisdictional claims in published maps and institutional affiliations. |
© 2021 by the author. Licensee MDPI, Basel, Switzerland. This article is an open access article distributed under the terms and conditions of the Creative Commons Attribution (CC BY) license (http://creativecommons.org/licenses/by/4.0/).
Share and Cite
MDPI and ACS Style
Ridolfi, F. Amp-TB2: An Updated Model for Calcic Amphibole Thermobarometry. Minerals 2021, 11, 324. https://doi.org/10.3390/min11030324
AMA Style
Ridolfi F. Amp-TB2: An Updated Model for Calcic Amphibole Thermobarometry. Minerals. 2021; 11(3):324. https://doi.org/10.3390/min11030324
Chicago/Turabian StyleRidolfi, Filippo. 2021. "Amp-TB2: An Updated Model for Calcic Amphibole Thermobarometry" Minerals 11, no. 3: 324. https://doi.org/10.3390/min11030324
Note that from the first issue of 2016, this journal uses article numbers instead of page numbers. See further details here.