Article

Effects of Mechanical Activation on the Bioleaching of Sphalerite and Marmatite for Zn Extraction

1
School of Minerals Processing and Bioengineering, Central South University, Changsha 410083, China
2
Key Lab of Biohydrometallurgy of Ministry of Education, Changsha 410083, China
*
Authors to whom correspondence should be addressed.
Minerals 2021, 11(2), 111; https://doi.org/10.3390/min11020111
Submission received: 3 January 2021 / Revised: 19 January 2021 / Accepted: 19 January 2021 / Published: 23 January 2021
(This article belongs to the Collection Bioleaching)

Abstract

:
Even though mechanical activation is a significant pretreatment technology for the efficient extraction of metals from mineral resources, its effects on the bioleaching of sphalerite and marmatite are rarely discussed. In this study, mechanical activation pretreatment using various grinding media and grinding times was conducted, and particle size distribution, morphology, X-ray diffraction (XRD) and energy dispersive spectrometry (EDS) analyses, as well as batch bioleaching experiments, were carried out. The results suggest that #C conditions (corundum jar with zirconia balls) were more efficient than #S conditions (stainless steel jar with stainless steel balls) for the grinding of both sphalerite and marmatite. Mechanical activation significantly improved the bioleaching of sphalerite; however, it inhibited that of marmatite, possibly due to the formation of reactive oxygen species (ROS). The optimum grinding conditions for the bioleaching of sphalerite and marmatite are proposed.

1. Introduction

Zinc, mainly derived from Zn sulfide minerals [1], is the fourth most momentous metal in the world, after iron, aluminum, and copper [2]. Sphalerite (ZnS) is the principal zinc-bearing mineral in nature, and generally occurs with a variety of other metal sulfides, such as chalcopyrite (CuFeS2), galena (PbS), and pyrite (FeS2), next to gangue minerals [3]. During the mineralization process, zinc sites in the lattice structure of sphalerite can be substituted by multiple impurity ions, especially iron ions [4] Marmatite (ZnxFe1-xS) occurs when the iron content reaches 6% (commonly, the Fe content is 6% to 25%, but can be even greater) [5]. Both sphalerite and marmatite have similar cubic crystalline structures [6,7], but the lattice dimensions decrease when the iron content increases [8]. Also, the conductivity, surface hydrophobicity, and surface defects of sphalerite/marmatite increase when the iron content increases [6,8], significantly affecting their flotation and metal extraction.
Sphalerite and marmatite are traditionally selected from raw ores by froth flotation to acquire the corresponding concentrates [3]. At present, around 90% of zinc is produced from concentrates by conventional roasting-leaching-electrowinning (RLE) and pressure hydrometallurgy processes [2,9,10]. Although relatively high leaching rates can be achieved by these methods, the ensuing environmental problems (e.g., SO2 emissions from the RLE process) and high costs (e.g., energy consumption for roasting and pressure generation, equipment, and operation costs) are pressing issues. Bioleaching that proceeds at normal pressure and temperature is considered to be a promising alternative technology [11,12,13].
The bioleaching of sphalerite/marmatite with different acidophilic prokaryotes has been described in previous reports: Acidithiobacillus (At.) thiooxidans and At. ferrooxidans mixed culture was used at 30 °C [14], Leptospirillum (L.) ferriphilum at 25–45 °C [2] and at 40 °C [15], At. ferrooxidans, At. thiooxidans and L. ferriphilum mixed culture at 35 °C [11], L. ferriphilum, At. caldus, Sulfobacillus sp. and Ferroplasma sp. mixed culture at 45 and 50 °C [16], At. ferrooxidans at 30–36 °C [17], etc. In these reports, the effects of the following parameters were investigated: temperature/kinetics [2], bioreactor type, particle surface [14], microwave treatment [18], pH, nutrient media, ferrous ion concentration [16], pulp density [17], ferric ion concentration [15], and particle size [19].
Mechanical activation is considered to be a crucial factor affecting the sphalerite/marmatite flotation and extraction processes [20,21]. Mechanical activation by grinding may destroy the mineral structure and alter the lattice dimension, specific surface, and particle size, thus affecting mineral dissolution [22,23,24]. Grinding time is directly related to production cost and efficiency [22]. Various grinding media also have different effects on mineral processing. The use of a porcelain grinding medium could reduce the galvanic effect between the minerals and grinding media [20]. A stainless steel medium inevitably introduces iron into the bioleaching system, which might affect the processing conditions and microorganism activity, thus affecting mineral dissolution.
In this study, the effects of mechanical activation, including grinding media (corundum, similar to porcelain, and stainless steel) and grinding time (30, 60, and 120 min), on the bioleaching of sphalerite (1.18% iron) and marmatite (12.29% iron) were investigated. At. ferrooxidans was selected and used for the mineral bioleaching due to its general abundance in mine and mine-impacted environments. X-ray diffraction (XRD) analysis, particle size distribution analysis, scanning electron microscopy (SEM), and energy dispersive spectrometry (EDS) were utilized to explore the mineral structure, particle size, specific surface, and morphology information. Subsequently, batch bioleaching experiments were carried out to investigate the metal extraction efficiency and process kinetics. The results obtained from this study may provide guidance on efficient metal extraction from sphalerite/marmatite, and broaden the knowledge and awareness of the scientific community about the effects of mechanical activation on the bioleaching process.

2. Materials and Methods

2.1. Materials

In this work, At. ferrooxidans (CCTCC AB 206207) was obtained from the Key Laboratory of Biohydrometallurgy of Ministry of Education of Central South University in Changsha, China, and cultivated for bioleaching experiments using 9K medium ((NH4)2SO4 (3.0 g/L), MgSO4·7H2O (0.5 g/L), K2HPO4 (0.5 g/L), KCl (0.1 g/L), Ca(NO3)2 (0.01 g/L), FeSO4·7H2O (44.7 g/L)), as previously described [25].
Mineral samples were purchased from Huadong Ye’s Stone Specimen Firm, Huadu District, Guangzhou, Guangdong Province, China. Sphalerite and marmatite samples were mined from the Inner Mongolia Autonomous Region and Hunan Province (both in China), respectively. The results of the elemental analysis are shown in Table 1, indicating that there were some impurities in the mineral samples, while the XRD patterns (Figure 1) suggest that both mineral samples were of high purity. Prior to the mechanical activation, the samples of sphalerite and marmatite were pre-ground to 38 to 74 µm particle diameter in a ceramic ball mill (Changsha Tencan Powder Technology Company Limited, Changsha, China).

2.2. Methods

2.2.1. Mechanical Activation Methods

Mechanical activation of the mineral samples was conducted using a planetary mill (YXQM-2L, MITR/Changsha Miqi Instrument Equipment Company Limited, Changsha, China) with a rotational speed of 300 rpm, and three grinding times (30, 60, and 120 min). Two different grinding media (MITR/Changsha Miqi Instrument Equipment Company Limited, Changsha, China) were utilized: a corundum jar (50 mL) with zirconia balls (#C) and a stainless steel jar (50 mL) with stainless steel balls (#S). For both grinding media, 10 g of the mineral samples was mixed with 70 g of grinding balls of different diameters, including 10 g of 10-mm balls, 20 g of 8-mm balls, and 40 g of 5-mm balls.

2.2.2. Batch Bioleaching Methods

Batch bioleaching experiments of the activated mineral samples were carried out in the constant temperature shakers (LYZ-2102-C/Shanghai Longyue Instruments Company Limited, Shanghai, China) at 30 °C with a rotational speed of 170 rpm. For each experiment, 2 g of the mineral samples with 100 mL Fe-free 9K medium was added to a 250 mL flask, and supplemented with 2 g/L ferrous ions as the iron source. The initial At. ferrooxidans concentration in each flask was inoculated at about 1.0 × 10⁷ cells/mL.

2.2.3. Analytical Techniques

The activated mineral samples were collected for characterization by XRD (D/max 2550 VB +18 kW, Cu Kα radiation, Rigaku Corporation, Osaka, Japan; scanning rate: 20°/min), SEM (JSM-7900F/JEOL Company, Shishima City, Tokyo, Japan), and particle size distribution analysis (Mastersizer 2000 Ver. 5.60/Malvern Instruments Limited, Malvin, England). The bioleaching residues were also characterized by XRD (Bruker D8 powder X-ray Cu Ka radiation diffractometer, Bruker Corporation, Karlsruhe, Germany; scanning rate: 10°/min) spectra, SEM (JSM-IT500LV/JEOL Corporation, Shishima City, Tokyo, Japan), and EDS (Octane Elect/EDAX Incorporated, Mahwah, NJ, USA).
The pH in the bioleaching flasks was monitored daily (LEICI pH meter/PHS-3C/Shanghai Electronic Scientific Instrument Company Limited, Shanghai, China) and adjusted to 1.7–1.8 with dilute sulfuric acid when it exceeded 1.8. The oxidation-reduction potential (ORP) was measured using a portable pH/ORP meter (BPH-221/Bell Analytical Instruments (Dalian) Company Limited, Dalian, Liaoning, China). Moreover, Zn and Fe ion concentrations were detected every other day by an inductively coupled plasma-atomic emission spectrometer (ICP-OES/ SPECTROBLUE-FMS36, AMETEK Corporation, Middleboro, MA, USA). Planktonic cells were counted using a blood cell counting plate and a microscope (CX31RTSF, Olympus Corporation, Tokyo, Japan).

3. Results

3.1. Mechanical Activation Results

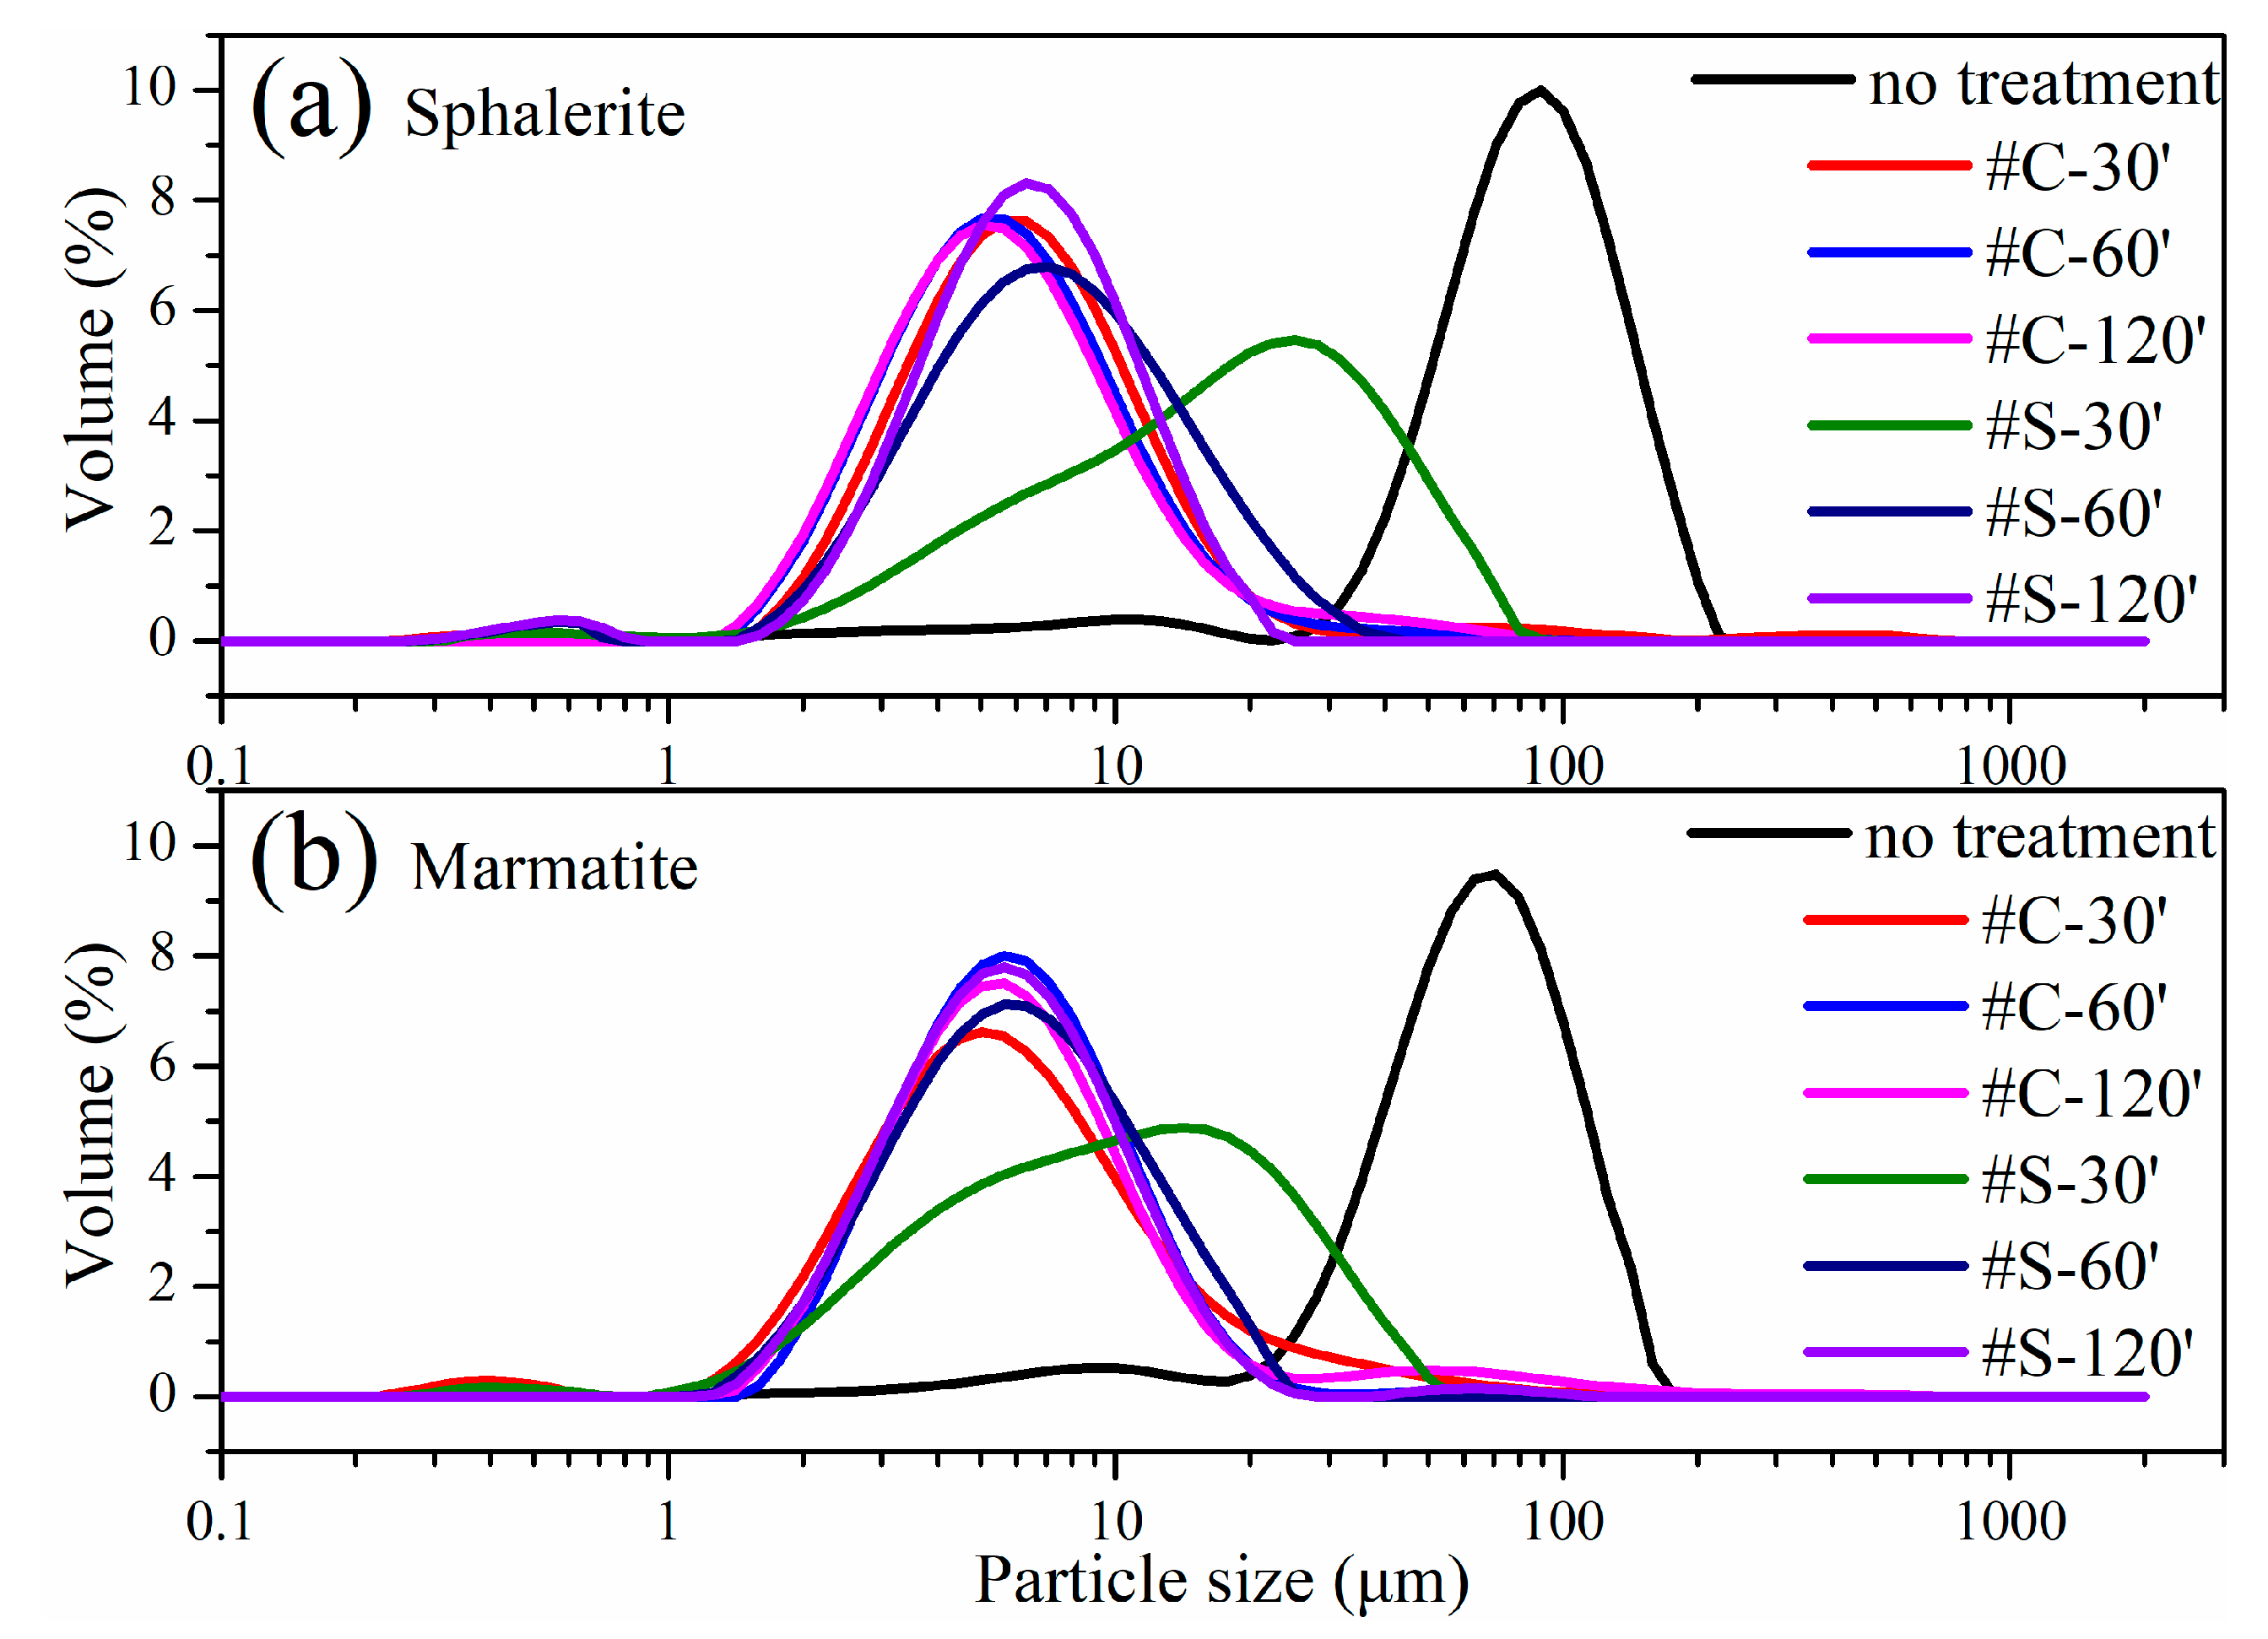
3.1.1. Particle Size Distribution Analysis

Figure 2 shows the particle size distribution curves (the average value of three parallel measurements) of activated sphalerite and marmatite samples; it may be seen that they followed similar trends under different grinding conditions. The maximum mean distributions of nontreated sphalerite and marmatite samples were located at about 100 µm. The particle size distribution curves for sphalerite and marmatite under the #C condition showed no obvious changes with different grinding times (the maximum mean distributions were at ~5 μm). In contrast, under the #S condition, the particle sizes of sphalerite and marmatite decreased significantly as the grinding time increased, from a maximum mean distribution at ~11 μm after 30 min of grinding to ~5 μm with prolonged grinding. These observations indicated that the #C condition had a higher grinding efficiency. Under the #C and #S grinding conditions, mineral samples (both the sphalerite and marmatite) reached the minimum particle fraction within 30 and 60 min, respectively. Figure 3a–c show the variation of particle size in the values of D(0.1), D(0.5), and D(0.9), where the values of D(0.1), D(0.5), and D(0.9) indicate that 10%, 50%, and 90% of the particles measured were less than or equal to the size stated. The results suggest that the main particle fractions after sphalerite and marmatite grinding were 3–15 μm under the #C30’–120’ and #S60’–120’ conditions, and 3–40 μm for the #S30’ condition. In detail, under #C30’–120’ conditions, the particle fractions of sphalerite and marmatite were similar. However, under #S30’–120’ conditions, the D(0.1), D(0.5), and D(0.9) of sphalerite were greater than the corresponding values for marmatite, and the particle fractions of sphalerite and marmatite both decreased as the grinding time increased. Specific surface area curves (Figure 3d) were basically inversely proportional to particle size.

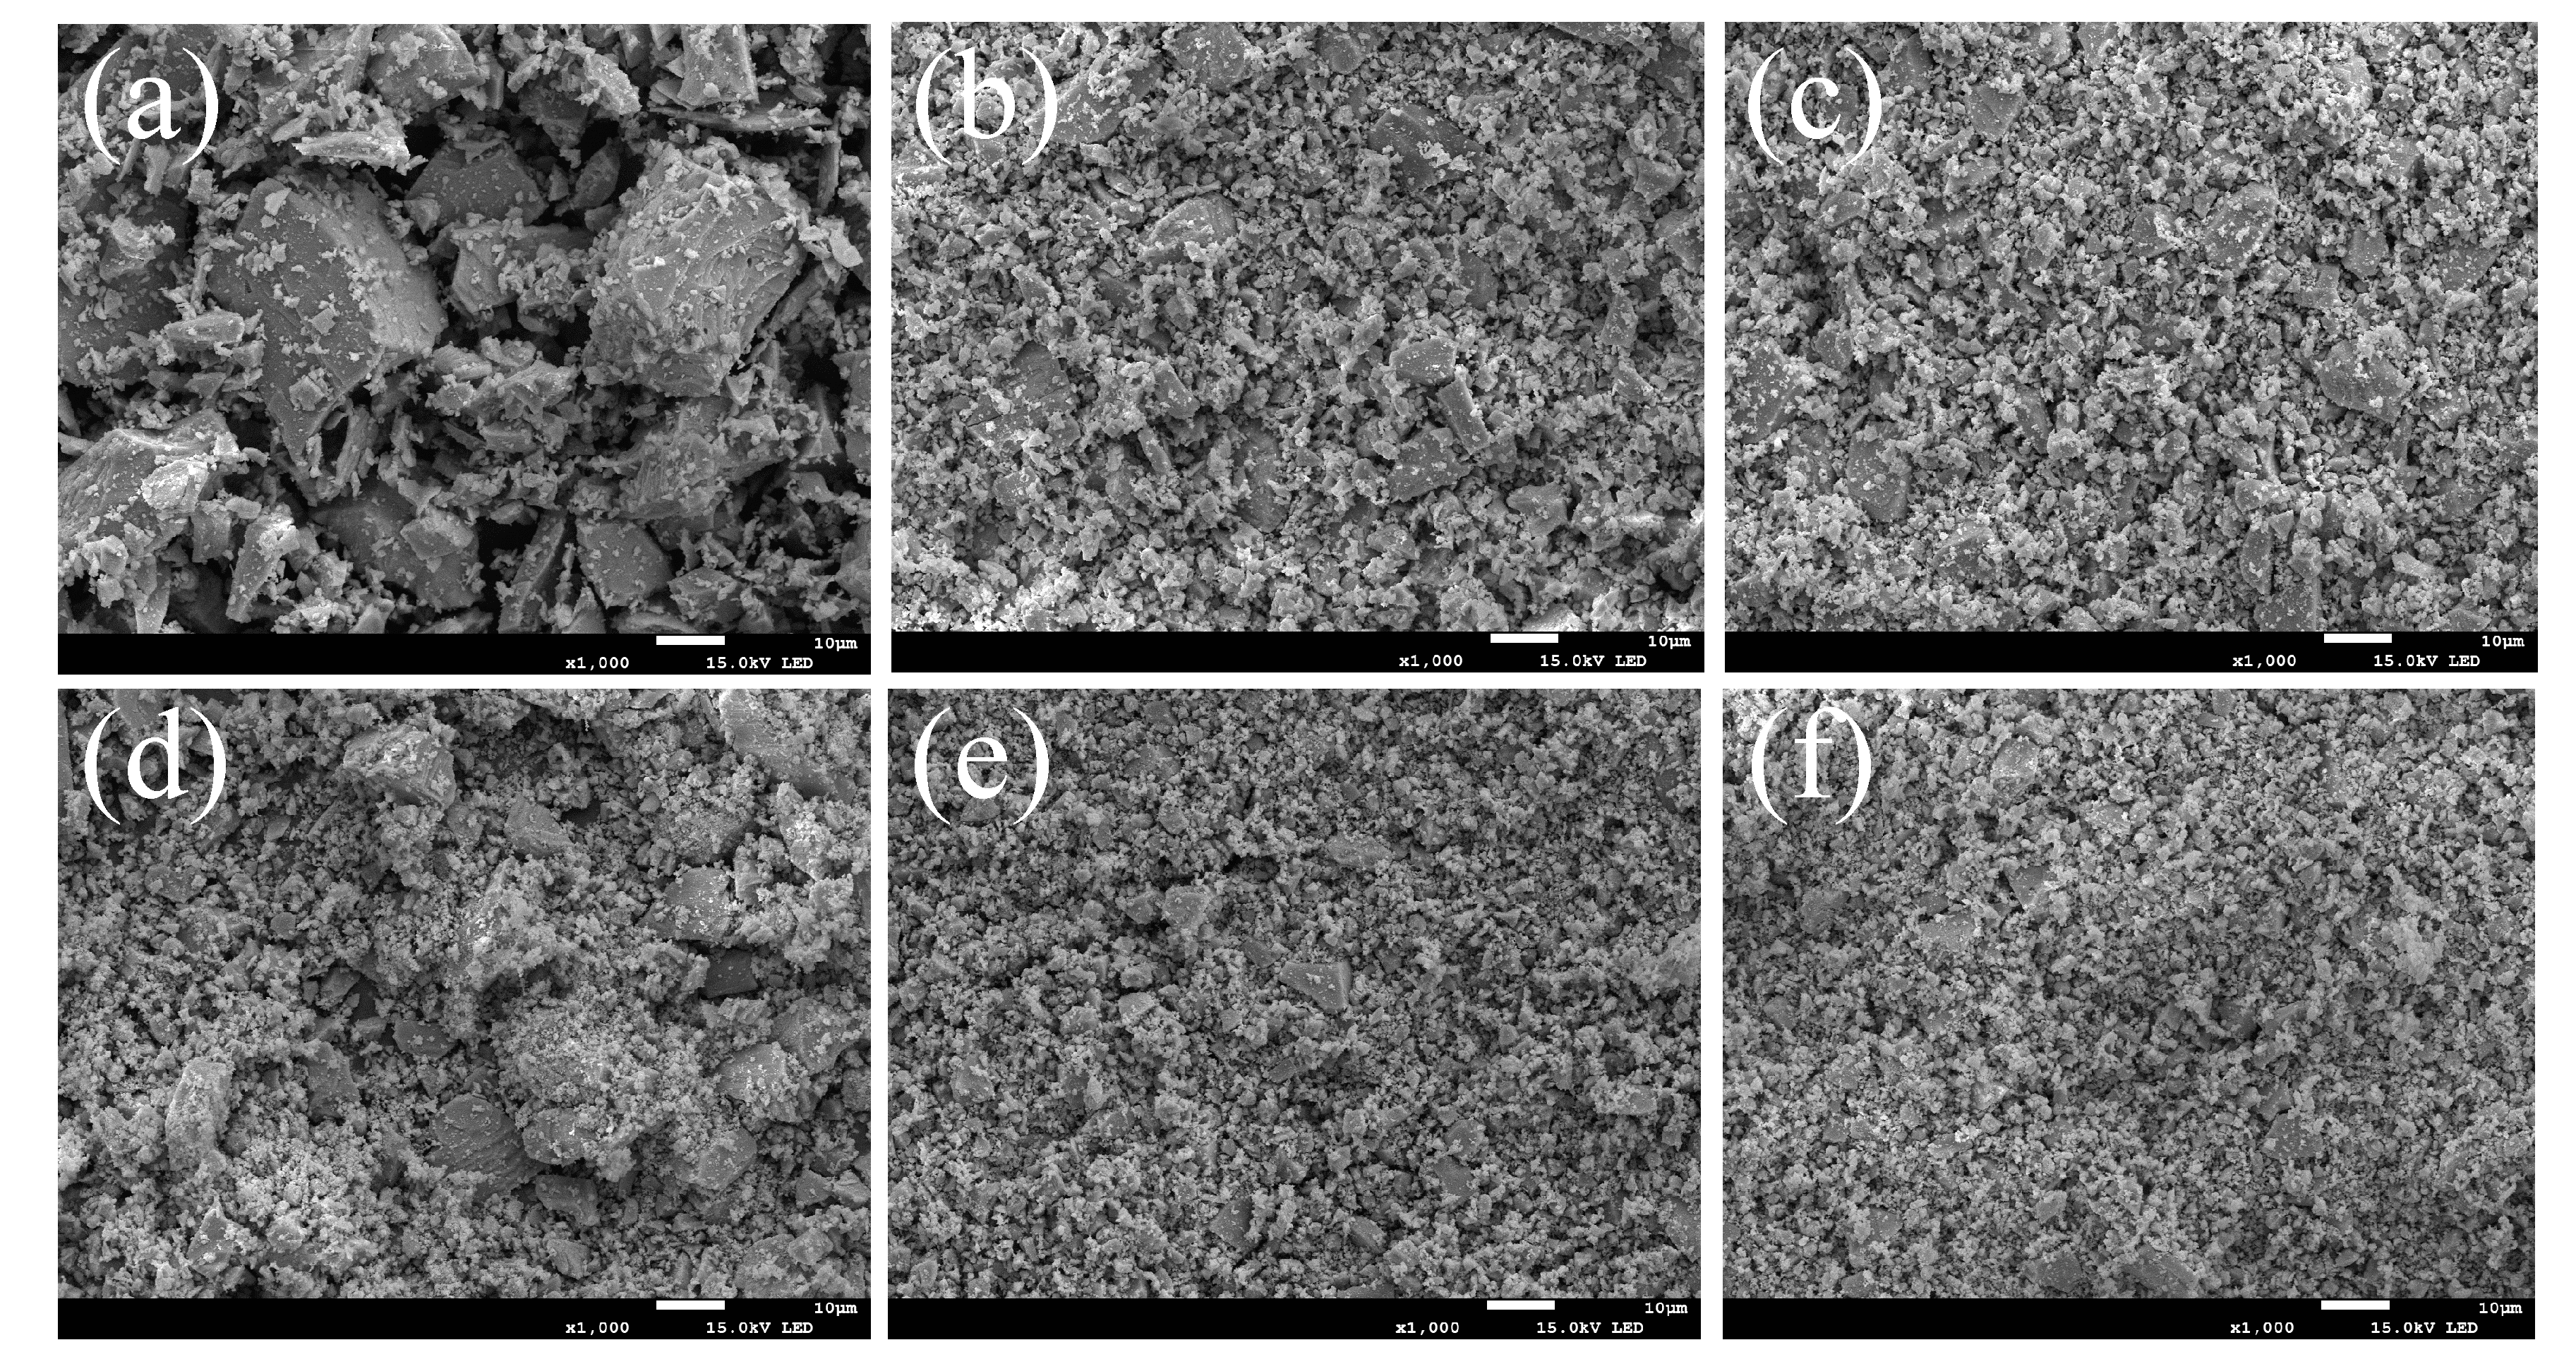
3.1.2. Activated Mineral Morphology

The morphologies of activated sphalerite and marmatite samples are shown in Figure 4 and Figure 5, respectively. The SEM images (1000-fold magnification) produced similar results to the particle size distribution analysis.

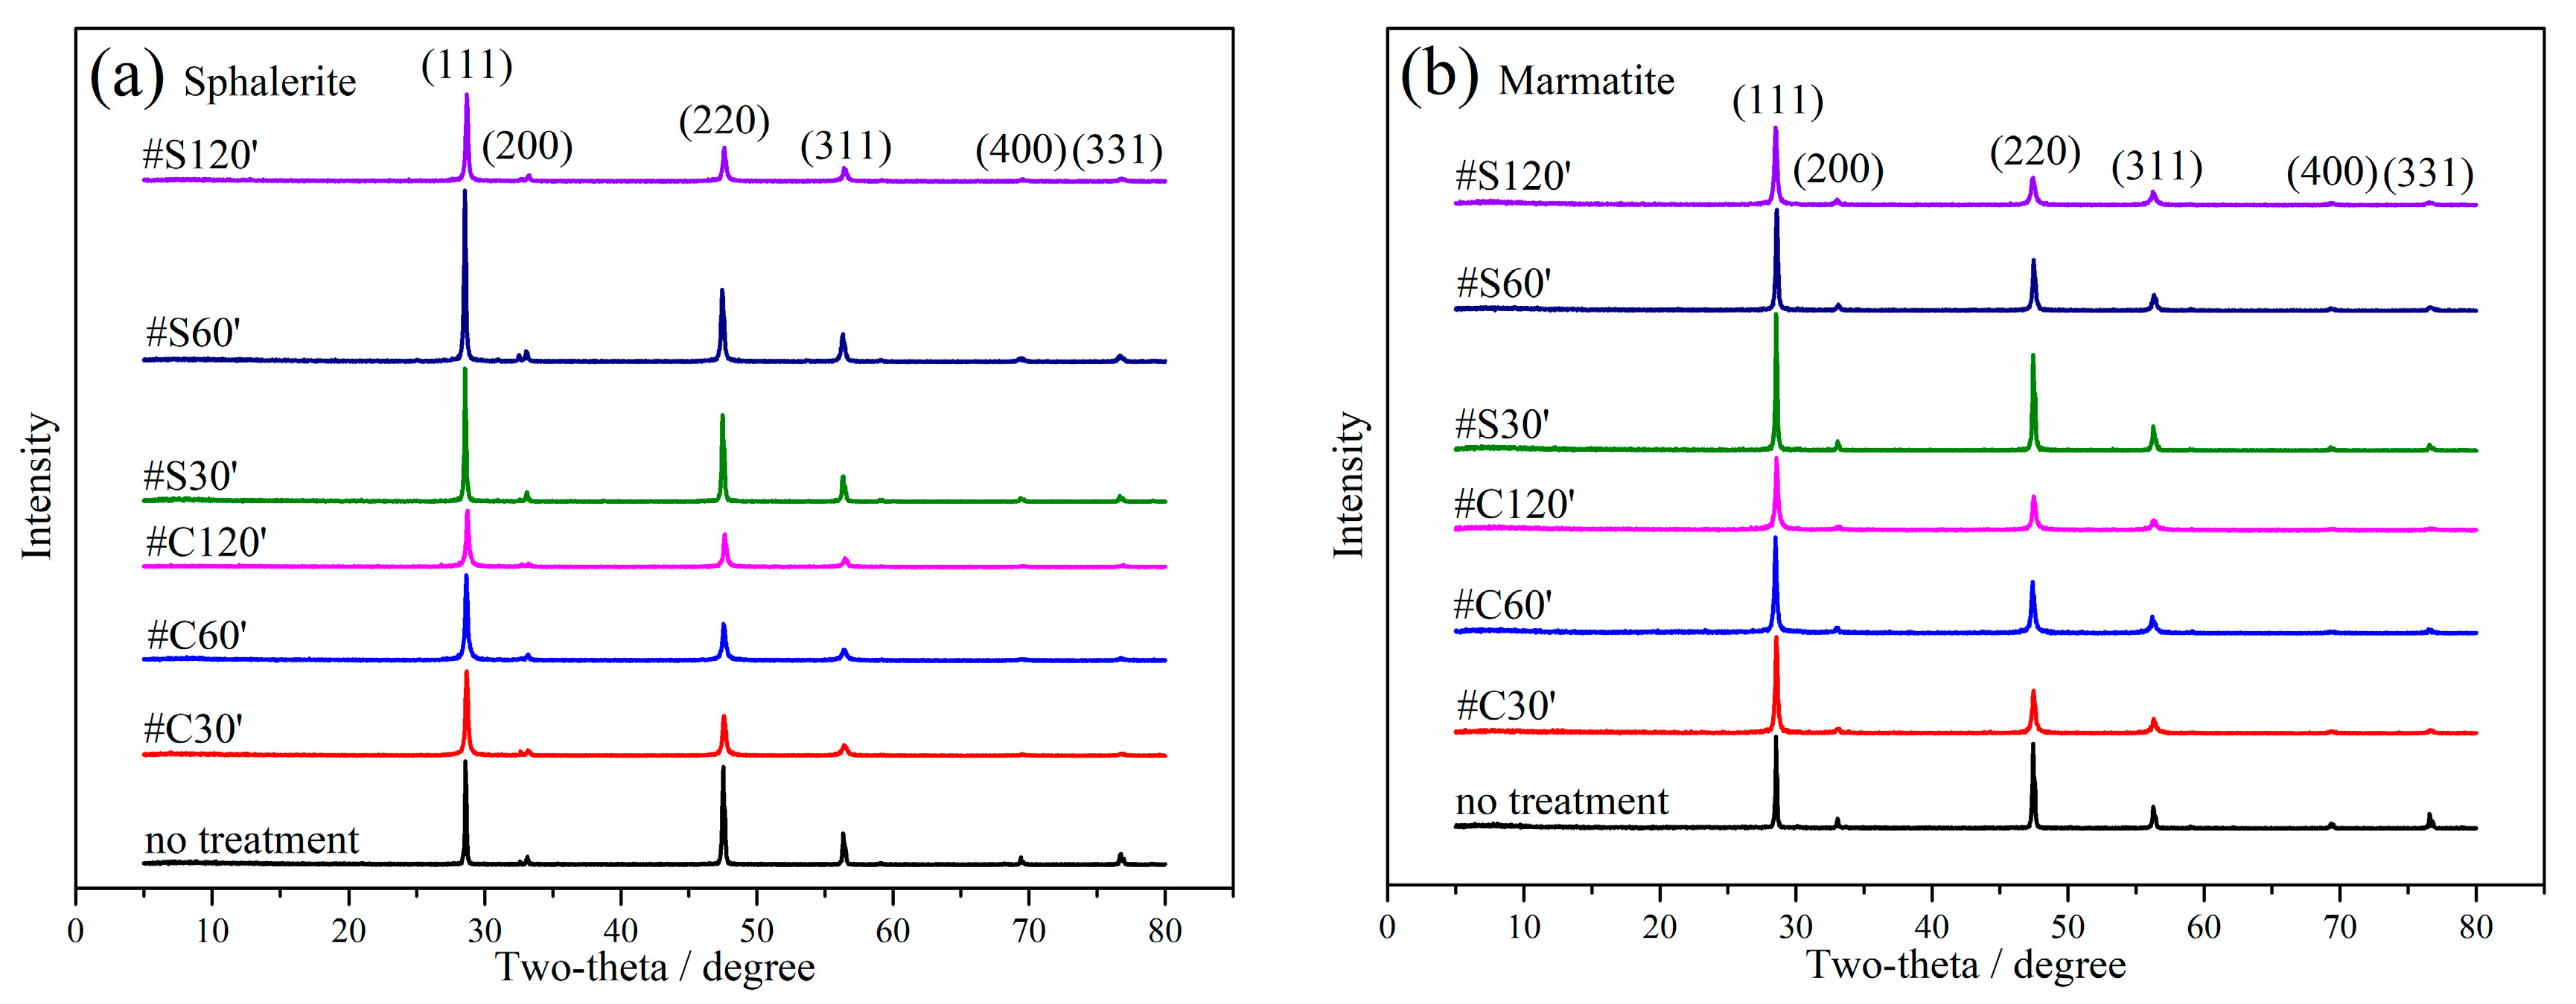
3.1.3. XRD Analyses of the Mechanically Activated Samples

Figure 6a,b show the XRD spectra of mechanically activated sphalerite and marmatite. The crystal planes corresponding to different peaks were marked according to the information described in [21]. Compared with the XRD spectra of samples treated under #S conditions, the (400) and (331) peaks almost disappeared in the XRD spectra of samples treated under #C conditions. The intensities of almost all peaks decreased with increasing grinding time. These results suggest that changes in crystallite dimension and lattice distortion might occur after mechanical activation [21,26]. The XRD results confirmed that the #C grinding conditions were more efficient than the #S conditions.

3.2. Batch Bioleaching

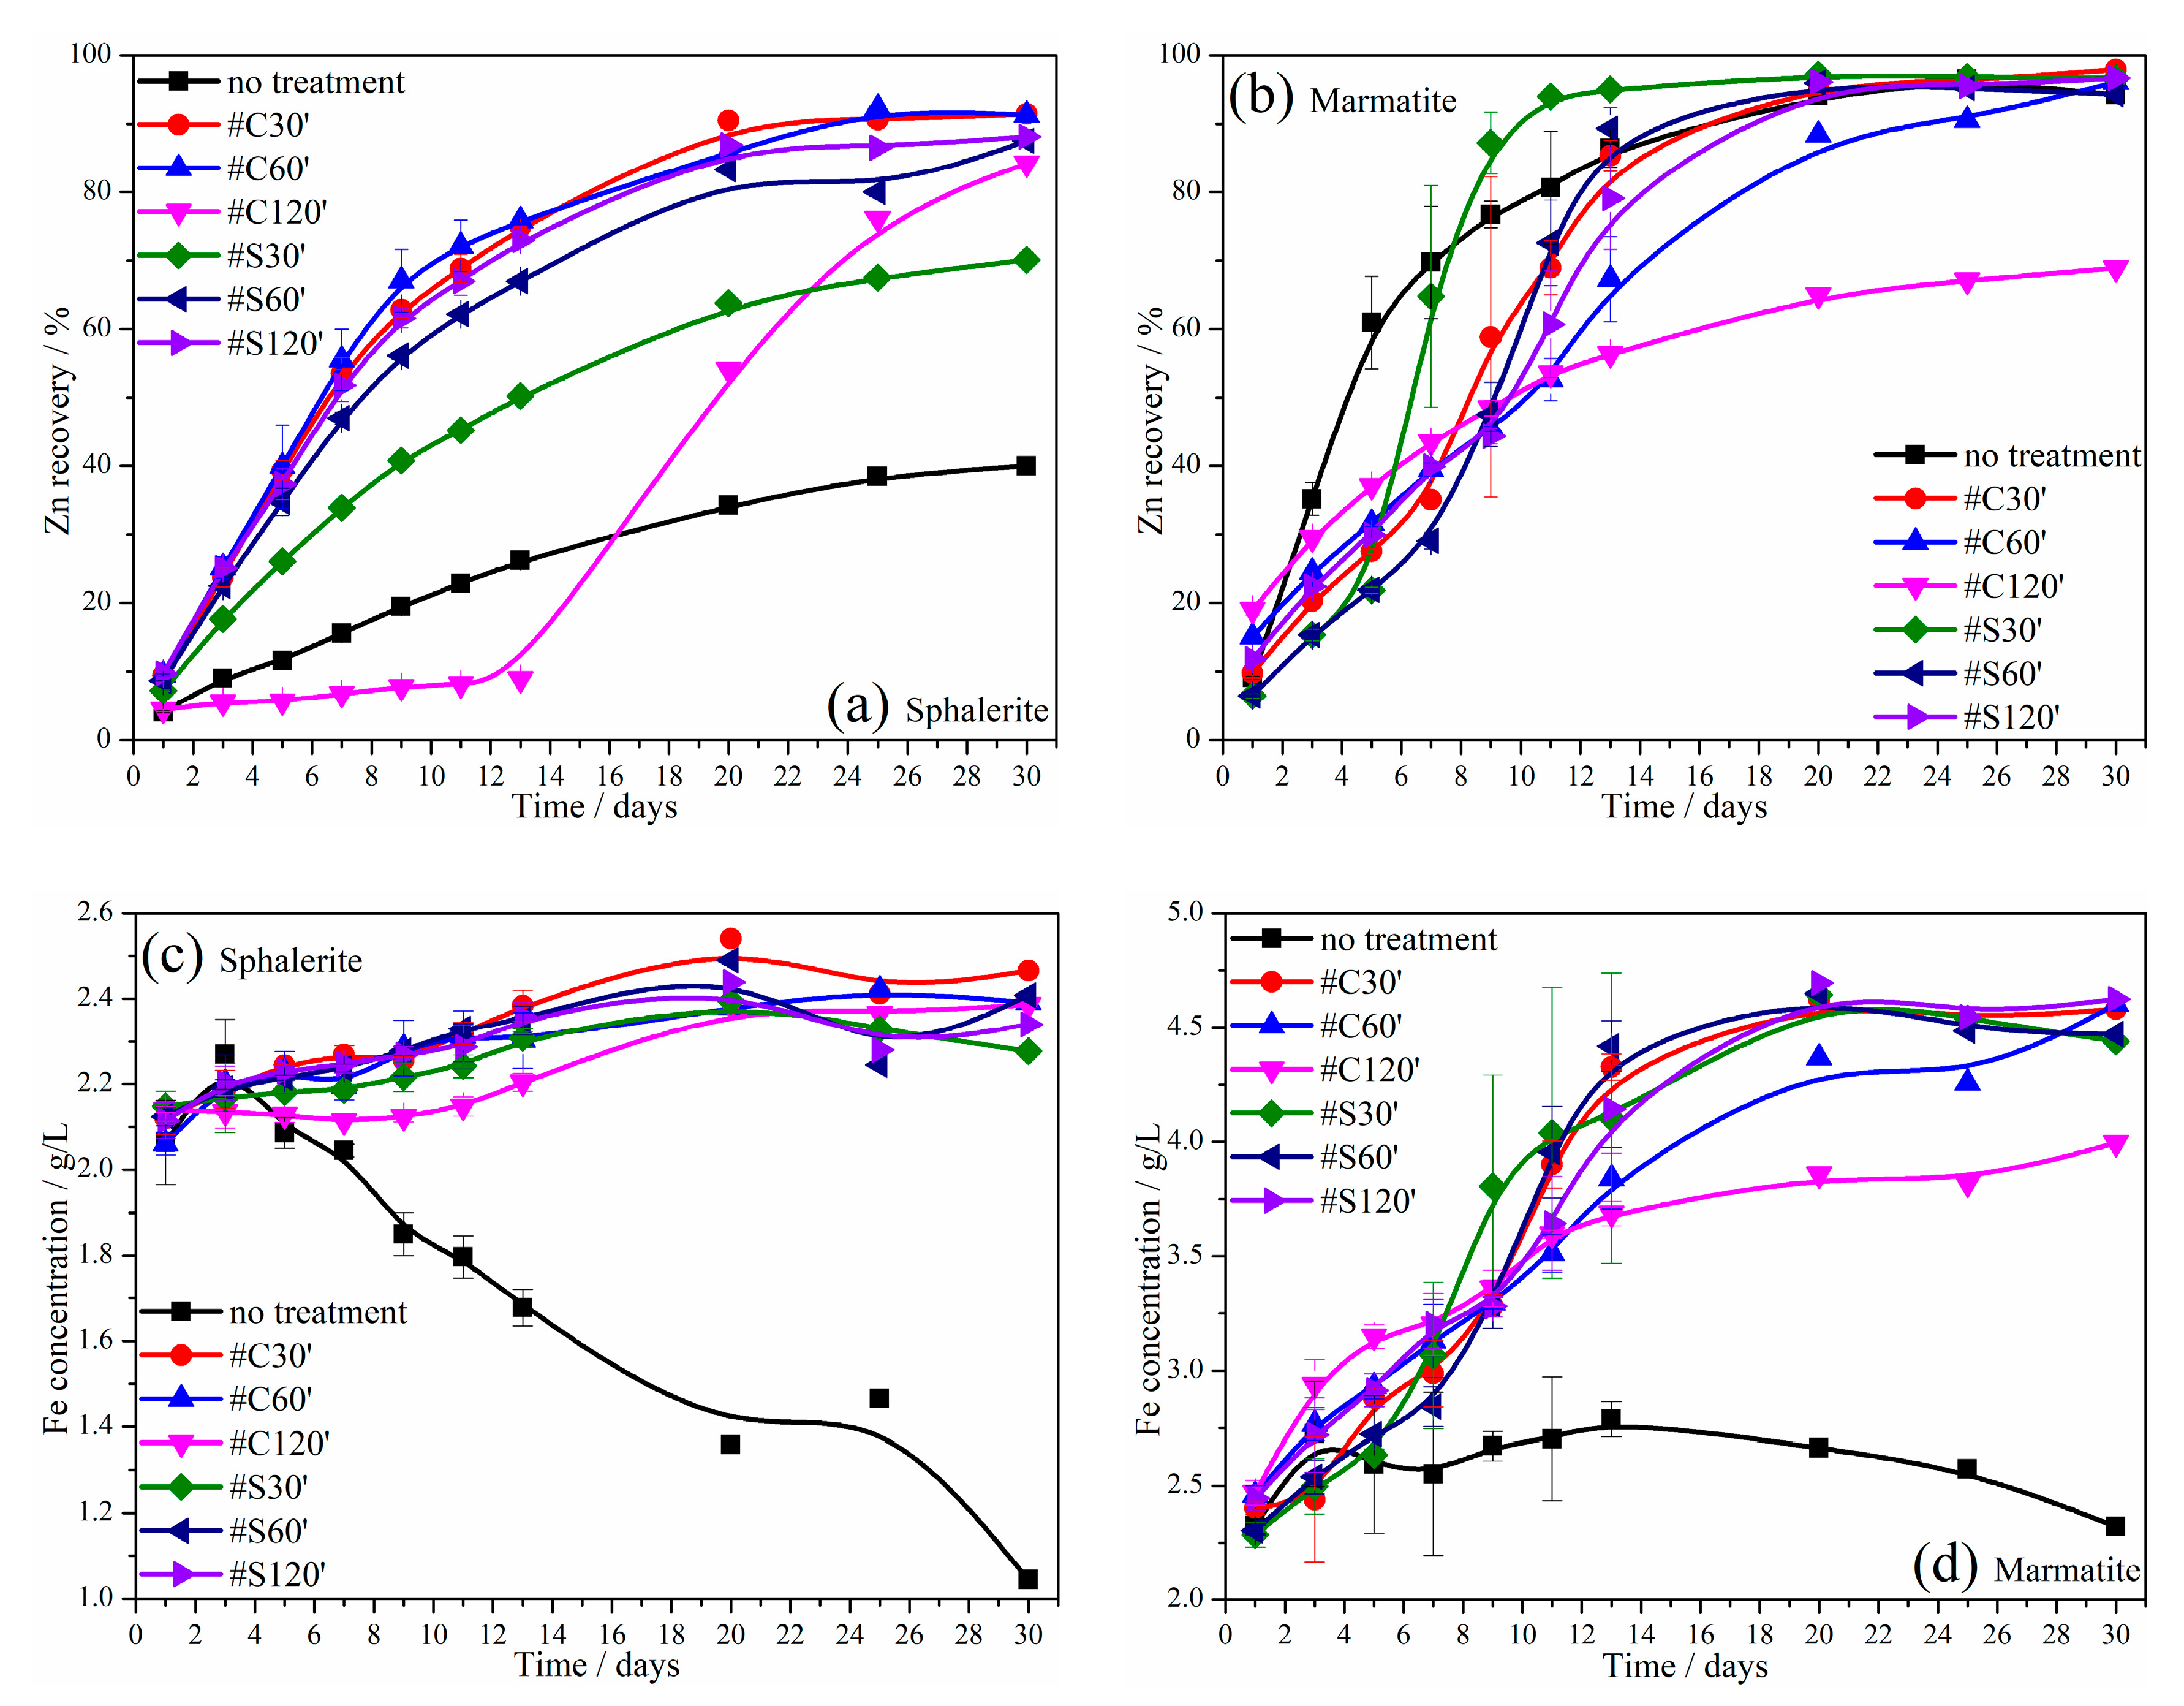
3.2.1. Zn and Fe Extractions

The zinc recovery rates from the sphalerite samples are shown in Figure 7a. The results indicated that the Zn recovery rates under #C conditions were equal after 30 days (reaching values of ~90%), despite a significantly lower recovery of Zn in the early stages (before day 14) under the #C120’ condition, compared to the #C30’ and #C60’ conditions. For #S conditions, the Zn recovery rates were proportional to the grinding time. The lowest Zn recovery rate (~40%) was detected in a nontreated control, confirming the general hypothesis that mechanical activation (under all tested conditions) promoted sphalerite bioleaching. The #C30’ condition was considered optimal for high Zn recovery (91.4%) with the shortest grinding time (30 min). Figure 7b shows the Zn recovery rates obtained during the bioleaching of marmatite. Unlike sphalerite, the Zn extraction from marmatite was inversely proportional to the grinding time (for both grinding media). With the exception of the #C120’ condition, the final Zn recoveries exceeded 90% after 30 days. However, the #S30’ condition was considered to be the preferred option because it required the shortest time (12 days) to reach the maximum Zn recovery (97.93%). In contrast to sphalerite, mechanical activation had little positive effect on marmatite bioleaching, as considerable Zn recovery (94.22%) was also achieved in the nontreated control. Considering the time needed to reach maximum Zn recovery, the no-treatment group was second only to the #S30’ condition, indicating that mechanical activation can hinder the bioleaching of marmatite. The #C120’ group obtained the lowest final zinc recovery rate, i.e., 68.9%. As a result of the introduction of the initial 2 g/L of additional ferrous ions, it was difficult to calculate the extraction and recovery of Fe. The Fe concentrations in the sphalerite and marmatite bioleaching systems are shown in Figure 7c,d, respectively. Figure 7c shows that the iron concentrations during the bioleaching of sphalerite varied only slightly under different activation conditions, but the iron concentration in the nontreated control decreased significantly over time, possibly due to precipitation. Fe concentrations during marmatite bioleaching (Figure 7d) followed zinc extraction trends, except for those in the nontreated control system, which remained relatively constant throughout the course of the experiment (with a slight decrease after day 13, possibly also due to precipitation).

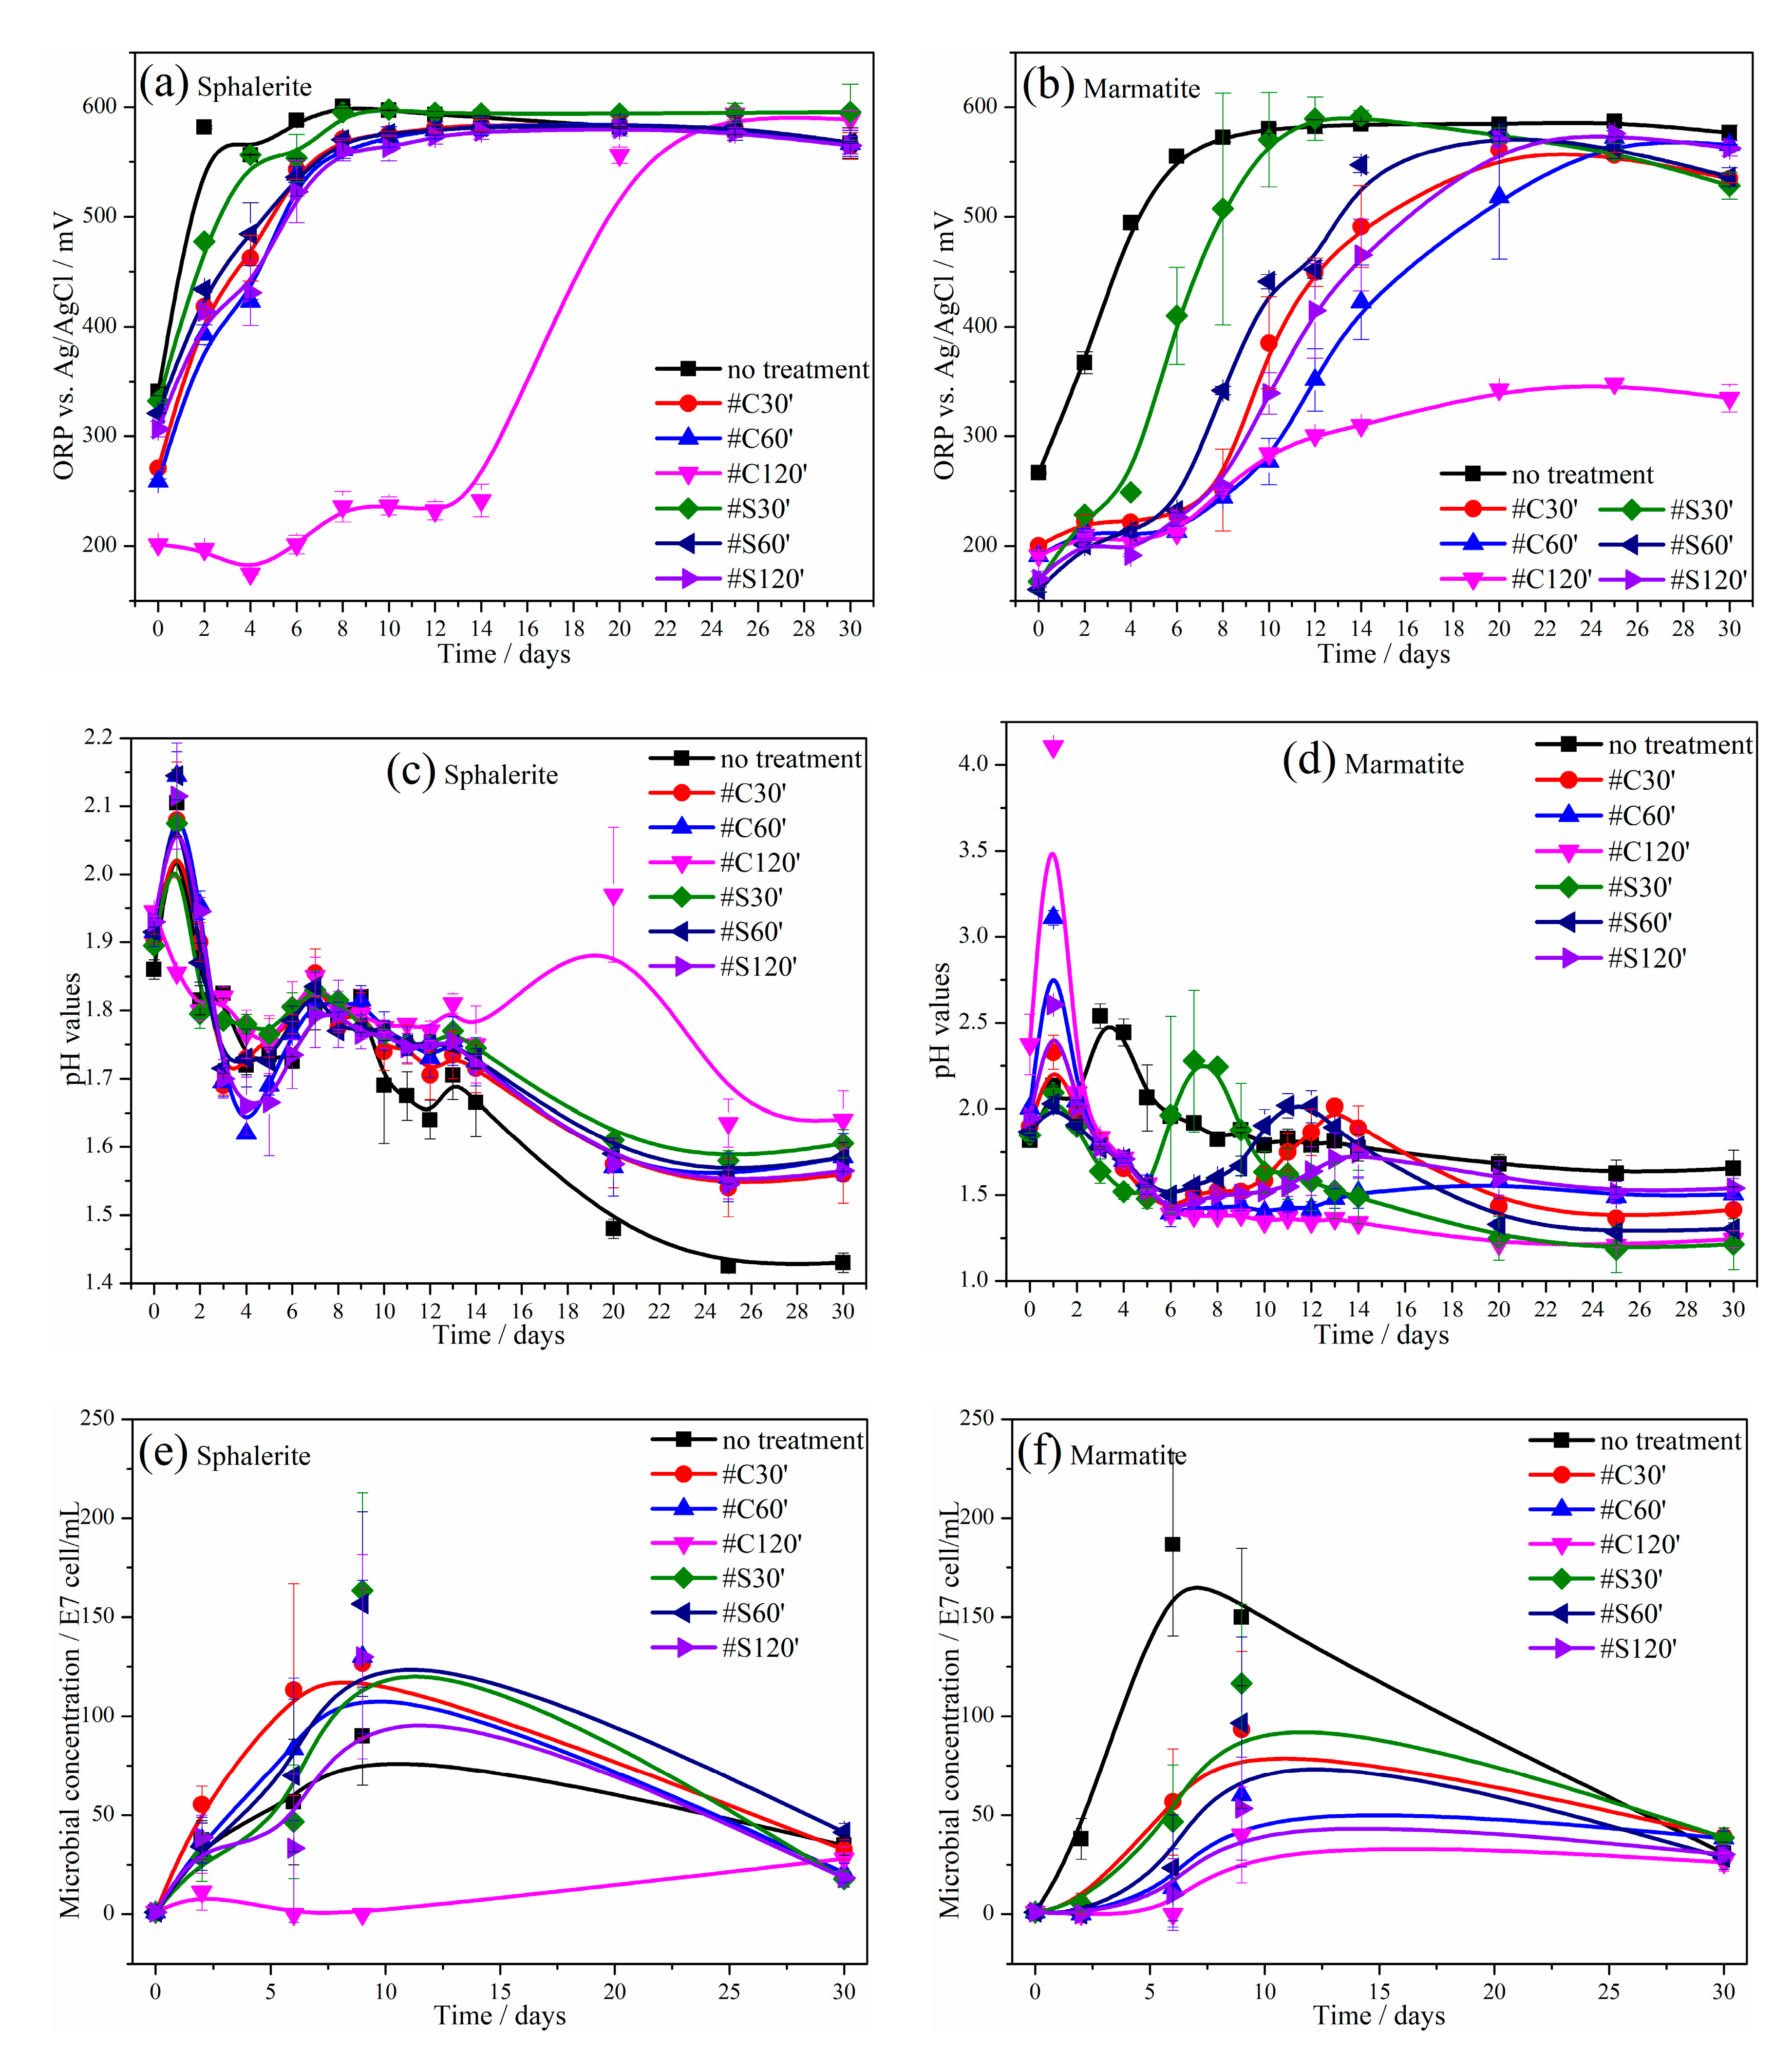
3.2.2. Bioleachate (Chemical) Characterization

Figure 8 shows time changes in ORP, pH, and planktonic cell counts during the bioleaching of sphalerite and marmatite. The ORP values during the bioleaching of sphalerite generally showed an initial sharp increase and a plateau at a maximum of around 600 mV after day 8; the exception was the ORP values during leaching under the #C120’ condition, which increased only marginally in the early stage (0–14 days) of the experiment, and abruptly reached a maximum of ~600 mV after day 24. Figure 8b shows the ORP changes during marmatite bioleaching. Similar to Zn recovery rates, the ORP was also inversely proportional to the increase in grinding time (under both #C and #S). Also, the ORP values under #S were greater than those under the #C conditions. Additionally, the nontreated control group was the first to reach the maximum of 600 mV (on day 10), followed by the #S30’ group (on day 12). The ORP in the #C120’ system was the lowest, with a maximum of only ~350 mV (on day 20).
Figure 8c,d show changes in pH in the sphalerite and marmatite bioleaching systems, respectively. The results show that the pH values rose sharply on day 1, accentuating proton consumption during the initial rapid dissolution of both sphalerite and marmatite. After this stage, the pH began to gradually decrease in all systems. The lowest final pH (~1.5) was achieved in the nontreated control group of sphalerite bioleaching after 20 days (Figure 8c), which probably resulted in the reduction of the metabolism of At. ferrooxidans [27]. Surprisingly, the pH during sphalerite bioleaching under the #C120’ condition increased significantly between days 14 and 22 (Figure 8c), corresponding to the rapid increase in ORP and Zn extraction after day 14. During marmatite bioleaching (Figure 8d), the pH values on day 1 significantly varied under different mechanical activation conditions. A correlation between pH and grinding time was observed; the longer the grinding time, the more acid was consumed (signifying an increase in the rate of marmatite dissolution). The highest pH values were detected in the marmatite #C120’ (pH > 4.1) and marmatite #C60’ groups (pH > 3.1), which might have impacted the activity of At. ferrooxidans [28].
Figure 8e,f show planktonic cell counts in the sphalerite and marmatite bioleaching systems, respectively. As shown in Figure 8e, no bacterial growth was observed during the #C120’ bioleaching of sphalerite in the early stages, followed by a slight increase towards the end of the experiment. Under other conditions, the microbial cell counts initially increased and decreased later, possibly due to no Fe2+ regeneration after achieving complete dissolution of the sphalerite/marmatite or after the passivation of the sphalerite/marmatite. The microbial cell counts in marmatite leachates (Figure 8f) followed a similar trend, i.e., an initial increase, followed by a decrease. The microbial cell counts in different treatments were inversely proportional to the pH values on day 1 (Figure 8d), indicating that the microbial activity was negatively affected by elevated pH on day 1.

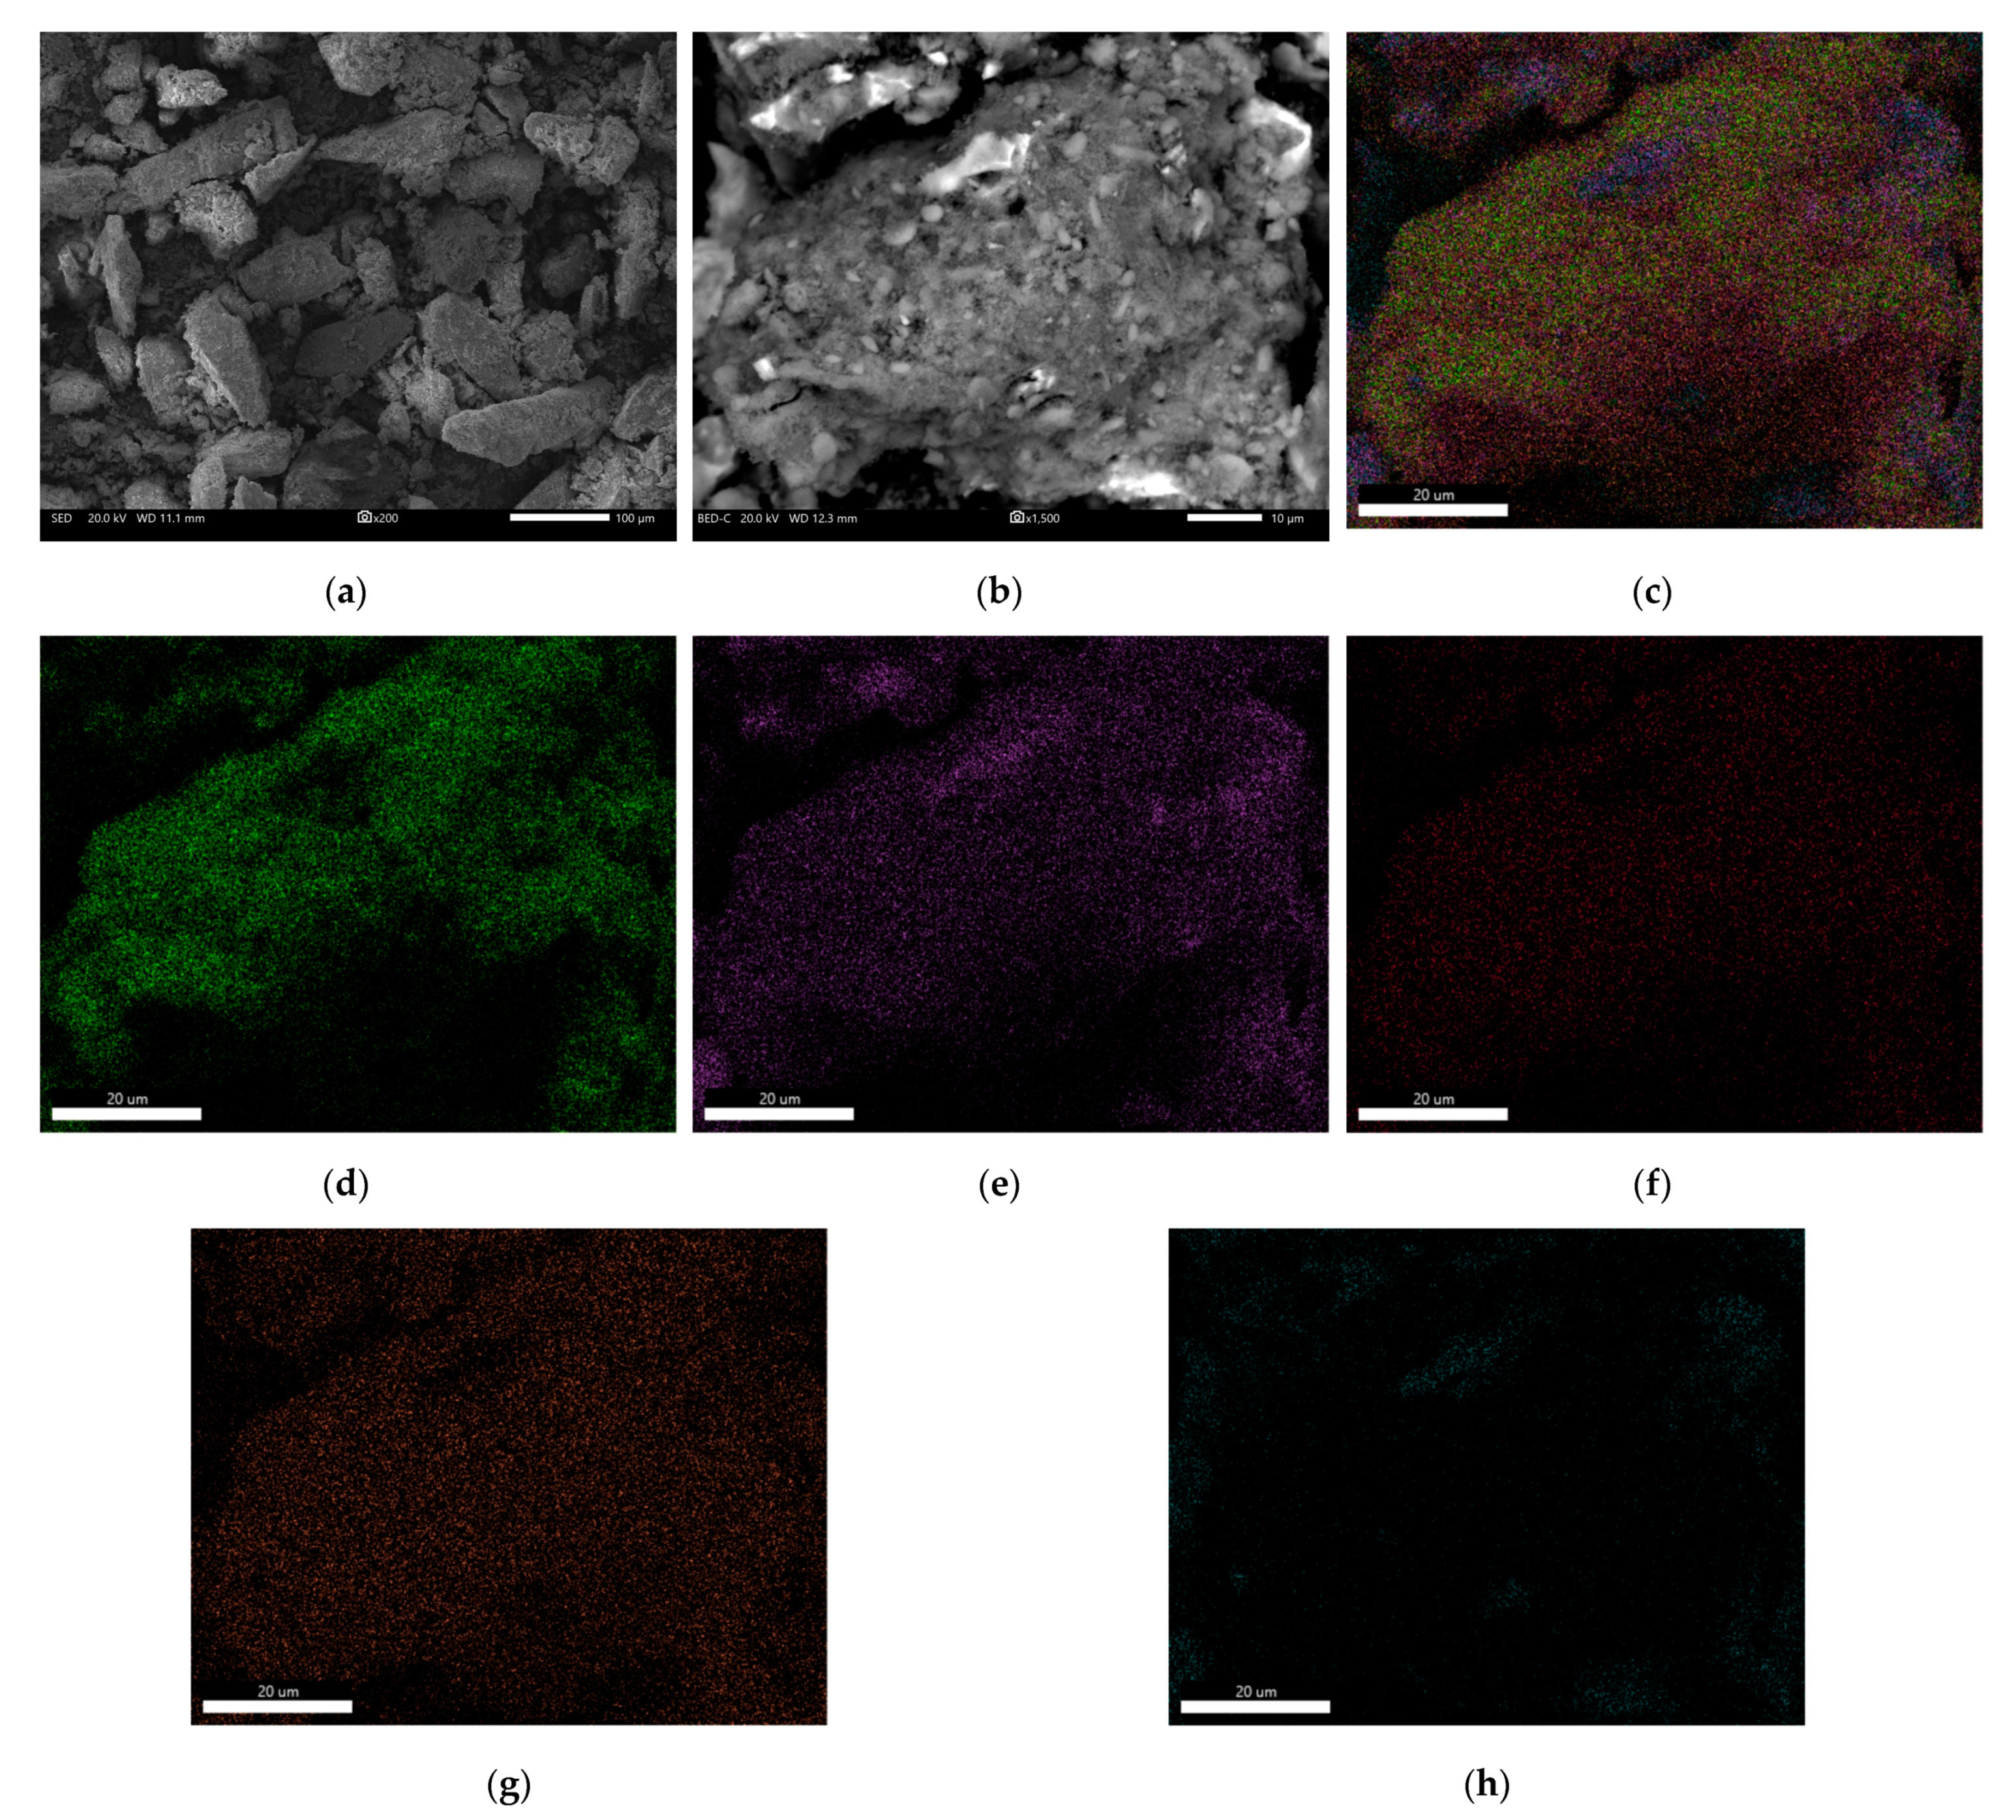
3.2.3. XRD Spectra and SEM-EDS Analysis of the Residues

Based on the bioleaching results, several sphalerite and marmatite residues were collected for XRD characterization (Figure 9) at the end of the experiment, including the nontreated sphalerite (as the worst condition for subsequent bioleaching), sphalerite activated under #C30’ (optimum condition), sphalerite under #S30’ (the worst bioleaching result among activation conditions), as well as nonactivated marmatite residues, marmatite activated under #C120’ (worst condition), and #S30’ (optimum condition) conditions. Figure 9a shows the presence of jarosite (PDF-# 71-1777) in the nontreated sphalerite residue, next to the main XRD peaks referring to sphalerite, while only sphalerite was detected in activated sphalerite residues. No marmatite XRD peaks were detected in the nontreated marmatite residue and after #S30’ activation (Figure 9b); S8 (PDF-# 83-2283) and jarosite were detected in the nontreated marmatite residue, and jarosite was detected as the only phase in the #S30’ group. Only marmatite peaks were observed in the #C120’ residue.
A SEM-EDS analysis was performed on the nontreated sphalerite residue (Figure 10 and Table 2) to explain the significant decrease in iron concentration during bioleaching (Figure 7c). The SEM results indicated that the surface of the residue was uniformly covered by intermediate products (Figure 10a,b), and EDS mapping results showed an even distribution of oxygen, sulfur, potassium, and iron (Figure 10d–g). Additionally, the atomic percentage of Zn on the surface was only 3.72% (Figure 10h and Table 2). Based on these results and the XRD results, it was suggested the surface of the residue was uniformly covered by jarosite.

4. Discussion

According to Figure 7a, mechanically activated sphalerite with #C30’–120’ conditions yielded similar Zn recoveries (80–90%) after 30 days, which might be due to their similar particle fractions (Figure 2a–c). Under the #S conditions, the Zn recoveries of sphalerite were proportional to the grinding time, and the particle size was inversely proportional to the grinding time (Figure 2a–c). The nontreated sphalerite with the greatest proportion of large particle size fractions yielded the smallest Zn recovery. These results proved that the Zn recoveries were inversely proportional to the particle size. However, the grinding efficiency of the #C conditions was higher than the #S conditions, because the former only needed 30 min to achieve a particle size distribution similar to that of the latter after 120 min. In addition, the optimum grinding condition of #C30’ (Zn recovery: 91.42%) provided an increment in specific surface area (around 1.60 m2/g), as shown in Figure 3d. This also indicated that excessive grinding could reduce the specific surface area of sphalerite, which might be ascribed to the agglomeration under high surface energy conditions [29]. On the other hand, excessively mechanically activated sphalerite with high surface energy might reduce the surface defect sites for the bacteria [23] and produce toxic reactive oxygen species (ROS) that hinder the activity of At. ferrooxidans (Figure 8e) [30], further impeding the regeneration of Fe3+. Low ORP (representing a high ratio of Fe2+/Fe3+ [31]; Figure 8a) decreases mineral dissolution rates [32,33], as observed in the early stages of the #C120’ bioleaching (Figure 8a,b).
Regarding marmatite bioleaching, no obvious relationships between the Zn recovery and the particle size or specific surface area were observed. Mechanical activation was shown to hinder the bioleaching process for what might be the high reactivity of marmatite [34], including the high dissolution kinetics [35] and electrochemical activity [8,36]. Additionally, as marmatite contains more iron, more ROS could be formed with increasing grinding time (Equation (1): ads: adsorbed; ≡Fe: iron exposed at sulfur-deficient defect sites on the sulfide surface) [37]. Microbial populations can be adversely affected and reduced by the formation of ROS (Figure 8f). In addition, the lowered bacterial activity observed in our experiment might have been caused by the elevated initial pH (Figure 8d), as reported elsewhere [28].
F e ( III )   +   H 2 O ( a d s ) F e ( II )   +   OH ( a d s )   +   H +
Based on the XRD and SEM-EDS results, the inhibition of the bioleaching of nontreated sphalerite might have been caused by a quick formation of jarosite on the mineral surface (Figure 9a, Figure 10). The ORP in the corresponding bioleaching system reached the maximum value after only two days (Figure 8a), indicating a high Fe3+/Fe2+ ratio. Also, the sharp decrease in pH after two days (Figure 8c) implies a rapid formation of jarosite, which is a proton-generating reaction, as shown in Equation (2) [9]. It has been postulated that the accumulation of jarosite on mineral surfaces (passivation) impedes metal bioleaching [31]. No jarosite (or other intermediate species) was detected in any of the mechanically activated sphalerite residues after bioleaching, supporting the conclusion that mechanical activation improves the bioleaching of metals from this mineral.
K + + 3 F e 3 + + 2 S O 4 2 + 6 H 2 O K F e 3 ( S O 4 ) 2 ( O H ) 6   +   6 H +
In the residue of the nontreated marmatite, S8 and jarosite were detected (Figure 9b). A previous study postulated that elemental sulfur was more likely to be produced during marmatite bioleaching than during sphalerite bioleaching [34]. Although mechanical activation generally inhibited the dissolution of marmatite, a positive effect of the #S30’ activation condition on the process was observed. The results of XRD analysis indicated that the promotion effect might have been due to impeded S8 formation, and therefore, reduced passivation of the marmatite surface. Additionally, the obtained results suggest that jarosite impeded sphalerite bioleaching, but had no effect on marmatite bioleaching. The quick formation of jarosite in the nontreated sphalerite bioleaching system showed that Fe3+ was formed significantly faster than it was consumed via oxidative dissolution of nontreated sphalerite; therefore, the initial addition of 2 g/L Fe2+ proved to be excessive in such a system. However, no jarosite was detected during the bioleaching of the activated sphalerites, indicating that Fe3+ was efficiently consumed in systems with finer particle sizes. In contrast, marmatite with higher reactivity reduced the formed Fe3+ quickly; therefore, jarosite was not formed in the early stages of the experiment. Hence, it is further proposed that the addition of Fe2+ should be decided not only based on the mineral type (and its chemical properties), but also on the degree of mechanical activation (defining particle size distribution).

5. Conclusions

A corundum jar with zirconia balls (#C conditions) was found to be more efficient than using a stainless steel jar with stainless steel balls (#S) for the mechanical activation of both sphalerite and marmatite. Through mechanical activation, the bioleaching of sphalerite was significantly improved, unlike the bioleaching of marmatite, which generally showed the opposite trend. The #C30’ (Zn recovery of 91.4% with the shortest grinding time of 30 min) and #S30’ (Zn recovery of 97.9% with the shortest bioleaching time of 12 days) were considered to be the optimum grinding conditions for sphalerite and marmatite bioleaching, respectively. Importantly, excessive mechanical activation was deleterious to the bioleaching of both minerals. Additionally, it is proposed that additions of Fe2+ should be determined based on the physicochemical properties of different minerals, but also the degree of mechanical activation (which determines particle size distribution); otherwise, passivation by jarosite might occur.

Author Contributions

Conceptualization, S.L., Y.Z. (Yisheng Zhang) and L.S.; methodology, S.L.; validation, G.Q.; formal analysis, S.L. and Y.Z. (Yisheng Zhang); investigation, S.L., Y.Z. (Yisheng Zhang), L.Z., A.T., X.L., and Y.Z. (Yu Zhao); resources, S.L., Y.Z. (Yisheng Zhang) and L.S.; data curation, S.L. and Y.Z. (Yisheng Zhang); writing—original draft preparation, S.L.; writing—review and editing, Y.Z. (Yisheng Zhang) and H.Z.; supervision, H.Z.; project administration, H.Z., L.S. and G.Q.; funding acquisition, H.Z., L.S. and G.Q. All authors have read and agreed to the published version of the manuscript.

Funding

This research was funded by Open Foundation of State Key Laboratory of Mineral Processing, China, grant number BGRIMM-KJSKL-2020-06; Opening Project of Key Laboratory of Solid Waste Treatment and Resource Recycle, Ministry of Education, grant number 19kfgk01.

Institutional Review Board Statement

Not applicable.

Informed Consent Statement

Not applicable.

Data Availability Statement

The data presented in this study are available on request from the corresponding author. The data are not publicly available due to the terms of the project.

Acknowledgments

The authors would like to thank Shiyanjia Lab (www.shiyanjia.com) for the support of particle size and XRD test.

Conflicts of Interest

The authors declare no conflict of interest.

References

  1. Ejtemaei, M.; Gharabaghi, M.; Irannajad, M. A review of zinc oxide mineral beneficiation using flotation method. Adv. Colloid Interface Sci. 2014, 206, 68–78. [Google Scholar] [CrossRef] [PubMed]
  2. Sundramurthy, V.P.; Rajoo, B.; Srinivasan, N.R.; Kavitha, R. Bioleaching of Zn from sphalerite using Leptospirillum ferriphilum isolate: Effect of temperature and kinetic aspects. Appl. Biol. Chem. 2020, 63, 1–13. [Google Scholar] [CrossRef]
  3. Baba, A.A.; Adekola, F.A. Hydrometallurgical processing of a Nigerian sphalerite in hydrochloric acid: Characterization and dissolution kinetics. Hydrometallurgy 2010, 101, 69–75. [Google Scholar] [CrossRef]
  4. Zhang, Y.; Zhao, H.; Meng, X.; Ou, P.; Lv, X.; Zhang, L.; Liu, L.; Chen, F.; Qiu, G. Mineralogical phase transformation of Fe containing sphalerite at acidic environments in the presence of Cu2+. J. Hazard. Mater. 2021, 403, 124058. [Google Scholar] [CrossRef]
  5. Lai, H.; Deng, J.S.; Liu, Z.L.; Wen, S.M.; Huang, L.Y. Determination of Fe and Zn contents and distributions in natural sphalerite/marmatite by various analysis methods. Trans. Nonferrous Met. Soc. China 2020, 30, 1364–1374. [Google Scholar] [CrossRef]
  6. Harmer, S.L.; Mierczynska-Vasilev, A.; Beattie, D.A.; Shapter, J.G. The effect of bulk iron concentration and heterogeneities on the copper activation of sphalerite. Miner. Eng. 2008, 21, 1005–1012. [Google Scholar] [CrossRef]
  7. Osadchii, E.G.; Gorbaty, Y.E. Raman spectra and unit cell parameters of sphalerite solid solutions (FexZn1−xS). Geochim. Cosmochim. Acta 2010, 74, 568–573. [Google Scholar] [CrossRef]
  8. Deng, J.; Lai, H.; Chen, M.; Glen, M.; Wen, S.; Zhao, B.; Wen, S.; Yang, H.; Liu, M.; Huang, L.; et al. Effect of iron concentration on the crystallization and electronic structure of sphalerite/marmatite: A DFT study. Miner. Eng. 2019, 136, 168–174. [Google Scholar] [CrossRef]
  9. Zhang, Y.; Zhao, H.; Qian, L.; Sun, M.; Lv, X.; Zhang, L.; Petersen, J.; Qiu, G. A brief overview on the dissolution mechanisms of sulfide minerals in acidic sulfate environments at low temperatures: Emphasis on electrochemical cyclic voltammetry analysis. Miner. Eng. 2020, 158, 106586. [Google Scholar] [CrossRef]
  10. Souza, A.D.; Pina, P.S.; Leão, V.A. Bioleaching and chemical leaching as an integrated process in the zinc industry. Miner. Eng. 2007, 20, 591–599. [Google Scholar] [CrossRef] [Green Version]
  11. Ghassa, S.; Noaparast, M.; Shafaei, S.Z.; Abdollahi, H.; Gharabaghi, M.; Boruomand, Z. A study on the zinc sulfide dissolution kinetics with biological and chemical ferric reagents. Hydrometallurgy 2017, 171, 362–373. [Google Scholar] [CrossRef]
  12. Pina, P.; Leão, V.; Silva, C.; Daman, D.; Frenay, J. The effect of ferrous and ferric iron on sphalerite bioleaching with Acidithiobacillus sp. Miner. Eng. 2005, 18, 549–551. [Google Scholar] [CrossRef]
  13. Haghshenas, D.F.; Alamdari, E.K.; Torkmahalleh, M.A.; Bonakdarpour, B.; Nasernejad, B. Adaptation of Acidithiobacillus ferrooxidans to high grade sphalerite concentrate. Miner. Eng. 2009, 22, 1299–1306. [Google Scholar] [CrossRef]
  14. Schippers, A.; Tanne, C.; Stummeyer, J.; Graupner, T. Sphalerite bioleaching comparison in shake flasks and percolators. Miner. Eng. 2019, 132, 251–257. [Google Scholar] [CrossRef]
  15. Ban, J.R.; Gu, G.H.; Hu, K. Bioleaching and electrochemical property of marmatite by Leptospirillum ferrooxidans. Trans. Nonferrous Met. Soc. China 2013, 23, 494–500. [Google Scholar] [CrossRef]
  16. Ahmadi, A.; Mousavi, S. The influence of physicochemical parameters on the bioleaching of zinc sulfide concentrates using a mixed culture of moderately thermophilic microorganisms. Int. J. Miner. Process. 2015, 135, 32–39. [Google Scholar] [CrossRef]
  17. Haghshenas, D.F.; Bonakdarpour, B.; Alamdari, E.K.; Nasernejad, B. Optimization of physicochemical parameters for bioleaching of sphalerite by Acidithiobacillus ferrooxidans using shaking bioreactors. Hydrometallurgy 2012, 111-112, 22–28. [Google Scholar] [CrossRef]
  18. Charikinya, E.; Bradshaw, S. An experimental study of the effect of microwave treatment on long term bioleaching of coarse, massive zinc sulphide ore particles. Hydrometallurgy 2017, 173, 106–114. [Google Scholar] [CrossRef]
  19. Ghorbani, Y.; Petersen, J.; Harrison, S.T.; Tupikina, O.V.; Becker, M.; Mainza, A.N.; Franzidis, J.-P. An experimental study of the long-term bioleaching of large sphalerite ore particles in a circulating fluid fixed-bed reactor. Hydrometallurgy 2012, 161–171. [Google Scholar] [CrossRef]
  20. Tao, L.; Yao, C.; Juanjuan, S.; Wei, C.; Yangge, Z.; Chonghui, Z.; Xianzhong, B. Effect of grinding media on the flotation of copper-activated marmatite. Physicochem. Probl. Miner. Process. 2020, 56, 229–237. [Google Scholar]
  21. Tian, L.; Zhang, T.; Liu, Y.; Lv, G.Z.; Tang, J.J. Oxidative acid leaching of mechanically activated sphalerite. Can. Met. Q. 2017, 57, 59–69. [Google Scholar] [CrossRef]
  22. Cao, S.T.; Zheng, X.; Nie, Z.; Zhou, Y.H.; Liu, H.C.; Chen, J.H.; Yang, H.; Xia, J.L. Mechanical Activation on Bioleaching of Chalcopyrite: A New Insight. Minerals 2020, 10, 788. [Google Scholar] [CrossRef]
  23. Baláž, P. Mechanical activation in hydrometallurgy. Int. J. Miner. Process. 2003, 72, 341–354. [Google Scholar] [CrossRef]
  24. Tromans, D.; Meech, J. Enhanced dissolution of minerals: Stored energy, amorphism and mechanical activation. Miner. Eng. 2001, 14, 1359–1377. [Google Scholar] [CrossRef]
  25. Zhao, H.; Wang, J.; Qin, W.; Hu, M.; Zhu, S.; Qiu, G. Electrochemical dissolution process of chalcopyrite in the presence of mesophilic microorganisms. Miner. Eng. 2015, 71, 159–169. [Google Scholar] [CrossRef]
  26. Baláž, P.; Achimovičová, M.; Bastl, Z.; Ohtani, T.; Sánchez, M. Influence of mechanical activation on the alkaline leaching of enargite concentrate. Hydrometallurgy 2000, 54, 205–216. [Google Scholar] [CrossRef]
  27. Mousavi, S.M.; Yaghmaei, S.; Vossoughi, M.; Roostaazad, R.; Jafari, A.; Ebrahimi, M.; Chabok, O.H.; Turunen, I. The effects of Fe(II) and Fe(III) concentration and initial pH on microbial leaching of low-grade sphalerite ore in a column reactor. Bioresour. Technol. 2008, 99, 2840–2845. [Google Scholar] [CrossRef]
  28. Daoud, J.; Karamanev, D. Formation of jarosite during Fe2+ oxidation by Acidithiobacillus ferrooxidans. Miner. Eng. 2006, 19, 960–967. [Google Scholar] [CrossRef]
  29. Zhang, Y.; Zheng, S.L.; Du, H.; Xu, H.B.; Zhang, Y. Effect of mechanical activation on alkali leaching of chromite ore. Trans. Nonferrous Met. Soc. China 2010, 20, 888–891. [Google Scholar] [CrossRef]
  30. Jones, G.C.; Corin, K.; Van Hille, R.; Harrison, S.T. The generation of toxic reactive oxygen species (ROS) from mechanically activated sulphide concentrates and its effect on thermophilic bioleaching. Miner. Eng. 2011, 24, 1198–1208. [Google Scholar] [CrossRef]
  31. Xia, L.X.; Liu, J.S.; Xiao, L.; Zeng, J.; Li, B.M.; Geng, M.M.; Qiu, G.Z. Single and cooperative bioleaching of sphalerite by two kinds of bacteria—Acidithiobacillus ferriooxidans and Acidithiobacillus thiooxidans. Trans. Nonferrous Met. Soc. China 2008, 18, 190–195. [Google Scholar] [CrossRef]
  32. Zhang, Y.; Zhao, H.; Zhang, Y.; Liu, H.; Yin, H.; Deng, J.; Qiu, G. Interaction mechanism between marmatite and chalcocite in acidic (microbial) environments. Hydrometallurgy 2020, 191, 105217. [Google Scholar] [CrossRef]
  33. Liu, S.; Hong, M.; Wang, X.; Yang, B.; Lin, H.; Lin, M.; Wang, J.; Qiu, G. Pretreatment with acidic ferric sulfate leaching promotes the bioleaching of bornite. Hydrometallurgy 2020, 196, 105349. [Google Scholar] [CrossRef]
  34. Shi, S.Y.; Fang, Z.H.; Ni, J.R. Comparative study on the bioleaching of zinc sulphides. Process. Biochem. 2006, 41, 438–446. [Google Scholar] [CrossRef]
  35. Crundwell, F.K. Effect of iron impurity in zinc sulfide concentrates on the rate of dissolution. AIChE J. 1988, 34, 1128–1134. [Google Scholar] [CrossRef]
  36. Crundwell, F.K. Analysis of the activation energy of dissolution of the iron-containing zinc sulfide (sphalerite). J. Phys. Chem. C 2020, 124, 15347–15354. [Google Scholar] [CrossRef]
  37. Borda, M.J.; Elsetinow, A.R.; Strongin, D.R.; Schoonen, M.A. A mechanism for the production of hydroxyl radical at surface defect sites on pyrite. Geochim. Cosmochim. Acta 2003, 67, 935–939. [Google Scholar] [CrossRef]
Figure 1. XRD spectra of mineral samples: (a) sphalerite and (b) marmatite.
Minerals 11 00111 g001
Figure 2. Particle size distribution of activated sphalerite samples (a) and marmatite samples: (b) #C—corundum jar with zirconia balls; #S—stainless steel jar with stainless steel balls; n’–n min.
Minerals 11 00111 g002
Figure 3. Particle fraction distribution of activated sphalerite samples: (a) D(0.1), (b): D(0.5), (c): D(0.9), and (d) specific surface area.
Minerals 11 00111 g003
Figure 4. SEM images of activated sphalerite samples (1000-fold magnification): (a) #S30’, (b) #S60’, (c) #S120’, (d) #C30’, (e) #C60’, (f) #C120’ (#C—corundum jar with zirconia balls; #S—stainless steel jar with stainless steel balls; n’–n min).
Minerals 11 00111 g004
Figure 5. SEM images of activated marmatite samples (1000-fold magnification): (a) #S30’, (b) #S60’, (c) #S120’, (d) #C30’, (e) #C60’, (f) #C120’ (#C—corundum jar with zirconia balls; #S—stainless steel jar with stainless steel balls; n’–n min).
Minerals 11 00111 g005
Figure 6. XRD spectra of mineral samples: (a) sphalerite sample, (b) marmatite sample (#C—corundum jar with zirconia balls; #S—stainless steel jar with stainless steel balls; n’–n min).
Minerals 11 00111 g006
Figure 7. (a) Zn recovery of sphalerite group, (b) Zn recovery of marmatite group, (c) Fe concentration of sphalerite group, (d) Fe concentration of marmatite group (#C—corundum jar with zirconia balls; #S—stainless steel jar with stainless steel balls; n’–n min).
Minerals 11 00111 g007
Figure 8. (a) ORP, (c) pH values, and (e) microbial concentration of sphalerite group, (b) ORP, (d) pH values, and (f) microbial concentration of marmatite group (#C—corundum jar with zirconia balls; #S—stainless steel jar with stainless steel balls; n’–n min; ORP—oxidation-reduction potential versus Ag/AgCl reference electrode).
Minerals 11 00111 g008
Figure 9. XRD spectra of several bioleaching residues: (a) sphalerite and (b) marmatite (#C—corundum jar with zirconia balls; #S—stainless steel jar with stainless steel balls; n’–n min).
Minerals 11 00111 g009
Figure 10. SEM-EDS analysis of the nontreated sphalerite bioleaching residue: (a) 200 times magnification, (b) 1500 times magnification indicate the morphology and distribution of intermediate products; (c–h) represent the EDS mapping results of the element overlay, oxygen, sulfur, potassium, iron and zinc elements on the residue surface, respectively.
Minerals 11 00111 g010
Table 1. Elemental composition of sphalerite and marmatite samples (%)*.
SamplesZnFeSOSiCaAlMgCdPbCuMnOthers
Sphalerite63.861.1831.420.930.610.460.260.270.83---0.18
Marmatite52.1912.2933.080.180.62-0.06-0.280.710.180.180.23
*“-”: Below detection.
Table 2. The main surface mass (Wt%) and atomic (At%) percentages of the nontreated sphalerite bioleaching residue, normalized to O, S, K, Fe and Zn (%).
ElementsWt%At%
O K48.5173.61
S K11.508.71
K K5.003.10
Fe K24.9710.86
Zn K10.033.72
MatrixCorrectionZAF
Publisher’s Note: MDPI stays neutral with regard to jurisdictional claims in published maps and institutional affiliations.

