Article

Adsorption of Strontium onto Synthetic Iron(III) Oxide up to High Ionic Strength Systems

1
Amphos 21 Consulting SL, 08019 Barcelona, Spain
2
Institute for Nuclear Waste Disposal (INE), Karlsruhe Institute of Technology (KIT), 76344 Karlsruhe, Germany
3
Ecole Européenne de Chimie, Polymères et Matériaux-Strasbourg (ECPM), CEDEX 2, 67087 Strasbourg, France
4
Department of Chemistry, Moscow State University, 119991 Moscow, Russia
*
Author to whom correspondence should be addressed.
Deceased.
Minerals 2021, 11(10), 1093; https://doi.org/10.3390/min11101093
Submission received: 6 July 2021 / Revised: 17 September 2021 / Accepted: 28 September 2021 / Published: 5 October 2021

Abstract

:
In this work, the adsorption behavior of Sr onto a synthetic iron(III) oxide (hematite with traces of goethite) has been studied. This solid, which might be considered a representative of Fe3+ solid phases (iron corrosion products), was characterized by X-Ray Diffraction (XRD) and X-Ray Photoelectron Spectroscopy (XPS), and its specific surface area was determined. Both XRD and XPS data are consistent with a mixed solid containing more than 90% hematite and 10% goethite. The solid was further characterized by fast acid-base titrations at different NaCl concentrations (from 0.1 to 5 M). Subsequently, for each background NaCl concentration used for the acid-base titrations, Sr-uptake experiments were carried out involving two different levels of Sr concentration (1 × 10⁻⁵ and 5 × 10⁻⁵ M, respectively) at constant solid concentration (7.3 g/L) as a function of −log([H+]/M). A Surface Complexation Model (SCM) was fitted to the experimental data, following a coupled Pitzer/surface complexation approach. The Pitzer model was applied to aqueous species. A Basic Stern Model was used for interfacial electrostatics of the system, which includes ion-specific effects via ion-specific pair-formation constants, whereas the Pitzer-approach involves ion-interaction parameters that enter the model through activity coefficients for aqueous species. A simple 1-pK model was applied (generic surface species, denoted as >XOH−1/2). Parameter fitting was carried out using the general parameter estimation software UCODE, coupled to a modified version of FITEQL2. The combined approach describes the full set of data reasonably well and involves two Sr-surface complexes, one of them including chloride. Monodentate and bidentate models were tested and were found to perform equally well. The SCM is particularly able to account for the incomplete uptake of Sr at higher salt levels, supporting the idea that adsorption models conventionally used in salt concentrations below 1 M are applicable to high salt concentrations if the correct activity corrections for the aqueous species are applied. This generates a self-consistent model framework involving a practical approach for semi-mechanistic SCMs. The model framework of coupling conventional electrostatic double layer models for the surface with a Pitzer approach for the bulk solution earlier tested with strongly adsorbing solutes is here shown to be successful for more weakly adsorbing solutes.

1. Introduction

The management of Spent Nuclear Fuel (SNF) is of utmost importance for assuring the safety of future generations. Nowadays, two different SNF management strategies can be distinguished. In one, the fuel is reprocessed to extract fissile nuclides (U-235 and Pu-239) in order to fabricate mixed-oxide fuel, and the resulting high-level nuclear waste is vitrified for final disposal. In the other, SNF is simply considered as a waste and stored pending final disposal in deep repository systems, which is envisaged as the best option to handle the hazards that may otherwise be caused by those types of waste [1]. Briefly, in such facilities, the waste is placed in conditioned galleries buried in deep geological repositories in specific host-rock environments. For instance, depending on the country and available options in saline, clay, or granitic formations, different options are considered concerning the host-rock [2,3,4,5]. This disposal strategy involves an Engineered Barrier System (EBS) designed to mitigate the potential release of radionuclides from the repository to the near- and far-field. The major perturbation scenario starts with the intrusion of the site-specific (pore) waters into the repository, which causes corrosion and alteration reactions in the near-field, resulting in the mobilization and migration of radionuclides. The EBS and natural safety barriers have been and are being studied in the context of reactions with water, and also concerning the retention of radionuclides for the required nuclear waste disposal management settings.
One potential barrier, which typically is not considered in safety assessment concerning the retention of mobilized radionuclides, is the corroded or partially corroded steel canister. While the intact canister in clay formations is expected to isolate radionuclides for about 10,000 years, upon contact with pore-water, steel canisters will corrode, resulting in the formation of, e.g., iron oxides as corrosion products [6]. Such iron oxides are known to be strongly adsorbing minerals. Magnetite, for example, has been shown [7] to adsorb nearly 100% of trivalent cations, even in the presence of 5 M NaCl, i.e., a result comparable to data obtained with much lower salt content. While magnetite is expected to form in the long-term, Fe(III)oxyhydroxides, such as hematite (α-Fe2O3) or goethite (α-FeOOH), might form during the early, aerobic/oxic phase of repository evolution [6].
Within the SNF material, the fast/Instant Release Fraction (IRF) of radionuclides is of utmost importance, given that this fraction of radionuclides will be directly mobilized upon exposure to water after a safety barrier failure [8,9]. Sr, and specifically 90Sr, is part of the elements within the IRF and is released fastest under aerobic/oxic conditions [9]. Typically, 90Sr, with its short half-life of about 30 years, is not relevant for safety assessment, but Sr is rather taken as an indicator in the context of matrix-corrosion of the nuclear fuel. 90Sr is more relevant in the context of fallout from nuclear accidents [10] and nuclear weapons [11]. Various comprehensive papers on Sr interaction with mineral surfaces have been recently published [12,13]. In terms of solute mineral surface interaction, Sr adsorbs on oxides at relatively high pH values corresponding to its weak hydrolysis [14]. In this work, Sr as a rather weakly adsorbing cation is studied to better understand adsorption in highly saline conditions in contrast to more strongly binding trivalent actinides, which can be nearly completely bound, as discussed above. In this way, the ability of surface complexation models to deal with highly saline concentrations can also be tested. The salt level dependence for metal ion adsorption onto oxide minerals has frequently been studied and interpreted [15,16,17], but the concentration of the monovalent electrolytes typically has been limited to 1 M. Surface complexation models are known to be able to describe such data [15]. Much less is known regarding the ability of the models to describe uptake data at even higher background salt concentrations.
Some countries discuss settings for nuclear waste disposal that involve high salt concentrations of the relevant waters [18]. As an example, in Germany some options for repositories in areas that would involve highly saline aqueous solutions (up to saturated brines, i.e., for rock-salt about 5 M NaCl at room temperature) have been discussed [19], and experimental data and models for treating such systems are required. While the state-of-the-art in treating solution speciation and solubility in brine solutions using the Pitzer approach is established, and for many relevant systems is quite advanced [20], experimental determination of uptake data and the application of thermodynamic adsorption models to high salt levels are rather scarce.
Early experimental studies on Sr adsorption on clays [21] with high salt levels, as well as the associated modelling attempts [22], may be criticized because the details of pH measurements are not given. The same is true for the titrations of mineral oxides up to high pH, such as silica in up to 4 M NaCl [23] or ferrihydrite in up to 6 M NaCl [24]. For high salt levels, specific precautions must be taken to obtain meaningful data from electrode readings [25,26,27]. From our point of view, self-consistent and comprehensive data covering both titrations and the uptake of solutes in brine solutions have recently gained importance [7,28]. In the iron oxide-hydroxide systems, as well as in the work on clays [27,29,30], the associate potentiometric titrations to design the acid-base models were carried out up to 1 M concentration, while the titrations by Garcia et al. [28] were carried out up to 5 M. The modelling in the above cited papers (involving self-consistent data) coupled non-electrostatic [27,29,30] or electrostatic [7,28] surface complexation models with the Pitzer or Specific ion Interaction Theory (SIT) approaches [31,32,33,34]. Garcia et al. [28] also showed that the acid-base model involved strong shielding of the charge in the Stern layer, particularly at high salt levels, which results in very low diffuse layer potentials. As a consequence, the application of the Gouy–Chapman equation that is included in these models can be justified. The previous electrostatic models that were applied up to the high salt levels [7,28] involved a surface complexation scheme with reaction equations that could, in principle, be linked to the mechanistic level. The non-electrostatic models applied in the high salt concentration context [27,29,30] might also be interpreted, to some extent, in this way. Generic models, which simplify, however, are expected to be favored in many experimental settings where the mechanistic models cannot be applied due to the lack of adsorbent characterization [35]. For such settings, simpler models will be required, and one purpose of the present work is to test a generic 1-site, 1-pK Basic Stern model [35] with a limited, but consistent, set of experimental data up to 5 M NaCl concentrations.
Taken together, to further fill the gaps in the study of adsorption up to high salt level, we present another self-consistent set of data involving Sr adsorption on a synthetic iron(III) oxide including surface titrations. Although the choice of the system is related to the above discussed occurrence of Fe(III) minerals under aerobic/oxic conditions in a potential repository, the solid used here should rather be considered as a model sorbent because other iron minerals are more relevant. Hematite and goethite are highly relevant in soils [36].

2. Materials and Methods

2.1. Materials

The solid was synthesized by rapidly neutralizing a FeCl3 solution (0.45 M) with KOH (2.5 M) under argon atmosphere. This results in the formation of ferrihydrite, which is subsequently transformed to a crystalline form by heating at 90 °C for two days. The resulting solid was then dialysed with MilliQ (18.2 MΩ × cm, TOC < 5 ppb) water until the pH of the washing water was that of the MilliQ water (Merck-Millipore, Darmstadt, Germany). The resulting suspension was stored with a solid content of 82 g/L at pH 7.5 under argon in a plastic container. No glassware was used during preparation and storage. Aliquots of the suspension were centrifuged (Heraeus Instruments, Hanau, Germany, Megafuge 2.0, 3500 rpm for 15 min) and subsequently washed with MilliQ water. This was repeated three times, whereupon the solid paste was dried under an argon atmosphere. The specific surface area (measured by BET using nitrogen gas, AUTOSORB-1, Quantachrome Corporation, Boynton Beach, FL, USA) of the solid particles was 21 m2/g.
The solid phase was characterized by X-ray powder diffraction using a D8 Advance diffractometer (Bruker AXS, Karlsruhe, Germany) equipped with a Cu anode and a Sol-X detector. Data were recorded from 10° to 75°, with a step size of 0.015° and a counting time of 3 seconds per step. Phases were identified using the DIFFRAC.EVA v5.0 software (Bruker AXS, Karlsruhe, Germany,) by comparison with the PDF-2 database, and quantitative results were obtained from fits to the experimental powder diffractogram using the DIFFRAC.TOPAS v6.0 software (Bruker AXS, Karlsruhe, Germany) and reported crystallographic data of hematite [37] and goethite [38].
The powder was pressed onto indium foil and studied by an XPS system PHI 5000 VersaProbe II (ULVAC-PHI Inc., Chigasaki, Japan) equipped with a scanning microprobe X-ray source (monochromatic Al Kα, hν = 1486.7 eV). An electron flood gun generating low energy electrons (1.1 eV) and low energy argon ions (8 eV) by a floating ion gun were applied for charge compensation at isolating samples (dual beam technique), respectively. Survey scans were recorded with a pass energy of the analyzer of 187.85 eV. Narrow scans of the elemental lines were recorded at 11.75 eV pass energy, which yields an energy resolution of 0.59 eV FWHM (full width half maximum) at the Ag 3d5/2 elemental line of pure silver. Calibration of the binding energy scale of the spectrometer was performed using well-established binding energies of elemental lines of pure metals (monochromatic Al Kα: Cu 2p3/2 at 932.62 eV, Au 4f7/2 at 83.96 eV) [39]. The error of binding energies of elemental lines is estimated at ± 0.2 eV. The O 1s elemental line of α-Fe2O3 at 529.6 eV is used as a charge reference [40].
Atomic concentrations were calculated by areas of elemental lines of survey spectra after subtraction of a local Shirley background, taking into account sensitivity factors and asymmetry parameters of elemental lines and the transmission function of the analyzer. Relative error of atomic concentrations were within ±(10–20)%. Curve fits to narrow scans of elemental lines were performed by Gaussian–Lorentzian sum functions after Shirley background subtraction. Data analysis was performed using the ULVAC-PHI MultiPak program, version 9.9 (ULVAC-PHI Inc., Chigasaki, Japan).

2.2. Surface Titrations and Zeta Potentials Measurements

The solid particles were subject to acid-base titrations (848 Titrino plus, Metrohm, Herisau, Switzerland) at different NaCl concentrations: 0.1, 1.0, 3.0, and 5.0 M. The concentration of the particles was 1.39 g/L, and the titrant was 0.01 M HCl. Titration was initiated from alkaline conditions. The suspension was equilibrated overnight under humidified argon (not in a glove box, no bubbling). This atmosphere was also imposed for all titrations. The solid content was relatively low, and with a starting volume of 20 mL, only a few titration points per experiment were obtained. For the titration, 50 µL drops of titrant (0.01 M HCl) were added, and a data point was accepted when the change in pH was below 0.01 for a time span of 20 s. As a first step, 250 µL of 0.01 M NaOH were added to increase the pH to −log([H+]/M) ≥ 9 (except for the highest salt concentration, where the addition of the base solution resulted in a lower value after equilibration). With this procedure for each ionic strength, around 5–8 points were obtained. For each titration, a separate suspension was prepared. Calibration of the measurement setup involved standard buffers (at least five commercial buffers from Merck, between pH 2 and 10). To obtain meaningful data, we considered the “A”-factor [25], which allows the correction of operational pH values (which were obtained from the electrode readings) to pHc, where pHc = −log([H+]/M). The setup was purged by purified and humidified argon to avoid intrusion of carbon dioxide and limit evaporation. The data treatment involved the subtraction of a theoretical blank. All data treatment was done on the concentration (molar) scale. The required values for pKw at the different ionic strengths were calculated using the Pitzer formalism. Due to lack of material, the titrations could not be repeated, and they were verified by comparing the data to published data for hematite and goethite, as shown later.
The raw data from the titrations yielded the relative uptake or release of protons as a function of pHc. The relative number of protons adsorbed was calculated as the difference of the known amounts of protons added and the measured amounts of protons remaining in the solution. To obtain absolute proton related surface charge density or proton uptake data, a reference is needed. In the present work, the isoelectric point of the particles was determined at millimolar salt levels and in the absence of added salt to limit shifts of the isoelectric point due to potentially, specifically adsorbing counter-ions using a Brookhaven PALS (Holtsville, NY, USA) setup to fix the absolute level of the surface charge. The samples for these measurements were prepared in the same way as for the titrations. To verify whether Sr adsorption occurred, preliminary zeta-potential measurements (using the Brookhaven PALS) were carried out in solutions containing, additionally 10, 50, or 100 µM SrCl2. These samples were equilibrated for 24 h, i.e., prepared in the same way as described below for the adsorption experiments. A humidified argon atmosphere was used to avoid the interference of carbonate during the zeta-potential measurements. The solid concentration was 100 mg/L. The Hückel approximation was used to transfer measured mobilities to zeta-potentials. The settings of the software involved 10 runs per point with a fixed number of 30 measurements per run. The last measurement was then recorded by the software. The measurements were independently repeated by two persons, and the results agreed. The Brookhaven software reported the standard error for the results of the 10 runs, which was typically below 2 mV. The variation between the two distinct series of measurements was below 5 mV.
The Pitzer parameters were calculated using Geochemist’s workbench [41] from an appropriate database (thermo_phrqpitz). The database is available at https://www.gwb.com/thermo.php (version 13/04/2009) and contains the aqueous components in the system under investigation: Sr2+, Na+, Cl, H+, and OH. The use of one database ensures self-consistency throughout the modelling procedure with the treatment of the experimental titration and adsorption data. Fe(III) was excluded from the aqueous speciation scheme due to the low solubility of iron(III) oxide minerals, which would not affect the activity coefficients of the aqueous components considered in the modelling.

2.3. Batch Adsorption Studies

Sr adsorption onto the iron(III) oxide particles was studied separately in NaCl solutions of ionic strengths 0.1, 1, 3, and 5 M. Two Sr total concentrations were used, 1 × 10⁻⁵ and 5 × 10⁻⁵ M, and the solid-to-liquid ratio was 7.3 g/L. A humidified argon atmosphere was used to avoid carbon dioxide, as in the titrations and the zeta-potential measurements.
The Sr concentration range and solid-to-liquid ratio were chosen to assure a reasonable range for the analytical determination of Sr, which is complicated by the high salt levels. pHc values were varied in the range from 4.0 to 11.0. The contact time was 24 h. At the end of this period, the pH was measured in the suspension and corrected in the same way as for the titrations. Subsequently, the suspensions were centrifuged (Heraeus Instruments, Hanau, Germany, Megafuge 2.0, 3500 rpm for 15 min). The concentration of Sr in the supernatant was determined by ICP-OES. Uptake of Sr was determined from the difference between added Sr and Sr measured in the supernatant. One measurement per sample was performed. Reproducibility was verified by performing the two series of measurements by two different persons. The results were reproducible. Errors within the ICP-OES measurements were between three and six percent.

2.4. Speciation Calculations and Surface Complexation Modelling

The surface complexation model requires a proper treatment of the aqueous speciation and the activity coefficients of aqueous species. As a second sub-system, the acid-base properties of the sorbent need to be defined in an appropriate model before attempting to simulate Sr adsorption. This requires a stepwise procedure. We first defined the aqueous system, neglecting, as stated above, any reactions of dissolved Fe(III).
For Sr and the conditions investigated, we assumed that only Sr2+(aq) was present. This was verified by aqueous speciation calculations.
Starting from the fact that alkaline-earth elements show a poor tendency to hydrolyze, which increases with increasing atomic weight [42], it was inferred from these calculations that Sr hydrolysis is relevant for pHc > 12 for the conditions studied here. For 0.1 M NaCl, the calculations can be carried out using the Davies equation. Additional calculations involved a SIT database (see https://rdrr.io/cran/phreeqc/man/sit.dat.html, 29 May 2021) with PhreeqC [43], where we had to use SIT parameters for Ni2+, the one simple divalent cation for which ion interaction coefficients of the chloride ion with Ni2+, NiCl+, and NiOH+, i.e., the three species that could be relevant for Sr in NaCl, were available. The above sketched calculations were carried out to verify to what extent the hydrolysis species (SrOH+) needed to be considered because the Pitzer database that was finally used does not include any hydrolysis species of Sr. In the Pitzer formalism, the interaction between Sr2+ and Cl is described by interaction coefficients only. For the final calculations, the activity coefficients are used to obtain the relevant activities for dissolved species for the different NaCl concentrations using the Pitzer formalism. Because the SIT is usually applied up to 3–4 M, we applied the Pitzer approach due to the 5 M dataset. In summary, for Sr only, the dissolved Sr2+ ion has been considered in the aqueous phase. Pitzer activity coefficients were used as described above.
Surface protonation of the solid is simulated with a generic 1-pKa (≡XOH−1/2, where X stands for Fe, see Table 1). In general, various surface functional groups exist (singly, doubly, triply coordinated groups), even on ideal surfaces. On real surfaces, defect sites add complexity [44]. Surfaces for which the precise morphology (in terms of exposed crystal planes and their contributions to the overall surface area of a particle) is not available or which are expected to show other types of heterogeneity, do not allow a detailed treatment. Instead, one has to resort to a simpler model, ideally to the simplest one possible that allows one to describe the available data [45,46]. A basic Stern model is used for interfacial electrostatics of the system, which includes ion-specific effects via ion-pair formation constants, (as does Pitzer via ion-interaction parameters). The ion-specific effects for the surface complexation model are included in the pair formation constants of the ions of the background electrolyte [47]. Target cation (i.e., Sr) adsorption is modelled by keeping parameters that were obtained from fitting the titration results, i.e., site density, capacitance, surface hydrolysis constants, and ion-pair formation constants. Parameter fitting is done using the general parameter estimation software UCODE [48] coupled to a modified version of FITEQL2 [49].
No activity corrections, apart from electrostatic factors, are applied to surface species, i.e., in the mass law equations, only activity coefficients for dissolved species and activities of water have to be considered to calculate the ionic strength dependence of stability constants.
The pre-calculated activity coefficients and water activities from Geochemist’s workbench calculations for the respective salt levels were applied in the FITEQL2 input files.

3. Results

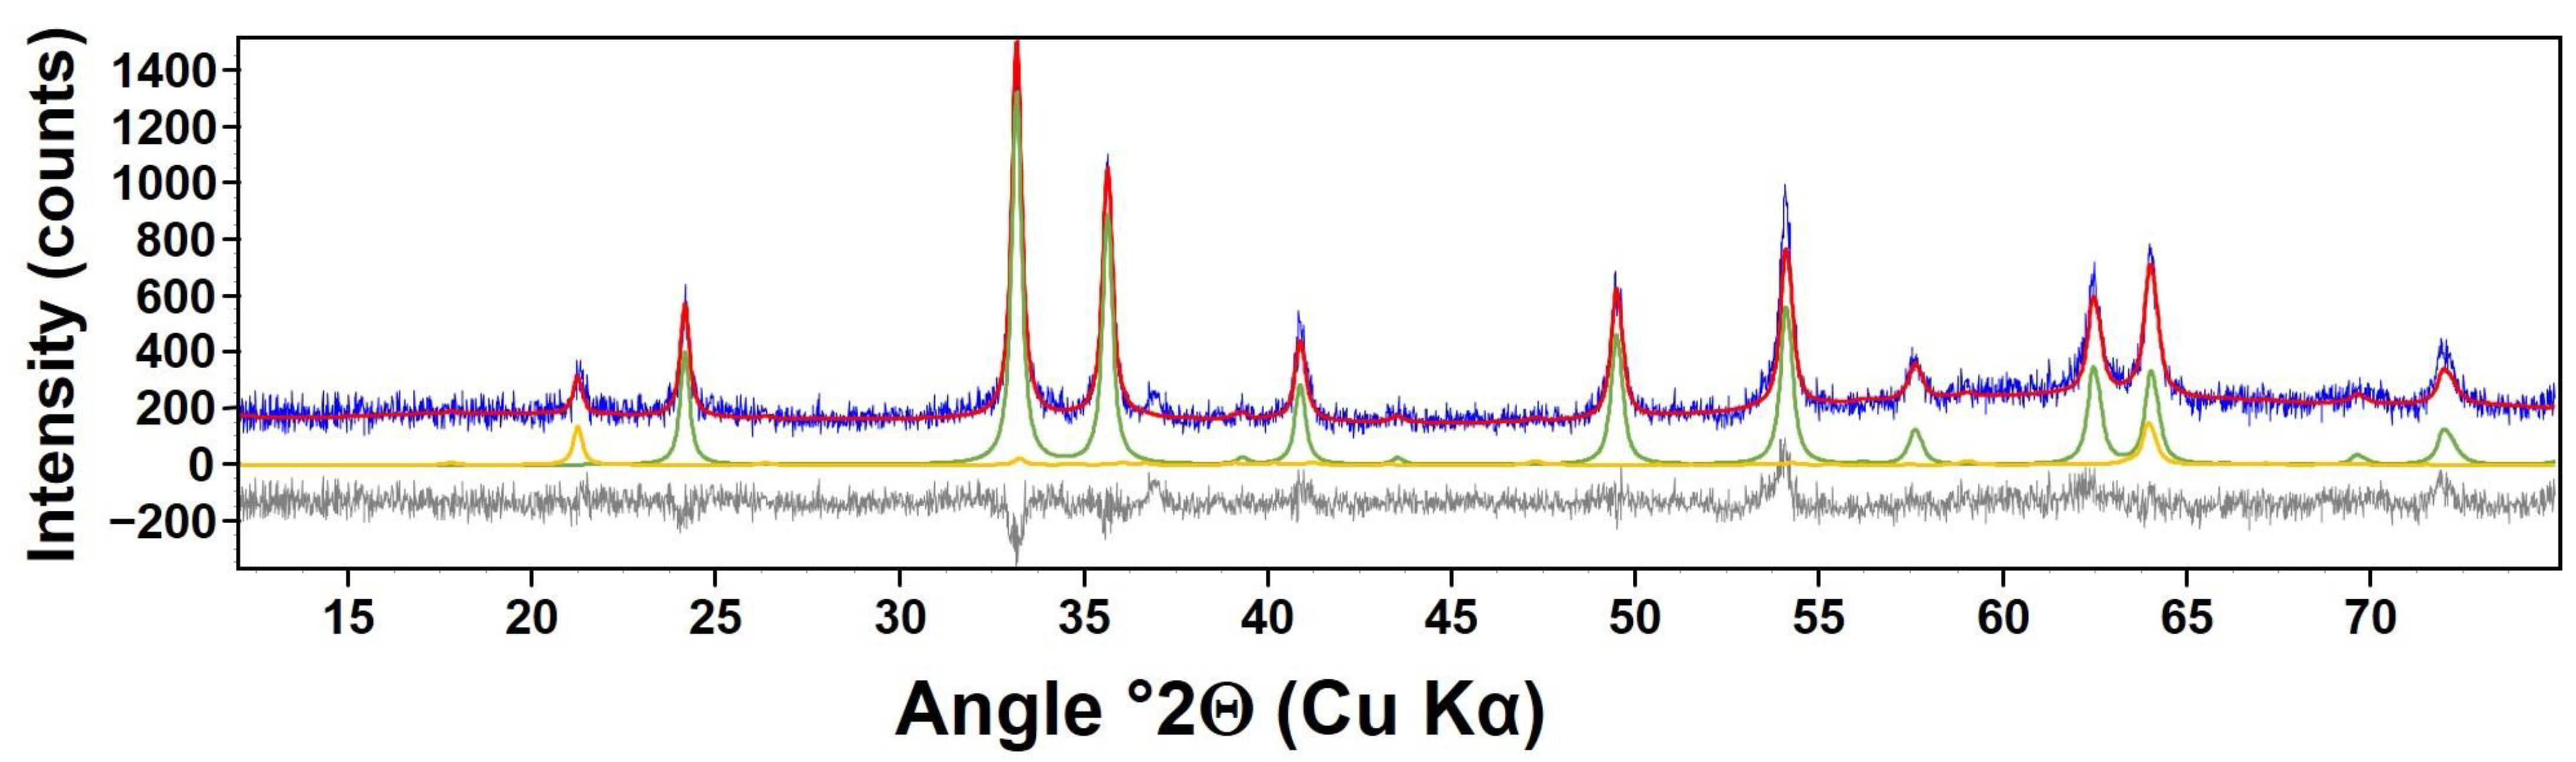
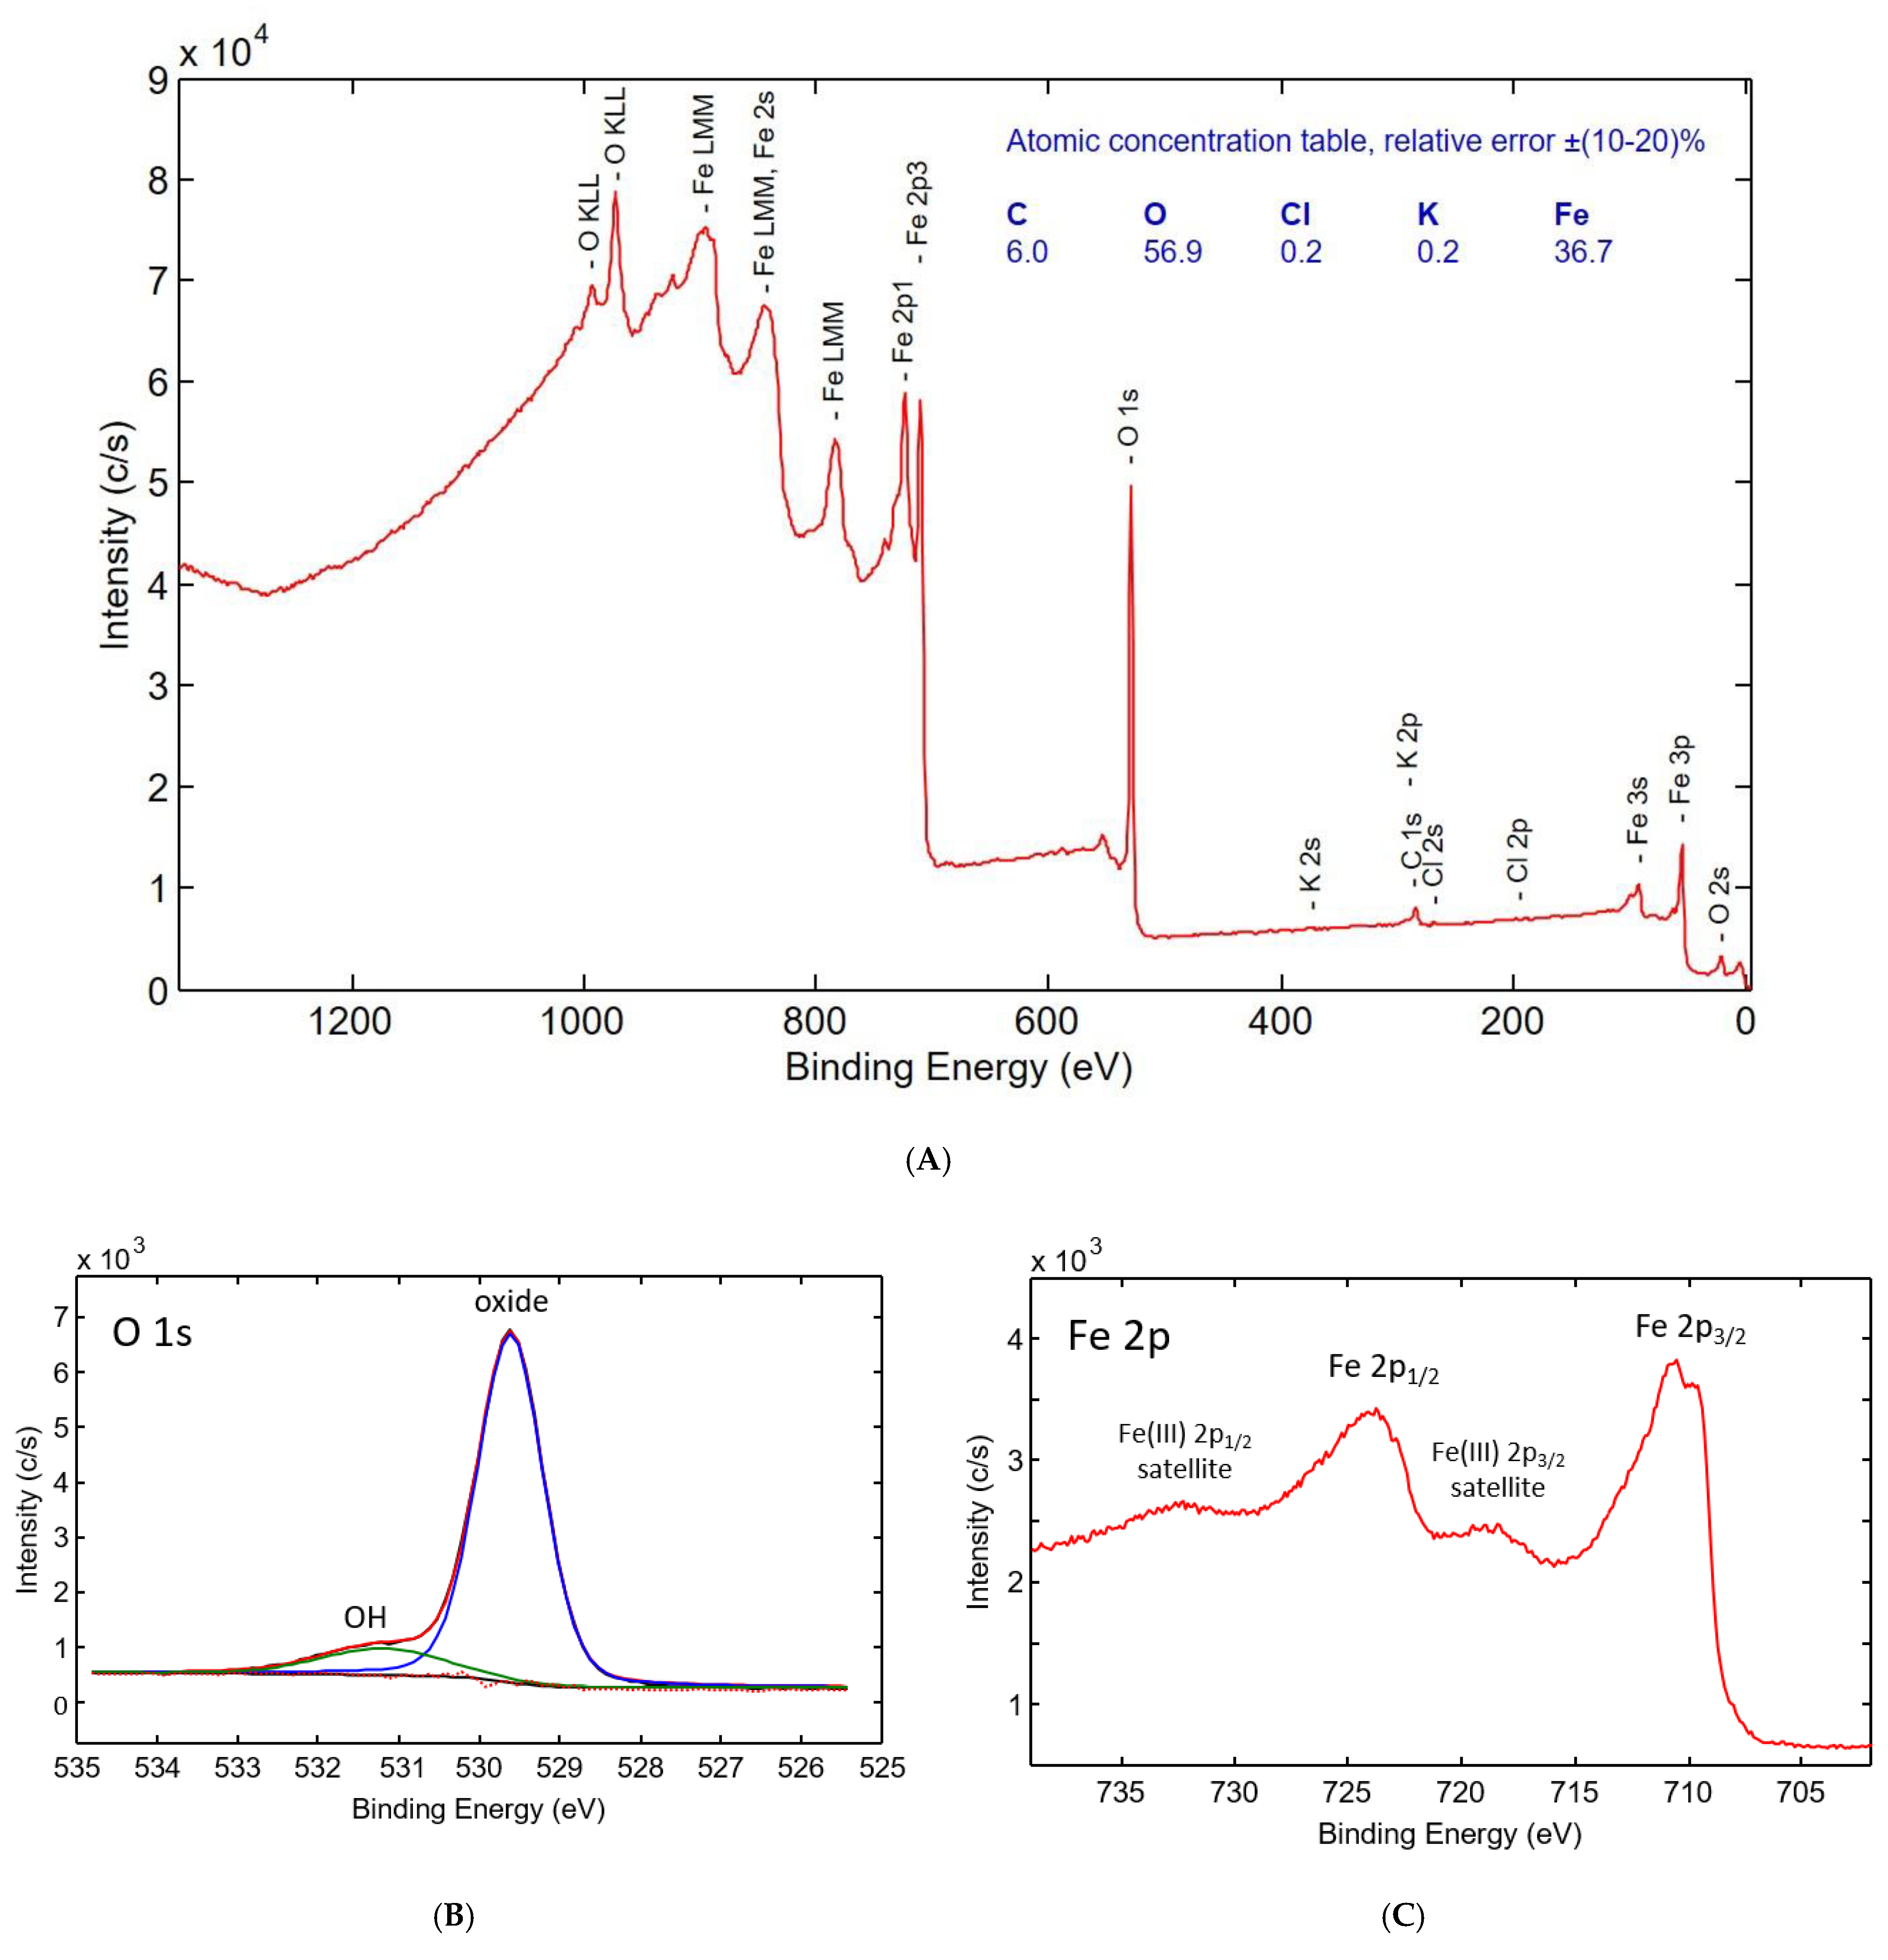
3.1. Solid Characterization

Figure 1 shows the XRD and Figure 2 the XPS data for the synthesized solid particles. A good fit to the powder diffractogram was obtained, considering the presence of 94% ± 2% hematite and 6% ± 2% goethite. No other crystalline phases were detected. As can be inferred from Figure 2A, the XPS measurement yields an atomic O/Fe concentration ratio of about 1.55, which is consistent with hematite plus some goethite. Figure 2B indicates that, within the penetration depth of the XPS measurement, the oxide dominates. Therefore, the results from the XRD and the XPS methods agree with each other concerning the presence of minor amounts of goethite. Figure 2A shows the presence of KCl impurities from the synthesis. KCl was not detected in the XRD measurements. Adventitious hydrocarbon is detected by XPS (Figure 2A) and is due to sample handling (i.e., transferring the sample to the XPS chamber). Finally, Figure 2C shows that no ferrous iron is detectable in the sample by XPS based on the absence of a shoulder at the low binding energy side of the Fe 2p3/2 peaks [50].

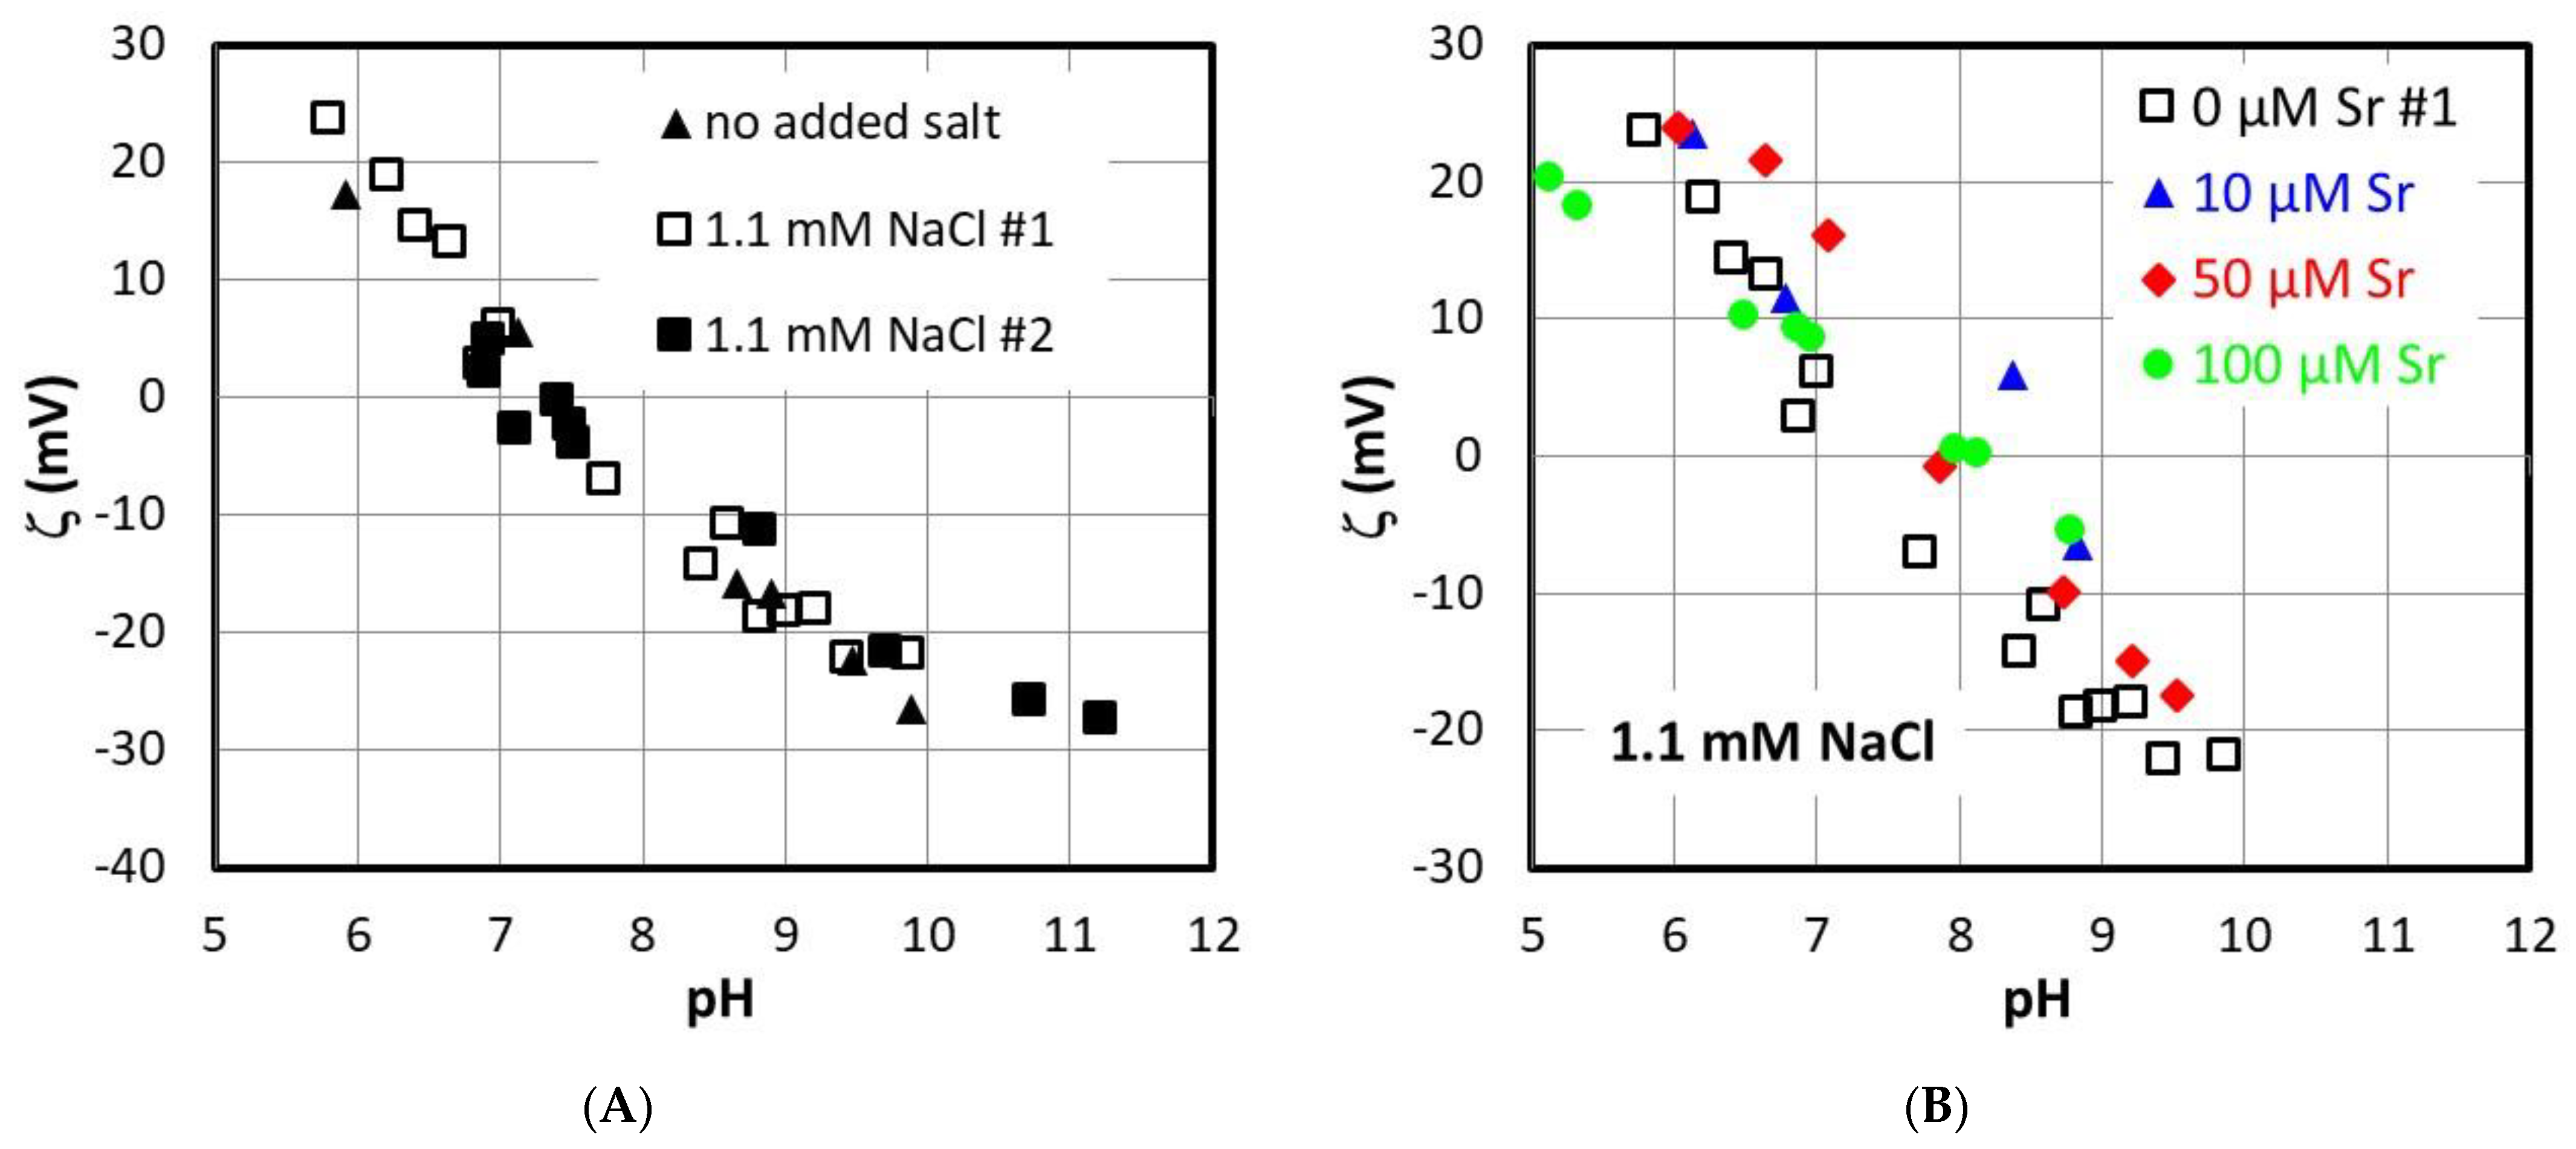
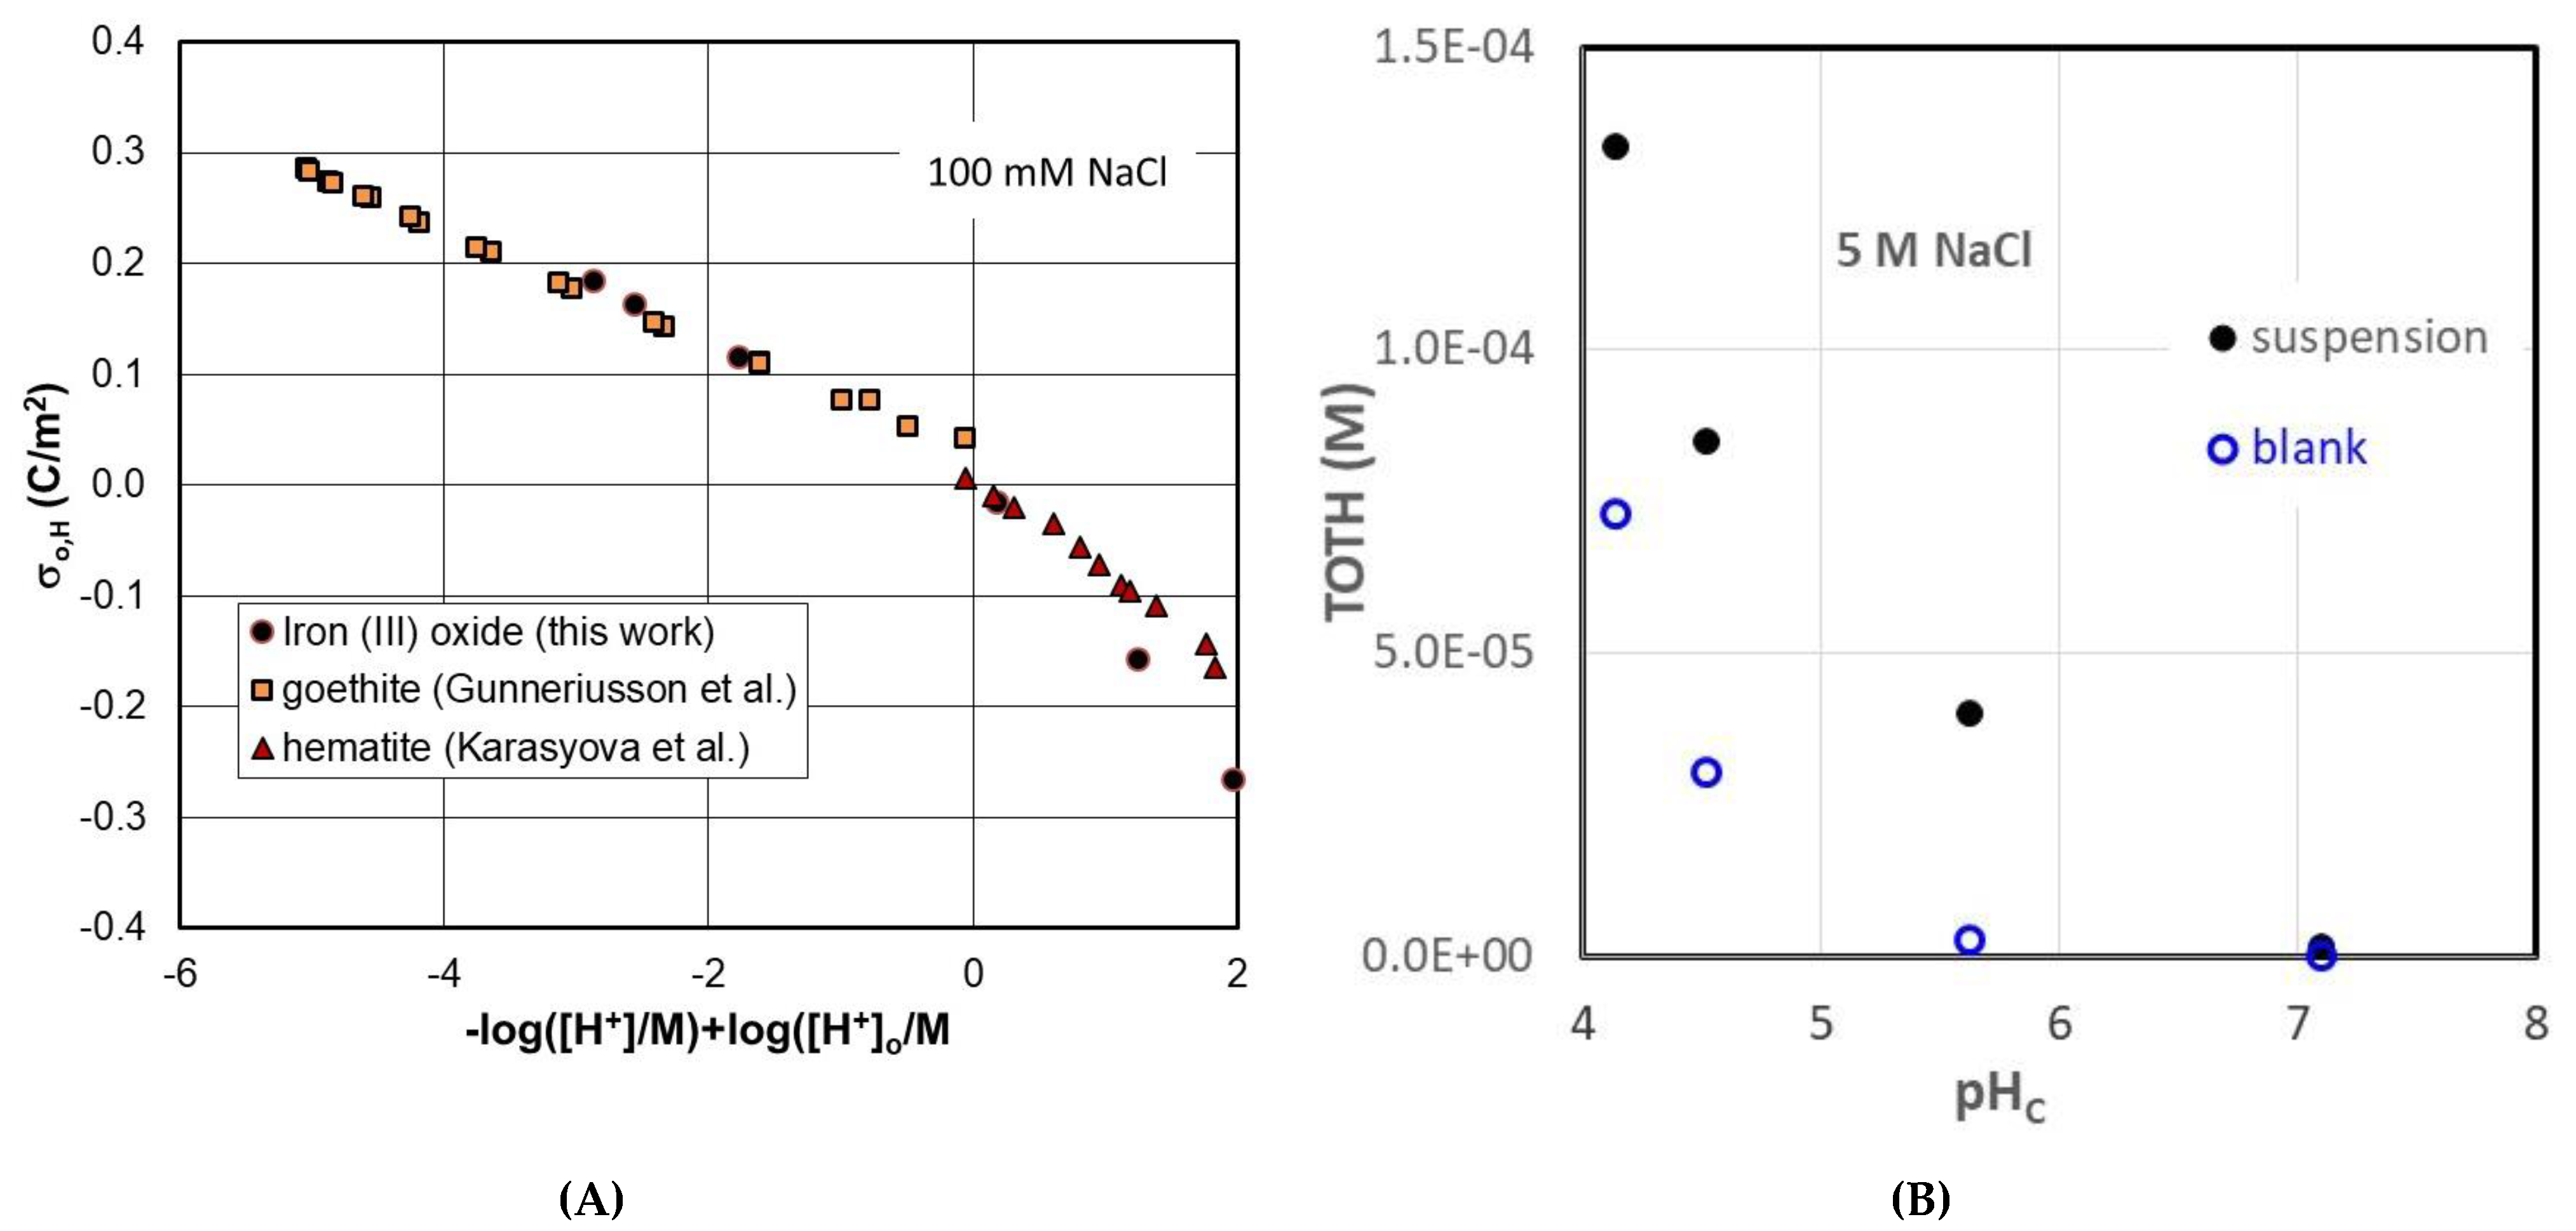
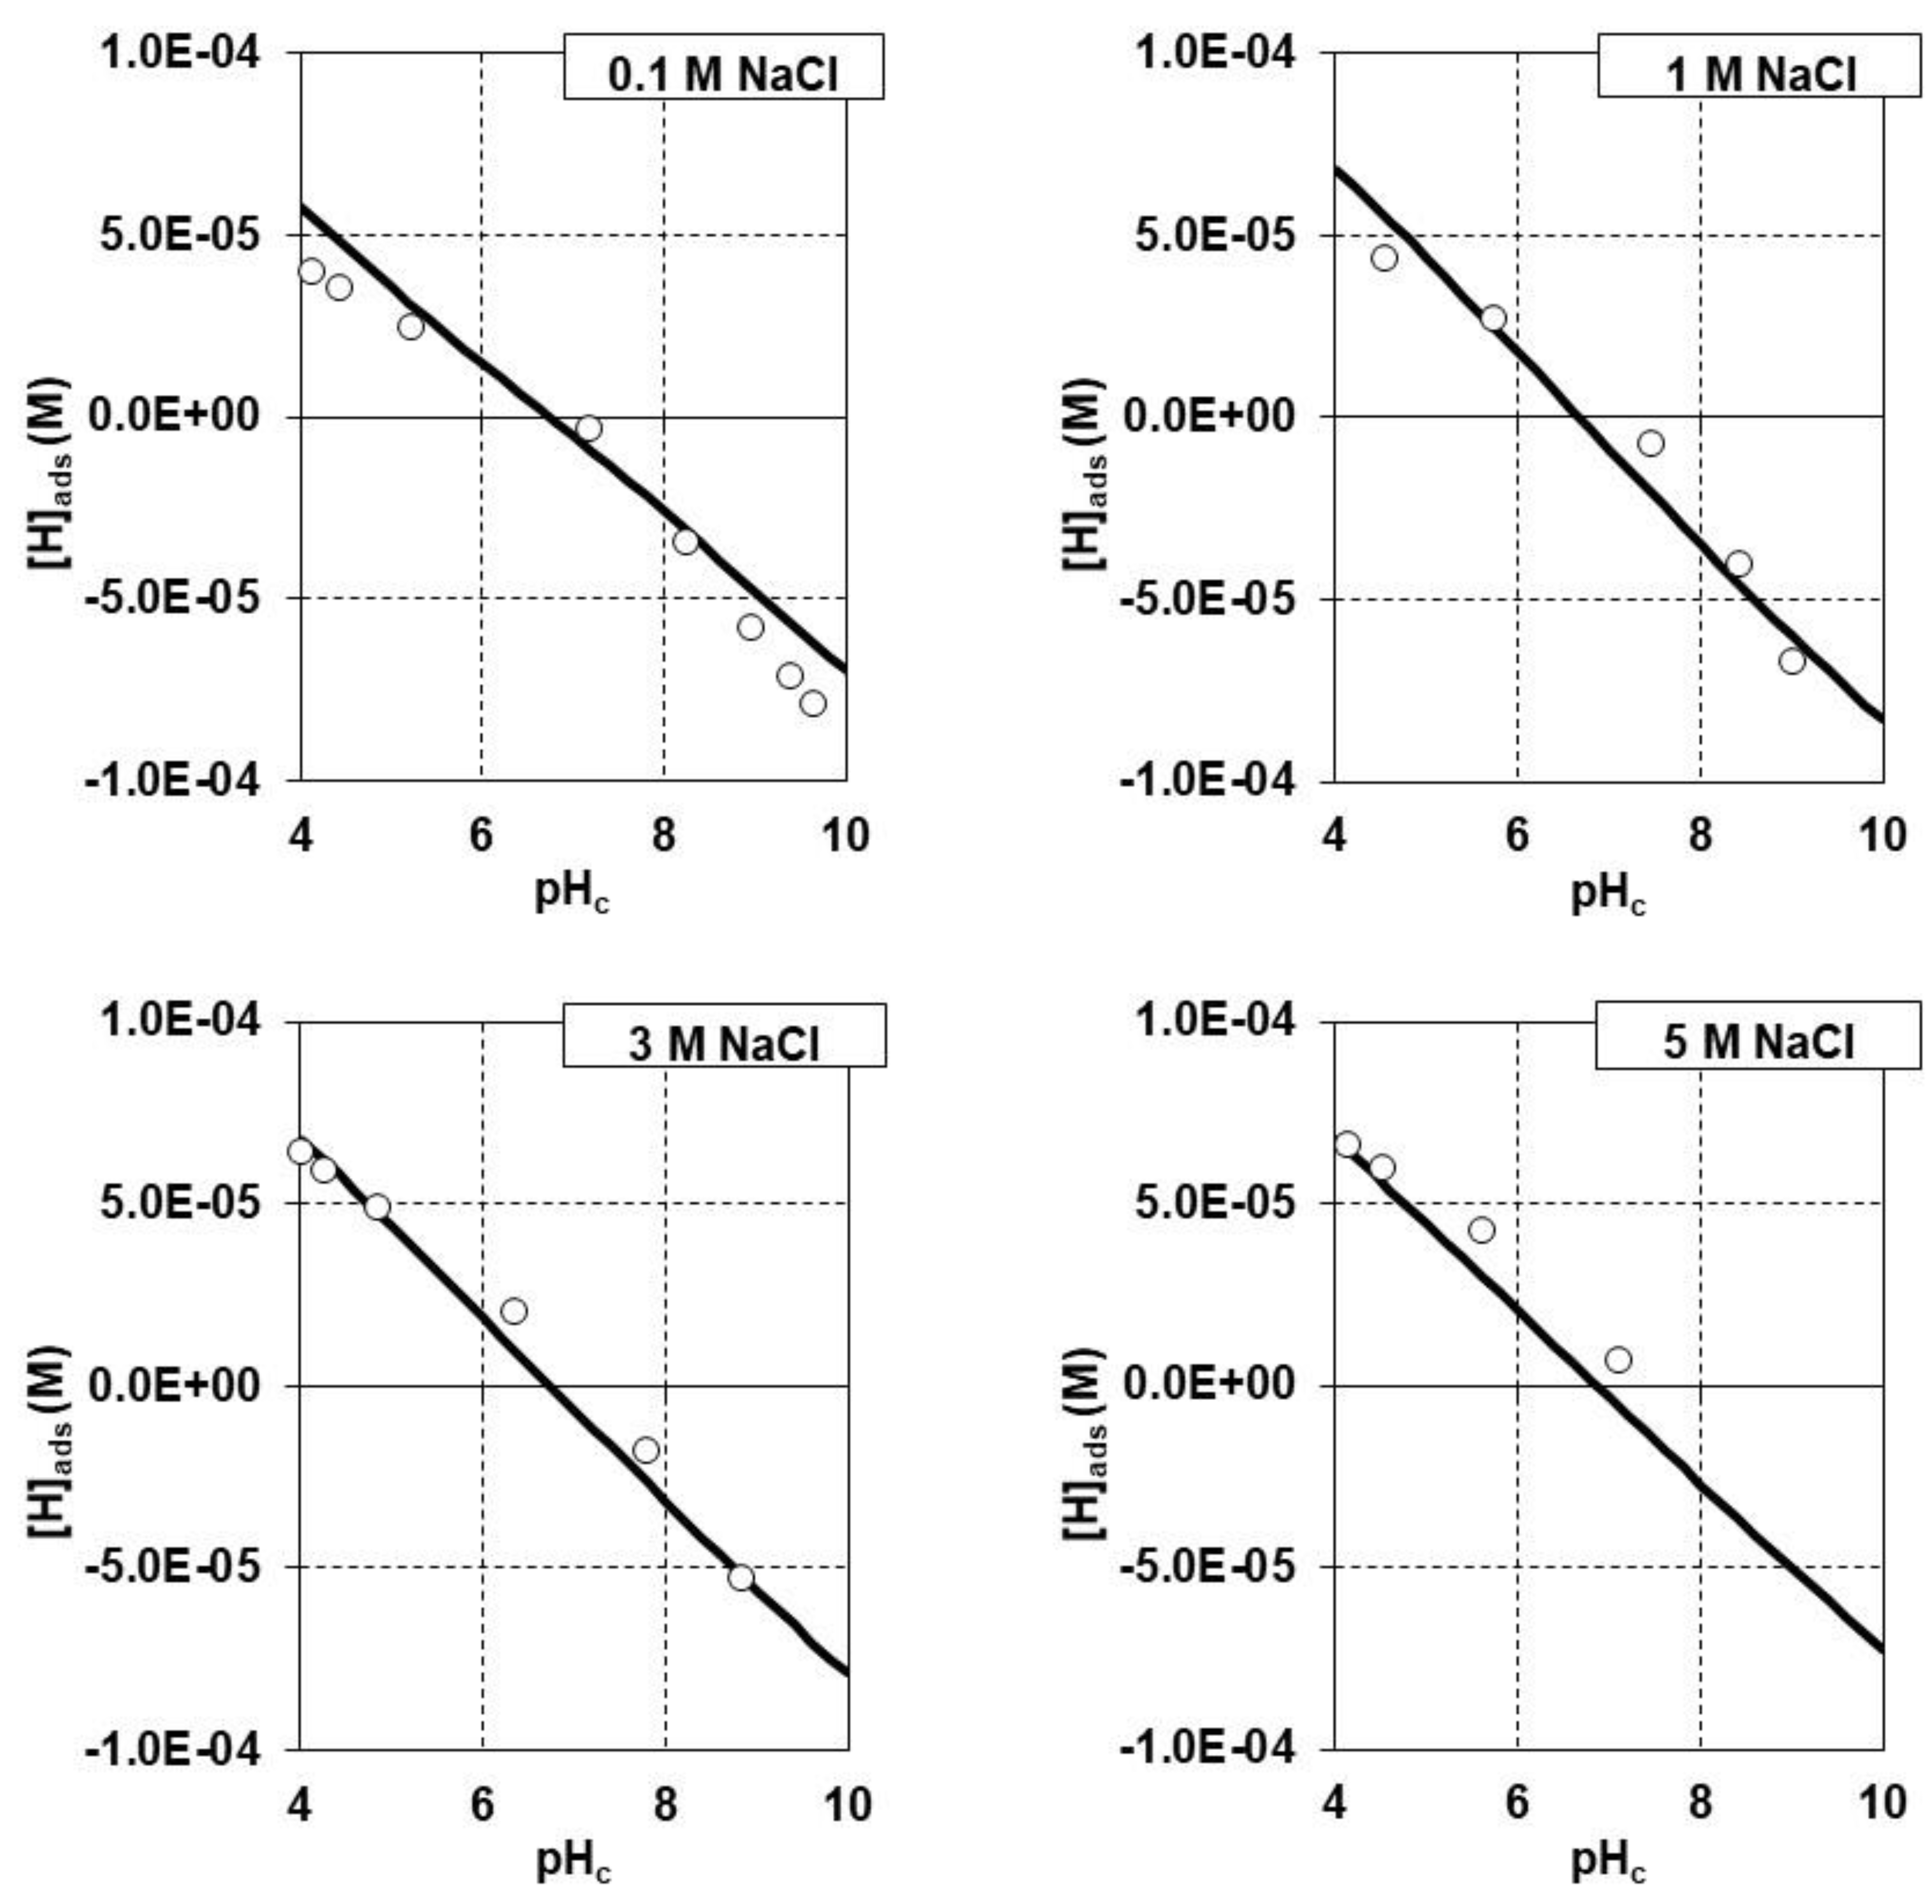
3.2. Electrokinetics and Surface Titrations

The zeta potential of the synthetic iron(III) oxide sample in the absence and presence of Sr2+(aq) is shown in Figure 3 as a function of pH. The isoelectric point of the solid in the absence of added salt and at about 1 mM NaCl can be between pH 7.1 and 7.6. For the modelling, it is taken to be at pH 7.1 (Figure 3A). Kosmulski [51] reports a range for points of zero charge for synthetic goethite between pH 5.6 and 10.2, and for synthetic hematite between pH 3.2 and 9.5. Therefore, the obtained results are in the range of previously reported values. The two separate series of experiments in Figure 3A show that the data were well reproducible. Figure 3B shows, for systems containing about 1 mM NaCl, that the addition of Sr leads to small but visible shifts of the isoelectric point to higher pH, indicating that Sr (specifically) adsorbs to the solid [52]. We emphasize that an accurate measurement of the isoelectric point (IEP) is difficult. Thus, the data in Figure 3A show significant scatter in the absence of Sr around the IEP. The reason for this is that, close to the IEP, the particles may aggregate more quickly and sediment, causing enhanced errors. We expect that the data points in the presence of Sr with |ζ| ≤ 10 mV are particularly affected by this effect and refrain from interpreting potential differences in the shifts of the IEP with Sr concentration. Rather, we believe the fact that for pH > 7, on average, all measurements in the presence of Sr yield results on the right side of the data in the absence of Sr indicate that there is a shift.
Next, we discuss the results of the titrations. We first show to what extent our results compare to previously published data, which were obtained on the proton concentration scale with the same background electrolyte.
Figure 4A compares our experimental data for 100 mM NaCl to data available in the literature for goethite and hematite [53,54]. These sets were chosen because the data were obtained on the proton concentration scale and because high-precision equipment was used. The comparison is done by relating the absolute proton related surface charge density, i.e., the x-axis refers to the respective points of zero charge in the two papers [53,54] and to the IEP measured for the solid studied here, Figure 3A, i.e., −log ([H+]o/M. The data agree very well, and we are therefore confident that our titration data are reliable, even if the amount of surface area in the titration vessel was relatively low, which also explains why relatively few data points are obtained. Figure 4B shows the comparison for data for the titration of the suspension in 5 M NaCl and the blank used for correction. It is clear that, despite the low amount of surface area used in the suspension titration, there is a clear difference between suspension and blank titration for the chosen conditions (as described in the experimental section). Even though for typical conditions (i.e. titrants with relatively high concentrations, such as 0.1 M) and typical titrant volumes (say, 0.2 mL), the surface area in the titration vessel should be as high as possible, it can be decreased if titrant concentration and volume added are accordingly adapted. The results shown in Figure 4 show that this was appropriately done in the present case, because literature data were reproduced for the low salt concentration (Figure 4A), and blank and suspension titrations showed significant and consistent differences as shown, for example, for the highest salt content (Figure 4B).
Figure 5 shows the results of the surface titrations in terms of protons adsorbed in molar concentrations as a function of pHc. The lines are calculated with the combination of an electrostatic surface complexation model (a 1-pK, 1-site, Basic Stern model) using the Pitzer approach. The site density was fixed at 6.36 sites/nm2, a value typical of iron oxides for this type of simplifying model [55]. Thus, the site density is in the range given by Barron and Torrent for hematite and goethite [36]. The pristine point of zero charge was fixed at pH 7.1, i.e., the isoelectric point in the absence of Sr (Figure 3A). This value is also used directly in the 1-pK protonation/deprotonation reaction. The remaining parameters that need to be determined from the experimental data are the electrolyte binding constants and the capacitance value. We obtained a good fit for the four salt concentrations investigated using the parameters given in Table 1.
The fitted parameters for electrolyte binding indicate a weaker affinity of chloride for the surface compared to sodium (Table 1). This deviates from results reported for a comparable model on goethite [55]. The fitted capacitance is somewhat higher than usually obtained (i.e., for the above cited work [55], the reported capacitance was 1.07 F/m2). Overall, with only three fitted parameters, we obtained an excellent fit to the measured proton uptake.

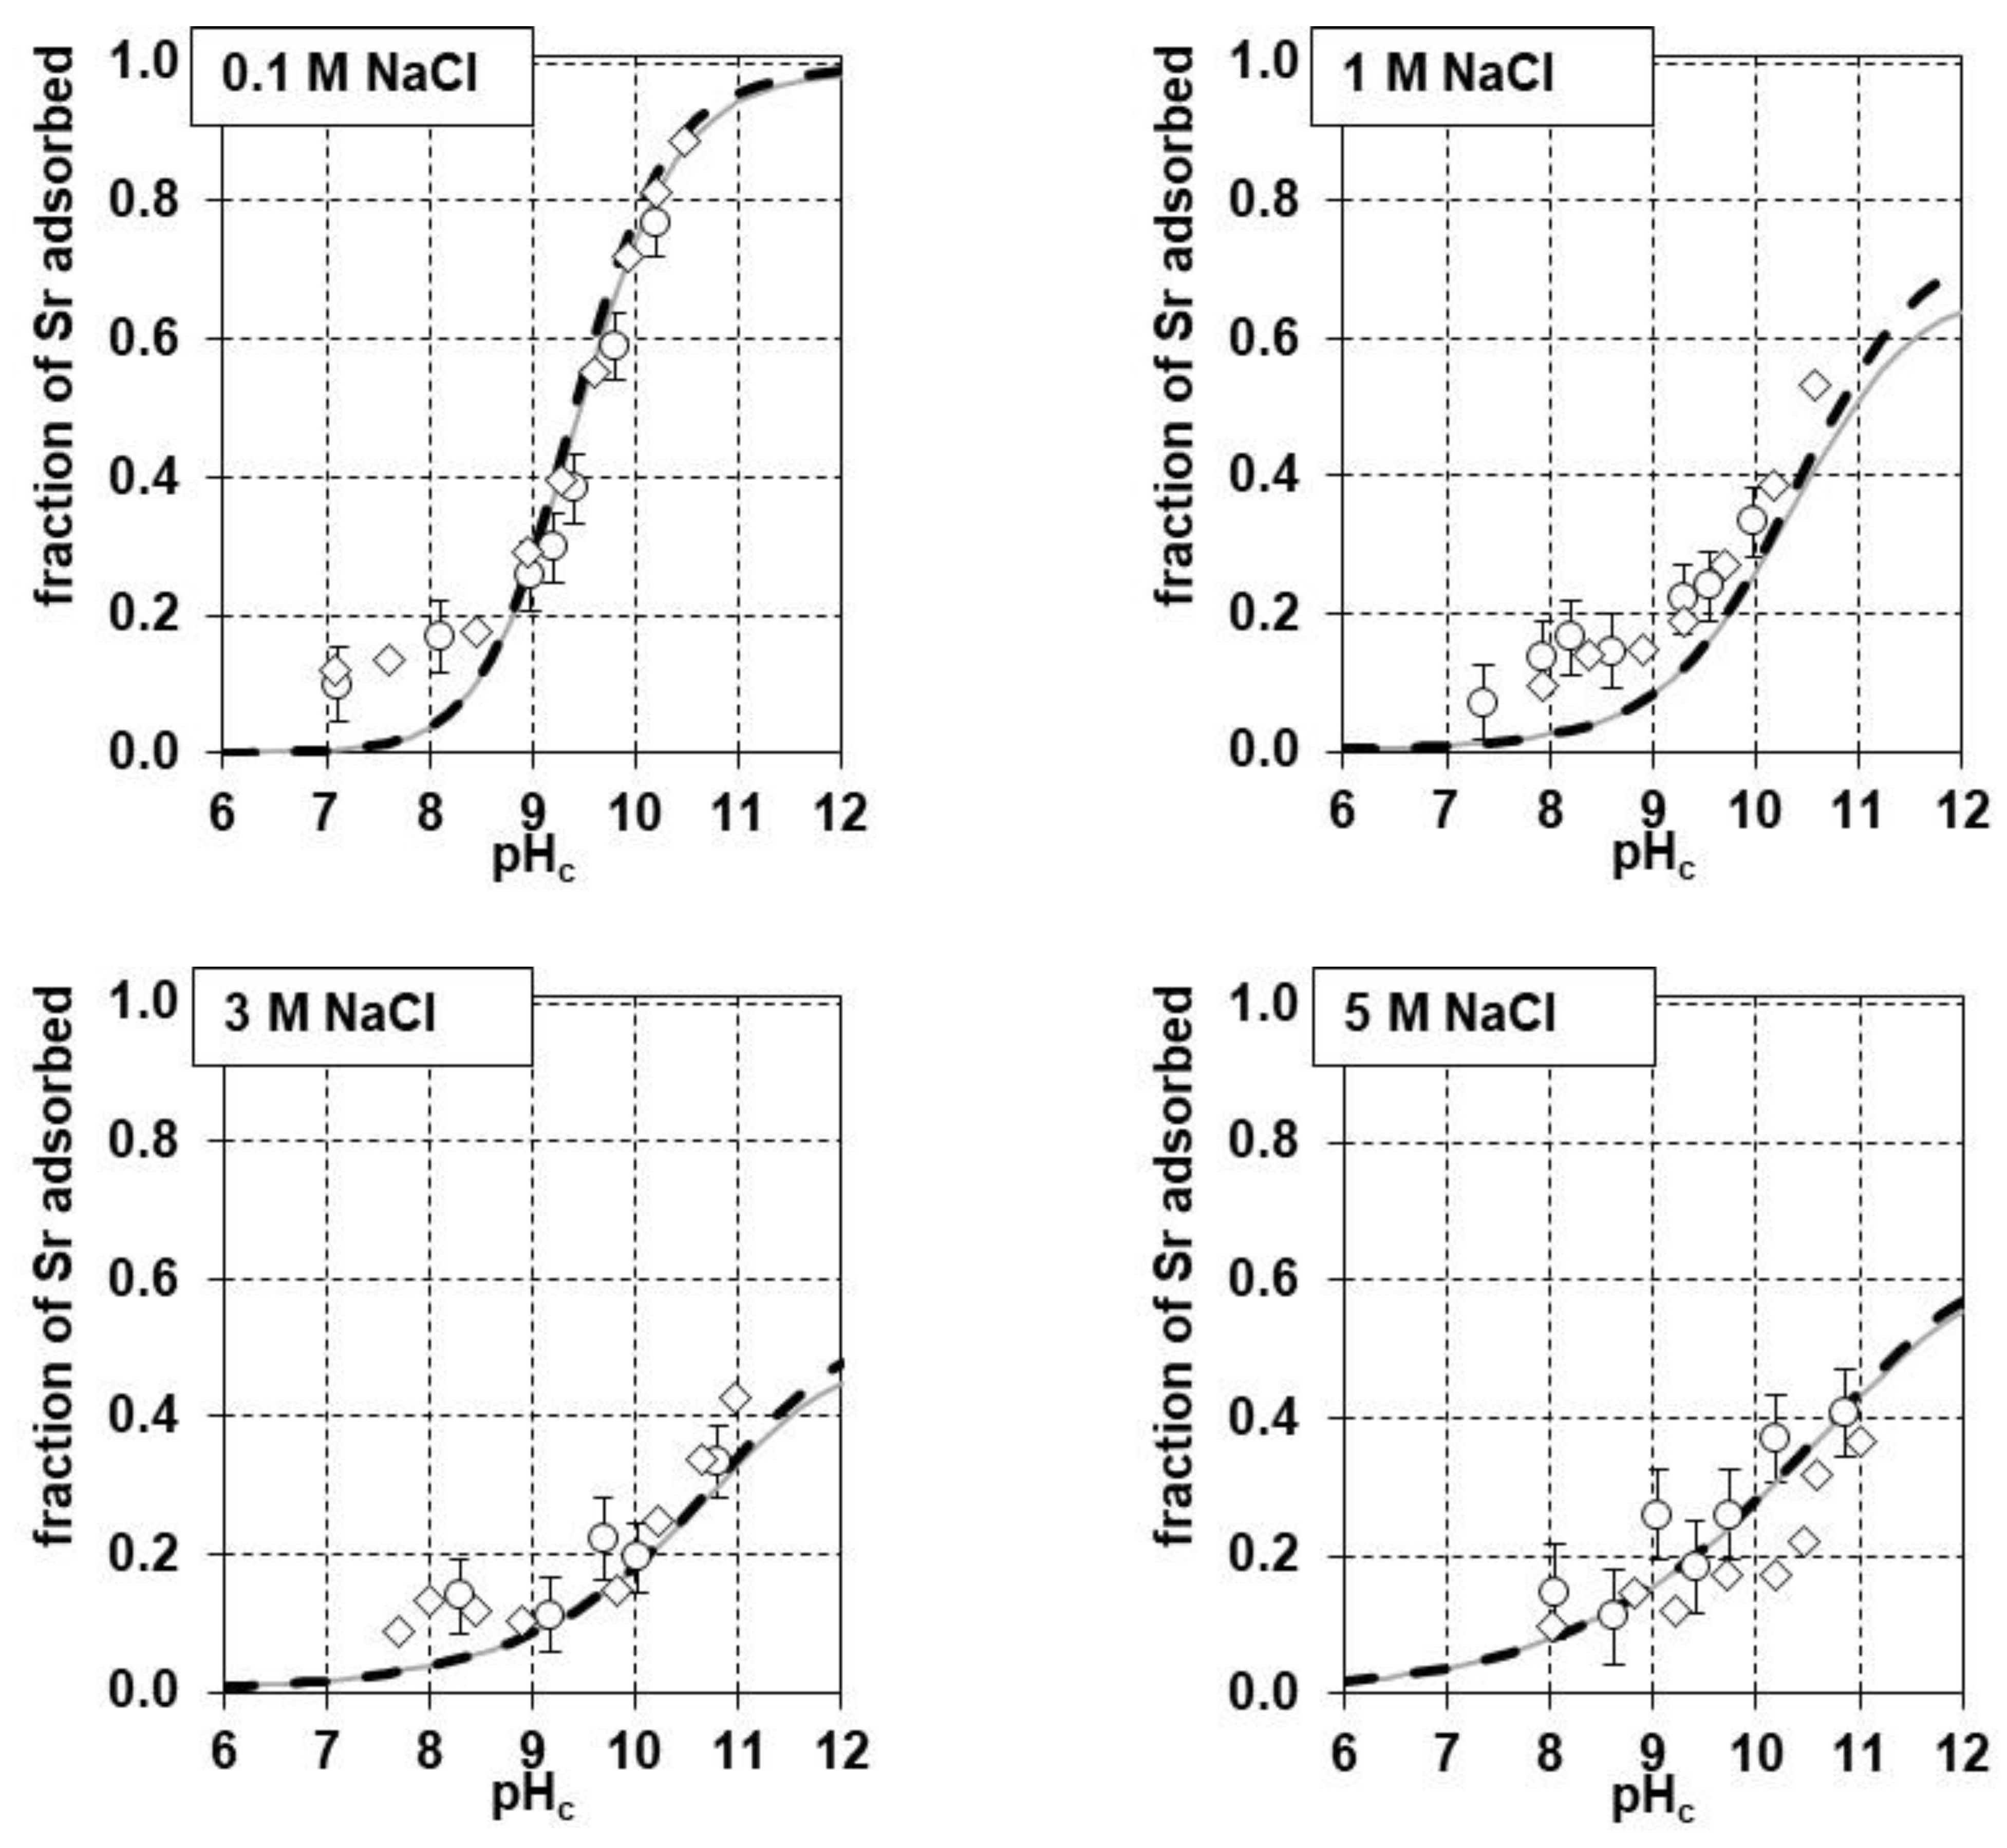
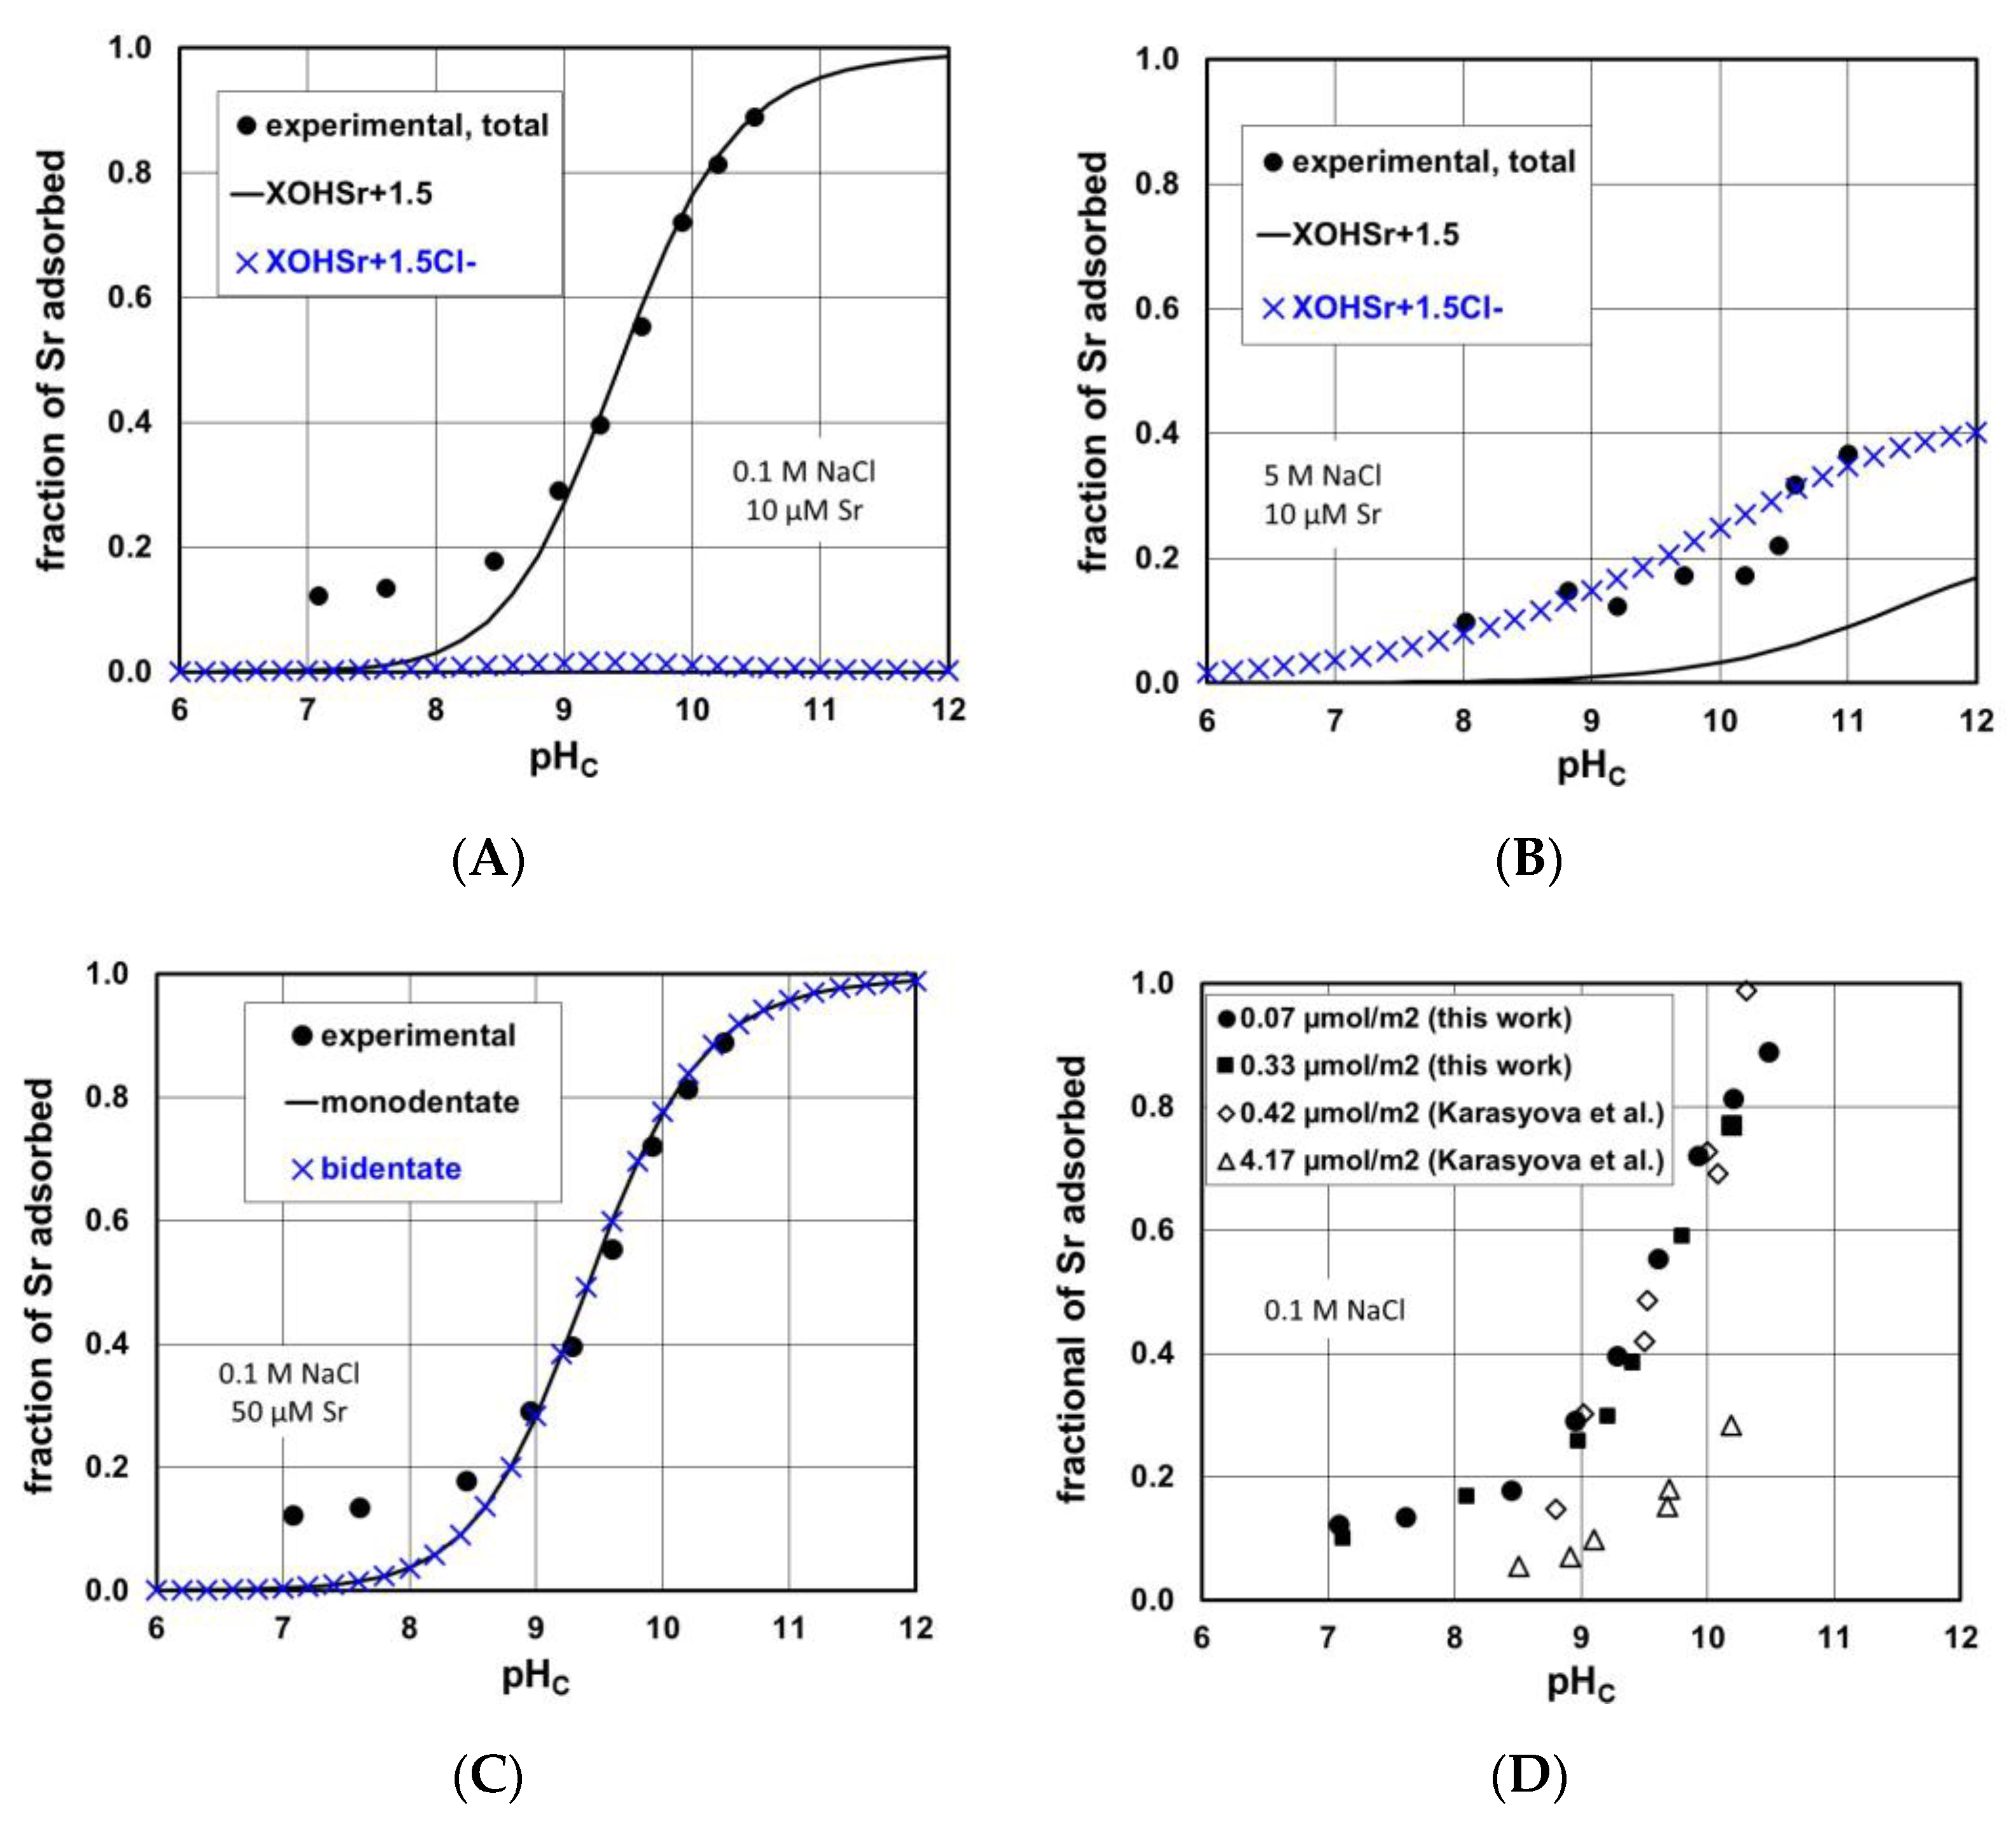
3.3. Sr Adsorption Experiments on the Synthetic Iron(III) Oxide

Figure 6 shows the pH dependence of Sr adsorption on the synthetic iron(III) oxide at two slightly different Sr concentrations. While, at low NaCl content, the uptake tends towards 100%, with increasing salt content, the uptake is clearly suppressed, indicating a decreasing affinity to the surface. Literature data for Sr adsorption on hematite (with a point of zero net proton charge of about 8.5) in 0.1 M NaCl [54] or on goethite (point of zero net proton charge of about 9.2) in 0.01 M NaCl [56] show (i) that the onset of Sr adsorption occurs in similarly high pH ranges as in our case and (ii) that, when increasing the Sr concentration under otherwise identical conditions, the fraction of adsorbed Sr decreases significantly. This indicates limited affinity to the surface relative to other metal ions like Eu in the case of magnetite [7]. The Sr uptake data on montmorillonite at pH 5 reported in the literature [21] also indicate a substantial decrease in the distribution coefficient with increasing salt content. However, the decrease of Sr uptake by montmorillonite is clearly explained by cation exchange, which does not occur on oxide minerals. A more appropriate comparison is the data for Ba adsorption on goethite [15], where increasing NaNO3 concentration shifts the adsorption edge of Ba to higher pH values.
A rather simple model is able to describe the complete set of uptake data. With only one surface complex plus chloride co-adsorption, we are able to simulate the effect of salt content over a factor of 50 as going from 0.1 M to 5 M NaCl and the effect of total Sr concentration in a small concentration range. Two options were tested in the modelling, one involving monodentate (A) and the other bidentate (B) surface complex formation. Both were seen to be equally successful. It was found that charge distribution significantly improved the fits in both cases. All parameters are given in Table 2. Thus, overall, two surface species, ≡XOHSr+3/2 and ≡XOHSr+3/2Cl (where the strontium charge is distributed over the two planes, while the chloride charge is placed in the d-plane, see Table 2), are sufficient to obtain excellent simulations, whereas a more sophisticated model for trivalent actinide adsorption on magnetite [7] was used. This latter model includes molecular level information in the definition of surface sites and the adsorption mechanism, whereas the present model is a generic one-site model with a limited number of adjustable parameters.
Figure 7A,B shows the surface speciation within the proposed model (Table 1 and Table 2). For the low chloride concentration (Figure 7A), the surface ion-pair plays no role. At the highest NaCl concentration, in turn, it dominates the surface speciation of Sr surface complexes (Figure 7B). The model indicates a trend with NaCl concentration concerning the difference between the two Sr concentrations at the high pH. For these two conditions, the surface speciation is governed by one complex. In the two other cases (speciation not shown) there is more equilibrated contribution from the two surface complexes. The model inherent effect of Sr concentration in all cases involves a slight decrease of fractional adsorption for the ≡XOHSr+3/2 species with increasing Sr concentration, whereas the ion-pair is not much affected. For the intermediate NaCl concentrations, the observed decrease due to electrostatics becomes relevant and visible.
Interestingly, the monodentate and bidentate options turned out to be equally successful in terms of goodness of fit. As an example, we plot the comparison for the data at 0.1 M NaCl and 10 µM Sr in Figure 7C. The Charge Distribution (CD)-values suggest that, in the bare complexes as given in the tables, the strontium charge is equally distributed between the two planes, while the co-adsorption of chloride in both cases draws more strontium charge towards the solution side of the interface. In both cases, equilibrium constants and CD-factors are nearly identical, the former because the A-matrix involves, in both cases, a stoichiometric factor of unity for the surface site component [57,58]. Overall, the combination of the conventional electrostatic SCMs with Pitzer aqueous solution approaches is successful in describing the available data. The increased salt levels do not seem to affect the performances of the adsorption models.
Finally, Figure 7D compares our Sr uptake data in the 0.1 mM NaCl solution with data on hematite from the literature [54]. To justify the comparison, we have calculated the ratio of the amount of total Sr in the system and the surface area exposed by the respective sorbents. The ratios for the 50 µM Sr data from the present work (0.33 µmol/m2) and one series from Karasyova et al. [54] (0.42 µmol/m2) are close. Figure 7D shows that the two datasets overlap. With the five-fold lower value, the experimental results from the present work do not differ. A ten-fold increase in Sr concentration in the literature data (Figure 7D) causes a shift in the experimental data similar to the shift caused by an increase of the NaCl concentration by a factor 50. For goethite, we did not find data obtained on the proton concentration scale. Data on the pH scale from Carrol et al. [59] in 0.1 M NaCl, when corrected to the concentration scale, coincide at the lower pH range with our data for comparable Sr to surface area ratios, but at higher pH values our data show lower adsorption.
One important aspect is that the adsorption edge in our dataset does not go to zero as in many other datasets. We have previously observed similar behavior with goethite in 0.01 M NaCl solutions [56]. As shown in Figure 6, for the 50 µM total strontium concentration, the “residual” uptake is significant. It is, therefore, of interest to discuss the onset of Sr adsorption on oxide minerals. The present data suggest that Sr uptake is not zero at the lower end of the pH range investigated, particularly for the lower salt level. However, the occurrence of broad pH-edges is not uncommon. For example, in the book by Dzombak and Morel [14], in nearly all Sr adsorption edges, even a two-site model is not able to capture the data at the lower pH range. One potential reason for this observation could be that pH changes during the equilibration time towards a lower pH, such that fast initial adsorption at the higher pH would require desorption with the lowering pH. Since desorption is sluggish [60] this would result in an apparent uptake that is higher than if the pH had always been at the lower value. With respect to our uptake data, the zeta-potential results (Figure 3B) corroborate the batch experiment observations, because Sr causes a shift of the IEP at the low pH range, where adsorption is not decreasing towards zero (Figure 7). Pronounced uptake of Sr below the typical S-shape of the adsorption edge for cations (or very broad adsorption edges or distribution coefficient curves as a function of pH) were reported, for example, on ZrO2 [61], hydrated TiO2 [62], various other TiO2 sorbents [63], hydrous Al, and Fe oxides [64] or γ-alumina [65]. While the pH range of the data on hematite by Karasyova et al. [54] shown in Figure 7D does not allow a conclusion concerning this issue, Carrol et al. report steeper pH-edges on goethite and amorphous silica [59]. Their data on goethite might suggest that the presence of carbonate could enhance Sr uptake at the lower pH range [59], which also agrees with the promotion of Sr uptake on goethite in the presence of selenite at low pH [56]. Mendez and Hiemstra [66] recently modeled the adsorption of alkaline earth ions on ferrihydrite and involved a high affinity site to fit the uptake data at the lower pH range in the absence of carbonate. They also showed that the metal-ion to ferrihydrite ratio determines the steepness of the adsorption edges in such scenarios. A similar approach was reported for γ-alumina [65], where the non-zero uptake of Sr covered a very broad pH range. From the available information, a definitive conclusion concerning the broad uptake curves as a function of pH, which can be considered as established according to Trivedi et al. [64], cannot be drawn. This could be a subject for further research.

4. Conclusions

In this work, we presented experimental data for Sr adsorption to an iron(III) oxide mineral. It was found that the synthesized solid involved crystalline hematite (>90%) and goethite. Sr adsorption on this solid was found to increase with pH, and at high pH it decreased when increasing NaCl concentration.
The present work is the first that reports experimental data and a successful model for the adsorption of Sr on an oxide surface up to very high salt levels. The model also describes charging curves in the same range of salt concentrations.
The combination of self-consistent experiments with a simple model that merges a conventional electrostatic SCM with a Pitzer approach to calculate the activities of ions in solution describes the uptake of Sr on the synthetic iron(III) oxide up to 5 M NaCl background electrolyte concentration; the model successfully simulates the strong effect of the increasing NaCl concentration on Sr uptake. Unlike for Sr in the present case, for previously studied systems up to such high salt levels involving trivalent cations, nearly 100% uptake was observed, even at the highest salt concentrations. The adsorption model involves few adjustable parameters, including the simulation of charging curves up to the high salt level. We conclude that using such a combination is a robust approach to simulate contaminant uptake from highly saline solutions, given that the model is calibrated self-consistently on a consistent set of experimental and solution speciation data. Previous models that used high salt levels [7,27,28,29,30] were more complex (involving more sites and more adjustable parameters). The fact that the very simple adsorption model framework (1-site, 1-pK, Basic Stern model) with fewer adjustable parameters can also be combined with Pitzer approaches in aqueous solution lends credibility to the approach on a general level and, in particular, for nuclear waste management in geochemical settings that involve high salt concentrations.

Author Contributions

Formal analysis, D.G., N.F. and D.S.; investigation, M.H., L.C., V.P., N.F. and D.S.; methodology, J.L.; supervision, J.L.; writing—original draft, D.G. and J.L.; writing—review and editing, L.C., V.P., N.F. and D.S. All authors have read and agreed to the published version of the manuscript.

Funding

This research leading to these results has received funding from the European Union’s European Atomic Energy Community’s (Euratom) Seventh Framework Programme FP7/2007-2011 under grant agreement n° 295722 (FIRST-Nuclides project).

Data Availability Statement

Not Applicable.

Acknowledgments

We commemorate Maximilien Huguenel, who passed away far too young, and dedicate this work to his memory. We acknowledge the numerous detailed, appropriate comments by one referee and the academic editors, which greatly improved the manuscript.

Conflicts of Interest

The authors declare no conflict of interest.

References

  1. IAEA. Geological Disposal Facilities for Radioactive Waste; International Atomic Energy Agency: Vienna, Austria, 2011. [Google Scholar]
  2. Alley, W.M.; Alley, R. The growing problem of stranded used nuclear fuel. Environ. Sci. Technol. 2014, 48, 2091–2096. [Google Scholar] [CrossRef]
  3. Birkholzer, J.; Houseworth, J.; Tsang, C.-F. Geologic disposal of high-level radioactive waste: Status, key issues, and trends. Annu. Rev. Environ. Resour. 2012, 37, 79–106. [Google Scholar] [CrossRef]
  4. Direito, S.O.L.; Clark, S.; Cousins, C.; Fujita, Y.; Gluyas, J.; Harley, S.; Holmes, R.J.; Hutchinson, I.B.; Kudryavtsev, V.A.; Lloyd, J.; et al. Geological repositories: Scientific priorities and potential high-technology transfer from the space and physics sectors. Mineral. Mag. 2018, 79, 1651–1664. [Google Scholar] [CrossRef] [Green Version]
  5. Mallants, D.; Travis, K.; Chapman, N.; Brady, P.V.; Griffiths, H. The state of the science and technology in deep borehole disposal of nuclear waste. Energies 2020, 13, 833. [Google Scholar] [CrossRef] [Green Version]
  6. Payer, J.H.; Finsterle, S.; Apps, J.A.; Muller, R.A. Corrosion performance of engineered barrier system in deep horizontal drillholes. Energies 2019, 12, 1491. [Google Scholar] [CrossRef] [Green Version]
  7. Morelová, N.; Finck, N.; Lützenkirchen, J.; Schild, D.; Dardenne, K.; Geckeis, H. Sorption of americium/europium onto magnetite under saline conditions: Batch experiments, surface complexation modelling and X-ray absorption spectroscopy study. J. Colloid Interface Sci. 2020, 561, 708–718. [Google Scholar] [CrossRef]
  8. González-Robles, E.; Serrano-Purroy, D.; Sureda, R.; Casas, I.; de Pablo, J. Dissolution experiments of commercial PWR (52 MWd/kgU) and BWR (53 MWd/kgU) spent nuclear fuel cladded segments in bicarbonate water under oxidizing conditions. Experimental determination of matrix and instant release fraction. J. Nucl. Mater. 2015, 465, 63–70. [Google Scholar] [CrossRef] [Green Version]
  9. Kienzler, B.; Duro, L.; Lemmens, K.; Metz, V.; De Pablo, J.; Valls, A.; Wegen, D.H.; Johnson, L.; Spahiu, K. Summary of the Euratom Collaborative Project FIRST-Nuclides and conclusions for the safety case. Nucl. Technol. 2017, 198, 260–276. [Google Scholar] [CrossRef]
  10. Labunska, I.; Levchuk, S.; Kashparov, V.; Holiaka, D.; Yoschenko, L.; Santillo, D.; Johnston, P. Current radiological situation in areas of Ukraine contaminated by the Chernobyl accident: Part 2. Strontium-90 transfer to culinary grains and forest woods from soils of Ivankiv district. Environ. Int. 2021, 146, 106282. [Google Scholar] [CrossRef]
  11. Mangano, J.J.; Sherman, J.D. Elevated in vivo strontium-90 from nuclear weapons test fallout among cancer decedents: A case-control study of deciduous teeth. Int. J. Health Serv. 2011, 41, 137–158. [Google Scholar] [CrossRef]
  12. Clark, M.W.; Harrison, J.J.; Payne, T.E.; Comarmond, M.J.; Thiruvoth, S.; Wong, H.; Shahin, L.M. Radium and strontium binding by a modified bauxite refinery residue-isotope exchange studies of pH-dependence, reversibility and ageing. Geochem. Explor. Environ. Anal. 2020, 20, 257–267. [Google Scholar] [CrossRef]
  13. Bots, P.; Comarmond, M.J.; Payne, T.E.; Gückel, K.; Lunn, R.J.; Rizzo, L.; Schellenger, A.E.P.; Renshaw, J.C. Emerging investigator series: A holistic approach to multicomponent EXAFS: Sr and Cs complexation in clayey soils. Environ. Sci. Process. Impacts 2021, 23, 1101–1115. [Google Scholar] [CrossRef]
  14. Dzombak, D.A.; Morel, F.M.M. Surface Complexation Modeling: Hydrous Ferric Oxide; John Wiley & Sons: Hoboken, NJ, USA, 1990. [Google Scholar]
  15. Hayes, K.F.; Leckie, J.O. Modeling ionic strength effects on cation adsorption at hydrous oxide/solution interfaces. J. Colloid Interface Sci. 1987, 115, 564–572. [Google Scholar] [CrossRef]
  16. Montoya, V.; Baeyens, B.; Glaus, M.; Kupcik, T.; Fernandes, M.M.; Van Laer, L.; Bruggeman, C.; Maes, N.; Schäfer, T. Sorption of Sr, Co and Zn on illite: Batch experiments and modelling including Co in-diffusion measurements on compacted samples. Geochim. Cosmochim. Acta 2018, 223, 1–20. [Google Scholar] [CrossRef]
  17. Missana, T.; García-Gutiérrez, M. Adsorption of bivalent ions (Ca(II), Sr(II) and Co(II)) onto FEBEX bentonite. Phys. Chem. Earth 2007, 32, 559–567. [Google Scholar] [CrossRef]
  18. King, F.; Hall, D.S.; Keech, P.G. Nature of the near-field environment in a deep geological repository and the implications for the corrosion behaviour of the container. Corros. Eng. Sci. Technol. 2017, 52, 25–30. [Google Scholar] [CrossRef]
  19. Entwicklungsgemeinschaft, T. F + E-Programm zur Eignungsprüfung der Schachtanlage Konrad für die Einlagerung radioaktiver Abfälle: Zusammenfassender Zwischenbericht <GSF T 114>; Ergebnisse des Untersuchungszeitraumes 1.1.1975 bis 30.6.1980; Ges. f. Strahlen- u.; Umweltforschung: München, Germany, 1980. [Google Scholar]
  20. Neck, V.; Altmaier, M.; Rabung, T.; Lützenkirchen, J.; Fanghänel, T. Thermodynamics of trivalent actinides and neodymium in NaCl, MgCl2, and CaCl2 solutions: Solubility, hydrolysis, and ternary Ca-M (III)-OH complexes. Pure Appl. Chem. 2009, 81, 1555–1568. [Google Scholar] [CrossRef]
  21. Rafferty, P.; Shiao, S.Y.; Binz, C.M.; Meyer, R.E. Adsorption of Sr(II) on clay minerals: Effects of salt concentration, loading, and pH. J. Inorg. Nucl. Chem. 1981, 43, 797–805. [Google Scholar] [CrossRef]
  22. Mahoney, J.J.; Langmuir, D. Adsorption of Sr on kaolinite, illite and montmorillonite at high ionic strengths. Radiochim. Acta 1991, 54, 139–144. [Google Scholar] [CrossRef]
  23. Bolt, G.H. Determination of the charge density of silica sols. J. Phys. Chem. 1957, 61, 1166–1169. [Google Scholar] [CrossRef]
  24. Pivovarov, S. Diffuse sorption modeling. J. Colloid Interface Sci. 2009, 332, 54–59. [Google Scholar] [CrossRef]
  25. Altmaier, M.; Metz, V.; Neck, V.; Müller, R.; Fanghänel, T. Solid-liquid equilibria of Mg(OH)2(cr) and Mg2(OH)3Cl·4H2O(cr) in the system Mg-Na-H-OH-Cl-H2O at 25 °C. Geochim. Cosmochim. Acta 2003, 67, 3595–3601. [Google Scholar] [CrossRef]
  26. Wiesner, A.D.; Katz, L.E.; Chen, C.-C. The impact of ionic strength and background electrolyte on pH measurements in metal ion adsorption experiments. J. Colloid Interface Sci. 2006, 301, 329–332. [Google Scholar] [CrossRef] [PubMed]
  27. Schnurr, A.; Marsac, R.; Rabung, T.; Lützenkirchen, J.; Geckeis, H. Sorption of Cm(III) and Eu(III) onto clay minerals under saline conditions: Batch adsorption, laser-fluorescence spectroscopy and modeling. Geochim. Cosmochim. Acta 2015, 151, 192–202. [Google Scholar] [CrossRef]
  28. García, D.; Lützenkirchen, J.; Petrov, V.; Siebentritt, M.; Schild, D.; Lefèvre, G.; Rabung, T.; Altmaier, M.; Kalmykov, S.; Duro, L.; et al. Sorption of Eu(III) on quartz at high salt concentrations. Colloids Surf. A Physicochem. Eng. Asp. 2019, 578, 123610. [Google Scholar] [CrossRef] [Green Version]
  29. Banik, N.L.; Marsac, R.; Lützenkirchen, J.; Marquardt, C.M.; Dardenne, K.; Rothe, J.; Bender, K.; Geckeis, H. Neptunium sorption and redox speciation at the illite surface under highly saline conditions. Geochim. Cosmochim. Acta 2017, 215, 421–431. [Google Scholar] [CrossRef] [Green Version]
  30. Marsac, R.; Lal Banik, N.; Lützenkirchen, J.; Diascorn, A.; Bender, K.; Marquardt, C.M.; Geckeis, H. Sorption and redox speciation of plutonium at the illite surface under highly saline conditions. J. Colloid Interface Sci. 2017, 485, 59–64. [Google Scholar] [CrossRef]
  31. Pitzer, K.S. Thermodynamics of electrolytes. 1. theoretical basis and general equations. J. Phys. Chem. 1973, 77, 268–277. [Google Scholar] [CrossRef] [Green Version]
  32. Brönsted, J.N. Studies on solubility. IV The principle of the specific interaction of ions. J. Am. Chem. Soc. 1922, 44, 877–898. [Google Scholar] [CrossRef] [Green Version]
  33. Scatchard, G. Concentrated solutions of strong electrolytes. Chem. Rev. 1936, 19, 309–327. [Google Scholar] [CrossRef]
  34. Guggenheim, E.A. Applications of Statistical Mechanics; Clarendon, P.: Oxford, UK, 1966. [Google Scholar]
  35. Lützenkirchen, J. Surface complexation models of adsorption: A critical survey in the context of experimental data. In Adsorption: Theory, Modeling, and Analysis; Marcel Dekker, Inc.: New York, NY, USA, 2002; pp. 631–710. [Google Scholar]
  36. Barrón, V.; Torrent, J. Surface hydroxyl configuration of various crystal faces of hematite and goethite. J. Colloid Interface Sci. 1996, 177, 407–410. [Google Scholar] [CrossRef]
  37. Maslen, E.; Streltsov, V.; Streltsova, N.; Ishizawa, N. Synchrotron X-ray study of the electron density in α-Fe2O3. Acta Crystallogr. Sect. B Struct. Sci. 1994, 50, 435–441. [Google Scholar] [CrossRef]
  38. Hazemann, J.-L.; Berar, J.; Manceau, A. Rietveld studies of the aluminium-iron substitution in synthetic goethite. In Materials Science Forum; Trans Tech Publications: Bäch, Switzerland, 1991; pp. 821–826. [Google Scholar]
  39. Seah, M.P.; Gilmore, I.S.; Beamson, G. XPS: Binding energy calibration of electron spectrometers 5—Re-evaluation of the reference energies. Surf. Interface Anal. 1998, 26, 642–649. [Google Scholar] [CrossRef]
  40. Moulder, J.; Stickle, W.; Sobol, W.; Bomben, K.D. Handbook of X-ray Photoelectron Spectroscopy; Chastain, J., King, R.C., Jr., Eds.; Ulvac-Phi Inc.: Chigasaki, Japan; Physical Electronics Inc.: Chanhassaen, MN, USA, 1995. [Google Scholar]
  41. Bethke, C.; Yeakel, S. Geochemist’s Workbench: Release 8.0 Reaction Modeling Guide; RockWare Incorporated: Golden, CO, USA, 2009. [Google Scholar]
  42. Baes, C.F.; Mesmer, R.E. The Hydrolysis of Cations; John Wiley & Sons: Hoboken, NJ, USA, 1976. [Google Scholar]
  43. Parkhurst, D.L.; Appelo, C. Description of Input and Examples for Phreeqc Version 3: A Computer Program for Speciation, Batch-Reaction, One-Dimensional Transport, and Inverse Geochemical Calculations; US Geological Survey: Reston, VI, USA, 2013; pp. 2328–7055. [Google Scholar]
  44. Hiemstra, T.; Van Riemsdijk, W.H. Effect of different crystal faces on experimental interaction force and aggregation of hematite. Langmuir 1999, 15, 8045–8051. [Google Scholar] [CrossRef]
  45. Venema, P.; Hiemstra, T.; Weidler, P.G.; van Riemsdijk, W.H. Intrinsic proton affinity of reactive surface groups of metal (Hydr)oxides: Application to Iron (Hydr)oxides. J. Colloid Interface Sci. 1998, 198, 282–295. [Google Scholar] [CrossRef]
  46. Livi, K.J.T.; Villalobos, M.; Leary, R.; Varela, M.; Barnard, J.; Villacís-García, M.; Zanella, R.; Goodridge, A.; Midgley, P. Crystal Face distributions and surface site densities of two synthetic goethites: Implications for Adsorption capacities as a function of particle size. Langmuir 2017, 33, 8924–8932. [Google Scholar] [CrossRef] [PubMed]
  47. Hiemstra, T.; Van Riemsdijk, W.H. On the relationship between charge distribution, surface hydration, and the structure of the interface of metal hydroxides. J. Colloid Interface Sci. 2006, 301, 1–18. [Google Scholar] [CrossRef] [PubMed]
  48. Poeter, E.P.; Hill, M.C. Documentation of UCODE. In A Computer Code for Universal Inverse Modeling; DIANE Publishing: Darby, PA, USA, 1998; pp. 98–4080. [Google Scholar]
  49. Westall, J.C.; Chemistry, O.S.U.D.O. FITEQL: A Computer Program for Determination of Chemical Equilibrium Constants from Experimental Data; Department of Chemistry, Oregon State University: Corvallis, OR, USA, 1982. [Google Scholar]
  50. Huber, F.; Schild, D.; Vitova, T.; Rothe, J.; Kirsch, R.; Schäfer, T. U(VI) removal kinetics in presence of synthetic magnetite nanoparticles. Geochim. Cosmochim. Acta 2012, 96, 154–173. [Google Scholar]
  51. Kosmulski, M. Chemical properties of material surfaces; Schick, M.J., Hubbard, A.T., Eds.; Surfactant Science Series; Marcel Dekker, Inc.: New York, NY, USA, 2001; Volume 102, ISBN 0-8247-0560-2. [Google Scholar]
  52. Tschapek, M.; Wasowski, C.; Torres Sanchez, R.M. The p.z.c. and i.e.p. of γ-Al2O3 and TiO2. J. Electroanal. Chem. Interfacial Electrochem. 1976, 74, 167–176. [Google Scholar] [CrossRef]
  53. Gunneriusson, L.; Lövgren, L.; Sjöberg, S. Complexation of Pb(II) at the goethite (α-FeOOH)/water interface: The influence of chloride. Geochim. Cosmochim. Acta 1994, 58, 4973–4983. [Google Scholar] [CrossRef]
  54. Karasyova, O.N.; Ivanova, L.I.; Lakshtanov, L.Z.; Lövgren, L. Strontium sorption on hematite at elevated temperatures. J. Colloid Interface Sci. 1999, 220, 419–428. [Google Scholar] [CrossRef] [PubMed]
  55. Lützenkirchen, J.; Boily, J.F.; Gunneriusson, L.; Lövgren, L.; Sjöberg, S. Protonation of different goethite surfaces—unified models for NaNO3 and NaCl media. J. Colloid Interface Sci. 2008, 317, 155–165. [Google Scholar] [CrossRef]
  56. Nie, Z.; Finck, N.; Heberling, F.; Pruessmann, T.; Liu, C.; Lützenkirchen, J. Adsorption of Selenium and strontium on goethite: EXAFS study and surface complexation modeling of the ternary systems. Environ. Sci. Technol. 2017, 51, 3751–3758. [Google Scholar] [CrossRef] [PubMed]
  57. Wang, Z.; Giammar, D.E. Mass action expressions for bidentate adsorption in surface complexation modeling: Theory and practice. Environ. Sci. Technol. 2013, 47, 3982–3996. [Google Scholar] [CrossRef]
  58. Lützenkirchen, J.; Marsac, R.; Kulik, D.A.; Payne, T.E.; Xue, Z.; Orsetti, S.; Haderlein, S.B. Treatment of multi-dentate surface complexes and diffuse layer implementation in various speciation codes. Appl. Geochem. 2015, 55, 128–137. [Google Scholar] [CrossRef]
  59. Carroll, S.A.; Roberts, S.K.; Criscenti, L.J.; O‘Day, P.A. Surface complexation model for strontium sorption to amorphous silica and goethite. Geochem. Trans. 2008, 9, 2. [Google Scholar] [CrossRef] [Green Version]
  60. Lützenkirchen, J. Evaluation of experimental procedures and discussion of two different modelling approaches with respect to long-term kinetics of metal cation Sorption onto (Hydr)oxide Surfaces. Aquat. Geochem. 2001, 7, 217–235. [Google Scholar] [CrossRef]
  61. Inan, S.; Tel, H.; Altaş, Y. Sorption studies of strontium on hydrous zirconium dioxide. J. Radioanal. Nucl. Chem. 2006, 267, 615–621. [Google Scholar] [CrossRef]
  62. Samanta, S.K. Hydrated titanium(IV) oxide as a granular inorganic sorbent for removal of radiostrontium.1. Batch equilibration studies. J. Radioanal. Nucl. Chem. Artic. 1996, 209, 235–242. [Google Scholar] [CrossRef]
  63. Danačíková, E.; John, J.; Motl, A.; Šebesta, F.; Hooper, E.W. Study of sorption properties of various titanium dioxide materials. Czechoslov. J. Phys. 1999, 49, 789–795. [Google Scholar] [CrossRef]
  64. Trivedi, P.; Axe, L. A comparison of strontium sorption to hydrous aluminum, iron, and manganese oxides. J. Colloid Interface Sci. 1999, 218, 554–563. [Google Scholar] [CrossRef]
  65. Mayordomo, N.; Alonso, U.; Missana, T. Effects of γ-alumina nanoparticles on strontium sorption in smectite: Additive model approach. Appl. Geochem. 2019, 100, 121–130. [Google Scholar] [CrossRef]
  66. Mendez, J.C.; Hiemstra, T. High and low affinity sites of ferrihydrite for metal ion adsorption: Data and modeling of the alkaline-earth ions Be, Mg, Ca, Sr, Ba, and Ra. Geochim. Cosmochim. Acta 2020, 286, 289–305. [Google Scholar] [CrossRef]
Figure 1. Experimental (blue line) and modeled (red line) powder X-ray diffractogram of the solid phase following the description in the experimental section. Also shown are the fit residual (grey line) and the contribution of hematite (green line) and goethite (orange line) to the diffractogram.
Minerals 11 01093 g001
Figure 2. XPS data for the synthesized solid phase. (A) survey scan; (B) narrow scan of O 1s elemental line, curve fit of the spectrum shown by colored lines: red, overall; green, hydroxide peak; blue, oxide peak; (C) narrow scan of Fe 2p elemental lines.
Minerals 11 01093 g002
Figure 3. Zeta-potential measurements of the synthesized particles: (A) in the absence of Sr without NaCl addition or with 1.1. mM NaCl present. (B) in the absence and presence of 10, 50, and 100 µM Sr in 1.1 mM NaCl. The two series with 1.1 mM NaCl (i.e., #1 and #2 in (A) correspond to two separate series of experiments.
Minerals 11 01093 g003
Figure 4. (A) Proton related surface charge density (σo,H) as a function of the difference of −log ([H+]/M) and −log ([H+]o/M) in comparison to data reported for goethite by Gunneriussion et al. [53] and hematite by Karasyova et al. [54]. (B) Comparison of blank and suspension titration for 5 M NaCl salt concentration and 1.39 g/L synthetic Fe(III) oxide.
Minerals 11 01093 g004
Figure 5. H+ adsorption (Hads) as a function of pHc for the Fe(III) oxide particles at different ionic strengths (0.1–5 M) in NaCl medium. Symbols denote the experimental results, while lines represent the best fit model using parameters from Table 1 and Pitzer activity coefficients for aqueous solution speciation. Conditions for the titrations are given in the experimental section of the main text.
Minerals 11 01093 g005
Figure 6. Adsorption edges for Sr (diamonds [Sr]T = 1 × 10⁻⁵ M; circles [Sr]T = 5 × 10⁻⁵ M) on iron(III) oxide (7.3 g/L) as a function of pHc and at different NaCl concentrations. Adsorption data (symbols) as percentage uptake. Grey solid lines ([Sr]T = 1 × 10⁻⁵ M) and black dotted lines ([Sr]T = 5 × 10⁻⁵ M) are for simulations with parameters from Table 1 and Table 2 for (monodentate) adsorption and Pitzer parameters for aqueous species. For the higher strontium concentrations (circles), the error bars are added; for the other dataset, the errors are similar (data not shown).
Minerals 11 01093 g006
Figure 7. (A) Surface speciation of Sr on the iron(III) oxide for 0.1 M NaCl and 10 µM Sr as a function of –log([H+]/M). (B) Surface speciation of Sr on the iron(III) oxide for 5 M NaCl and 10 µM Sr as a function of −log([H+]/M). (C) Comparison between mono- and bidentate simulations for Sr adsorption to the Fe(III) oxide mineral as a function of –log([H+]/M) at 0.1 M NaCl. (D) Sr uptake in 0.1 M NaCl solutions; comparison of data for 10 µM and 50 µM Sr data with literature data on hematite [54]. Solid concentration is 7.3 g/L for all calculations and experimental data.
Minerals 11 01093 g007
Table 1. Parameters and reactions used to model the amphoteric behavior of the Fe(III) mineral surface with an electrostatic (Basic Stern) SCM model at infinite dilution and zero surface potential. Fitted parameters are underlined.
Reactionlog K0
≡XOH−1/2 + H+ → ≡XOH2+1/27.10 a
≡XOH−1/2 + Na+ → ≡XOH−1/2…Na+0.42a
≡XOH2+1/2 + Cl → ≡XOH2+1/2…Cl−0.17a
ParameterParameter Value
Site x (sites·nm−2), fixed at this value6.36
Capacitance (F·m−2)2.59
Note: a Counter ion charge is placed in the d-plane, i.e., chloride and sodium were placed in the 1-plane (d-plane, at the head end of the diffuse layer) as outer-sphere complexes.
Table 2. Parameters and reactions used to model Sr adsorption onto the synthetic iron(III) oxide surface with an electrostatic SCM model at infinite dilution and zero surface potential. All parameters were fitted.
(A) For Monodentate Surface Complexes
Reactionlog K0
≡XOH−1/2 + Sr2+ → ≡XOHSr+3/21.11 a
≡XOHSr+3/2 + Cl → ≡XOHSr+3/2…Cl1.05 a,b
(B) For Bidentate Surface Complexes
Reactionlog K0
(≡XOH−1/2)2 + Sr2+ → (≡XOH)2Sr+11.11 c,d
(≡XOH)2Sr+1 + Cl → (≡XOH)2Sr+1…Cl1.04 c,d,e
Note: a Strontium charge is placed in the 0-plane and 1-plane (for the bare complex one charge unit in each, for the ternary complex 0.38 charge units in the 0-plane), b chloride charge is placed in the 1-plane (d-plane, head end of the diffuse layer). c Strontium charge is placed in the 0-plane and 1-plane (for the bare complex one charge unit in each, for the ternary complex 0.38 charge units in the 0-plane); d bidentate formulation involves a stoichiometric factor of 1 for the A-matrix and consumes two generic sites by setting the coefficient to 2 in the B-matrix [57,58], e chloride charge is placed in the 1-plane (d-plane, head end of the diffuse layer).
Publisher’s Note: MDPI stays neutral with regard to jurisdictional claims in published maps and institutional affiliations.

