Article

Application of Evolved Gas Analysis Technique for Speciation of Minor Minerals in Clays

by
Eulalia Zumaquero Silvero
*,
Jessica Gilabert Albiol
,
Eva María Díaz-Canales
,
María Jesús Ventura Vaquer
and
María Pilar Gómez-Tena
Instituto de Tecnología Cerámica, Asociación de Investigación de las Industrias Cerámicas, Universitat Jaume I, 12006 Castellón, Spain
*
Author to whom correspondence should be addressed.
Minerals 2020, 10(9), 824; https://doi.org/10.3390/min10090824
Submission received: 30 July 2020 / Revised: 11 September 2020 / Accepted: 15 September 2020 / Published: 18 September 2020
(This article belongs to the Collection Clays and Other Industrial Mineral Materials)

Abstract

:
Mineralogical characterization of clays used in manufacturing of traditional ceramic products is critical for guarantee the quality of the final product, but also for assessing the environmental impact of the industrial process in terms of atmospheric emissions. In fact, the presence of impurities even in low-level concentrations can have a big impact. So, it is very important to carry out an accurate mineral quantification of those minerals which are related to carbon dioxide and acid emissions (hydrogen fluoride, hydrogen chloride or sulfur dioxide). The development of hyphenated techniques coupling thermal analysis equipment with mass spectrometry and Fourier-transform infrared spectroscopy provides more valuable information and lower limit quantification than other primary techniques, such as X-ray diffraction or infrared spectroscopy. The main objective of this work is to develop an analytical procedure using evolved gas analysis to identify and quantify minerals such as chlorides, sulfides, carbonaceous materials and minor clay minerals. In addition to this, the study includes the analysis of acid emissions during the ceramic firing treatment even if they are present at low quantitative levels. This methodology was applied to reference materials so that it allows the identification of sulfur, chlorine, fluorine and carbonaceous compounds in concentrations lower than 1%.

1. Introduction

The emission of acid compounds into the atmosphere in the ceramic tile manufacture has become an important problem in the ceramic sector. These acid compounds (chlorides, fluorides, sulfides and carbon compounds) are caused by the presence of impurities in the raw materials and can be identified during the tile firing stage where the processed materials reach high temperatures releasing HF, HCl, SOX and CO2. Therefore, identifying the nature of these emissions and being able to determine their concentration is essential to reduce and control them [1].
Most sulfur emissions result from the sulfur content in the raw materials and the type of fuel used in the industrial process [2,3,4,5]. Red and white clays used in ceramic tile manufacture can contain sulfur in the form of sulfides (pyrite), sulfates (potassium, aluminum, iron and calcium sulfates) or sulfur from organic compounds.
In the case of fluorine emissions, it is crucial to obtain a better understanding of the nature of fluorine within the raw materials and how fluorine evolves during the firing process. The fluoride ion is very similar to the hydroxyl ion, so it is very common the substitution for hydroxyl groups in many clay minerals. Fluoride substitutions are particularly common in 2:1 layer silicates, such as micas, illites and smectites [6,7,8,9,10]. The emission of fluorine compounds (e.g., hydrofluoric acid, silicon tetrafluoride, or even alkali fluorides) results from the breakdown of the clay mineral structure caused by the heat treatment of the firing operation. Nevertheless, it is important to consider that not all of the fluorine contained in the raw clay materials is released; some of it remains bound in the fired product and can be released if a second firing is carried out [11].
Another important emission to take into account is CO2, the emissions of which are subject to international regulator and mitigation measures. Fossil fuels are one of the most important sources of CO2 emissions to the atmosphere, but in the ceramic tile manufacturing the raw materials composition, as carbonates or organic matter, plays a very important role in environmental emissions at the firing stage [12,13].
Chlorine compounds are also released into the atmosphere as acid emissions. Most clays contain trace levels of chloride, often derived from an original marine formation, but also additives or alkaline salts are possible sources of hydrochloric acid (HCl) emissions [1].
The minority minerals present in clays related to acid emissions and their chemical composition can be determined with different analytical techniques as X-ray diffraction (XRD), wavelength dispersive X-ray fluorescence (WD-XRF), ion chromatography, infrared detection, inductively coupled plasma optical emission spectrometry (ICP-OES)… but they present some limitations as the presence of interferences in a complex clayey matrix when using WD-XRF, the detection limit (for XRD usually greater than 1%), the difficulty of the speciation (e.g. to discern whether sulfur is present in the form of sulfides or sulfates) or limitations in the determination of some analytes in the case of ICP-OES technique.
To improve these limitations, the development of coupling techniques has been required and evolved gas analysis technique (EGA) is a versatile and sensitive solution. The combined application of thermal and gas analysis yields information on the composition of the evolved gases and thermal processes (oxidation, dehydration, decomposition…) that take place in clayey matrices. Using this technique, the evolution of emissions and the identification of compounds can be monitored and measured during thermal treatment by using thermogravimetry an differential scanning calorimetry (TGA-DSC) coupled with a quadrupole mass spectrometer (QMS) and a Fourier transform infrared spectrometer (FTIR) [14,15,16,17].
Due to the difficulty to identify minority minerals in ceramic raw materials, the objective of this work is to develop a new methodology to quantify acid emissions (like SO2, CO2, HCl and HF) and minerals in clayey matrices during the firing treatment, even if they are present at low quantitative levels, using the EGA technique.

2. Materials and Methods

2.1. Materials

Natural and synthetic compounds and reference materials used in ceramic tile manufacturing were analyzed in the present study (Table 1 and Table 2). These pure minerals were used to identify the emissions generated during the firing of the ceramic clayey raw materials.
The certified reference materials used in this study were: a calcium carbonate reference material supplied by Sigma-Aldrich; a certified soil with reference GBW07403 supplied by National Research Centre for Certified Reference Materials GBW (Beijing, China); BCS-CRM 348, a ball clay supplied by the British Ceramic Research Limited and certified by the Bureau of Analysed Samples LTD.

2.2. Experimental Methodology

The samples were analyzed by evolved gas analysis technique using a simultaneous TGA-DSC instrument STA 449 C Jupiter® (NETZSCH-Gerätebau GmbH, Selb, Germany) coupled with a quadrupole mass spectrometer QMS 403 Aëolos® (NETZSCH-Gerätebau GmbH, Selb, Germany) and a FTIR spectrometer TENSOR 27 (BRUKER, Bierica, MA, USA). The test conditions were as follows [3,17]: Dynamic air atmosphere with a flow rate of 50 mL·min−1, helium as protection gas at a flow rate of 25 mL·min−1, alumina crucible, sample mass of 50 mg, heating rate of 10 °C·min−1 and maximum temperature of 1200 °C simulating the industrial firing cycle. Signal recorded for mass spectrometer were mass/charge ratio (m/z) of 36 (HCl), 48 (CO2) and 64 (SO2). In addition, the infrared absorption peak of HF was collected from 4056 to 4096 cm−1. The electrical signal obtained in the mass spectrometer or the spectrum obtained in the FTIR equipment as a function of temperature provides an emission profile and the area of these emission peaks can be calculated.
The EGA technique allows to quantify the emissions registered during the thermal treatment injecting a known amount of gas into the carrier gas stream of the system during the measurement. Using this method, the calibration is achieved by determining the relationship between the amount of the injected gas and the intensity of the QMS and FTIR signals. However, this method has some disadvantages such as the possibility that the injected gas could react chemically or be adsorbed on the solid (chemisorption/physisorption processes). On the other side, the use of compressed gases such as fluorine or sulfur dioxide presents problems of high corrosion and their handling requires very strict safety measures. Therefore, it became necessary to develop a new methodology for the quantification of these acid emissions.
Concerning this research, to quantify emissions obtained with EGA technique, sulfur, chlorine and fluorine percentage were determined before and after the thermal treatment using different techniques and methodologies which are detailed below.
The determination of sulfur and chlorine were carried out by WD-XRF preparing the sample in the form of pressed powder. Samples and the compositions prepared for use as calibration standards were homogenized in a HERZOG tungsten carbide ring mill. All pellets were formed at a pressure of 100 kN in a CASMON hydraulic press using a 40mm diameter die. WD-XRF analysis was performed with a PHILIPS Model PW 2400 with Rh-target tube and PW 2540 VTC sample. The following reference materials were used for calibration in WD-XRF analysis of Cl and S in the form of pellets: CRPG samples BR Basalt, Mica Mg and Mica Fe from Geostandards IWG, NCS DC 73324 GBW07406 Soil from China National Centre for Iron and Steel, CCRMP samples LKSD-1, LKSD-3, LKSD-4 and STDS-2 from CANMET [18,19].
To analyze fluorine in the samples, potentiometry technique with an ion-selective electrode was used because in previous studies it was demonstrated that it has a lower detection limit than other techniques as X-ray fluorescence spectrophotometry method [20]. Sample preparation for this determination was performed by alkaline fusion with sodium carbonate of the samples and dissolution in water, finally the determination of the dissolved fluorine was analyzed with an ion-selective electrode. The fluorine measurement by the potentiometric method was carried out with a CRISON model micropH 2002 pH-meter (CRISON INSTRUMENTS S.A., Barcelona, Spain) capable of measuring mV, fitted with a fluorine ion-selective electrode and a reference electrode. Calibration of the potentiometric measurements were carried out using standard solutions containing 1000 mg·L−1 of fluorine from Merck. The validation was performed analyzing a certified reference material (Standard Glass No. 4 Fluorine Opal Glass) [21].
The determination of organic carbon was carried out by coulometry, with a carbon analyzer model CM-150 COULOMETRICS in oxygen atmosphere. To carry out the test, a portion of sample was subjected to a temperature of 500 °C in a furnace with an oxygen atmosphere (3L·min−1). The reference material used was GBW07403 supplied by National Research Centre for Certified Reference Materials GBW (China).
In order to quantify CO2 emissions derived from carbonate decompositions a calcite reference material (calcite 1.02410, Merck) was analyzed by EGA under the same conditions as the test sample.

3. Results and Discussion

3.1. Study of Emission Profiles

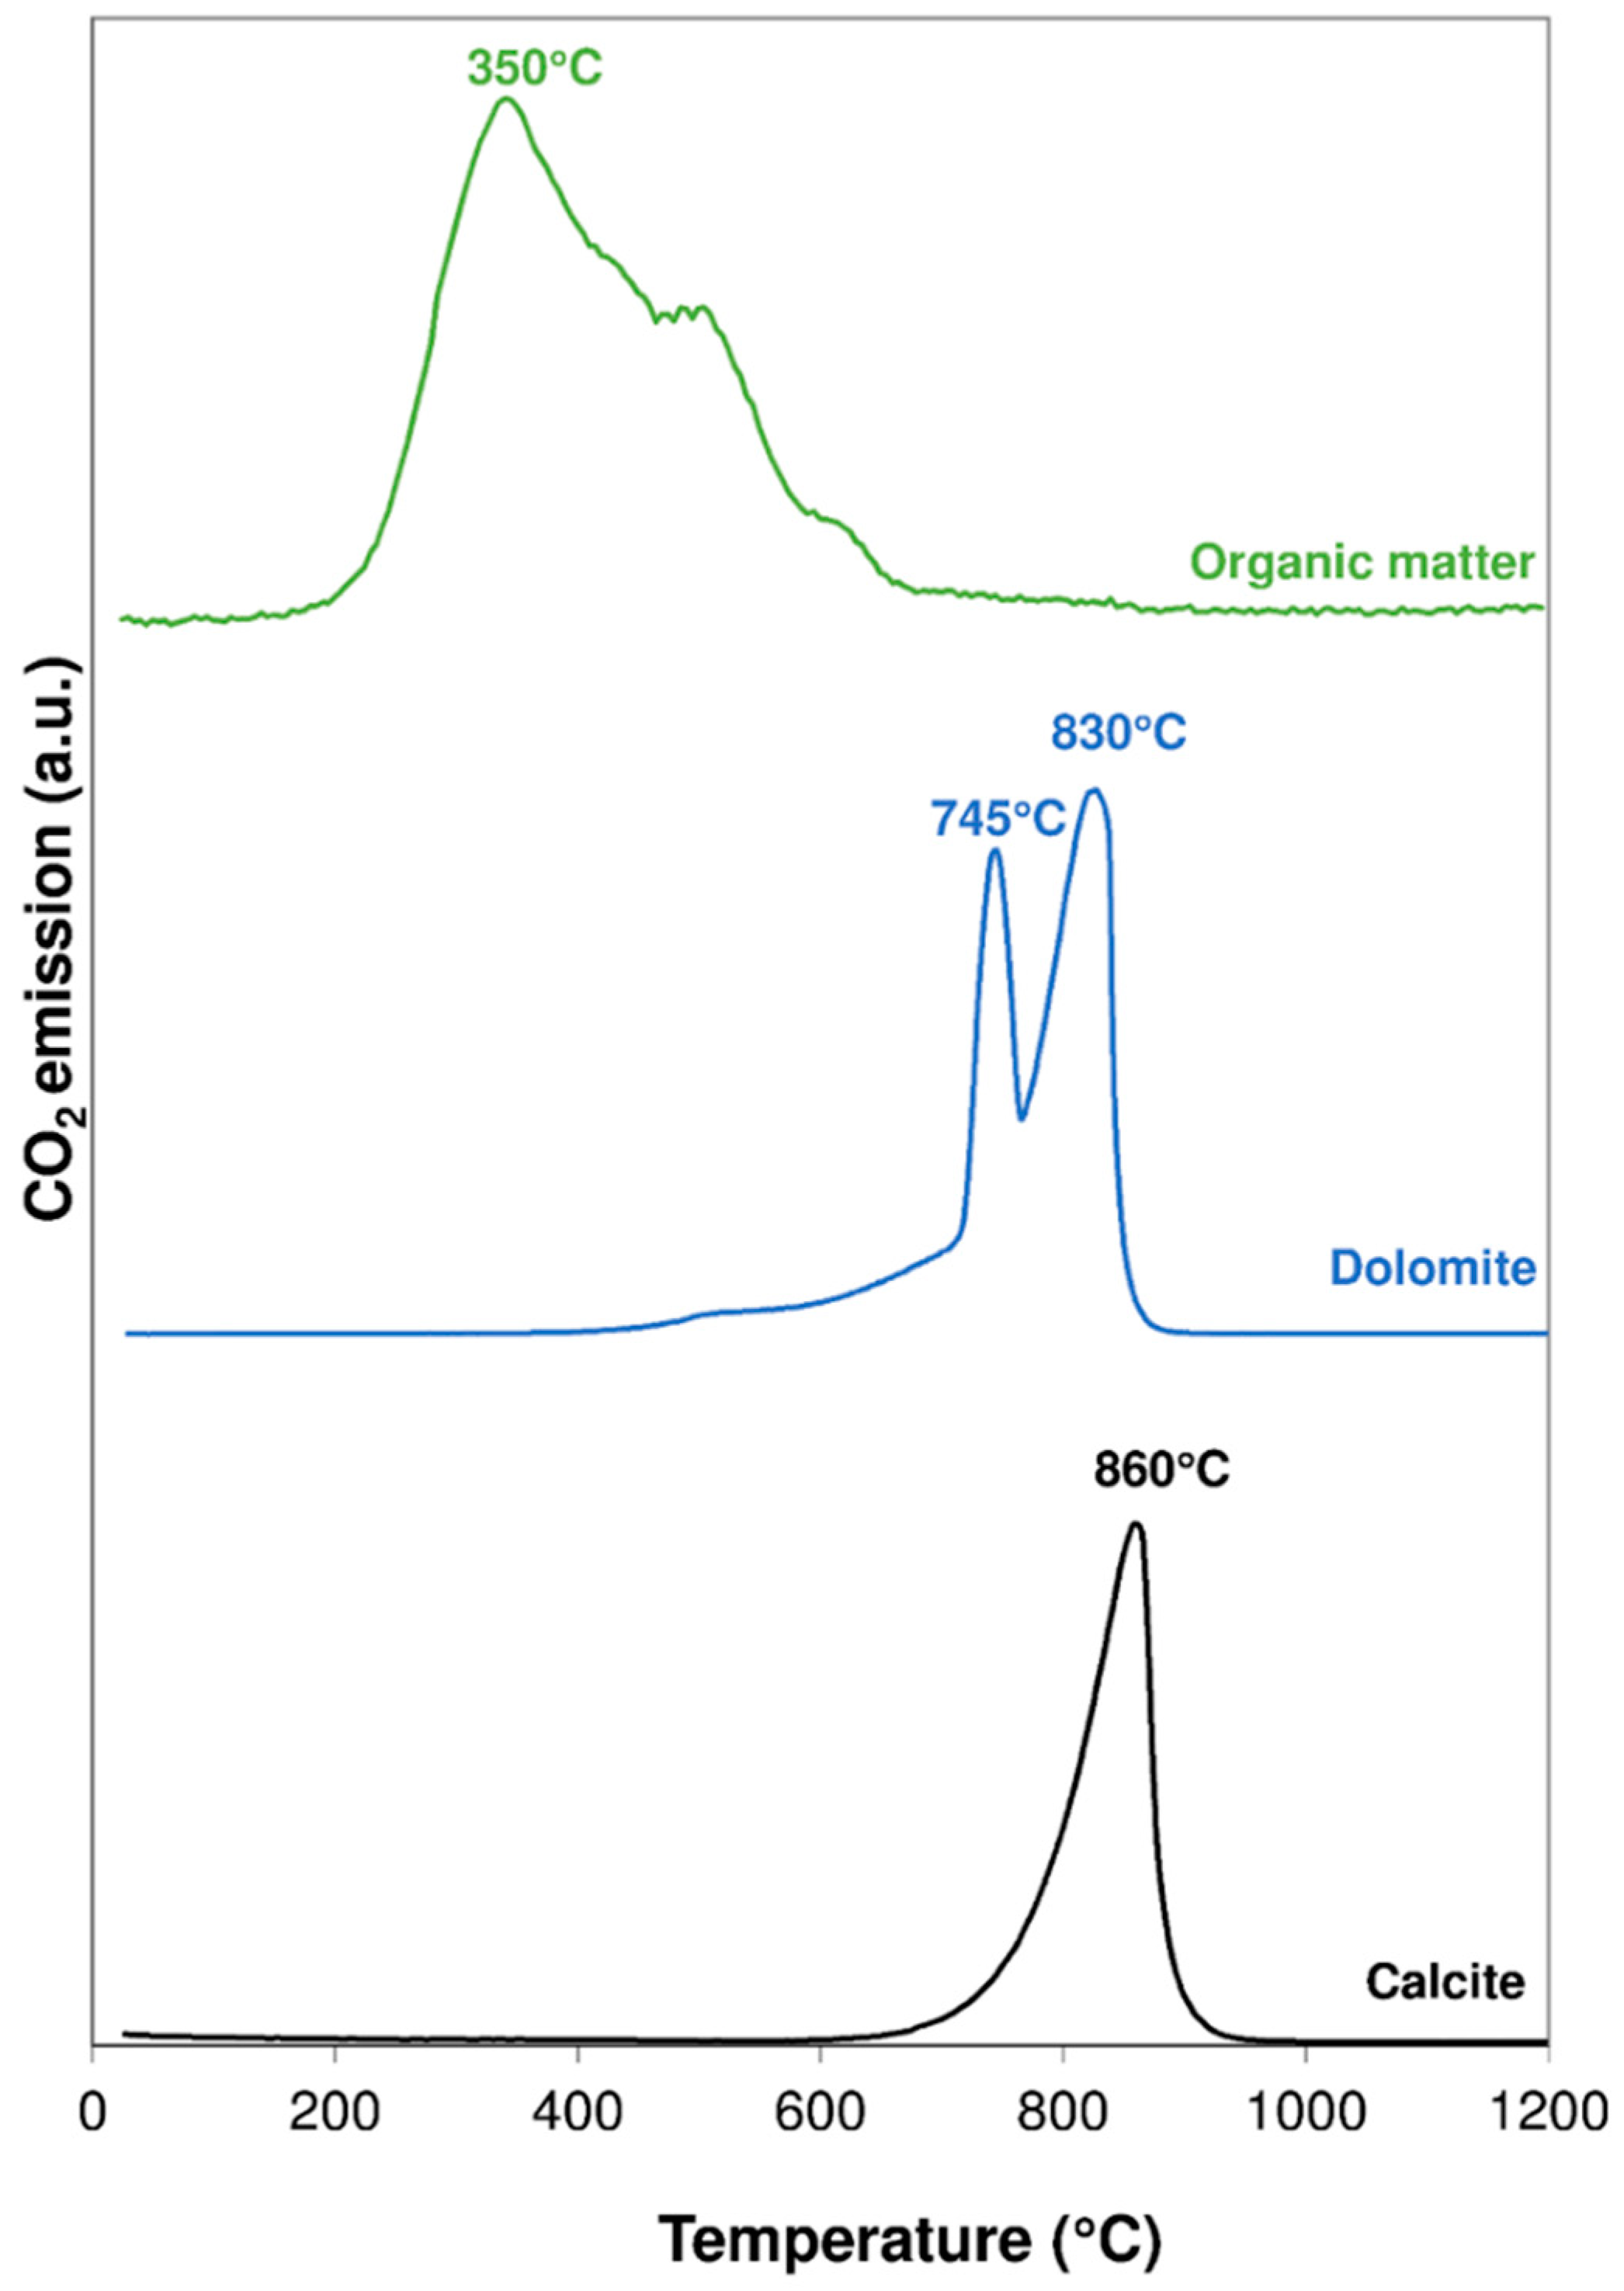
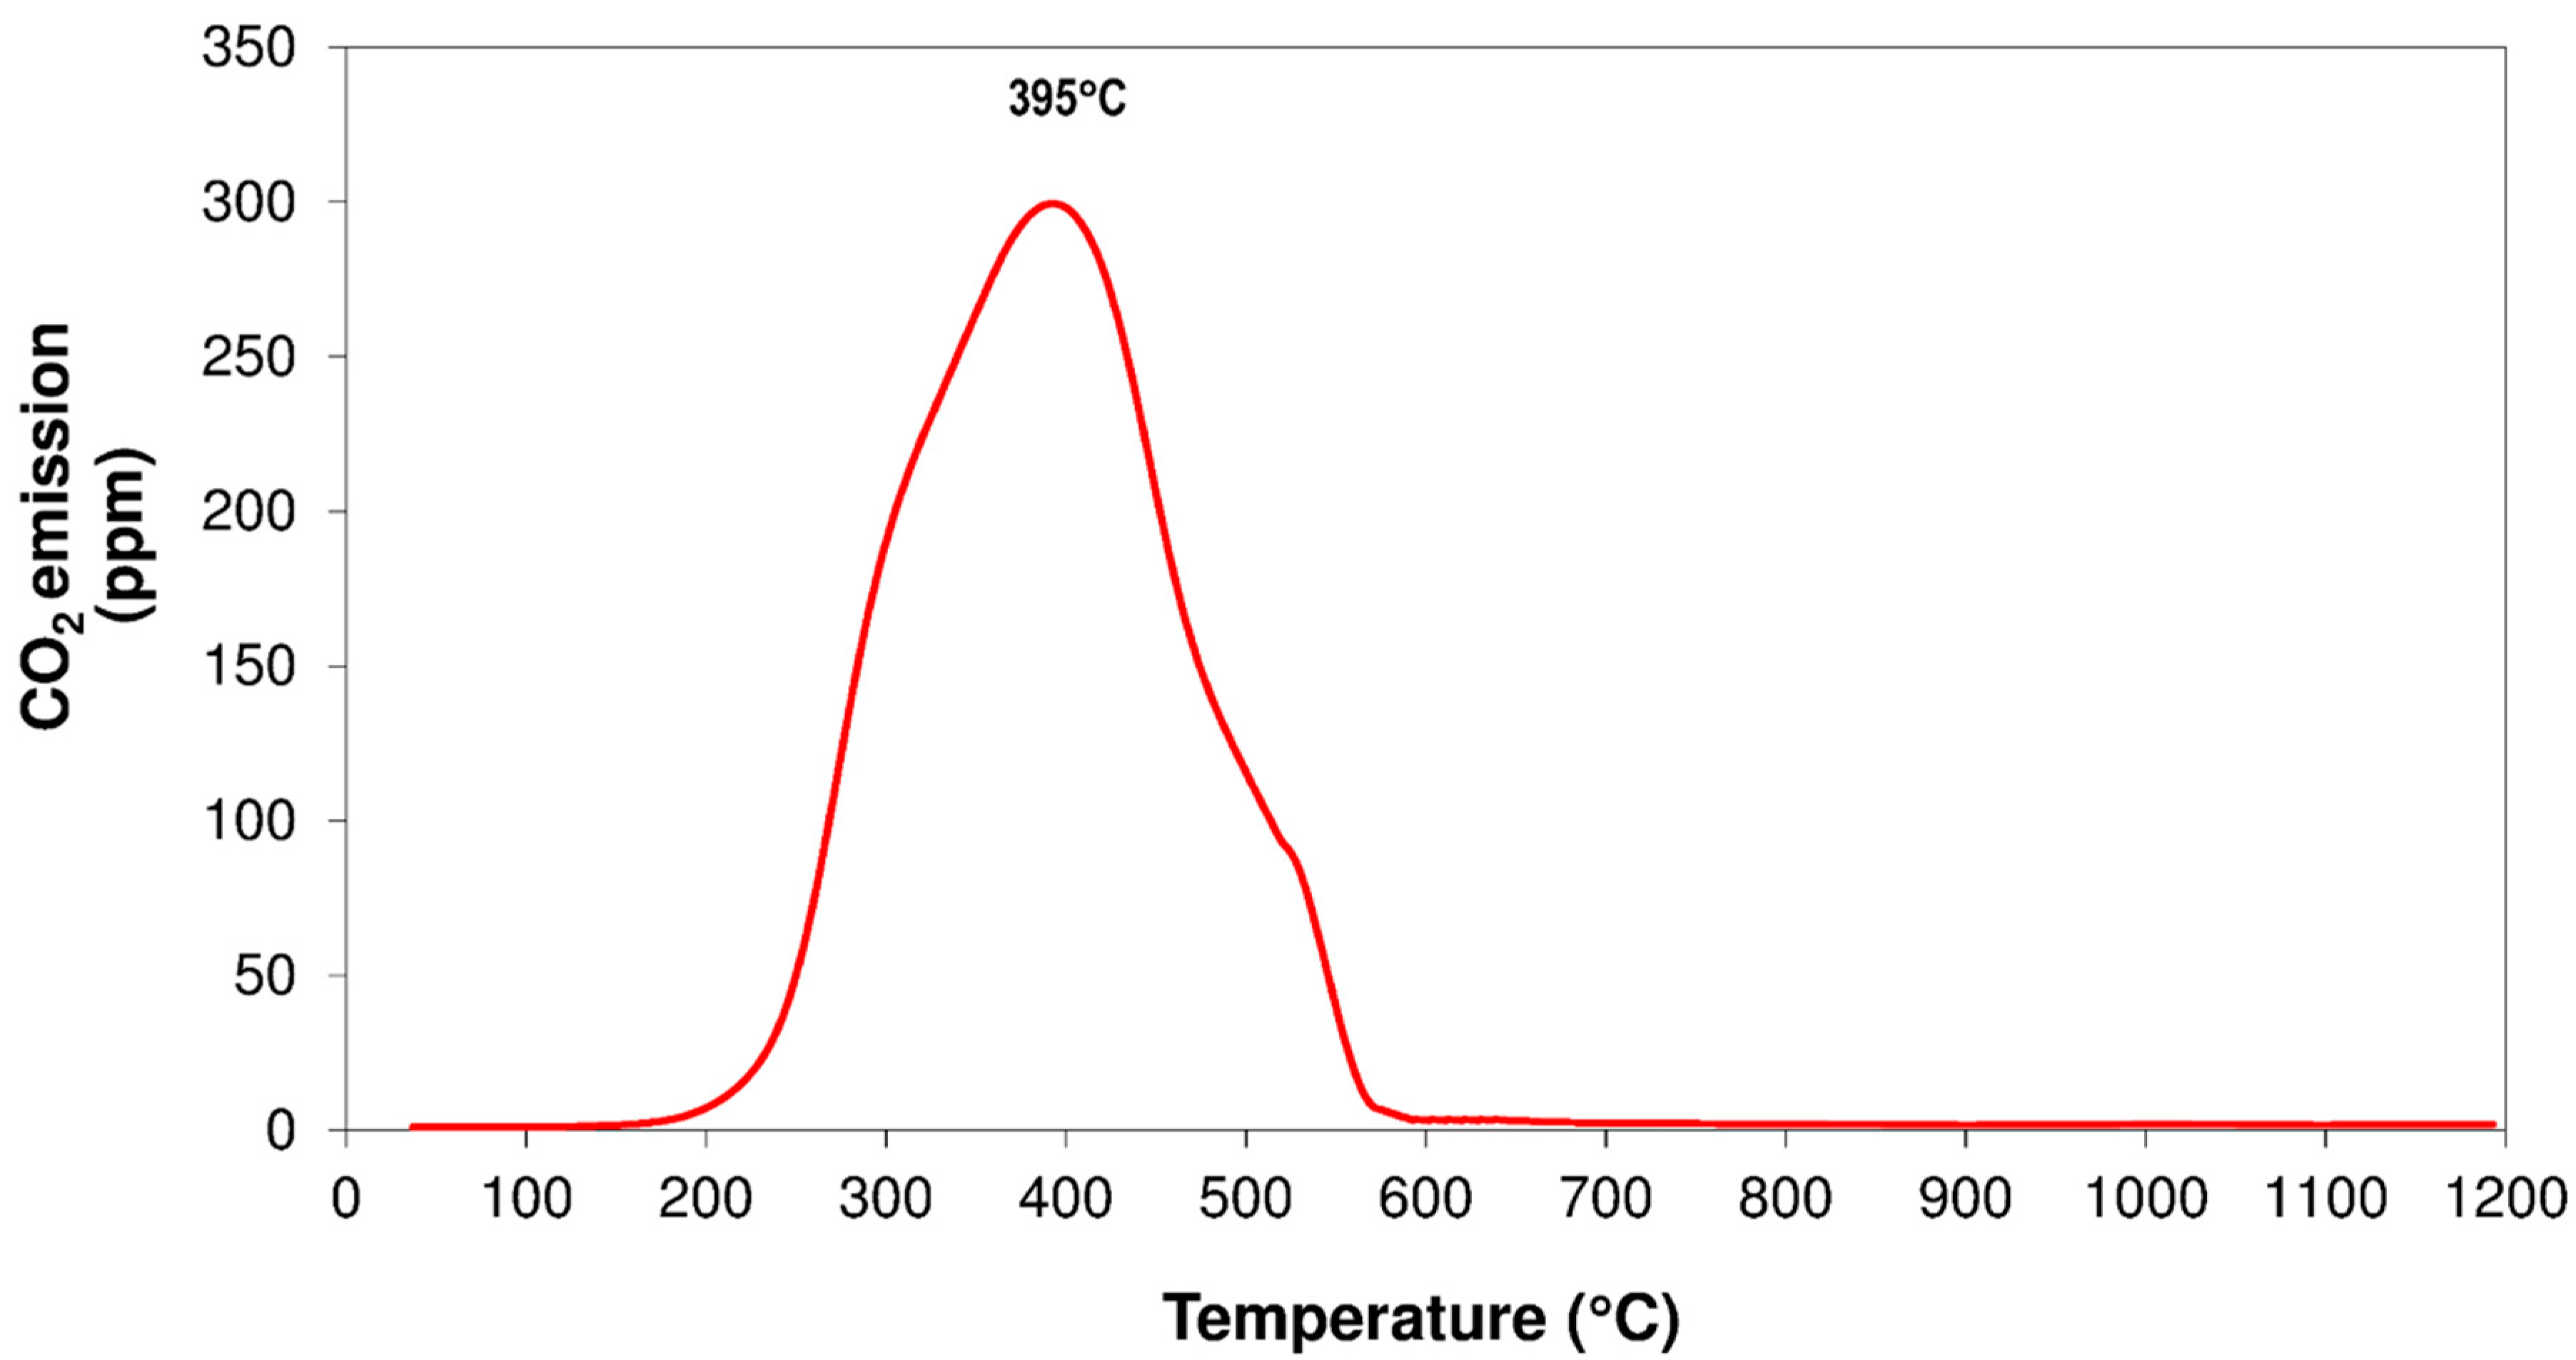
3.1.1. Carbon Dioxide Emissions

The emission of carbon dioxide during the thermal treatment of raw materials can be derived from different sources, either from the decomposition of carbonates such as calcite, dolomite or magnesite or compounds from the thermal degradation of small percentages of organic matter found in clays (lignin, humic acids or bituminous substances). Combustion of these organic substances occurs between 250 and 650 °C and they decompose entirely if the quantity of oxygen is sufficient to complete the reaction [22]. On the other hand, the decomposition of carbonates takes place in the temperature range between 600 and 950 °C depending on the nature of the mineral as well as the particle size and the crystallinity of the product [23,24].
For the study of carbon dioxide emissions, two carbonates present in many clays, calcite and dolomite, were selected. These carbonates used in ceramic compositions give the product a high porosity and promote the formation of calcium crystalline phases. As shown in Figure 1, calcite presented a single emission stage with a maximum emission at 860 °C, while dolomite presented two differentiated stages corresponding to the decomposition of calcium carbonate and magnesium carbonate (745 and 830 °C respectively).
The decomposition reactions of organic matter can be studied by monitoring CO2 emissions during the thermal treatment of clays. For this purpose, a reference material with a high organic matter content was analyzed (GBW07403, CMSI (China Metallurgical Standardization Research Institute (Beijing, China)) [17]. It was observed an important CO2 emission, which started at 170 °C and with a maximum emission at 350 °C.
These results show how the proposed methodology makes it possible to distinguish the presence of different types of minerals and compounds related to CO2 emissions.

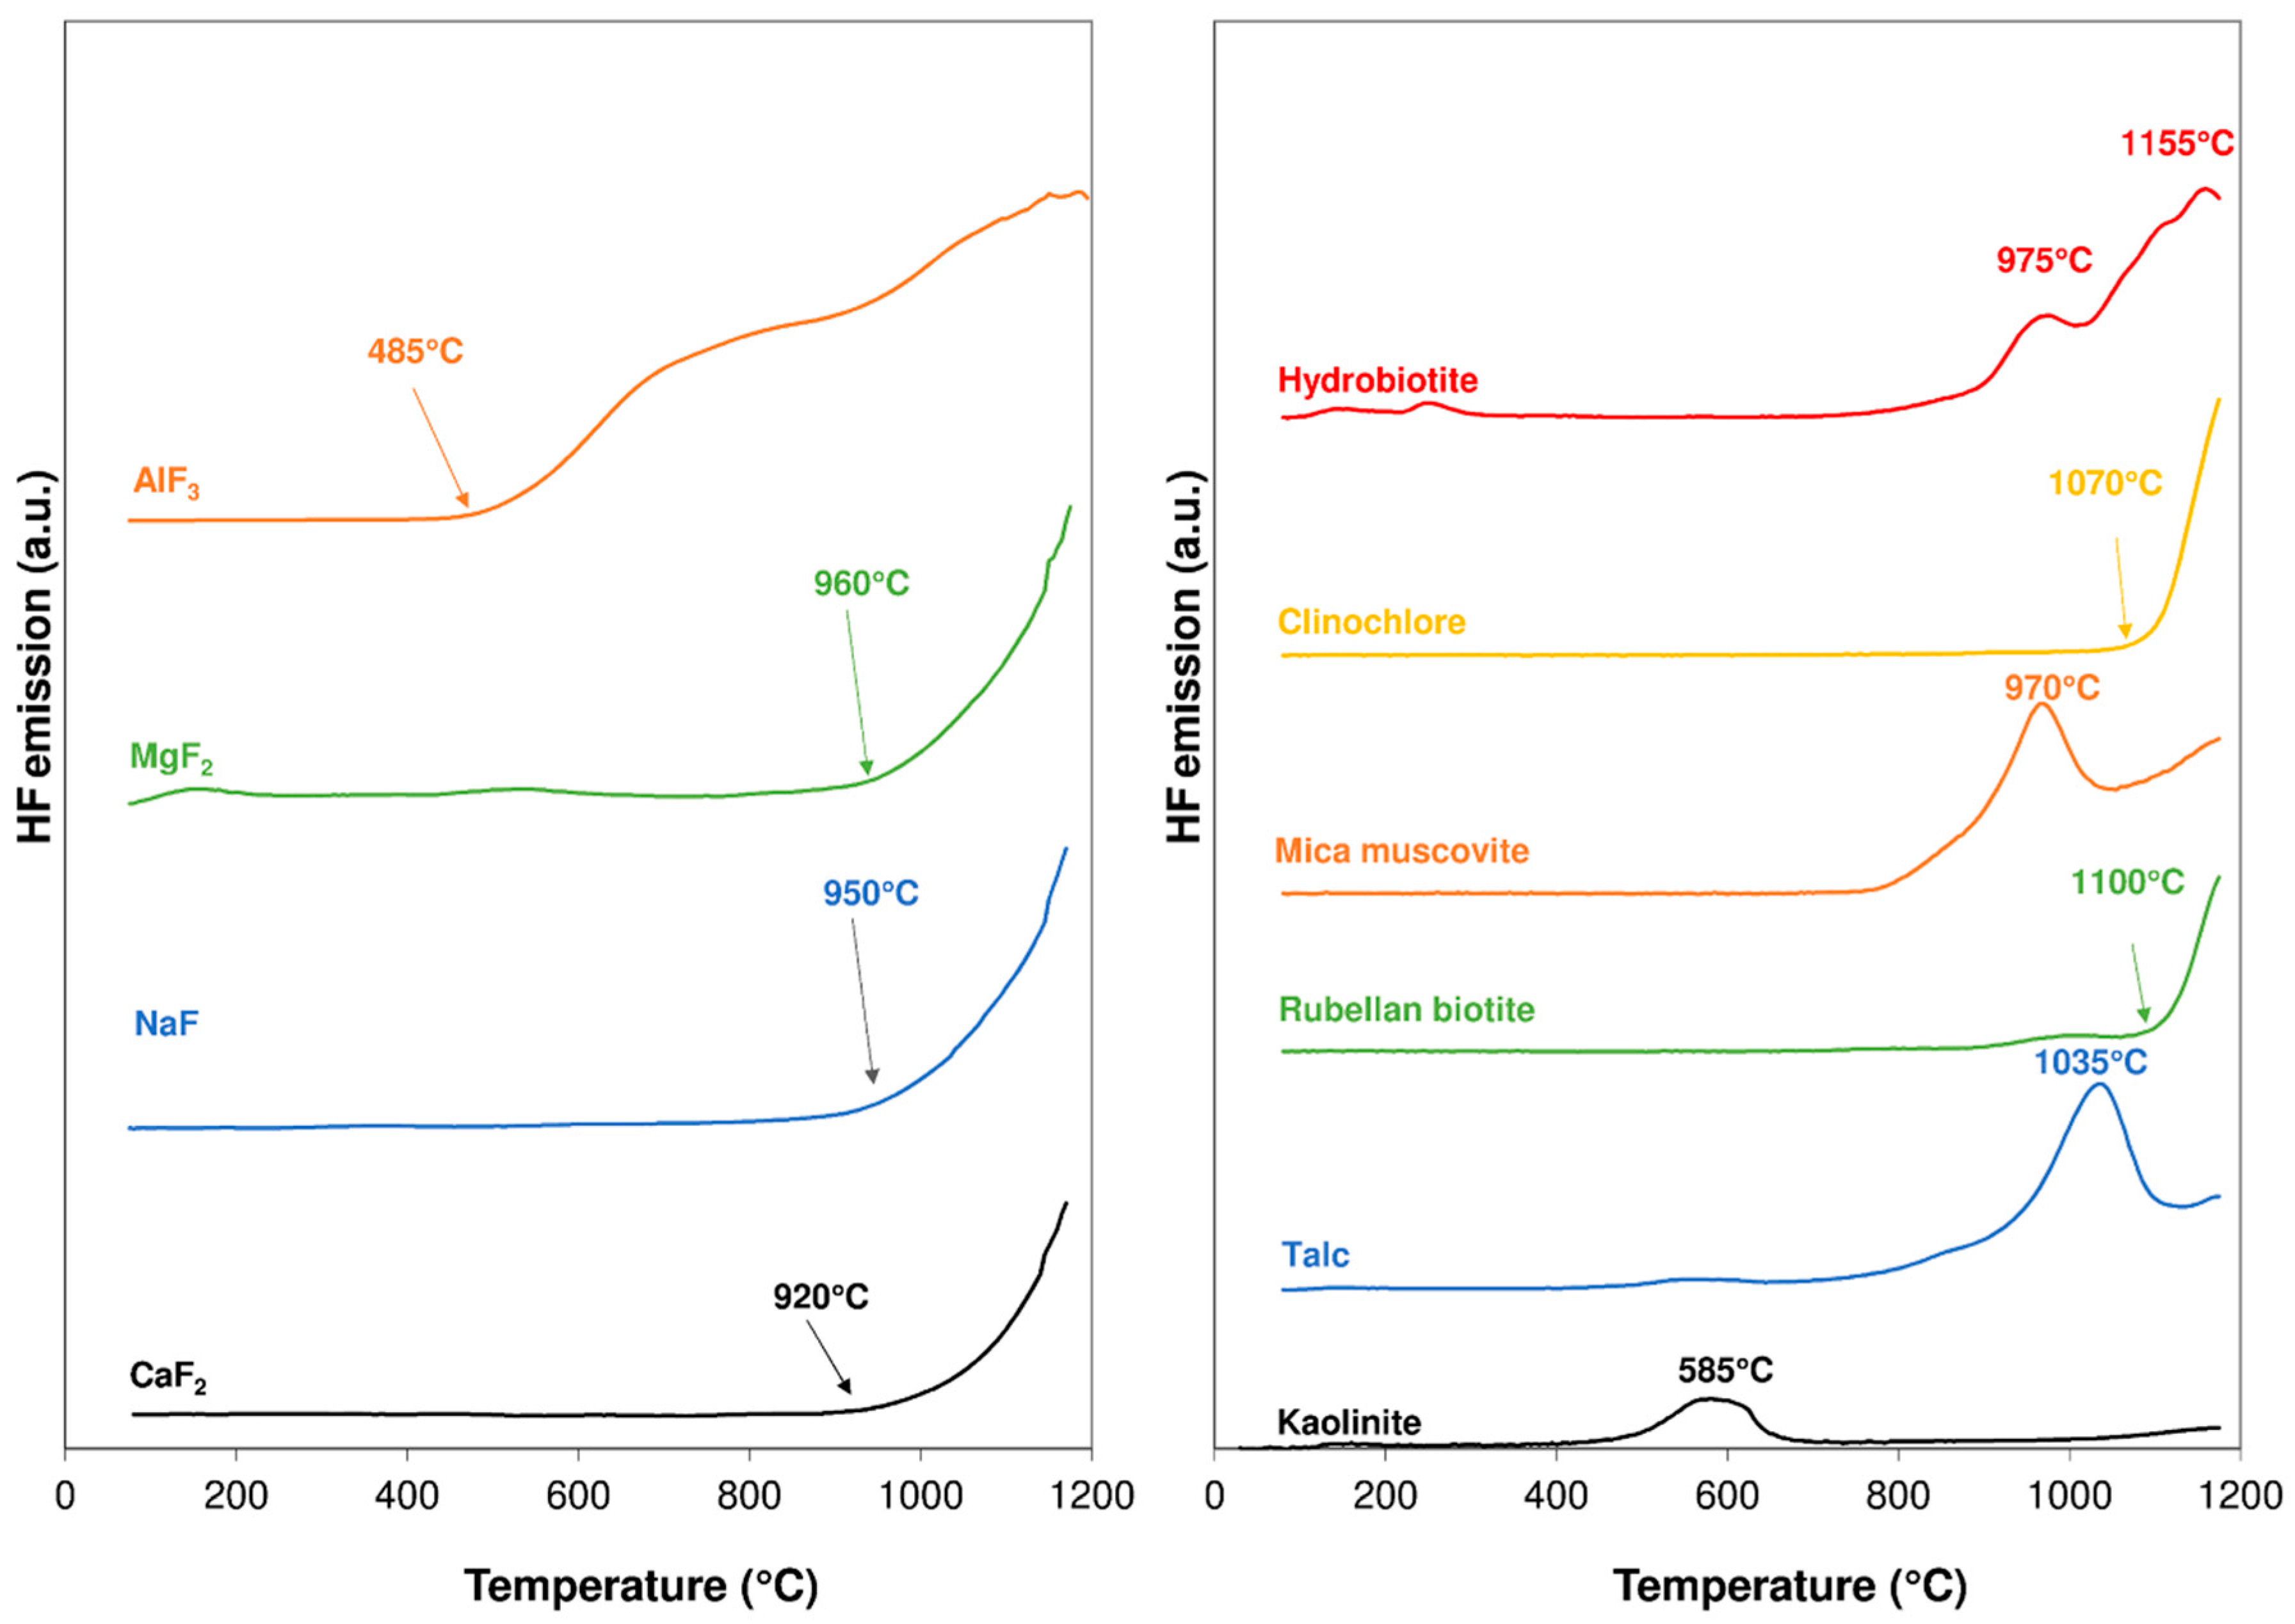
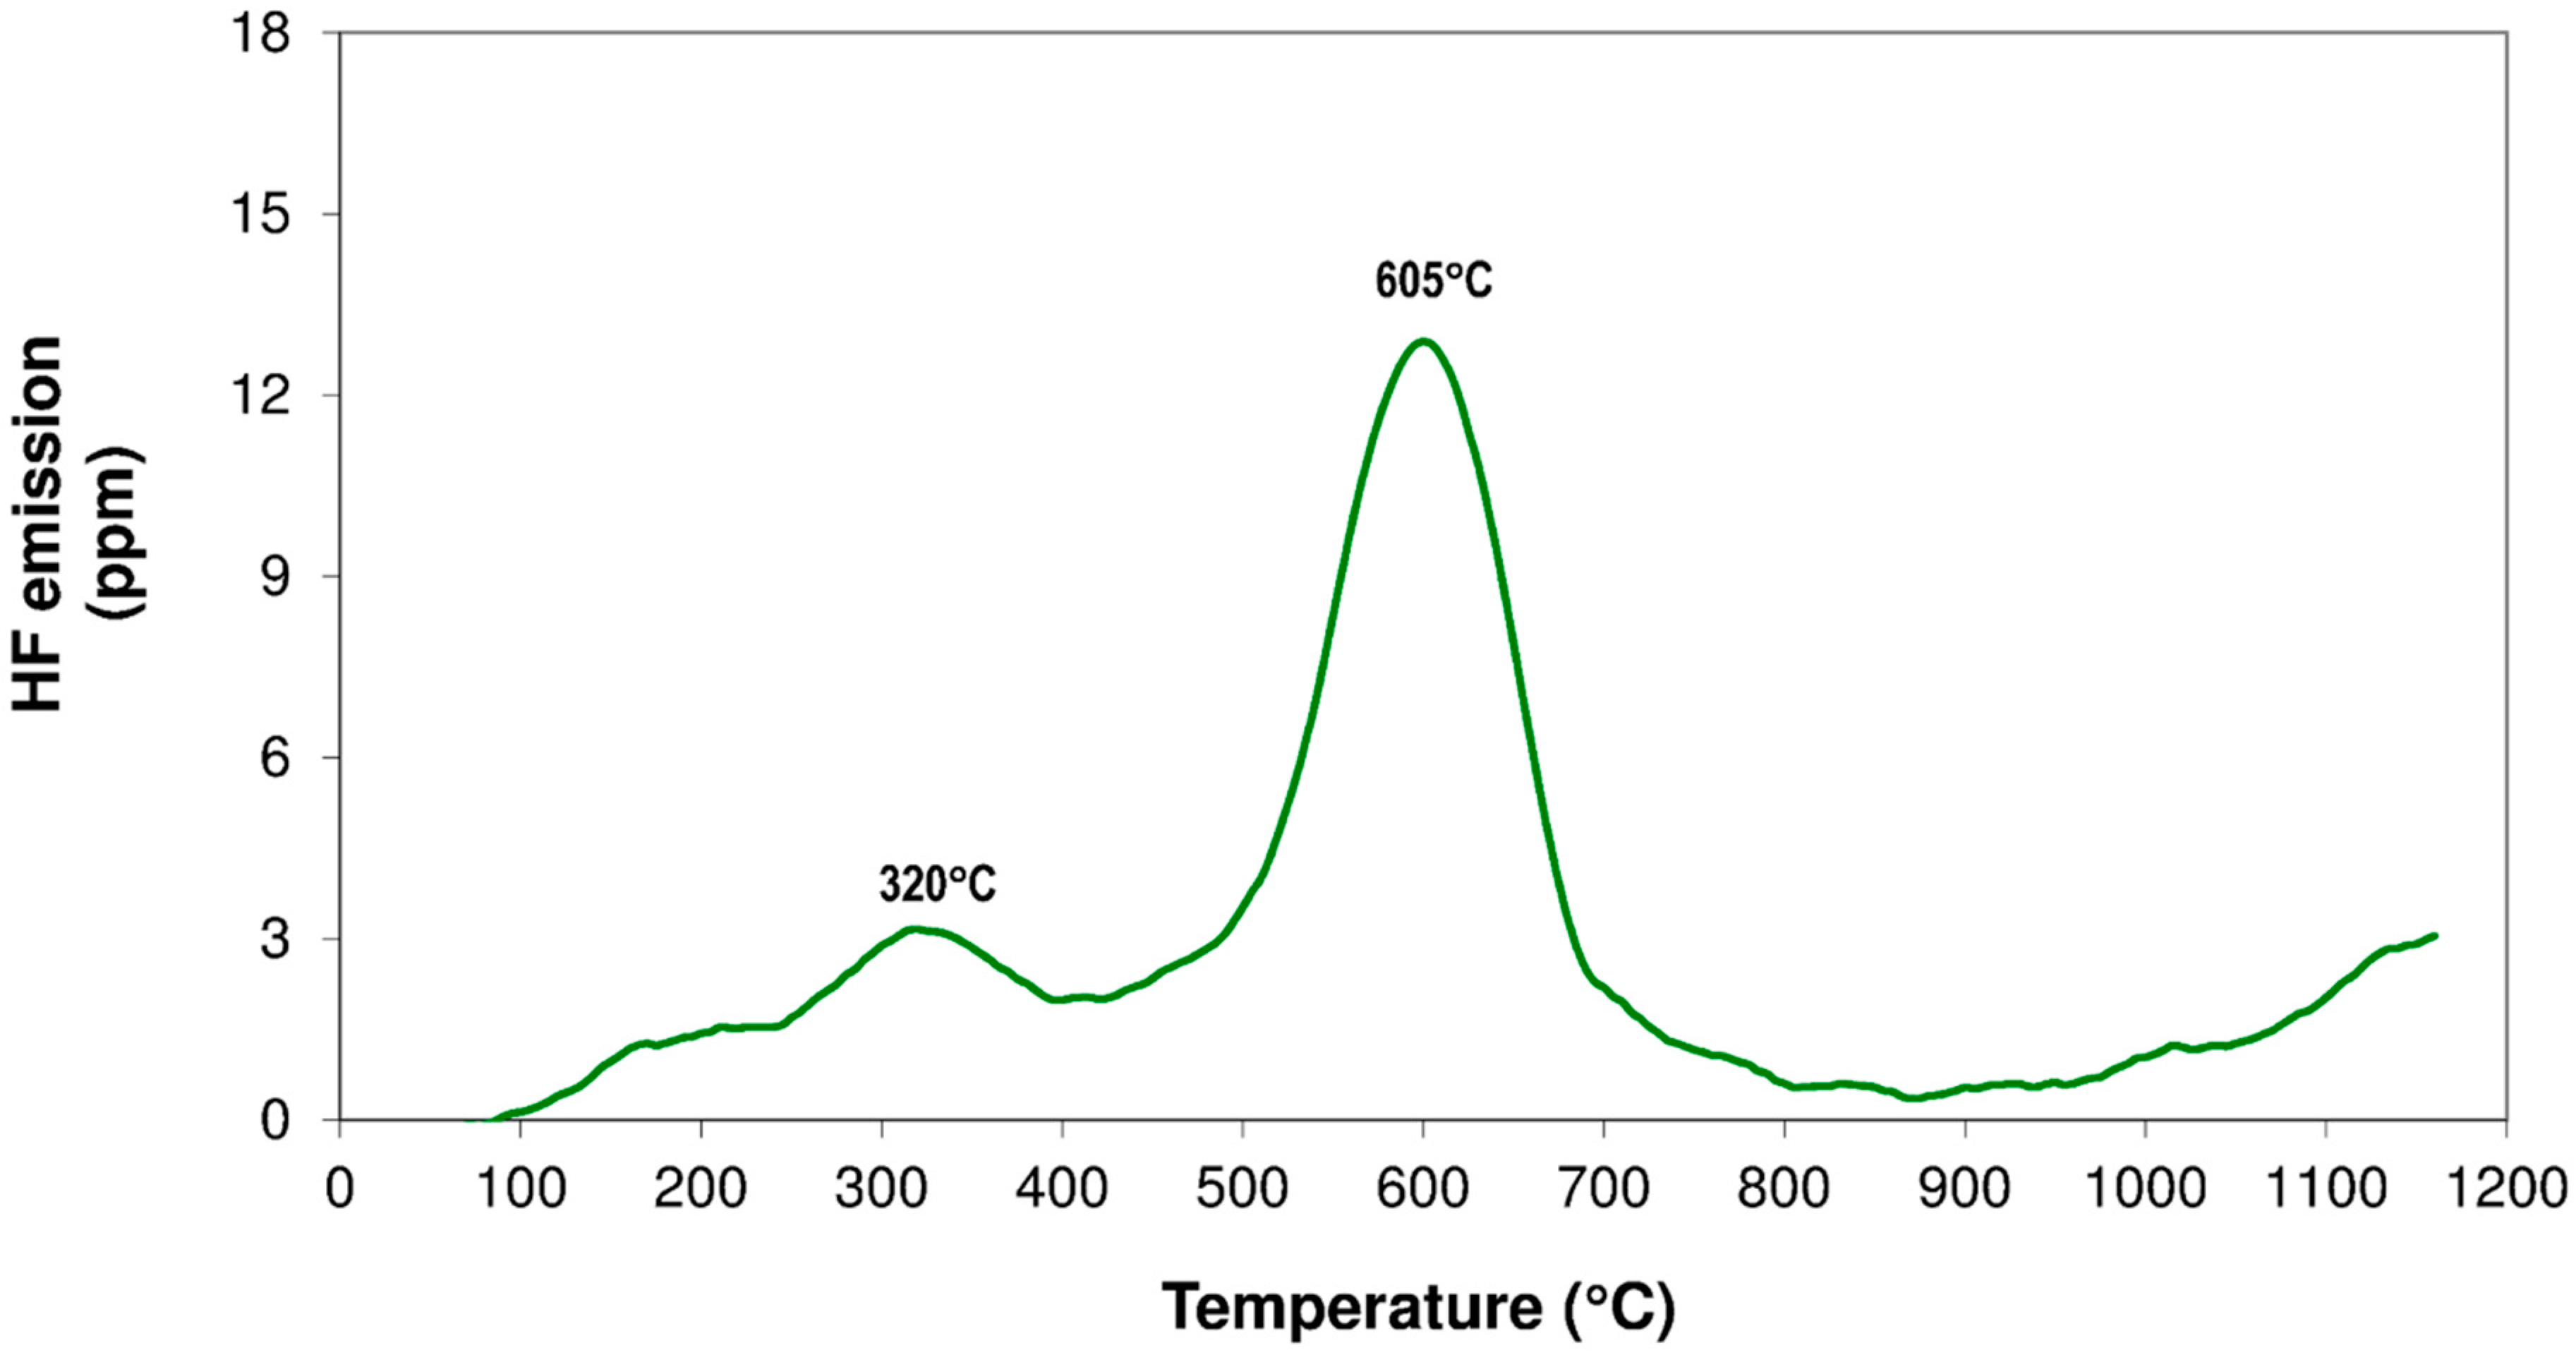
3.1.2. Hydrogen Fluoride Emissions

Nearly all natural raw materials contain small amounts of fluoride substituting structural hydroxyl groups that are part of the phyllosilicates such as micas, talcs, smectites, kaolinite and of feldspars [6,7,10]. The emission of hydrogen fluoride takes place in accordance with two different mechanisms or two main intervals of temperature. First, gaseous fluorine compounds are emitted due to the fluorine contained in the crystal lattice of clays and phyllosilicates and it depends heavily on the type of clay (e.g., smectite at temperatures from 550 °C, illite at temperatures from 750 °C). However, there is another fluorine emission due to the decomposition of fluorite (CaF2) at higher temperatures (>900 °C) formed by the chemical reaction of the fluorine released during the clay mineral dehydroxylation with the calcium oxide liberated from the decomposition of carbonates present in clays [13]. The fluorine released depends on the initial concentration of the raw material, the particle size distribution, the calcite content, the firing temperature and the heating rate [25]. In addition, the presence of water molecules and hydroxyl groups present in phyllosilicates constitute an important interference when determining fluorine emissions using the EGA technique. Using the mass spectrometry technique, the m/z value of water and hydroflouric acid are very close (18 and 19 respectively) and sometimes if the quantity of water is important, for example in dehydroxylation processes, this technique does not allow to distinguish water and fluorine emission. On the other hand, absorption band for HF exhibits multiple absorption peaks in the range 3740–4171 cm−1 and it is well known that water vapor absorbs in the range of 1250–2200 cm−1 and 3000–4100 cm−1, consequently spectral subtraction is necessary to identify and quantify HF accurately when using FTIR technique. So, it should be noted that the study of fluorine emissions is not an easy task.
The HF emission curves recorded by FTIR of the different compounds and minerals analyzed are detailed in Figure 2. Fluoride emission due to CaF2 formation is quite common in clays containing calcium compounds in their composition. For this reason, it was decided to study the evolution of fluorine emissions in different fluorides. However, the emission of fluorine in the compounds analyzed, i.e., magnesium fluoride, sodium fluoride, aluminum fluoride and fluorite, did not differ significantly. Apart from aluminum fluoride which had an emission start at 485 °C, the rest of the fluorides emitted fluorine at very close temperatures, around 900–950 °C. For this reason, it is very difficult to differentiate between different fluorides based exclusively on the temperature at which the emission occurs.
Additionally, the study of the selected phyllosilicates was performed. Kaolinite showed an important HF emission due to the dehydroxylation of the mineral with a maximum emission at 585 °C. Moreover, talc, chlorite and micas analyzed presented different fluorine emission profiles caused when the mineral releases hydroxyl groups, constitution water or their crystal lattice breaks. The talc analyzed presented an emission which started at 890 °C with a maximum emission at 1035 °C. However, the chlorite began to emit HF at higher temperatures, at 1070 °C, and at the end of the heat treatment the emission continued. On the other hand, this study showed how the emission of fluorine compounds from the minerals belonging to the mica group would depend on the structure as well as the chemical composition. It was observed that hydrobiotite sample had two emission peaks at 975 °C and 1155 °C, rubellan biotite had a single emission stage starting at 1100 °C and fluorine emissions of mica muscovite sample started at 775 °C.

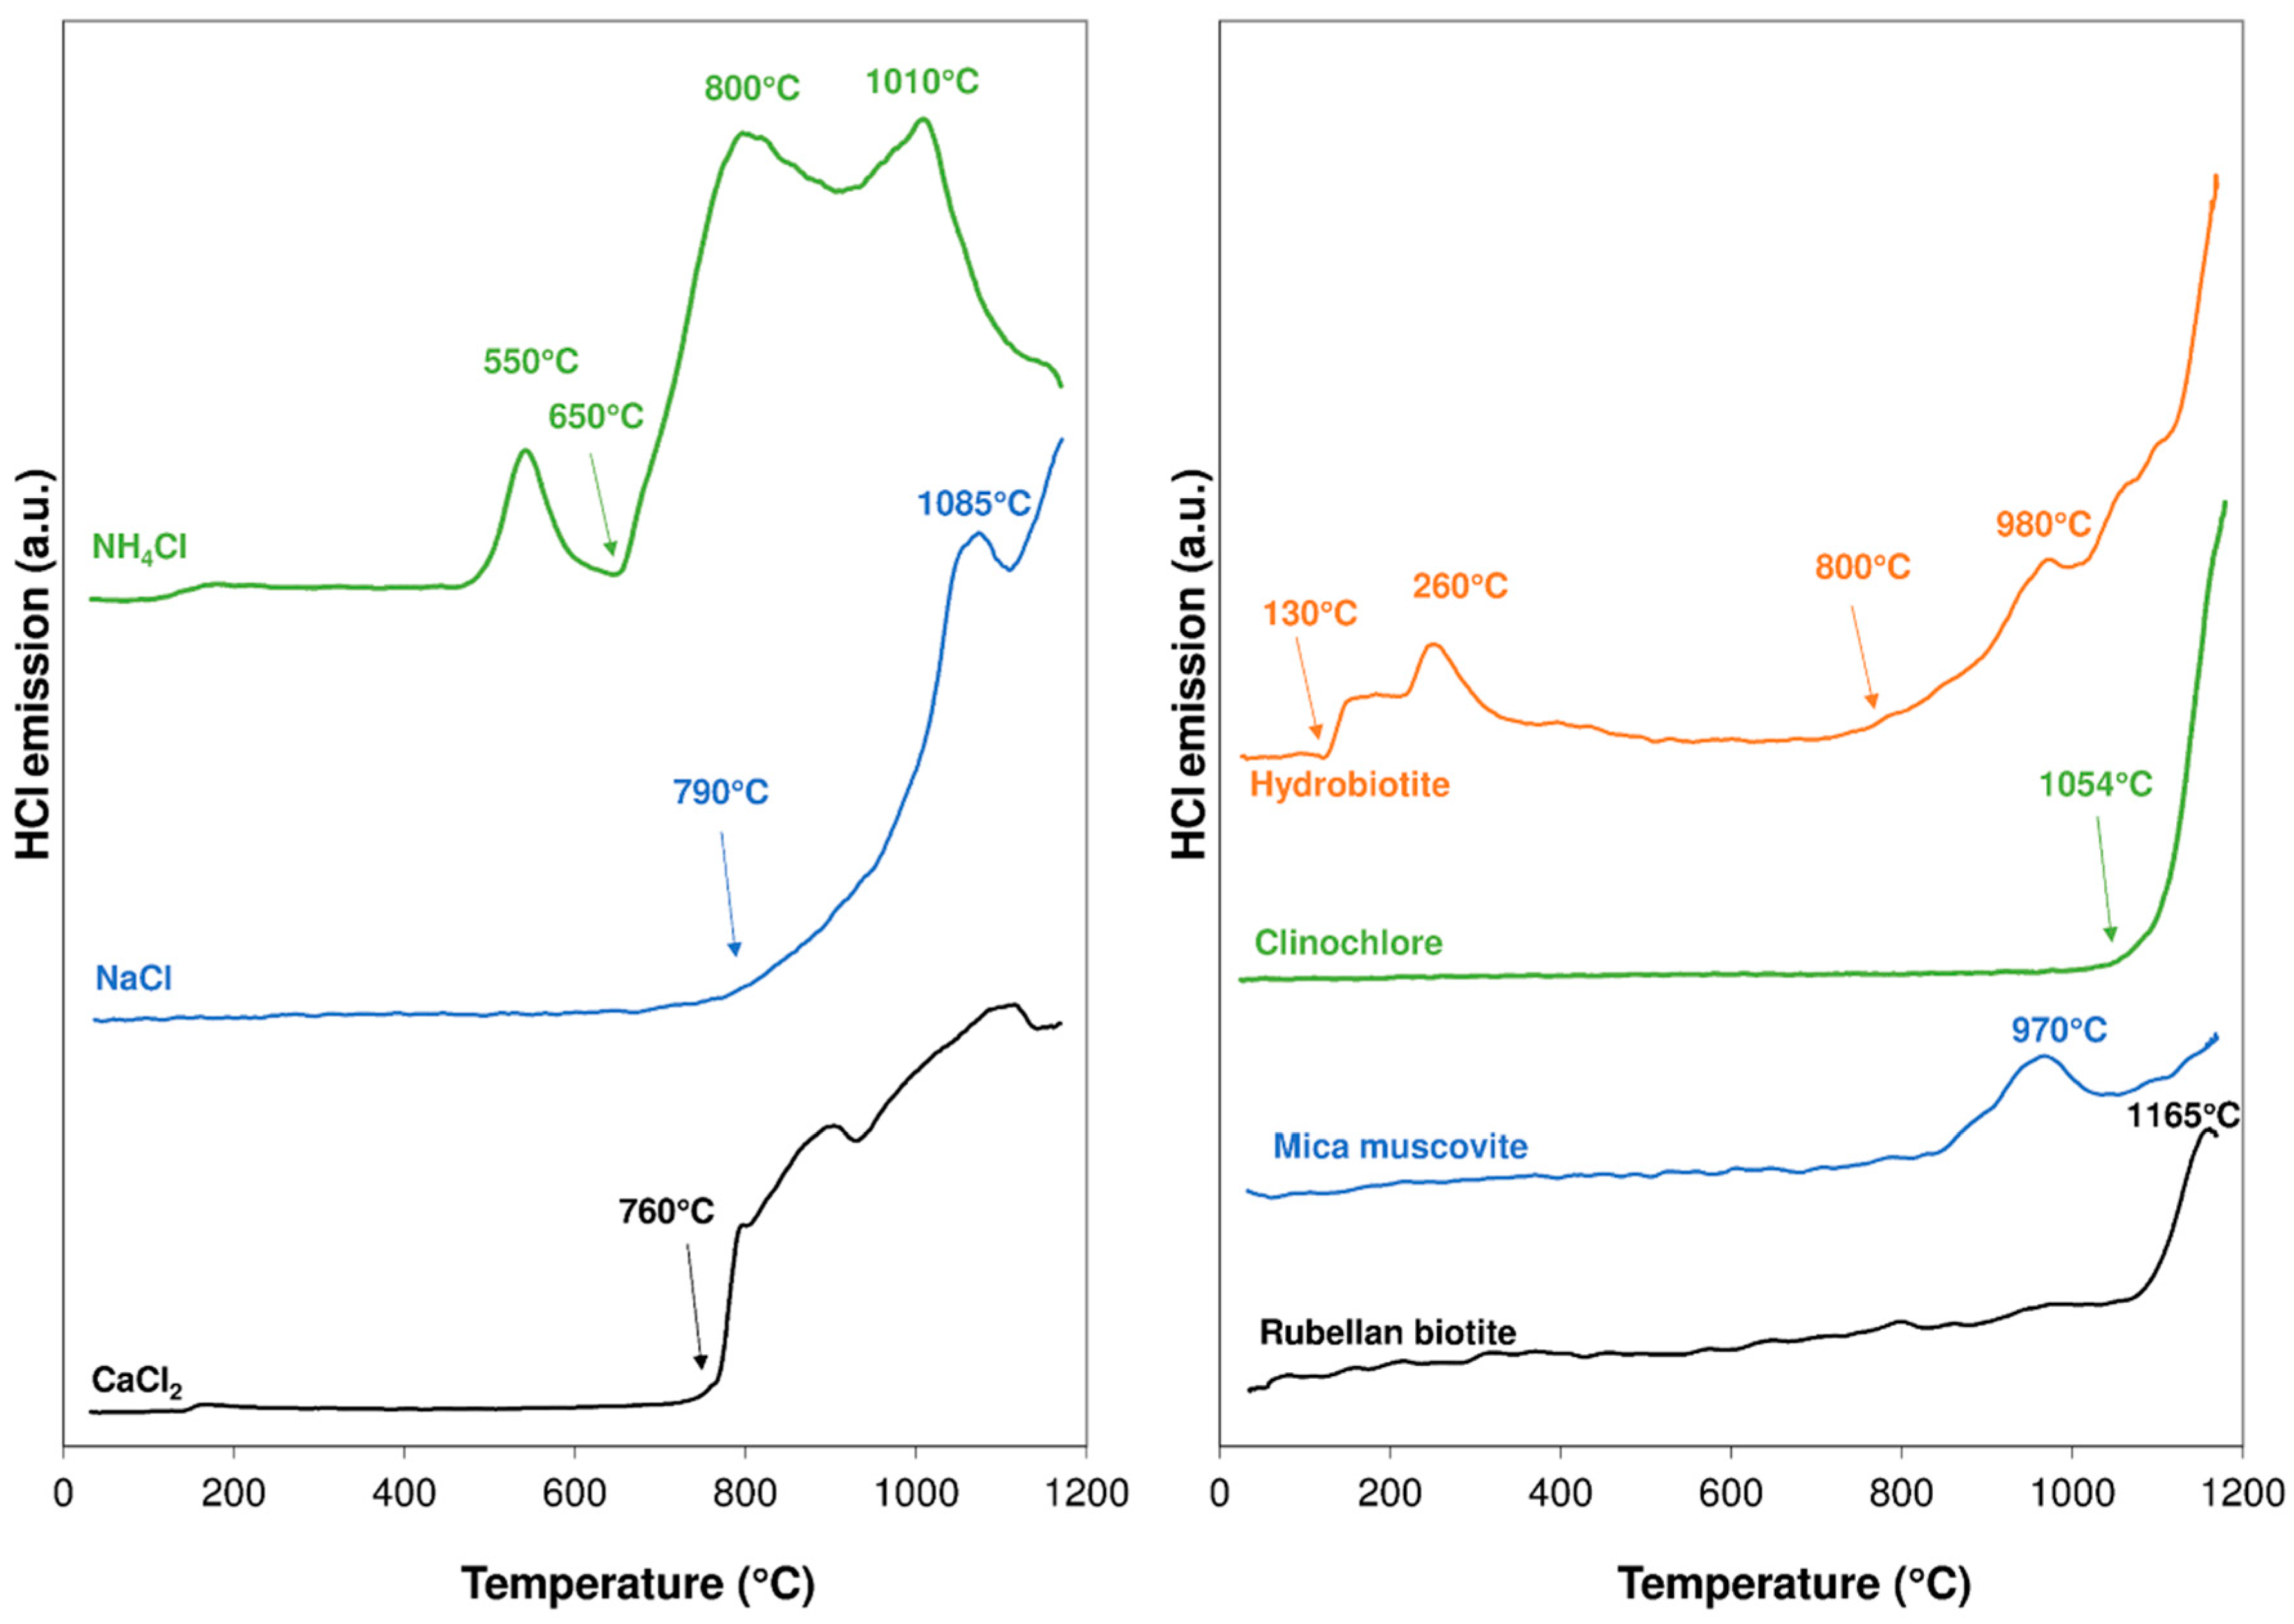
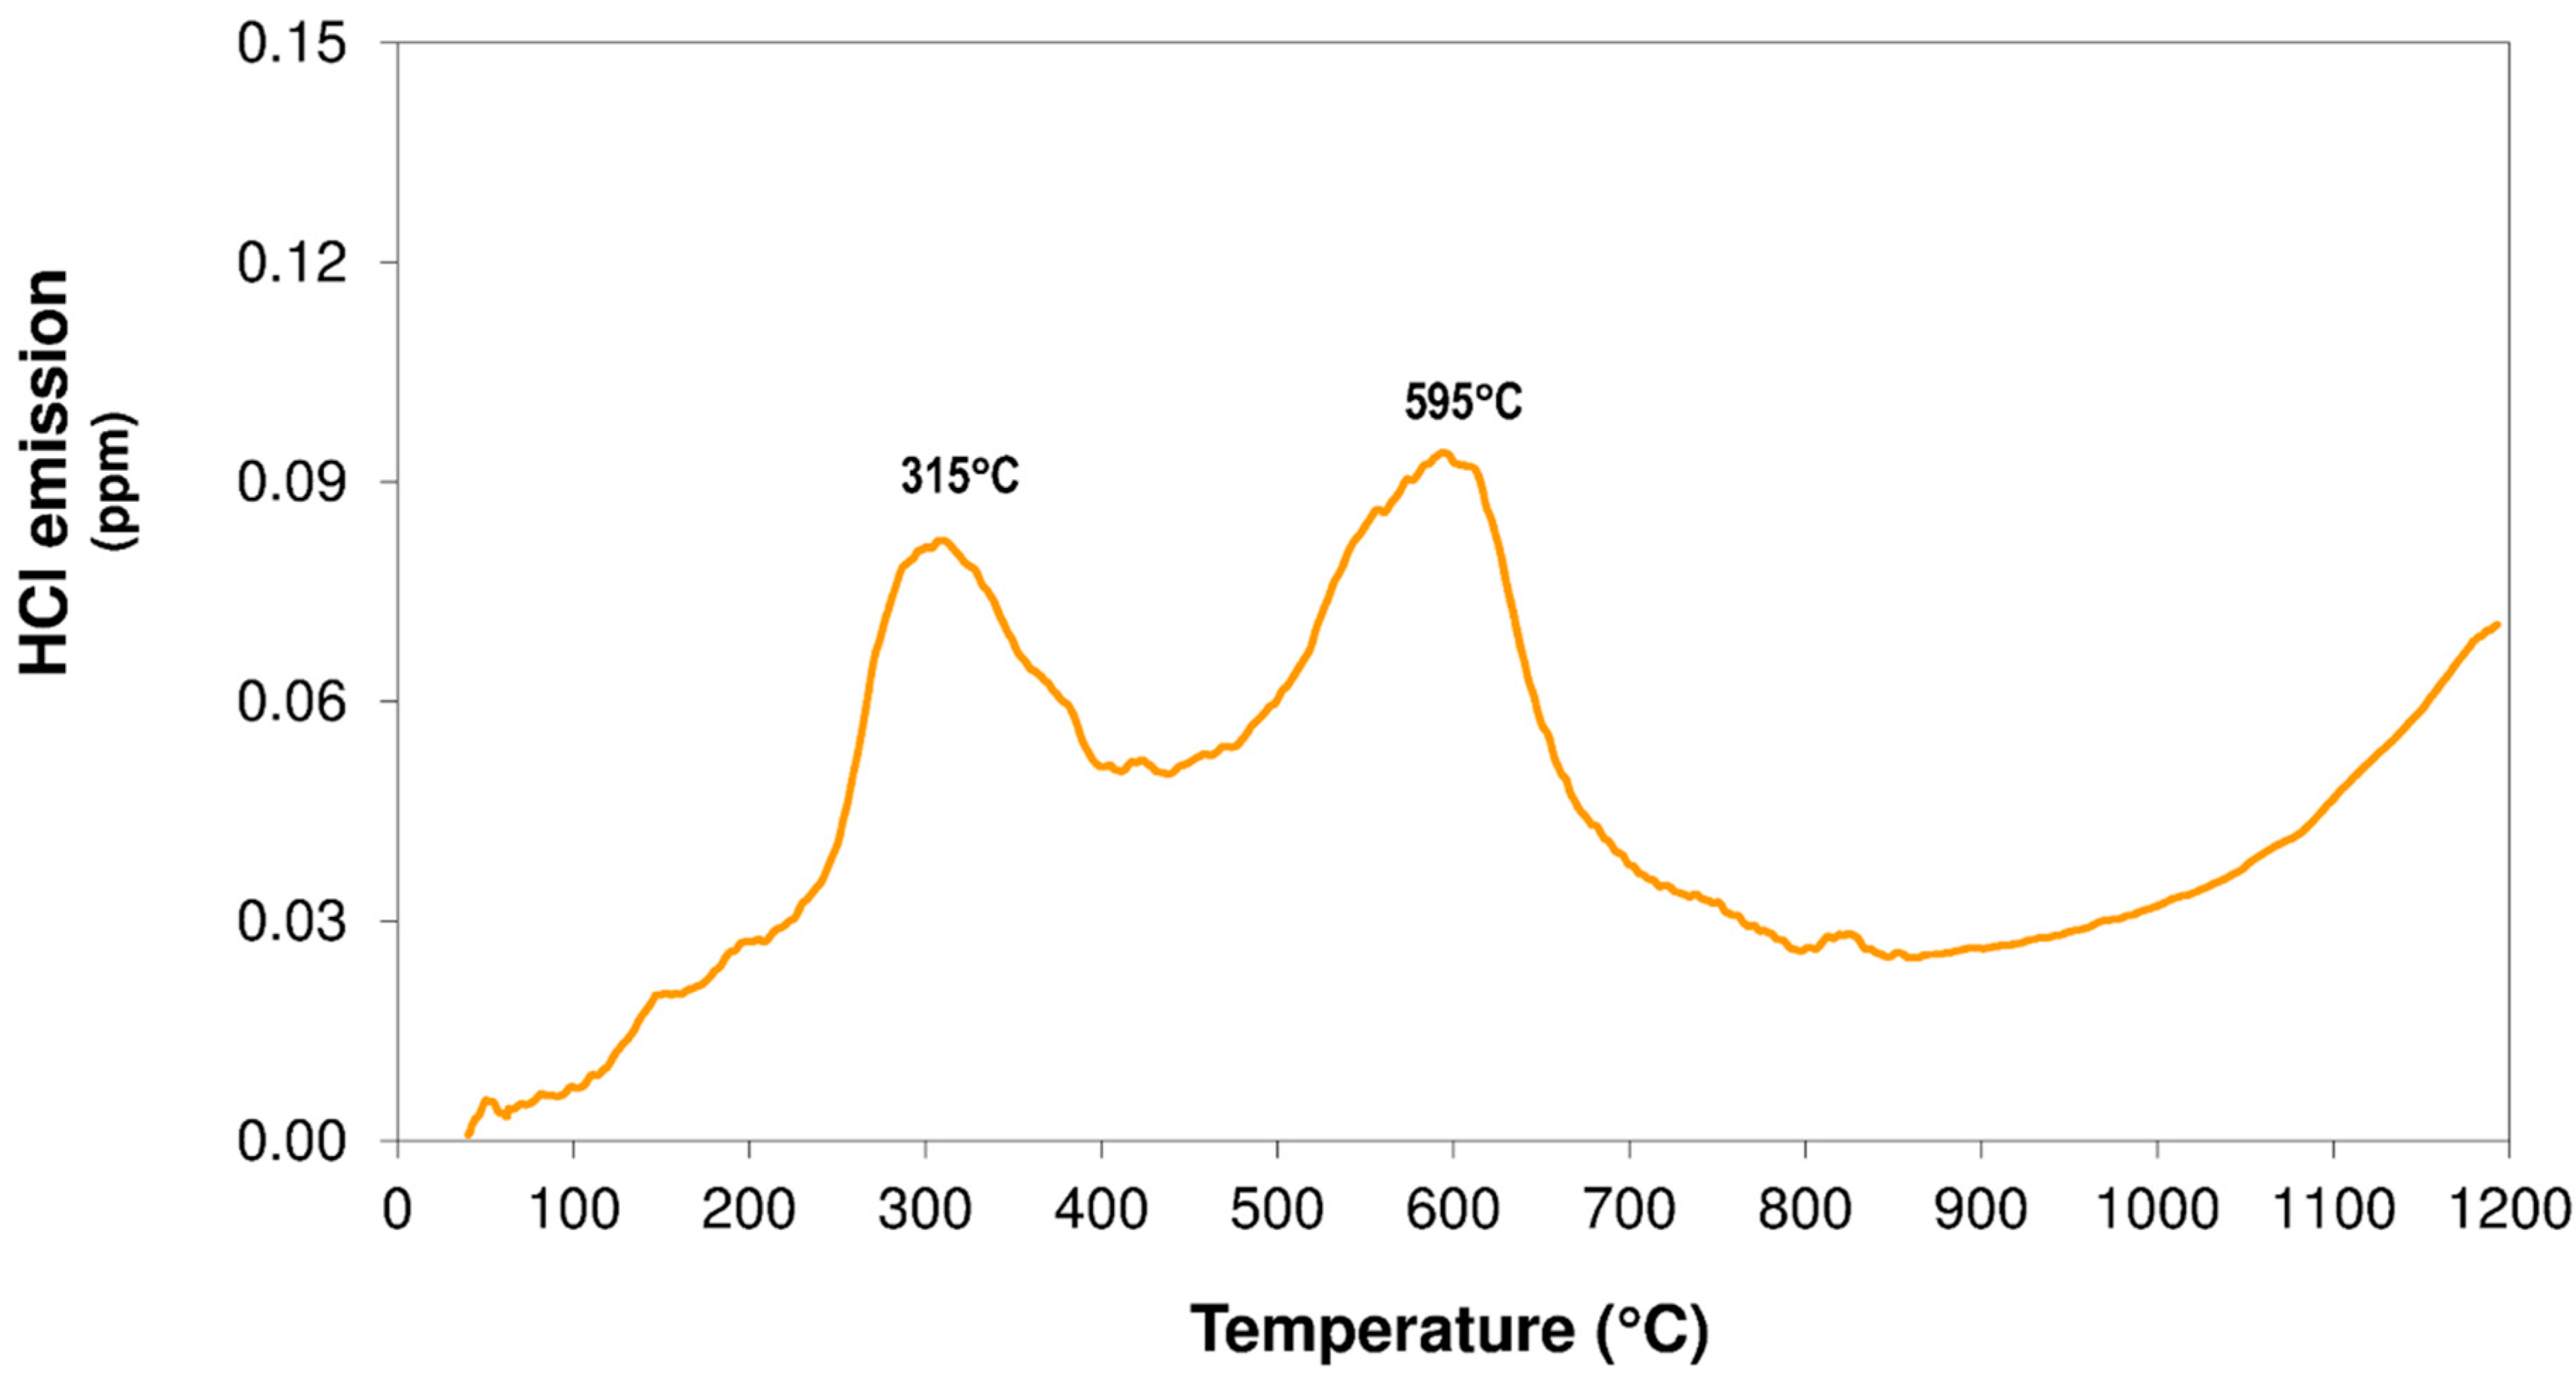
3.1.3. Hydrogen Chloride Emissions

In order to study the different emission sources of chlorine compounds associated with clays, different salts and phyllosilicate minerals were analyzed (Figure 3).
Depending on the nature of the mineral, it could be observed different emission profiles. In the case of the phyllosilicates studied, it was observed that the most important emissions were produced at temperatures above 800 °C, when the mineral releases constitution water and the crystal lattice breaks. In the case of hydrobiotite, three significant emissions could be observed. Under normal atmospheric conditions, water occupies the spaces between the silicate layers, so we could detect three different chlorine emissions related to this water molecules. The first emission was released at 130 °C due to the “unbound water”. The second emission was registered at 260 °C corresponding to “bound water”, and the third emission started at 800 °C due to the dehydroxilation of the mineral [26]. Rubellan biotite, mica muscovite and clinochlore presented a single emission at temperatures above 900 °C related to the loss of hydroxyl groups [27].
On the other hand, the study of different salts containing chlorine showed different emission profiles due to the decomposition of the compounds.

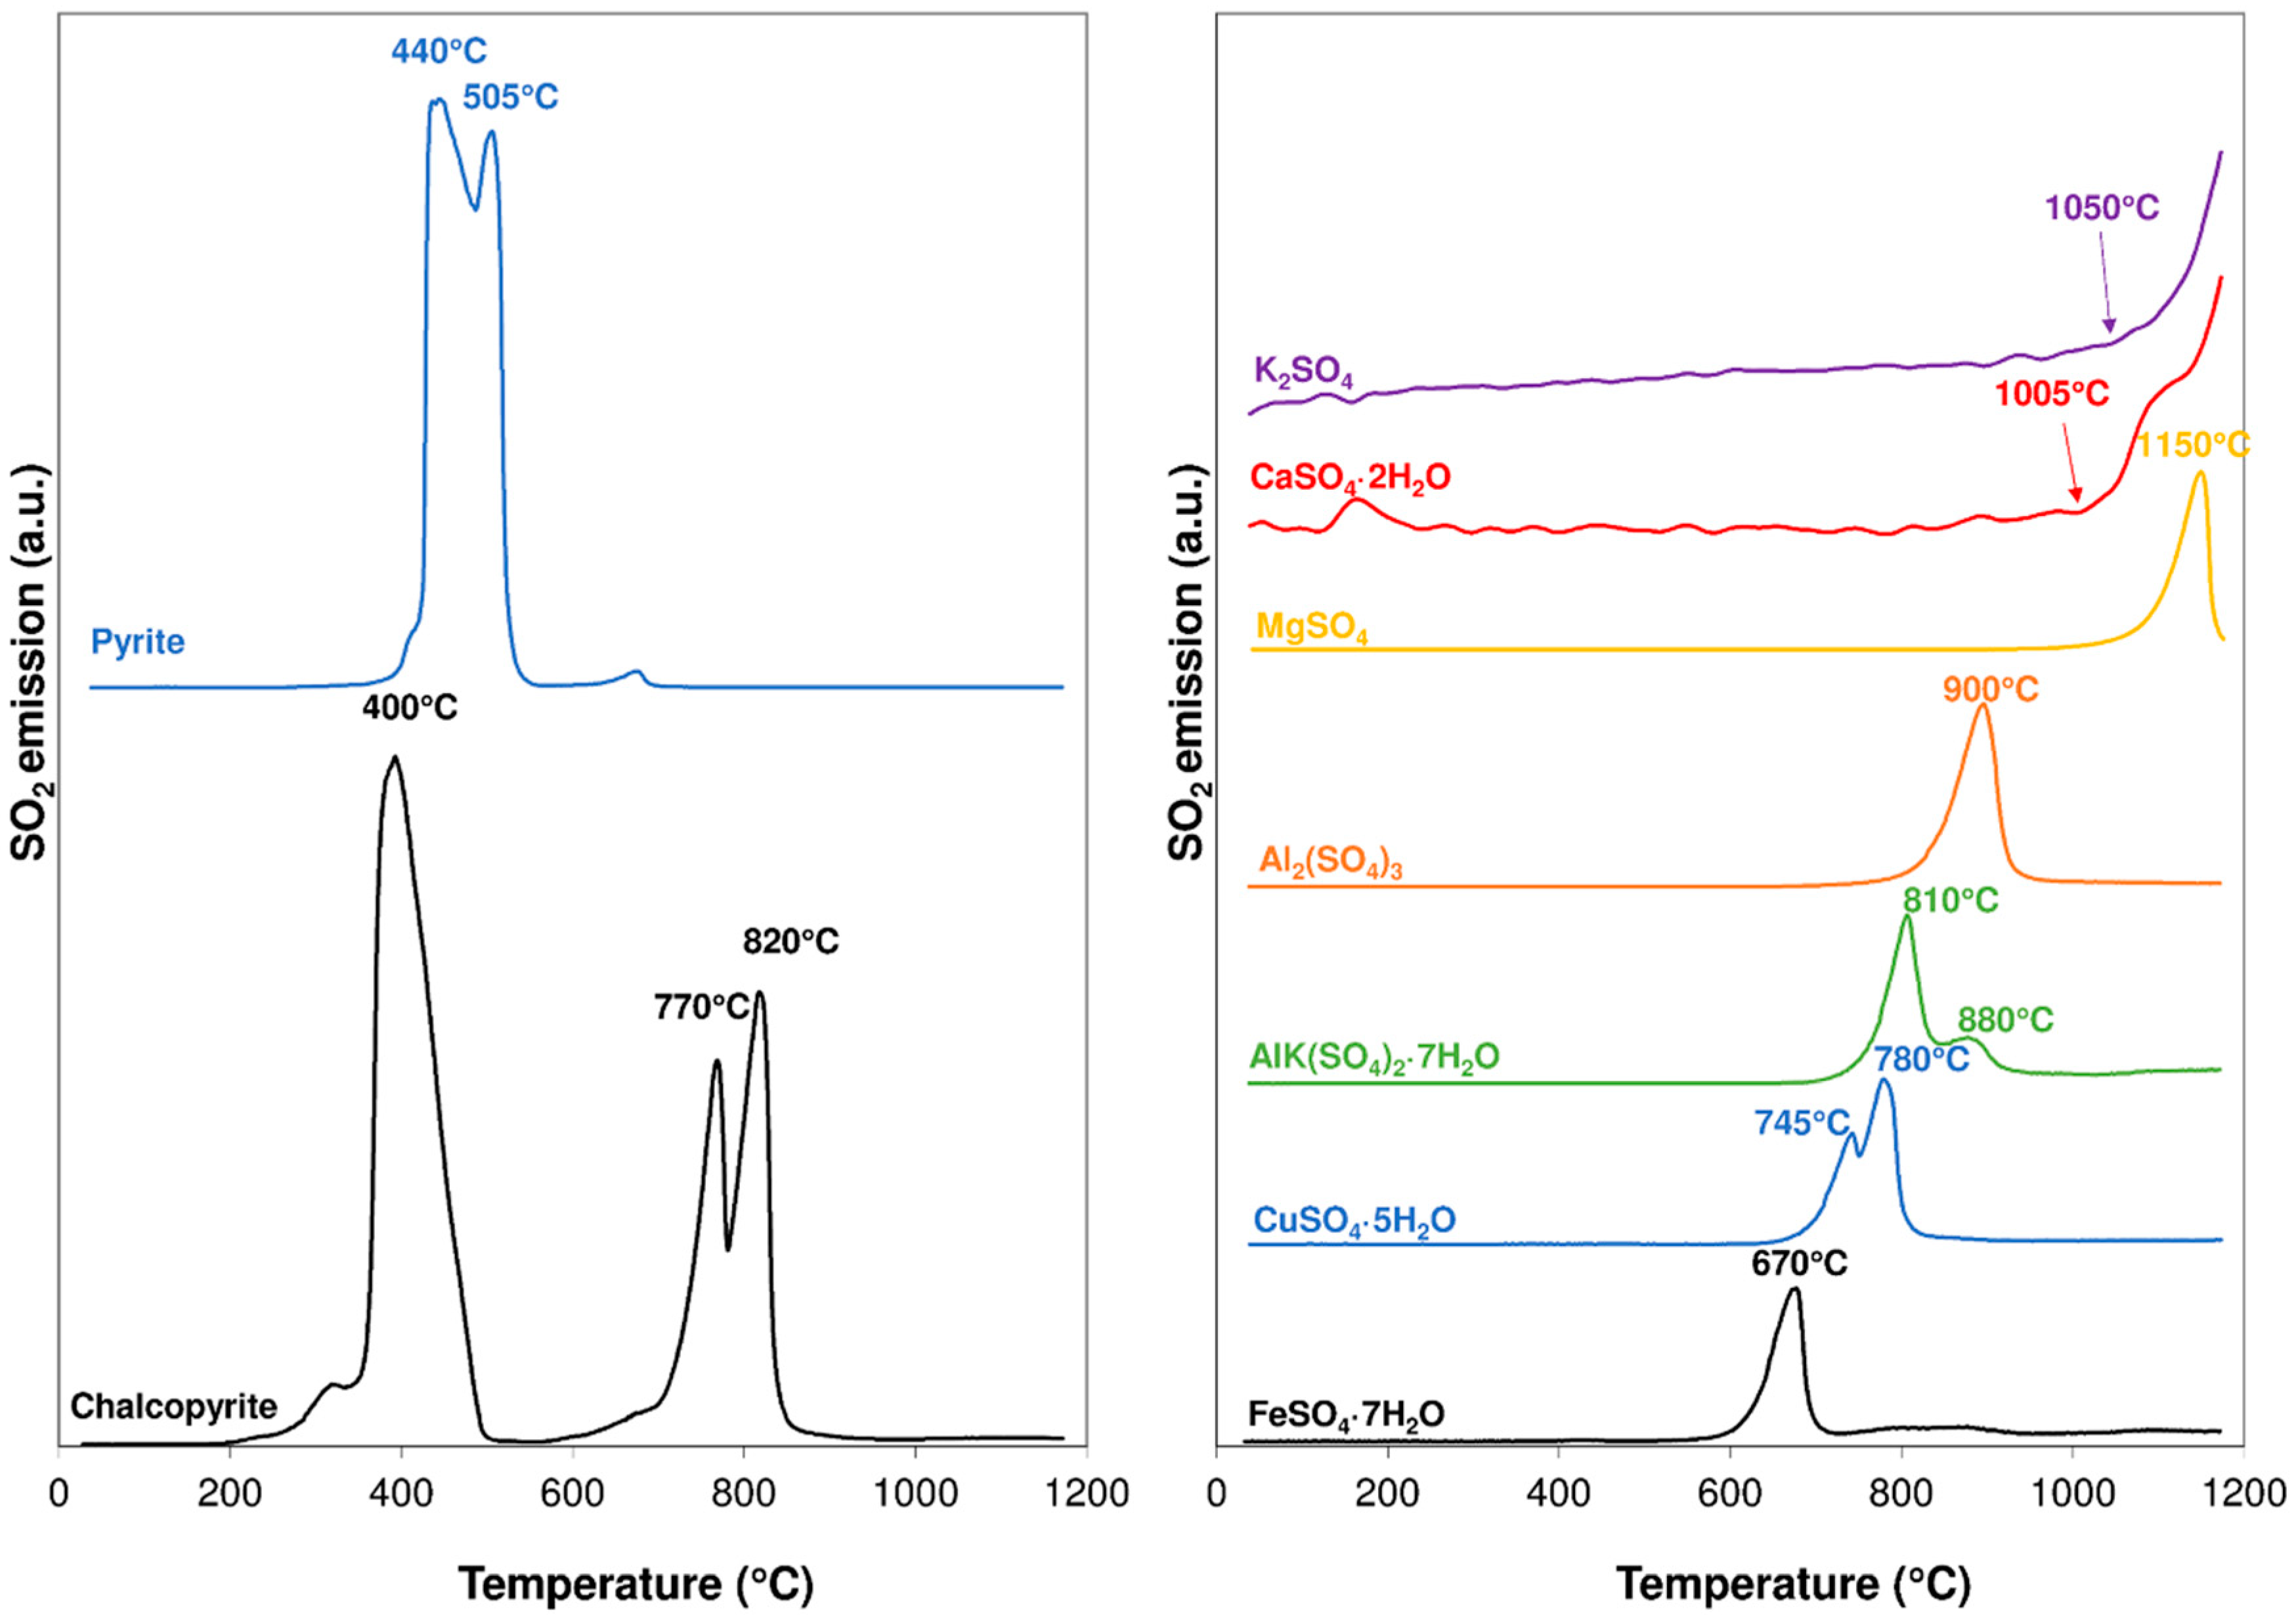
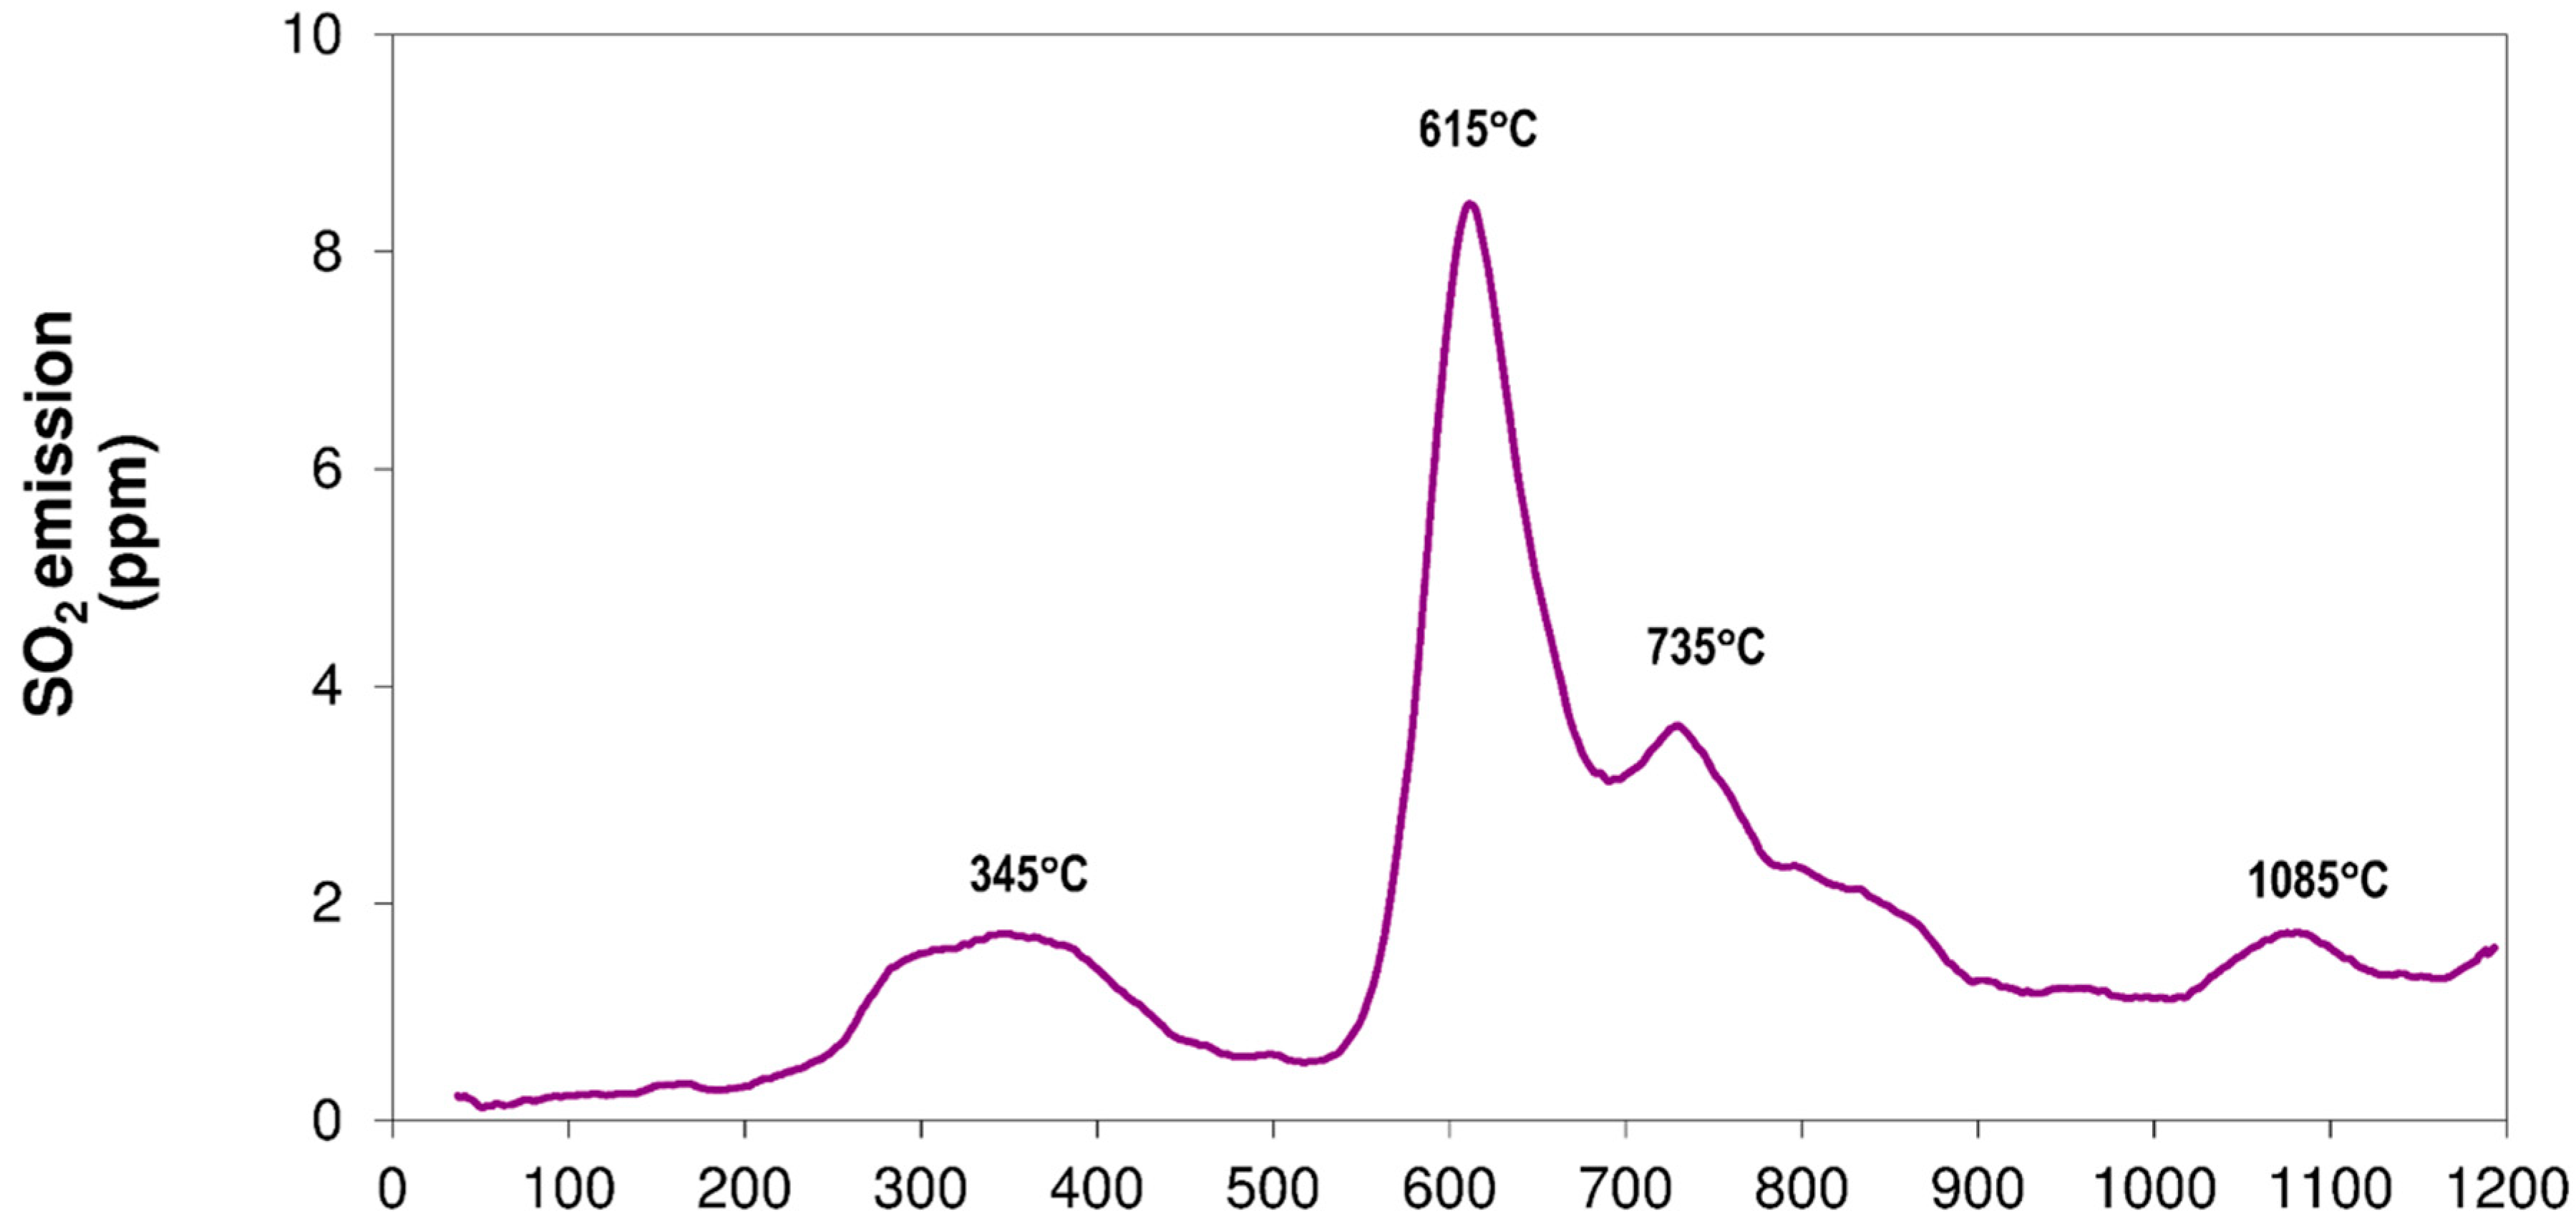
3.1.4. Sulfur Dioxide Emissions

To study the evolution of sulfur compound emissions, SO2 emissions were recorded using the mass spectrometer (Figure 4).
The most common sulfides in the clays for the manufacture of ceramic tiles are pyrite and chalcopyrite. EGA results showed that pyrite presented an emission of SO2 in the range of 400 to 600 °C corresponding to the oxidation and decomposition of sulfide. On the other hand, chalcopyrite showed two important processes: the most important emission that took place in the range of temperatures of 300 and 550 °C was due to the oxidation of chalcopyrite to give CuSO4 and Fe2(SO4)3. Two separated steps were observed in the second emission. In the first step, that started at 630 °C with a maximum peak temperature at 770 °C, it was noted an endothermic stage where the Fe2(SO4)3 formed previously and some CuSO4 decomposed to give CuO and Fe2O3 with the emission of SO2. The second step was registered with a maximum peak emission at 820 °C where part of the CuSO4 decomposed to CuO and SO2 [27,28].
Sulfates are usually present in many clays used in the manufacture of tiles, sometimes at elevated concentrations but often at low concentrations or in the form of impurities. The most frequent sulfates observed in clayey raw material are potassium, aluminum, iron and calcium sulfates, so in this study different sulfates were analyzed using evolved gas analysis. The different sulfates studied showed emission profiles as a function of the decomposition temperature. The sulfates that decomposed at low temperatures (600–1000 °C) were iron sulfate, copper sulfate, aluminum and aluminum and potassium sulfate. Other sulfates analyzed that decomposed at higher temperatures were magnesium sulfate, potassium sulfate and calcium sulfate, which corresponded to alkaline and alkaline earth elements.
The SO2 emission curves exposed in the Figure 4 show how this technique allows us to distinguish between different types of sulfates according to the curve emission and decomposition temperature of each one of them.

3.1.5. Study of Acid Emissions in a Ball Clay

This methodology was applied to a certified reference material, which presents sulfur and carbon as certified value. The certified reference material was BCS-CRM 348 Ball clay and it was selected because these clays are used mainly in the manufacture of ceramic whiteware and they are valued for their properties of plasticity, unfired strength and their light fired color. Plastic ball clays are commonly composed of kaolinite (25–80%), illite and mica (10–30%), and fine-grained quartz. A small amount of organic matter up to 0.5% by mass is also typical. Therefore, this clay will allow the study of emissions during heat treatment.
For the study of this sample, the quantification of the emitted compounds was carried out by relating the ppm of each compound with the area of emission and the maximum temperature at which the emission is produced. In some materials not all the sulfur, chlorine and fluorine content are emitted. For this reason, it is necessary to determine these elements before and after the thermal treatment (Table 3).
On the other hand, Table 4 shows the amounts and percentages of emissions obtained for HCl, HF, SO2 and CO2 compounds during the heating treatment. The results obtained in the emissions study are detailed and interpreted below.
The HCl emission curve had three emission ranges (Figure 5). The first one started approximately at 200 °C with a maximum emission at 315 °C and would correspond to the loss of “bound water”. The second emission range would be related to chlorine molecules that were emitted during the dehydroxylation of the clay mineral with a maximum emission at 595 °C. Finally, the third step was registered at temperatures above 900 °C and would be related to the decomposition of minerals belonging to the mica group. As can be seen, at the end of the heating cycle, the emission of HCl had not finished, so the emission had not been complete.
The HF emission curve (Figure 6) presented two main emission stages corresponding to structural water loss and dehydroxylation of kaolinite. These emissions had maximum peak emission at 320 and 605 °C respectively. A third lower emission was observed at temperatures over 900 °C related to crystal lattice breaks of micas. Similarly to the behavior of chlorine compounds, the emissions of fluorine had not concluded at the end of the heating cycle.
The emission profile of sulfur dioxide was found to be complex due to the different emission stages observed (Figure 7). Firstly, a low temperature emission was observed, with a maximum emission peak at 345 °C that would correspond to the decomposition process of the organic matter present in the sample. Then, a higher emission was observed with an emission peak at 615 °C that would correspond to the presence of iron sulfate. In addition, different emission bands were detected with maximums at 735 and 1085 °C that would be related to the decomposition of sulfates of different natures such as mixed aluminum and potassium sulfates. The SO2 emission profile of the analyzed sample showed that practically all the sulfur present in the sample had been removed during the heat treatment.
The determination of carbon dioxide emissions did not require analysis of the heat-treated sample since both the organic matter and carbonates decompose at temperatures below 1000 °C and at the end of the thermal cycle the emissions have finished. So, to quantify CO2 emissions, from the electrical signal obtained in the mass spectrometer, an emission curve was recorded with the temperature. The emission area was calculated and related to the concentration using two different reference materials, calcium carbonate 1.02410 supplied by MERCK if the sample contains carbonates and GBW07403 if organic matter is present in the material [29].
The sample BCS-CRM 348 Ball clay showed a CO2 emission profile with a single emission stage that started at 220 and ended at 550 °C (Figure 8). The maximum emission recorded at 395 °C would indicate that this emission is due to the combustion of the organic matter present in the sample.
Results obtained for the analyzed clay sample allow us to quantify the acid and carbon dioxide emissions produced by small percentages of minerals with sulfur, chlorine, fluorine and carbon contents in their composition. In addition, the application of this methodology provides the detection of the presence of organic carbon and sulfates that can generate defects in the manufacturing process.
The detection limits of the different techniques used depend on the type of mineral and the matrix in which the analyte is found, so it is complex to assign a general value for detection and error limits. For the study detailed in this research, the detection limits for chlorine and sulfur (with respect to solid) were 50 ppm when analyzed by XRF and 5 ppm when analyzed by EGA. The detection limit for determining fluorine using the selective electrode technique was 10 and 5 ppm when determined by EGA. For organic carbon, the detection limit was 50 ppm when the analysis was performed by coulometry and 1 ppm when it was performed by EGA.
So, the proposed methodology could be applied to study and quantify CO2 and acid emissions in clays and ceramic raw materials.

4. Conclusions

Related to the analyzed clay minerals such as talc, kaolinite, chlorite and mica an emission profile has been obtained for the compounds HCl, SO2, HF and CO2 that includes a wide range of concentrations. The methodology proposed using the evolved gas analysis has proved to be versatile and presents high sensitivity for identifying and quantifying minor phases related to acid emissions in clay minerals. The analytical procedure allows to study thermal processes as oxidation, dehydration, decomposition providing information on the composition of the evolved gases when applying a heat treatment. In the same way it is possible to identify and distinguish the presence of sulfides and sulfates or the presence of carbon of different origin in clayey raw materials according to the temperature at which the decomposition of the mineral occurs even when they are in the form of impurities. It is therefore concluded that the proposed method allows quantification of acidic emissions and minority minerals even when they are found in percentages below 1%.

Author Contributions

The authors had been conducted the following tasks in the research, in addition to the successive revisions of the manuscript: conceptualization, M.P.G.-T. and E.Z.S.; methodology, E.Z.S., M.J.V.V. and E.M.D.-C.; validation, J.G.A. and M.J.V.V.; investigation, E.Z.S. and E.M.D.-C.; resources, E.Z.S.; writing—original draft preparation, E.Z.S. and M.P.G.-T.; writing—review and editing, E.Z.S. and M.P.G.-T.; supervision, M.P.G.-T.; project administration, M.P.G.-T. and J.G.A.; funding acquisition, M.P.G.-T. and J.G.A. All authors have read and agreed to the published version of the manuscript.

Funding

This research was co-funded by the Valencian Institute of Business Competitiveness (IVACE) and the FEDER Funds within the FEDER Operational Program of the Valencian Region 2014–2020, through project IMDEEA/2019/28.

Conflicts of Interest

The authors declare no conflict of interest. The funders had no role in the design of the study; in the collection, analyses, or interpretation of data; in the writing of the manuscript, or in the decision to publish the results.

References

  1. EIPPCB. Integrated Pollution Prevention and Control (IPPC). Reference Document on Best Available Techniques (BATs) in the Ceramic Manufacturing Industry; European Commission, Directorate-general JRC, Joint Research Centre Institute for Prospective Technological Studies (Sevilla). Technologies for Sustainable Development; European IPPC Bureau: Sevilla, Spain, 2007. [Google Scholar]
  2. Norman White, G.; Dixon, J.B.; Weaver, R.M.; Kunkle, A.C. Genesis and morphology of iron sulfides in gray kaolins. Clays Clay Miner. 1991, 39, 70–76. [Google Scholar] [CrossRef]
  3. Gómez-Tena, M.P.; García-ten, J.; Monfort, E.; Zumaquero, E.; Machi, C. Study of sulphur compounds in clays by the TGA-EGA technique. In Proceedings of the 11th International Conference and Exhibition of the European Ceramic Society, Krakow, Poland, 21–25 June 2009; Volume 2, pp. 914–918. [Google Scholar]
  4. Monfort, E.; Celades, I.; Gomar, S.; Rueda, F.; Martínez, J. Characterisation of acid pollutant emissions in ceramic tile manufacture. Bol. Soc. Esp. Cerám. Vidr. 2011, 50, 179–184. [Google Scholar] [CrossRef]
  5. Celades, I.; Gomar, S.; Romero, F.; Chauhan, A.; Delpech, B.; Jouhara, H. Acid emissions monitoring needs in ceramic tile industry: Challenges derived from new policy trends. E3S Web Conf. 2017, 22, 00026. [Google Scholar]
  6. Chipera, S.J.; Bish, D.L. Thermal evolution of fluorine from smectite and kaolinite. Clays Clay Miner. 2002, 50, 38–46. [Google Scholar] [CrossRef]
  7. Romo, L.A.; Roy, R. Studies of the Substitution of OH– by F– in Various Hydroxylic Minerals. Am. Mineral. 1957, 42, 165–177. [Google Scholar]
  8. Fabbri, B. Flúor en las arcillas: Contenidos y mecanismos de emisión. Cerám. Inf. 1992, 33–36. [Google Scholar]
  9. Wu, W.; Xie, Z.; Xu, J.; Liu, C. Characteristics of Fluoride Emission from Five Clay Minerals as Affected by Temperature, Heating Time and Addition of Calcium Compounds. J. Zhejiang Univ. Sci. 2010, 2, 284. [Google Scholar] [CrossRef]
  10. Thomas, J.; Glass, H.D.; White, W.A.; Trandel, R.M. Fluoride content of clay minerals and argillaceous earth materials. Clays Clay Miner. 1977, 25, 278–284. [Google Scholar] [CrossRef]
  11. Palmonari, C.; Timellini, G. Pollutant Emission Factors for the Ceramic Floor and Wall Tile Industry. J. Air Pollut. Control. Assoc. 1982, 32, 1095–1100. [Google Scholar] [CrossRef]
  12. Paulik, J.; Paulik, F.; Arnold, M. Simultaneous TG, DTG, DTA and EGA technique for the determination of carbonate, sulphate, pyrite and organic material in minerals, soil and rocks. J. Therm. Anal. 1984, 29, 345–351. [Google Scholar]
  13. González, I.; Galán, E.; Miras, A.; Vázquez, M.A. CO2 emissions derived from raw materials used in brick factories. Applications to Andalusia (Southern Spain). Appl. Clay Sci. 2011, 52, 193–198. [Google Scholar] [CrossRef]
  14. Frost, R.L.; Vassallo, A.M. The dehydroxylation of the kaolinite clay minerals using infrared emission spectroscopy. Clays Clay Miner. 1996, 44, 635–651. [Google Scholar] [CrossRef]
  15. Materazzi, S.; Gentili, A.; Curini, R. Applications of evolved gas analysis: Part 2: EGA by mass spectrometry. Talanta 2006, 69, 781–794. [Google Scholar] [CrossRef]
  16. Materazzi, S.; Gentili, A.; Curini, R. Applications of evolved gas analysis: Part 1: EGA by infrared spectroscopy. Talanta 2006, 68, 489–496. [Google Scholar] [CrossRef] [PubMed]
  17. Gomez, M.P.; Gazulla, M.F.; Zumaquero, E.; Orduna, M. Use of coupled TG-DSC-QMS-FTIR thermal analysis techniques in characterizating clays and ceramic compositions used in ceramic tile manufacture. Quantification of carbon compounds. Bol. Soc. Esp. Cerám. Vidr. 2007, 46, 259–266. [Google Scholar]
  18. Gazulla, M.F.; Gómez, M.P.; Orduña, M.; Rodrigo, M. New methodology for sulfur analysis in geological samples by WD-XRF spectrometry. X-Ray Spectrom. 2009, 38, 3–8. [Google Scholar] [CrossRef]
  19. Gazulla, M.F.; Vicente, S.; Orduña, M.; Ventura, M.J. Chemical analysis of very small-sized samples by wavelength-dispersive X-ray fluorescence. X-Ray Spectrom. 2012, 41, 176–185. [Google Scholar] [CrossRef]
  20. Monfort, E.; García-Ten, J.; Celades, I.; Gazulla, M.F.; Gomar, S. Evolution of fluorine emissions during the fast firing of ceramic tile. Appl. Clay Sci. 2008, 38, 250–258. [Google Scholar] [CrossRef]
  21. Gazulla, M.F.; Rodrigo, M.; Orduña, M.; Ventura, M.J. Fluorine determination in glasses and glazes by WD-XRF. In Glass Technology—European Journal of Glass Science and Technology; Society of Glass Technology: Sheffield, UK, 2015; Volume 56, pp. 95–101. [Google Scholar]
  22. Maritan, L.; Nodari, L.; Mazzoli, C.; Milano, A.; Russo, U. Influence of firing conditions on ceramic products: Experimental study on clay rich in organic matter. Appl. Clay Sci. 2006, 31, 1–15. [Google Scholar] [CrossRef]
  23. Morgan, D.J. Simultaneous DTA-EGA of minerals and natural mineral mixtures. J. Therm. Anal. 1977, 12, 245–263. [Google Scholar] [CrossRef]
  24. Parsons, A.J.; Inglethorpe, S.D.J.; Morgan, D.J.; Dunham, A.C. Evolved gas analysis (EGA) of brick clays. J. Therm. Anal. 1997, 48, 49–62. [Google Scholar] [CrossRef]
  25. Tressaud, A. Fluorine and the Environment: Atmospheric Chemistry, Emissions & Lithosphere; Advances in Fluorine Science; Elsevier Science: Amsterdam, The Netherlands, 2006; ISBN 9780080463759. [Google Scholar]
  26. Kennedy, B.A.; Kennedy, B.A. Society for Mining, Metallurgy, and Exploration (U.S.). In Surface Mining, 2nd ed.; Society for Mining, Metallurgy, and Exploration: Littleton, CO, USA, 1990; ISBN 9780873351027. [Google Scholar]
  27. Hatakeyama, T.; Liu, Z. Handbook of Thermal Analysis; Wiley: New York, NY, USA, 1998; ISBN 0471983632. [Google Scholar]
  28. Prasad, S.; Pandey, B.D. Thermoanalytical studies on copper-iron sulphides. J. Therm. Anal. Calorim. 1999, 58, 625–637. [Google Scholar] [CrossRef]
  29. Gómez-Tena, M.P.; Gazulla, M.F.; Zumaquero, E.; Orduña, M. Utilización de técnicas acopladas de análisis TG-DSC-FTIR-MS en la caracterización de arcillas. Cuantificación de compuestos de carbono. In XLVI Congreso Anual de la Sociedad Española de Cerámica y Vidrio; Faenza Editrice Iberica: Castellón de la Plana, Spain, 2006; p. 68. ISBN 84-87683-33-9. [Google Scholar]
Figure 1. CO2 emission evolution of analyzed samples.
Minerals 10 00824 g001
Figure 2. HF emission evolution of analyzed samples.
Minerals 10 00824 g002
Figure 3. HCl emission evolution of analyzed samples.
Minerals 10 00824 g003
Figure 4. SO2 emission evolution of analyzed samples.
Minerals 10 00824 g004
Figure 5. HCl curve emission for sample BCS-CRM 348 Ball clay.
Minerals 10 00824 g005
Figure 6. HF curve emission for sample BCS-CRM 348 Ball clay.
Minerals 10 00824 g006
Figure 7. SO2 curve emission for sample BCS-CRM 348 Ball clay.
Minerals 10 00824 g007
Figure 8. CO2 curve emission for sample BCS-CRM 348 Ball clay.
Minerals 10 00824 g008
Table 1. Compounds studied with the evolved gas analysis (EGA) technique.
CompoundMolecular FormulaReference
Pyrite (Iron disulfide) (>98%)FeS242633, Alfa-Aesar
Chalcopyrite (Copper iron sulfide) (>98%)CuFeS242533, Alfa-Aesar
Gypsum (Calcium sulfate dihydrate) (≥99%)CaSO4·2H2OC3771, Sigma-Aldrich
Magnesium sulfate (≥98%)MgSO463136, Fluka
Chalcanthite (Copper (II) sulfate pentahydrate) (99.995%)CuSO4·5H2O469130, Sigma-Aldrich
Melanterite (Iron (II) sulfate heptahydrate) (≥99%)FeSO4·7H2OF7002, Sigma-Aldrich
Aluminum sulfate (99.99%)Al2(SO4)3202614, Sigma-Aldrich
Arcanite (Potassium sulfate) (≥99.9%)K2SO4P0772, Sigma-Aldrich
Sodium chloride (≥99%)NaCl746398, Sigma-Aldrich
Calcium chloride (≥99%)CaCl2793639, Sigma-Aldrich
Ammonium chloride (≥99.5%)NH4Cl213330, Sigma-Aldrich
Magnesium fluoride (99.9%)MgF2142360, Panreac
Calcium fluoride (Fluorite) (>99%)CaF201123, Riedel-de Häen
Sodium fluoride (>98.5%)NaF141675, Panreac
Aluminum fluoride (99.8%)AlF3449628, Sigma-Aldrich
Calcite (>99.95%)CaCO31.02410, Merck
Dolomite, naturally occur. mineral (>98%)CaMg(CO3)242526, Alfa-Aesar
Muscovite, naturally occur. mineral (>95%)KAl2(AlSi3O10)(OH)242470, Alfa-Aesar
Hydrobiotite, natural mineralK(Mg,Fe2+)6((Si,Al)8O20)(OH)4·nH2OMálaga deposit
Rubellan biotite, natural mineralK(Mg,Fe++)3[AlSi3O10(OH,F)2]Málaga deposit
Clinochlore, natural mineral(Mg,Fe)5Al(Si3Al)O10(OH)8Málaga deposit
Kaolinite K1512 (>98%)Al2Si2O5(OH)4K1512, Sigma-Aldrich
TalcMg3Si4O10(OH)2LR-1T-35AN, Lorda-Roig
Table 2. Reference materials used in this study and suppliers of these materials.
CompoundSupplier% C% S
CalciteMerck12.00 ± 0.01<0.01
GBW07403 (Soil)CMSI0.51 ± 0.03 10.0123 ± 0.0014
BCS-CRM 348 (Ball Clay)Bureau of Analysed Samples Ltd1.640.1
1 Organic Carbon.
Table 3. Determined values of chlorine, fluorine, sulfur and organic carbon in the sample BCS-CRM 348.
Chlorine (mg/kg)Fluorine (mg/kg)Sulfur (mg/kg)Organic Carbon (%)
OriginalCalcinedOriginalCalcinedOriginalCalcinedOriginalCalcined
6010620601000<501.64<0.01
Table 4. Emission values at 1200 °C.
HCl EmissionHF EmissionSO2 EmissionCO2 Emission
mg/kg% Emittedmg/kg% Emittedmg/kg% Emitted%% Emitted
5182590901900956100

