Article

Mechanical Activation on Bioleaching of Chalcopyrite: A New Insight

1
School of Minerals Processing and Bioengineering, Central South University, Changsha 410083, China
2
Key Lab of Biometallurgy of Ministry of Education of China, Central South University, Changsha 410083, China
3
College of Resources, Environment and Materials, Guangxi University, Nanning 530004, China
4
School of Metallurgy, Northeastern University, Shenyang 110819, China
*
Authors to whom correspondence should be addressed.
These authors have equally contributed to this work.
Minerals 2020, 10(9), 788; https://doi.org/10.3390/min10090788
Submission received: 6 August 2020 / Revised: 3 September 2020 / Accepted: 4 September 2020 / Published: 7 September 2020
(This article belongs to the Collection Bioleaching)

Abstract

:
Mechanical activation as a means of accelerating the mineral dissolution may play an important role in chalcopyrite bioleaching. In the present work, the mechanical activation by ball-milling with 10 min, 30 min, 60 min, 90 min, 120 min and 180 min time periods of bioleaching of chalcopyrite was studied, and then evaluated by a Density Functional Theory (DFT) calculation. The results showed that the specific surface area increased sharply in the very beginning of mechanical activation and then increased slowly until the agglomeration of the particles occurred, while the chalcopyrite lattices increased with the mechanical activation. The reaction activity analyzed by cyclic voltammetry (CV) increased slowly in 30 min, increased quickly in the following 90 min, and then decreased, while the hydrophobicity analyzed by contact angles of the chalcopyrite after activation showed less of a change. The results showed that after 15 days of bioleaching, the Cu leaching by Sulfobacillus thermosulfidooxidans (S. thermosulfidooxidans) increased from 9.39% in the 0 min of mechanical activation to 87.41% in the 120 min of mechanical activation, and the copper leaching rate increased by about 78%. The DFT results provide solid proof that the activated chalcopyrite can be adsorbed more easily by cells with higher adsorption energies and stronger bonds.

1. Introduction

Chalcopyrite (CuFeS2), an abundant copper mineral, accounts for almost 70% of the copper resources and is a strategic nonferrous metal resource to be further developed [1,2,3]. In nature, chalcopyrite is associated with complex and low-grade ores that cannot be extracted by traditional pyrometallurgy, a process of metallurgy at high temperatures [4]. Bioleaching, a process that utilizes microorganisms for recovering value-added metals from minerals at low temperatures [5], can extract Cu from low-grade chalcopyrite in a cost-effective and eco-friendly manner [5,6,7,8,9]. However, the bioleaching rate of chalcopyrite is low because of the high lattice energy of chalcopyrite [10], which makes it difficult for chalcopyrite to be oxidized by bacteria during bioleaching. Therefore, finding an effective method to destroy the lattice and promote the bioleaching rate of chalcopyrite would be of great significance.
Mechanical activation by means of grinding minerals with different size balls is a method to destruct the structure of solid substances [11], and thus accelerate the dissolution of minerals [12]. The use of mechanical activation can enhance the hydrometallurgical processes [13]. It is known that mechanical activation by grinding may not only reduce the particle size, and thus significantly increase the specific surface area of the material, but also may change the lattice parameter and cause crystal structure distortion [12,14,15,16]. It is important to note that mechanical activation can destroy the passivation layer on the minerals’ surface and lower the activation energy; thus, it promotes the leaching rate of minerals [17]. Tan Q et al., [18] found that mechanical activation could largely increase the Tb leaching rate with an evident increase in the apparent reaction rate (kap) of leaching; Xu Y et al. [19] reported that mechanical activation pretreatment of boron concentrate notably improved the leaching rate of B2O3; and Zhao Z et al. [16] found that the mechanical activation highly improved the activity of pyrrhotite and remarkably accelerated the leaching rate. There are some studies [15,20,21,22] focused on mechanical activation for chalcopyrite chemical leaching, but few studies for chalcopyrite bioleaching.
In this study, the effect and the mechanism of mechanical activation by ball-milling of bioleaching of chalcopyrite are investigated. The interactions between the functional groups of cells and chalcopyrite are also elucidated by Density Functional Theory (DFT), a useful method to unravel the interactions between the small molecules and material surfaces [23,24,25,26,27,28]. Extracellular polymeric substances (EPS) are generally very important in bacterial adhesion processes [29,30], and glucose is a major sugar component in EPS for the bioleaching bacteria [30,31,32,33,34]. Therefore, we utilize glucose to simulate the interactions by DFT. Overall, this study may help us to find an effective pre-treatment to improve the bioleaching rate of chalcopyrite and understand the mechanism therein.

2. Materials and Methods

2.1. Strain and Culture Medium

The bacteria, Sulfobacillus thermosulfidooxidans YN22 (S. thermosulfidooxidans) comes from the School of Minerals Processing and Bioengineering. The basal medium (9K) for the experiments consisted of the following components: (NH4)2SO4 (3.00 g/L), K2HPO4 (0.50 g/L), KCl (0.10 g/L), MgSO4·7H2O (0.50 g/L), Ca (NO3)2 (0.01 g/L).

2.2. Mechanical Activation

The chalcopyrite concentrate was bought from MingfaYe’s mineral museum in Guangzhou City, Guangdong Province, China. Chemical analysis shows that the chalcopyrite sample contained (w/w) 35.8% Cu, 31.0% Fe, 29.3% S. The X-ray diffraction spectra (XRD, see in Figure 2b) results show that the chalcopyrite sample is pure.
The size fraction of the chalcopyrite particles was 200 to 400 mesh (38–74 μm) after crushing and sieving. Then, the chalcopyrite sample was mechanically activated in a planetary ball mill (UBE-V 0.4 L, DECO, ChangSha, China) loaded with 15 stainless steel balls of 20 mm diameter and milling with a ball to powder mass ratio of 20:1 at a rotation speed of 450 r/min for 10 min, 30 min, 60 min, 90 min, 120 min and 180 min, respectively [22].

2.3. Characterization of the Structure and Properties of Chalcopyrite

The particle size distribution of chalcopyrite sample in pure water before and after mechanical activation was analyzed by using a laser particle sizer (Mastersizer 2000, Malvern, UK) to get the mean particle diameter and specific surface area. The change in the lattices and structure with activation time was measured by XRD (PANalytical, Eindhoven, The Netherlands), and the data were analyzed by JADE 5.0 software. The change in morphology with activation time was analyzed by using a FEI Nano230 scanning electron microscope (SEM) (Nova™ NanoSEM 230, FEI, Hillsboro, OR, USA) at 30 kV. The contact angles with activation time were analyzed by using the JJC-I wetting angle measuring instrument (Changchun Optics Factory, Changchun, China) to get the change in hydrophobicity.
The cyclic voltammetry (CV) was performed in 9K medium (pH 2.0) in an electrochemical working station (INTERFACE 1010E, Gamry, Princeton, NJ, USA), loaded with a tri-electrode system: chalcopyrite slice as the working electrode, Ag/AgCl as the reference electrode, and carbon rods as the counter electrode. Before the CV was performed, 1.05 g chalcopyrite sample was mixed with 0.3 g graphite and 0.15 g solid paraffin, and then compressed at 120 kPa for 10 min. The forward CV was scanned from −1.0 V to +1.0 V, and the reverse CV from +1.0 V to −1.0 V at a scan rate of 20 mV/s. Both the forward CV and reverse CV scans began at the open circuit potential (OCP).

2.4. Bioleaching Experiments

The chalcopyrite samples with different mechanical activation times of 0–180 min were used as the energy substrate for bioleaching experiments with a pulp density of 1% (w/v) and 200 μL yeast (10%) was added as the energy source. All of the leaching experiments were performed in 250 mL Erlenmeyer flasks containing 100 mL of sterilized 9K medium, which was adjusted to pH 2.0 by sulfuric acid. The inoculation concentration was 4 × 10⁷ mL−1, and the bacteria were incubated in a rotary shaker at 170 rpm and 45 °C. The relevant bioleaching parameters (cell concentration, pH, ORP, [Cu2+], [Fe3+], total [Fe] and adsorption curve) were determined. All of the experiments were performed in triplicate.
The cell concentration was determined by a microscope (Olympus CX31) with bacteria counting chamber, the pH was determined by a pH meter (PHS-3C), and the redox potential was measured by a platinum (Pt) electrode (Ag0/AgCl reference). After diluting the leaching solution with pH 2.0 ultrapure water, the [Cu2+] was determined by inductively coupled plasma-optical emission spectroscopy (ICP-OES) (SPECTROBLUE FMX26, Philadelphia, PA, USA), while [Fe3+] and total [Fe] were determined by 5-sulfosalicylic acid spectrophotometry [35]. The adsorption quantity of S. thermosulfidooxidans on chalcopyrite was calculated from the difference in cell concentrations in suspension before and after adsorption with the initial inoculation amount of 109/mL.

2.5. Computational Details

The crystal structure of chalcopyrite is shown in Figure 1, which belongs to the space group I-42D [36]. All of the DFT calculations were performed by using CASTEP and GGA-PBE. Only the valence electrons were considered explicitly by using ultrashort pseudopotentials [37]. Based on the results of convergence test, the cut-off energy of 450 eV and k-points of 2 × 2 × 1 were used for all of the calculations. After getting the S-terminal chalcopyrite (0 0 1) surface, the most stable surface of chalcopyrite [38,39], a 2 × 2 × 1 supercell was built with a vacuum slab of 15 Å [40]. In all of the slab calculations, the top three surface layers of S-Fe(Cu)-S were allowed to relax while the other layers remained fixed at positions consistent with bulk chalcopyrite. Glucose was placed inside a 15 × 15 × 15 Å slab for optimization. The convergence tolerances were set to the maximum displacement of 0.002 Å; the maximum force of 0.08 eV/Å, the maximum energy change of 2.0 × 10⁻⁵ eV/atom and the maximum stress of 0.1 GPa, while the SCF convergence tolerance was set to 2.0 × 10⁻⁶ eV/atom. Spin polarized was considered for all of the calculations.
The adsorption energies (Eads) of the adsorbate, glucose, and on the chalcopyrite (0 0 1) surface can be determined using the following equation:
Eads = E(chalcopyrite-glucose) − (Echalcopyrite + Eglucose)
where Echalcopyrite, Eglucose, and E(chalcopyrite-glucose) represent the total energies for the chalcopyrite (0 0 1) surface, glucose, and the chalcopyrite-glucose system, respectively.

3. Results and Discussion

3.1. Structure and Properties of Chalcopyrite

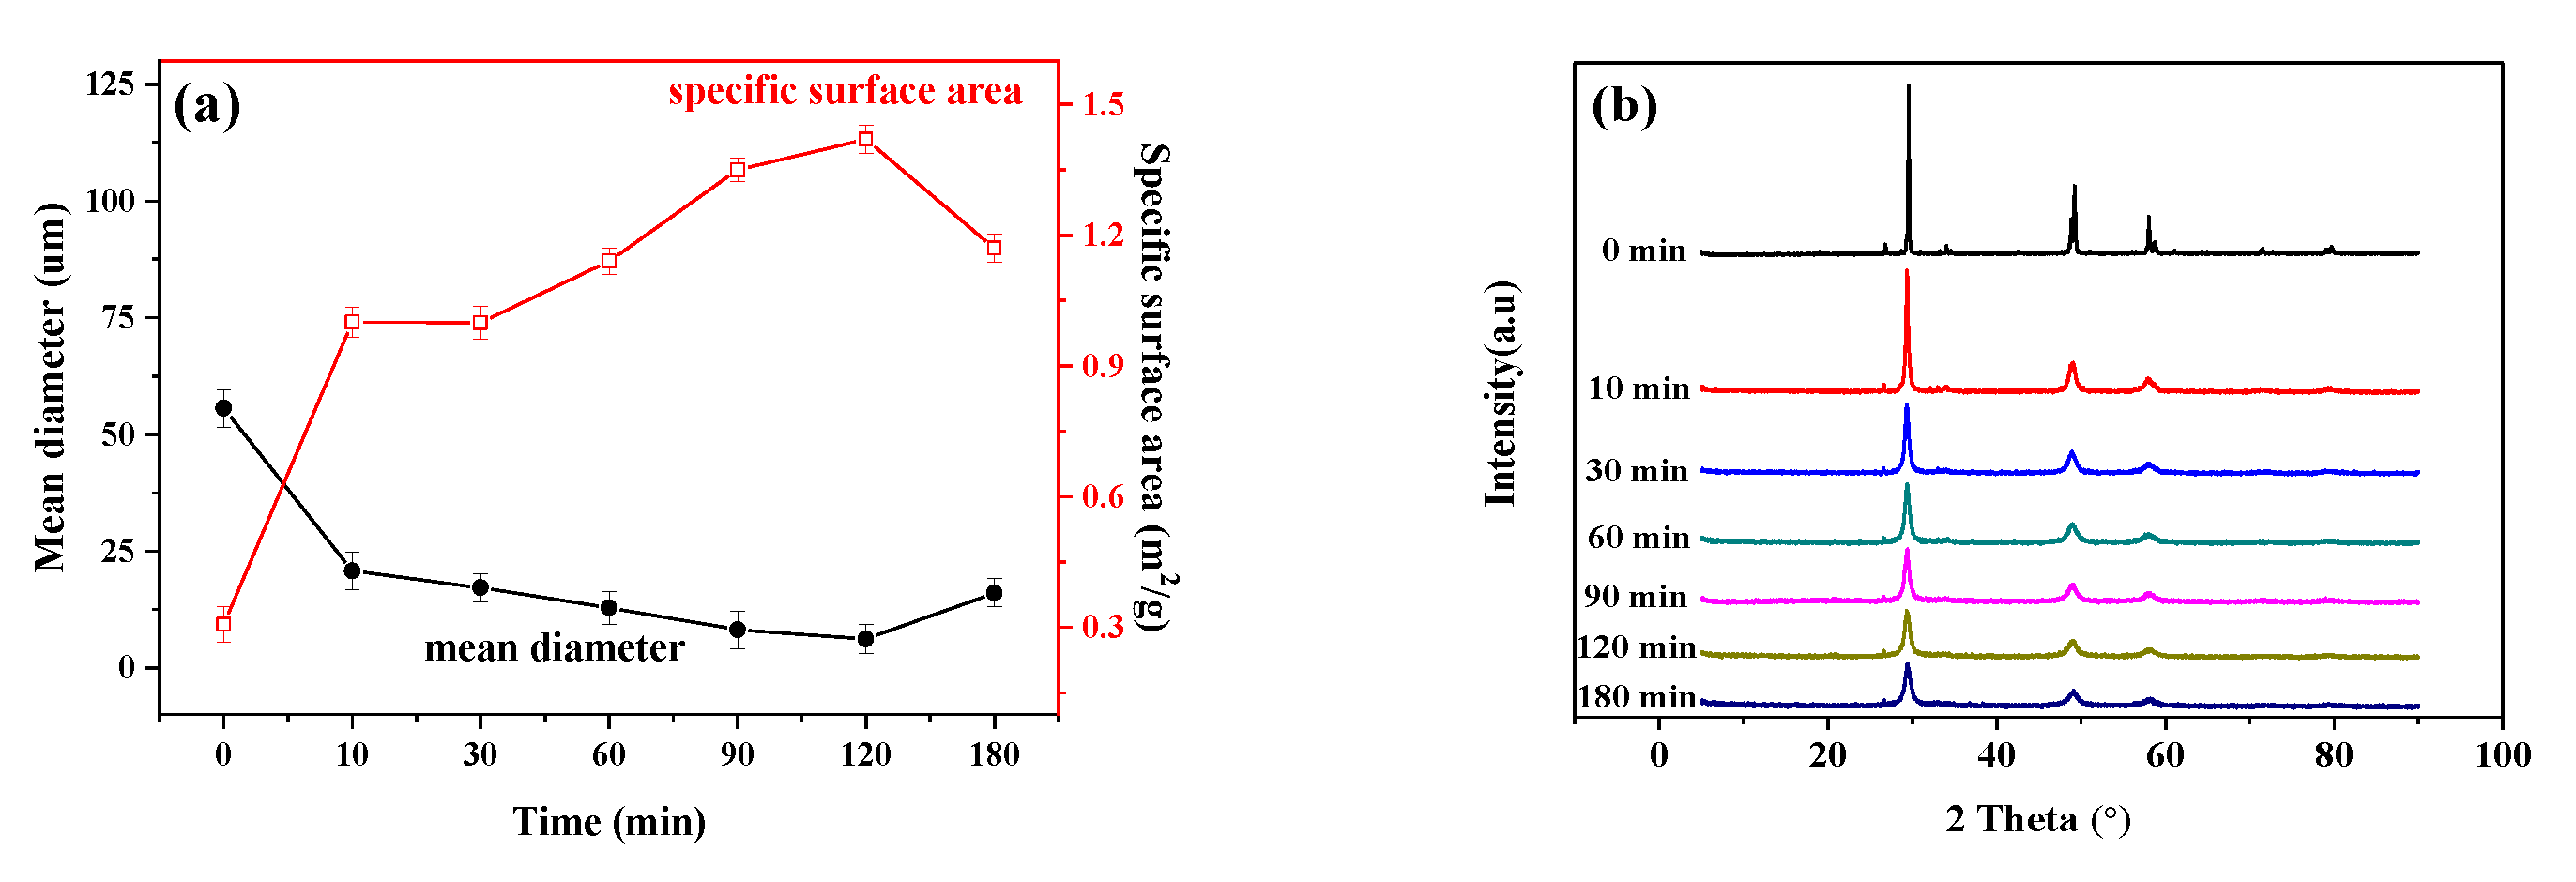
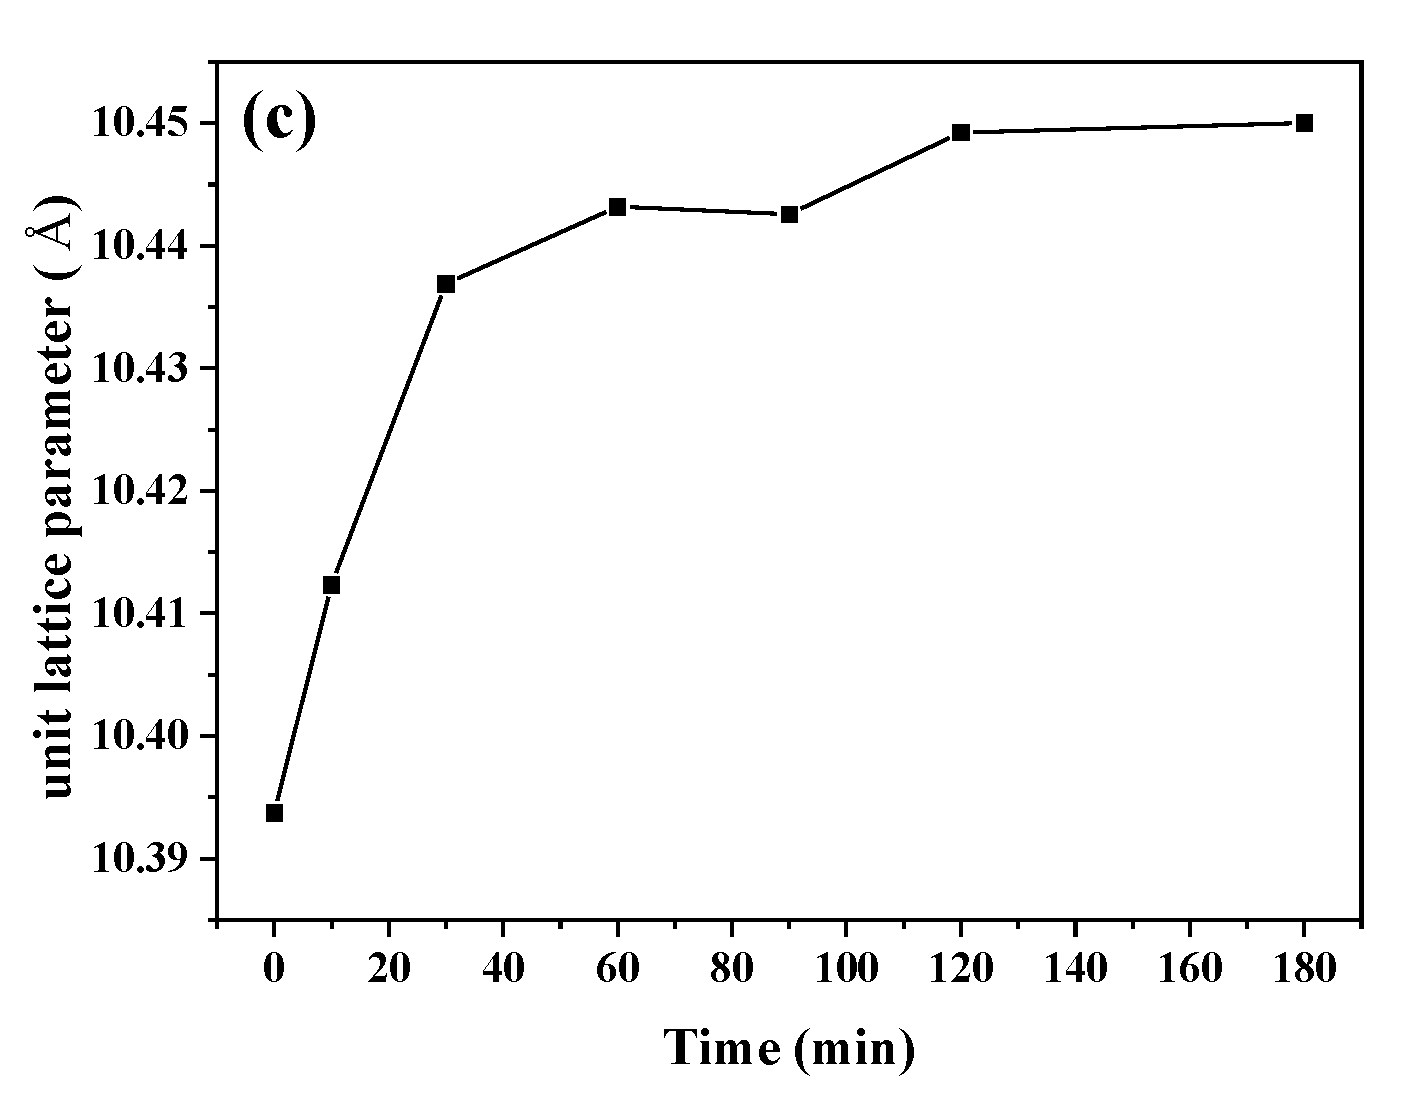
3.1.1. Mean Diameter, Specific Surface Area and X-ray Diffraction Analysis

The change in mean diameter (Figure 2a) shows that during the grinding process, the mean diameter of chalcopyrite decreases sharply with ball-milling in 10 min, followed by a gradual decrease until 180 min, when a slight increase occurs due to the agglomeration of the particles [16]. The change in specific surface area (Figure 2a) is contrary to that observed for the mean diameter.
The XRD results (Figure 2b,c) show that during the mechanical activation process, there are no changes in 2θ angles of the peaks, indicating that no new substances are formed. Moreover, the strength of the diffraction peaks gradually decreases and widens, which may be due to the destruction of the chalcopyrite crystal structure into an unfixed structure [11,15]. Figure 2c further shows that the lattice parameter increases rapidly with ball-milling in 30 min, followed by a slow increase (from 30 min to 120 min), and then stabilizes at a constant value (from 120 min to 180 min). These results indicate that during the mechanical activation process, defects on the chalcopyrite surface occurred [22]. This finding is the basis used for building the chalcopyrite surface models in the DFT calculations.

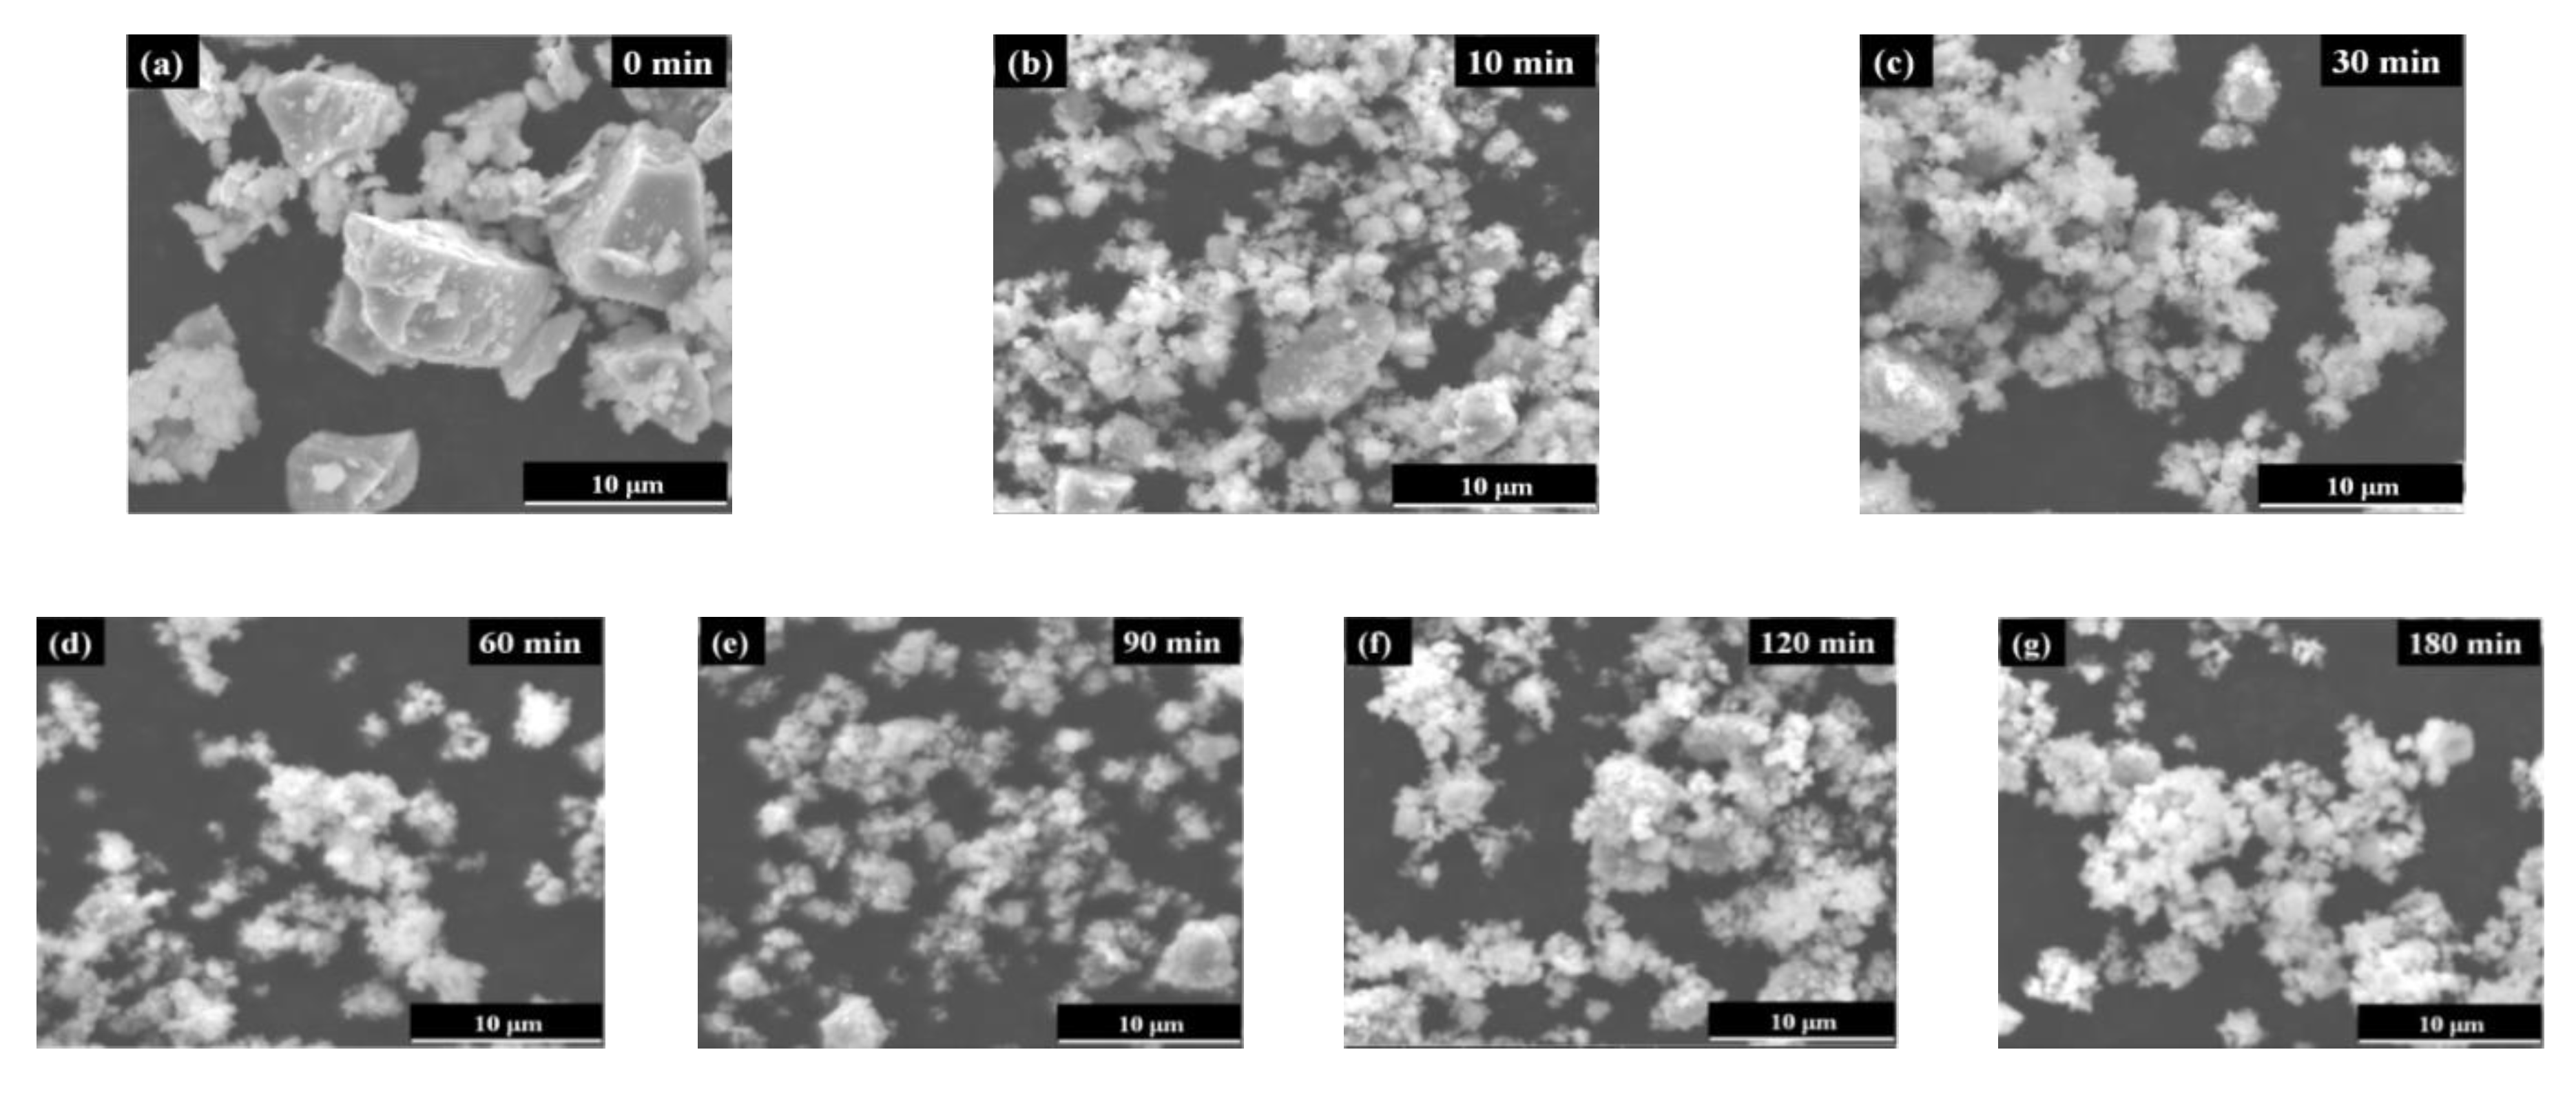
3.1.2. Morphological Analysis

The SEM results (Figure 3) show that the activated chalcopyrite particle sizes gradually decrease with the surface becoming rough in comparison with that of the unactivated chalcopyrite. During the grinding process, the chalcopyrite particles size decrease until 180 min, when a slight increase occurs due to the agglomeration of the particles. This result is consistent with that of the mean diameter analysis (Figure 2a).

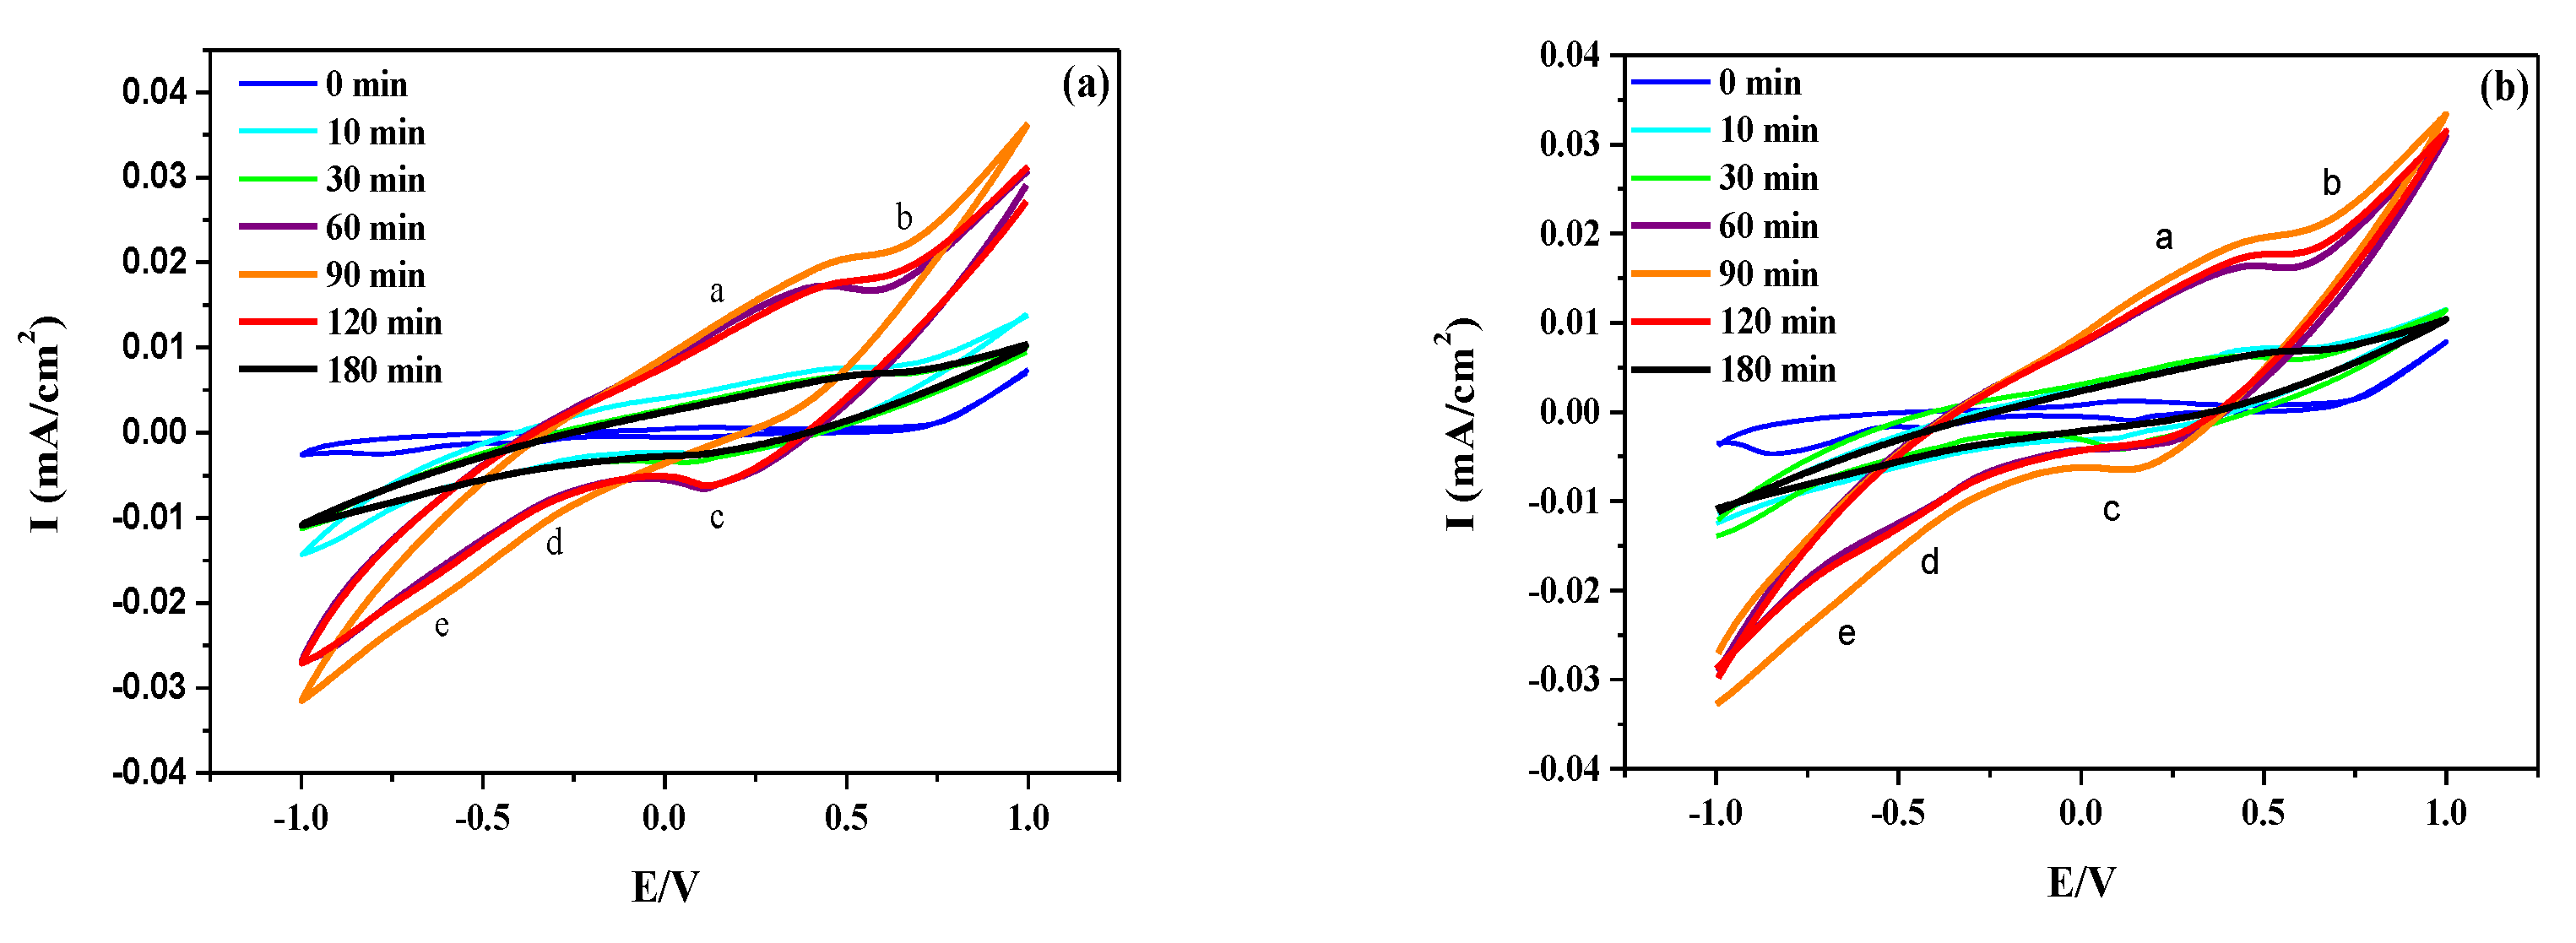
3.1.3. Surface Hydrophobicity and Redox Properties

Table 1 shows that the contact angle obtained by droplet contact angle measurement does not change significantly at different activation times, indicating that the mechanical activation does not change the chalcopyrite surface hydrophobicity.
The surface redox properties measured by CV (Figure 4a,b) show that during the grinding process, the current of chalcopyrite increases slowly with ball-milling in 30 min, followed by a rapid increase until 120 min, when a sharp decrease occurs due to the agglomeration of chalcopyrite. This indicates that the reaction activity increases slowly in 30 min, then increases rapidly in the following 90 min, and decreases after that. The anodic peak a in the range of 200 mV to 400 mV can be assigned to copper oxidation [41]. In addition, peak b in the range of 600 mV to 800 mV to the formation of covellite [10,42]. The cathodic peak c (200 mV to 400 mV) can be associated with the reduction of covellite forms during the oxidation [41,43], and peaks d, e (−700 mV to 0 mV) to the reduction of bornite or covellite and copper(I) to metallic copper [44,45], respectively. These results indicate that mechanical activation can promote the surface redox, and thus accelerate the dissolution of chalcopyrite, which may function in reducing the passivation of the secondary products during the bioleaching [46].

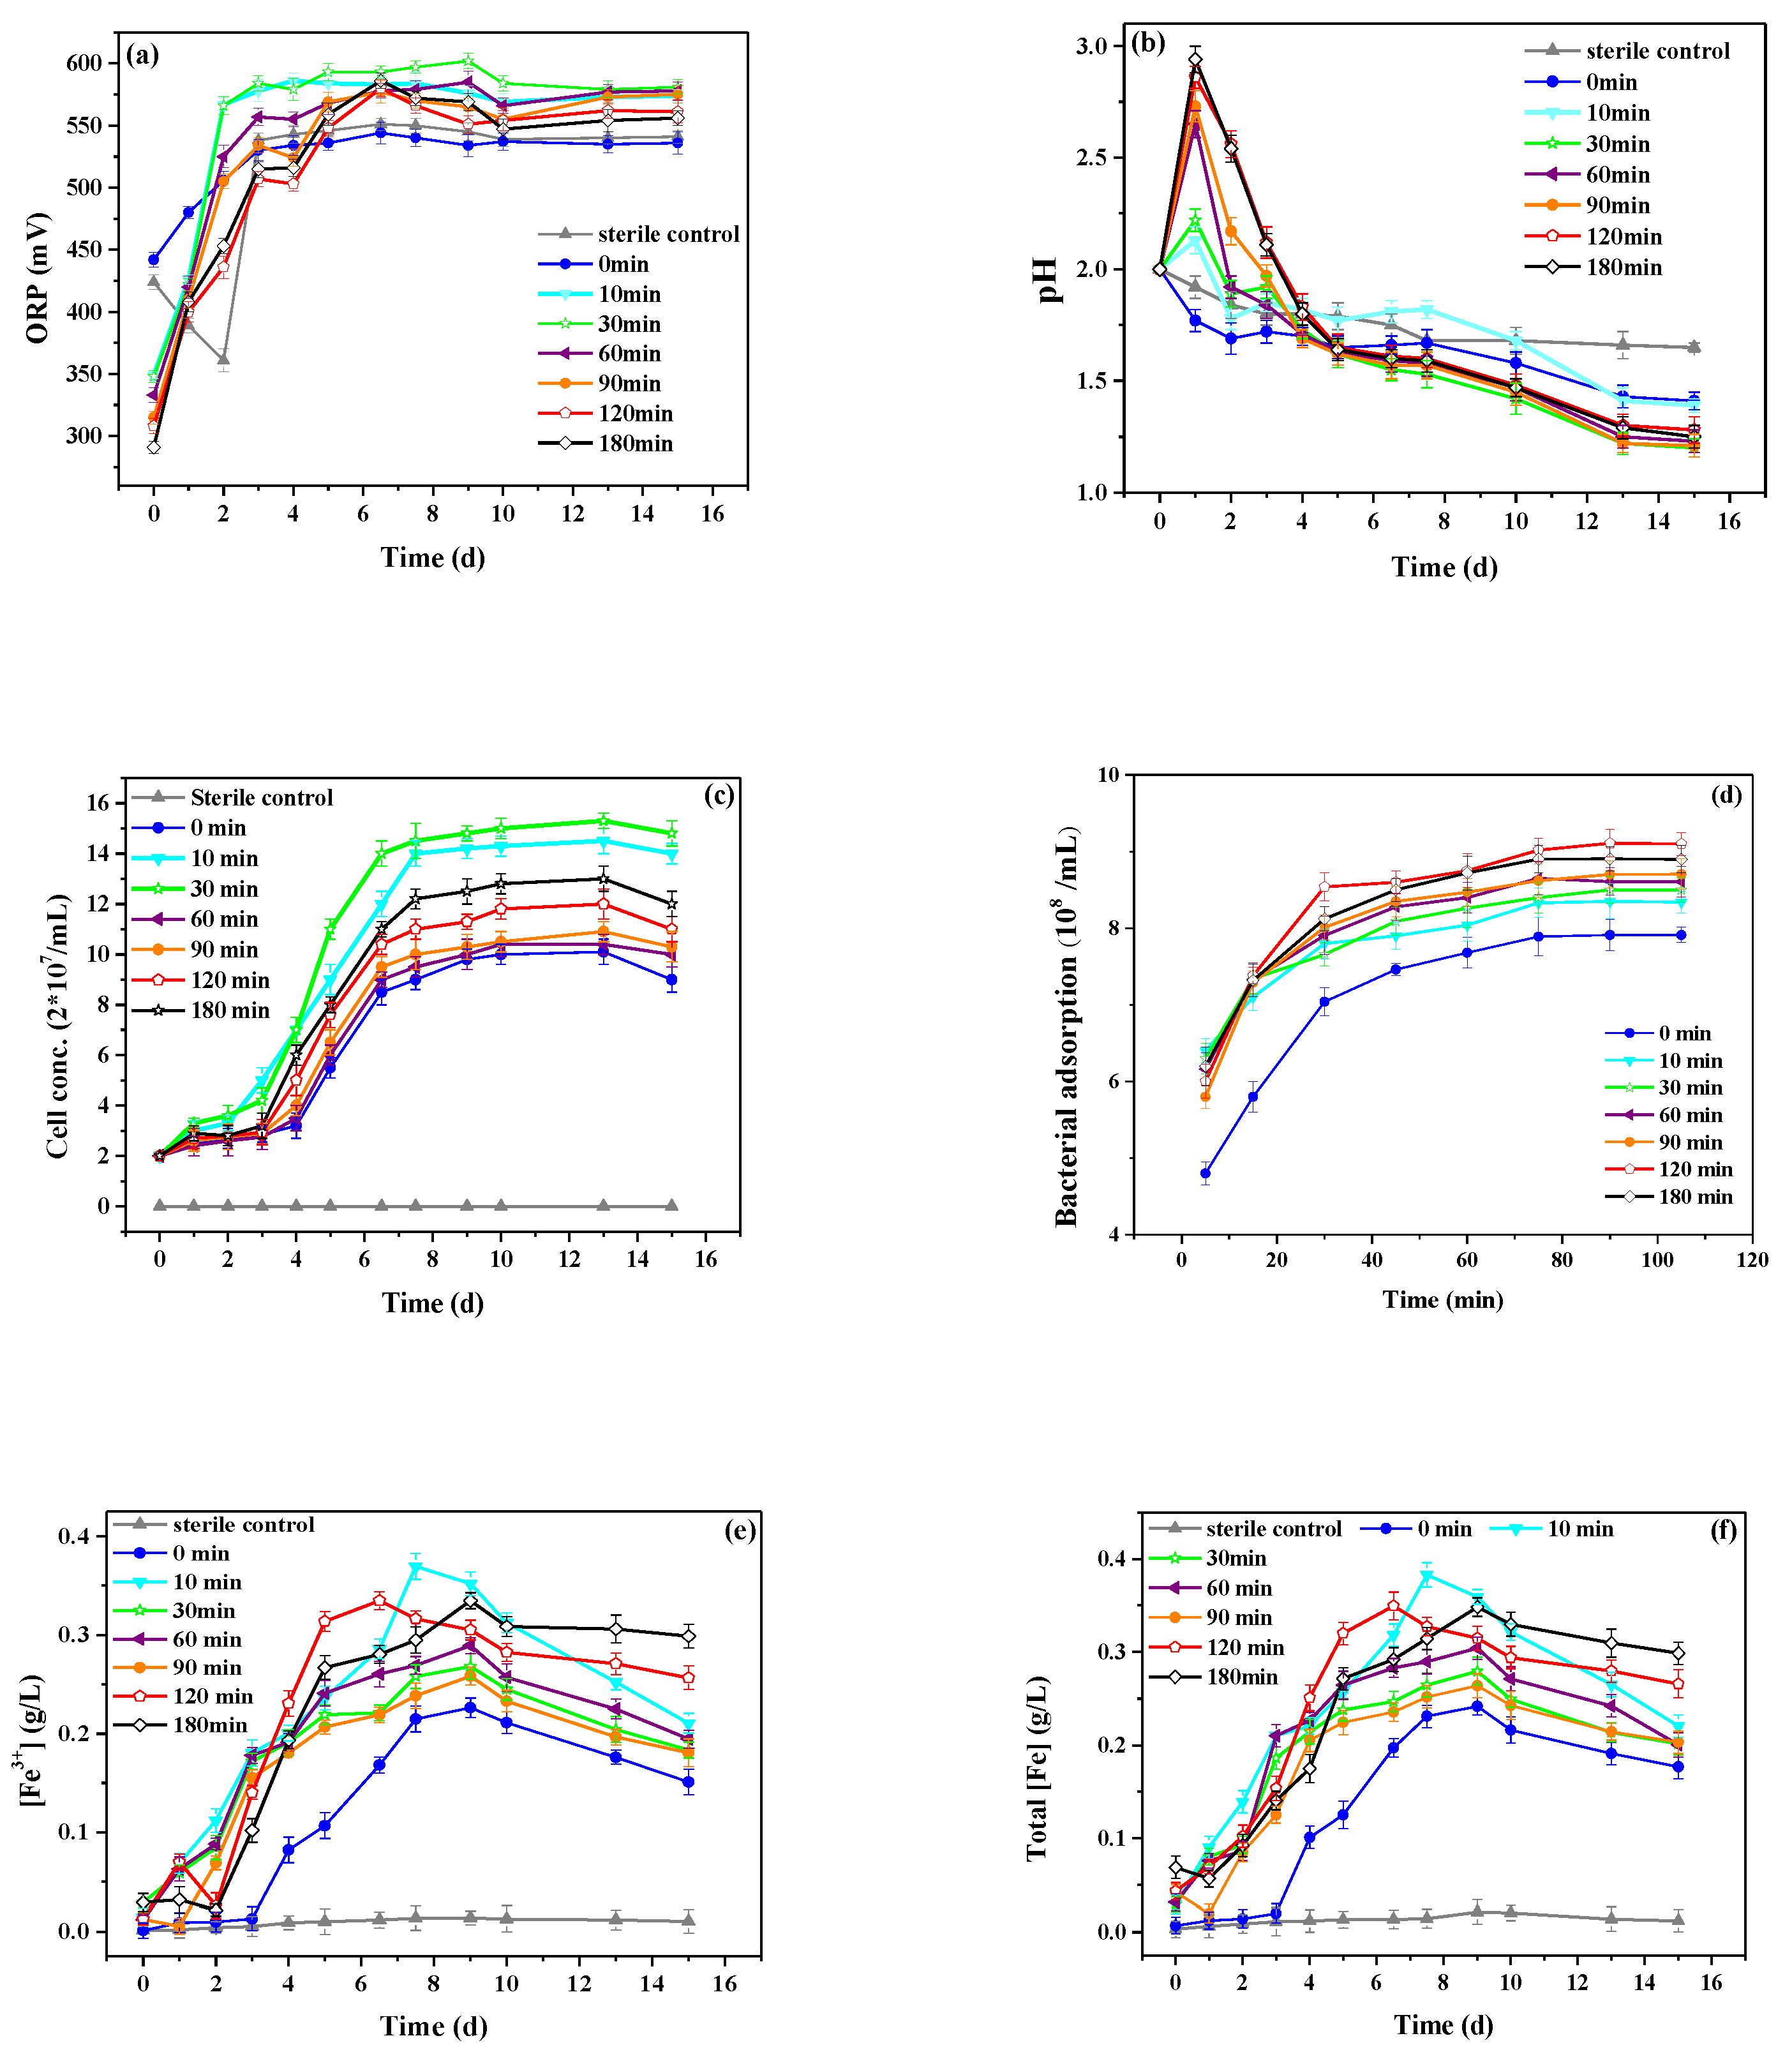
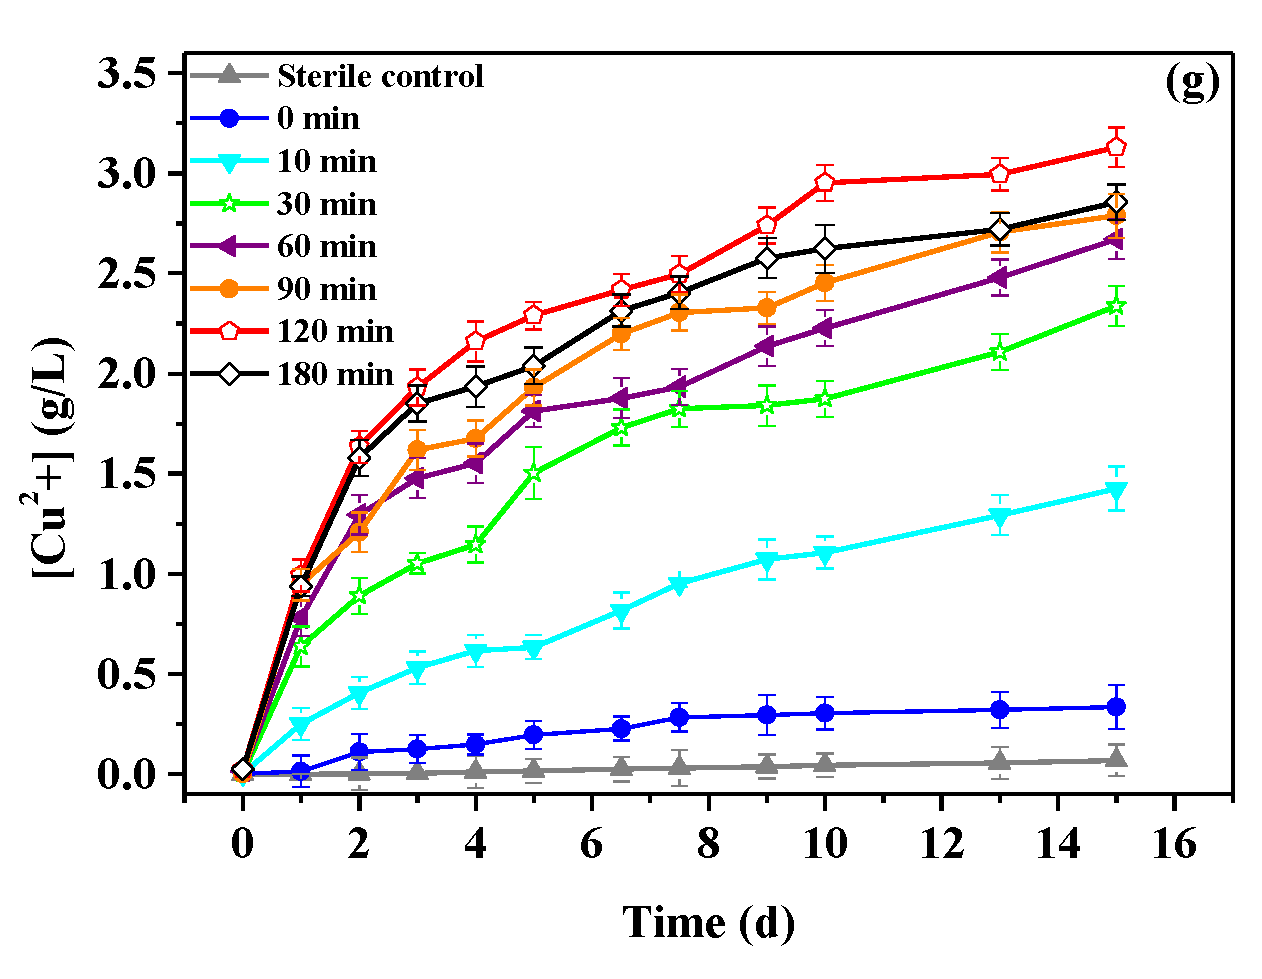
3.2. Bioleaching Behavior

The bioleaching behavior is characterized by redox potential values, pH values, cell densities, bacterial adsorption, [Fe3+], total [Fe] and [Cu2+] in Figure 5.
Figure 5a shows that the redox potential of the activated chalcopyrite increases faster in the early stage of bioleaching and has higher values compared to the unactivated chalcopyrite. Under 500 mV, the chalcopyrite dissolves more significantly, which may be due to the bacteria being in the logarithmic growth period and accelerating dissolution.
Figure 5b shows a two-stage of changes in pH for the activated chalcopyrite: The faster increase caused higher values in the early stage (before 2 days), and then the faster decrease caused lower values while the unactivated chalcopyrite only shows a gradual decrease in pH values during the all-bioleaching period.
The changes in cell densities (Figure 5c) show that in comparison with the unactivated chalcopyrite, the cell densities for the activated chalcopyrite are significantly higher. It is important to note that the highest increase occurs for the activation at 30 min and a longer time activation does not lead to a further increase of cell densities in solution. This may be due to the adsorption of more cells to the chalcopyrite surface [47], and it is demonstrated by the adsorption curves of S. thermosulfidooxidans (Figure 5d), which shows increase in adsorption capacity of cells with the activation time due to the larger specific surface area and lattice defects of chalcopyrite.
Figure 5e,f shows that the [Fe3+] and total [Fe] for activated chalcopyrite increase faster causing higher values when compared with that of unactivated chalcopyrite, suggesting that mechanical activation can improve the bioleaching of the chalcopyrite, as verified by the changes in [Cu2+] in Figure 5g.
Figure 5g shows that during the bioleaching process, the [Cu2+] for the activated chalcopyrite increases with ball-milling in 120 min, followed by slight decrease until 180 min due to the agglomeration of the particles [15,48]. After 15 days bioleaching, the [Cu2+] increased from 9.39% in the 0 min of mechanical activation to 87.41% in the 120 min of mechanical activation, and the copper leaching rate increased by about 78%. These results show that the optimal activation time is 120 min in this experiment, which is consistent with the mean diameter (Figure 2a) result.
All of the experimental results above indicate that the mechanical activation can significantly promote the leaching of chalcopyrite because of the smaller mean diameter, the larger specific surface area, the higher surface activities and the lattice defects. In order to demonstrate the effect of surface defects, we controlled the same surface area to do the CV, adsorption of bacterial cells and Cu dissolution experiment (an additional and independent experiment), and the results seen in Figures S1 and S2 in Supplementary Materials, according to which we can conclude that after mechanical activation, the bacteria cells are more likely to adhere to chalcopyrite surfaces due to the defects on this surface. Therefore, we use DFT calculations to explore the adsorption mechanism of bacteria in the next step.

3.3. Computational Results

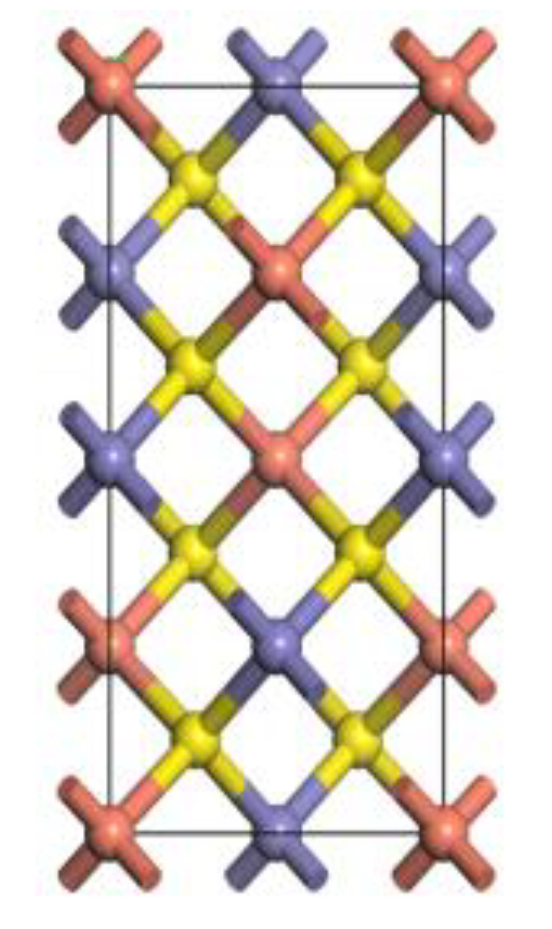
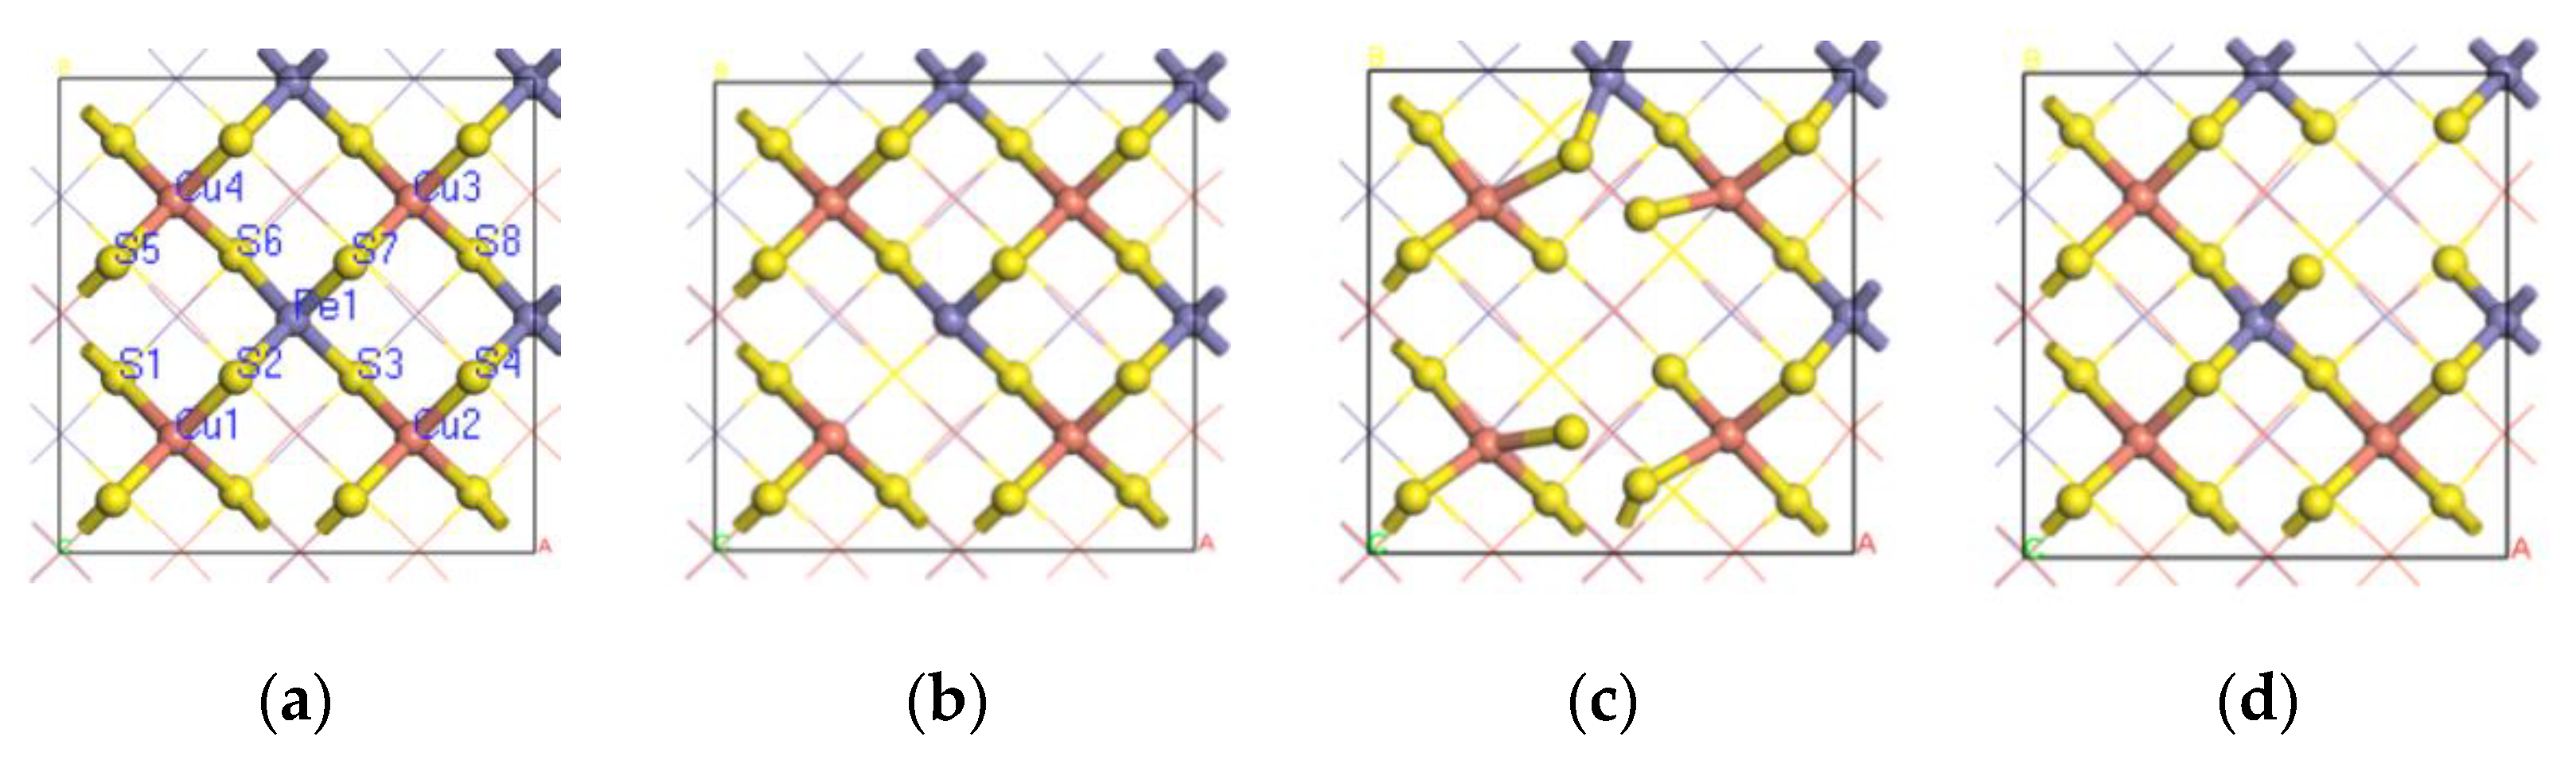
3.3.1. Bulk Chalcopyrite Calculation

In order to validate the calculation methodology, the chalcopyrite bulk parameters were first calculated, and then compared with the experimental parameters [36]. The results (Table 2) show that the calculation results adhere to the previous experimental data and the XRD results, indicating that the calculation methods can provide reliable results for chalcopyrite.

3.3.2. Chalcopyrite (0 0 1) Surface

The configurations of the perfect and surface-defect chalcopyrite (0 0 1) surfaces (Figure 6) show that after S2 or Cu3 defecting, the configuration of chalcopyrite (0 0 1) surface has changed less than that when Fe1 defects. For the surface Mulliken charges (Table 3), the charge of S2 atom on the defect surface increases in comparison with the perfect surface, while the charge of Fe1 and Cu3 atom on the defect surface decrease, indicating that after defecting, S atom loses electrons and Fe or Cu atom get electrons.

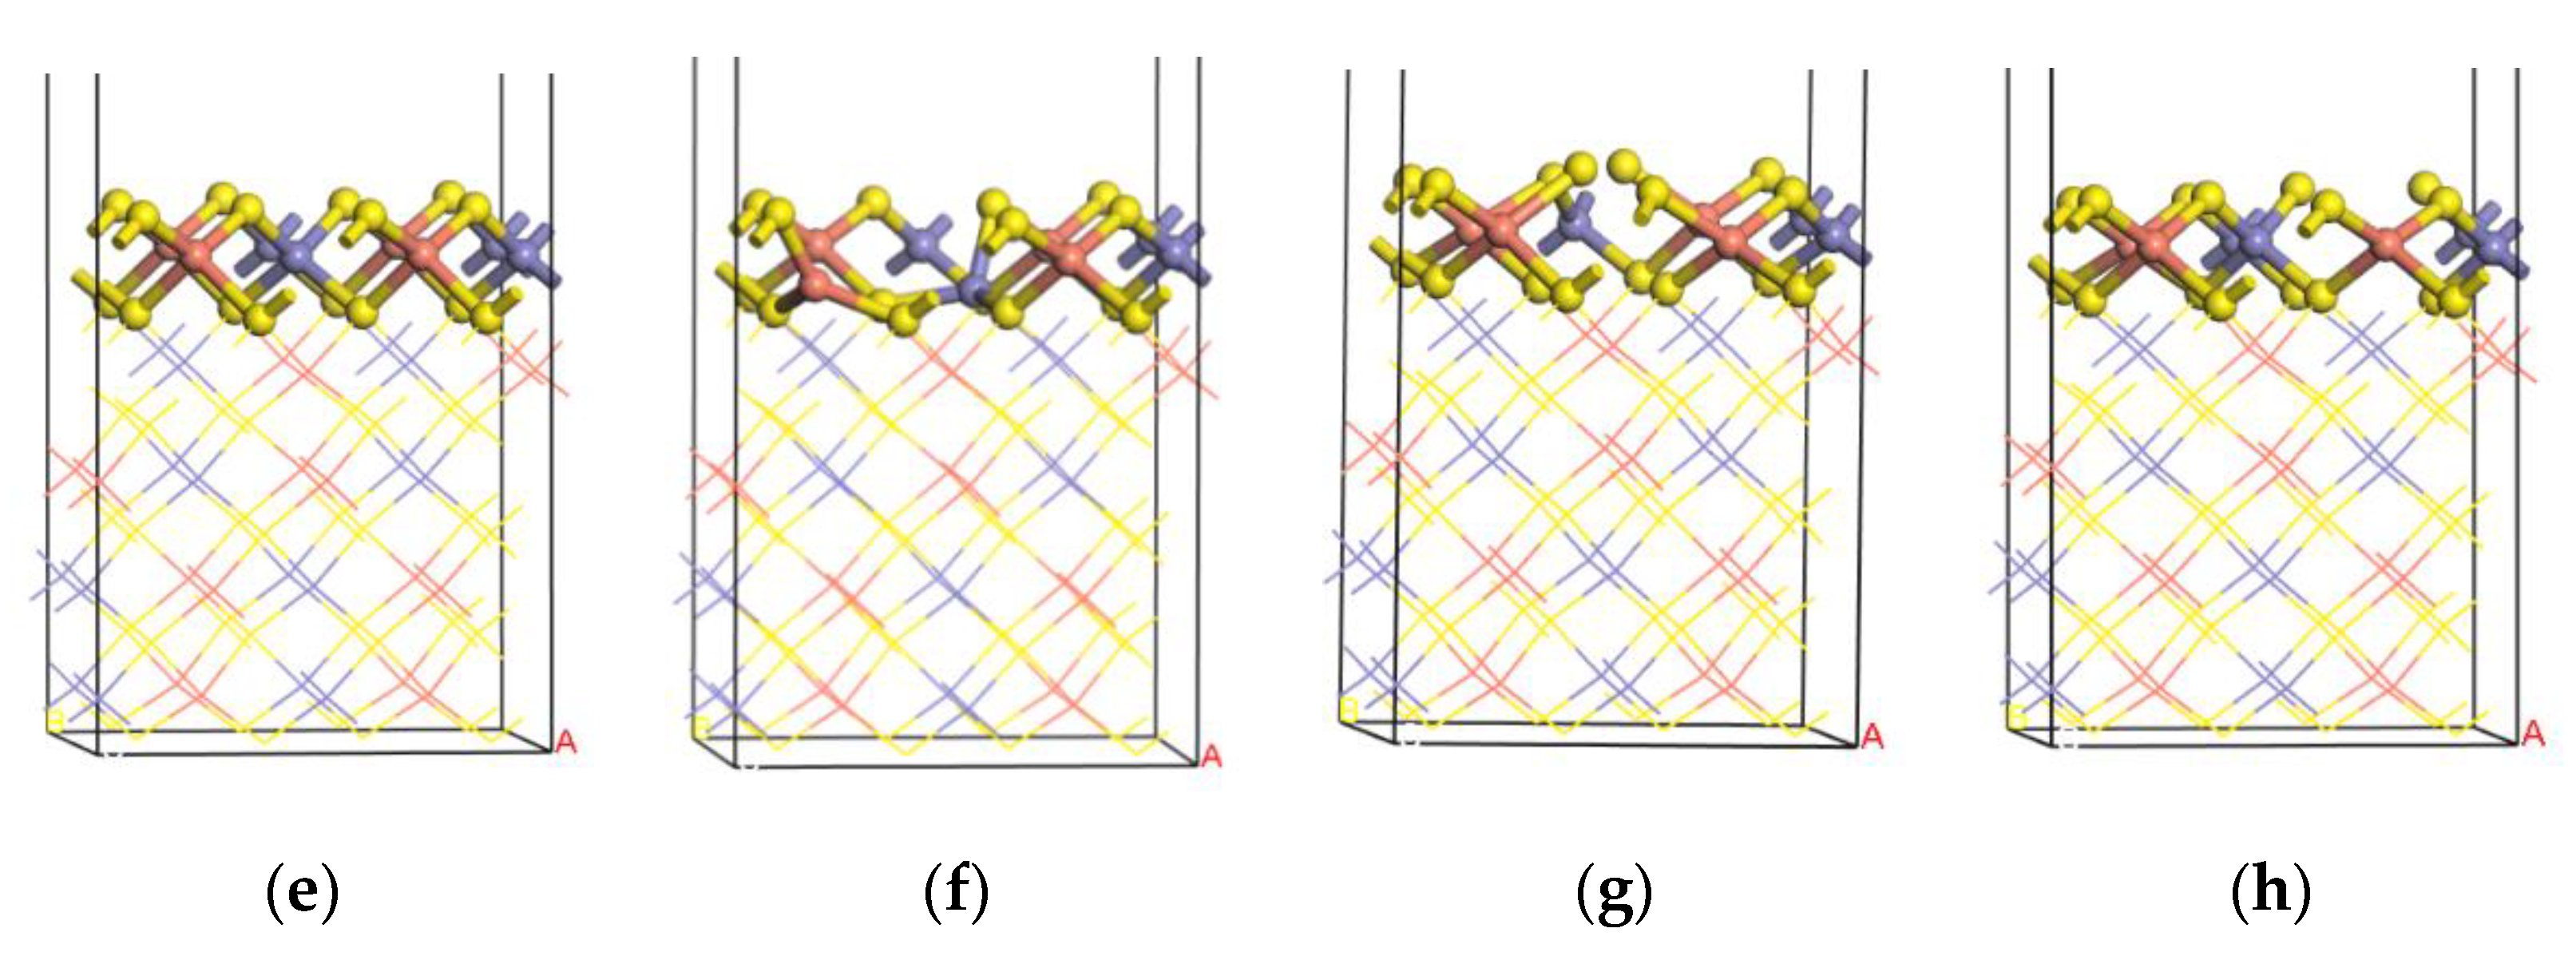
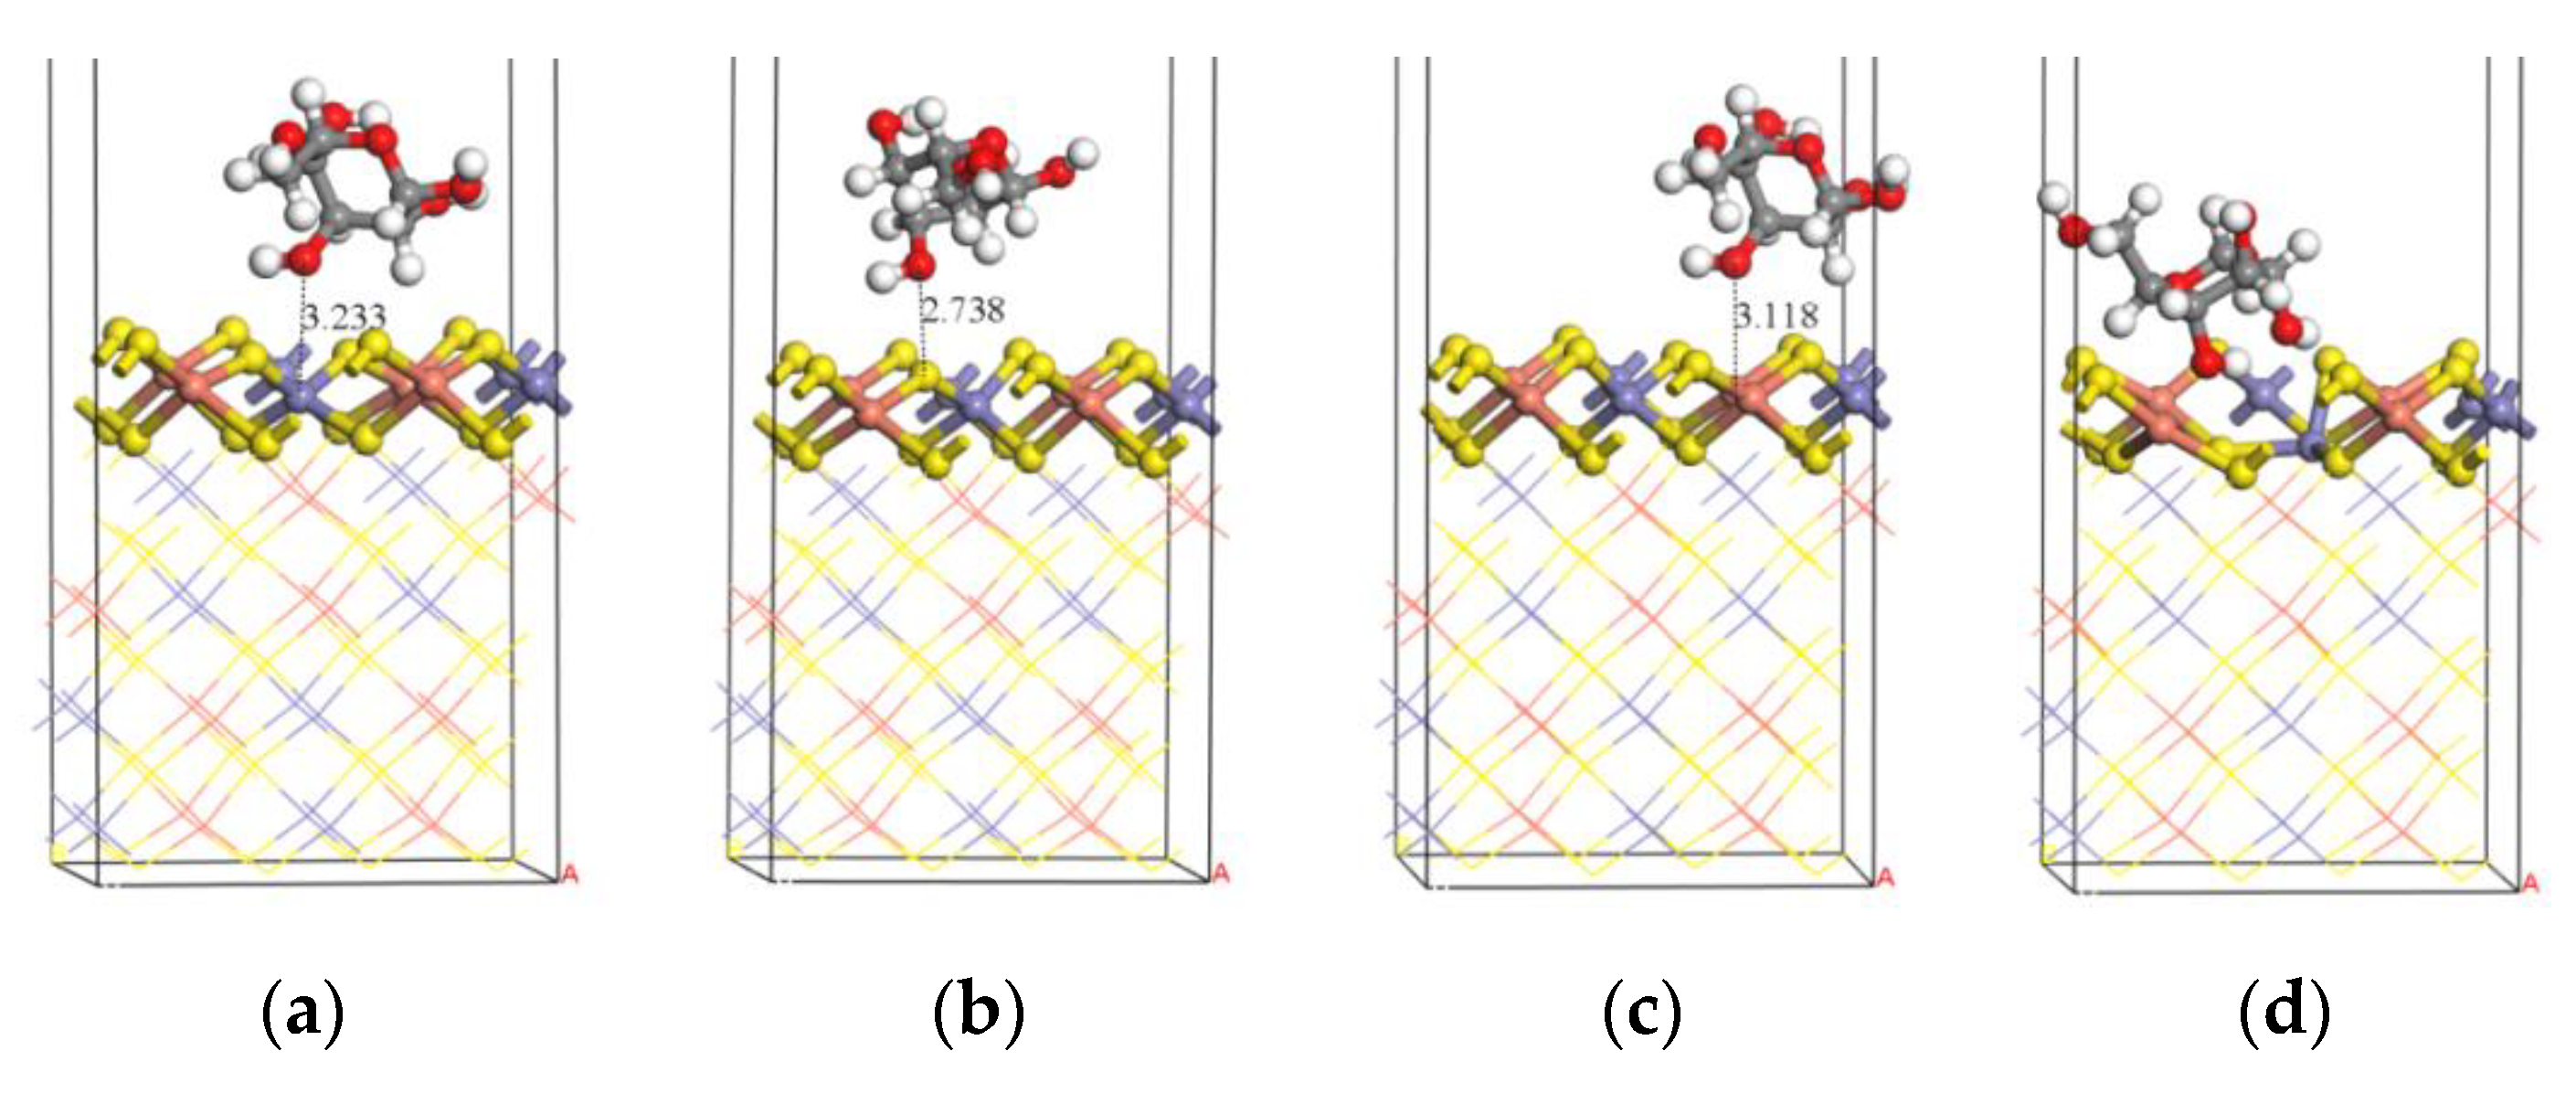
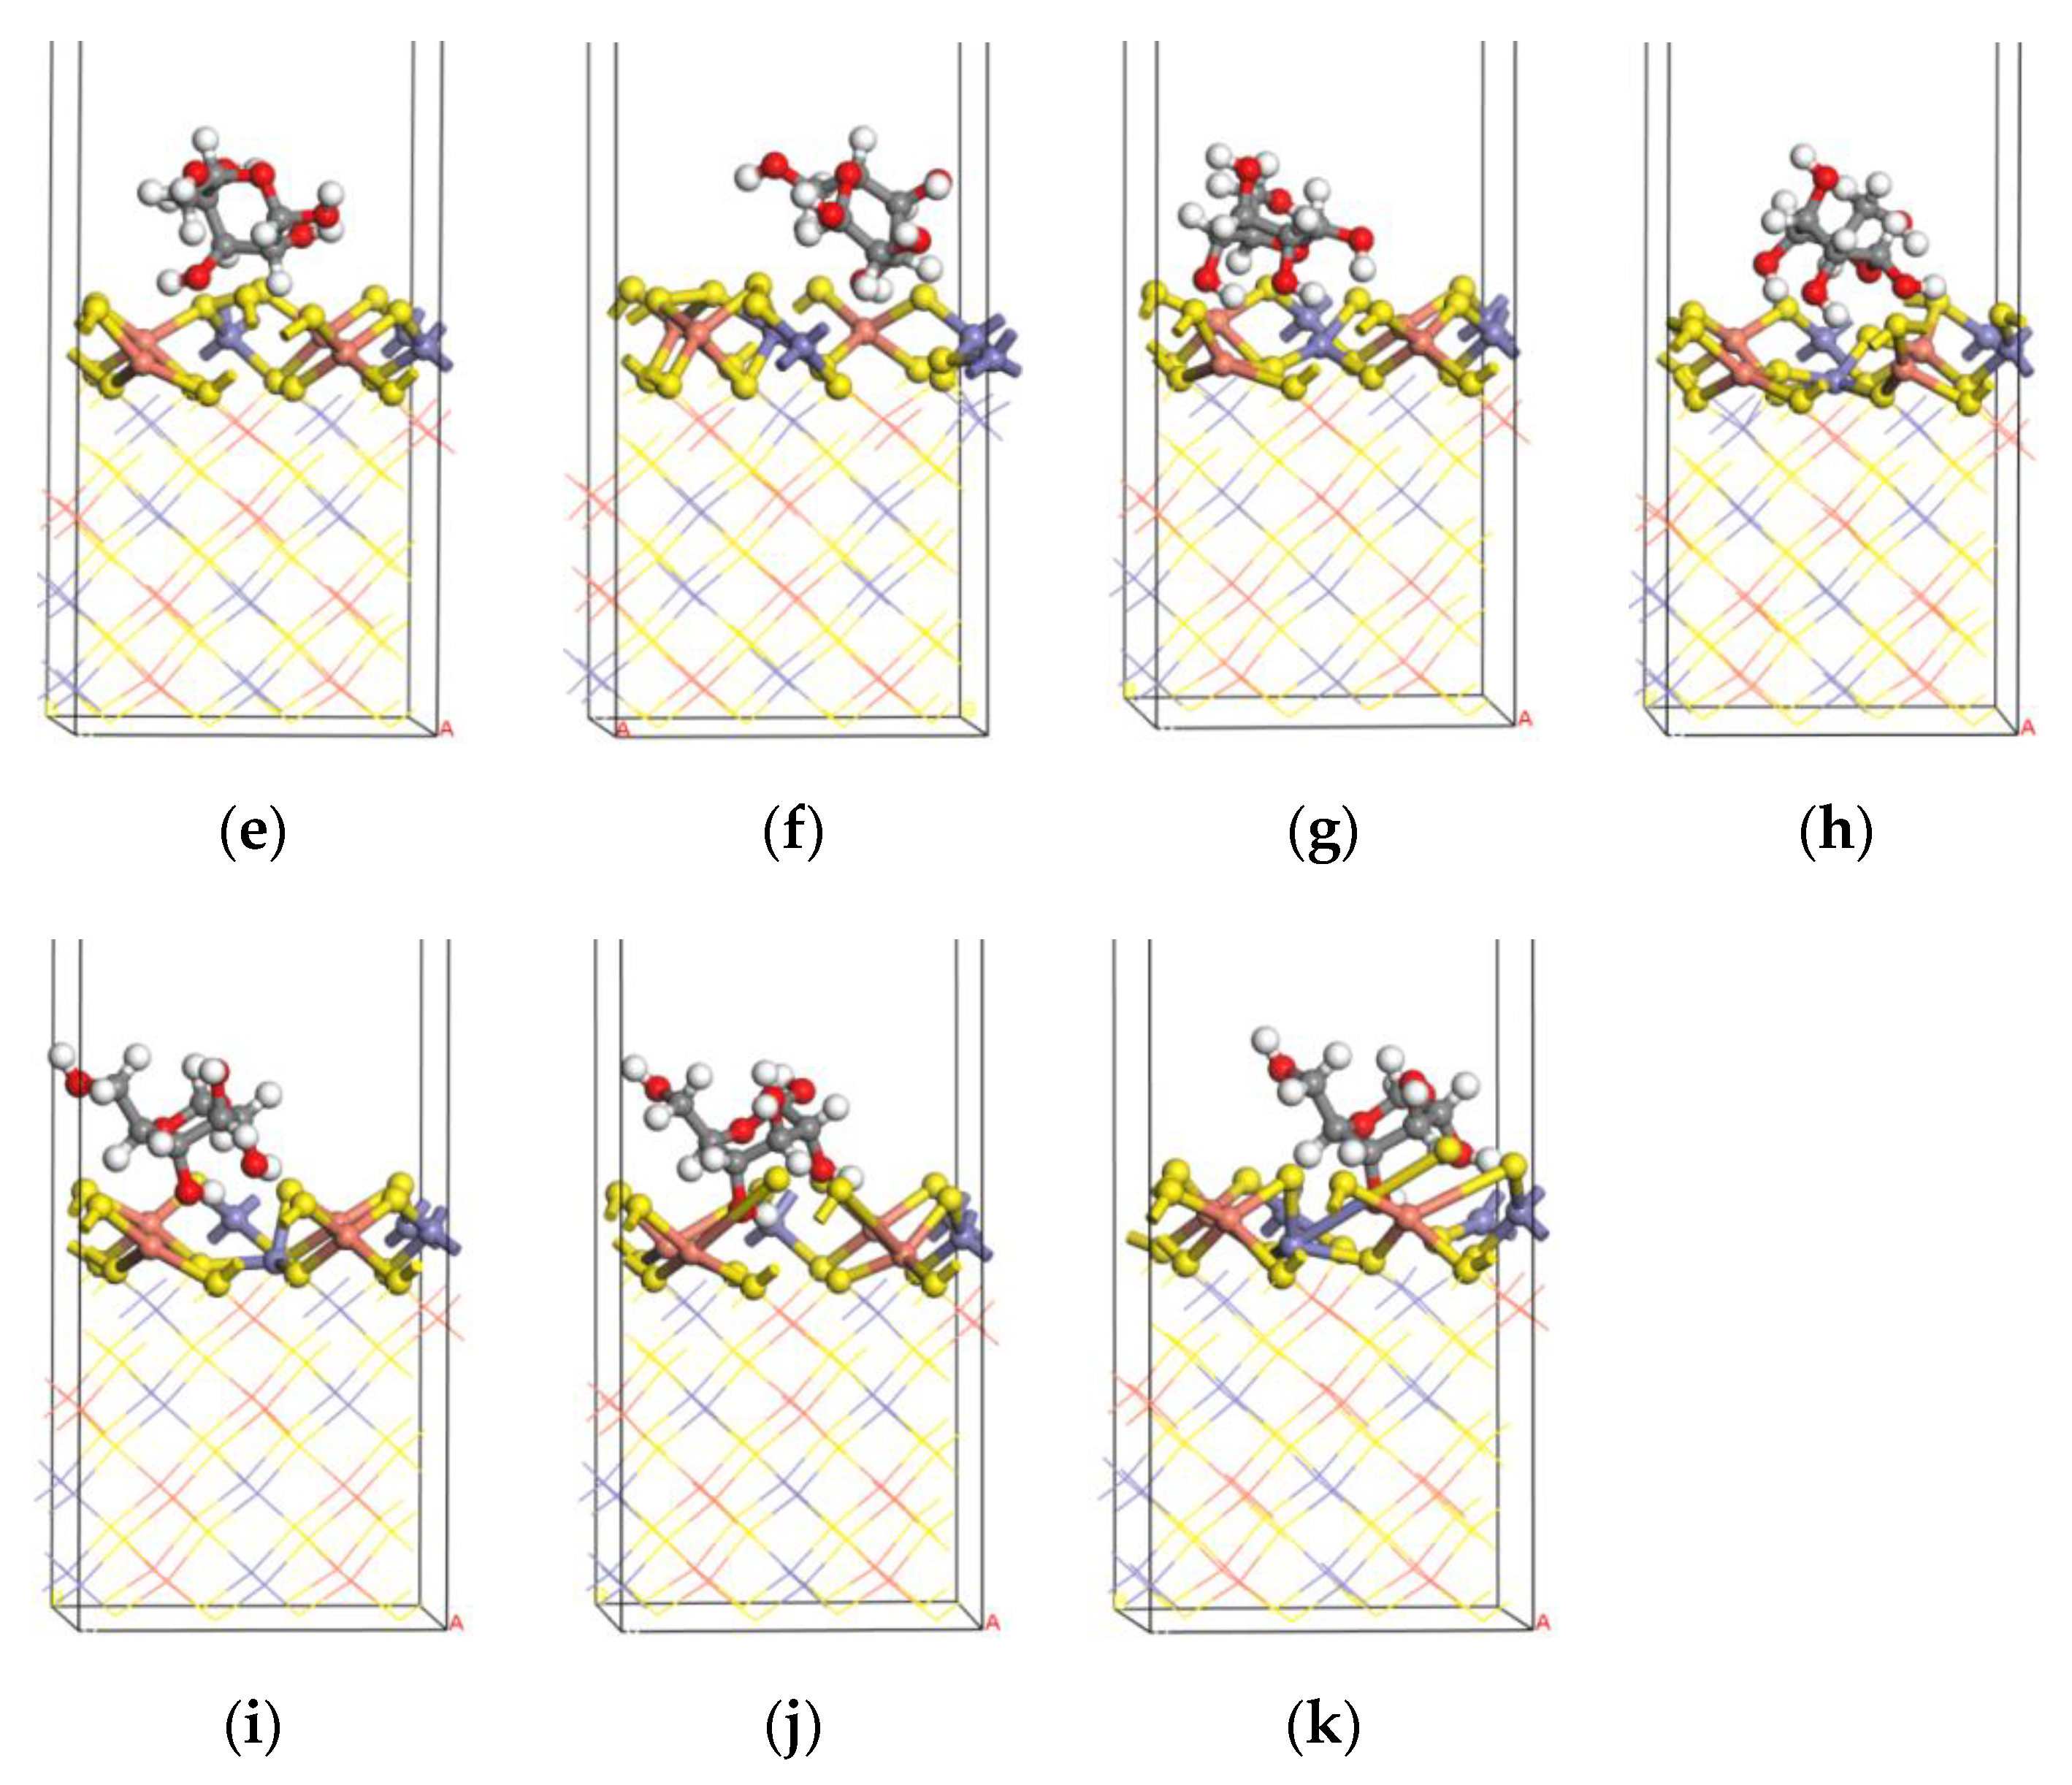
3.3.3. Bond Length and Mulliken Bond Population of the Glucose Adsorption on the Chalcopyrite (0 0 1) Surface

The optimized glucose adsorption configurations (Figure 7) and bond lengths (Table 4) show that when a single hydroxyl of glucose adsorbs on the Fe, S, or Cu site, the chalcopyrite (0 0 1) surface configurations change less, while on the S, Fe, or Cu defect site, the chalcopyrite (0 0 1) surface configurations noticeably change. The corresponding bond lengths (Å) are 3.233 (a, O-Fe), 2.738 (b, O-S), 3.118 (c, O-Cu), 2.714 (d, O-Cu), 3.312 (e, O-S2), and 2.983 (f, O-Fe1). For the adsorption of polyhydroxyl of glucose (Figure 7g–k), the chalcopyrite (0 0 1) surface configurations change more, and the corresponding bond lengths (Å) are 3.080 (g, O-S1), 2.675 (h, O-Cu2), 2.032 (i, O-Cu1), 2.343 (j, O-Cu1), and 3.337 (O-S8). The configurations and the bond lengths indicate that the defect of the chalcopyrite (0 0 1) surface is the glucose preferred adsorption site through chemical or the physical adsorption than the perfect surface, in another word, the defect surface is in favor of the bacteria cells adsorption, which is consistent with the experiment results above. In addition, from the bond length, it can be concluded that the polyhydroxyl of glucose adsorbs easier than the single hydroxyl.
Table 4 also shows the Mulliken bond population of these configurations, which can give the character and the strength of the bonds between atoms. Notably, a higher bond population value represents a stronger covalent interaction; on the contrary, a smaller bond population value represents a stronger ionic bond [27,49]. As seen in Table 4, when single hydroxyl of glucose adsorbs on the defect sites of chalcopyrite (0 0 1) surface, the value of the population is 0.09 (d, O-Cu1; f, O-Fe1), while for the S site, the value is negative (−0.05). which indicates an anti-bonding [50] and an unstable chemical bond. For the Fe site and the Cu site, the bond lengths are too large to calculate the populations; when the polyhydroxyl of glucose adsorbs on the hollow site and the defect site, the values of the populations are 0.07 (h, O-Cu2), 0.25 (i, O-Cu1), and 0.19 (j, O-Cu1). Notably, the interaction in configuration I tends to be a covalent bonding, while the interactions in configuration h tend to be ionic bonding compared with the other interactions. From the analysis above, it can be deduced that the glucose in configurations b, d, f, h, j adsorbs on the surface both chemically and physically, while glucose in the other configurations physically adsorbs on the surface because the distance between the glucose and the surface is too far to form a chemical bond.

3.3.4. Adsorption Energies

The adsorption energies of glucose on the chalcopyrite (0 0 1) surface (Table 5) show that all of the adsorption energy values are negative, indicating that adsorption is exothermic. Notably, the adsorption energies of polyhydroxyl of glucose are higher than that of the single hydroxyl of glucose. For both cases of the single hydroxyl and polyhydroxyl of glucose adsorption, the adsorption energies values of the defect surfaces are larger than that of the perfect surfaces, indicating that the defect sites occurring on the (0 0 1) surface are in favor of glucose adsorption, agreeing with the results above. When glucose adsorbs on Fe defect site, the adsorption energies are −1.23 eV for single hydroxyl adsorption and −1.76 eV for polyhydroxyl adsorption, larger (absolute value) than that of the others, indicating that the Fe defect chalcopyrite (0 0 1) surface may be the most thermodynamically preferred for glucose [51].

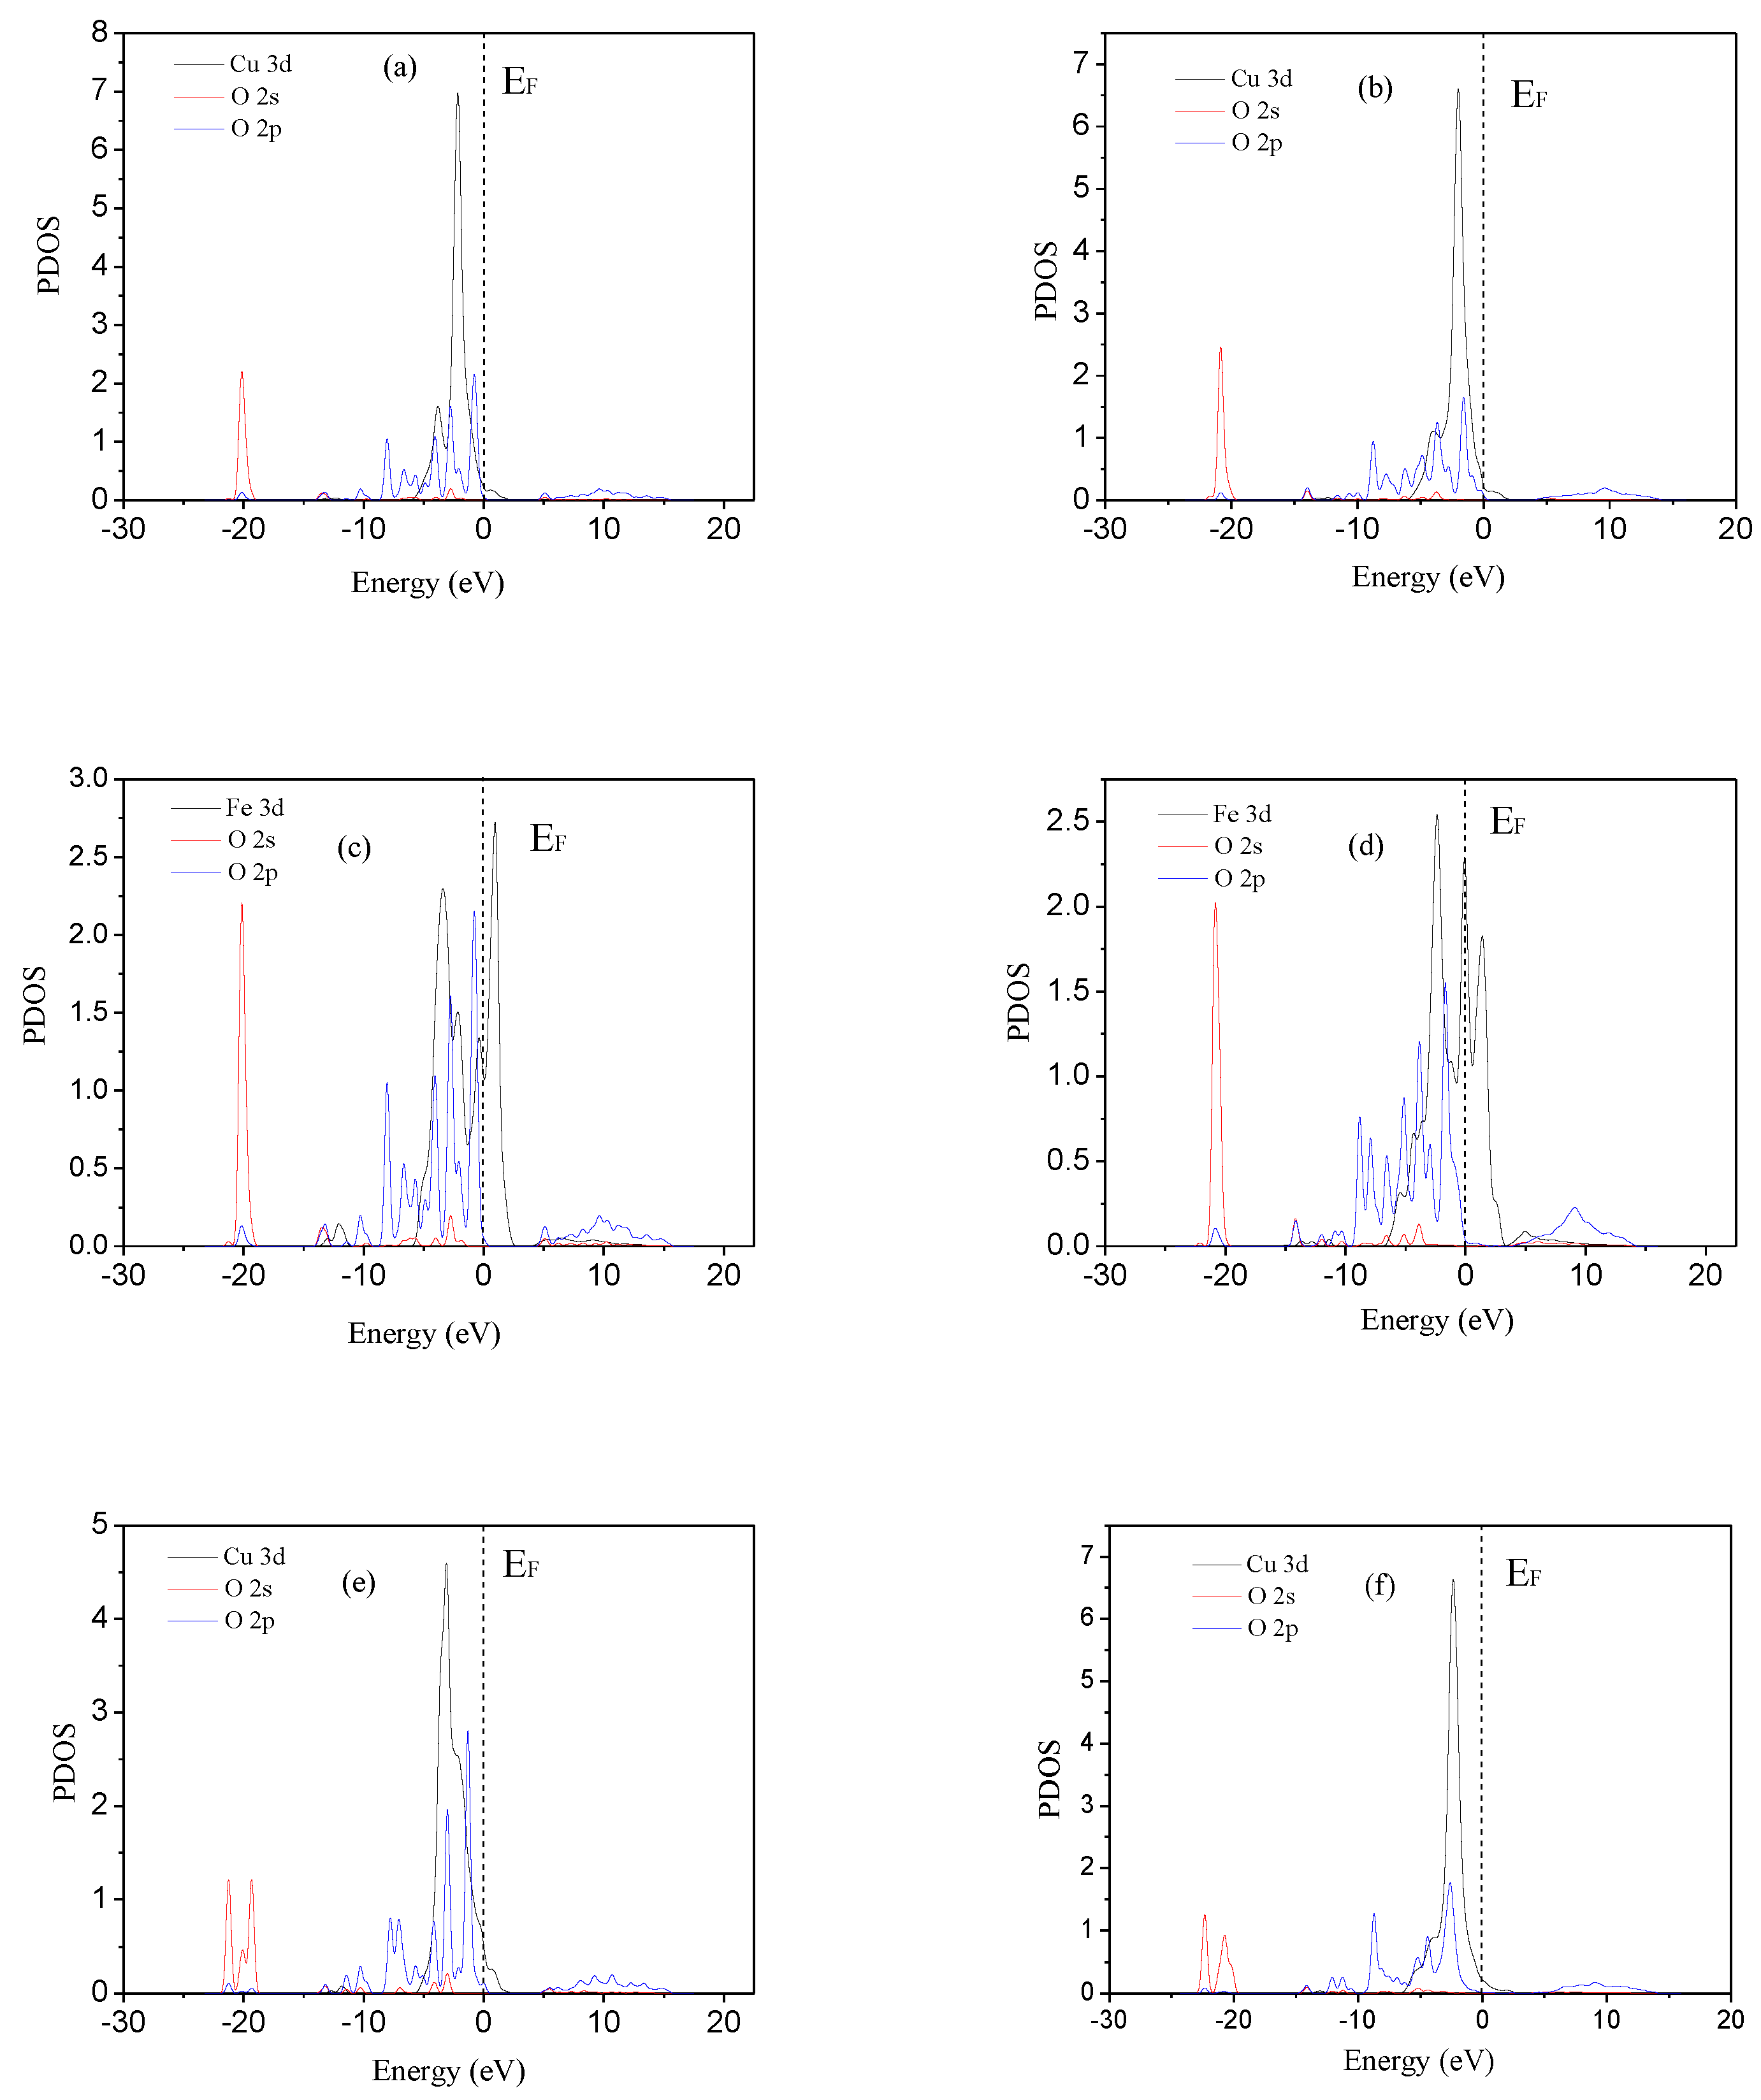
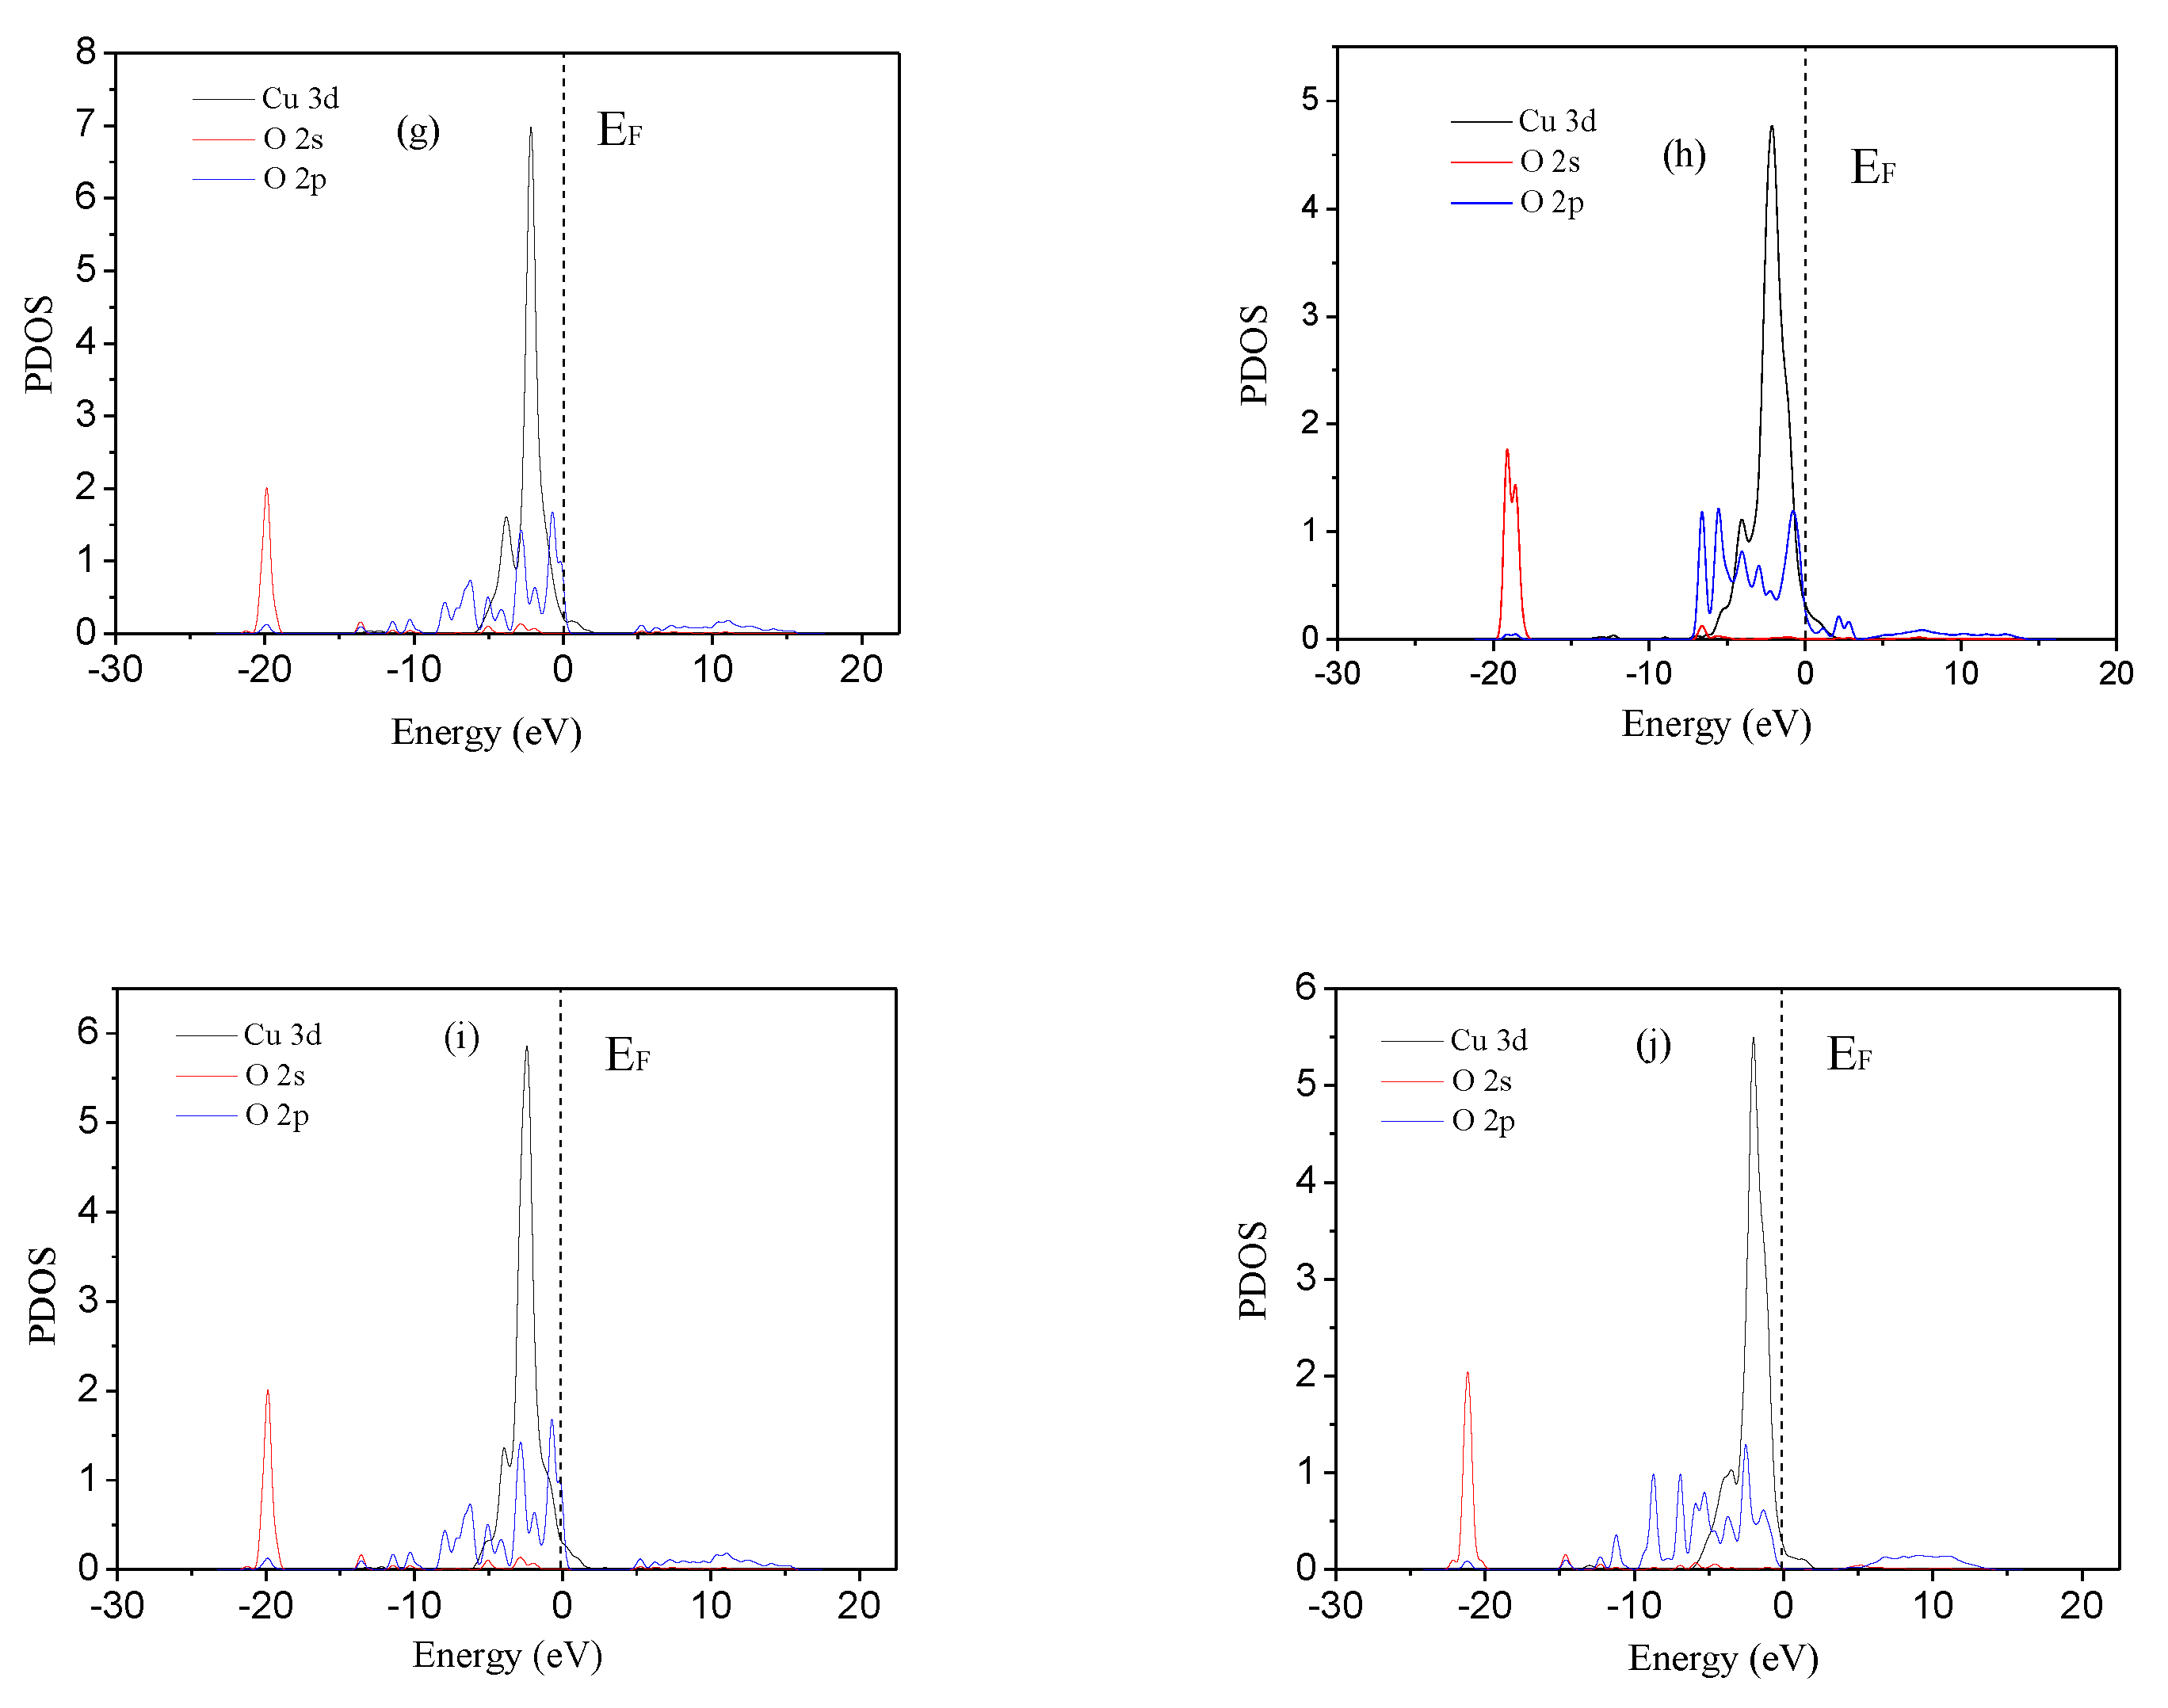
3.3.5. PDOS of the Interaction between Glucose and Chalcopyrite (0 0 1) Surface

To further understand the interactions between the glucose and chalcopyrite (0 0 1) surface in detail, the projected density of states (PDOS) is investigated. In this research, only the configurations d, f, h, i, and j are analyzed since other configurations cannot form stable chemical bonds according to the analysis above. Figure 8a,c,e,g,i shows the PDOS of the Cu or Fe atom and O atom before adsorption in the configurations d, f, h, i, and j, while Figure 8b,d,f,h,j shows PDOS after adsorption, respectively. The EF value, representing the position of Fermi level, is 0 eV. Comparing the PDOS before and after adsorption, it is conspicuous that the PDOS changes, which means that there are interactions occurring between glucose and chalcopyrite (0 0 1) surface after adsorption. Moreover, the overlap areas at −10 to 0 eV in Figure 8h is larger than that of the others, indicating that the O-Cu1 bond in configuration i tends to be the most covalent [52].

4. Conclusions

In this work, the mechanical activation contributed to bioleaching process of chalcopyrite was investigated, and the results can be concluded as follows: (1) The structure of chalcopyrite changes significantly in 30 min of mechanical activation; the surface hydrophobicity does not change but the surface redox activities are clearly promoted during mechanical activation; (2) The copper leaching increases after mechanical activation due to smaller sizes of particles, lattice expansion, surface defects and higher surface activities of the activated chalcopyrite. (3) The DFT results show that the activated chalcopyrite has the advantages of larger adsorption energy and stronger bond, and thereby, an easier adsorption by cells.
In the mining industry, due to the mechanical activation process being energy-consuming, the smaller particle size represents higher costs; thus, a possible solution is to find an optimal activation time that is profitable and can improve its economic sustainability. Furthermore, the industrial application of low-grade chalcopyrite bioleaching is limited due to its long cycle and low leaching rate. In our work, the chalcopyrite bioleaching cycle is shortened by using mechanical activation while the Cu leaching rate is improved, which provides a treatment option for its industrial application.

Supplementary Materials

The following are available online at https://www.mdpi.com/2075-163X/10/9/788/s1, Figure S1: The forward cyclic voltammetry (CV) (a) and reverse CV (b) of chalcopyrite, Figure S2: The changes in cell adsorption (a) and Cu leaching rate (b) during the bioleaching of chalcopyrite mechanically activated in different time.

Author Contributions

J.-L.X., H.-Y.Y., S.-T.C., and X.-F.Z. conceived of and designed the experiments; S.-T.C., X.-F.Z., Y.-H.Z., H.-C.L., Z.-Y.N., and J.-H.C. performed the experiments; S.-T.C., and X.-F.Z. analyzed the data; S.-T.C., X.-F.Z., and J.-L.X. wrote the paper. All authors have read and agreed to the published version of the manuscript.

Funding

National Natural Science Foundation of China (51774342; 41802038).

Acknowledgments

We are grateful to the anonymous reviewers for their meticulous checking and helpful suggestions to the manuscript. The calculations were performed at National Supercomputer Centers in Lvliang and Shenzhen (Shenzhen Cloud Computing Center) of China.

Conflicts of Interest

The authors declare no conflict of interest.

References

  1. Córdoba, E.M.; Muñoz, J.A.; Blázquez, M.L.; González, F.; Ballester, A. Leaching of chalcopyrite with ferric ion. Part I: General aspects. Hydrometallurgy 2008, 93, 81–87. [Google Scholar] [CrossRef]
  2. Li, Y.; Kawashima, N.; Li, J.; Chandra, A.P.; Gerson, A.R. A review of the structure, and fundamental mechanisms and kinetics of the leaching of chalcopyrite. Adv. Colloid. Interface. Sci. 2013, 197–198, 1–32. [Google Scholar] [CrossRef] [PubMed]
  3. Pradhan, N.; Nathsarma, K.C.; Rao, K.S.; Sukla, L.B.; Mishra, B.K. Heap bioleaching of chalcopyrite: A review. Miner. Eng. 2008, 21, 355–365. [Google Scholar] [CrossRef]
  4. Watling, H.R. Chalcopyrite hydrometallurgy at atmospheric pressure: 1. Review of acidic sulfate, sulfate–chloride and sulfate–nitrate process options. Hydrometallurgy 2013, 140, 163–180. [Google Scholar] [CrossRef]
  5. Ma, L.; Wu, J.; Liu, X.; Tan, L.; Wang, X. The detoxification potential of ferric ions for bioleaching of the chalcopyrite associated with fluoride-bearing gangue mineral. Appl. Microbiol. Biotechnol. 2019, 103, 2403–2412. [Google Scholar] [CrossRef] [PubMed]
  6. Johnson, D.B. Biomining-biotechnologies for extracting and recovering metals from ores and waste materials. Curr. Opin. Biotechnol. 2014, 30, 24–31. [Google Scholar] [CrossRef]
  7. Panda, S.; Akcil, A.; Pradhan, N.; Deveci, H. Current scenario of chalcopyrite bioleaching: A review on the recent advances to its heap-leach technology. Bioresour. Technol. 2015, 196, 694–706. [Google Scholar] [CrossRef]
  8. Wang, X.; Ma, L.; Wu, J.; Xiao, Y.; Liu, X. Effective bioleaching of low-grade copper ores: Insights from microbial cross experiments. Bioresour. Technol. 2020, 308, 123–273. [Google Scholar] [CrossRef]
  9. Feng, S.; Yang, H.; Wang, W. Improved chalcopyrite bioleaching by Acidithiobacillus sp. via direct step-wise regulation of microbial community structure. Bioresour. Technol. 2015, 192, 75–82. [Google Scholar] [CrossRef]
  10. Arce, E.M.; Gonzalez, I. A comparative study of electrochemical behavior of chalcopyrite, chalcocite and bornite in sulfuric acid solution. Int. J. Miner. Process. 2002, 67, 17–28. [Google Scholar] [CrossRef]
  11. Klára, T.; Peter, B. Reactivity of mechanically activated chalcopyrite. Int. J. Miner. Process. 1996, 44–45, 97–208. [Google Scholar]
  12. Holmberg, K.; Matthews, A.; Ronkainen, H.; Maurice, D.; Hawk, J.A. Ferric chloride leaching of mechanically activated chalcopyrite. Hydrometallurgy 1998, 49, 103–123. [Google Scholar]
  13. Palaniandy, S.; Azizli, K.A.M.; Hussin, H.; Hashim, S.F.S. Mechanochemistry of silica on jet milling. J. Mater. Process. Technol. 2008, 205, 119–127. [Google Scholar] [CrossRef]
  14. Bafghi, M.S.; Emami, A.H.; Zakeri, A. Effect of Specific Surface Area of a Mechanically Activated Chalcopyrite on Its Rate of Leaching in Sulfuric Acid-Ferric Sulfate Media. Metall. Mater. Trans. B 2013, 44, 1166–1172. [Google Scholar] [CrossRef]
  15. Palaniandy, S. Impact of mechanochemical effect on chalcopyrite leaching. Int. J. Miner. Process. 2015, 136, 56–65. [Google Scholar] [CrossRef] [Green Version]
  16. Zhao, Z.; Zhang, Y.; Chen, X.; Chen, A.; Huo, G. Effect of mechanical activation on the leaching kinetics of pyrrhotite. Hydrometallurgy 2009, 99, 105–108. [Google Scholar] [CrossRef]
  17. Balaz, P.; Tkacova, K.; Avvakumov, E.G. The effect of mechanical activation on the thermal decomposition of chalcopyrite. J. Therm. Anal. Calorim. 1989, 35, 1325–1330. [Google Scholar]
  18. Tan, Q.; Deng, C.; Li, J. Effects of mechanical activation on the kinetics of terbium leaching from waste phosphors using hydrochloric acid. J. Rare. Earth. 2017, 35, 398–405. [Google Scholar] [CrossRef]
  19. Xu, Y.; Jiang, T.; Zhou, M.; Wen, J.; Chen, W.; Xue, X. Effects of mechanical activation on physicochemical properties and alkaline leaching of boron concentrate. Hydrometallurgy 2017, 173, 32–42. [Google Scholar] [CrossRef]
  20. Lee, J.; Kim, S.; Kim, B.; Lee, J. Effect of Mechanical Activation on the Kinetics of Copper Leaching from Copper Sulfide (CuS). Metals 2018, 8, 150. [Google Scholar] [CrossRef] [Green Version]
  21. Li, Y.; Wang, B.; Xiao, Q.; Lartey, C.; Zhang, Q. The mechanisms of improved chalcopyrite leaching due to mechanical activation. Hydrometallurgy 2017, 173, 149–155. [Google Scholar] [CrossRef]
  22. Mohammadabad, F.K.; Hejazi, S.; Khaki, J.V.; Babakhani, A. Mechanochemical leaching of chalcopyrite concentrate by sulfuric acid. Int. J. Min. Met. Mater. 2016, 23, 380–388. [Google Scholar] [CrossRef]
  23. Li, Q.; Qin, W.; Sun, W.; Qiu, G. Calculation of electron structure by density function theory and electrochemical process of surface. J. Cent. South. Univ. Technol. 2007, 14, 618–622. [Google Scholar] [CrossRef]
  24. Zheng, X.; Pan, X.; Nie, Z.; Yang, Y.; Liu, L.; Yang, H.; Xia, J. Combined DFT and XPS Investigation of Cysteine Adsorption on the Pyrite (1 0 0) Surface. Minerals 2018, 8, 366. [Google Scholar] [CrossRef] [Green Version]
  25. Chen, J.; Long, X.; Chen, Y. Comparison of Multilayer Water Adsorption on the Hydrophobic Galena (PbS) and Hydrophilic Pyrite (FeS2) Surfaces: A DFT Study. J. Phys. Chem. C 2014, 118, 11657–11665. [Google Scholar] [CrossRef]
  26. Chen, J.; Li, Y.; Zhao, C. First principles study of the occurrence of gold in pyrite. Comp. Mater. Sci. 2014, 88, 1–6. [Google Scholar] [CrossRef]
  27. Zhao, C.; Chen, J.; Li, Y.; Chen, Y.; Li, W.Z. First-principle calculations of interaction of O2 with pyrite, marcasite and pyrrhotite surfaces. Trans. Nonferrous Metal. Soc. 2016, 26, 519–526. [Google Scholar] [CrossRef]
  28. Yang, Y.J.; Liu, J.; Liu, F.; Wang, Z.; Miao, S. Molecular-level insights into mercury removal mechanism by pyrite. J. Hazard. Mater. 2018, 344, 104–112. [Google Scholar] [CrossRef]
  29. Diao, M.; Taran, E.; Mahler, S.; Nguyen, A.V. A concise review of nanoscopic aspects of bioleaching bacteria–mineral interactions. Adv. Colloid. Interface. Sci. 2014, 212, 45–63. [Google Scholar] [CrossRef] [Green Version]
  30. Wang, Z.; Xie, X.; Xiao, S.; Liu, J. Adsorption behavior of glucose on pyrite surface investigated by TG, FTIR and XRD analyses. Hydrometallurgy 2010, 102, 87–90. [Google Scholar] [CrossRef]
  31. Gehrke, T.; Telegdi, J.; Thierry, D.; Sand, W. Importance of extracellular polymeric substances from Thiobacillus ferrooxidans for bioleaching. Appl. Environ. Microb. 1998, 64, 2743–2747. [Google Scholar] [CrossRef] [PubMed] [Green Version]
  32. Zhang, R.Y.; Thomas, R.N.; Veronique, B.; Mario, V.; Wolfgang, S. Biofilm dynamics and EPS production of a thermoacidophilic bioleaching archaeon. New. Biotechnol. 2019, 51, 21–30. [Google Scholar] [CrossRef] [PubMed]
  33. Zhang, R.Y. Biofilm Formation and Extracellular Polymeric Substances of Acidophilic Metal/Sulfur-Oxidizing Archaea. Ph.D. Thesis, Faculty of Chemistry, Univesity of Duiburg-Essen, Duisburg, Germany, 2016. [Google Scholar]
  34. Zhang, R.Y.; Neu, T.R.; Bellenberg, S.; Kuhlicke, U.; Sand, W.; Vera, M. Use of lectins to in situ visualize glycoconjugates of extracellular polymeric substances in acidophilic archaeal biofilms. Microb. Biotechnol. 2015, 8, 448–461. [Google Scholar] [CrossRef] [PubMed]
  35. Karamanev, D.G.; Nikolov, L.N.; Mamatarkova, V. Rapid simultaneous quantitative determination of ferric and ferrous ions in drainage waters and similar solutions. Miner. Eng. 2002, 15, 341–346. [Google Scholar] [CrossRef]
  36. Hall, B.S.R.; Stewart, J.M. The Crystal Structure Refinement of Chalcopyrite, CuFeS2. Acta. Cryst. 1973, B29, 579–585. [Google Scholar] [CrossRef]
  37. Vanderbilt, D. Soft self-consistent pseudopotentials in a generalized eigenvalue formalism. Phys. Rev. B 1990, 41, 7892–7895. [Google Scholar] [CrossRef]
  38. De Lima, G.F.; De Oliveira, C.; De Abreu, H.A.; Duarte, H.A. Water Adsorption on the Reconstructed (001) Chalcopyrite Surfaces. J. Phys. Chem. C 2011, 115, 10709–10717. [Google Scholar] [CrossRef]
  39. De Oliveira, C.; De Lima, G.F.; De Abreu, H.; Duarte, H.A. Reconstruction of the Chalcopyrite Surfaces—A DFT Study. J. Phys. Chem. C 2012, 116, 6357–6366. [Google Scholar] [CrossRef]
  40. Fan, Y.; Zhang, J.; Qiu, Y.; Zhu, J.; Zhang, Y.; Hu, G. A DFT study of transition metal (Fe, Co, Ni, Cu, Ag, Au, Rh, Pd, Pt and Ir)-embedded monolayer MoS2 for gas adsorption. Compos. Mater. Sci. 2017, 138, 255–266. [Google Scholar] [CrossRef]
  41. Zhao, H.; Hu, M.; Li, Y.; Zhu, S.; Qin, W.; Qiu, G.; Wang, J. Comparison of electrochemical dissolution of chalcopyrite and bornite in acid culture medium. Trans. Nonferrous Metal. Soc. 2015, 25, 303–313. [Google Scholar] [CrossRef]
  42. Majuste, D.; Ciminelli, V.S.T.; Osseo-Asare, K.; Dantas, M.S.S.; Magalhães-Paniago, R. Electrochemical dissolution of chalcopyrite: Detection of bornite by synchrotron small angle X-ray diffraction and its correlation with the hindered dissolution process. Hydrometallurgy 2012, 111–112, 114–123. [Google Scholar] [CrossRef]
  43. Liang, C.; Xia, J.; Nie, Z.; Luo, X. Comparison of Electrochemical Behaviors of Chalcopyrite, Bornite, Chalcocite and Covellite in 9K Medium. Adv. Mater. Res. 2013, 634–638, 68–71. [Google Scholar] [CrossRef]
  44. Bevilaqua, D.; Acciari, H.A.; Arena, F.A.; Benedetti, A.V.; Fugivara, C.S.; Filho, G.T. Utilization of electrochemical impedance spectroscopy for monitoring bornite (Cu5FeS4) oxidation by Acidithiobacillus ferrooxidans. Miner. Eng. 2009, 22, 254–262. [Google Scholar] [CrossRef]
  45. Hong, M.; Wang, X.; Wu, L.; Fang, C.; Huang, X.; Liao, R.; Zhao, H.; Qiu, G.; Wang, J. Intermediates Transformation of Bornite Bioleaching by Leptospirillum ferriphilum and Acidithiobacillus caldus. Minerals 2019, 9, 159. [Google Scholar] [CrossRef] [Green Version]
  46. Zhao, H.; Zhang, Y.; Sun, M.; Ou, P.; Zhang, Y.; Liao, R.; Qiu, G. Catalytic mechanism of silver in the oxidative dissolution process of chalcopyrite: Experiment and DFT calculation. Hydrometallurgy 2019, 187, 18–29. [Google Scholar] [CrossRef]
  47. Sandström, Å.; Shchukarev, A.; Paul, J. XPS characterisation of chalcopyrite chemically and bio-leached at high and low redox potential. Miner. Eng. 2005, 18, 505–515. [Google Scholar] [CrossRef]
  48. Basturkcu, H.; Acarkan, N.; Gock, E. The role of mechanical activation on atmospheric leaching of a lateritic nickel ore. Int. J. Miner. Process. 2017, 163, 1–8. [Google Scholar] [CrossRef]
  49. Zhang, X.; Qian, Z.; Zheng, G.; Zhu, Y.; Wu, W. The design of a macromolecular depressant for galena based on DFT studies and its application. Miner. Eng. 2017, 112, 50–56. [Google Scholar] [CrossRef]
  50. Zhao, C.; Chen, J.; Li, Y.; Huang, D.W.; Li, W. DFT study of interactions between calcium hydroxyl ions and pyrite, marcasite, pyrrhotite surfaces. Appl. Surf. Sci. 2015, 355, 577–581. [Google Scholar] [CrossRef]
  51. Zheng, X.; Liu, L.; Nie, Z.; Yang, Y.; Chen, J.; Yang, H.; Xia, J. The differential adsorption mechanism of hexahydrated iron and hydroxyl irons on a pyrite (1 0 0) surface: A DFT study and XPS characterization. Miner. Eng. 2019, 138, 215–225. [Google Scholar] [CrossRef]
  52. Li, K.; Zhao, Y.; Zhang, P.; He, C.; Deng, J.; Ding, S.; Shi, W. Combined DFT and XPS investigation of iodine anions adsorption on the sulfur terminated (0 0 1) chalcopyrite surface. Appl. Surf. Sci. 2016, 390, 412–421. [Google Scholar] [CrossRef]
Figure 1. Unit cell of chalcopyrite. Red represents Cu atom, blue represents Fe atom, and yellow represents S atom.
Minerals 10 00788 g001
Figure 2. Mean diameter and specific surface area (a), XRD spectra (b) and unit lattice parameter patterns (c) of chalcopyrite with different activation time. Error bars represent the standard deviation from three independent experiments (n = 3).
Minerals 10 00788 g002aMinerals 10 00788 g002b
Figure 3. SEM micrographs of chalcopyrite ground for 0 min (unactivated) (a), 10 min (b), 30 min (c), 60 min (d), 90 min (e), 120 min (f), and 180 min (g).
Minerals 10 00788 g003
Figure 4. The forward cyclic voltammetry (CV) (a) and reverse CV (b) of chalcopyrite.
Minerals 10 00788 g004
Figure 5. The changes in redox potential values (a), pH values (b), cell densities (c), cell adsorption (d), [Fe3+] (e), total [Fe] (f) and [Cu2+] (g) during the bioleaching of chalcopyrite mechanically activated in different time. Error bars represent standard deviation from three independent experiments (n = 3).
Minerals 10 00788 g005aMinerals 10 00788 g005b
Figure 6. Optimized perfect chalcopyrite (0 0 1) surface, top views (a), side views (e); S-defect chalcopyrite (0 0 1) surface, top views (b), side views (f); Fe-defect chalcopyrite (0 0 1) surface, top views (c), side views (g); Cu-defect chalcopyrite (0 0 1) surface, top views (d), side views (h).
Minerals 10 00788 g006aMinerals 10 00788 g006b
Figure 7. Optimized configurations of adsorbed glucose on the chalcopyrite (0 0 1) surface. (af), single hydroxyl of glucose adsorbs on the Fe, S, Cu, S defect, Fe defect and Cu defect sites; (gk), polyhydroxyl of glucose adsorbs on top, hollow, S defect, Fe defect and Cu defect sites, respectively.
Minerals 10 00788 g007aMinerals 10 00788 g007b
Figure 8. PDOS of single hydroxyl adsorbing on the S-defect site (a,b), Cu-defect site (c,d); polyhydroxyl adsorbing on the hollow site (e,f), S-defect site (g,h), and Fe-defect site (i,j).
Minerals 10 00788 g008aMinerals 10 00788 g008b
Table 1. Contact angle under different ball grinding time.
Grinding Time (min)Contact Angle (°)
0107.2
10111.7
30112.4
60111.9
90112.0
120114.5
180110.8
Table 2. Optimized lattice parameters (in Å) of bulk chalcopyrite.
a = bc
5.28910.423Experiment
5.27510.393XRD
5.31110.417Calculation
Table 3. Surface charge comparison.
Optimized ConfigurationCharge of S2Charge of Fe1Charge of Cu3
Perfect surface−0.2500.3900.350
S-defect surface-0.3300.320
Fe-defect surface−0.180-0.330
Cu-defect surface−0.1700.190-
Table 4. Bond Lengths and Mulliken bond populations.
Optimized ConfigurationBondBond Lengths(Å)Populations
aO-Fe13.233-
bO-S22.738−0.05
cO-Cu33.188-
dO-Cu12.7140.09
eO-S23.312-
fO-Fe12.9830.09
gO-S13.080-
hO-Cu22.6750.07
iO-Cu12.0320.25
jO-Cu12.3430.19
kO-S83.337-
Table 5. Adsorption energies of glucose on the chalcopyrite (0 0 1) surface.
Optimized ConfigurationEad (eV)
a−0.34
b−0.13
c−0.23
d−0.96
e−1.23
f−1.06
g−0.98
h−0.71
i−1.58
j−1.76
k−1.42
“−” represents exothermic reaction.

