A Geospatial Database for Effective Mine Rehabilitation in Australia

 ,
,  , , ,
, , ,
Abstract
:1. Introduction
2. Methodology and Data Sources
2.1. Data Sources and Evaluation
2.2. Data Classification and Database Compilation
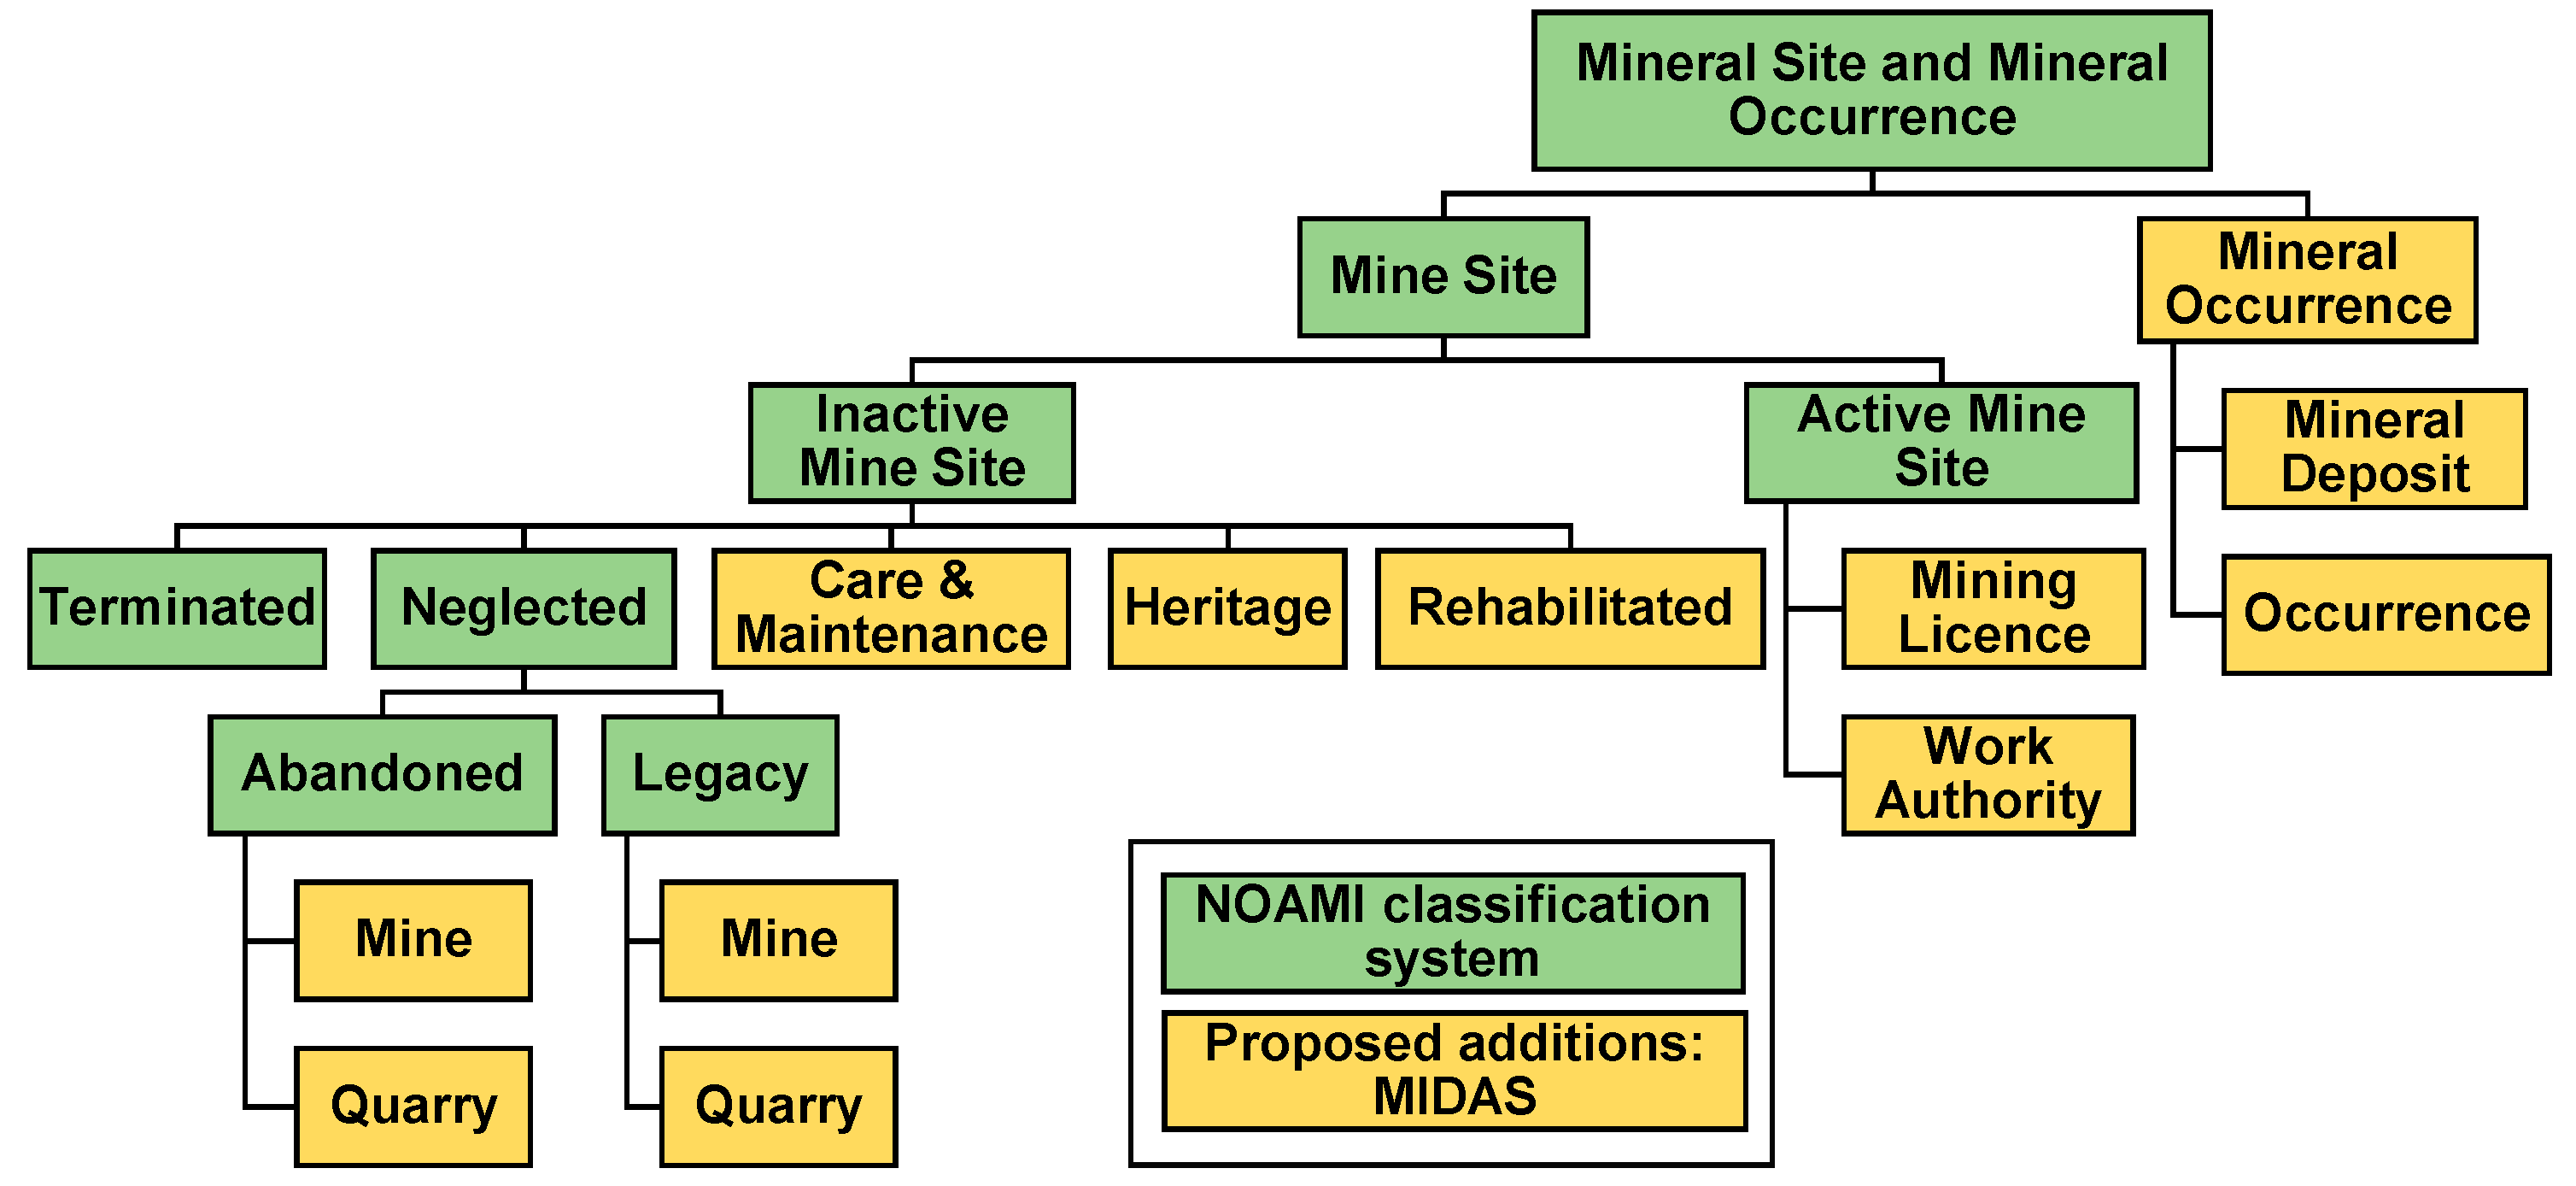
- Mining site: The definition of a mining site was left relatively broad to ensure comprehensiveness, but only included site types of significant size or potential impact (such that they are reported at a state level), to reduce the chance of overestimation and the dilution of database significance. Hence, for practicality purposes, our database excludes mines that are operated at very small scales (e.g., some clay and sand mining operations), such that their environmental or socioeconomic impacts do not warrant significant consideration for national rehabilitation efforts.
- Active mine: Defined as a site on which mineral exploration, mining or processing is ongoing with regulatory approvals in place. Active mineral exploration sites are those sites included in the approved work program of the current mineral tenure holder, those sites covered by the appropriate mining permissions and those sites involved in the ongoing process of beneficiating mine commodities. An active mine incorporates the following two classifications depending on its mined resource and regulatory approvals required:
- ○
- Work authority license sites are delineated for the extractive/quarry industries. An extractive work authority license gives quarry operators the right to extract stone (e.g., sand, gravel and hard rock) from land with the landholder’s consent. Australian states and territories may have different terms for a work authority license such as an extractive industry license.
- ○
- Mining license sites have appropriate approvals in place to mine for specified minerals (e.g., zinc, copper, coal, gold and mineral sands).
- Inactive mine: All mineral sites that are not considered active mineral sites were ultimately assigned under this umbrella term. Inactive sites may be inactive for many reasons including (a) completion of the exploration, mining or processing project; (b) standby status of exploration, mining or processing projects awaiting better market conditions; and (c) loss of owner/operator capability for any number of reasons. For any of these reasons, inactive mines can be further classified as:
- ○
- Terminated/Ceased: Where operations have ceased, with there being little to no prospects for rehabilitation.
- ○
- Care and maintenance: A closed mine site where there is potential to recommence operations at a later date. During the care and maintenance phase, production is ceased although is managed to ensure it remains in a safe and stable condition.
- ○
- Heritage sites: Located within World Heritage, National Heritage, or state or local government heritage sites. A site may also be classified as a heritage site due its historical importance. Active heritage sites are defined similar to an inactive heritage mine site although are currently active and operational in mineral extraction, mining or processing. Some active mines may have partial areas that may be considered heritage.
- ○
- Neglected (Abandoned/Legacy) sites: Sites that have been inactive for at least one year, with no implementation or assurance of a plan for management or remediation and with the mined land having been adversely affected by resource extraction. Further, an abandoned site can be classified as a mine site that lies on Crown Land whilst a legacy site is one that lies on Private Land. We note that VIC was the only state where we had adequate information to distinguish between abandoned and legacy sites. Similar sites in all other states were simply classified as neglected. For comparative purposes, we summarise all mines in this category as neglected in later sections.
- Mineral occurrences: Undeveloped sites were also considered for purposes of developing an indication of the potential number of sites for future mining, and hence longer-term rehabilitation requirements.
- Rehabilitated sites: Inactive mine sites that have successfully completed remediation objectives. Upon remediation, this type of site has a defined post-mining land use (e.g., agriculture, forestry and lakes) with no further mining care and maintenance required from authorities.
2.3. Spatial and Site-Specific Analyses
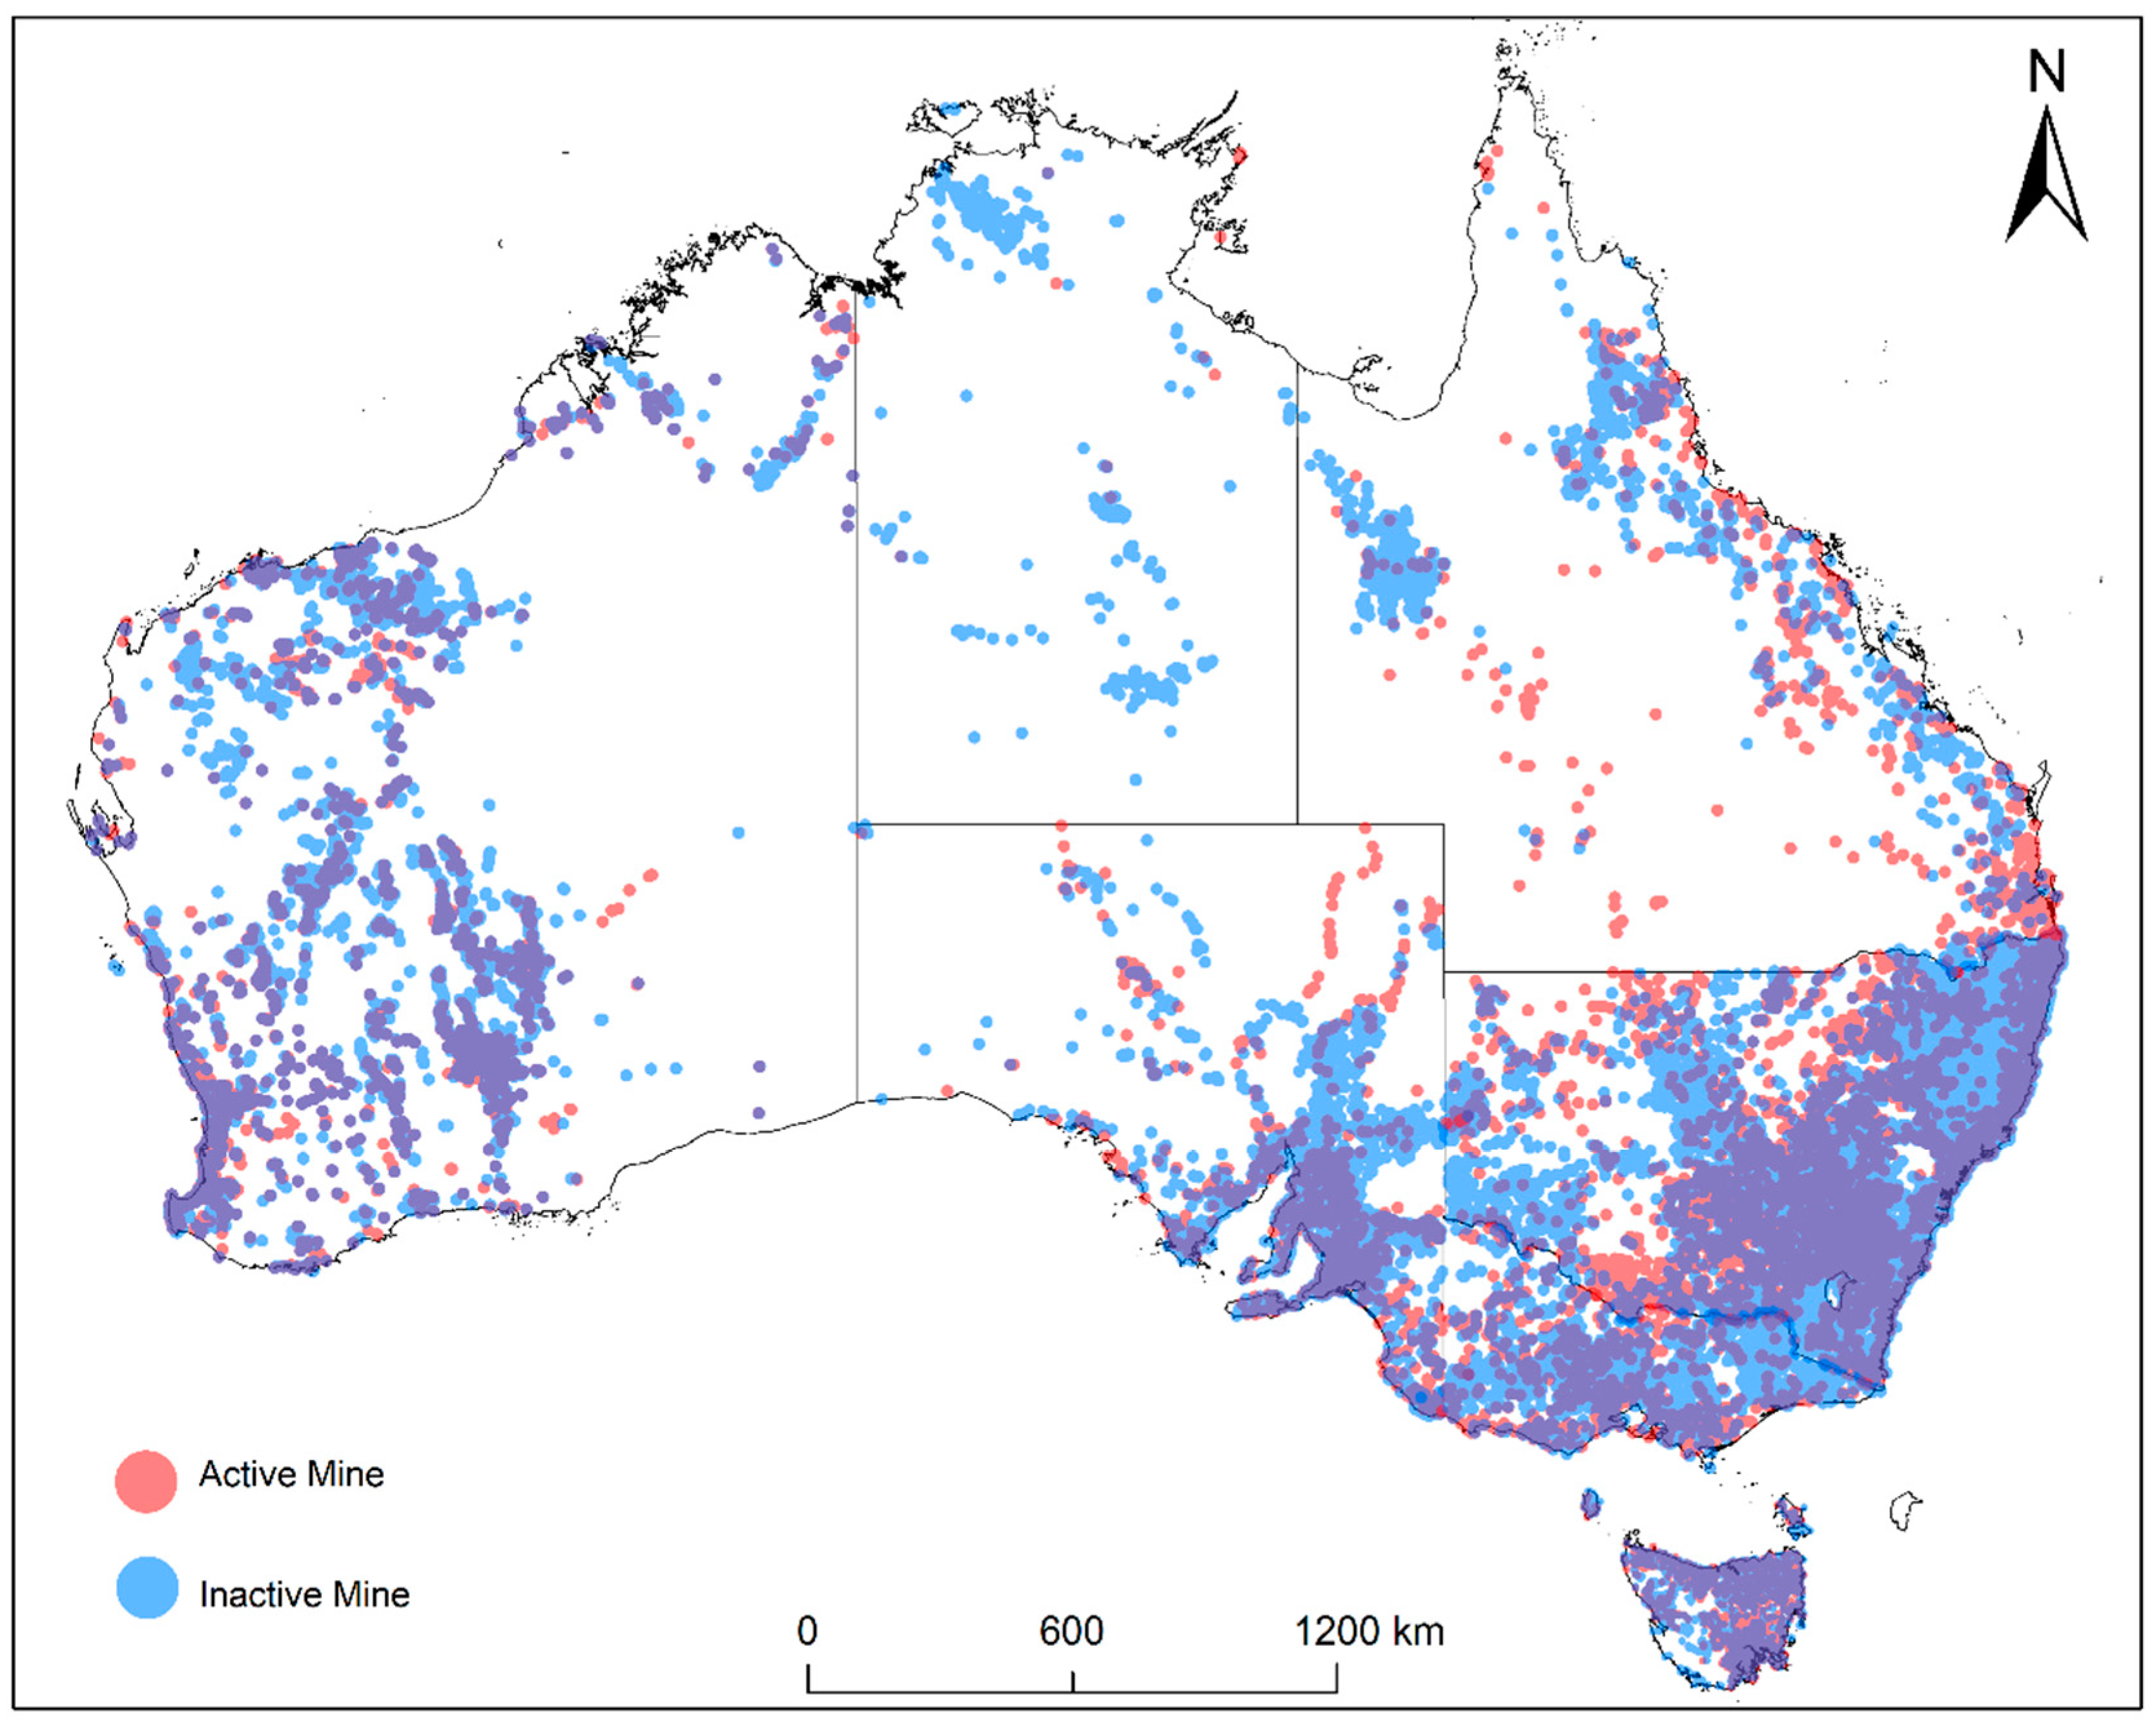
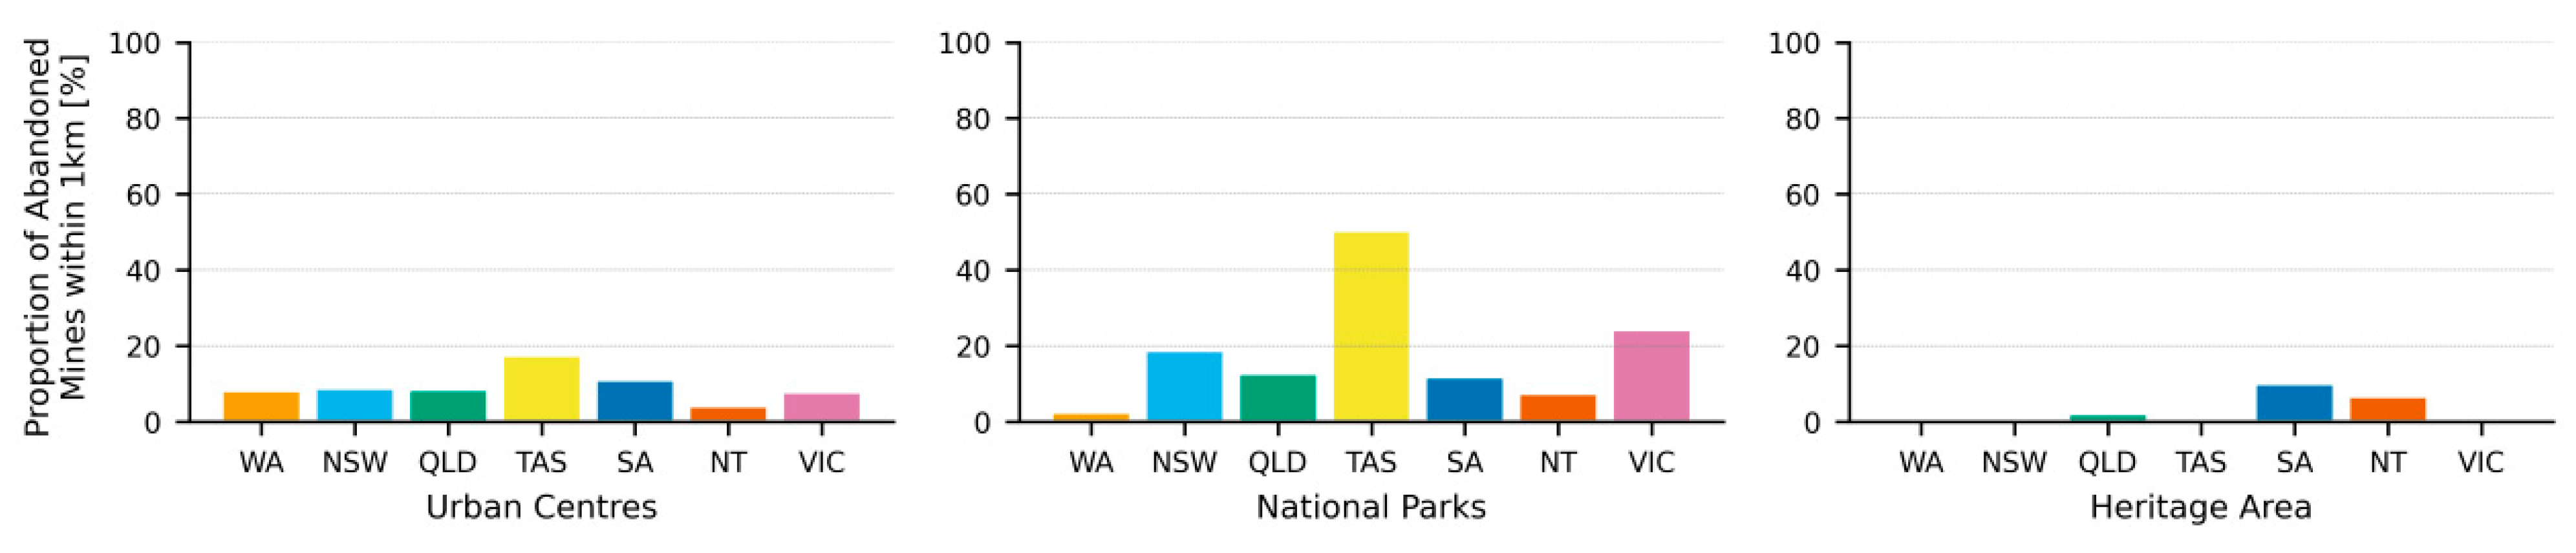
2.3.1. National and State-Level Analysis
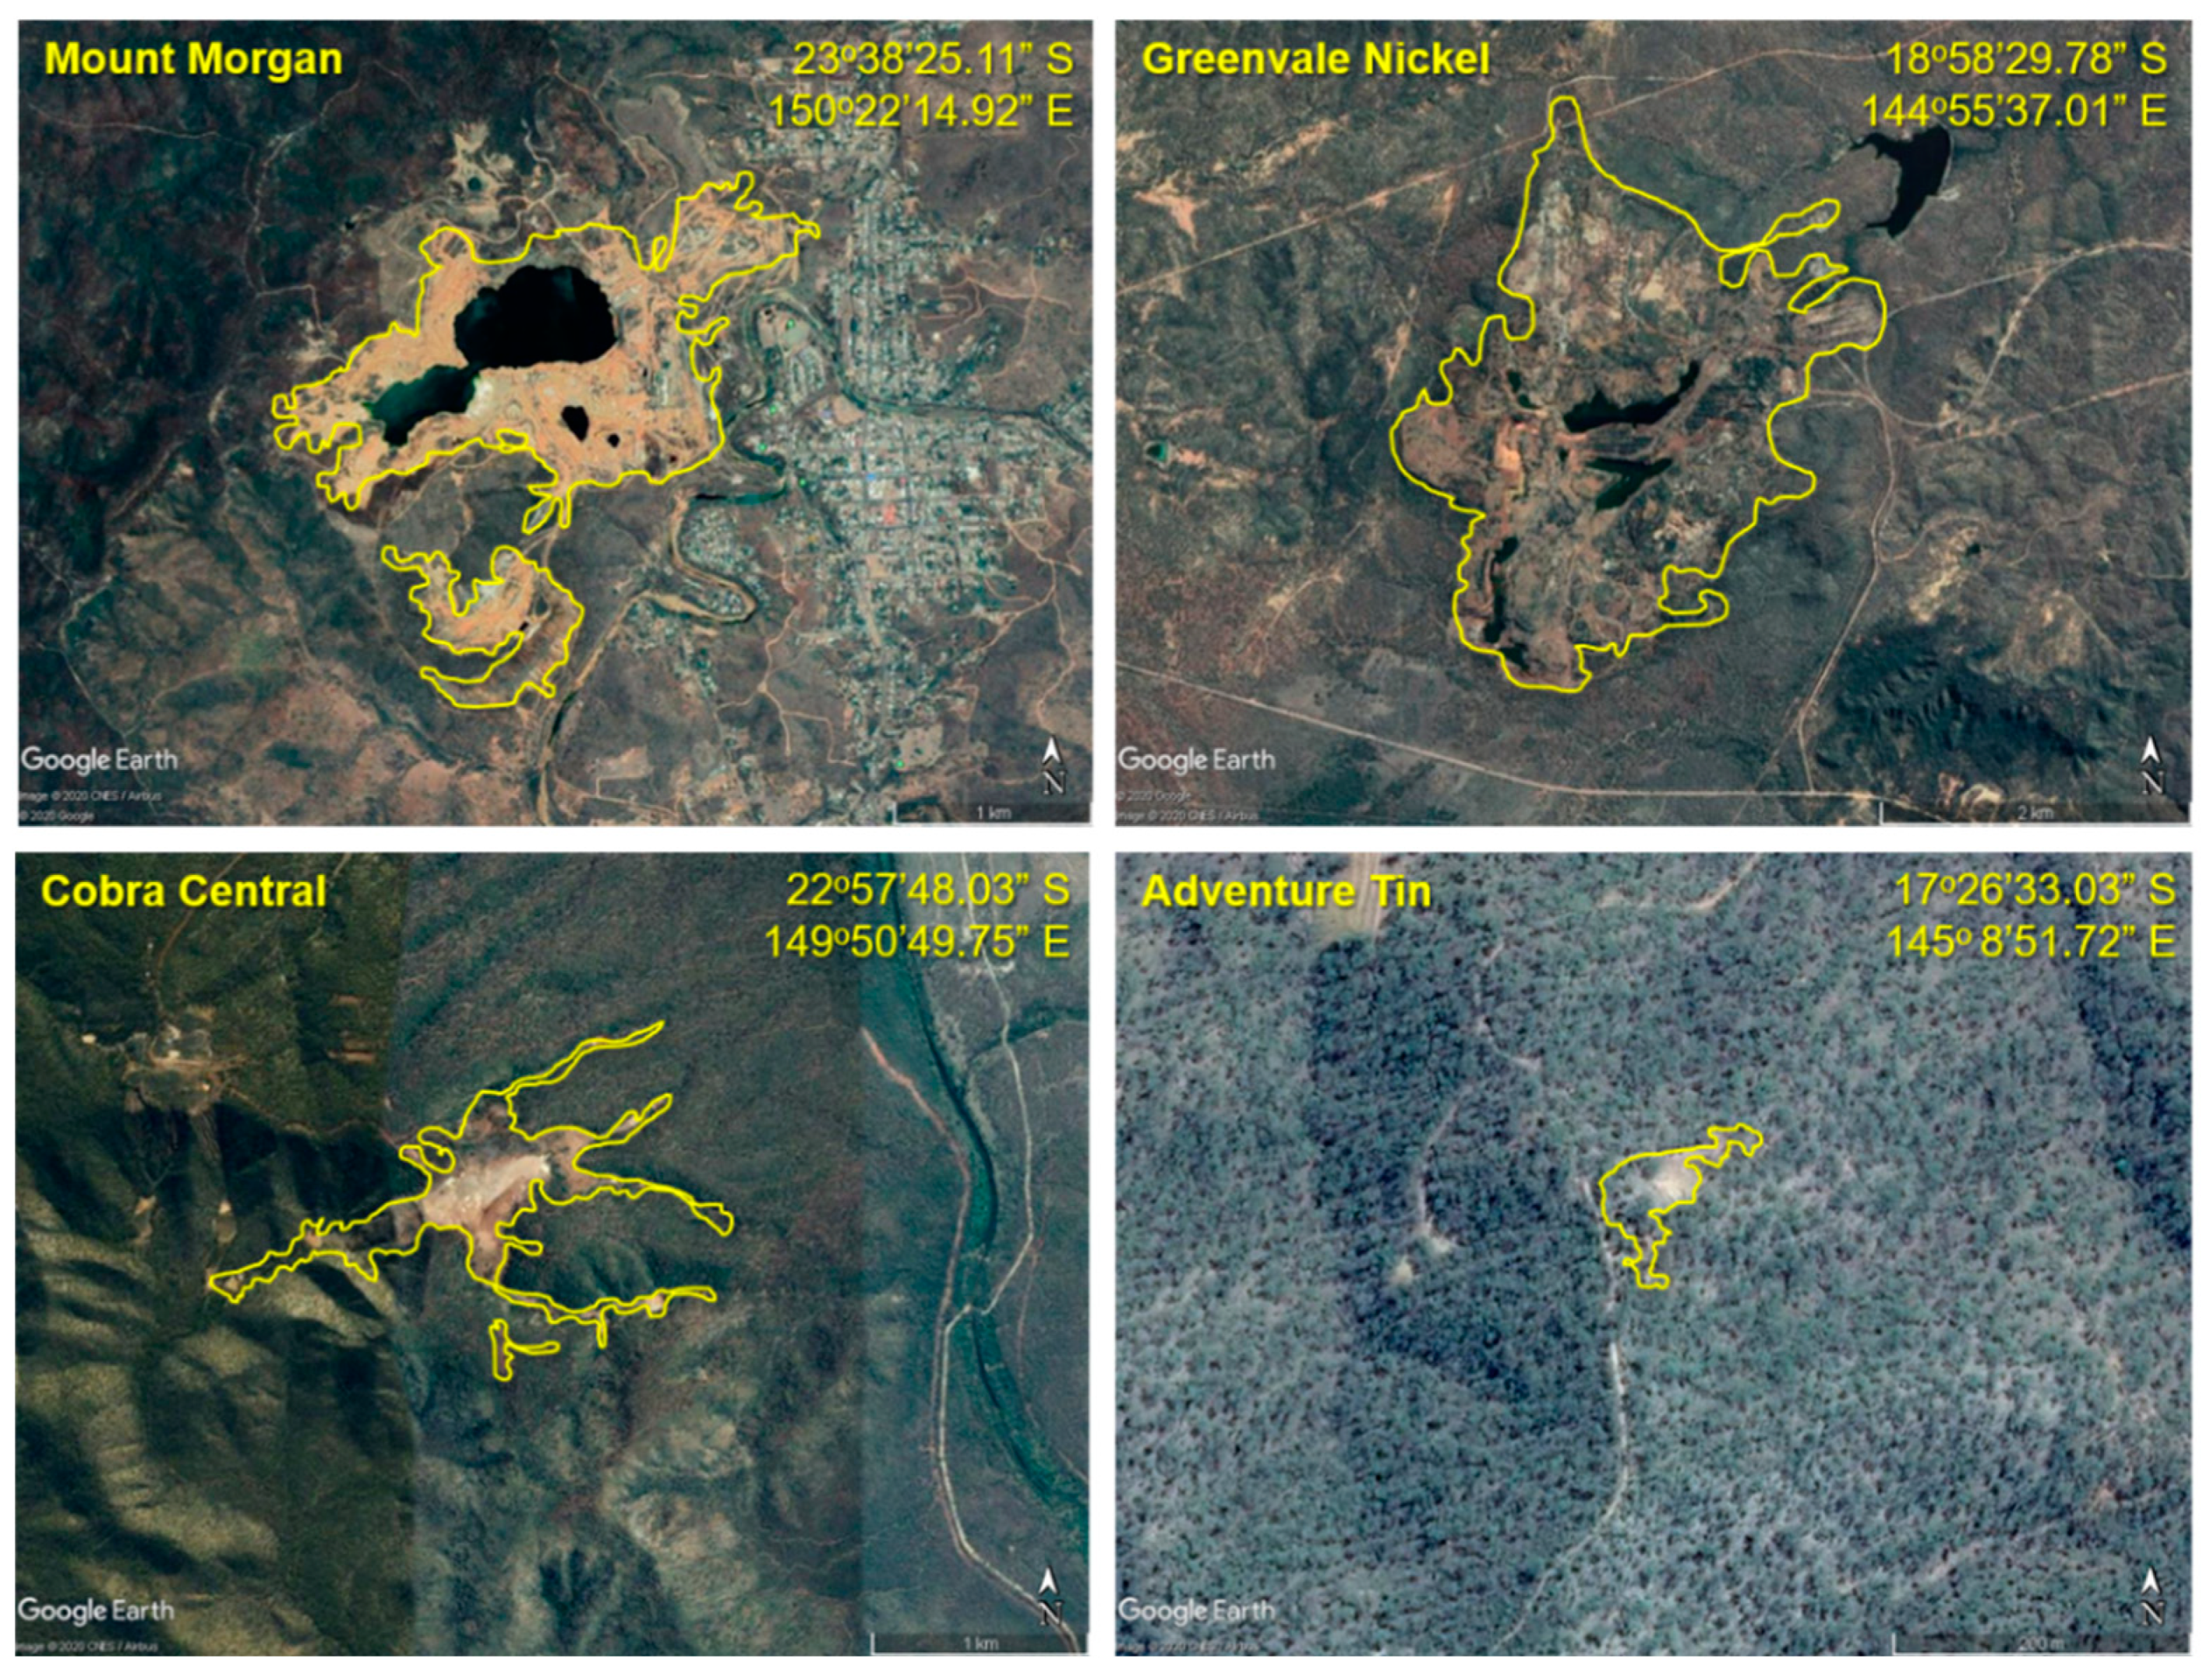
2.3.2. Site-Specific Environmental Risk Assessment—Queensland Case Studies
3. Results and Discussion
3.1. National Mine Classification and Database Summary
3.2. Spatial Distribution of Inactive Mines
3.3. Site-Specific Comparative Environmental Risk Assessments
4. Evaluation and Implications
4.1. Accuracy and Data Limitations
4.2. Local Impacts and Challenges of Inactive Mines
4.3. Towards a Unified Approach: Meeting the Needs of the Senate Inquiry
4.4. Environmental Challenge or Economic Opportunity?
- -
- Construction works (restoration and rehabilitation) [52];
- -
- Tourism potential to rehabilitated sites (e.g., bike paths and recreational lakes) [53];
- -
- Carbon farming opportunities (e.g., via Eucalyptus plantation on rehabilitated lands);
- -
- Overburden waste for making building bricks and ceramic products to support regional construction industry [54];
- -
- Potential to use rehabilitation areas for renewable energy generation;
- -
- -
- Consulting practice through the monitoring of rehabilitated conditions (geotechnical and environmental).
Supplementary Materials
Author Contributions
Funding
Acknowledgments
Conflicts of Interest
References
- International Monetary Fund. International Trade in Goods and Services ABS Cat No. 5368 Table 3; Australian Bureau of Statistics: Canberra, Australia, 2017.
- Unger, C.; Lechner, A.; Glenn, V.; Edraki, M.; Mulligan, D. Mapping and prioritising rehabilitation of abandoned mines in Australia. In Proceedings of the Life of Mine Conference (AusIMM), Brisbane, Australia, 10–12 July 2012; pp. 259–266. [Google Scholar]
- Werner, T.T.; Bebbington, A.; Gregory, G. Assessing impacts of mining: Recent contributions from GIS and remote sensing. Extr. Ind. Soc. 2019, 6, 993–1012. [Google Scholar] [CrossRef]
- Australian Senate. Rehabilitation of Mining and Resources Projects and Power Station Ash Dams as it Relates to Commonwealth Responsibilities; Environment and Communications Reference Committee: Canberra, Australia, 2017.
- Day, B.; Act, E.; Milestone, F.; Schedule, F.; Act, O. Environment Protection and Biodiversity Conservation Act 1999; Parliament of Australia: Canberra, Australia, 1999.
- Cassard, D.; Bertrand, G.; Billa, M.; Serrano, J.-J.; Tourlière, B.; Angel, J.-M.; Gaál, G. ProMine Mineral Databases: New tools to assess primary and secondary mineral resources in Europe. In 3D, 4D and Predictive Modelling of Major Mineral Belts in Europe; Springer: Berlin/Heidelberg, Germany, 2015; pp. 9–58. [Google Scholar]
- Bao, N.; Lechner, A.M.; Johansen, K.; Ye, B. Object-based classification of semi-arid vegetation to support mine rehabilitation and monitoring. J. Appl. Remote Sens. 2014, 8, 83564. [Google Scholar] [CrossRef]
- Taylor, M.P.; Mackay, A.K.; Hudson-Edwards, K.A.; Holz, E. Soil Cd, Cu, Pb and Zn contaminants around Mount Isa city, Queensland, Australia: Potential sources and risks to human health. Appl. Geochem. 2010, 25, 841–855. [Google Scholar] [CrossRef]
- Lechner, A.M.; Kassulke, O.; Unger, C. Spatial assessment of open cut coal mining progressive rehabilitation to support the monitoring of rehabilitation liabilities. Resour. Policy 2016, 50, 234–243. [Google Scholar] [CrossRef]
- Sonter, L.J.; Ali, S.H.; Watson, J.E. Mining and biodiversity: Key issues and research needs in conservation science. Proc. R. Soc. B 2018, 285, 20181926. [Google Scholar] [CrossRef]
- Werner, T.T.; Mudd, G.M.; Schipper, A.M.; Huijbregts, M.A.J.; Taneja, L.; Northey, S.A. Global-scale remote sensing of mine areas and analysis of factors explaining their extent. Glob. Environ. Chang. 2020, 60, 102007. [Google Scholar] [CrossRef]
- Northey, S.A.; Mudd, G.M.; Werner, T.T.; Jowitt, S.M.; Haque, N.; Yellishetty, M.; Weng, Z. The exposure of global base metal resources to water criticality, scarcity and climate change. Glob. Environ. Chang. 2017, 44, 109–124. [Google Scholar] [CrossRef]
- NOAMI: The Orphaned/Abandoned Mines Initiative—Canada. Available online: https://www.abandoned-mines.org/en/ (accessed on 25 May 2020).
- Unger, C.; Lechner, A.; Kenway, J.; Glenn, V.; Walton, A. A jurisdictional maturity model for risk management, accountability and continual improvement of abandoned mine remediation programs. Resour. Policy 2015, 43, 1–10. [Google Scholar] [CrossRef]
- Ministerial Council on Mineral and Petroleum Resouces. Strategic Framework for Managing Abandoned Mines in the Minerals Industry; Minerals Council of Australia: Canberra, Australia, 2010.
- Pepper, M.; Roche, C.; Mudd, G. Mining legacies—Understanding life-of-mine across time and space. In Proceedings of the Life of Mine Conference (AusIMM), Brisbane, Australia, 16–18 July 2014; pp. 449–465. [Google Scholar]
- Worrall, R.; Neil, D.; Brereton, D.; Mulligan, D. Towards a sustainability criteria and indicators framework for legacy mine land. J. Clean. Prod. 2009, 17, 1426–1434. [Google Scholar] [CrossRef]
- State of Queensland: QSpatial. Available online: http://qldspatial.information.qld.gov.au/cata-logue/ (accessed on 20 May 2019).
- State Government of Victoria: Data VIC. Available online: https://www.data.vic.gov.au/ (accessed on 13 March 2020).
- State Government of Victoria: Victoria’s Open Data Directory. Available online: https://discover.data.vic.gov.au/dataset/mines-and-mineral-occurrence-sites (accessed on 13 March 2020).
- Northern Territory State Government: Northern Territory Wide Geoscience Datasets. Department of Primary Industry and Resources. Available online: https://dpir.nt.gov.au/mining-and-energy/STRIKE/accessing-nt-datasets/nt-wide-geoscience-datasets (accessed on 10 April 2020).
- Mineral Resources Tasmania: Tasmania’s Mineral Industry. Available online: http://www.mrt.tas.gov.au/portal/mining (accessed on 25 May 2018).
- Department of Resources and Energy: MinView/NSW Geodata Warehouse. Available online: https://www.resourcesandenergy.nsw.gov.au/miners-and-explorers/geosci-ence-information/services/online-services/minview (accessed on 1 November 2018).
- Government of South Australia, Department for Energy and Mining: South Australian Resources Information Gateway (SARIG). Available online: https://map.sarig.sa.gov.au/ (accessed on 1 July 2019).
- Australian Mines Atlas: Australian Government. Available online: http://www.australianminesatlas.gov.au/ (accessed on 1 July 2019).
- Government of Western Australia: MINEDEX; Department of Mines, Industry Regulation and Safety (DMIRS). Available online: http://minedexext.dmp.wa.gov.au/minedex/external/com-mon/appMain.jsp (accessed on 1 November 2018).
- Miller, A.; Northey, S.; Yellishetty, M. Potential Environmental and Social-Economic Impacts from Neglected Mining Occurrences in Victoria, Australia. Submission 74 to Senate Inquiry for Rehabilitation of Mining and Resources Projects as it Relates to Commonwealth Responsibilities; Parliament of Australia: Canberra, Australia, 2017.
- Australian Statistical Geography Standard (ASGS). Volume 4—Significant Urban Areas, Urban Centres and Localities, Section of State; Australian Bureau of Statistics: Canberra, Australia, 2011.
- Open Street Map Contributors. Available online: https://www.openstreetmap.org (accessed on 20 March 2020).
- Schwarz-Schampera, U.; Terblanche, H.; Oberthür, T. Volcanic-hosted massive sulfide deposits in the Murchison greenstone belt, South Africa. Min. Depos. 2010, 45, 113–145. [Google Scholar] [CrossRef]
- Cook, N.J.; Sundblad, K.; Valkama, M.; Nygard, R.; Ciobanu, C.L.; Danyushevsky, L. Indium mineralisation in A-type granites in southeastern Finland; insights into mineralogy and partitioning between coexisting minerals. Chem. Geol. 2011, 284, 62–73. [Google Scholar] [CrossRef]
- Australian Bureau of Agriculture and Resource Economics and Sciences: Forests of Australia. Available online: https://data.gov.au/data/dataset/forests-of-australia-2018 (accessed on 21 March 2020).
- CSIRO Land & Water: Atlas of Australian Acid Sulfate Soils. Available online: https://www.asris.csiro.au/themes/AcidSulfateSoils.html (accessed on 21 March 2020).
- Moss, R.L.; Tzimas, E.; Kara, H.; Willis, P.; Kooroshy, J. Critical Metals in Strategic Energy Technologies: Assessing Rare Metals as Supply-Chain Bottlenecks in Low-Carbon Energy Technologies; European Commission Joint Research Centre—Institute for Energy and Transport: Luxembourg, 2011. [Google Scholar]
- Ramsar. National Report on the Implementation of the Ramsar Convention on Wetlands. In Proceedings of the 12th Meeting of the Conference of the Contracting Parties, Punta del Este, Uruguay, 1–9 June 2015. [Google Scholar]
- Yenilmez, F.; Kuter, N.; Emil, M.K.; Aksoy, A. Evaluation of pollution levels at an abandoned coal mine site in Turkey with the aid of GIS. Int. J. Coal Geol. 2011, 86, 12–19. [Google Scholar] [CrossRef]
- Tiwari, A.K.; De Maio, M.; Singh, P.K.; Mahato, M.K. Evaluation of Surface Water Quality by Using GIS and a Heavy Metal Pollution Index (HPI) Model in a Coal Mining Area, India. Bull. Environ. Contam. Toxicol. 2015, 95, 304–310. [Google Scholar] [CrossRef] [PubMed]
- Walsh, S.D.; Northey, S.A.; Huston, D.; Yellishetty, M.; Czarnota, K. Bluecap: A geospatial model to assess regional economic-viability for mineral resource development. Resour. Policy 2020, 66, 101598. [Google Scholar] [CrossRef]
- Audet, P.; Arnold, S.; Lechner, A.; Baumgartl, T. Site-specific climate analysis elucidates revegetation challenges for post-mining landscapes in eastern Australia. Biogeosciences 2013, 10, 6545–6557. [Google Scholar] [CrossRef] [Green Version]
- AditNow. Adventure Tin Mine. Available online: https://www.aditnow.co.uk/Mines/Adventure-Tin-Mine_12641/ (accessed on 18 August 2020).
- Vicente-Beckett, V.A.; McCauley, G.J.T.; Duivenvoorden, L.J. Metals in agricultural produce associated with acid-mine drainage in Mount Morgan (Queensland, Australia). J. Environ. Sci. Health Part A 2016, 51, 561–570. [Google Scholar] [CrossRef]
- Mhlongo, S.E.; Amponsah-Dacosta, F. A review of problems and solutions of abandoned mines in South Africa. Int. J. Min. Reclam. Environ. 2016, 30, 279–294. [Google Scholar] [CrossRef]
- Giurco, D.; Prior, T.; Mason, L.; Mohr, S.; Mudd, G. Life-of-resource sustainability considerations for mining. Aust. J. Civ. Eng. 2012, 10, 47–56. [Google Scholar] [CrossRef]
- Devillers, R.; Jeansoulin, R.; Goodchild, M.F. Fundamentals of Spatial Data Quality; ISTE: London, UK, 2006. [Google Scholar]
- Edraki, M.; Golding, S.; Baublys, K.; Lawrence, M. Hydrochemistry, mineralogy and sulfur isotope geochemistry of acid mine drainage at the Mt. Morgan mine environment, Queensland, Australia. Appl. Geochem. 2005, 20, 789–805. [Google Scholar] [CrossRef]
- State Government of Victoria. Latrobe Valley Regional Rehabilitation Strategy; Department of Jobs, Precincts and Regions and Department of Environment, Land, Water and Planning: Victoria, Australia, 2020.
- Mudd, G. Expensive, dirty and dangerous: Why we must fight miners’ push to fast-track uranium mines. The ConversationAU, 17 July 2020. [Google Scholar]
- Stanley, M.; Gudgeon, K. Pilbara mining blast confirmed to have destroyed 46,000yo sites of ‘staggering’ significance. ABC News Pilbara, 27 May 2020. [Google Scholar]
- Campbell, R.; Linqvist, J.; Browne, B.; Swann, T.; Grudnoff, M. Dark Side of the Boom: What We Do and Don’t Know about Mines, Closures and Rehabilitation; Australia Institute: Canberra, Australia, 2017. [Google Scholar]
- Victorian Auditor-General’s Office. Rehabilitating Mines: Indepedent Assurance Report to Parliament 2020-21:1; Victorian Auditor-General’s Office: Melbourne, Australia, 2020.
- Horizon 2020 Work Program 2016–2017 20. General Annexes. Available online: http://ec.europa.eu/research/participants/data/ref/h2020/other/wp/2016-2017/annexes/h2020-wp1617-annex-ga_en.pdf (accessed on 22 August 2020).
- Taylor, M.; Yellishetty, M.; Panther, B.C. Geotechnical and Hydrogeological Evaluation of Artificial Soils to Remediate Acid Mine Drainage and Improve Mine Rehabilitation–An Australian Case Study. In Mine Planning and Equipment Selection; Springer: Berlin/Heidelberg, Germany, 2014; pp. 855–865. [Google Scholar]
- Daley, J. The Floating Solar Power Station in Anhui Province. Available online: https://www.smithson-ianmag.com/smart-news/china-launches-largest-floating-so-lar-farm-180963587/ (accessed on 30 May 2019).
- Yellishetty, M.; Karpe, V.; Reddy, E.; Subhash, K.; Ranjith, P.G. Reuse of iron ore mineral wastes in civil engineering constructions: A case study. Resour. Conserv. Recycl. 2008, 52, 1283–1289. [Google Scholar] [CrossRef]
- Gorakhki, M.H.; Bareither, C.A. Sustainable reuse of mine tailings and waste rock as water-balance covers. Minerals 2017, 7, 128. [Google Scholar] [CrossRef] [Green Version]
- Ahmari, S.; Zhang, L. Production of eco-friendly bricks from copper mine tailings through geopolymerization. Constr. Build. Mater. 2012, 29, 323–331. [Google Scholar] [CrossRef]


| State | Dataset | Database Notes and Accuracy |
|---|---|---|
| Queensland (QLD) | QSpatial (Queensland Mineral Occurrence Data and Coal Resource Sites) [18] |
|
| Victoria (VIC) | VIC Open Data Repository [19,20] |
|
| Northern Territory (NT) | NT Wide Geoscience Datasets [21] |
|
| Tasmania (TAS) | Mineral Resources Tasmania [22] |
|
| New South Wales (NSW) | MinView/NSW Geodata warehouse [23] |
|
| South Australia (SA) | SARIG [24] |
|
| Western Australia (WA) | Department of Mines, Industry Regulation and Safety [26] |
|
| National | Australian Mines Atlas [25] |
|
| Overlay Category | Rationale | Format Source(s) |
|---|---|---|
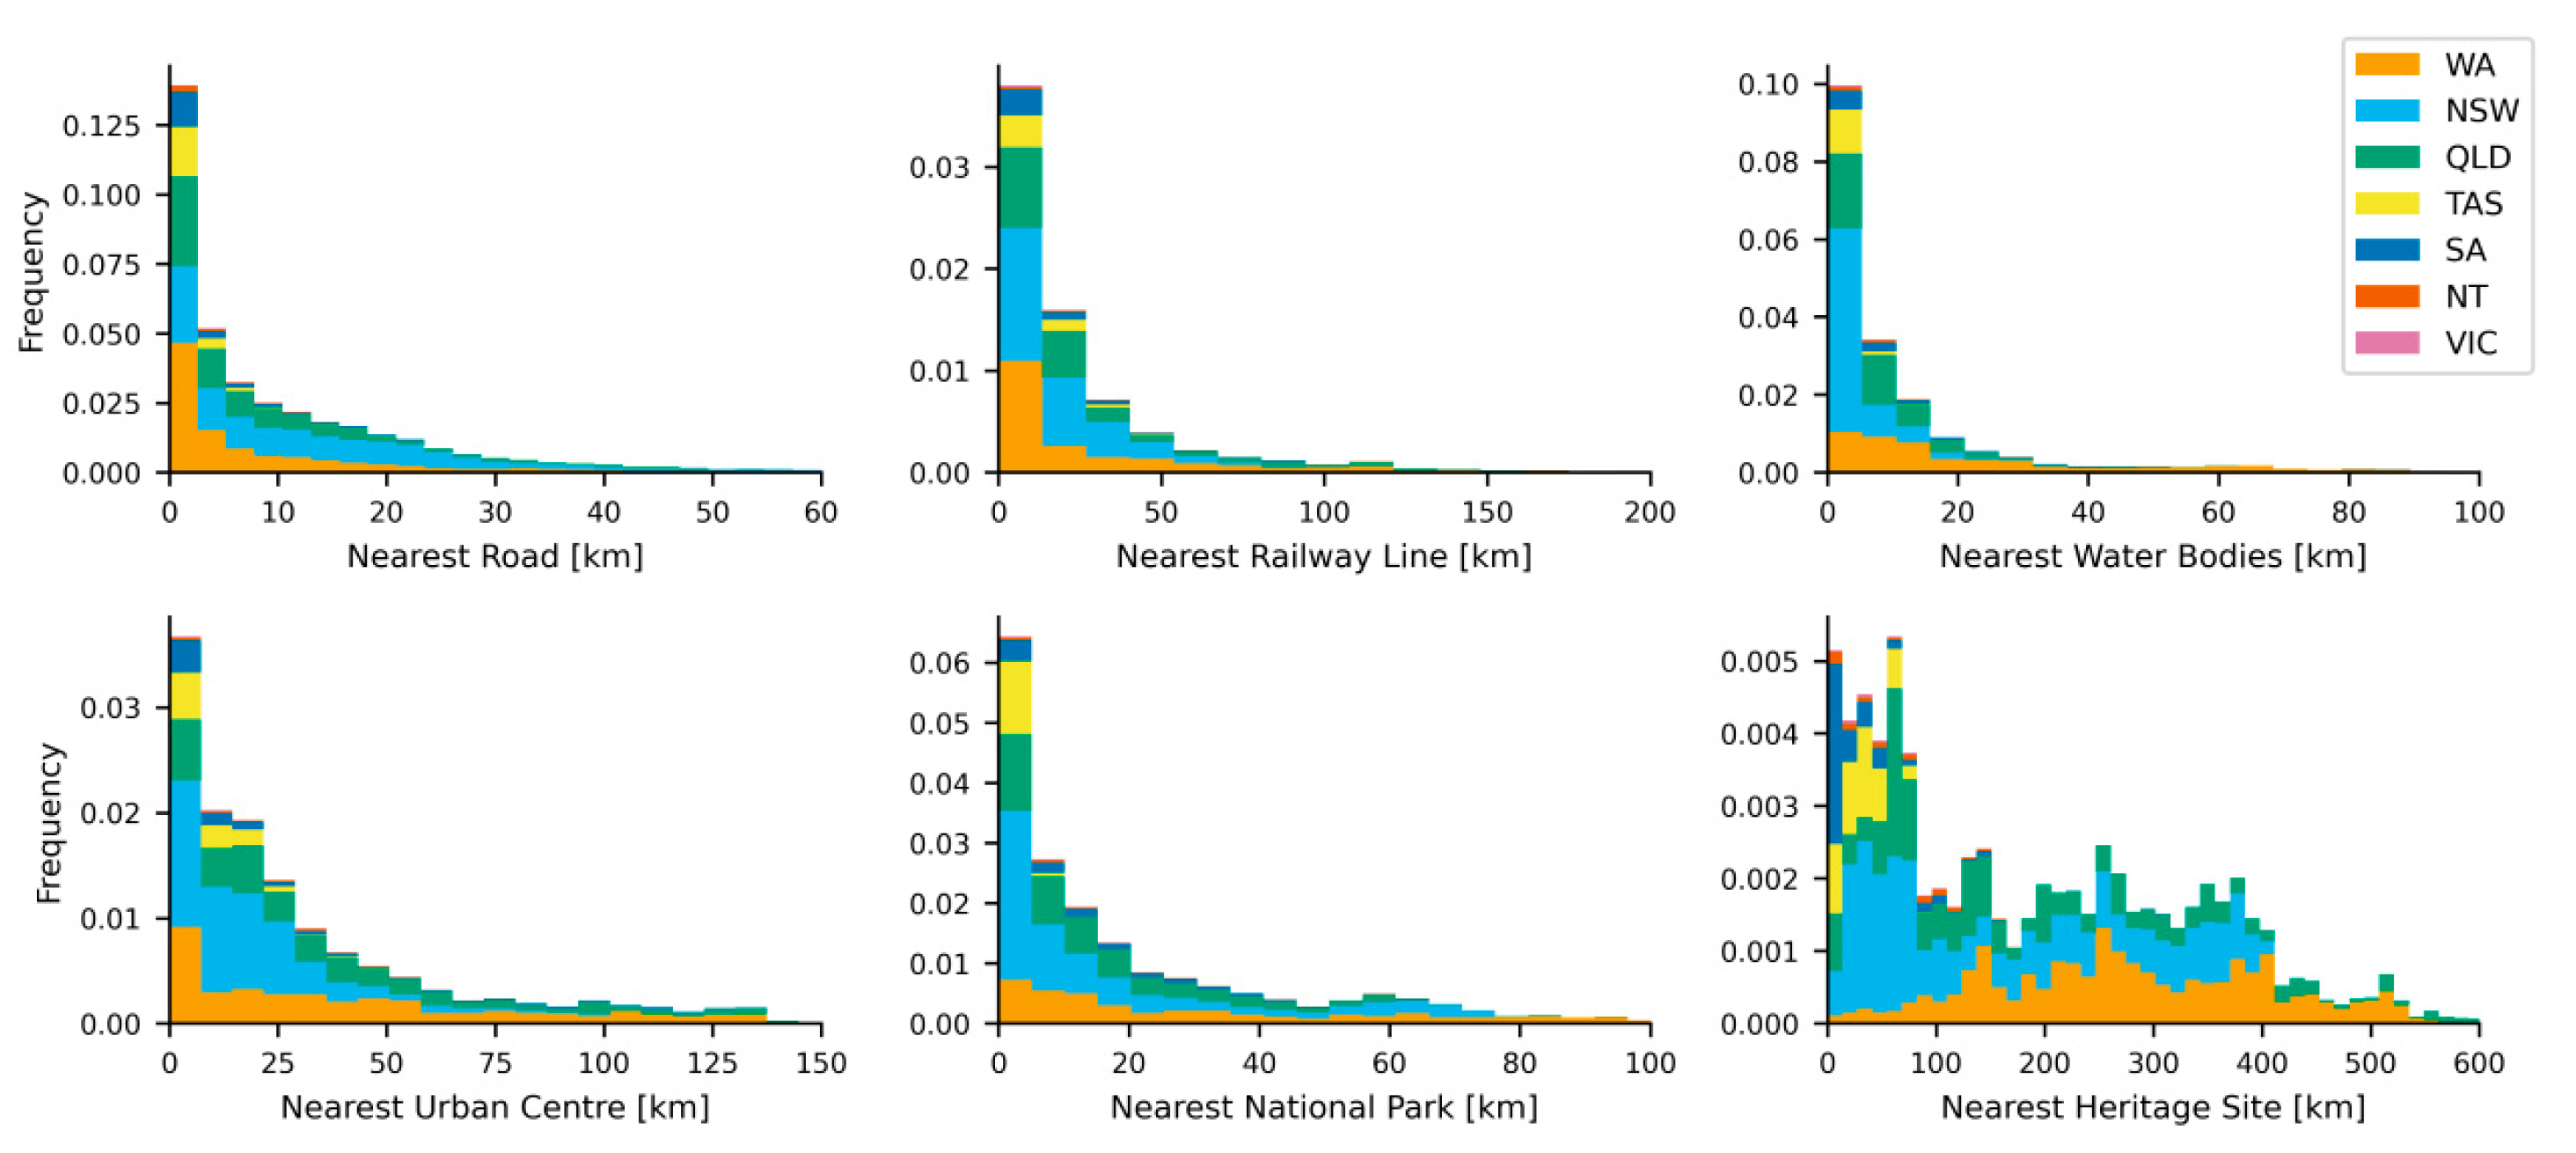
| Major Urban Centres | Proximity to major urban centres has a twofold implication: on the one hand, access to populous areas will create employment opportunities during rehabilitation; conversely, adverse impacts on urban areas may be felt from legacy issues. | Polygons [28] |
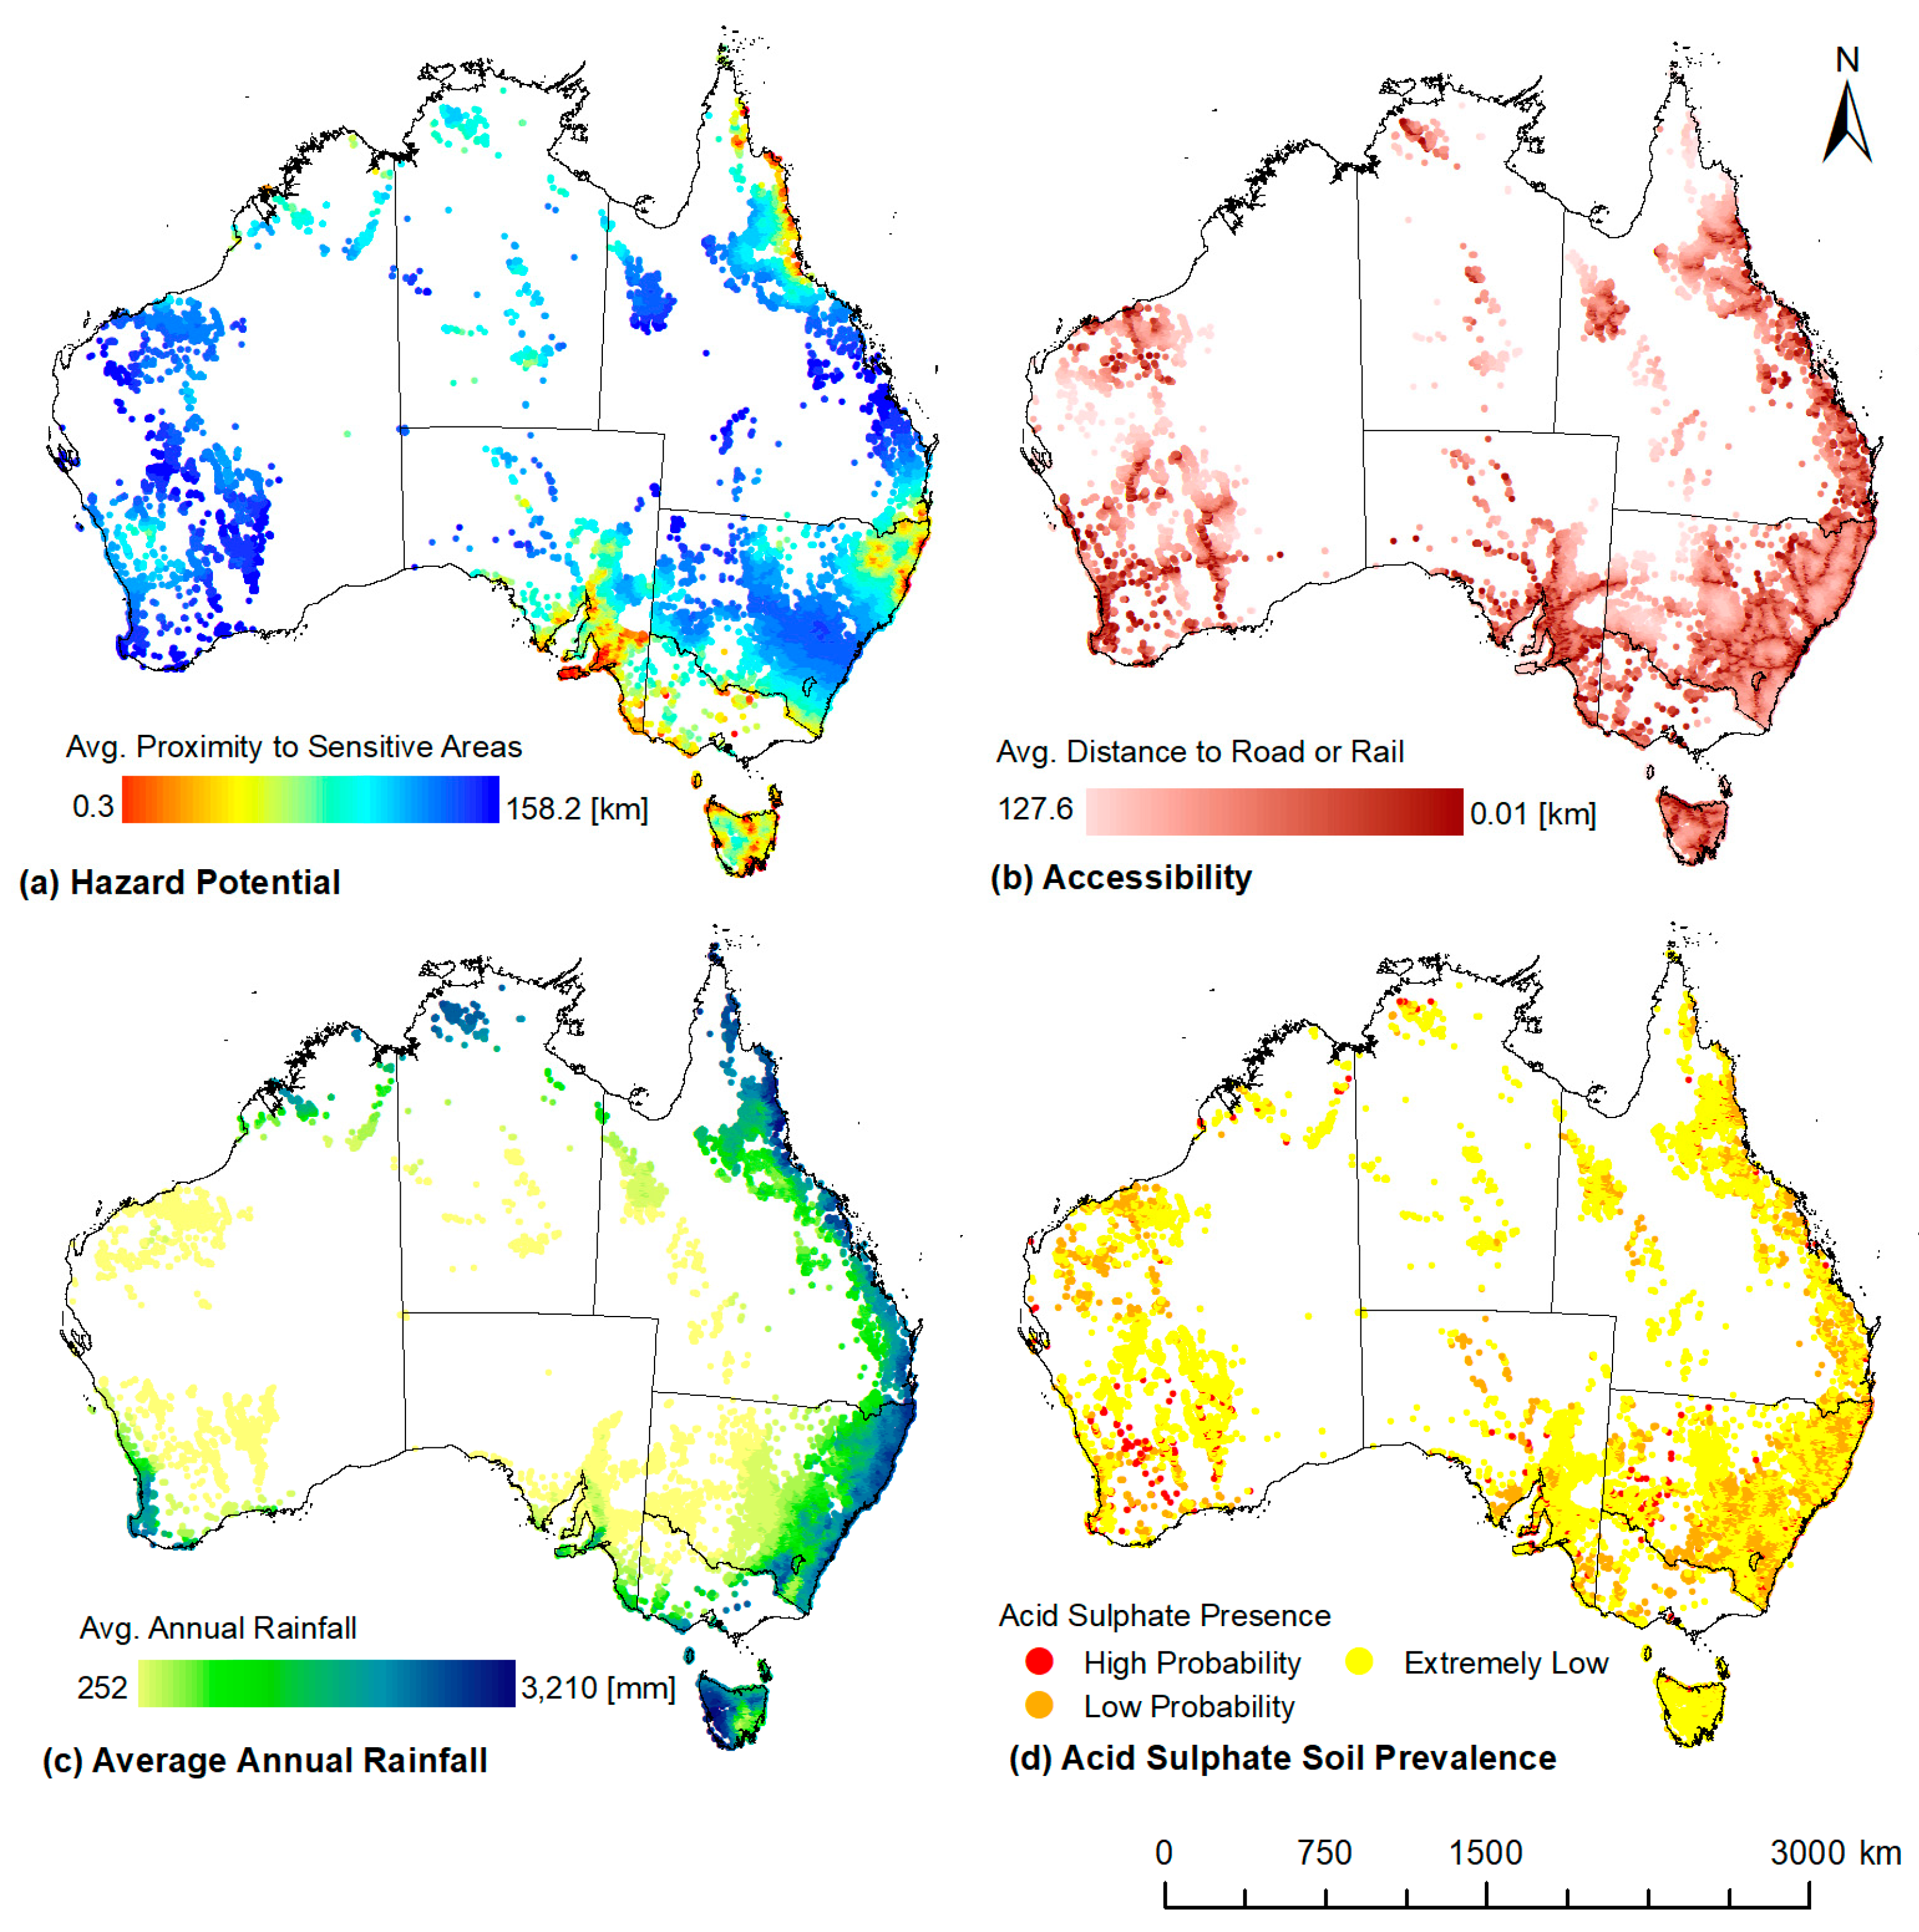
| Major Road and Rail Infrastructure | Proximity to road and rail infrastructure determines accessibility for resources required to conduct mine site rehabilitation, to remove waste materials, or to transport products, should the sites be deemed economically viable in future. | Lines [29] |
| Major Waterways and Lakes | Proximity to major waterways and lakes allows us to understand the potential environmental impact of rehabilitation measures on downstream natural aquatic environments. | Lines and Polygons [30] |
| Heritage and Indigenous Areas | Contain areas of international and Indigenous significance, relevant to the EPBC Act (1999) and within the scope of effects relevant to Commonwealth intervention. | Polygons [31] |
| National parks | Contain areas of national environmental significance, also relevant to the EPBC Act (1999) and within the scope of effects relevant to Commonwealth intervention. | Polygons [32] |
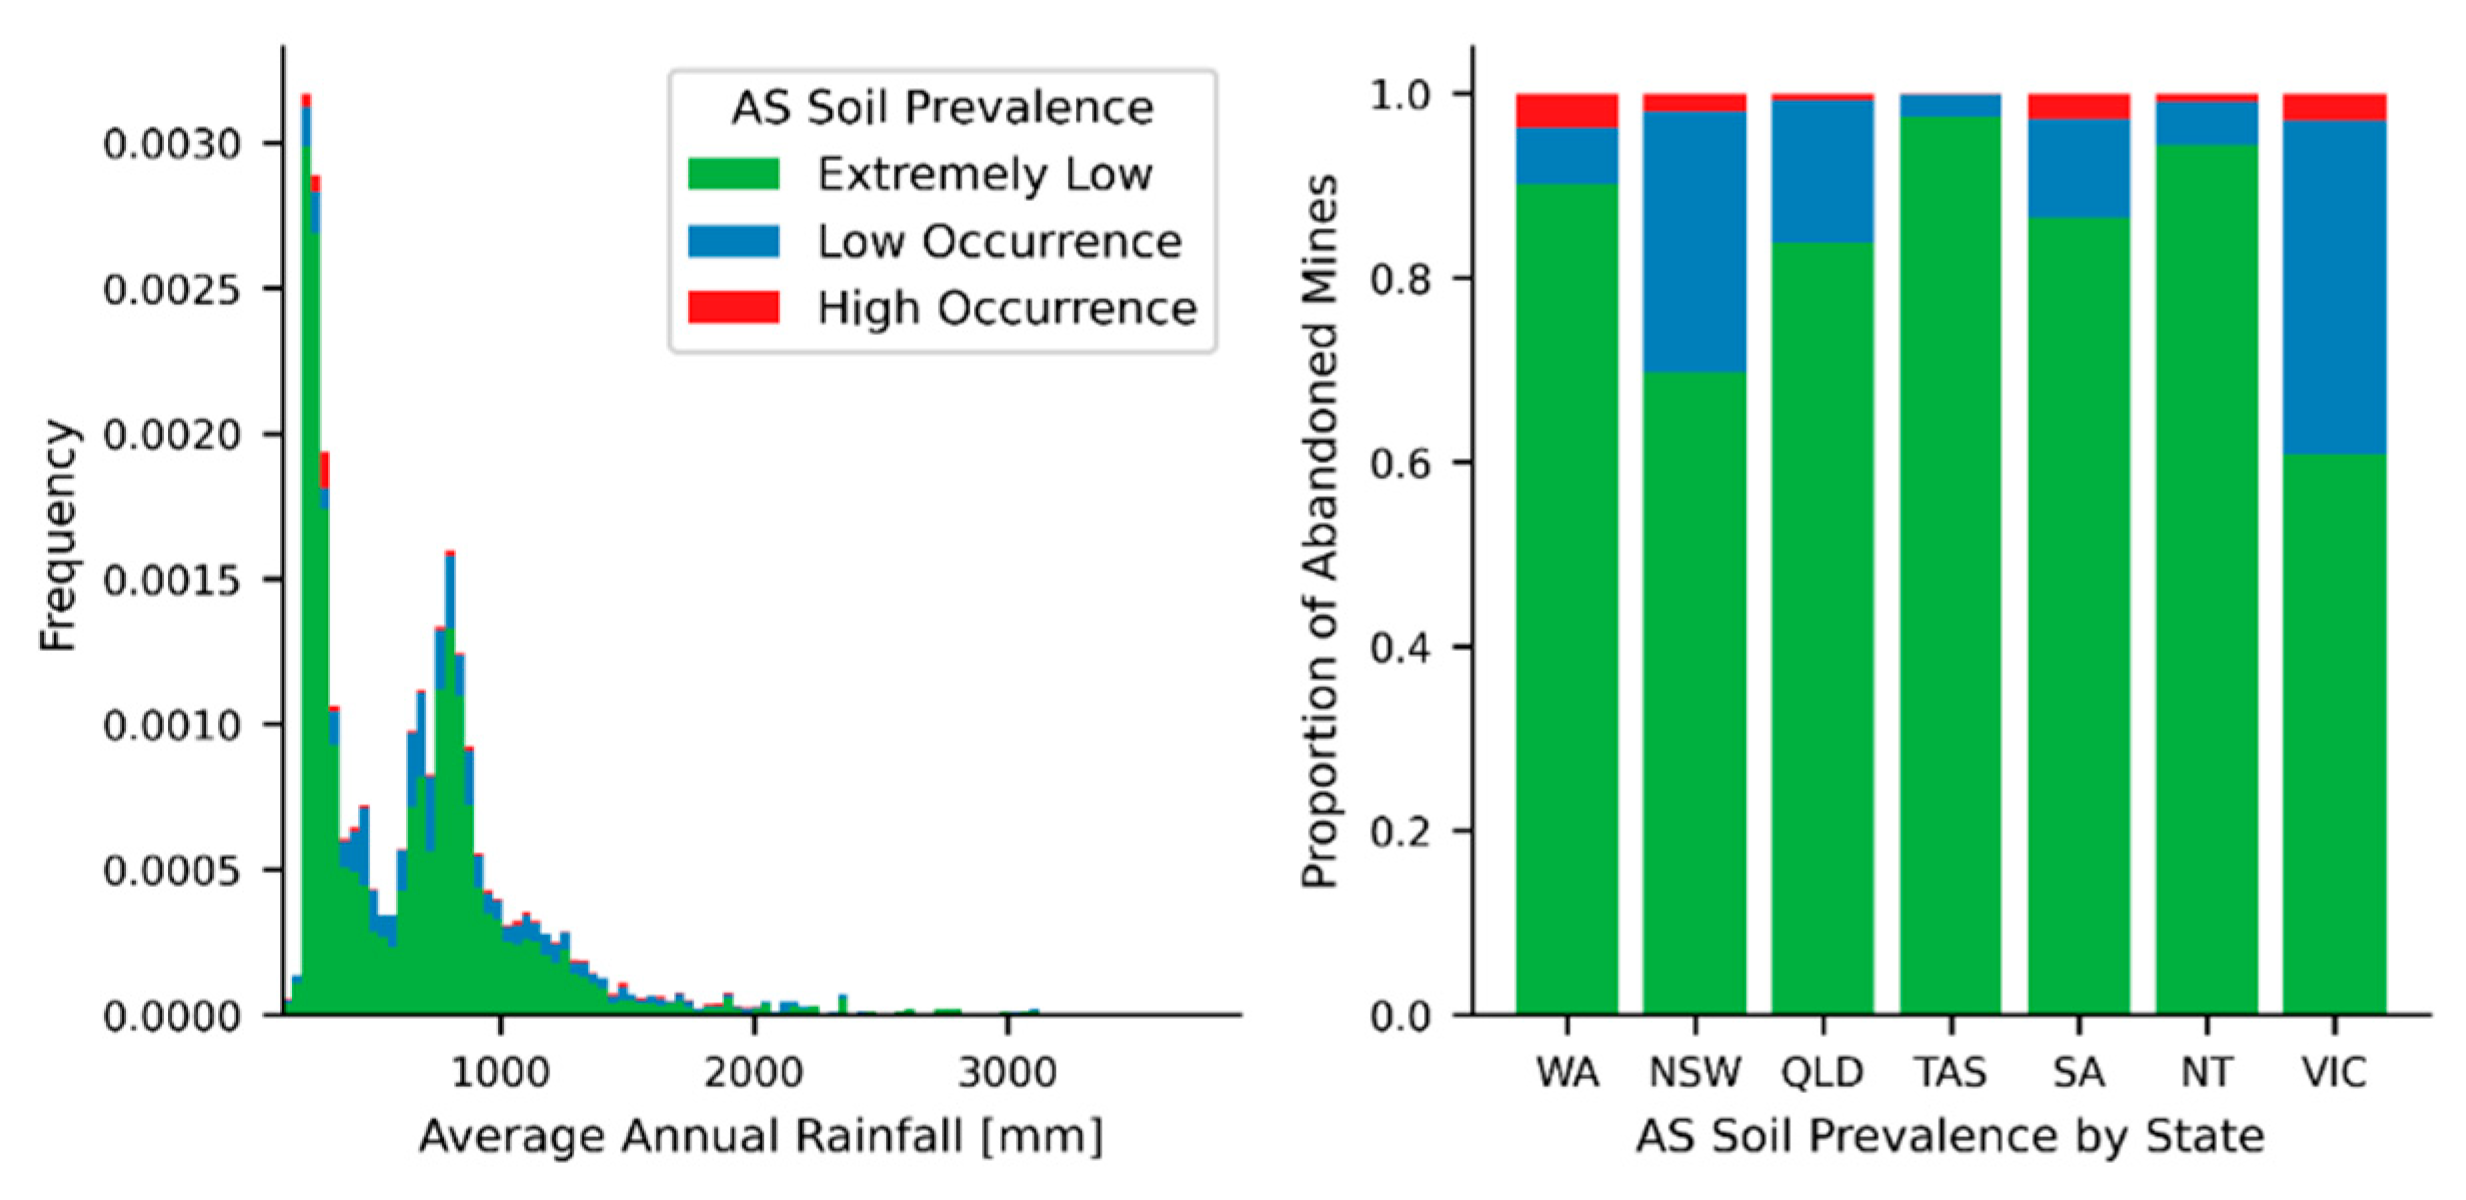
| Acid Sulphate Soils | Acid and metalliferous drainage (AMD) is a key environmental challenge induced by the exposure of sulphate rocks to rainfall, areas highlight the likelihood of acid sulphate soil prevalence. | Polygons [33] |
| Average Annual Rainfall | To establish potential interactions with receiving watercourses and lakes and with regions of high acid sulphate soil prevalence, we used long-term spatial average annual rainfall. | Raster [34] |
| State/Territory | VIC | NSW | WA | SA | QLD | TAS | NT | TOTAL | ||
|---|---|---|---|---|---|---|---|---|---|---|
| Inactive | Terminated/Ceased | 1 | 19,728 | N/A | 132 | N/A | 112 | 118 | 20,091 | |
| Neglected | Mines | 18,171 | 7183 | 20,303 | 3759 | 2820 | 4266 | 738 | 58,017 | |
| Quarries | 559 | 218 | ||||||||
| Care and Maintenance | 1 | 42 | 671 | 148 | 104 | N/A | 28 | 994 | ||
| Rehabilitated | N/A | N/A | 3068 | 13 | N/A | N/A | N/A | 3081 | ||
| Heritage | 2175 | N/A | N/A | N/A | 394 | N/A | 42 | 2611 | ||
| Active | Mining License | 2070 | 3447 | 1098 | 957 | 711 | 1305 | 11 | 10,526 | |
| Work Authority | 750 | 888 | ||||||||
| Heritage | N/A | N/A | ||||||||
| TOTAL | 23,168 | 30,400 | 26,587 | 5009 | 3536 | 5683 | 937 | 95,320 | ||
 Mount Morgan |  Greenvale Nickel |  Cobra Central |  Adventure Tin | |
|---|---|---|---|---|
| Mine impact area [km2] | 3.07 | 6.93 | 0.71 | 0.37 |
| Area score [-] | 5 | 5 | 5 | 3 |
| Distance to closest water course [km] | 0.07 | 6.54 | 1.27 | 2.27 |
| Watercourse score [-] | 3 | 2 | 2 | 2 |
| Distance to closest protected area [km] | 7.74 | 46.5 | 8.41 | 10.8 |
| Protected area score [-] | 2 | 1 | 2 | 1 |
| Distance to closest Ramsar site [km] | 86.6 | 225 | 81.7 | 299 |
| Ramsar score [-] | 1 | 1 | 1 | 1 |
| Total Risk Score [-] | 11 | 9 | 10 | 7 |
| Environmental Risk Category | High | Medium | High | Medium |
© 2020 by the authors. Licensee MDPI, Basel, Switzerland. This article is an open access article distributed under the terms and conditions of the Creative Commons Attribution (CC BY) license (http://creativecommons.org/licenses/by/4.0/).
Share and Cite
Werner, T.T.; Bach, P.M.; Yellishetty, M.; Amirpoorsaeed, F.; Walsh, S.; Miller, A.; Roach, M.; Schnapp, A.; Solly, P.; Tan, Y.; et al. A Geospatial Database for Effective Mine Rehabilitation in Australia. Minerals 2020, 10, 745. https://doi.org/10.3390/min10090745
Werner TT, Bach PM, Yellishetty M, Amirpoorsaeed F, Walsh S, Miller A, Roach M, Schnapp A, Solly P, Tan Y, et al. A Geospatial Database for Effective Mine Rehabilitation in Australia. Minerals. 2020; 10(9):745. https://doi.org/10.3390/min10090745
Chicago/Turabian StyleWerner, Tim T., Peter M. Bach, Mohan Yellishetty, Fatemeh Amirpoorsaeed, Stuart Walsh, Alec Miller, Matthew Roach, Andrew Schnapp, Philippa Solly, Youming Tan, and et al. 2020. "A Geospatial Database for Effective Mine Rehabilitation in Australia" Minerals 10, no. 9: 745. https://doi.org/10.3390/min10090745