Lithium Enrichment in the No. 21 Coal of the Hebi No. 6 Mine, Anhe Coalfield, Henan Province, China


1
State Key Laboratory of Coal Resources and Safe Mining, College of Geoscience and Surveying Engineering, China University of Mining and Technology, Beijing 100083, China
2
College of Resources and Environmental Science, Hebei Normal University, Shijiazhuang 050024, China
3
Departments of Chemical and Petroleum Engineering, and School of Energy Resources, University of Wyoming, Laramie, WY 82071, USA
4
School of Civil and Environmental Engineering, Georgia Institute of Technology, Mason Building, 790 Atlantic Drive, Atlanta, GA 30332, USA
*
Author to whom correspondence should be addressed.
Minerals 2020, 10(6), 521; https://doi.org/10.3390/min10060521
Submission received: 18 May 2020
/
Revised: 31 May 2020
/
Accepted: 3 June 2020
/
Published: 5 June 2020
(This article belongs to the Collection Critical Metals and Minerals in Coal and Coal Combustion Products)
Abstract
:Lithium (Li) is an important strategic resource, and with the increasing demand for Li, there are some limitations in the exploitation and utilization of conventional deposits such as the pegmatite-type and brine-type Li deposits. Therefore, it has become imperative to search for Li from other sources. Li in coal is thought to be one of the candidates. In this study, the petrology, mineralogy, and geochemistry of No. 21 coal from the Hebi No. 6 mine, Anhe Coalfield, China, was reported, with an emphasis on the distribution, modes of occurrence, and origin of Li. The results show that Li is enriched in the No. 21 coal, and its concentration coefficient (CC) value is 6.6 on average in comparison with common world coals. Lithium in the studied coal is mainly present in aluminosilicates, mainly clay minerals, some of which contain a significant amount of Ti. The Li enrichment in the No. 21 coal is mainly controlled by the terrigenous materials and sourced from the moyite of the Yinshan Upland. Furthermore, Li in the No. 21 coal is more enriched in coals formed in acidic and humid conditions and coals influenced by fresh water during peat accumulation.
1. Introduction
Coal is not only a resource primarily used for power generation but can also be considered as a source for critical metals [1,2]. Lithium is known as an important critical metal, and it is widely used in new energy vehicles, lithium batteries, controllable nuclear fusion, and other important fields [3,4]. With the rapid development of the new energy industry, the demand for Li resources is increasing. However, there are some limitations in the exploitation and utilization of new Li sources from pegmatite-type and brine-type Li deposits [4,5]. Therefore, it has become imperative to search for Li from other sources. Lithium in coal is identified as one of the candidates among them [6]. With the development of in-depth research on trace elements in coal [7,8,9,10,11,12,13,14,15,16,17,18,19,20,21,22,23,24,25], it has been found that coals are highly rich in some trace elements in many coalfields [3,11,26,27,28,29,30,31,32,33,34,35,36,37,38,39,40,41,42]. In recent years, a high enrichment of lithium in coal samples has been found from different regions in China [43,44,45,46,47,48]. The discovery of coal with a high enrichment of Li is of great significance to the rapid growth of the new energy industry.
Lithium in coal is generally considered to occur as an organic or inorganic form [11,31,34,36,43,47,48,49,50,51]. Lithium being associated with the inorganic matter in coal, is generally suggested to be related to aluminosilicate minerals, namely clay minerals in most cases [52,53]. The adsorption/incorporation of Li by/into clay minerals such as kaolinite [54,55], illite [56,57], smectite [58,59,60,61], chlorite [58], and cookeite [53,62] has been reported. According to Finkelman et al. [36], in some low-rank coals the proportion of organically bound Li may be as high as 50%. Lithium in organic-associated coals has been found in Longyearbyen and Bulgarian coals [49,63]. The source of Li, if mainly associated with aluminosilicate/clay minerals in coals, is commonly attributed to the terrigenous materials deposited during peat accumulation [53]. The moyite of Yinshan Upland and the bauxite of Benxi Formation are considered as the main source areas of Li in Li-rich coals in North China [4,43].
The Anhe Coalfield is not only one of the important coal basins for coal production but also one of the strategic replacement areas of coalbed methane (CBM) exploration and development in northern China [64]; it covers an area of approximately 900 km2 and contains abundant CBM resources (1115.7 × 108 m3) [65,66,67]. During the investigation of the Li content of the main coal seams in Henan Province, Wang et al. [68] found that the content of Li in the No. 21 coal seam in the Anhe Coalfield ranges from 18.86 to 124.37 μg/g, with 59.88 μg/g on average. Considering that the average content of Li in common world coals is 12 μg/g and the average content of Li in common Chinese coals is 28.94 μg/g [3,7,49,69], the average content of Li in the No. 21 coal seam in the Anhe Coalfield is almost two to three times higher than that in common Chinese coals and world coals, showing potential economic significance. However, there is still a lack of detailed studies on the distribution, mode of occurrence, and origin of lithium in the Anhe coals. This study will be of great practical significance for the comprehensive and efficient utilization of mineral resources in coal measures.
In this study, we report the petrology, mineralogy, and geochemistry of the No. 21 coal (including the partings and floor strata) from the Hebi No. 6 mine, Anhe Coalfield, Henan Province, China and discuss the content and distribution characteristics, modes of occurrence, and origin of Li.
2. Geological Setting
The Hebi No. 6 mine is located in the Hebi mining area, Anhe Coalfield, northern Henan Province, North China (Figure 1). The Anhe Coalfield preserves several coal seams formed during the Late Carboniferous–Early Permian, and the coal resources developed in the Taiyuan and Shanxi Formations account for 94.9% of the total resources in this area [70,71]. In addition, the Anhe Coalfield lies in the transition zone between the eastern foot of Taihang Mountain and the North China Plain. It is a monoclinic structure with a north–south strike and an east dip, and the secondary structures are mainly faults and folds in the north-east and north–east directions, which were influenced by Yanshanian and Himalayan tectonic movements [65].
The Taiyuan Formation can be correlated to the Kasimovian–Asselian stages in the international chronostratigraphic nomenclature [70,71]. The depositional environment of the Taiyuan Formation is characterized by tidal flat, barrier-lagoon, carbonate platform, and peat swamp facies [72]. The numbers of coal seams in the Taiyuan Formation can reach up to 11 (Figure 2A). Due to marine influence, the coal seams are thin and the lateral distribution of the seams is limited.
The Shanxi Formation can be correlated to the Sakmarian to early Artinskian Stages of the international chronostratigraphic framework [70]. The depositional environment of the Shanxi Formation was characterized by delta plain, delta front, tidal flat, and peat swamp facies [72], and the Shanxi Formation can be subdivided into a No. 21 coal member, Dazhan sandstone member, Xiangtan sandstone member, and Xiaozi mudstone member [72]. Broadly, the No. 21 coal member consists of sandstone, siltstone, mudstone, and coal. The number of coal seams can reach up to three, and the No. 21 coal seam is the most laterally extensive layer in the Anhe Coalfield, with a thickness ranging from 1.2 to 19.9 m (Figure 2A).
3. Samples and Experimental Methods
3.1. Sample Collection
According to lithological compositions, a total of 24 samples were collected from the No. 21 coal seam in the underground workings of the Hebi No. 6 mine, Anhe Coalfield, which include 19 coal samples, 4 mudstone parting samples, and 1 mudstone floor sample (Figure 2B). The thickness of the No. 21 coal seam is 5 m. The sampling interval was 0.2–0.3 m in the vertical section of the coal seam. From top to bottom, the coal bench samples, partings, and floor sample are identified as HB-1 to HB-24 (Figure 2B). All the samples were fresh, and the samples were immediately stored in plastic bags to minimize contamination and oxidation after collection.
3.2. Experimental Methods
The proximate and ultimate analyses of the coal were operated according to the international standard [73,74,75]. The maceral compositions of the coal samples were identified based on the ICCP System 1994 [76,77] and Pickel et al. [78] under the optical microscope of oil immersion-reflected light. The vitrinite random reflectance was determined according to the international standard ASTM D2798-11a (2011) [79]. The total sulfur and forms of sulfur were determined and calculated based on the international standard ASTM D3177–02 (2011) [80] and ASTM D2492–02 (2012) [81].
The percentages of the major oxides, including SiO2, TiO2, Al2O3, Fe2O3, MgO, CaO, MnO, Na2O, and K2O, of the high-temperature ash of each sample (815 °C) were determined using X-ray fluorescence spectrometry (XRF; PANalytical Axios, Malvern Panalytical, Almelo, Netherland). The loss on ignition (LOI) was also determined at 815 °C for each coal sample. The samples used for the XRF analysis were prepared using borate fusion in an automated fusion furnace (CLAISSE TheOX). Each sample (0.7 g) was mixed and homogenized with lithium borate flux (7 g; CLAISSE, pure, 67% Li2B4O7 + 33% LiBO2).
Inductively coupled plasma mass spectrometry (iCAP Qc ICP-MS; Thermal Fisher, Waltham, MA, USA) was used to determine the concentrations of trace elements. Each sample (100 mg/200 mg/300 mg, air-dried; less sample weighted due to high ash yield to guarantee thorough digestion) was firstly ashed at 500 °C to achieve a constant weight, and then the ash sample was placed in a Poly tetra fluoroethylene (PTFE) griffin beaker and digested applying an electric hot plate (TTG-6K). Hydrochloric acid, HNO3, HF, and perchloric acid were used as the digestion reagents. The linear coefficients for the standard solution of multi-element were greater than 0.999. The recovery rates of the internal standards (Rh and Ir) were between 78% and 110%. Multi-element standards (GSS-3, GSS-5, GSS-16, and GSS-25) were used for the calibration of trace element concentrations. The concentrations of duplicate blank samples, method detection limits (MDL), and measurement modes (MD) are showed in Table 1. In order to avoid the disturbance of polyatomic ions, the kinetic energy discrimination (KED) mode was used for the determination of some trace elements (see Table 1).
According to the Chinese standard SY/T 5163-2010 [82], the mineral composition of the coal was tested by the TTR III type multifunctional X-ray diffractometer with the anode target Cu (λ = 0.15406 nm) with a step size of 0.02°. For all mineral analyses, the 2θ of the X-ray scanning was 2.6–45° and the scanning speed was 6°/min. For the clay minerals analysis, the 2θ of the X-ray scanning of the natural and the high-temperature sheets was 2.6–15° and the scanning speed was 4°/min, and the 2θ of the X-ray scanning of the ethylene glycol sheet was 2.6–30°. The quantitative mineralogical analysis was conducted using the K value method [83].
The observation of the mineral phases was conducted by a scanning electron microscope (SEM) (Hitachi S4800) equipped with an energy dispersive X-ray spectrometer (EDS) at Beijing Physical and Chemical Test Center. Images were taken under the secondary electron mode. Before the SEM-EDS analysis, the samples with <1 mm particle size were overlaid uniformly on the conductive tape and then coated with gold. The accelerating voltage was 15 kV during the SEM operation.
4. Results
4.1. Coal Characteristics and Coal Petrology
The ash yield, moisture, volatile material and sulfur contents, various forms of sulfur and macerals results are summarized in Table 2. The mean random vitrinite reflectance (1.87%, based on mixed-coal samples) and volatile matter contents (range from 15.7% to 17.8%, 16.2% on average) of coal samples with relatively low contents of CaO (samples HB-2 0.94%, HB-4 0.91%, HB-7 0.85%, HB-10 0.85%, HB-18 0.29%) in the Hebi No. 6 mine indicate a low-volatile bituminous coal according to the ASTM classification (ASTM D388-12, 2012) [84]. The ash yield of the No. 21 coal samples in the Hebi No. 6 mine is 7.4–37.8%, with an average content of 13.7%. The total sulfur content of the coal samples ranges from 0.2% to 0.4%, and the average is 0.3%. The contents of ash yield and total sulfur above indicate that the No. 21 coal is a low-ash and super-low sulfur coal according to Chinese standards GB15224.1-2010 [85] (coals with an ash yield of >10% and ≤20% are low-ash coals) and GB15224.2-2010 [86] (coals with a total sulfur content of ≤0.5% are super-low sulfur coals). In addition, organic sulfur (0.08% to 0.27%, averaging 0.19%) is the main form of sulfur in the coal, followed by pyritic sulfur (0.01% to 0.20%, averaging 0.07%).
The macerals of the No. 21 coal in Hebi sixth mine are dominated by vitrinite-group macerals, with an average of 62.3 vol.%, followed by the inertinite group macerals (26.0 vol.% on average, Table 3). Liptinite was not observed, since it is difficult to identify liptinites in low volatile bituminous coals [87]. The relative proportions of maceral groups in the No. 21 coal is quite different from that found in other Late Paleozoic coals in the northern part of North China, which usually have slightly higher proportions of inertinite than vitrinite [88].
The vitrinite in the No. 21 coal is dominated by collodetrinite (47.4 vol.% on average; Figure 3A,B) and telinite (11.2 vol.% on average; Figure 3A,C), with trace amounts of vitrodetrinite (2.7 vol.% on average) and collotelinite (1.9 vol.% on average). Sometimes, the collodetrinite contains fracture-filling calcite (Figure 3B) and clay minerals filled in deformed cells of the telinite (Figure 3C). In most cases, the collodetrinite occurs as matrix-containing embedded (Figure 3D) or banded (Figure 3E) clay minerals and massive quartz (Figure 3D).
The inertinite in the No. 21 coal is mainly composed of semifusinite (Figure 3A,F; 15.8 vol.% on average) and, to a lesser extent, inertodetrinite (8.9 vol.% on average), with small amounts of fusinite, macrinite (Figure 3D), and micrinite. In most cases, the cell structures of the semifusinite are not well-preserved and have a swelled and degraded form (Figure 3A,F), which is sometimes filled with clay minerals (Figure 3F).
4.2. Geochemistry
4.2.1. Major-Element Oxides
The percentages of the major-element oxides in the No. 21 coal and parting samples, as well as the average values for Chinese coals, are listed in Table 4. The major-element oxides in the studied No. 21 coal samples are mainly dominated by SiO2 and Al2O3, ranging from 2.8% to 18.1% (6.3% on average on a whole-coal basis) and 2.4% to 13.5% (5.3% on average on a whole-coal basis), respectively (Table 4). Compared with the average values for average Chinese coals reported by Dai et al. [12], the percentages of CaO and Na2O are slightly higher, while other major oxides (SiO2, TiO2, Al2O3, Fe2O3, MgO, MnO, and K2O) are either close to or lower than those of average Chinese coals (Table 4).
4.2.2. Li Concentrations
The concentrations of trace elements in all the coal and non-coal samples are listed in Table 5. The concentration of Li in the No. 21 coal samples varies from 40.2 μg/g to 183 μg/g, with an average value of 79.0 μg/g. This is much higher than that of common Chinese coals (31.8 μg/g) [12] and world hard coals (14 μg/g) [69]. A high Li content has been also reported in other coals from northern China, such as coals from the Haerwusu mine of the Junger Coalfield (116 μg/g on average) [11], the Guanbanwusu mine of the Junger Coalfield (175 μg/g on average [26]; 264 μg/g on average [43]), the Heidaigou mine of the Junger Coalfield (143 μg/g on average) [89], the Buertaohai-Tianjiashipan mine of the Junger Coalfield (70–79 μg/g on average) [52], the Dongpo mine of the Weibei Coalfield (84.98 μg/g on average) [35], and the Wangtaipu mine of the Jincheng Coalfield (136.5 μg/g on average) [53].
The concentration of Li in the partings and floor from the Hebi No. 6 mine are two to three times higher than that of the coal samples. Specifically, the concentration of Li in the partings decrease gradually from top to bottom, ranging from 171 to 260 μg/g with an average of 203.5 μg/g, while the concentration of Li in the floor increases again up to 244 μg/g (Figure 4A).
The concentration coefficient (CC) proposed by Dai et al. [9,25] was used to evaluate the enrichment degree of the minor and trace elements in coal and organic-rich rocks. In this paper, the concentration coefficient value is the ratio of Li concentration in the coal samples correlated with the mean value of Li concentration in common world coal [69] and the ratio of Li concentration in the parting and floor mudstone samples compared to the mean Li concentration in common world clays [90]. Lithium is enriched in the No. 21 coal and the CC value of Li in coal is 6.6 on average. Lithium is slightly enriched in the parting and floor mudstones of the No. 21 coal seam and the relevant CC value is 3.9 on average.
Note that Li is more enriched in the upper part of the No. 21 coal seam and the CC value of Li in the upper part (including HB-1 to HB-12) of the No. 21 coal is 7.3. The CC value of Li in the lower part of the No. 21 coal and in the partings and the floor is between 2 and 5, and the Li is slightly enriched (Figure 4B).
4.2.3. Rare Earth Elements and Yttrium
In the literature, the term rare earth elements (REE) or rare earth elements and yttrium (REY) has been used somewhat inconsistently [92], but recently in Dai et al.’s [93] review study, REY (or REE if yttrium is not included) is used to specifically represent the elemental suite La, Ce, Pr, Nd, Sm, Eu, Gd, Tb, Dy, Y, Ho, Er, Tm, Yb, and Lu. The ionic radius of Y3+ is very similar to that of Ho3+, and thus Y3+ can be placed between isovalent Dy3+ and Ho3+ in normalized REY distribution patterns [93,94]. In the present study, a three-fold geochemical classification of REY, which was classified by Seredin and Dai. [94], was used, including light REY (LREY: La, Ce, Pr, Nd, and Sm), medium REY (MREY: Eu, Gd, Tb, Dy, and Y), and heavy REY (HREY: Ho, Er, Tm, Yb, and Lu). Correspondingly, in comparison with the upper continental crust concentrations (UCC) [91], three enrichment patterns were also identified as L-type (light-REY; LaN/LuN > 1), M-type (medium-REY; LaN/SmN < 1, GdN/LuN > 1), and H-type (heavy REY; LaN/LuN < 1) [94].
Previous studies have shown that the measured content of Eu and the identification of positive Eu anomalies by quadrupole-based ICP-MS in coals should be used with great caution, because the Eu content of the samples may be interfered with by Ba [93,95]. If the Ba/Eu value is higher than 1000, the Eu content of the samples is thought to be interfered with by element Ba [93,95]. In this study, the relationship between the Ba and Eu concentrations (r = 0.29; Figure 5) is weak, and almost all the Ba/Eu values of the studied coal samples are lower than 1000 (604 on average), except the sample HB-1 with a Ba/Eu value of 1132. However, the EuN/EuN* in the sample HB-1 is 0.78 (Table 6), which is lower than 1, indicating no positive Eu anomalies in this sample. Furthermore, the Ba contents in samples with a relatively high Eu or EuN/EuN* content are relatively lower than those in samples with a relatively low Eu or EuN/EuN* content, such as the samples HB-23 (Eu = 1.47 μg/g, EuN/EuN* =1.18, Ba = 288 μg/g) and HB-1 (Eu = 0.28 μg/g, EuN/EuN* = 0.78, Ba = 317 μg/g). Therefore, the high Eu or EuN/EuN* contents in this study were generally not interfered with by the Ba concentration.
The REY concentrations of the No. 21 coal samples (from 42.98 to 186.57 μg/g, 97.99 μg/g on average; Table 6) are lower than those of common Chinese coals (136 μg/g) [12] and the upper continental crust (168.37 μg/g) [91], but slightly higher than those of average world hard coals (68.6 μg/g) [69].
The REY contents of the partings and floor from the Hebi No. 6 mine are approximately two to four times higher than those of the coal bench samples (Table 6). Specifically, the REY concentrations of the partings range from 209.99 to 285.36 μg/g, with an average of 242.41 μg/g, which are slightly higher than those of average world clays (226.42 μg/g) [90] and those of the upper continental crust (168.37 μg/g) [91]. The contents of REY in the floor are the highest among all the non-coal samples, with values of up to 365.9 μg/g, which are much higher than those of average world clays (226.42 μg/g) [90] and the upper continental crust (168.37 μg/g) [91].
Based on Seredin-Dai’s classification, the REY distribution patterns of the No. 21 coal samples are mainly characterized by LREY enrichment relative to the upper continental crust with negative Eu and Ce anomalies (Figure 6A), except for the sample HB-23, which shows an HREY enrichment and a positive Eu anomaly. Like the coal samples, the REY distribution pattern of the floor is also characterized by LREY enrichment with negative Eu- and Ce- anomalies (Figure 6B). While compared with the distribution curves of the REY in coal samples, the curves of the REY in the the partings are relatively flat (Figure 6B), indicating no obvious fractionation of LREY and HREY.
4.2.4. Other Trace Elements
In addition to Li, compared to the average values for world hard coals reported by Ketris and Yudovich [69], the No. 21 coal is also enriched with Sr (CC = 5.07) and slightly enriched with Pb (CC = 2.47) and Th (CC = 2.19), while Mn, Zn, Rb, Mo, Cd, Bi, and Tl in the No. 21 coal are depleted and the remaining elements have normal concentrations (Figure 7A). The concentration of Sr in the No. 21 coal samples varies from 110 to 1183 μg/g and has an average value of 557.4 μg/g.
Compared to the average values of trace elements for world clays [90], the parting samples from the Hebi No. 6 mine are slightly enriched in Ga (CC = 2.31), Nb (CC = 2.36), and Pb (CC = 2.05), while Mn, Zn, Rb, Cd, Cs, and Tl are depleted and the remaining trace elements have concentrations close to the average values for world clays [90] (Figure 7B). The concentrations of Ga, Nb, and Pb in the parting samples range from 34.8 to 39.9 μg/g, 24.9 to 27.9 μg/g, and 26.3 to 31.7 μg/g, respectively.
Figure 7C shows the ratio of the average values of trace elements in the floor sample and the average values of trace elements for world clays [90]. Gallium (CC = 2.42), Nb (CC = 2.66), Pb (CC = 3.87), and Er (CC = 2.48) are slightly enriched in the floor while Mn, Mo, Cd, and Tl are depleted, and the remaining elements have normal concentrations in the floor sample.
4.3. Minerals
Minerals in coal are often regarded as a nuisance, being responsible for most of the problems arising during coal utilization, but minerals are also seen as a potentially valuable source of critical metals. With a few exceptions, minerals are the major hosts of the majority of elements present in coal [96].
According to the results of X-ray diffraction analysis (Figure 8), clay minerals such as illite and kaolinite are the main mineral in the No. 21 coal of Hebi No. 6 mine, followed by quartz and calcite, with a small amount of ankerite and K-feldspar. The mineral phases in the partings and floor are dominantly kaolinite and, to a lesser extent, illite, quartz, and calcite, with smaller proportions of K-feldspar, plagioclase, and ankerite.
Under the SEM-EDS, the morphology and principal elements of the main minerals in the samples are shown in Figure 9 and Figure 10. The morphology of illite, with some occurrences as Ti-bearing illite, mainly appears as irregular flaky and fine slats (Figure 9A–D), and the kaolinite exists in form of thin sheets in the No. 21 coal (Figure 9E,F). Although usually regarded as being relatively immobile, Ti may be mobilized at low pH levels [97], allowing it to be leached from detrital components and re-precipitated in other parts of the coalbed [98], leading to the Ti-bearing illite found in the present paper.
5. Discussion
5.1. Modes of Occurrence of Elements
5.1.1. Lithium
Based on the correlation coefficients (r) between the elemental concentrations and the ash yield, Li in the No. 21 coal has a very high positive correlation coefficient with the ash yield (r = 0.87, Figure 11A, Table 7, Group 1), indicating a highly inorganic affinity. In addition, the relatively high correlation coefficients of Li-Al2O3 (r = 0.95, Figure 11B, Table 7), Li-SiO2 (r = 0.91, Figure 11C, Table 7), Li-K2O (r = 0.50, Figure 11D, Table 7), and Li-TiO2 (r = 0.79, Figure 11E, Table 7) indicate that Li is mainly present in the aluminosilicate minerals, most likely the clay minerals. The relatively high correlation coefficient of Li-TiO2 (r = 0.79, Figure 11E, Table 7) and the weekly positive correlation coefficient of Li-K2O (r = 0.50, Figure 11D, Table 7) indicate that, to a lesser extent, Ti-bearing illite is probably also a carrier of Li. Furthermore, the conclusion above can be confirmed by the Ti-bearing illite, which has also been found in the No. 21 coals (Figure 9C,D) detected by SEM-EDS, and the intimate association of Li and TiO2-, Al2O3-, and SiO2 indicated by cluster analysis (Figure 12, Group B), indicating that at least some Ti-bearing aluminosilicates are carriers of Li in No. 21 coal from the Hebi No. 6 mine.
Based on sequential chemical extraction results, Finkelman et al. [36] suggested that in most coals about 90% of Li is associated with clays and micas and the remainder is either associated with organics or acid-insoluble phases, such as tourmaline. The high Li in the Haerwusu [11] and Buertaohai-Tianjiashipan [52] coals in the Junger Coalfield is deduced to be associated with aluminosilicate minerals. Wang et al. [47] also considered that Li in the coal of the Qinshui Basin is probably bound to clay minerals such as kaolinite and illite. However, cookeite, a Li-rich member of the chlorite group, was considered to be the primary Li carrier in the coals from the Jincheng Coalfield, southeastern Qinshui Basin [62]. Ti-bearing aluminosilicates were not uncommon in coals [35,100,101], but those occurring as the main carrier of Li have rarely been reported. As mentioned above, this study and a number of studies have shown relatively strong correlations between Li and aluminosilicates/clay minerals [96,102]. This is because clay minerals, being usually negatively charged in nature, have high surface to volume ratios, which enable trace elements such as Li, usually positively charged, to be adsorbed on their surface. Additionally, some clay minerals have an interlayer space where cation exchange may take place [96]. Titanium may be leached from detrital components at low pH levels [97] and re-precipitated in these clay minerals, leading to a close relationship between Li and Ti-bearing clays/aluminosilicates.
5.1.2. Other Trace Elements
The affinity of some elevated elements in the No. 21 coal (Sr, Pb, Th, except Li) and some enriched trace elements in the partings and floor, such as Ga, Nb, Pb, and REY, are discussed. Three groups of elements can be differentiated according to their correlation coefficients with the ash yield (Table 7). The first group has a very high positive correlation coefficient with ash yield (>0.7; Ga 0.87, Nb 0.91, Th 0.76, SiO2 0.98, TiO2 0.81, Al2O3 0.97, K2O 0.80; Table 7; Figure 13A–C) and includes elements with a high inorganic affinity. Most of these elements normally relate with aluminosilicate minerals (rAl–Si > 0.7, Figure 13D–I). The second group with an rash of 0.4 to 0.69 includes Fe2O3 and Pb. Although the correlation coefficient of Pb-ash (r = 0.78, Figure 13J, Table 7) is high, there are only two points falling in the high-ash areas (ash > 30%) of the Pb-ash plot, and the other points in the low-ash areas (with ash < 30%) have a lower correlation coefficient (r = 0.49, Figure 13J), indicating that Pb has an inorganic–organic mixed affinity rather than an inorganically dominated affinity. The elements of Group 3 have correlation coefficients with an ash yield of less than 0.40, indicating no statistical significance. This group includes CaO, REY, Sr, and Na2O (Table 7). However, in some cases, accessory Sr-bearing barite and Sr-sulphate minerals can occur in the cleats/fractures of coal due to marine influence and/or being associated with syngenetic pyrite clusters in low ash yield coals, leading to a very weak correlation between Sr and ash yields; thus, this negative correlation does not always indicate organically bound Sr and Ba in coal [40,103,104]. However, sulphate minerals in the studied coals are low, which can be evidenced by the low contents of total sulfur (0.2–0.4%, 0.3% on average; Table 2) and sulphate sulphur (bdl-0.04%, 0.02% on average; Table 2) [99]. Therefore, it is unlikely that Sr exists in any significant amount in Sr-bearing barite or other sulphate minerals in the studied coals.
5.2. Source of Lithium
The Al2O3/TiO2 ratio has been widely used in the source analysis of sedimentary rocks [34,50,52] and sediments associated with coal deposits [105]. Sedimentary rocks derived from mafic, intermediate, and felsic igneous rocks have Al2O3/TiO2 ratios varying from 3 to 8, 8 to 21, and 21 to 70, respectively [106,107]. The Al2O3/TiO2 ratio in No. 21 coal from the Hebi No. 6 mine ranges from 12.6 to 32.9, with an average of 22.6 (Figure 14), indicating that the sediment rocks for detrital inputs into palaeomires of the No. 21 coal in the Hebi No. 6 mine are mainly felsic and intermediate rocks. The partings from the Hebi No. 6 mine have Al2O3/TiO2 ratios ranging from 25.6 to 28.4, indicating a felsic composition for the sediment-source rocks. The similarity in the Al2O3/TiO2 ratios for the No. 21 coal seam and the partings suggest a similar provenance for the No. 21 coal seam and the associated sedimentary rocks.
The sediment-source region of the No. 21 coal can be further inferred by their rare earth element and trace-element assemblages [108,109]. Dai et al. [11] attributed the high Li concentration in the Pennsylvanian coal from the Junger Coalfield, Inner Mongolia, to moyite (a variety of biotite granite in which quartz exceeds orthoclase [110]) of the Yinshan Upland to the north of the coalfield [53]. The REY plots for the No. 21 coal are similar to those for Li-enriched coals from the Haerwusu mine, Junger Coalfield [11], which are mainly characterized by LREY and have negative Eu anomalies. In addition, those two mines above also have similar enriched trace element associations (e.g., Li, Ga, Pb, and Th) and similar modes of occurrence of Li, which are believed to be associated with aluminosilicate minerals, further indicating a similar provenance—the moyite of the Yinshan Upland. This conclusion is consistent with the results inferred from the Al2O3/TiO2 ratio, as mentioned above.
In northern China, during the Late Paleozoic the Xingmeng Trough subducted beneath the North China Platform, resulting in the uplift and orogeny of the Yinshan Upland [111]. Thus, the Yinshan Upland, which is located to the north of the North China Plate, served as the dominant sediment-source region for the Permo-Pennsylvanian coals on the North China Plate itself [112]. The source of two super-large Li-Ga deposits in the Pingyu mining area and the Jungar Coalfield is closely related to the Yinshan Upland [4,45]. During the Middle Permian, the source materials for the study area were mainly from the Yinshan Upland located in the north of the study area [113].
Therefore, according to the comprehensive analysis, the enriched Li in the No. 21 coal of the Hebi No. 6 mine is mainly derived from the moyite of Yinshan Upland.
5.3. Depositional Conditions during Peat Accumulation
The Sr/Ba ratio is one of the mostly widely used indicators, not only for sedimentary rocks [114,115,116] but also for coals [99,117,118,119]. The ratio of Sr/Ba in marine-influenced coals is mostly >1; in contrast, if the Sr/Ba < 1, the coals are generally influenced by fresh water. In this paper, the ratios of Sr/Ba in the floor, coal sample HB-23, and partings, coal sample HB-18, from bottom to top are lower than 1 (Figure 15A), indicating that the lower part of the profile was mainly affected by fresh water. From the top of sample HB-17, the ratios of Sr/Ba in almost all the No. 21 coal samples (except the samples HB-8) are above 1 (Figure 15A), indicating that these coals were influenced by marine water during coal deposition. The conclusion above is consistent with the sedimentary setting that the No. 21 coal formed both in upper delta plain and lower delta plain environment (Figure 16) [71]. Furthermore, the variation trend of the Li content and Sr/Ba ratio is opposite, which can be seen from Figure 15A, indicating that Li is more enriched in coals influenced by fresh water (Figure 15B).
During oxidizing conditions, low pH conditions (e.g., pH < 3) may occur in some parts of the peat. Aluminum is generally insoluble in the conditions of natural pH values but is soluble under low pH values and would be easily leached from many existing Al-bearing materials (including volcanic ash) under such solubility. Then, the Al-bearing leachates would transfer to other parts of the peat bed with relatively higher but still acidic pH values and subsequently be precipitated initially to bauxite-group minerals (e.g., gibbsite [98,119]), which are unstable if silica was present during their crystallization [97]. Interaction between the precipitated alumina and silica in solutions would therefore result in the formation of authigenic kaolinite rather than other clay minerals such as illite, because the K, Na, and Ca would be expected to have been leached out in the acidic system. However, a marine-influenced environment would favor the formation of illite [120]. Although illite in some cases can be of terrigenous origin [98,109,119,121], in others it can be of syngenetic authigenic origin if the ions required for their formation (e.g., K+ for illite in a marine-influenced environment) were available in a weakly alkaline peat swamp. As shown in Figure 17, the contents of kaolinite and illite in the samples from the Hebi No. 6 mine show the opposite “X” type trend from bottom to top; that is, in the upper part of the samples (from sample HB-13 to the top), the content of illite is significantly higher than that of kaolinite. Meanwhile, in the lower part (from the bottom of sample HB-19) the content of kaolinite increases sharply while the content of illite decreases sharply, showing that the content of kaolinite is significantly higher than that of illite. Thus, the variation trend of the kaolinite and illite content indicates that the lower part was mainly affected by fresh water while the upper coal seam was affected by seawater transgression. This conclusion is consistent with the Sr/Ba value and sedimentary setting of No. 21 coal.
In addition, syngenetic and authigenic kaolinite in coal usually reflects the acidic conditions of the peat swamp [50]. The cell-filling kaolinite (Figure 3C,F) found in coal samples HB-8 and HB-18, which have higher Li concentrations than those of the adjacent coal samples (Figure 15A), indicates that the acidic conditions of the peat swamp may be favorable to the enrichment of Li (Figure 15B). The acidic conditions of the peat swamp can be further supported by the Ti-bearing clays found in sample HB-8 (Figure 9C,D). In the Junger-Hebaopian mining districts, Li in coals has also been found to be more enriched in acidic peat depositional environments [122].
The Sr/Cu and Rb/Sr ratios of fine-grained sediments are generally sensitive to climatic variations during depositional processes [123]). Coals with a Sr/Cu ratio of ~1.3–5.0 were formed in humid conditions, while those with a Sr/Cu ratio >5.0 were formed in arid conditions [124]. In addition, the Rb/Sr ratio declines with increasing aridity and decreasing temperature [125,126]. Note that Sr/Ba values of >1 and <1 also indicate arid and humid climatic conditions, respectively [127,128,129], and this indication is probably based on the dominant occurrence of fresh water, where it occurs, with an Sr/Ba < 1 value corresponding to a humid climate [50]. The conclusion about peat environment deduced from these three factors mentioned above is consistent; that is to say, the floor, coal sample HB-23, four partings, and coal sample HB-18 (from bottom to top) were formed in humid conditions, while the samples from HB-17 to top were basically formed in arid conditions, which probably represent one wetting-upward and drying-upward coal cycle of No. 21 coal in the Anhe Coalfield, as mentioned by Li et al. [71]. (Figure 15A), Li enrichment mainly occurs in coals or non-coal samples formed in humid conditions (Figure 15B).
6. Conclusions
The petrology, mineralogy, and geochemistry of the No. 21 coal from the Hebi No. 6 mine, Anhe Coalfield, China, were reported in this paper, with an emphasis on the distribution, modes of occurrence, and origin of Li. The main conclusions drawn from this work are summarized as follows.
- (1)
- The No. 21 coal in the Hebi No. 6 coal mine is a low volatile bituminous coal with low ash and super-low sulfur contents. The macerals of the No. 21 coal are dominated by the vitrinite group macerals, followed by the inertinite group macerals.
- (2)
- In comparison with common world coals, Li is enriched in the No. 21 coal and its concentration coefficient (CC) value is 6.6 on average. The concentrations of Li in the partings and floor from the Hebi No. 6 mine are two to three times higher than those of the coal samples.
- (3)
- Clay minerals including illite and kaolinite are the main minerals in the No. 21 coal of the Hebi No. 6 mine, followed by quartz and calcite, with small amounts of ankerite and K-feldspar. The mineral phases in the partings and floor are dominantly kaolinite and, to a lesser extent, illite, quartz, and calcite, with smaller proportions of K-feldspar, plagioclase, and ankerite.
- (4)
- The relatively high correlation coefficients of Li-Al2O3 (r = 0.951), Li-SiO2 (r = 0.912), Li-TiO2 (r = 0.787), and Li-K2O (r = 0.497) in the No. 21 coal indicate that Li is mainly present in the aluminosilicate/clay minerals (most likely the Ti-bearing clay minerals).
- (5)
- The lithium enrichment in the No. 21 coal is mainly controlled by the terrigenous materials which were sourced from the moyite of the Yinshan Upland. Furthermore, Li in the No. 21 coal is more enriched in coals formed in acidic and humid conditions and coals influenced by fresh water during peat accumulation.
Author Contributions
Formal analysis, Y.W. and W.H.; methodology, W.H., Y.W., G.Q., and M.F.; writing—original draft preparation, Y.W., W.H., and G.Q.; writing—review and editing, Y.W., G.Q., and M.F.; supervision, Y.W. and D.C. All authors have read and agreed to the published version of the manuscript.
Funding
This research was funded by the National Natural Science Foundation of China (No. 41972174), the Geological Survey Project of China geological survey (No. DD20160187), the Natural Science Foundation of Hebei Province (No. D2019508167), the China Scholarship Council (No. 201906435004), and the Fundamental Research Funds for the Central Universities (No. 2009QD15).
Acknowledgments
The authors would like to acknowledge Jiangsu mineral resources and Geological design and research institute for the experimental support. We thank Shifeng Dai and David French and three anonymous reviewers for their constructive and helpful comments and suggestions, which greatly improved the paper quality. We also thank Lei Zhao at China University of Mining and Technology (Beijing) for her help with the revising, grammatical editing, and terminologies along with the English usage in our paper.
Conflicts of Interest
The authors declare no conflict of interest.
References
- Dai, S.; Finkelman, R.B. Coal as a promising source of critical elements: Progress and future prospects. Int. J. Coal Geol. 2018, 186, 155–164. [Google Scholar] [CrossRef]
- Dai, S.; Yan, X.; Ward, C.R.; Hower, J.C.; Zhao, L.; Wang, X.; Zhao, L.; Ren, D.; Finkelman, R.B. Valuable elements in Chinese coals: A review. Int. Geol. Rev. 2018, 60, 590–620. [Google Scholar] [CrossRef]
- Sun, Y.; Li, Y.; Zhao, C.; Lin, M.; Wang, J.; Qin, S. Concentrations of lithium in Chinese coals. Energy Explor. Exploit. 2010, 28, 97–104. [Google Scholar] [CrossRef] [Green Version]
- Qin, S.; Zhao, C.; Li, Y.; Zhang, Y. Review of coal as a promising source of lithium. Int. J. Oil Gas Coal Technol. 2015, 9, 215–229. [Google Scholar] [CrossRef]
- Li, J.; Liu, X.; Wang, D. The metallogenetic regularity of lithium deposit in China. Acta Geol. Sin. 2014, 88, 2269–2283. [Google Scholar]
- Seredin, V.V.; Dai, S.; Sun, Y.; Chekryzhov, I.Y. Coal deposits as promising sources of rare metals for alternative power and energy-efficient technologies. Appl. Geochem. 2013, 31, 1–11. [Google Scholar] [CrossRef]
- Finkelman, R.B. Trace and minor elements in coal. In Organic Geochemistry; Engel, M.H., Macko, S., Eds.; Plenum: New York, NY, USA, 1993; pp. 593–607. [Google Scholar]
- Zhao, J.; Tang, X.; Huang, W. Abundance of trace elements in coal of China. Coal Geol. China 2002, 14, 5–13. (In Chinese) [Google Scholar]
- Dai, S.; Ren, D.; Tang, Y.; Yue, M.; Hao, L. Concentration and distribution of elements in Late Permian coals from western Guizhou Province, China. Int. J. Coal Geol. 2005, 61, 119–137. [Google Scholar] [CrossRef]
- Dai, S.; Ren, D.; Chou, C.L.; Li, S.; Jiang, Y. Mineralogy and geochemistry of the No. 6 coal (Pennsylvanian) in the Junger Coalfield, Ordos Basin, China. Int. J. Coal Geol. 2006, 66, 253–270. [Google Scholar] [CrossRef]
- Dai, S.; Li, D.; Chou, C.L.; Zhao, L.; Zhang, Y.; Ren, D.; Ma, Y.; Sun, Y. Mineralogy and geochemistry of boehmite-rich coals: New insights from the Haerwusu Surface Mine, Jungar Coalfield, Inner Mongolia, China. Int. J. Coal Geol. 2008, 74, 185–202. [Google Scholar] [CrossRef]
- Dai, S.; Ren, D.; Chou, C.L.; Finkelman, R.B.; Seredin, V.V.; Zhou, Y. Geochemistry of trace elements in Chinese coals: A review of abundances, genetic types, impacts on human health, and industrial utilization. Int. J. Coal Geol. 2012, 94, 3–21. [Google Scholar] [CrossRef]
- Dai, S.; Ren, D.; Zhou, Y.; Seredin, V.V.; Li, D.; Zhang, M.; Hower, J.C.; Ward, C.R.; Wang, X.; Zhao, L.; et al. Coal-hosted rare metal deposits: Genetic types, modes of occurrence, and utilization evaluation. J. China Coal Soc. 2014, 39, 1707–1715. (In Chinese) [Google Scholar]
- Sun, Y.; Zhao, C.; Li, Y.; Wang, J. Minimum mining grade of the selected trace elements in Chinese coal. J. China Coal Soc. 2014, 39, 744–748. (In Chinese) [Google Scholar]
- Duan, P.; Li, Y.; Guan, T. Trace elements of Carboniferous–Permian coal from the Adaohai Mine, Daqingshan Coalfield, Inner Mongolia, China. Chin. J. Geochem. 2015, 34, 379–390. [Google Scholar] [CrossRef]
- Duan, P.; Wang, W.; Liu, X.; Qian, F.; Sang, S.; Xu, S. Distribution of As, Hg and other trace elements in different size and density fractions of the Reshuihe high-sulfur coal, Yunnan Province, China. Int. J. Coal Geol. 2017, 173, 129–141. [Google Scholar] [CrossRef]
- Yang, N.; Tang, S.; Zhang, S.; Chen, Y. Modes of occurrence and abundance of trace elements in Pennsylvanian coals from the Pingshuo Mine, Ningwu Coalfield, Shanxi Province, China. Minerals 2016, 6, 40. [Google Scholar] [CrossRef] [Green Version]
- Yang, N.; Tang, S.; Zhang, S.; Xi, Z.; Li, J.; Yuan, Y.; Guo, Y.Y. In seam variation of element-oxides and trace elements in coal from the eastern Ordos Basin, China. Int. J. Coal Geol. 2018, 197, 31–41. [Google Scholar] [CrossRef]
- Wei, Y.; Hua, F.; He, W.; Ning, S.; Zhang, N.; Qin, Y.; Cao, D. Difference of trace elements characteristics of No. 2 coal in Fengfeng mining area. J. China Coal Soc. 2020, 45, 1473–1487. (In Chinese) [Google Scholar]
- Qin, S.; Gao, K.; Sun, Y.; Wang, J.; Zhao, C.; Li, S.; Lu, Q. Geochemical characteristics of rare-metal, rare-scattered, and rare-earth elements and minerals in the late permian coals from the Moxinpo Mine, Chongqing, China. Energy Fuels 2018, 32, 3138–3151. [Google Scholar] [CrossRef]
- Li, C.; Liang, H.; Wang, S.; Liu, J. Study of harmful trace elements and rare earth elements in the Permian tectonically deformed coals from Lugou Mine, North China Coal Basin, China. J. Geochem. Explor. 2018, 190, 10–25. [Google Scholar] [CrossRef]
- Huang, W.; Jiu, B.; Li, Y. Distribution characteristics of rare earth elements in coal and its prospects on development and exploitation. J. China Coal Soc. 2019, 44, 287–294. (In Chinese) [Google Scholar]
- Huang, Z.; Fan, M.; Tiand, H. Coal and coal byproducts: A large and developable unconventional resource for critical materials–Rare earth elements. J. Rare Earths 2018, 36, 337–338. [Google Scholar] [CrossRef]
- Bai, X.; Wang, Y.; Li, W. Distribution and occur-rence of trace elements in the No.14 coal from the Huolinhe mine. Int. J. Coal Sci. Technol. 2017, 4, 199–213. [Google Scholar] [CrossRef] [Green Version]
- Liu, Z.; Wei, Y.; Ning, S.; Jia, X.; Qin, R.; Cao, D. The differences of element geochemical characteristics of the main coal seams in the Ningdong coalfield, Ordos Basin. J. Geochem. Explor. 2019, 202, 77–91. [Google Scholar]
- Dai, S.; Jiang, Y.; Ward, C.R.; Gu, L.; Seredin, V.V.; Liu, H.; Zhou, D.; Wang, X.; Sun, Y.; Zou, J.; et al. Mineralogical and geochemical compositions of the coal in the Guanbanwusu Mine, Inner Mongolia, China: Further evidence for the existence of an Al (Ga and REE) ore deposit in the Jungar Coalfield. Int. J. Coal Geol. 2012, 98, 10–40. [Google Scholar] [CrossRef]
- Zhao, C.; Qin, S.; Yang, Y.; Li, Y.; Lin, M. Concentration of gallium in the Permo-Carboniferous coals of China. Energy Explor. Exploit. 2009, 27, 333–343. [Google Scholar] [CrossRef] [Green Version]
- Sun, Y.; Zhao, C.; Zhang, J.; Yang, J.; Zhang, Y.; Yuan, Y.; Xu, J.; Duan, D. Concentrations of valuable elements of the coals from the Pingshuo Mining District, Ningwu Coalfield, northern China. Energy Explor. Exploit. 2013, 31, 727–744. [Google Scholar] [CrossRef]
- Seredin, V.V. From coal science to metal production and environmental protection: A new story of success. Int. J. Coal Geol. 2012, 90–91, 1–3. [Google Scholar] [CrossRef]
- Chen, J.; Chen, P.; Yao, D.; Liu, Z.; Wu, Y.; Liu, W.; Hu, Y. Mineralogy and geochemistry of Late Permian coals from the Donglin Coal Mine in the Nantong coalfield in Chongqing, southwestern China. Int. J. Coal Geol. 2015, 149, 24–40. [Google Scholar] [CrossRef]
- Ning, S.; Deng, X.; Li, C.; Qin, G.; Zhang, J.; Zhu, S.; Qiao, J.; Chen, L.; Zhang, W. Metal Element Mineral Resources in Chinese Coal; Science Press: Beijing, China, 2018. (In Chinese) [Google Scholar]
- Shao, P.; Wang, W.; Chen, L.; Duan, P.; Qian, F.; Ma, M.; Xiong, W.; Yu, S. Distribution, occurrence, and enrichment of gallium in the Middle Jurassic coals of the Muli Coalfield, Qinghai, China. J. Geochem. Explor. 2018, 185, 116–129. [Google Scholar] [CrossRef]
- Ning, S.; Deng, X.; Li, C.; Qin, G.; Zhang, J.; Zhu, S.; Qiao, J.; Chen, L.; Zhang, W. Researh status and prospect of metal element mineral resources in China. J. China Coal Soc. 2017, 42, 2214–2225. (In Chinese) [Google Scholar]
- Ning, S.; Huang, S.; Zhu, S.; Zhang, W.; Deng, X.; Li, C.; Qiao, J.; Zhang, J.; Zhang, N. Mineralization zoning of coal-metal deposits in China. Chin. Sci. Bull. 2019, 64, 2501–2513. (In Chinese) [Google Scholar]
- Qin, G.; Cao, D.; Wei, Y.; Wang, A.; Liu, J. Mineralogy and geochemistry of the No. 5−2 high-sulfur coal from the Dongpo Mine, Weibei Coalfield, Shaanxi, North China, with emphasis on anomalies of gallium and lithium. Minerals 2019, 9, 402. [Google Scholar] [CrossRef] [Green Version]
- Finkelman, R.B.; Palmer, C.; Wang, P. Quantification of the modes of occurrence of 42 elements in coal. Int. J. Coal Geol. 2018, 185, 138–160. [Google Scholar] [CrossRef]
- Diehl, S.; Goldhaber, M.; Koenig, A.; Lowers, H.; Ruppert, L. Distribution of arsenic, selenium, and other trace elements in high pyrite Appalachian coals: Evidence for multiple episodes of pyrite formation. Int. J. Coal Geol. 2012, 94, 238–249. [Google Scholar] [CrossRef]
- Hower, J.; Campbell, J.; Teesdale, W.; Nejedly, Z.; Robertson, J. Scanning proton microprobe analysis of mercury and other trace elements in Fe-sulfides from a Kentucky coal. Int. J. Coal Geol. 2008, 75, 88–92. [Google Scholar] [CrossRef]
- Karayigit, A.; Mastalerz, M.; Oskay, R.; Gayer, R. Coal petrography, mineralogy, elemental compositions and palaeo-environmental interpretation of Late Carboniferous coal seams in three wells from the Kozlu coalfield (Zonguldak Basin, NW Turkey). Int. J. Coal Geol. 2018, 187, 54–70. [Google Scholar] [CrossRef]
- Karayigit, A.; Atalay, M.; Oskay, R.; Córdoba, P.; Querol, X.; Bulut, Y. Variations in elemental and mineralogical compositions of Late Oligocene, Early and Middle Miocene coal seams in the Kale-Tavas Molasse sub-basin, SW Turkey. Int. J. Coal Geol. 2020, 218, 103366. [Google Scholar] [CrossRef]
- Kolker, A. Minor element distribution in iron disulfides in coal: A geochemical review. Int. J. Coal Geol. 2012, 94, 32–43. [Google Scholar] [CrossRef]
- Spears, D. The role of seawater on the trace element geochemistry of some UK coals and a tribute to Goldschmidt. Minerals 2017, 7, 148. [Google Scholar] [CrossRef] [Green Version]
- Sun, Y.; Zhao, C.; Li, Y.; Wang, J.; Liu, S. Li distribution and mode of occurrences in Li-bearing coal seam# 6 from the Guanbanwusu Mine, Inner Mongolia, Northern China. Energy Explor. Exploit. 2012, 30, 109–130. [Google Scholar]
- Sun, Y.; Yang, J.; Zhao, C. Minimum mining grade of associated Li deposits in coal seams. Energy Explor. Exploit. 2012, 30, 167–170. [Google Scholar] [CrossRef] [Green Version]
- Sun, Y.; Zhao, C.; Li, Y.; Wang, J.; Lin, M. Li distribution and mode of occurrences in Li-bearing coal seam 9 from Pingshuo Mining district, Ningwu Coalfield, northern China. Energy Educ. Sci. Technol. Part A 2013, 31, 47–58. [Google Scholar]
- Wang, J.; Wang, Q.; Shi, J.; Li, Z. Distribution and enrichment mode of Li in the No. 11 coal seam from Pingshuo mining district, Shanxi province. Energy Explor. Exploit. 2015, 33, 203–215. [Google Scholar] [CrossRef]
- Wang, X.; Wang, X.; Pan, Z.; Pan, W.; Yin, X.; Chai, P.; Pan, S.; Yang, Q. Mineralogical and geochemical characteristics of the Permian coal from the Qinshui Basin, northern China, with emphasis on lithium enrichment. Int. J. Coal Geol. 2019, 214, 103254–103268. [Google Scholar] [CrossRef]
- He, H.T.; Wang, J.X.; Xing, L.C.; Zhao, S.S.; He, M.Y.; Zhao, C.L.; Sun, Y.Z. Enrichment mechanisms of lithium in the No. 6 coal seam from the Guanbanwusu Mine, Inner Mongolia, China: Explanations based on Li isotope values and density functional theory calculations. J. Geochem. Explor. 2020, 213, 106510. [Google Scholar] [CrossRef]
- Lewińska-Preis, L.; Fabiańska, M.J.; Ćmiel, S.; Kita, A. Geochemical distribution of trace elements in Kaffioyra and Longyearbyen coals, Spitsbergen, Norway. Int. J. Coal Geol. 2009, 80, 211–223. [Google Scholar] [CrossRef]
- Dai, S.; Hower, J.; Finkelman, R.; Graham, I.; French, D.; Ward, C.; Eskenazy, G.; Wei, Q.; Zhao, L. Organic associations of non-mineral elements in coal: A review. Int. J. Coal Geol. 2020, 218, 103347. [Google Scholar] [CrossRef]
- Karayigit, A.; Littke, R.; Querol, X.; Jones, T.; Oskay, R.; Christanis, K. The Miocene coal seams in the Soma Basin (W. Turkey): Insights from coal petrography, mineralogy and geochemistry. Int. J. Coal Geol. 2017, 173, 110–128. [Google Scholar] [CrossRef]
- Li, J.; Zhuang, X.; Yuan, W.; Liu, B.; Querol, X.; Font, O.; Moreno, N.; Li, J.; Gang, T.; Liang, G. Mineral composition and geochemical characteristics of the Li-Garich coals in the Buertaohai-Tianjiashipan mining district, Jungar Coalfield, Inner Mongolia. Int. J. Coal Geol. 2016, 167, 157–175. [Google Scholar] [CrossRef]
- Zhao, L.; Dai, S.; Nechaev, V.P.; Nechaev, E.V.; Graham, I.T.; French, D. Enrichment origin of critical elements (Li and rare earth elements) and a MoU-Se-Re assemblage in Pennsylvanian anthracite from the Jincheng Coalfield, southeastern Qinshui Basin, northern China. Ore Geol. Rev. 2019, 115, 1–16. [Google Scholar] [CrossRef]
- Hoyer, M.; Kummer, N.A.; Merkel, B. Sorption of lithium on bentonite, kaolin and zeolite. Geosciences 2015, 5, 127–140. [Google Scholar] [CrossRef] [Green Version]
- Greene-Kelly, R. Lithium absorption by kaolin minerals. J. Phys. Chem. 1955, 59, 1151–1152. [Google Scholar] [CrossRef]
- Clauer, N.; Williams, L.B.; Lemarchand, D.; Florian, P.; Honty, M. Illitization decrypted by B and Li isotope geochemistry of nanometer-sized illite crystals from bentonite beds, East Slovak Basin. Chem. Geol. 2018, 477, 177–194. [Google Scholar] [CrossRef]
- Bobos, I.; Williams, L.B. Boron. Lithium and nitrogen isotope geochemistry of NH4-illite clays in the fossil hydrothermal system of Harghita Bãi, East Carpathians, Romania. Chem. Geol. 2017, 473, 22–39. [Google Scholar] [CrossRef]
- Berger, G.; Schott, J.; Guy, C. Behavior of Li, Rb and Cs during basalt glass and olivine dissolution and chlorite, smectite and zeolite precipitation from seawater: Experimental investigations and modelization between 50 °C and 300 °C. Chem. Geol. 1988, 71, 297–312. [Google Scholar] [CrossRef]
- Bujdák, J.; Slosiarikova, H.; Novakova, L.; Cicel, B. Fixation of lithium cations in montmorillonite. Chem. Pap. 1991, 45, 499–507. [Google Scholar]
- Hindshaw, R.S.; Tosca, R.; Goût, T.L.; Farnan, I.; Tosca, N.J.; Tipper, E.T. Experimental constraints on Li isotope fractionation during clay formation. Geochim. Cosmochim. Acta 2019, 250, 219–237. [Google Scholar] [CrossRef]
- Vigier, N.; Decarreau, A.; Millot, R.; Carignan, J.; Petit, S.; France-Lanord, C. Quantifying Li isotope fractionation during smectite formation and implications for the Li cycle. Geochim. Cosmochim. Acta 2008, 72, 780–792. [Google Scholar] [CrossRef]
- Zhao, L.; Ward, C.R.; French, D.; Graham, I.T.; Dai, S.; Yang, C.; Xie, P.; Zhang, S. Origin of a kaolinite-NH4-illite-pyrophyllite-chlorite assemblage in a marine-influenced anthracite and associated strata from the Jincheng Coalfield, Qinshui Basin, Northern China. Int. J. Coal Geol. 2018, 185, 61–78. [Google Scholar] [CrossRef]
- Vassilev, S.V.; Vassileva, C.G. Geochemistry of coals, coal ashes and combustion wastes from coal-fired power stations. Fuel Process. Technol. 1997, 51, 19–45. [Google Scholar] [CrossRef]
- Shao, L.; Hou, H.; Tang, Y.; Lu, J.; Qiu, H.; Wang, X.; Zhang, J. Selection of strategic relay areas of CBM exploration and development in China. Nat. Gas Ind. 2015, 35, 211–221. [Google Scholar] [CrossRef] [Green Version]
- Liu, D.; Yao, Y.; Liu, Z.; Tang, D.; Tang, S.; Che, Y.; Huang, W. Coal reservoir characteristics and perspective and target areas for CBM in the Anyang-Hebi Coalfield, North China. Geoscience 2008, 05, 787–793. [Google Scholar]
- Wang, S. Prospecting coalbed methane resource in Anyang-Hebi mining area. Coal Sci. Technol. 2009, 37, 103–106. [Google Scholar]
- Zhao, S.; Shao, L.; Hou, H.; Tang, Y.; Li, Z.; Yao, M.; Zhang, J. Methane adsorption characteristics and its influencing factors of the medium-to-high rank coals in the Anyang-Hebi coalfield, northern China. Energy Explor. Exploit. 2019, 37, 60–82. [Google Scholar] [CrossRef]
- Wang, H.; Zhao, M.; Zhang, Y. Investigation and resources potential evaluation of lithium content in principal mining seams of Henan Province. Coal Sci. Technol. 2018, 46, 191–195. [Google Scholar]
- Ketris, M.P.; Yudovich, Y.E. Estimations of Clarkes for Carbonaceous biolithes: World averages for trace element contents in black shales and coals. Int. J. Coal Geol. 2009, 78, 135–148. [Google Scholar] [CrossRef]
- Zhang, H.; Shen, G.; He, Z. Control of paleoclimatic change on late Paleozoic coal accumulation of the North China Plate. Acta Geol. Sin. 1999, 73, 131–139. [Google Scholar]
- Li, Y.; Shao, L.; Fielding, C.R.; Wang, D.; Mu, G.; Luo, H. Sequence stratigraphic analysis of thick coal seams in paralic environments—A case study from the Early Permian Shanxi Formation in the Anhe coalfield, Henan Province, North China. Int. J. Coal Geol. 2020, 222, 103451. [Google Scholar] [CrossRef]
- Li, L.; Ning, C.; Li, H. Research of Late Paleozoic coal-forming environment and coal accumulating law in Anhe coalfield. Coal 2013, 165, 7–19. [Google Scholar]
- ASTM International. Test Method for Moisture in the Analysis Sample of Coal and Coke; ASTM Standard D3173-11; Annual Book of ASTM Standards; ASTM International: West Conshohocken, PA, USA, 2011. [Google Scholar]
- ASTM International. Test Method for Ash in the Analysis Sample of Coal and Coke; ASTM Standard D3174-11; Annual Book of ASTM Standards; ASTM International: West Conshohocken, PA, USA, 2011. [Google Scholar]
- ASTM International. Test Method for Volatile Matter in the Analysis Sample of Coal and Coke; ASTM Standard D3175-11; Annual Book of ASTM Standards; ASTM International: West Conshohocken, PA, USA, 2011. [Google Scholar]
- International Committee for Coal and Organic Petrology (ICCP). The new vitrinite classification (ICCP System 1994). Fuel 1998, 77, 349–358. [Google Scholar] [CrossRef]
- International Committee for Coal and Organic Petrology (ICCP). The new inertinite classification (ICCP System 1994). Fuel 2001, 80, 459–471. [Google Scholar] [CrossRef]
- Pickel, W.; Kus, J.; Flores, D.; Kalaitzidis, S.; Christanis, K.; Cardott, B.J.; Misz-Kennan, M.; Rodrigues, S.; Hentschel, A.; Hamor-Vido, M.; et al. Classification of liptinite—ICCP System 1994. Int. J. Coal Geol. 2017, 169, 40–61. [Google Scholar] [CrossRef] [Green Version]
- ASTM International. Standard Test Method for Microscopical Determination of the Vitrinite Reflectance of Coal; ASTM Standard D2798-11a; ASTM International: West Conshohocken, PA, USA, 2011. [Google Scholar]
- ASTM International. Test Methods for Total Sulfur in the Analysis Sample of Coal and Coke; ASTM Standard D3177-02; ASTM International: West Conshohocken, PA, USA, 2011. [Google Scholar]
- ASTM International. Standard Test Method for Forms of Sulfur in Coal; ASTM Standard D2492-02; ASTM International: West Conshohocken, PA, USA, 2012. [Google Scholar]
- Standardization Administration of China; General Administration of Quality Supervision, Inspection and Quarantine of the China. Chinese National Standard SY/T 5163-2010; Standand Press of China: Beijing, China, 2010. (In Chinese) [Google Scholar]
- Chung, F. Quantitative interpretation of X-ray diffraction patterns of mixtures: I. Matrix flushing method for quantitative multicomponent analysis. J. Appl. Cryst. 1974, 7, 519–525. [Google Scholar] [CrossRef]
- ASTM International. Standard Classification of Coals by Rank; ASTM D388-12; ASTM International: West Conshohocken, PA, USA, 2012. [Google Scholar]
- Standardization Administration of China; General Administration of Quality Supervision, Inspection and Quarantine of the China. Classification for Quality of Coal—Part 1: Ash; Chinese National Standard GB15224.1-2010; Standand Press of China: Beijing, China, 2010. (In Chinese) [Google Scholar]
- Standardization Administration of China; General Administration of Quality Supervision, Inspection and Quarantine of the China. Classification for Quality of Coal—Part 2: Sulfur Content; Chinese National Standard GB/T 15224.2-2010; Standand Press of China: Beijing, China, 2010. (In Chinese) [Google Scholar]
- O’Keefe, J.M.K.; Bechtel, A.; Christanis, K.; Dai, S.; DiMichele, W.A.; Eble, C.F.; Esterle, J.S.; Mastalerz, M.; Raymond, A.L.; Valentim, B.V.; et al. On the fundamental difference between coal rank and coal type. Int. J. Coal Geol. 2013, 118, 58–87. [Google Scholar] [CrossRef]
- Han, D.; Ren, D.; Wang, Y.; Jin, K.; Mao, H.; Qin, Y. Coal Petrology in China; China University of Mining & Technology Press: Xuzhou, China, 1996; pp. 104–123. [Google Scholar]
- Sun, Y.; Zhao, C.; Li, Y.; Wang, J.; Zhang, J.; Jin, Z.; Lin, M.; Kalkreuth, W. Further information of the associated Li deposits in the No. 6 coal seam at Jungar Coalfield, Inner Mongolia, Northern China. Acta Geol. Sin. 2013, 87, 1097–1108. [Google Scholar]
- Grigoriev, N.A. Chemical Element Distribution in the Upper Continental Crust; UB RAS: Ekaterinburg, Russia, 2009; Volume 382, p. 383. [Google Scholar]
- Taylor, S.R.; McLennan, S.M. The geochemical evolution of the continental crust. Rev. Geophys. 1995, 33, 241–265. [Google Scholar] [CrossRef]
- Loges, A.; Wagner, T.; Barth, M.; Bau, M.; GÖb, S.; Markl, G. Negative Ce anomalies in Mn oxides: The role of Ce4+ mobility during water-mineral interaction. Geochim. Cosmochim. Acta 2012, 86, 296–317. [Google Scholar] [CrossRef]
- Dai, S.; Graham, I.T.; Ward, C.R. A review of anomalous rare earth elements and yttrium in coal. Int. J. Coal Geol. 2016, 159, 82–95. [Google Scholar] [CrossRef]
- Seredin, V.V.; Dai, S. Coal deposits as potential alternative sources for lanthanides and yttrium. Int. J. Coal Geol. 2012, 94, 67–93. [Google Scholar] [CrossRef]
- Yan, X.; Dai, S.; Graham, I.T.; He, X.; Shan, K.; Liu, X. Determination of Eu concentrations in coal, fly ash and sedimentary rocks using a cation exchange resin and inductively coupled plasma mass spectrometry (ICP-MS). Int. J. Coal Geol. 2018, 191, 152–156. [Google Scholar] [CrossRef]
- Finkelman, R.B.; Dai, S.; French, D. The importance of minerals in coal as the hosts of chemical elements: A review. Int. J. Coal Geol. 2019, 212, 103251. [Google Scholar] [CrossRef]
- Loughnan, F.C. Chemical Weathering of the Silicate Minerals; Elsevier: New York, NY, USA, 1969. [Google Scholar]
- Ward, C.R. Analysis, origin and significance of mineral matter in coal: An updated review. Int. J. Coal Geol. 2016, 165, 1–27. [Google Scholar] [CrossRef]
- Dai, S.; Bechtel, A.; Eble, C.F.; Flores, R.M.; French, D.; Graham, I.T.; Hood, M.M.; Hower, J.C.; Korasidis, V.A.; Moore, T.A.; et al. Recognition of peat depositional environments in coal: A review. Int. J. Coal Geol. 2020, 219, 103383. [Google Scholar] [CrossRef]
- Dai, S.; Li, T.; Jiang, Y.; Ward, C.R.; Hower, J.C.; Sun, J.; Liu, J.; Song, H.; Wei, J.; Li, Q.; et al. Mineralogical and geochemical compositions of the Pennsylvanian coal in the Hailiushu Mine, Daqingshan Coalfield, Inner Mongolia, China: Implications of sediment-source region and acid hydrothermal solutions. Int. J. Coal Geol. 2015, 137, 92–110. [Google Scholar] [CrossRef]
- Zhao, L.; Ward, C.R.; French, D.; Graham, I.T. Mineralogical composition of Late Permian coal seams in the Songzao Coalfield, southwestern China. Int. J. Coal Geol. 2013, 116–117, 208–226. [Google Scholar] [CrossRef]
- Finkelman, R.B. Modes of Occurrence of Trace Elements in Coal; USGS Open-File Report; Springer: Berlin, Germany, 1981; Volumes 81–99, p. 322. [Google Scholar]
- Spiro, B.F.; Liu, J.; Dai, S.; Zeng, R.; Large, D.; French, D. Marine derived 87Sr/86Sr in coal, a new key to geochronology and palaeoenvironment: Elucidation of the India-Eurasia and China-Indochina collisions in Yunnan, China. Int. J. Coal Geol. 2019, 215, 103304. [Google Scholar] [CrossRef]
- Karayigit, A.I.; Oskay, R.G.; Gayer, R.A. Mineralogy and geochemistry of feed coals and combustion residues of the Kangal power plant (Sivas, Turkey). Turk. J. Earth Sci. 2019, 28, 438–456. [Google Scholar] [CrossRef]
- Dai, S.; Hower, J.C.; Ward, C.R.; Guo, W.; Song, H.; O’Keefe, J.M.K.; Xie, P.; Hood, M.M.; Yan, X. Elements and phosphorus minerals in the middle Jurassic inertiniterich coals of the Muli Coalfield on the Tibetan Plateau. Int. J. Coal Geol. 2015, 144–145, 23–47. [Google Scholar] [CrossRef]
- Hayashi, K.I.; Fujisawa, H.; Holland, H.D.; Ohmoto, H. Geochemistry of ∼1.9 Ga sedimentary rocks from northeastern Labrador, Canada. Geochim. Cosmochim. Acta 1997, 61, 4115–4137. [Google Scholar] [CrossRef]
- Liu, J.; Nechaev, V.P.; Dai, S.; Song, H.; Nechaeva, E.V.; Jiang, Y.; Graham, I.T.; French, D.; Yang, P.; Hower, J.C. Evidence for multiple sources for inorganic components in the Tucheng coal deposit, western Guizhou, China and the lack of critical-elements. Int. J. Coal Geol. 2020, 103468. [Google Scholar] [CrossRef]
- Liu, J.; Song, H.; Dai, S.; Nechaev, V.P.; Graham, I.T.; French, D.; Nechaeva, E.V. Mineralization of REE-Y-Nb-Ta-Zr-Hf in Wuchiapingian coals from the Liupanshui Coalfield, Guizhou, southwestern China: Geochemical evidence for terrigenous input. Ore Geol. Rev. 2019, 115, 103190. [Google Scholar] [CrossRef]
- Dai, S.; Seredin, V.V.; Ward, C.R.; Hower, J.C.; Xing, Y.; Zhang, W.; Song, W.; Wang, P. Enrichment of U-Se-Mo-Re-V in coals preserved within marine carbonate successions: Geochemical and mineralogical data from the Late Permian Guiding Coalfield, Guizhou, China. Min. Depos. 2015, 50, 159–186. [Google Scholar] [CrossRef]
- Le Maitre, R.W.; Streckeisen, A.; Zanettin, B.; Le Bas, M.J.; Bonin, B.; Bateman, P.; Bellieni, G.; Dudek, A.; Efremova, S.; Keller, J.; et al. Igneous Rocks: A Classification and Glossary of Terms, 2nd ed.; Cambridge University Press: Cambridge, UK, 2002; Volume 254. [Google Scholar]
- Wang, G. The Study of Sources and Sequence-Lithofaces Palaeogeography of Upper Palaezoic, Northern Ordos. Ph.D. Thesis, Chengdu University of Technology, Chengdu, China, 2011. [Google Scholar]
- Han, D.; Yang, Q. (Eds.) Coal Geology of China; Publishing House of China Coal Industry: Beijing, China, 1980; Volume 2. (In Chinese) [Google Scholar]
- Shao, L.; Dong, D.; Li, M.; Wang, H.; Wang, D.; Lu, J.; Zheng, M.; Cheng, A. Sequence-paleogeography and coal accumulation of the Carboniferous-Permian in the north china basin. J. China Coal Soc. 2014, 39, 1725–1734. (In Chinese) [Google Scholar]
- Zhang, S.; Liu, C.; Liang, H.; Wang, J.; Bai, J.; Yang, M.; Liu, G.; Huang, H.; Guan, Y. Paleoenvironmental conditions, organic matter accumulation, and unconventional hydrocarbon potential for the Permian Lucaogou Formation organic-rich rocks in Santanghu Basin, NW China. Int. J. Coal Geol. 2018, 185, 44–60. [Google Scholar] [CrossRef]
- Zhao, L.; Sun, J.; Guo, W.; Wang, P.; Ji, D. Mineralogy of the Pennsylvanian coal seam in the Datanhao mine, Daqingshan Coalfield, Inner Mongolia, China: Genetic implications for mineral matter in coal deposited in an intermontane basin. Int. J. Coal Geol. 2016, 167, 201–214. [Google Scholar] [CrossRef]
- Wei, W.; Algeo, T.J.; Lu, Y.; Lu, Y.; Liu, H.; Zhang, S.; Peng, L.; Zhang, J.; Chen, L. Identifying marine incursions into the Paleogene Bohai Bay Basin lake system in northeastern China. Int. J. Coal Geol. 2018, 200, 1–17. [Google Scholar] [CrossRef]
- Dai, S.; Ji, D.; Ward, C.R.; French, D.; Hower, J.C.; Yan, X.; Wei, Q. Mississippian anthracites in Guangxi Province, southern China: Petrological, mineralogical, and rare earth element evidence for high-temperature solutions. Int. J. Coal Geol. 2018, 197, 84–114. [Google Scholar] [CrossRef]
- Zhao, L.; Dai, S.; Nechaev, V.P.; Nechaeva, E.V.; Graham, I.T.; French, D.; Sun, J. Enrichment of critical elements (Nb-Ta-Zr-Hf-REE) within coal and host rocks from the Datanhao mine, Daqingshan Coalfield, northern China. Ore Geol. Rev. 2019, 111, 102951. [Google Scholar] [CrossRef]
- Ward, C.R. Analysis and significance of mineral matter in coal seams. Int. J. Coal Geol. 2002, 50, 135–168. [Google Scholar] [CrossRef]
- Ward, C.R. Minerals in bituminous coals of the Sydney Basin (Australia) and the Illinois Basin (U.S.A.). Int. J. Coal Geol. 1989, 13, 455–479. [Google Scholar] [CrossRef]
- Dai, S.; Yang, J.; Ward, C.R.; Hower, J.C.; Liu, H.; Garrison, T.M.; French, D.; O’Keefe, J.M.K. Geochemical and mineralogical evidence for a coal-hosted uranium deposit in the Yili Basin, Xinjiang, northwestern China. Ore Geol. Rev. 2015, 70, 1–30. [Google Scholar] [CrossRef]
- Qin, G.; Cao, D.; Wei, Y.; Wang, A.; Liu, J. Geochemical characteristics of the Permian coals in the Junger-Hebaopian mining district, northeastern Ordos Basin, China: Key role of paleopeat-forming environments in Ga-Li-REY enrichment. J. Geochem. Explor. 2020, 106494. [Google Scholar] [CrossRef]
- Beckmann, B.; Flögel, S.; Hofmann, P.; Schulz, M.; Wagner, T. Orbital forcing of Cretaceous river discharge in tropical Africa and ocean response. Nature 2005, 437, 241–244. [Google Scholar] [CrossRef] [PubMed]
- Adegoke, A.K.; Abdullah, W.H.; Hakimi, M.H.; Yandoka, B.M.S.; Mustapha, K.A.; Aturamu, A.O. Trace elements geochemistry of kerogen in Upper Cretaceous sediments, Chad (Bornu) Basin, northeastern Nigeria: Origin and paleo-redox conditions. J. Afr. Earth Sci. 2014, 100, 675–683. [Google Scholar] [CrossRef]
- Deng, H.W.; Qian, K. Elemental geochemistry. In Sedimentary Geochemistry and Environment Analysis; Deng, H.W., Qian, K., Eds.; Science and Technology of Gansu Press: Lanzhou, China, 1993; pp. 4–31. [Google Scholar]
- Roy, D.K.; Roser, B.P. Climatic control on the composition of Carboniferous-Permian Gondwana sediments, Khalaspir basin, Bangladesh. Gondwana Res. 2013, 23, 1163–1171. [Google Scholar] [CrossRef]
- Wang, X.; Tang, Y.; Jiang, Y.; Xie, P.; Zhang, S.; Chen, Z. Mineralogy and geochemistry of an organic- and V-Cr-Mo-U-rich siliceous rock of Late Permian age, western Hubei Province, China. Int. J. Coal Geol. 2017, 172, 19–30. [Google Scholar] [CrossRef]
- Wang, Z.; Fu, X.; Feng, X.; Song, C.; Wang, D.; Chen, W.; Zeng, S. Geochemical features of the black shales from the Wuyu Basin, southern Tibet: Implications for palaeoenvironment and palaeoclimate. Geol. J. 2017, 52, 282–297. [Google Scholar] [CrossRef]
- Meng, Q.T.; Liu, Z.J.; Bruch, A.A.; Liu, R.; Hu, F. Palaeoclimatic evolution during Eocene and its influence on oil shale mineralisation, Fushun basin, China. J. Asian Earth Sci. 2012, 45, 95–105. [Google Scholar] [CrossRef]
Figure 1.
Location of the Hebi No. 6 mine of the Anhe Coalfield, North China.

Figure 2.
(A) Sedimentary sequences [71] and (B) the vertical sampled section of the No. 21 coal from the Hebi No. 6 mine, Anhe Coalfield. The red pentagram represents the coal seam studied in this paper.
Figure 2.
(A) Sedimentary sequences [71] and (B) the vertical sampled section of the No. 21 coal from the Hebi No. 6 mine, Anhe Coalfield. The red pentagram represents the coal seam studied in this paper.

Figure 3.
Macerals in the No. 21 coal samples. (A) Telinite, collodetrinite, and semifusinite in sample HB-5; (B) collodetrinite and fracture-filling calcite in sample HB-12; (C) telinite and clay minerals in sample HB-18; (D) collodetrinite, macrinite, clay minerals, and quartz in sample HB-8; (E) collodetrinite and banded-clay minerals in sample HB-23; (F) collodetrinite, semifusinite, and clay minerals in sample HB-8. T, telinite; CD, collodetrinite; SF, semifusinite; clay, clay minerals; Qtz, quartz; Cal, calcite.

Figure 4.
The concentration and concentration coefficient of Li. (A) The concentration of Li; (B) concentration coefficient of Li.
Figure 4.
The concentration and concentration coefficient of Li. (A) The concentration of Li; (B) concentration coefficient of Li.

Figure 5.
Relationship between Eu and Ba in the No. 21 coal from the Hebi No. 6 mine.

Figure 6.
Distribution patterns of REY of the Hebi No. 6 mine samples. (A) Distribution pattern of REY in No. 21 coal; (B) distribution pattern of REY in the partings and floor samples. Note that because the test values of Sm and Dy are abnormal, in this paper they are corrected by interpolation. The numerical value of the dotted line in the REE distribution pattern is the interpolation of the ratio of the REE content on the adjacent sides to the average upper crust content. The calculation formula is as follows: SmN = 0.5 * (NdN + EuN); DyN = 0.5 * (TbN + YN).

Figure 7.
Concentration coefficients (CC) of trace elements in (A) the coal samples, (B) parting samples, and (C) floor sample from the Hebi No. 6 mine. The trace elements concentrations in the coal samples were normalized by the average trace element concentrations of world hard coals [69]. The trace elements concentrations in the partings and floor samples were normalized by the average trace element concentrations of the world clays [90].

Figure 8.
XRD patterns of samples from Hebi No. 6 coal seam. (A) Sample HB-19; (B) sample HB-21; (C) sample HB-23; (D) sample HB-24.
Figure 8.
XRD patterns of samples from Hebi No. 6 coal seam. (A) Sample HB-19; (B) sample HB-21; (C) sample HB-23; (D) sample HB-24.

Figure 9.
SEM images (under “SE mode”) and EDS spectrum of clay minerals. (A,B) Illite, dample HB-13; (C,D) illite, sample HB-8; (E,F) kaolinite, sample HB-23. Note that the unlabeled peak in each spectrum is due to Au, which was used for the sample coating.
Figure 9.
SEM images (under “SE mode”) and EDS spectrum of clay minerals. (A,B) Illite, dample HB-13; (C,D) illite, sample HB-8; (E,F) kaolinite, sample HB-23. Note that the unlabeled peak in each spectrum is due to Au, which was used for the sample coating.

Figure 10.
Calcite and pyrite in samples from Hebi No. 6 mine. (A) Calcite, sample HB-8, SEM images under SE mode; (B) massive and euhedral pyrite, sample HB-21, SEM images under SE mode; (C) massive pyrite, sample HB-21, reflected light, oil immersion; (D) fracture-filling pyrite, sample HB-22, reflected light, oil immersion.

Figure 11.
Relationship between Li and ash yield (A), Al2O3 (B), SiO2 (C), K2O (D), and TiO2 (E) in coal samples.
Figure 11.
Relationship between Li and ash yield (A), Al2O3 (B), SiO2 (C), K2O (D), and TiO2 (E) in coal samples.

Figure 12.
Cluster analysis diagram of elevated trace elements, ash yield, and selected major element oxides in the No. 21 coal. (cluster method, centroid clustering; interval, Pearson correlation; transform values, maximum magnitude of 1).
Figure 12.
Cluster analysis diagram of elevated trace elements, ash yield, and selected major element oxides in the No. 21 coal. (cluster method, centroid clustering; interval, Pearson correlation; transform values, maximum magnitude of 1).

Figure 13.
Plots of the concentration of elevated elements and ash yield, Al2O3, and SiO2 in coal samples. (A) Plot of Ga and ash yield. (B) Plot of Nb and ash yield. (C) Plot of Th and ash yield. (D) Plot of Ga and Al2O3. (E) Plot of Ga and SiO2. (F) Plot of Nb and Al2O3. (G) Plot of Nb and SiO2. (H) Plot of Th and Al2O3. (I) Plot of Th and SiO2. (J) Plot of Pb and ash yield.

Figure 14.
Al2O3/TiO2 ratios of the samples from the Hebi No. 6 mine.

Figure 15.
(A) Variations in Li concentration (μg/g) and Ad (%), Sr/Ba, Sr/Cu, and Rb/Sr; (B) depositional conditions during peat accumulation which are beneficial to the enrichment of Li in the Hebi No. 6 mine.
Figure 15.
(A) Variations in Li concentration (μg/g) and Ad (%), Sr/Ba, Sr/Cu, and Rb/Sr; (B) depositional conditions during peat accumulation which are beneficial to the enrichment of Li in the Hebi No. 6 mine.

Figure 16.
A sequence stratigraphic model of the No. 21 coal member from the Anhe Coalfield (modified from [71]). LST, low-stand systems tracts; TST, transgressive systems tracts; HST, high-stand system tracts.
Figure 16.
A sequence stratigraphic model of the No. 21 coal member from the Anhe Coalfield (modified from [71]). LST, low-stand systems tracts; TST, transgressive systems tracts; HST, high-stand system tracts.

Figure 17.
Relative contents of illite and kaolinite (on 100% clay mineral basis) in some samples from the Hebi No. 6 mine. Note that the dashed lines are the predicted trend of illite and kaolinite content and solid points are the tested data.
Figure 17.
Relative contents of illite and kaolinite (on 100% clay mineral basis) in some samples from the Hebi No. 6 mine. Note that the dashed lines are the predicted trend of illite and kaolinite content and solid points are the tested data.


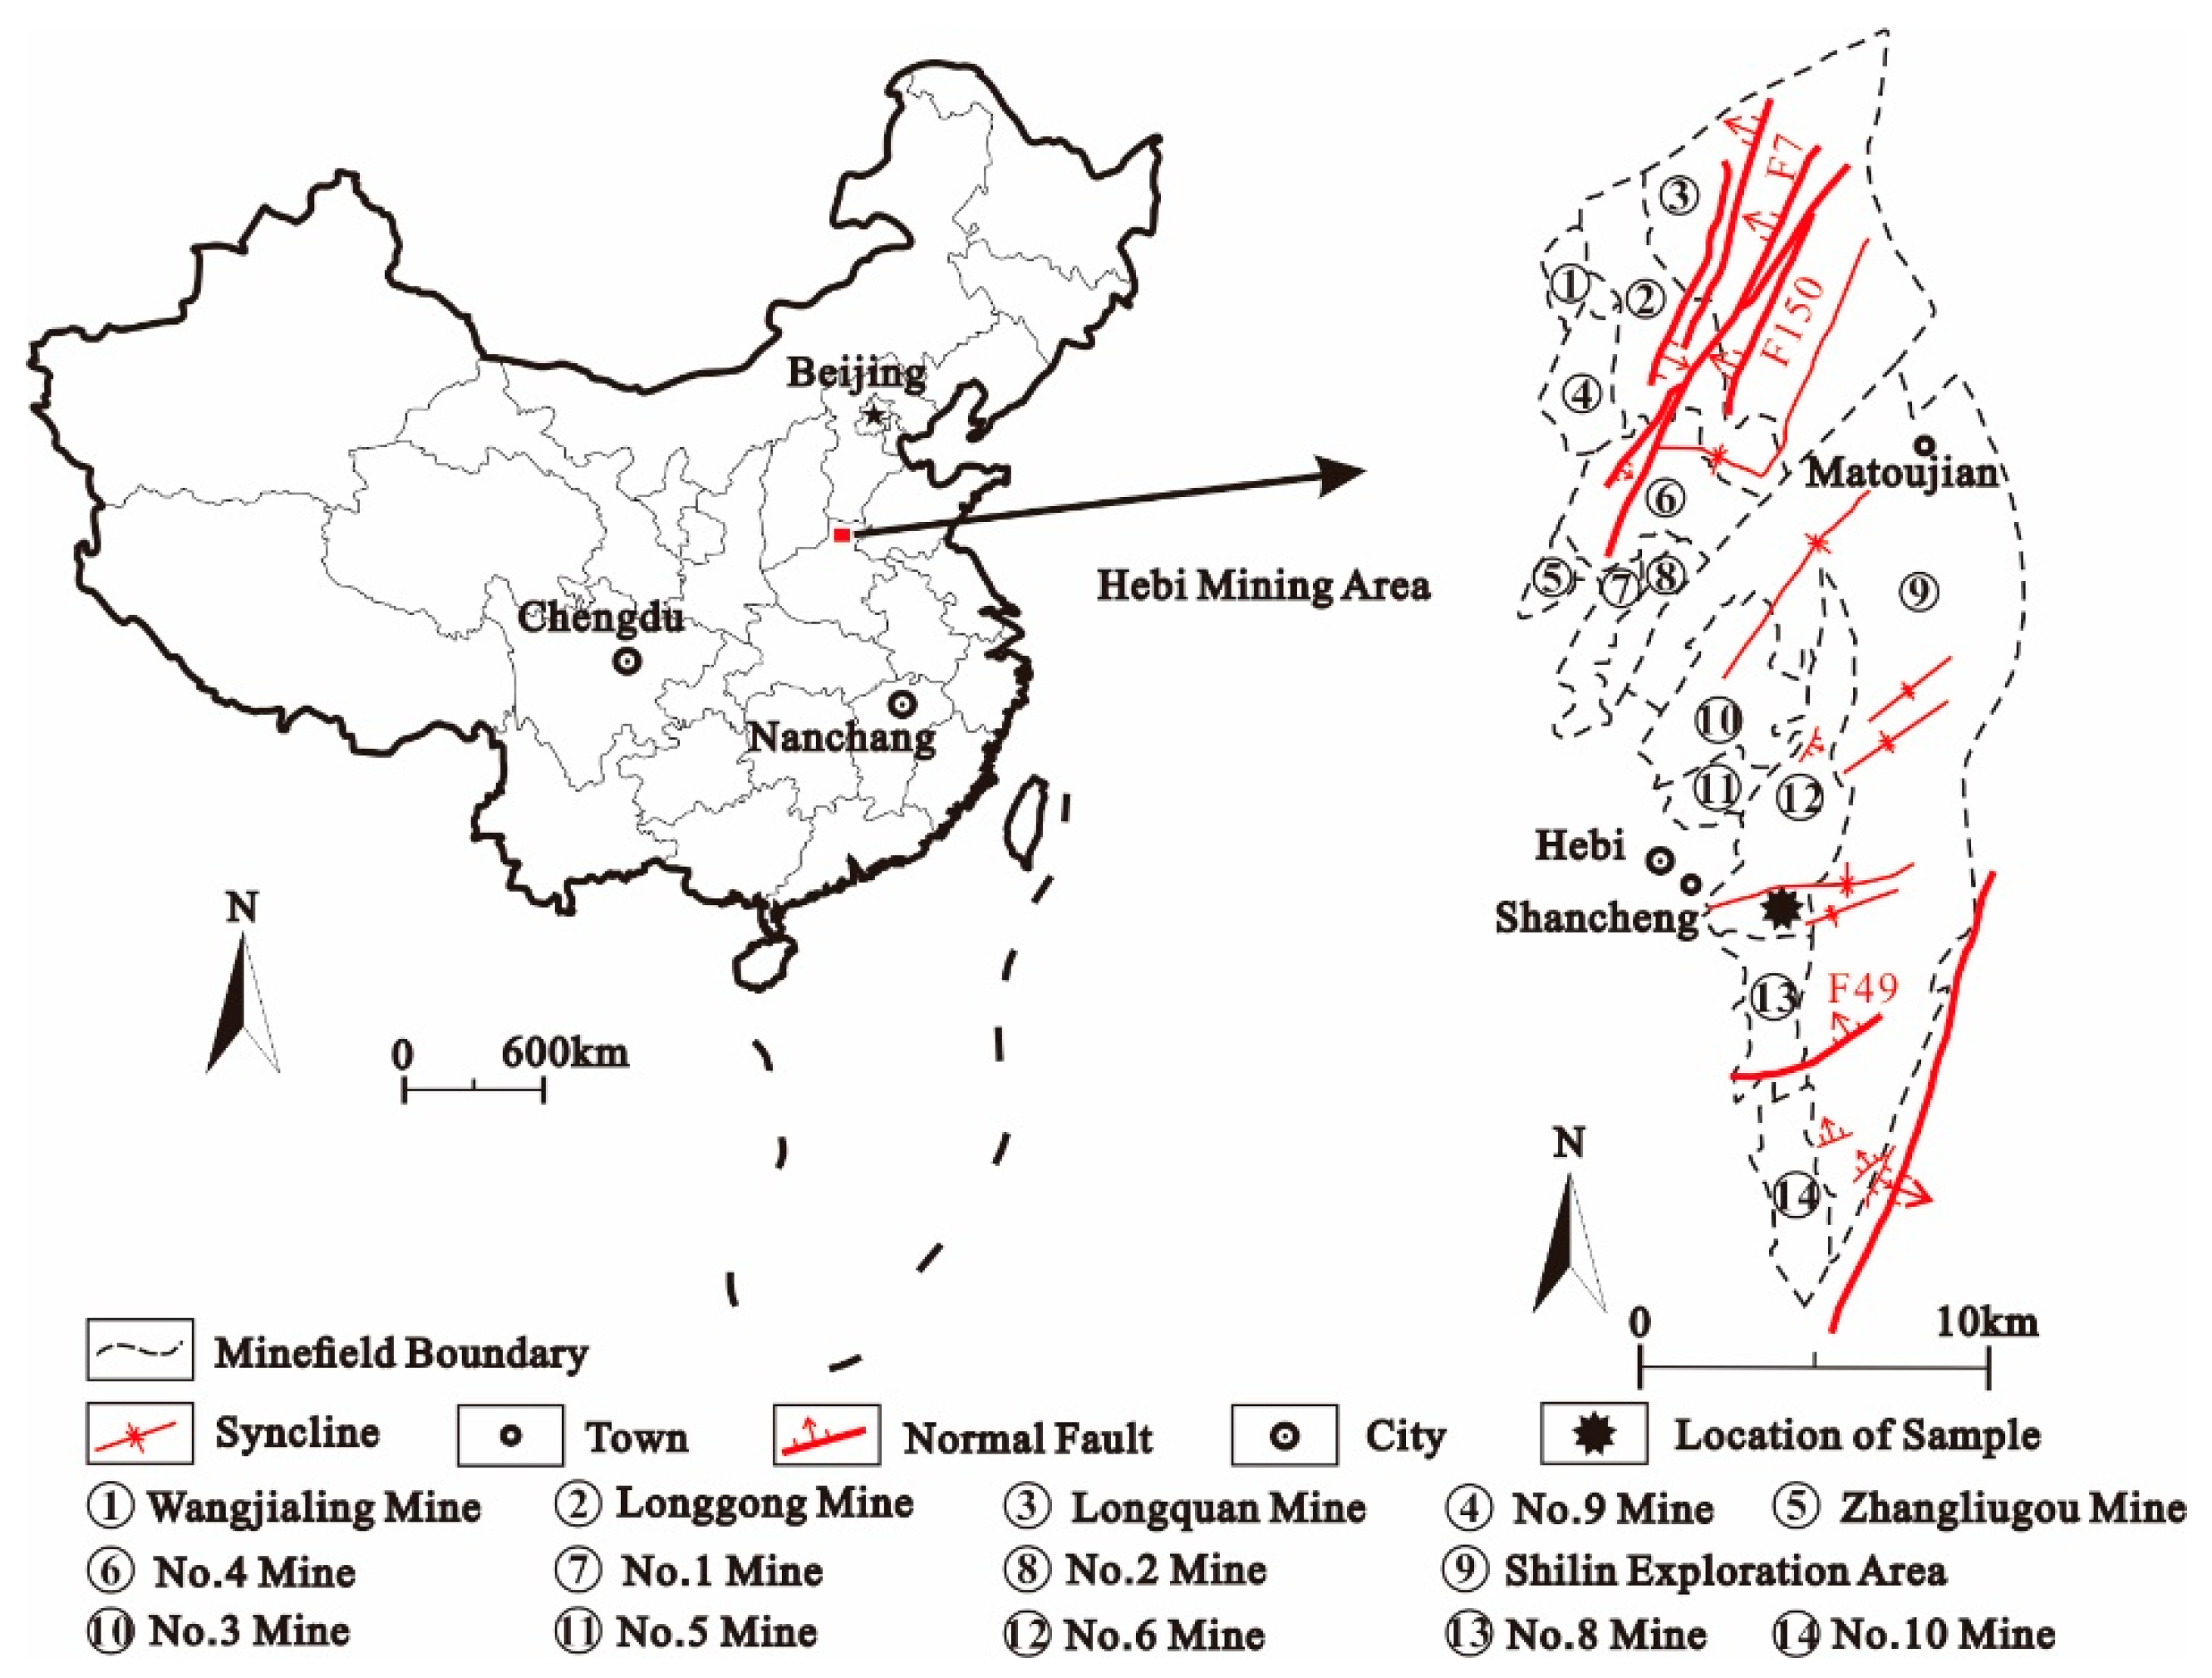
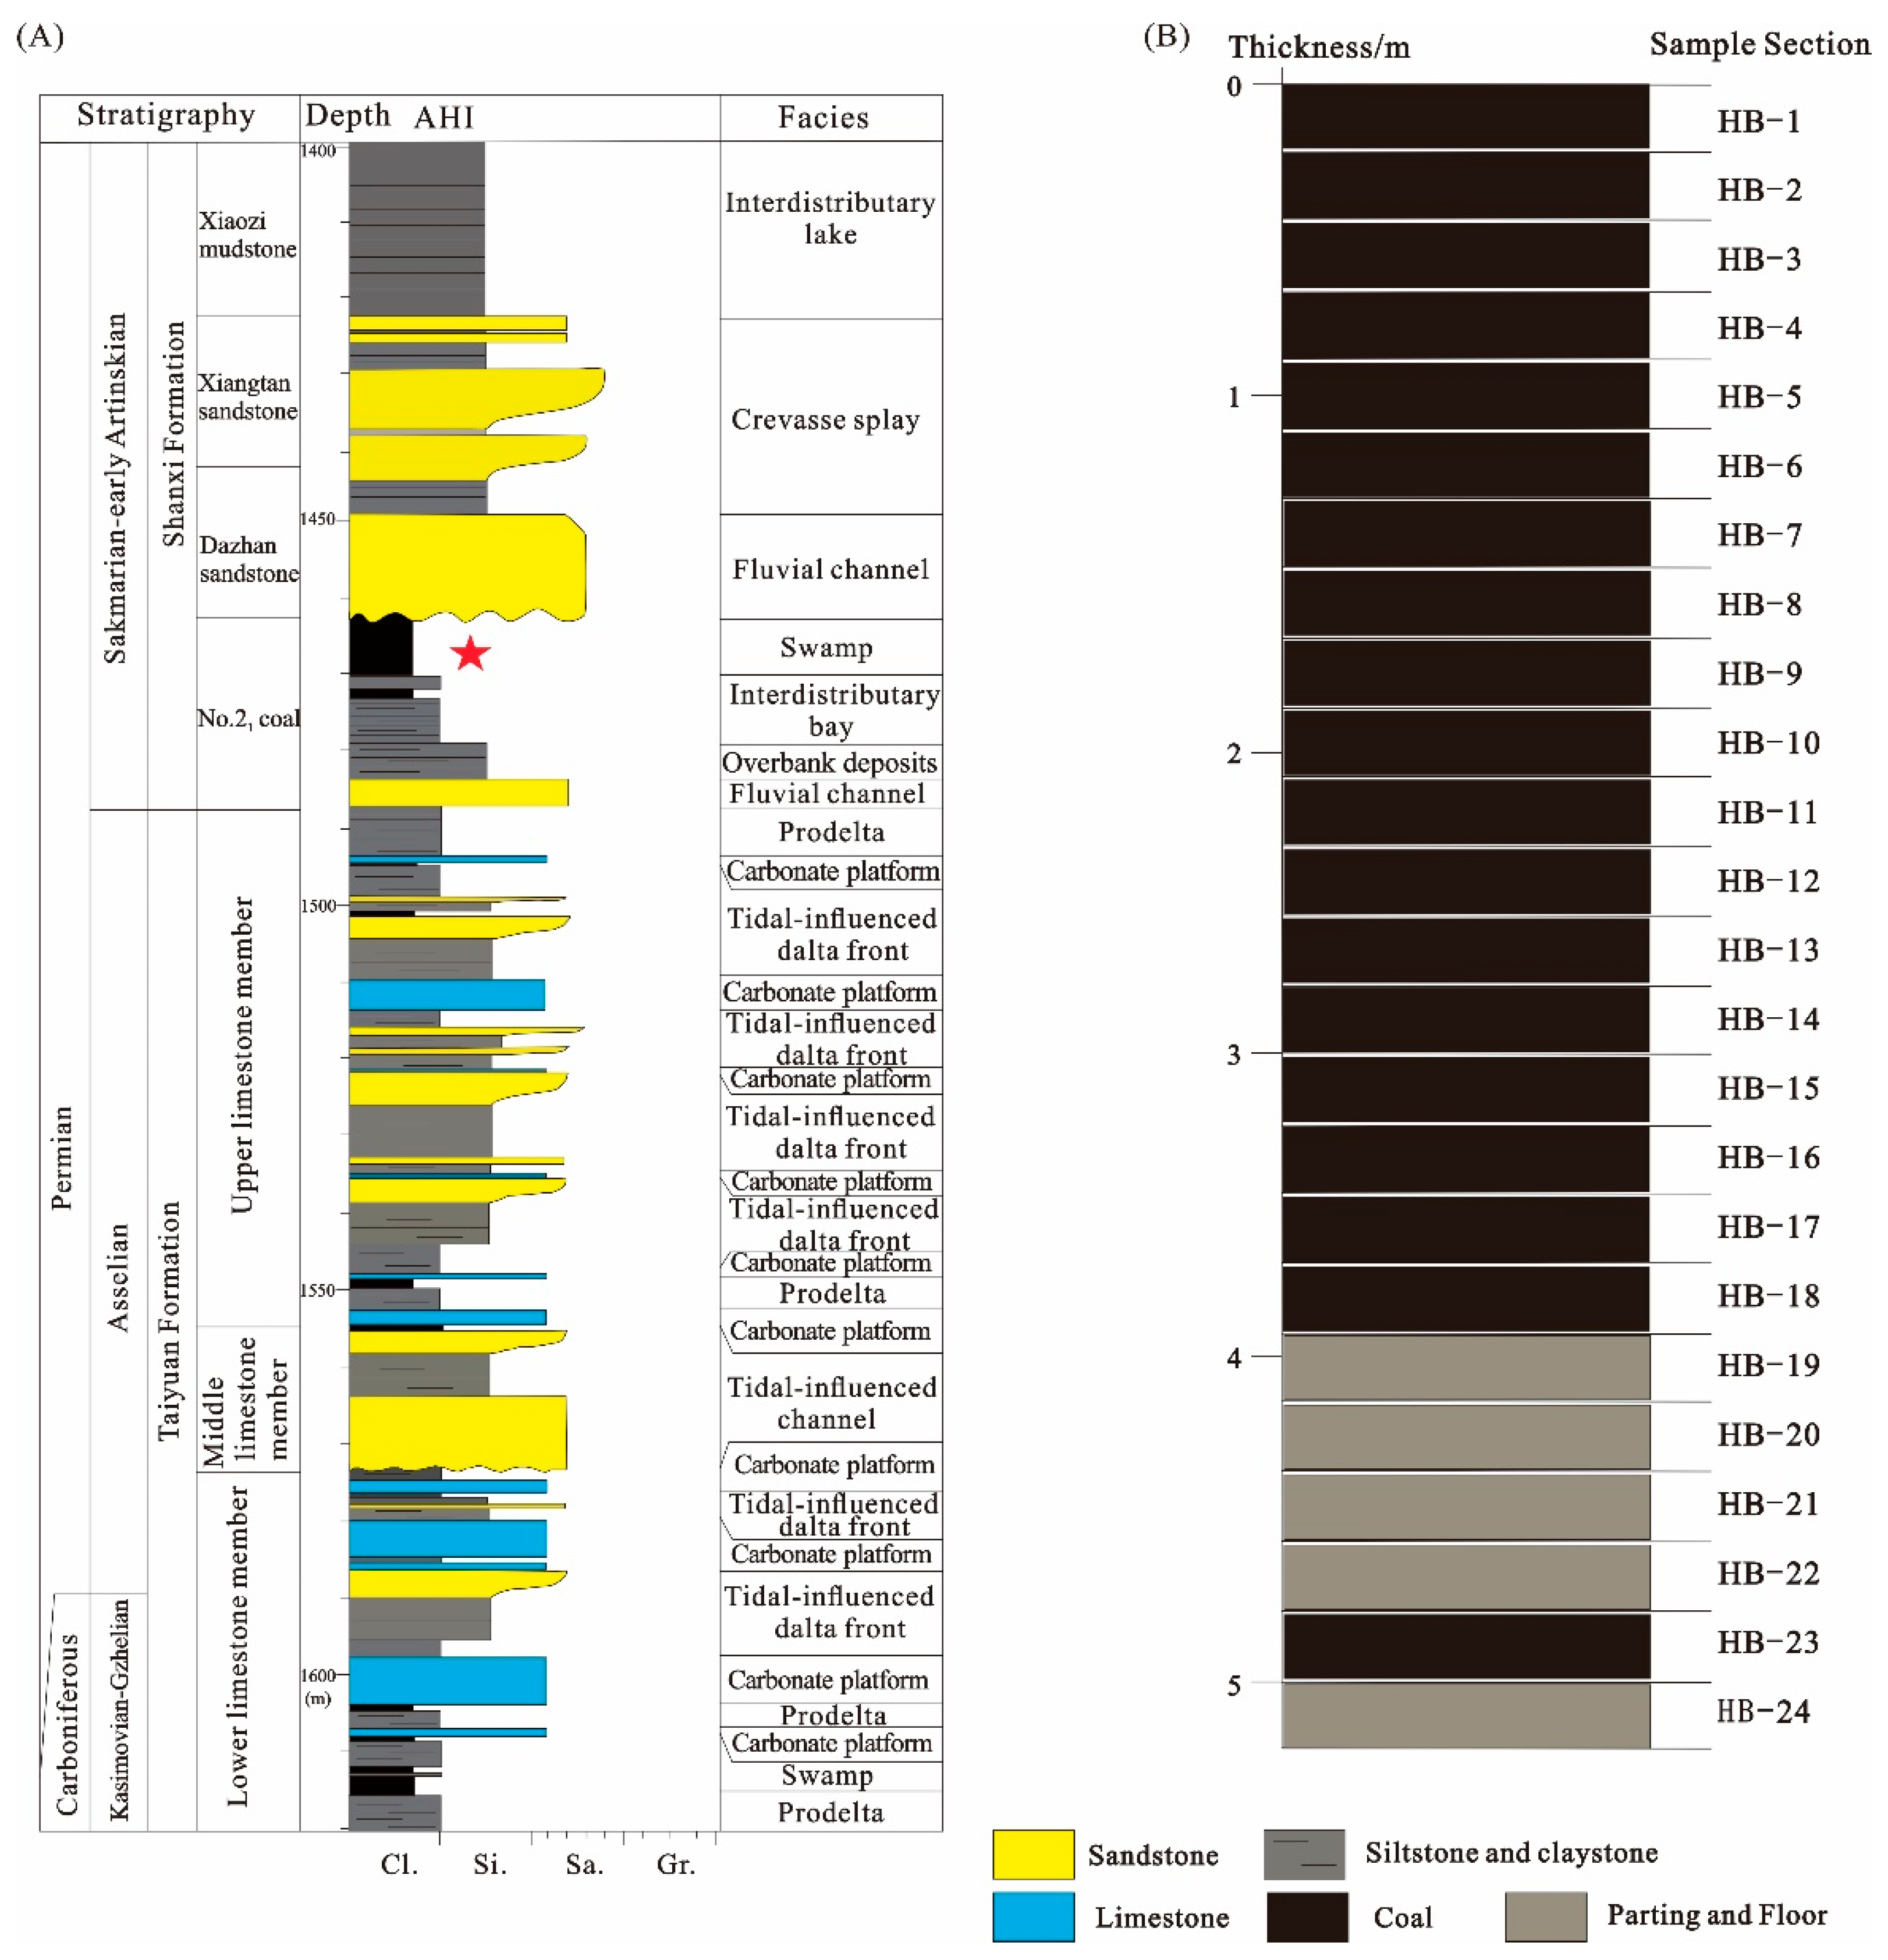
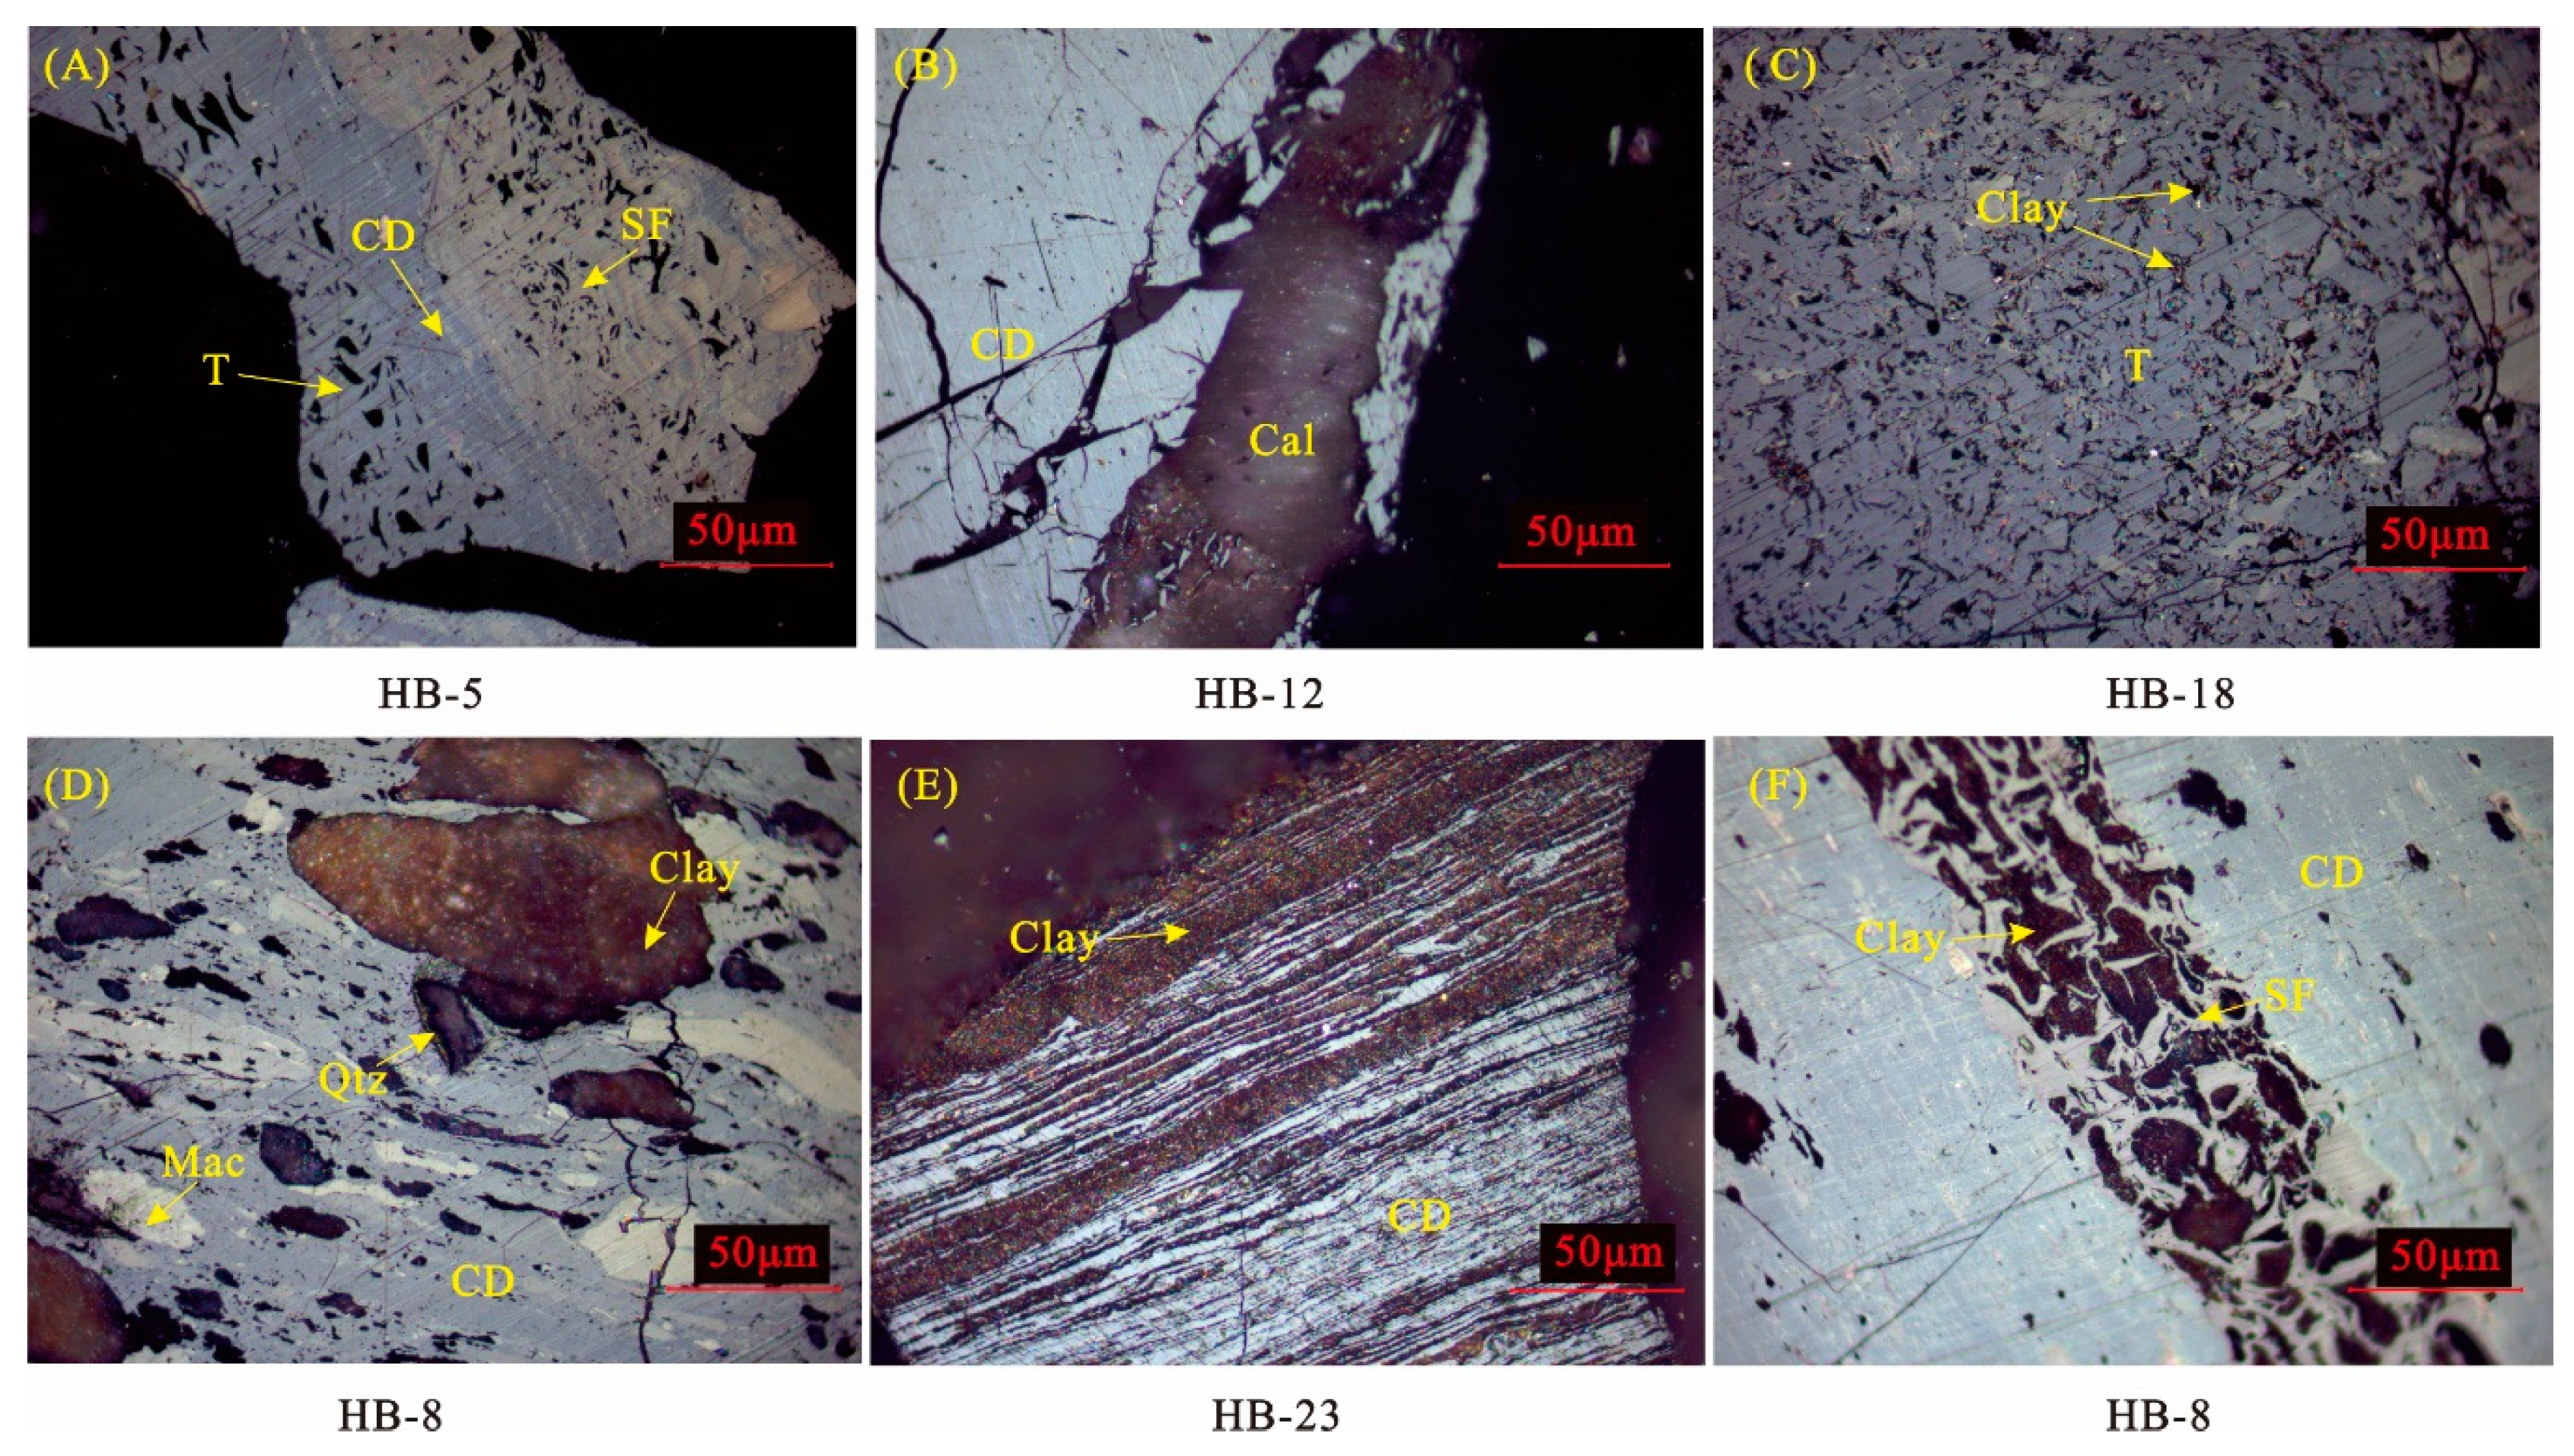
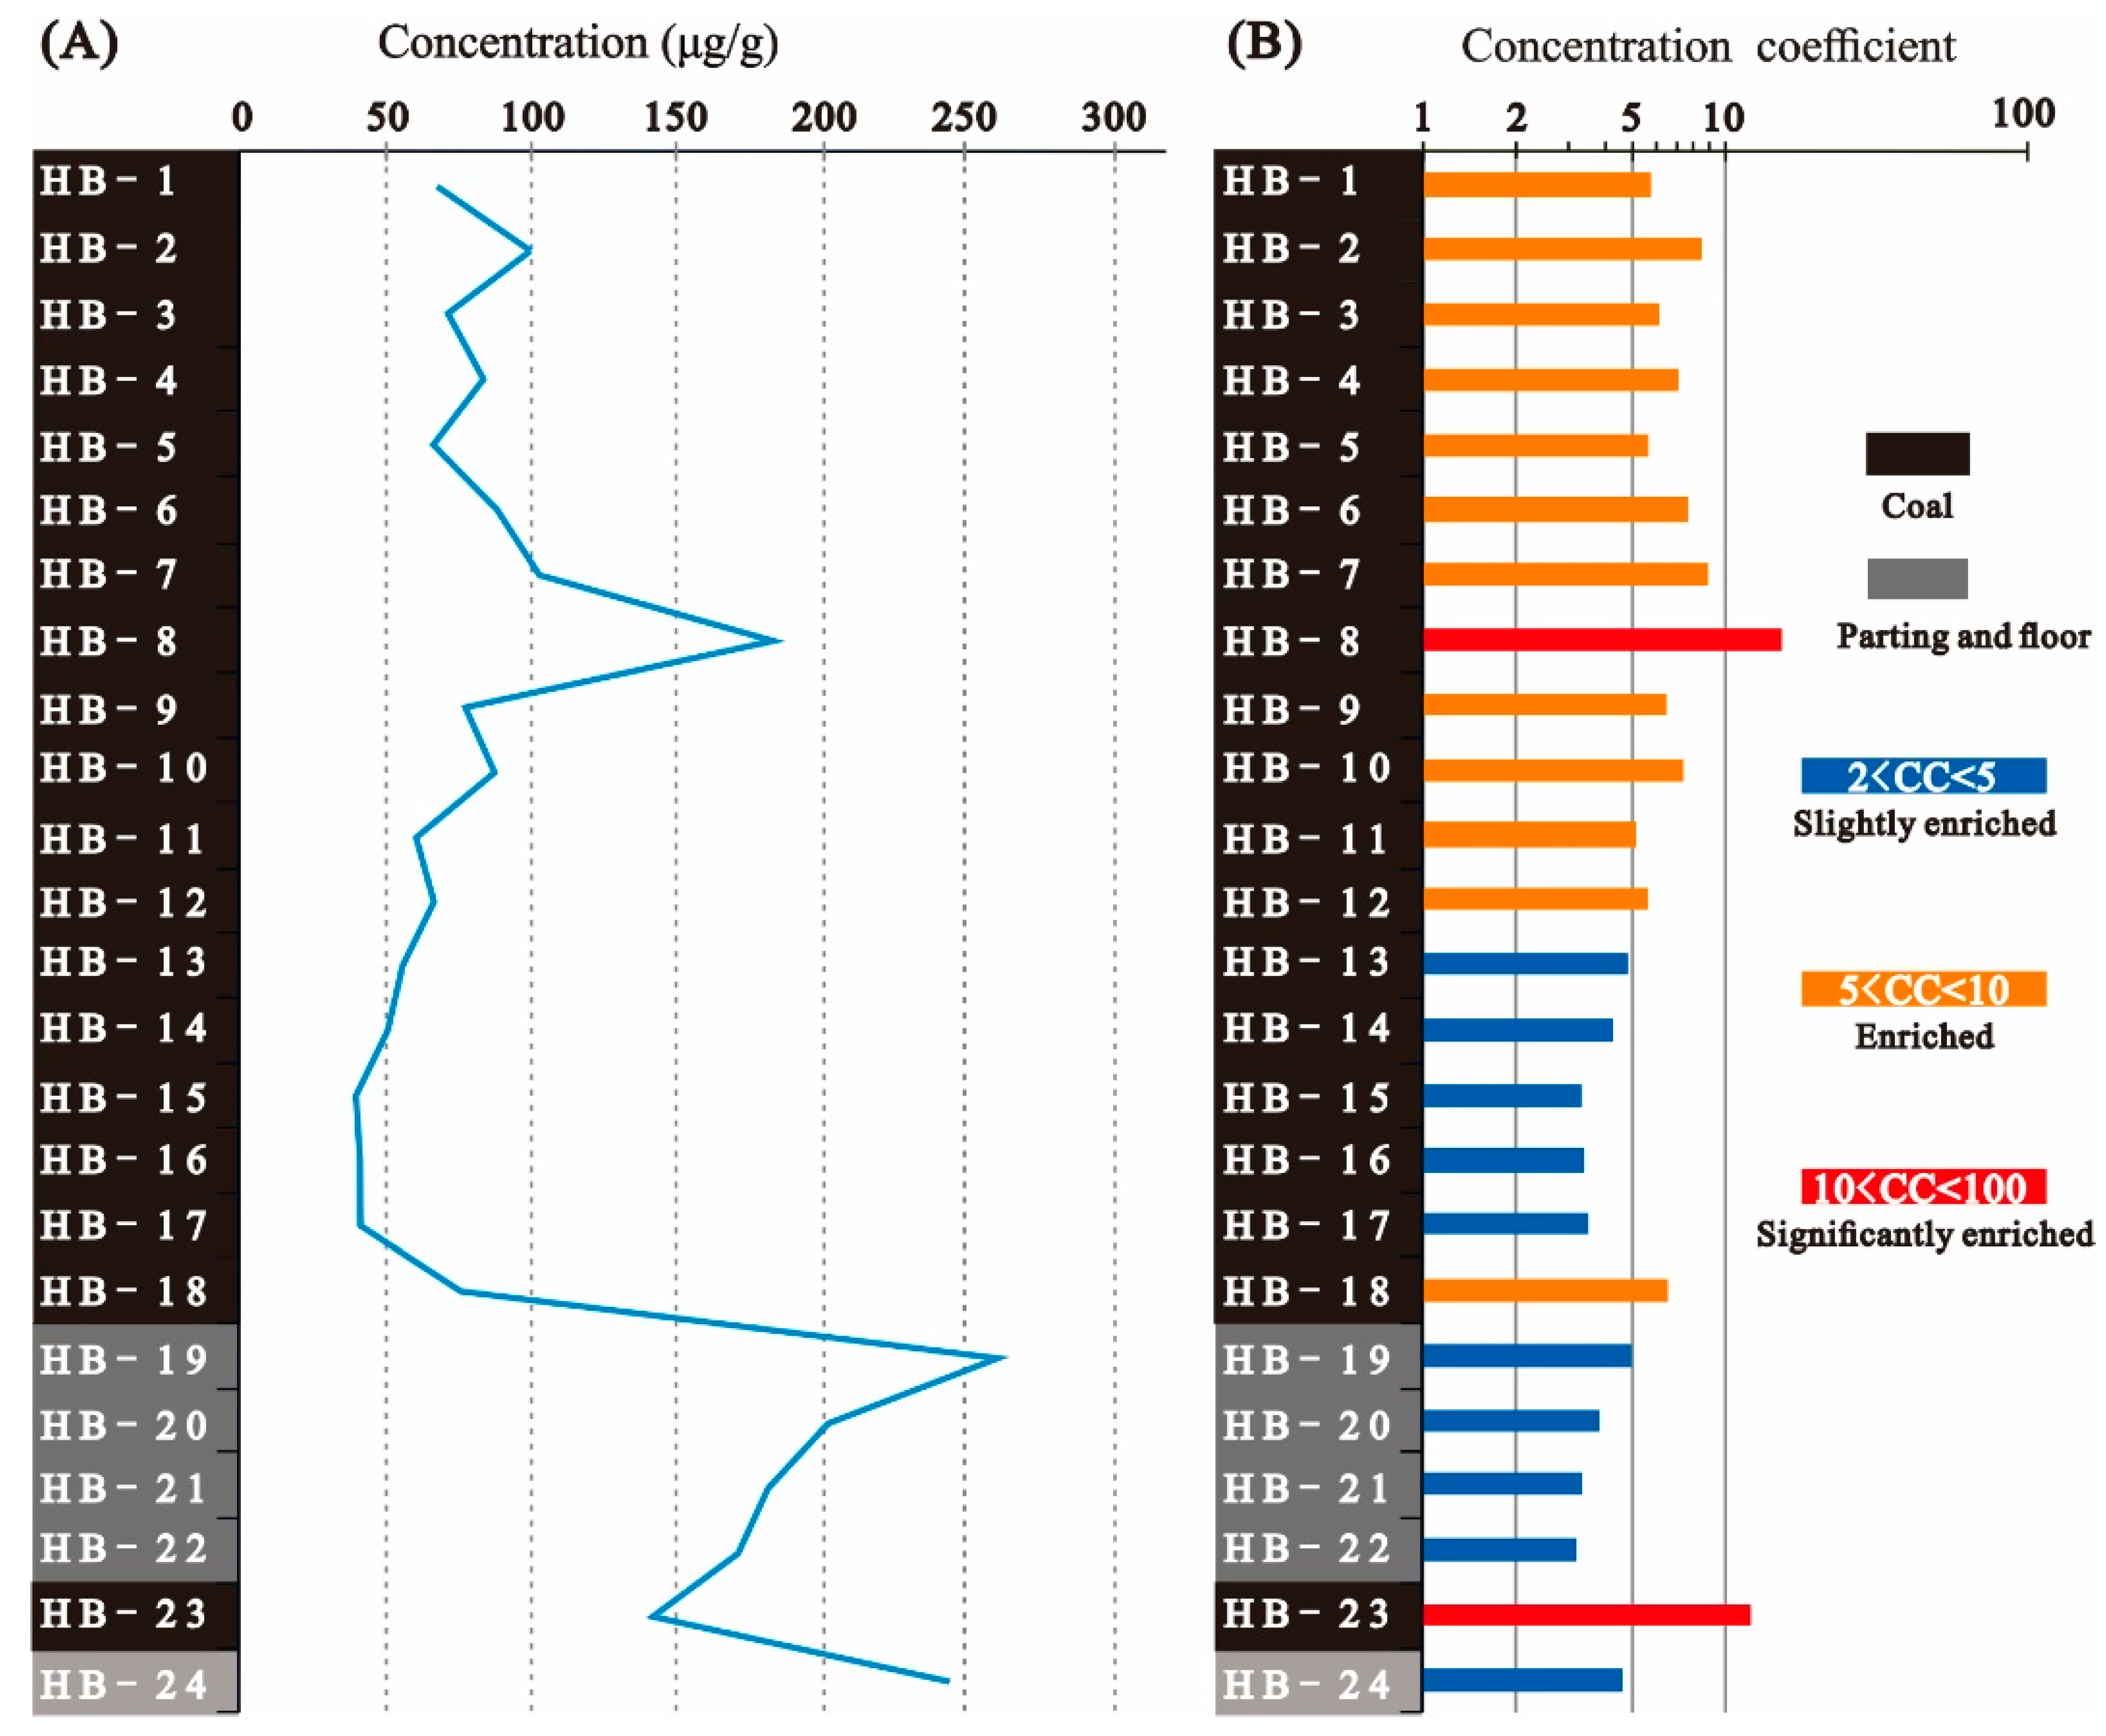
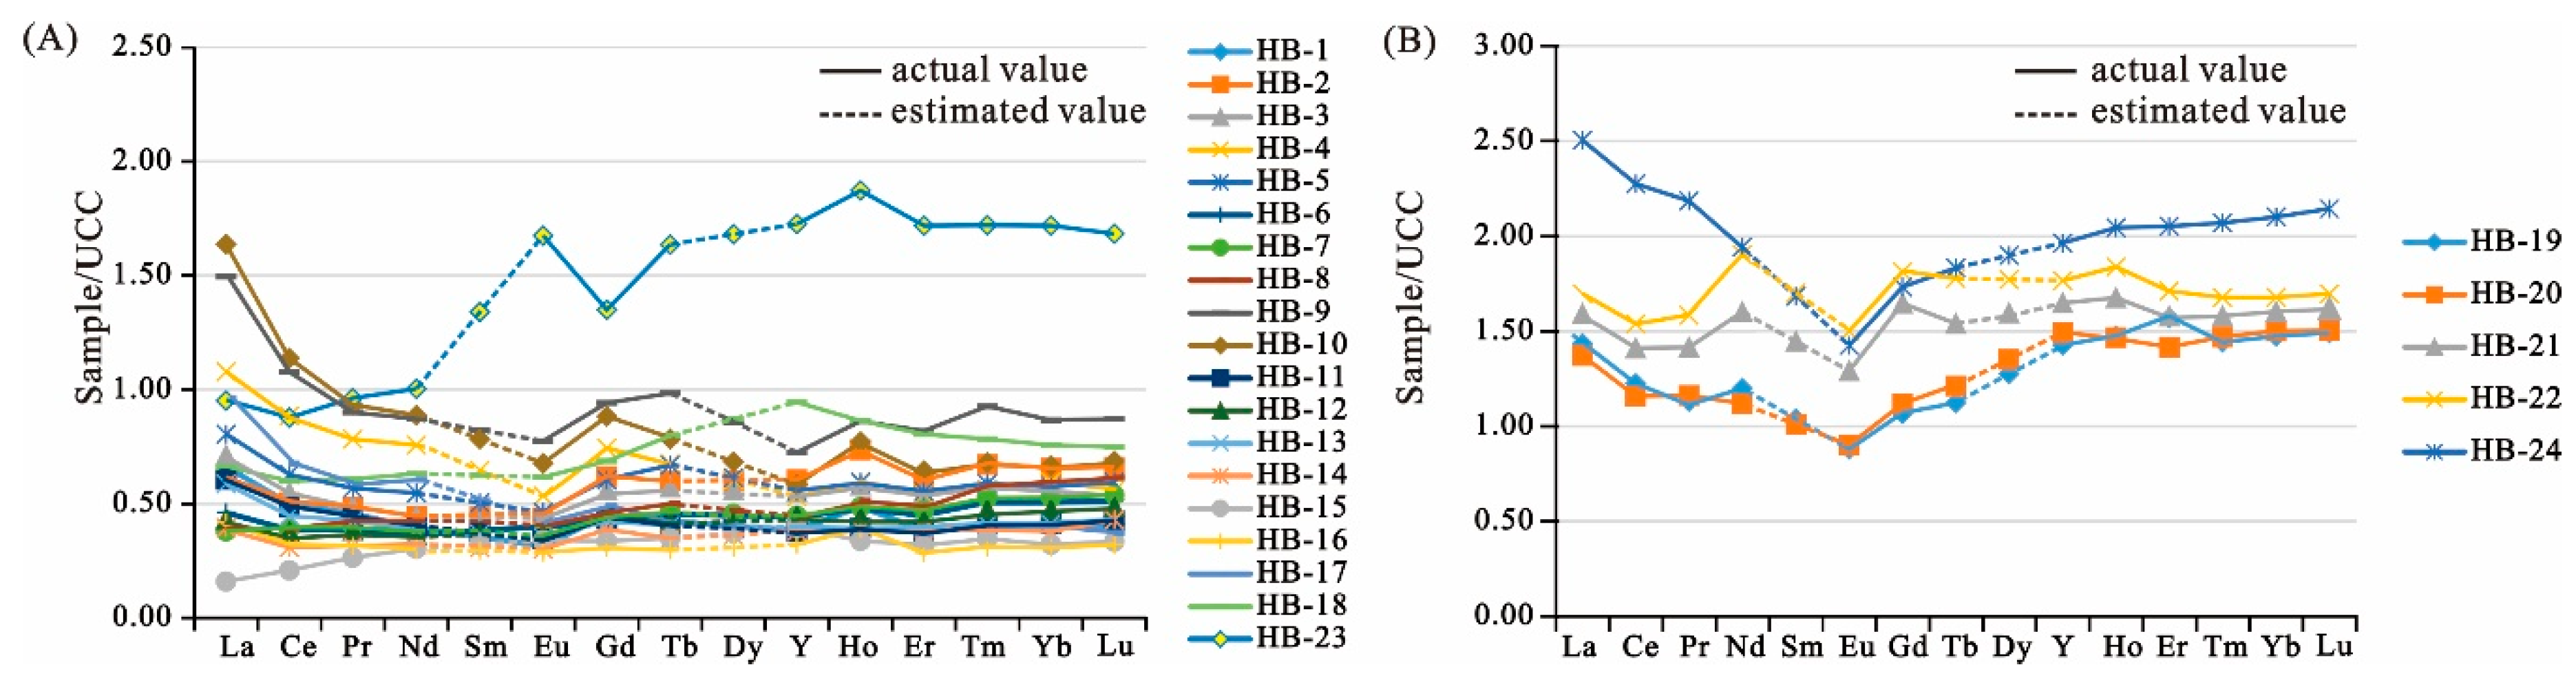
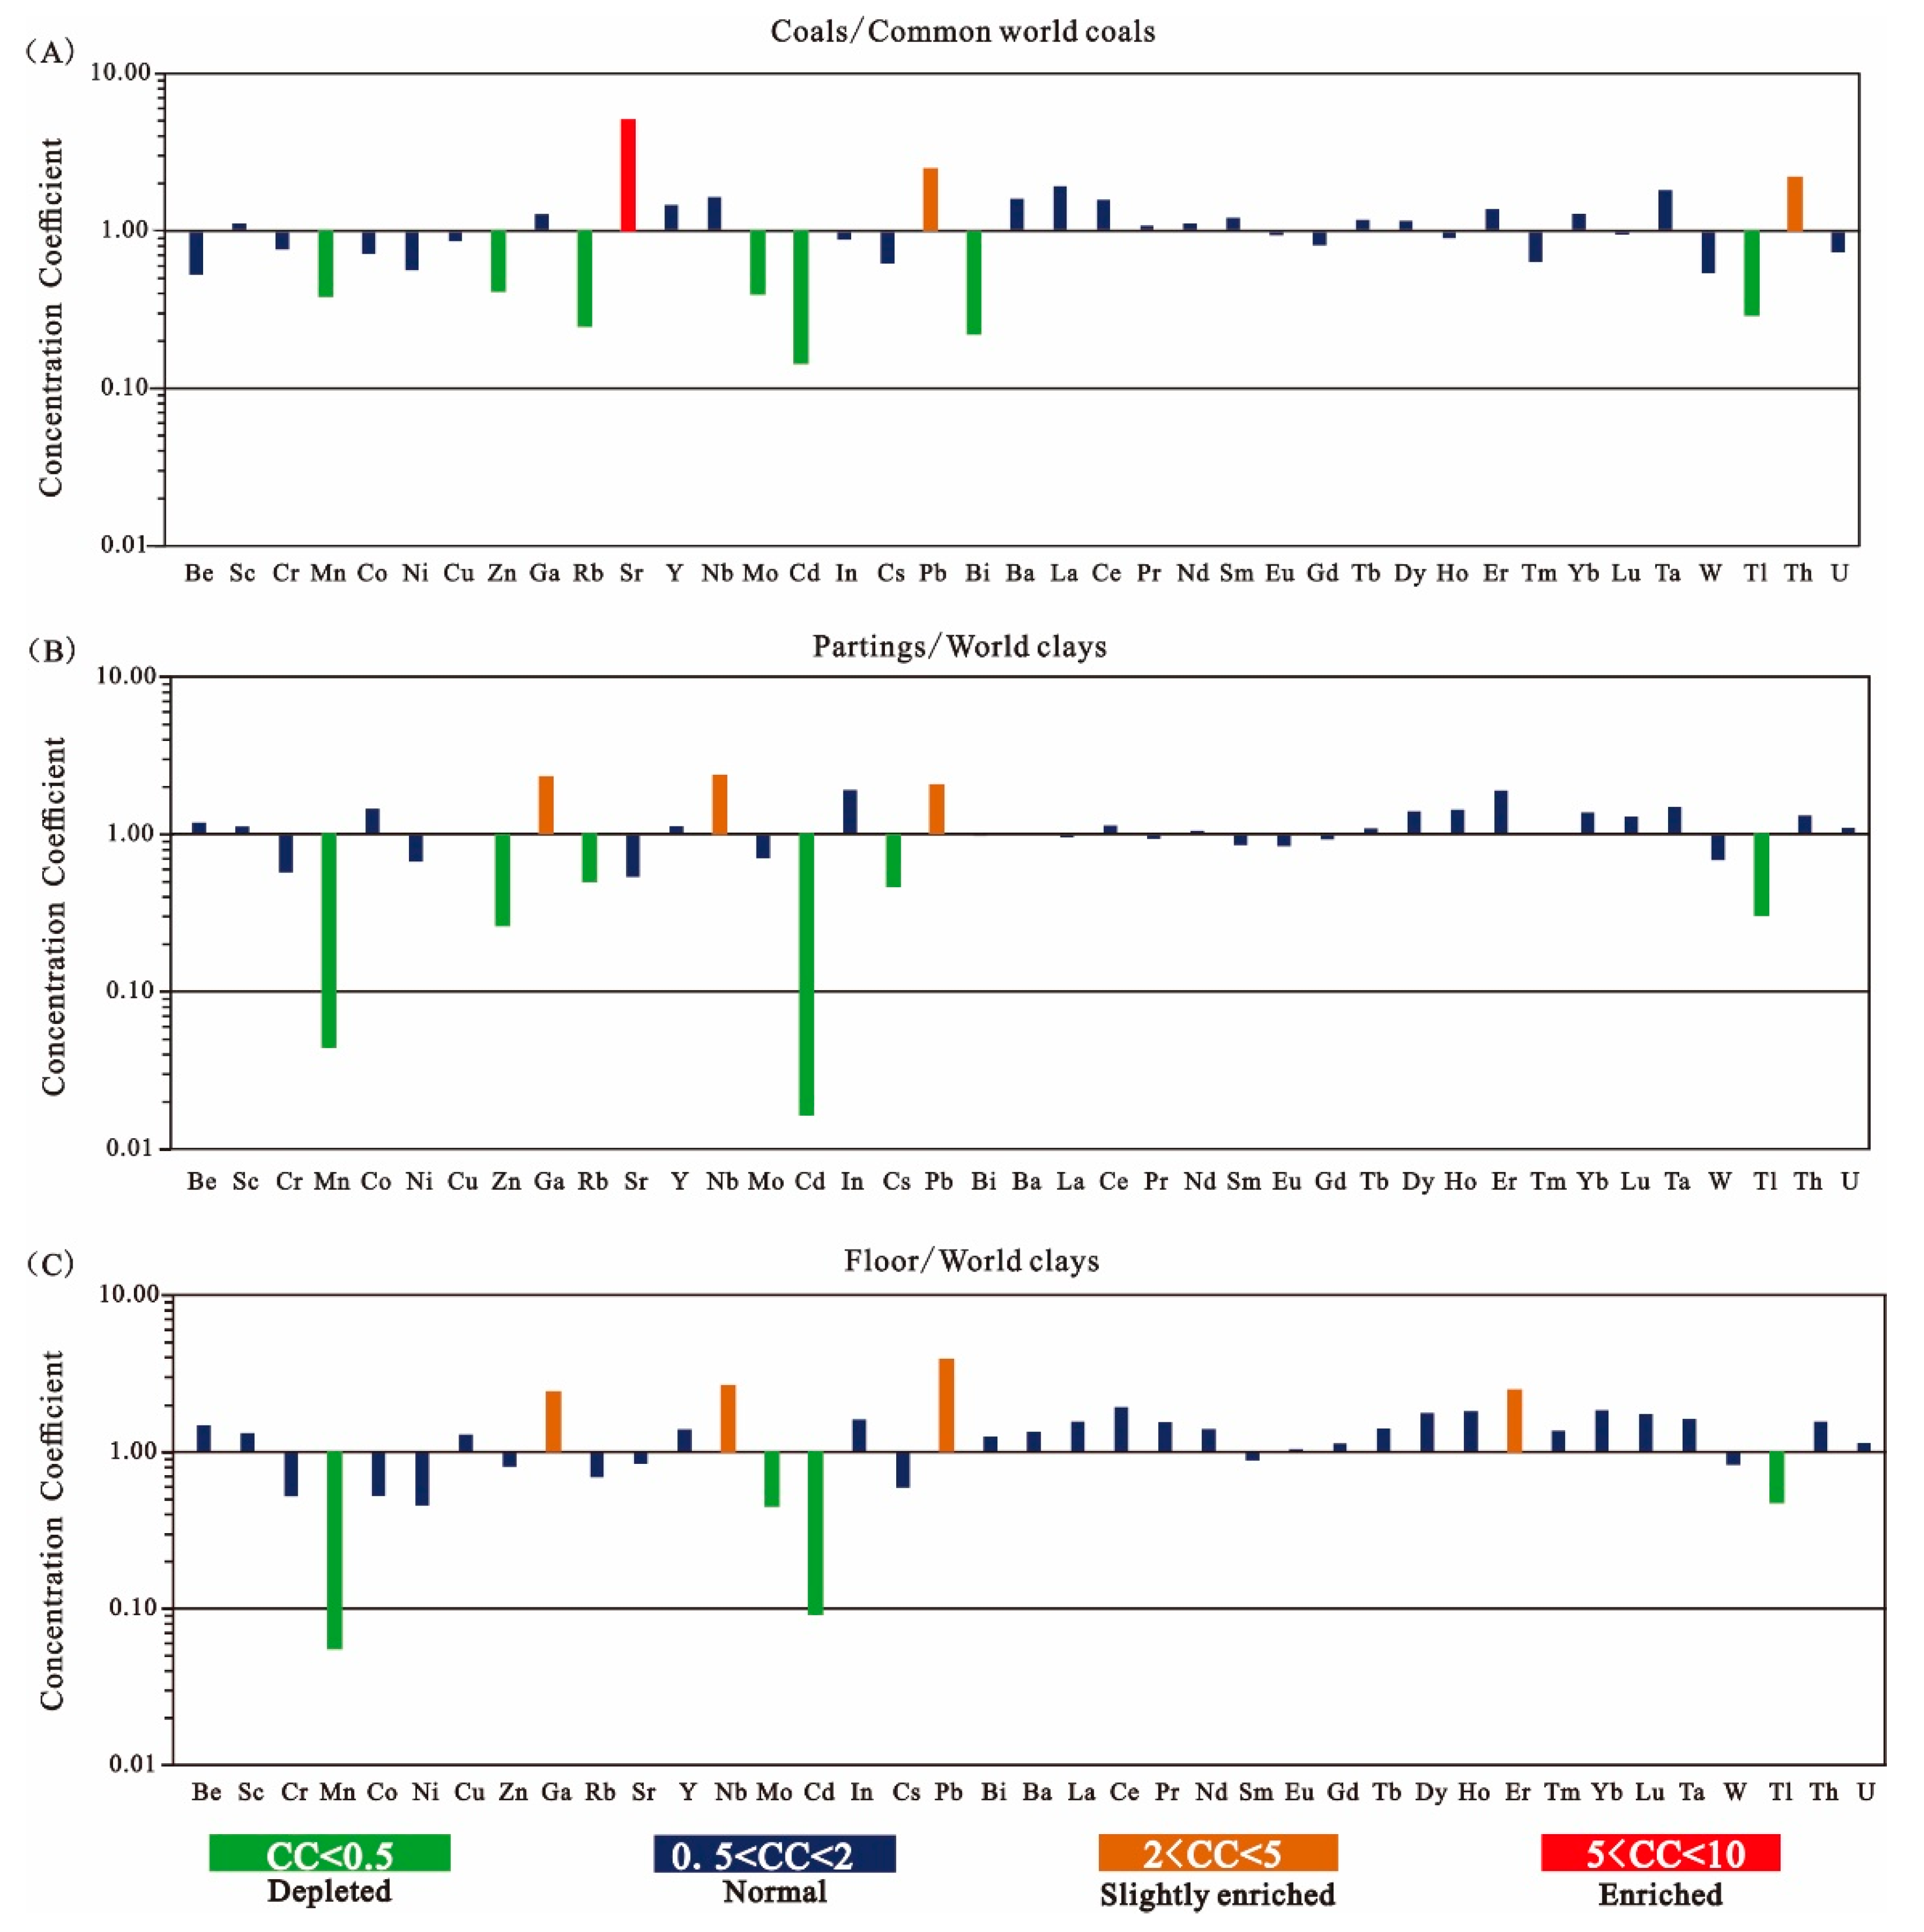
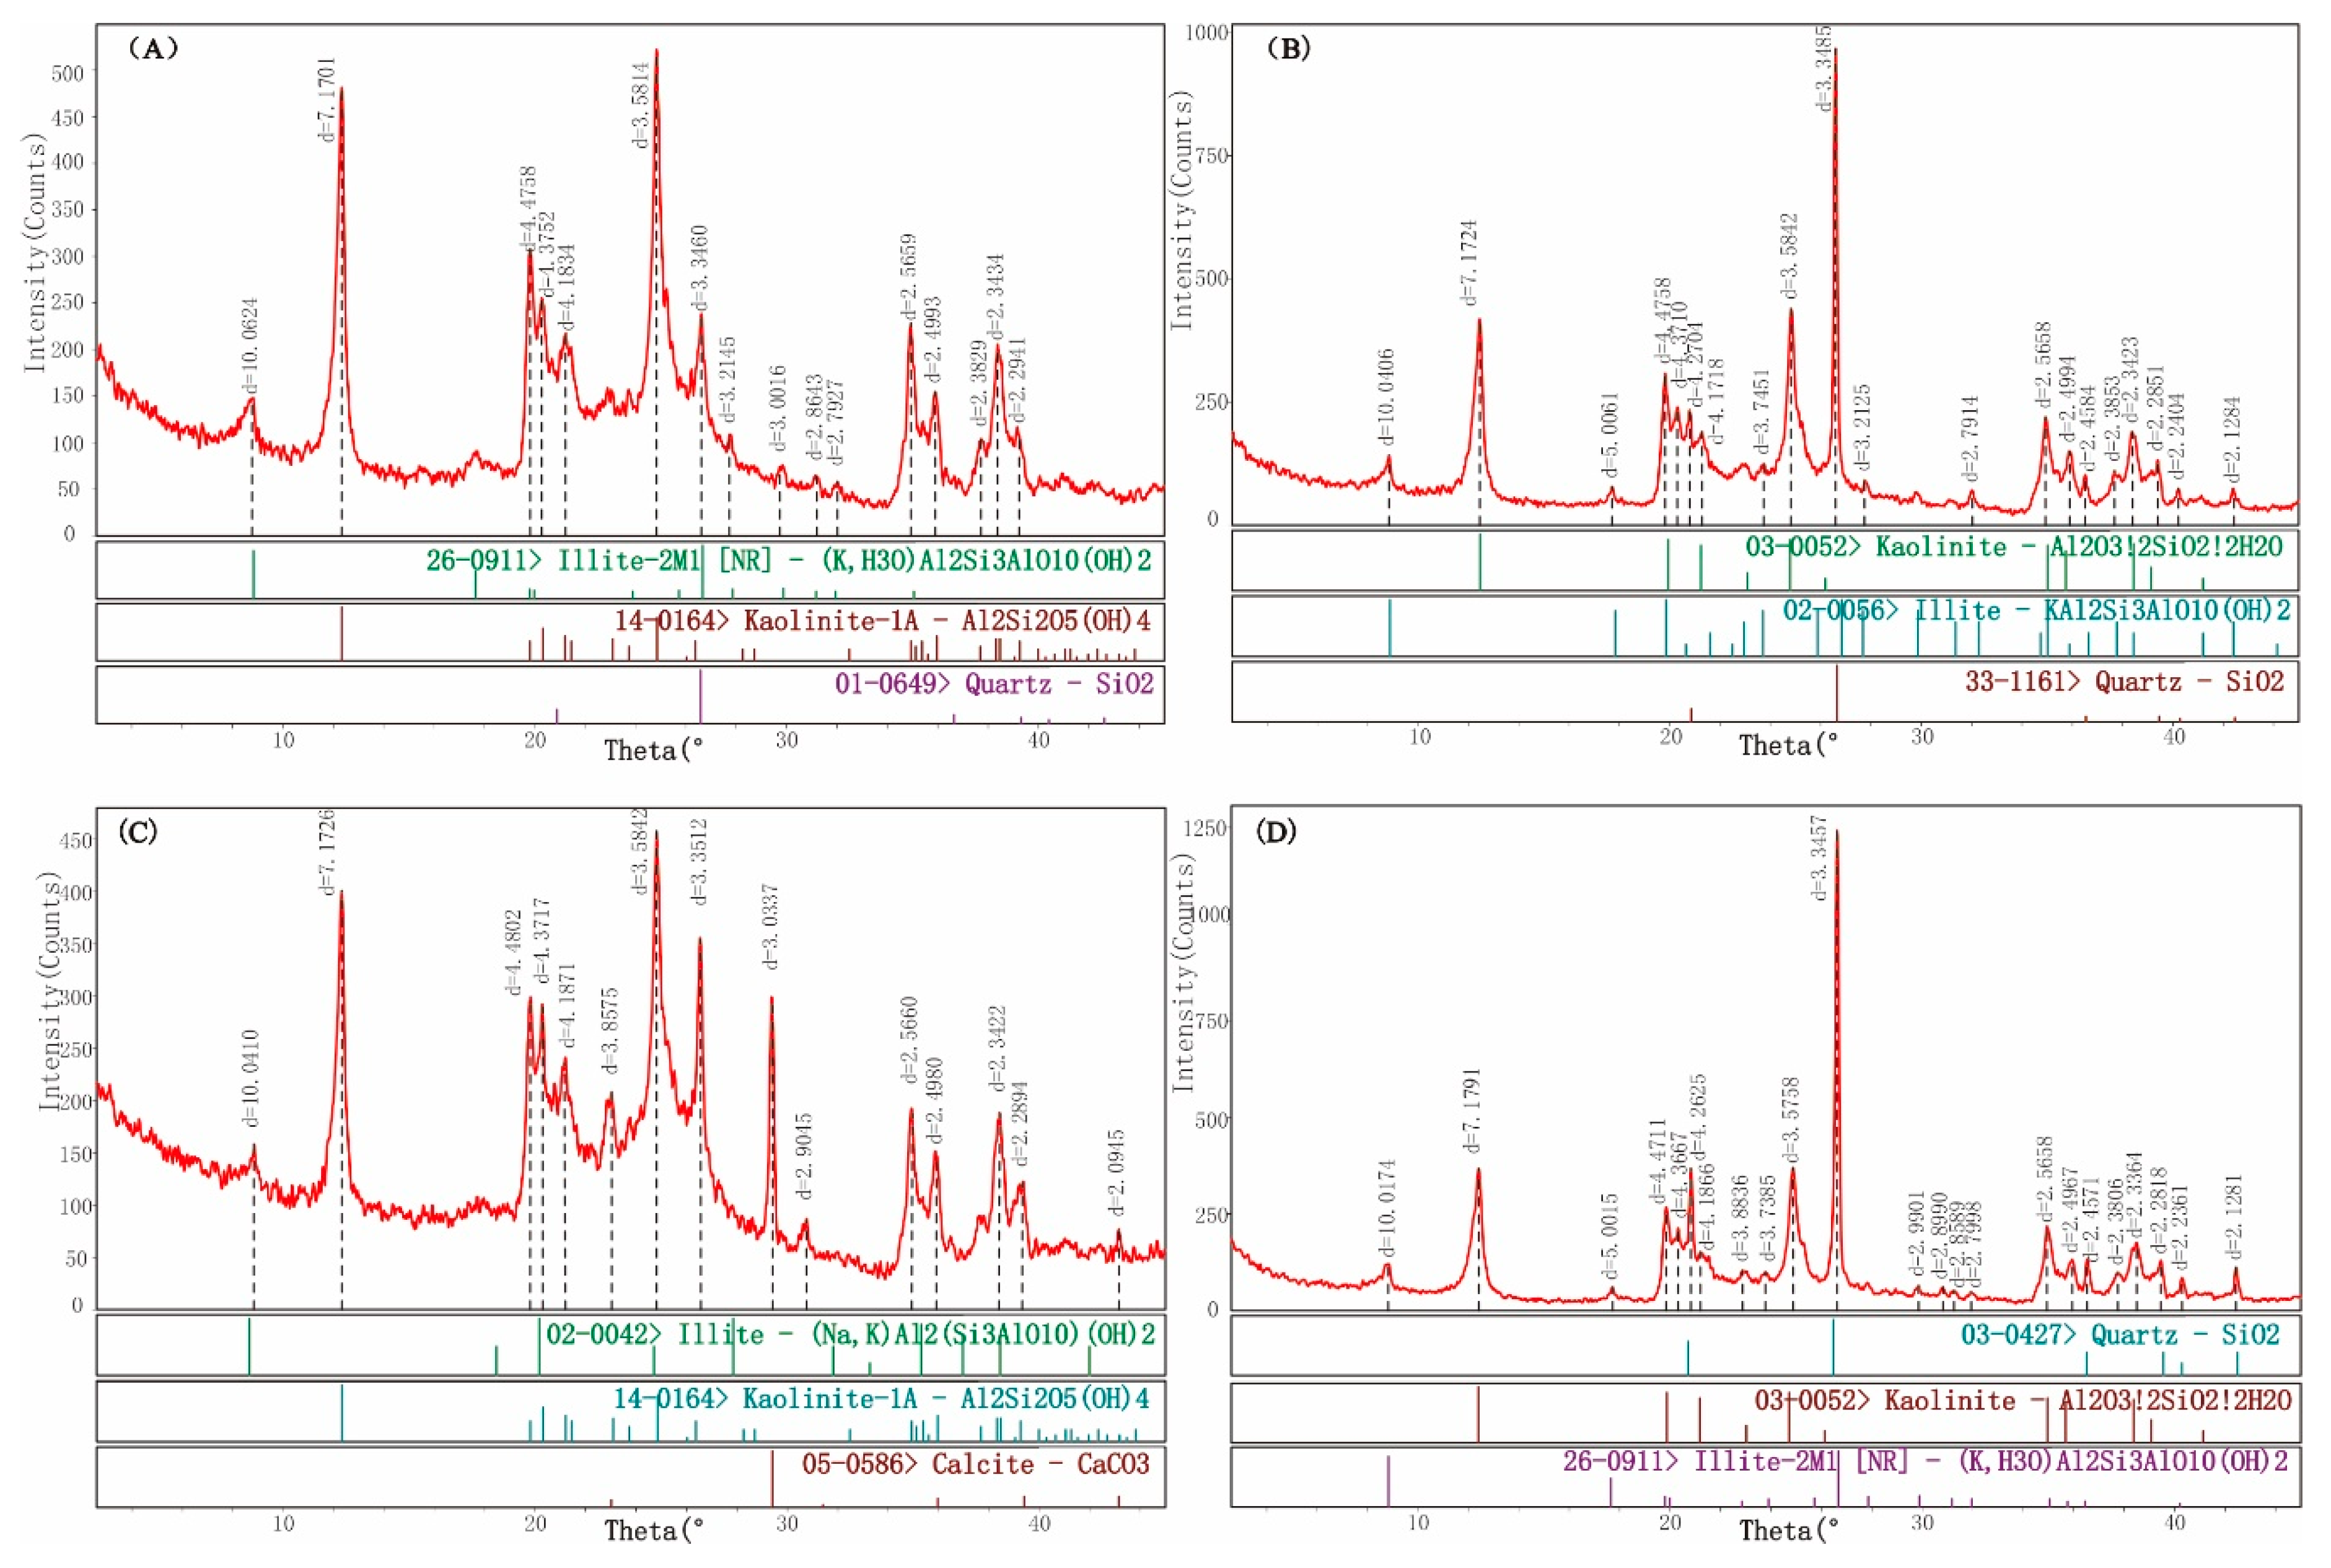
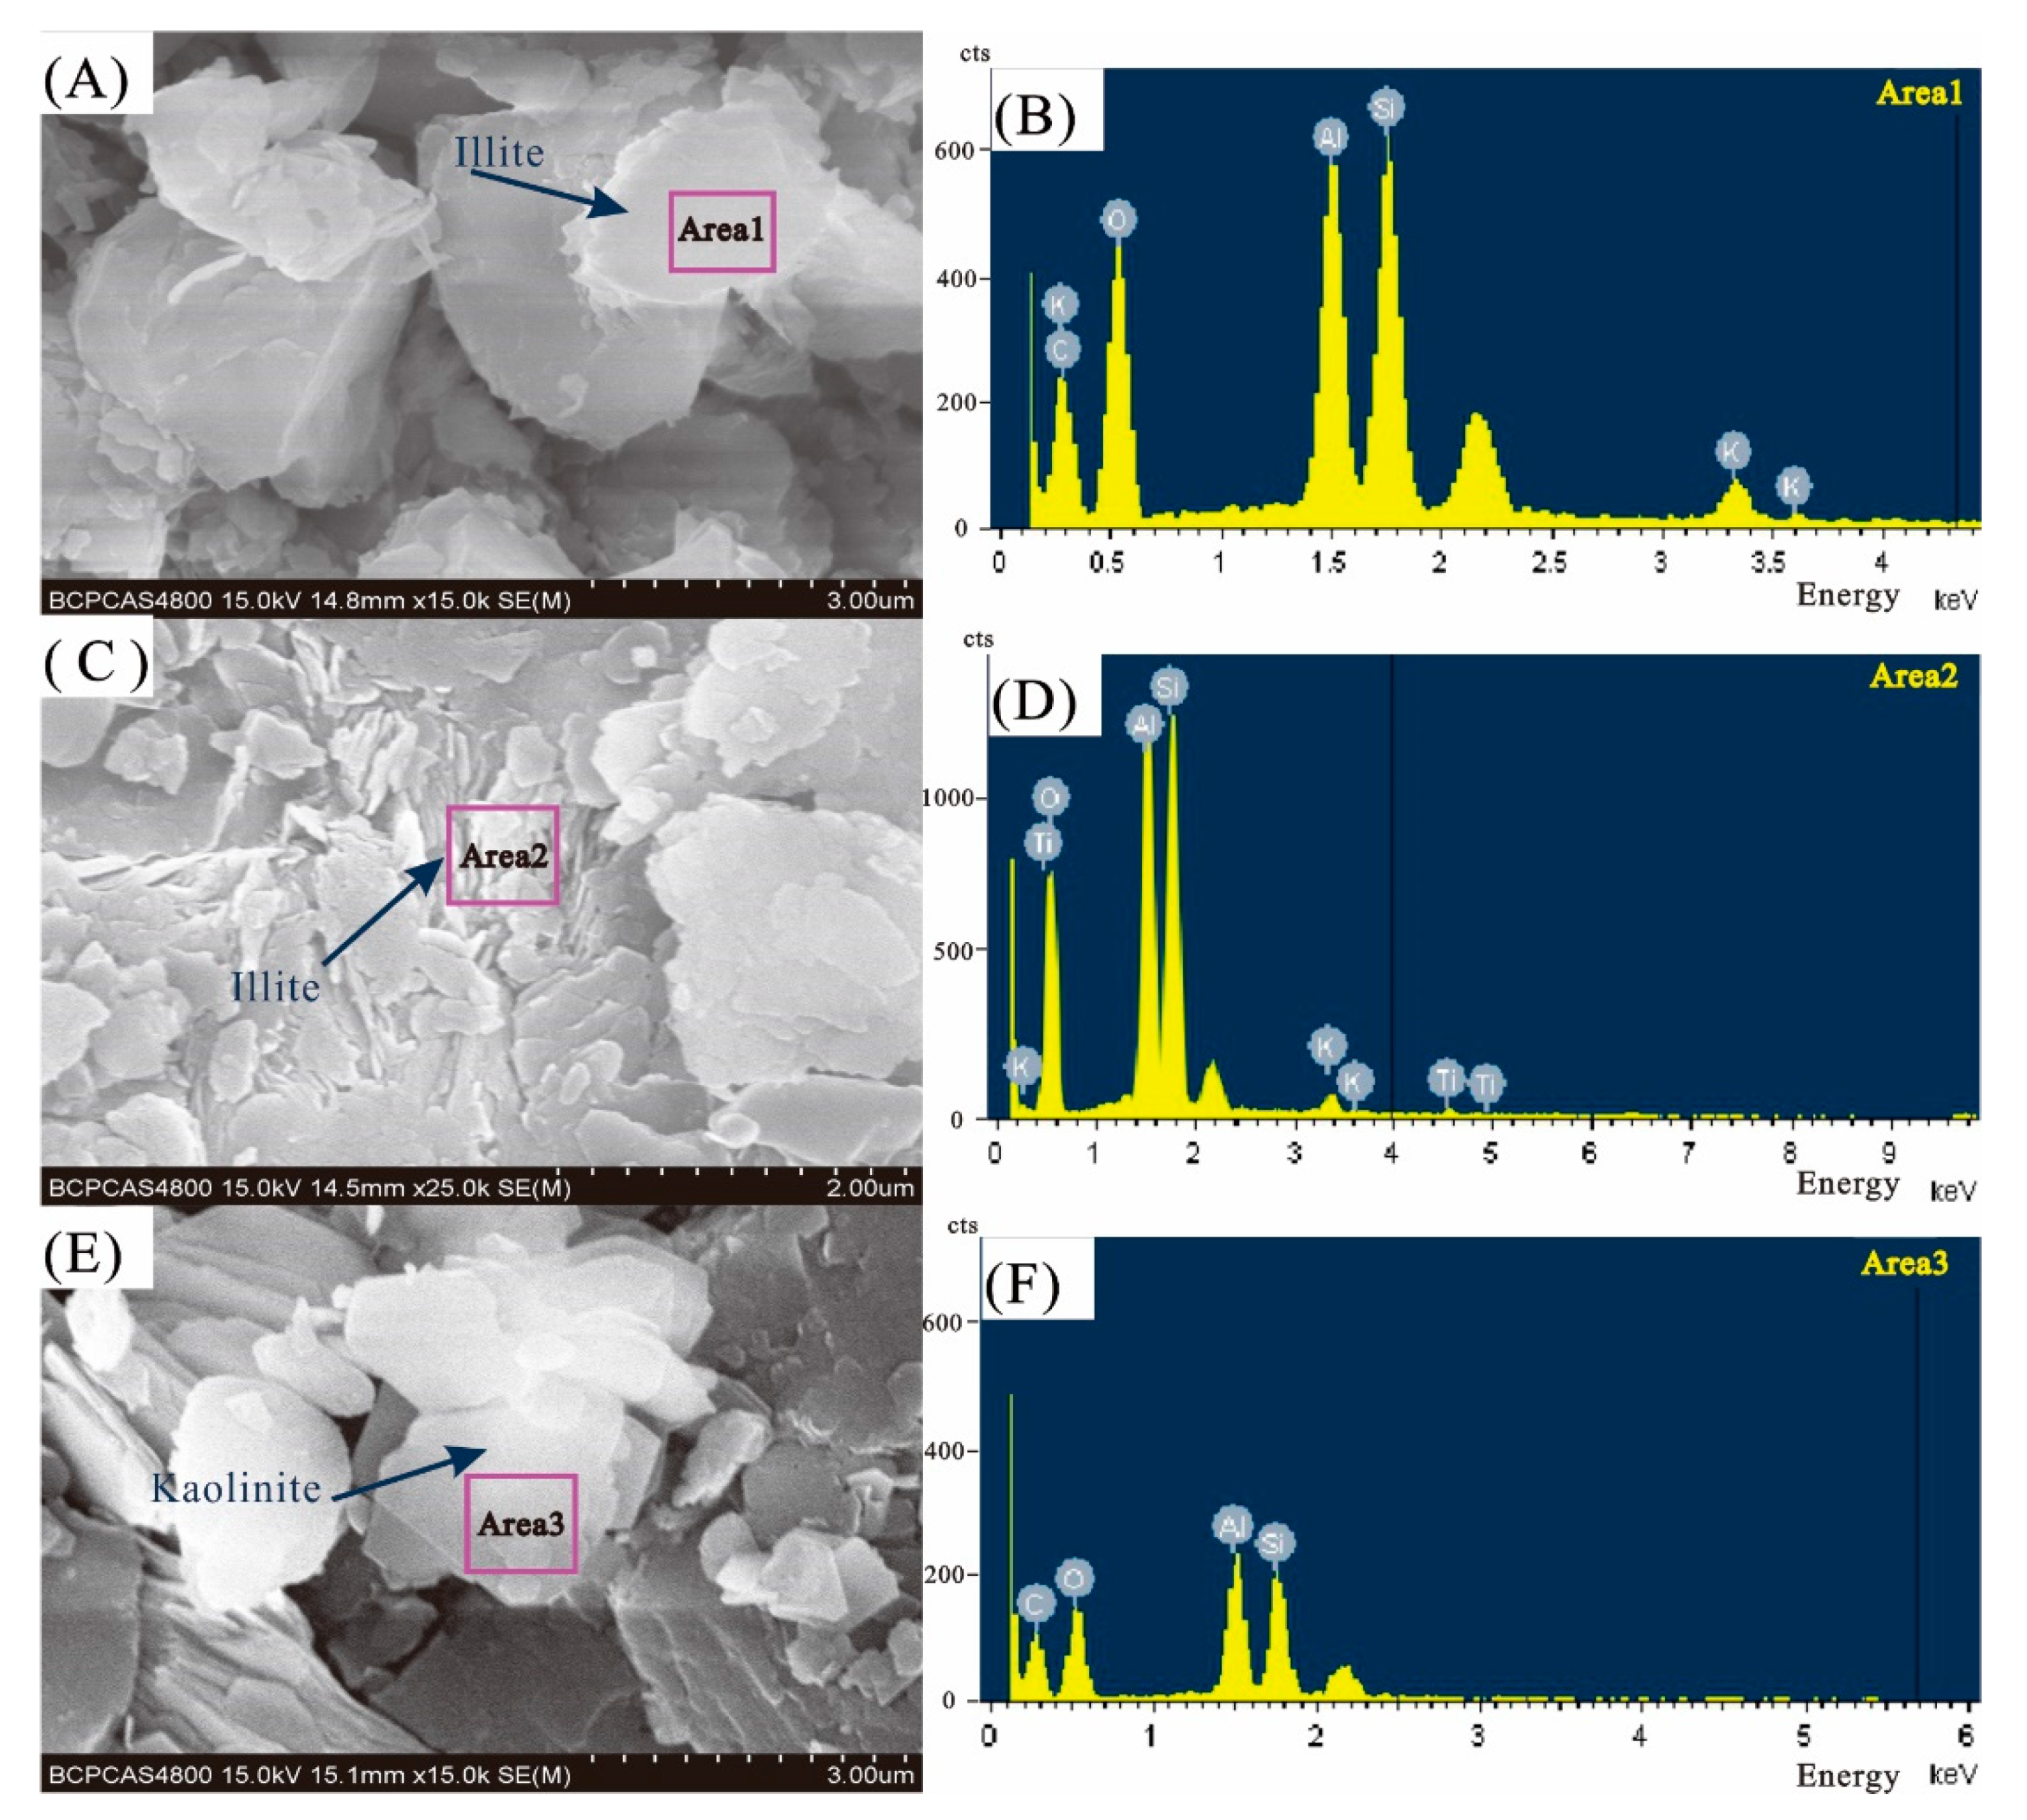
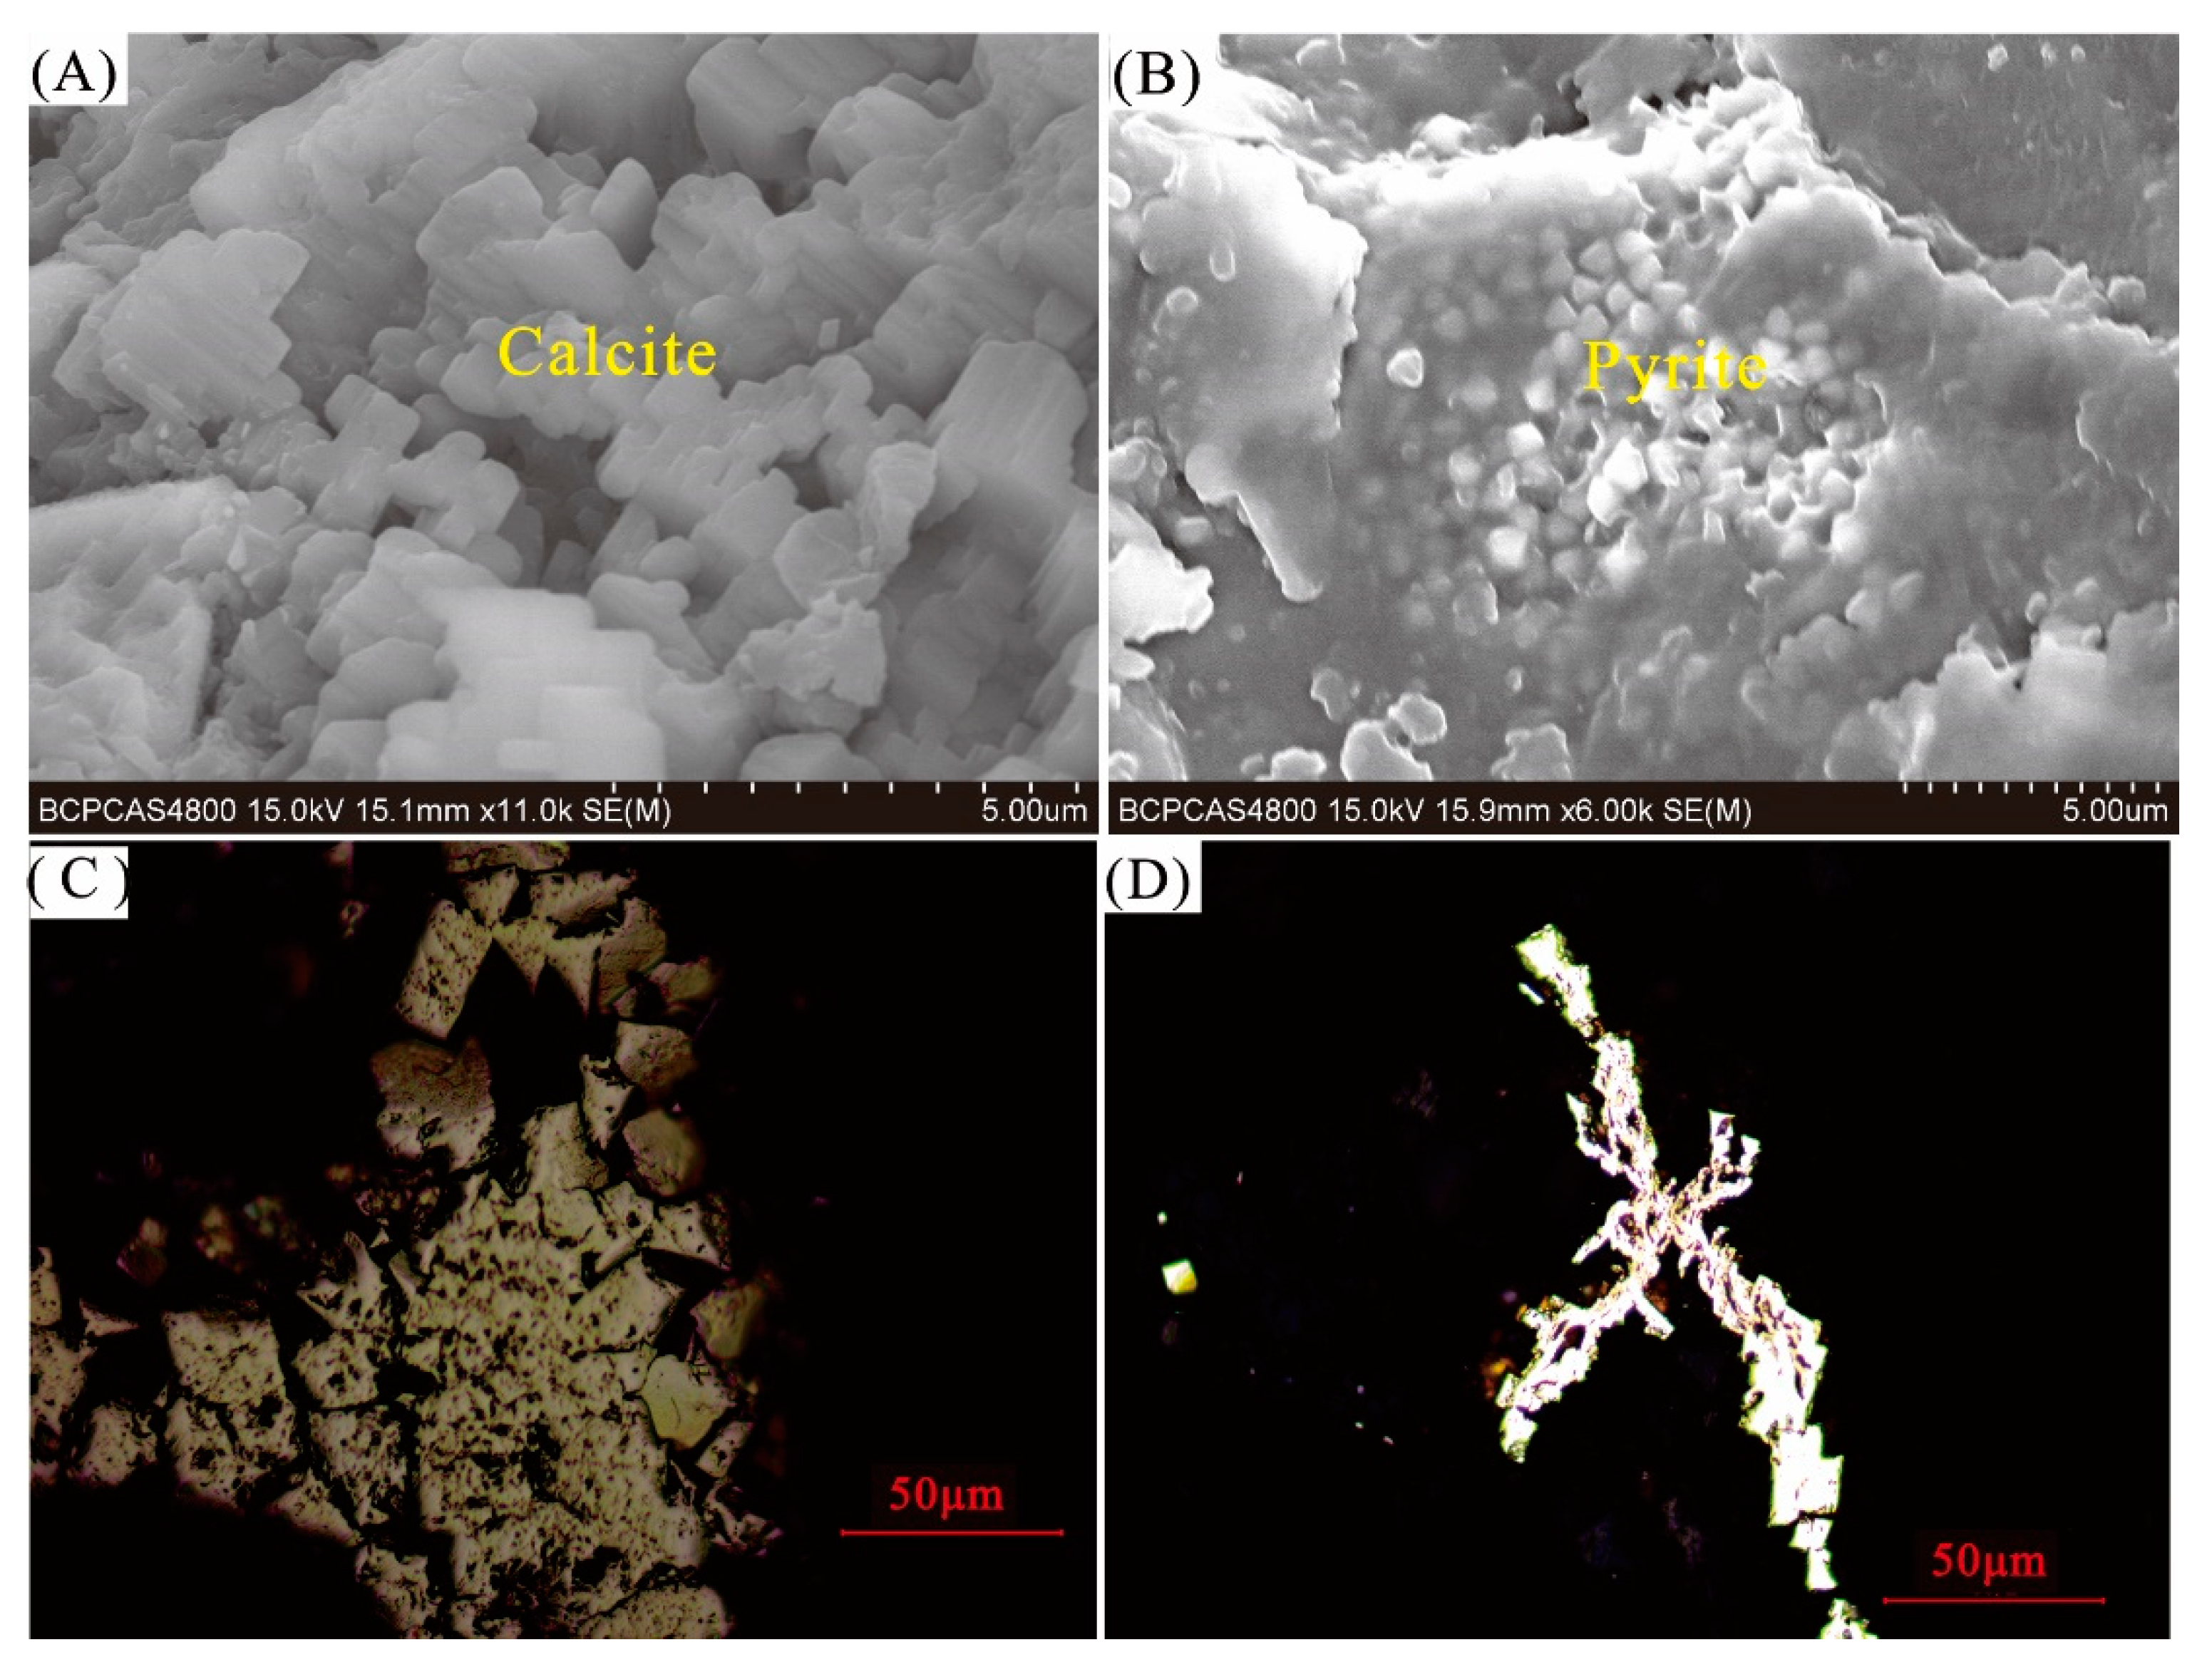
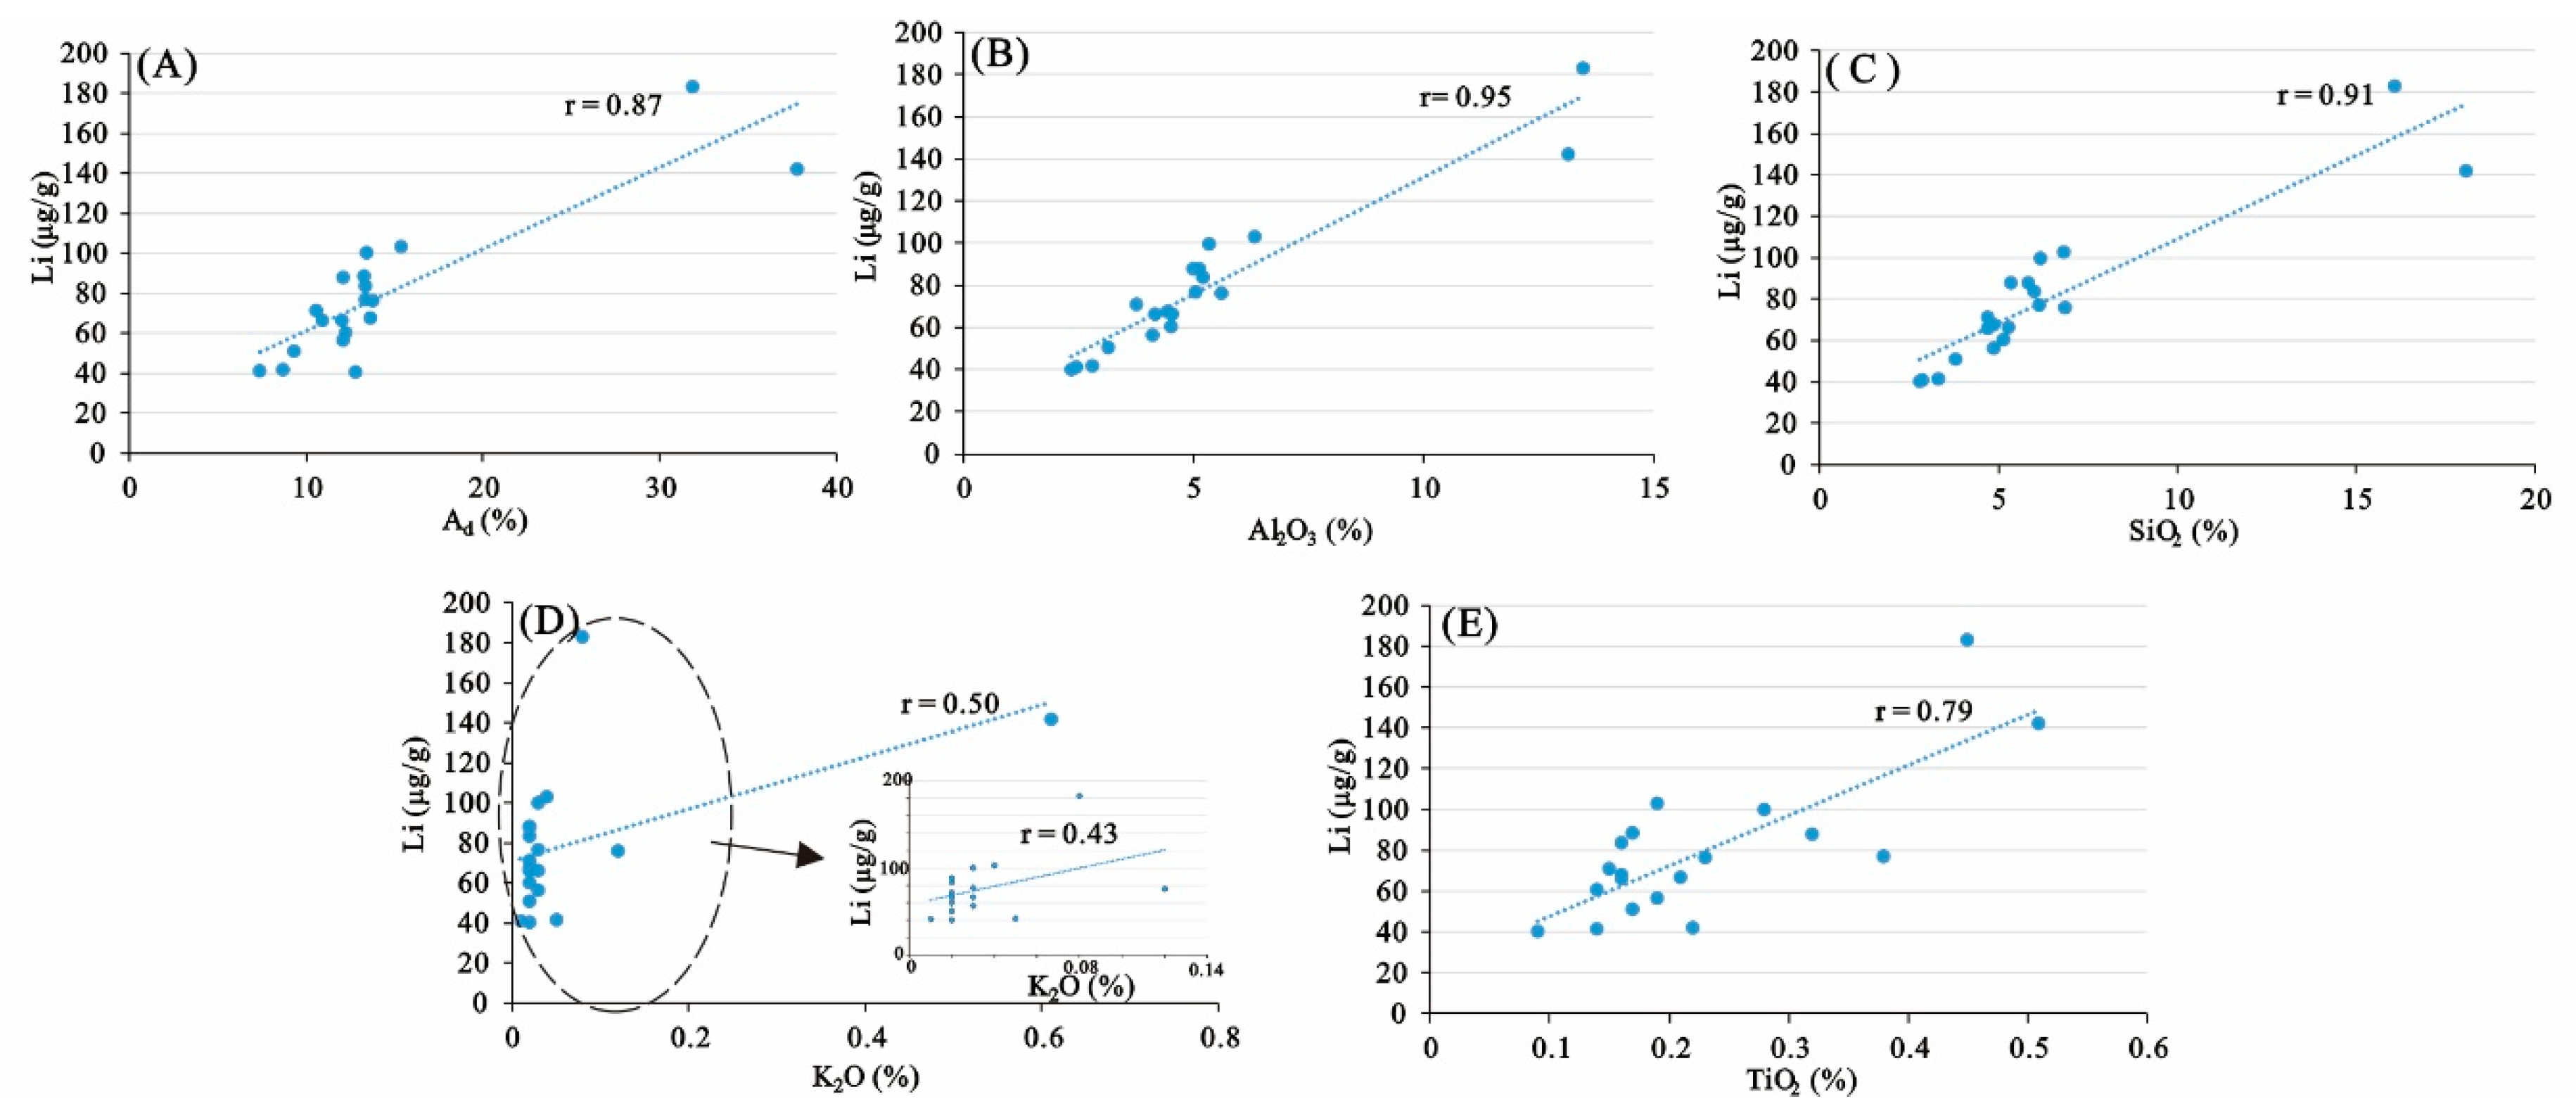
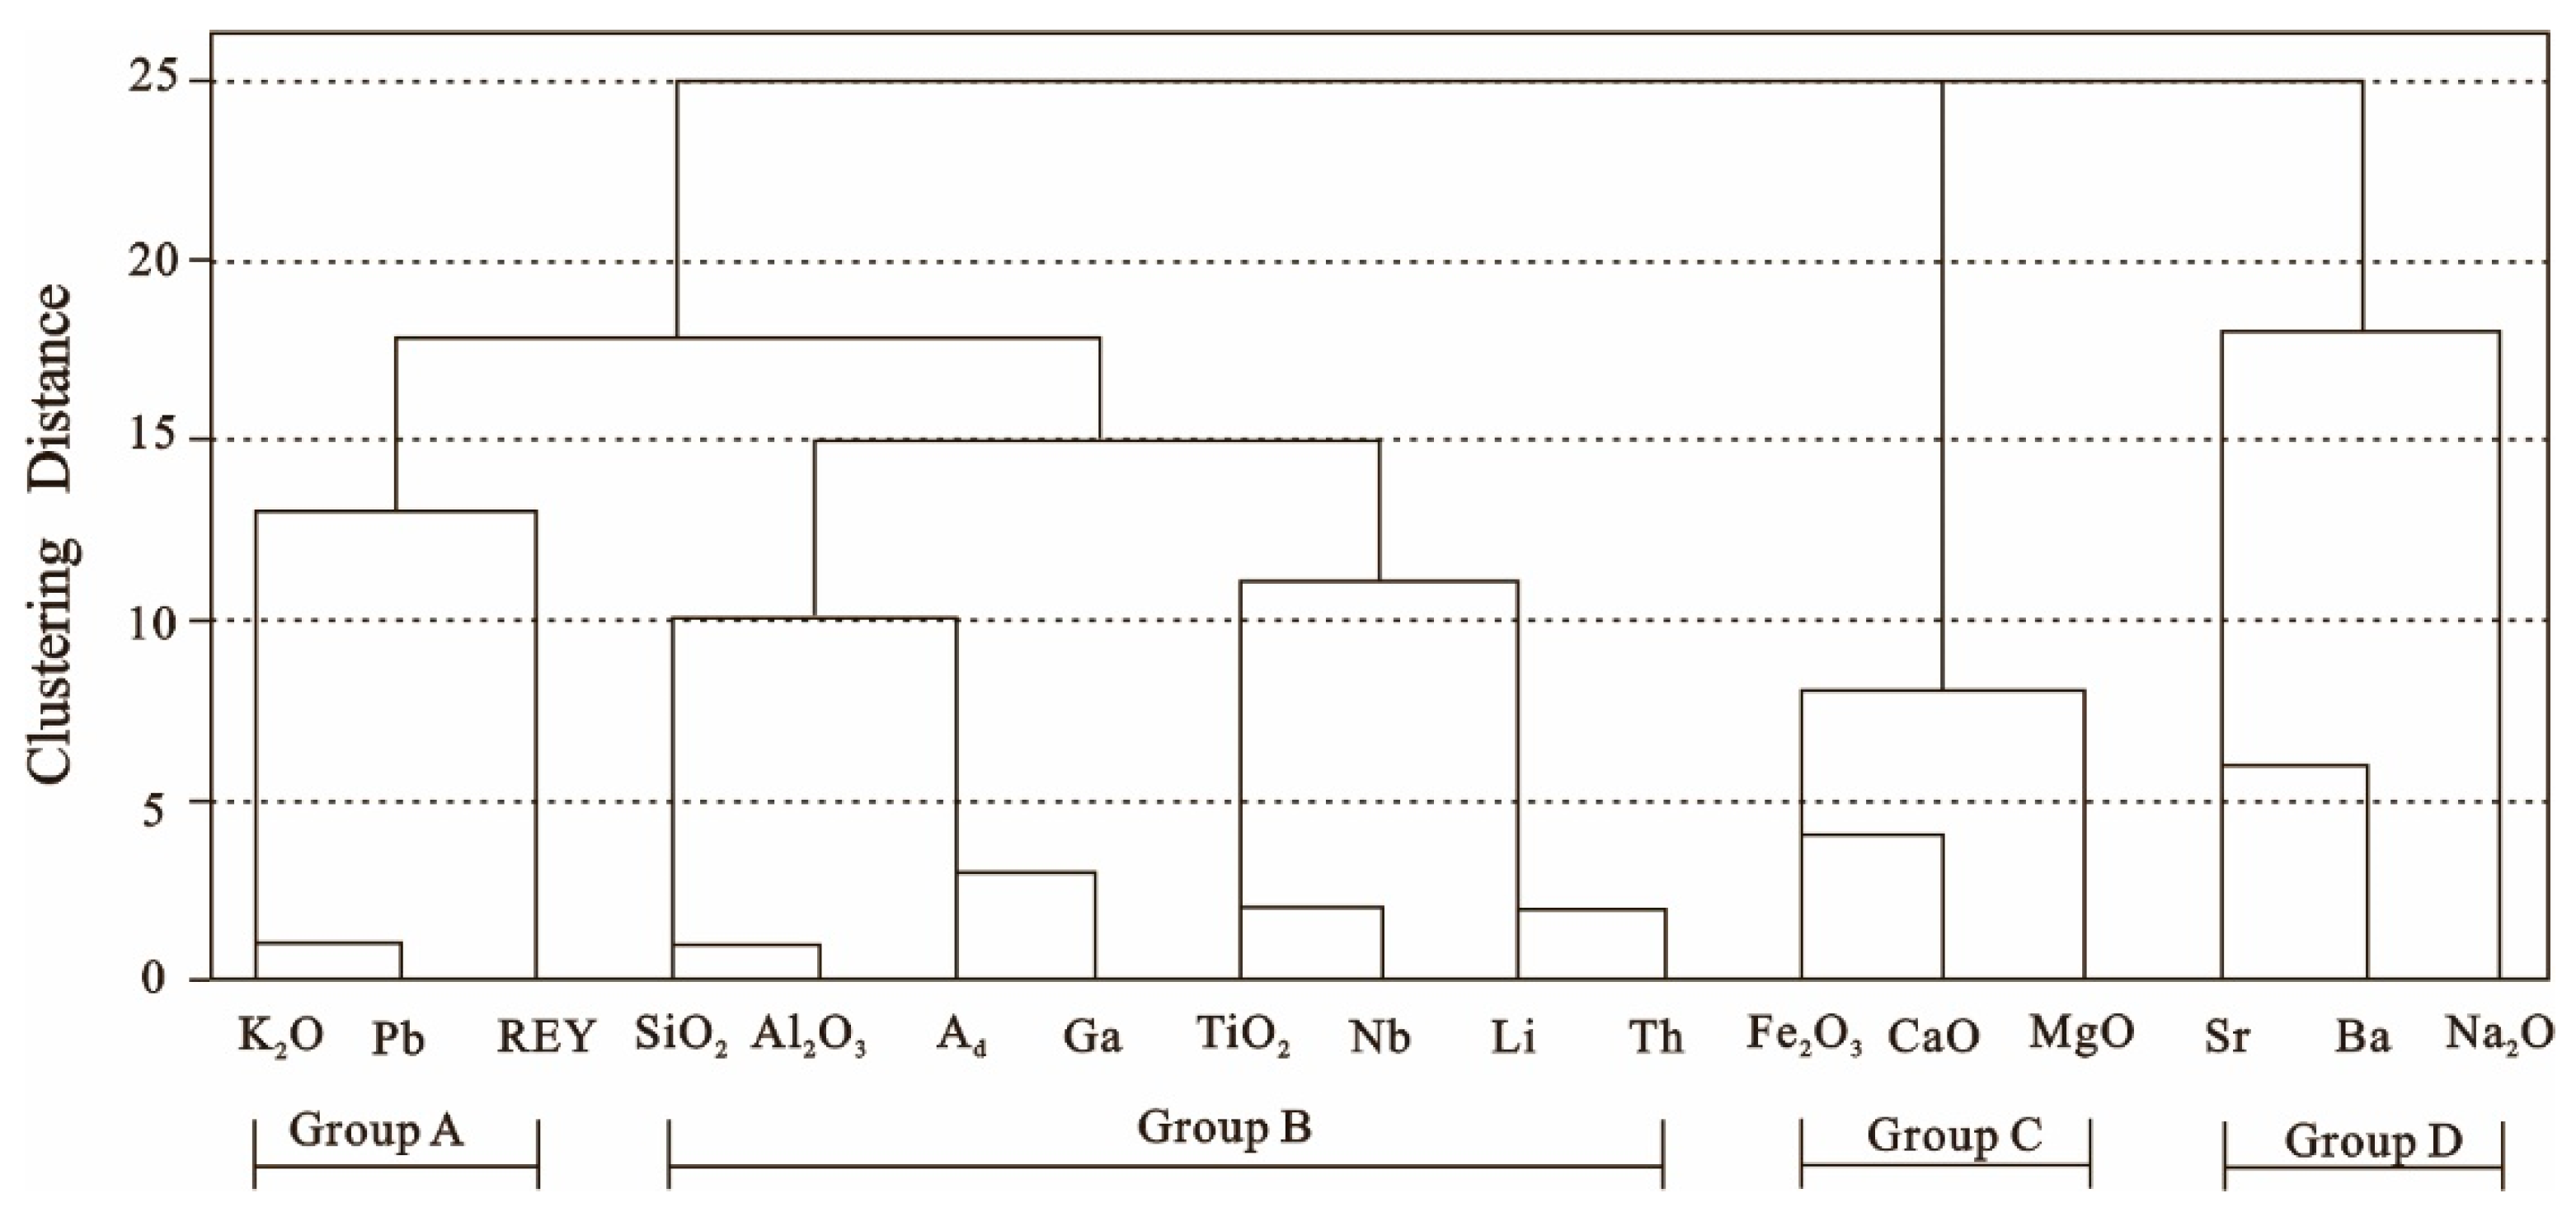
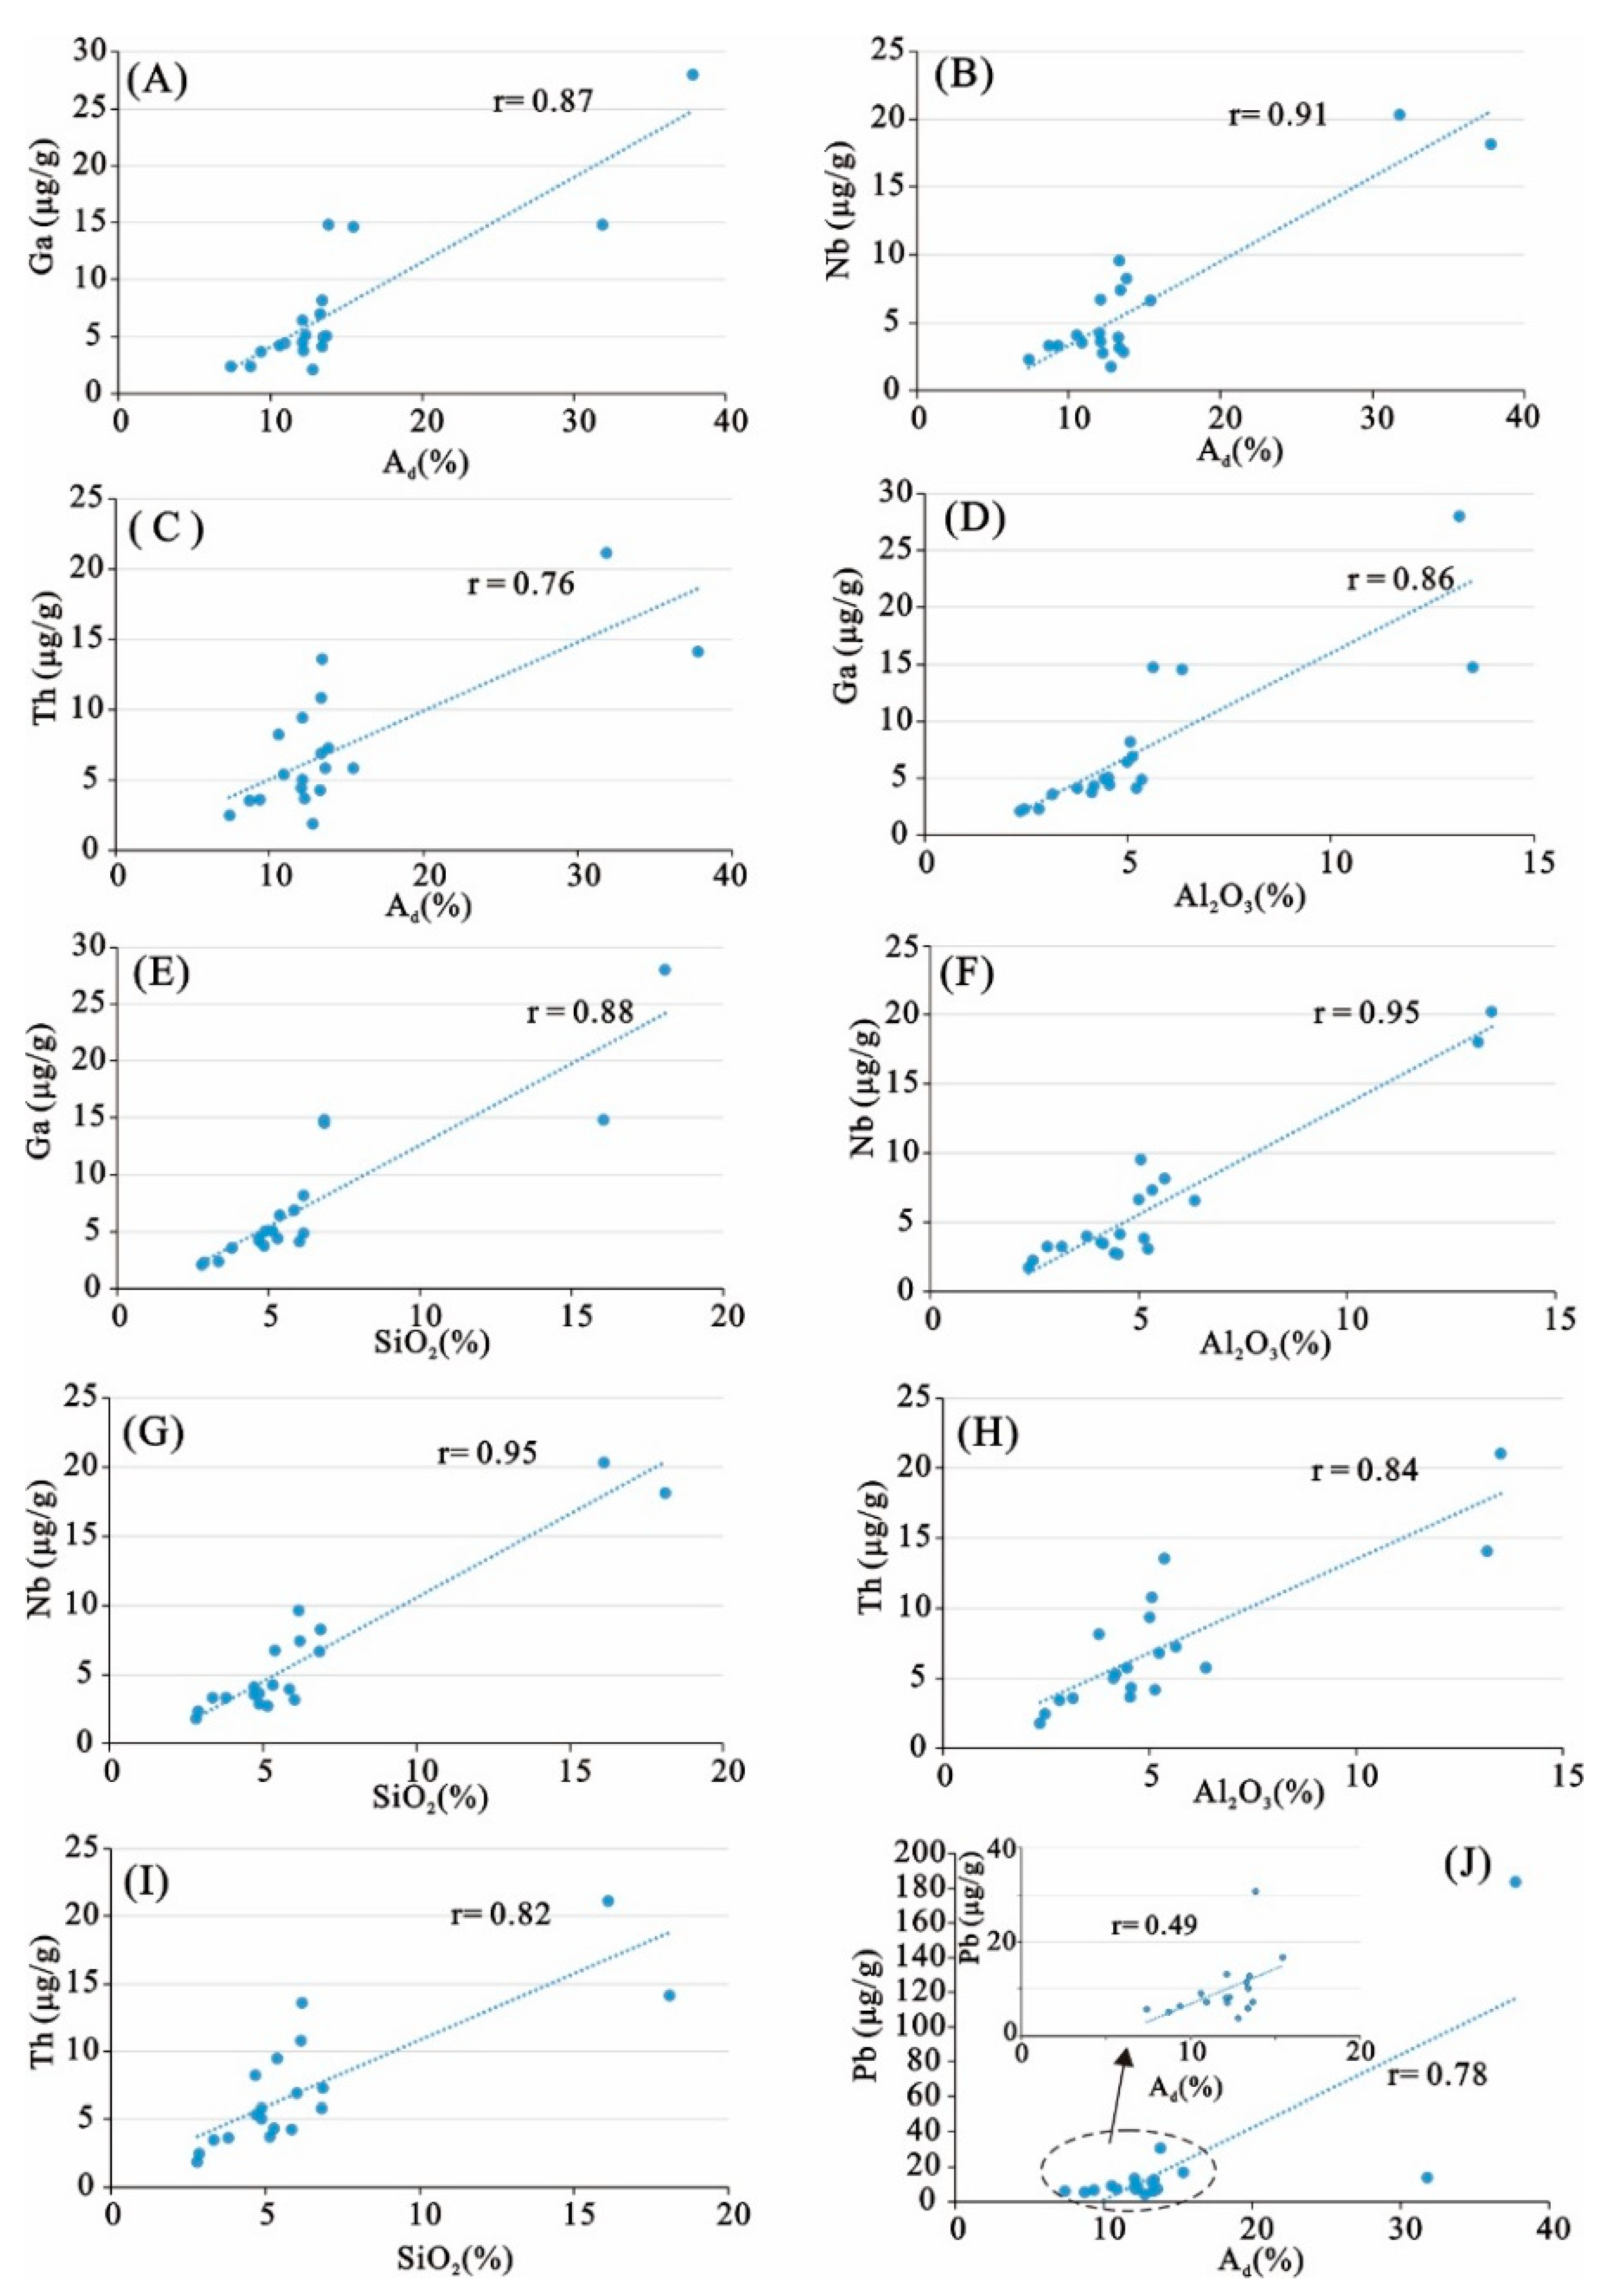
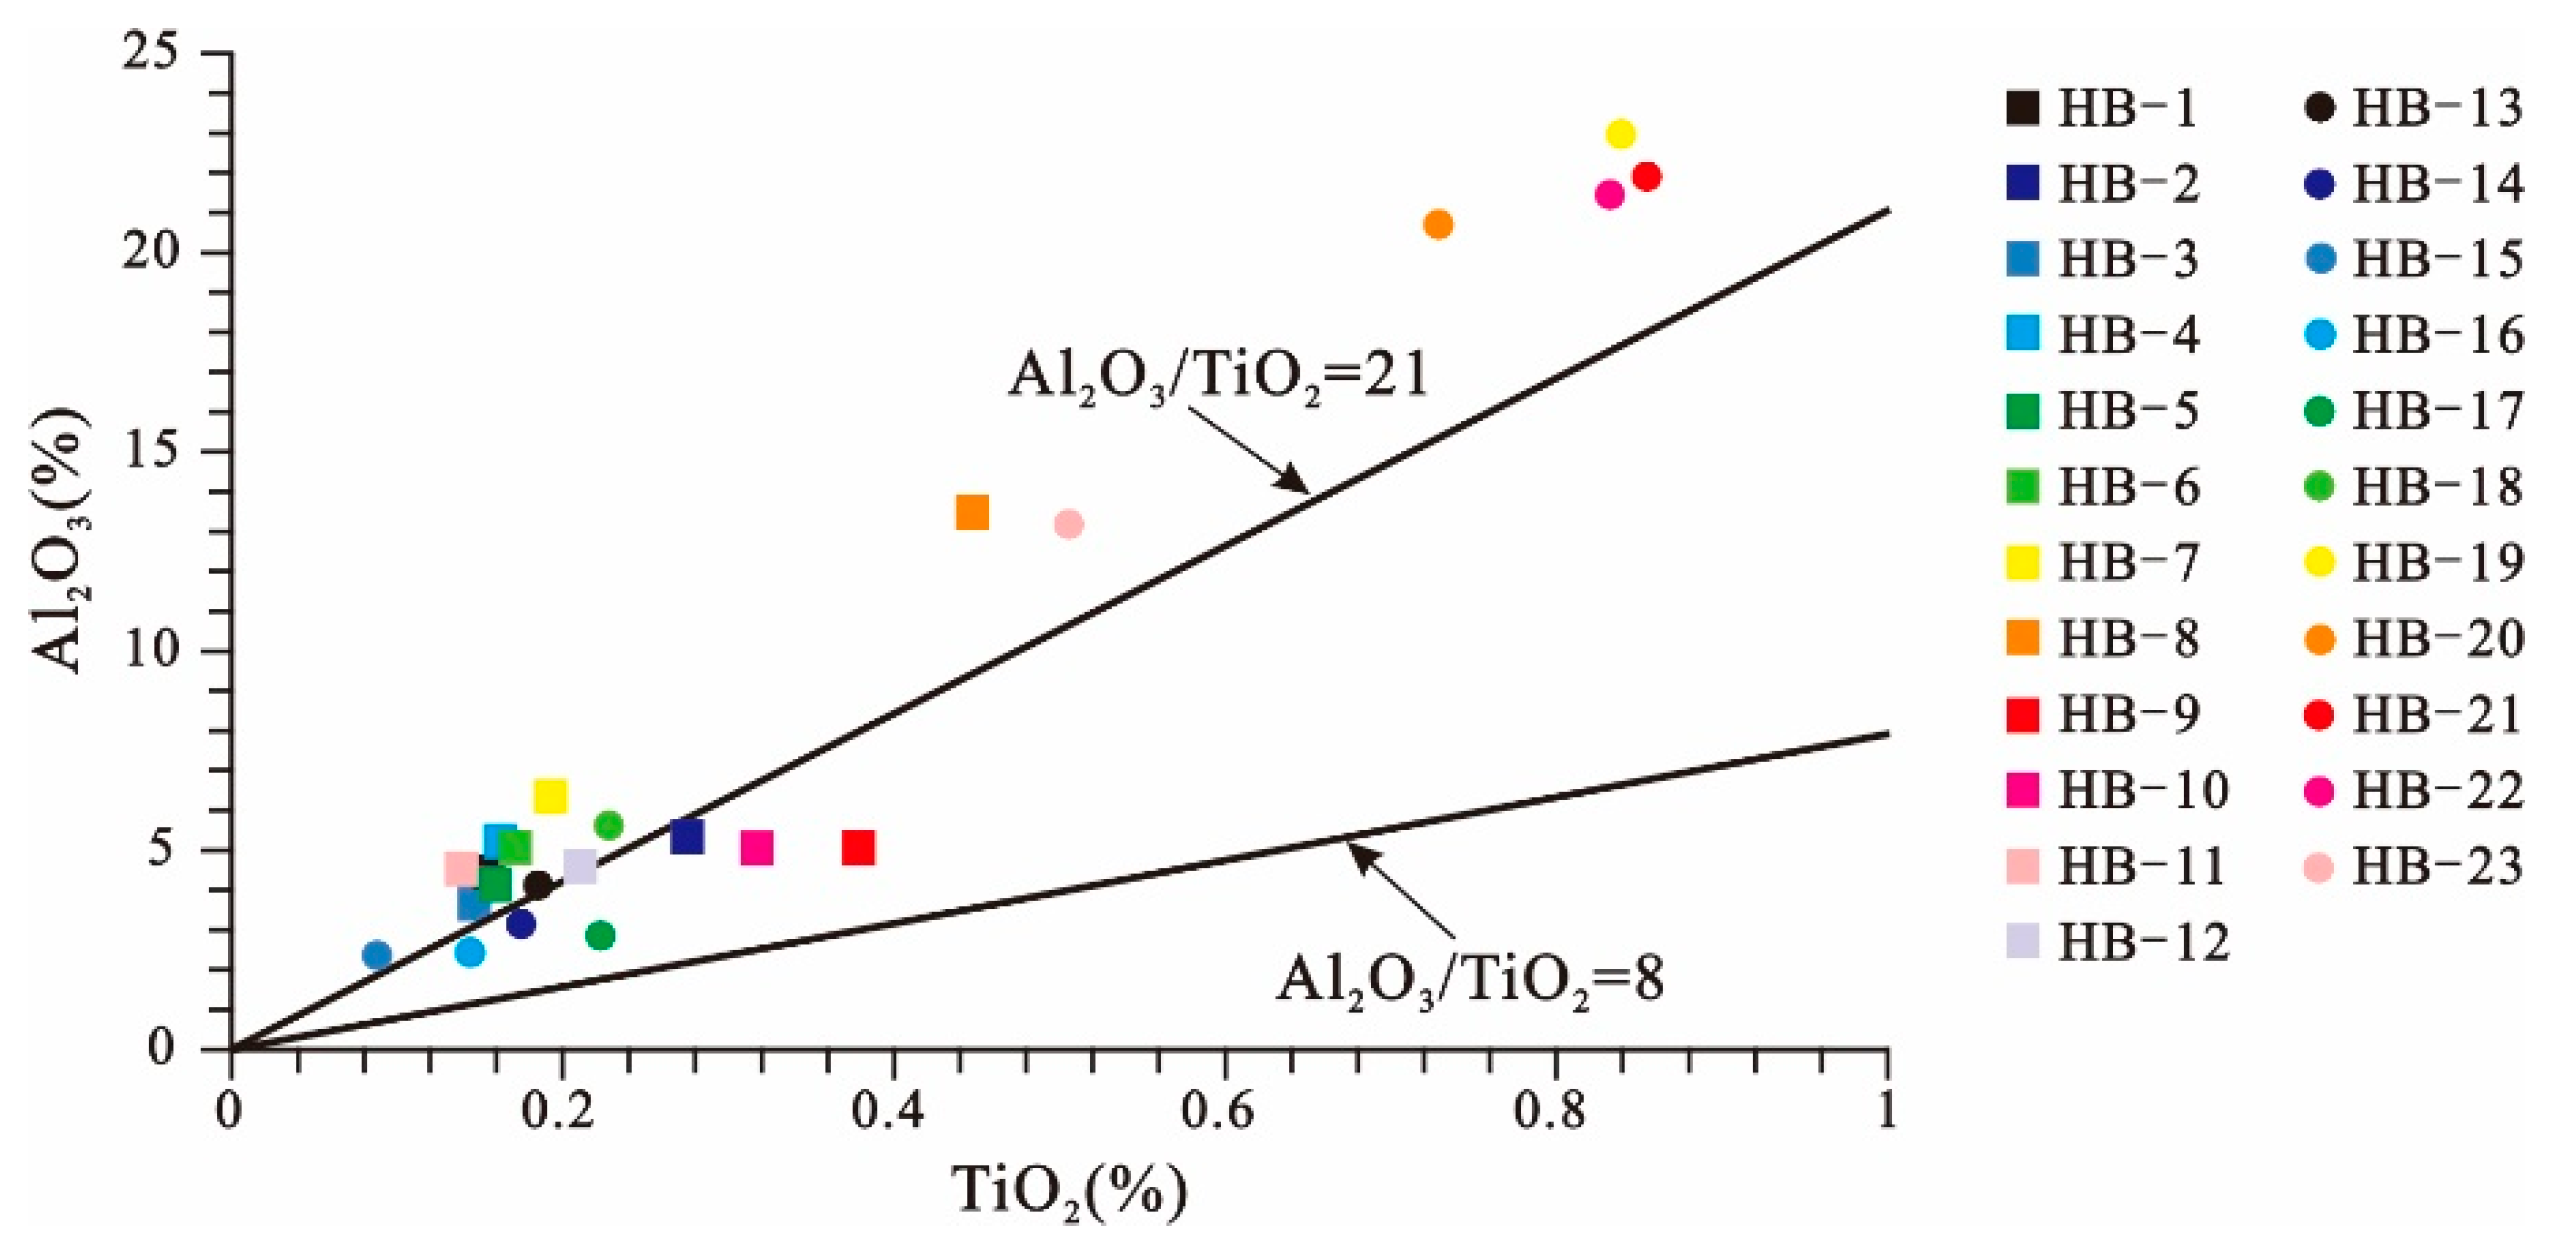
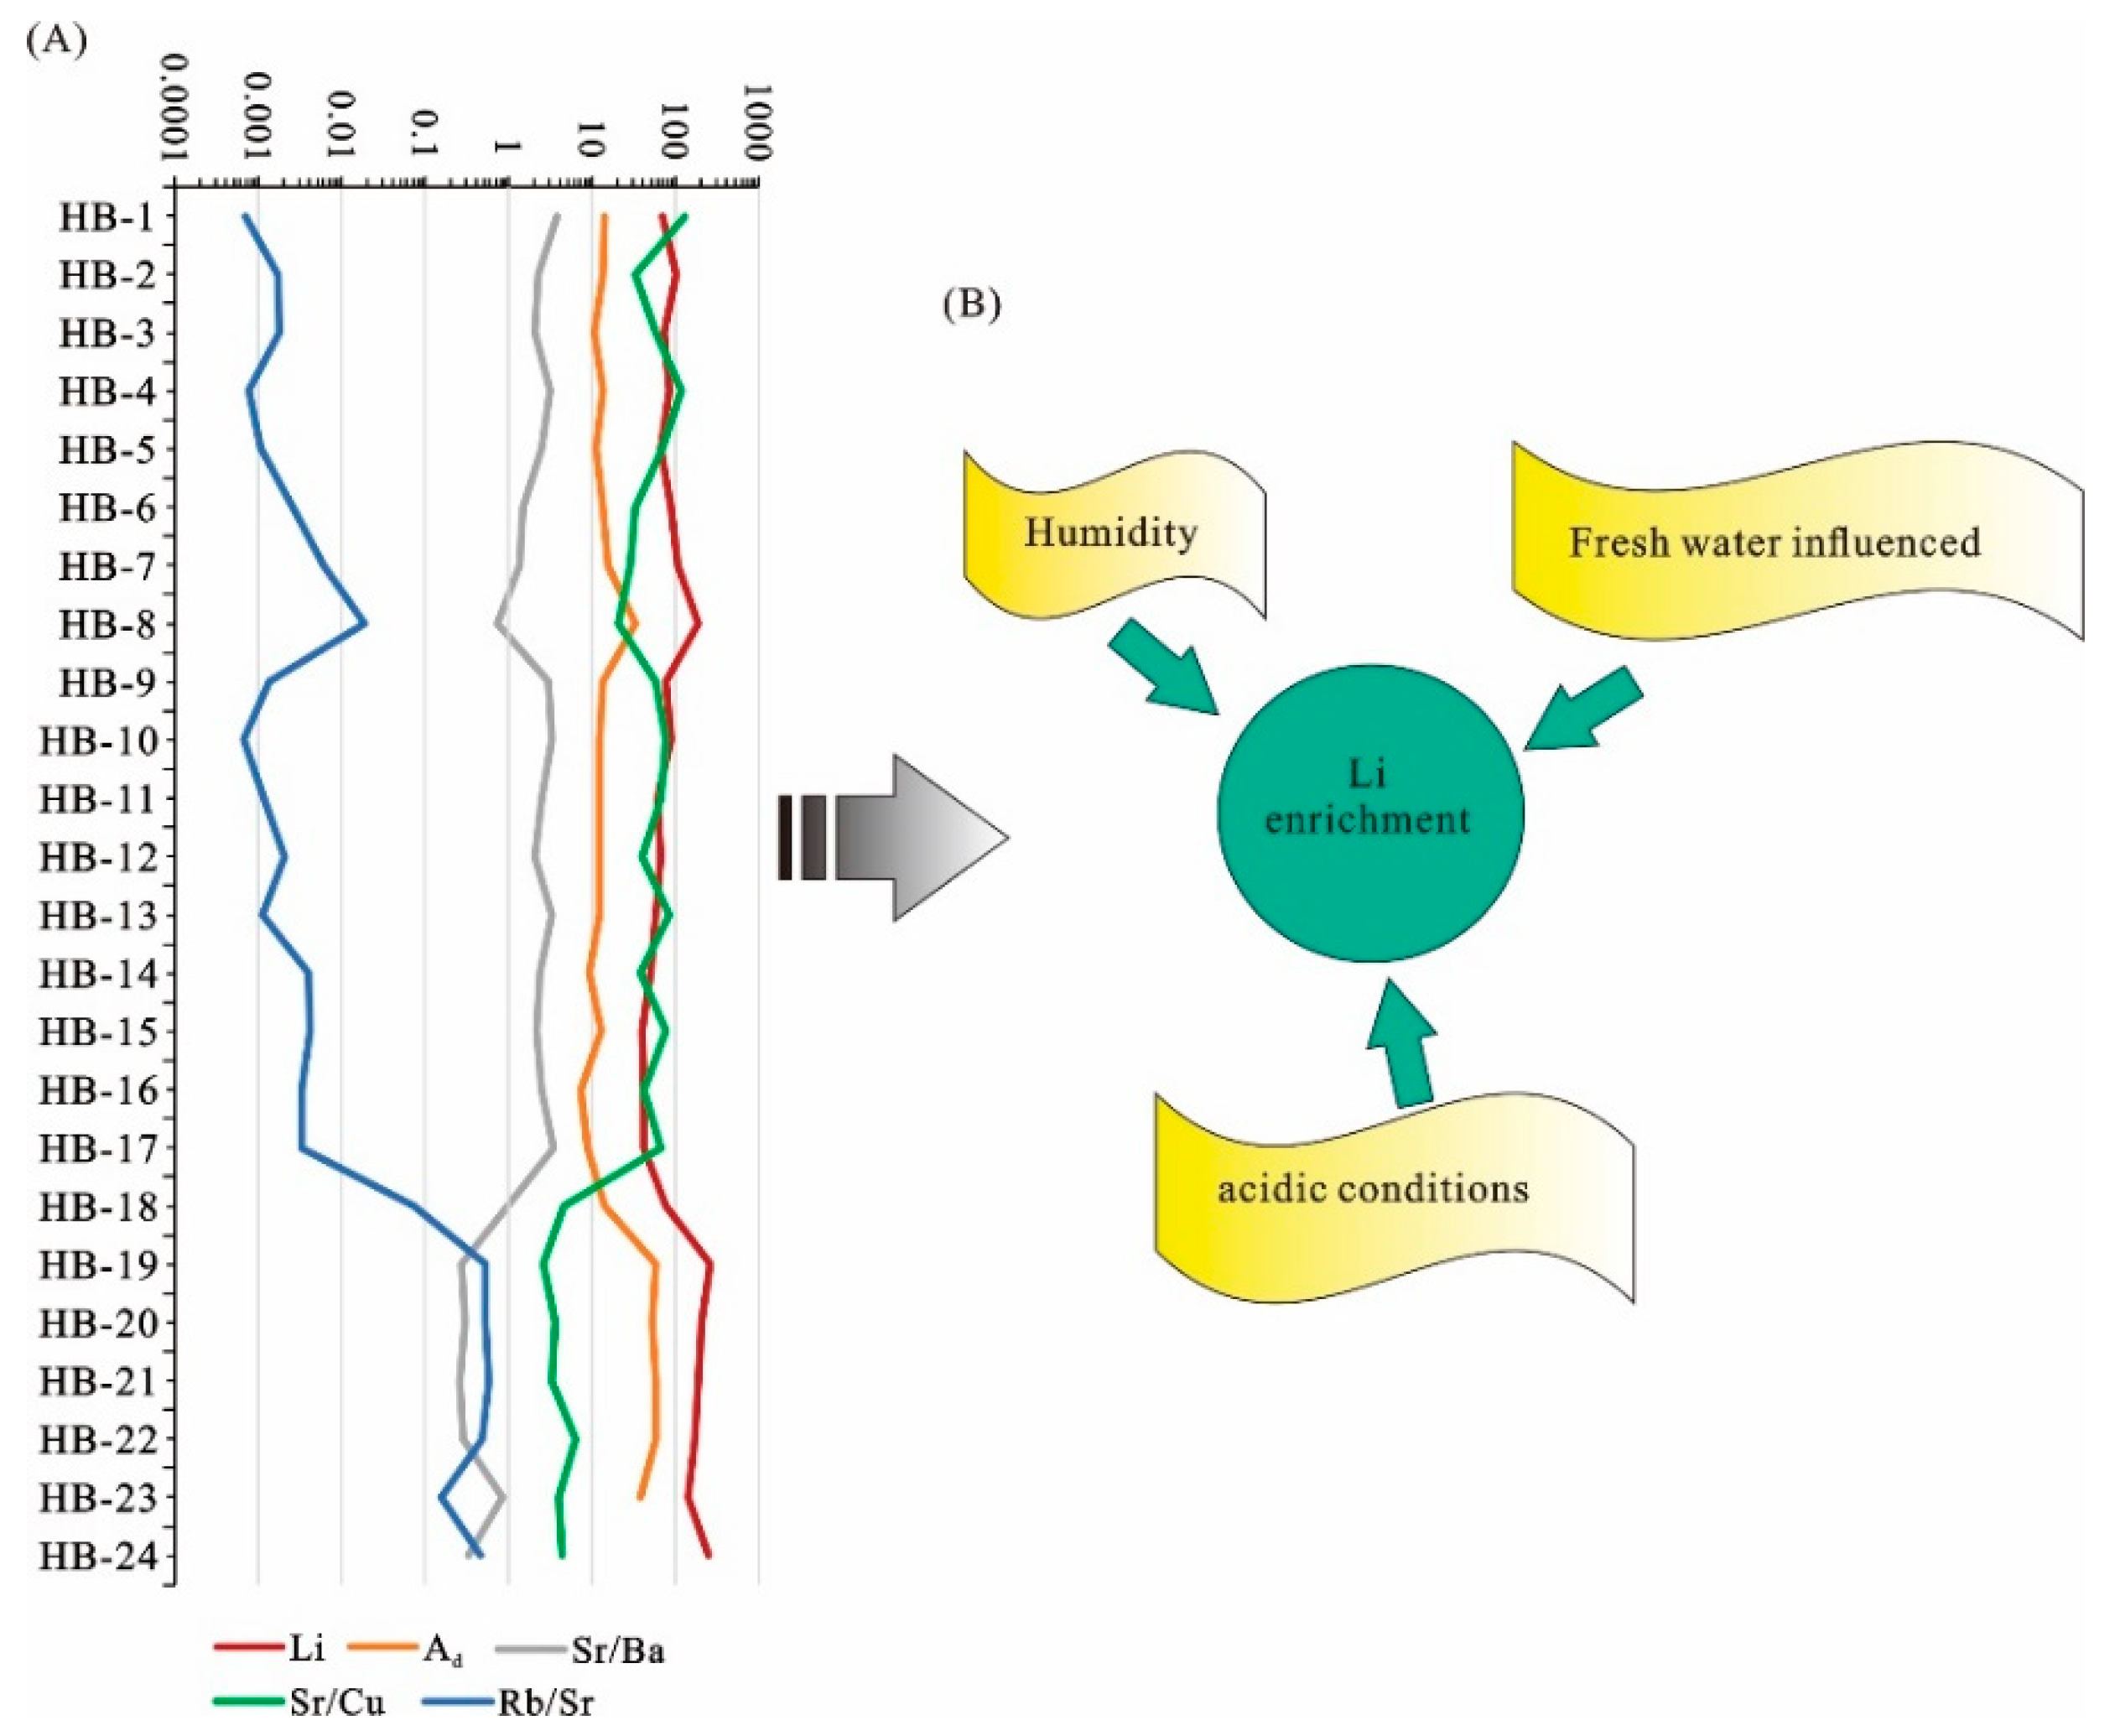
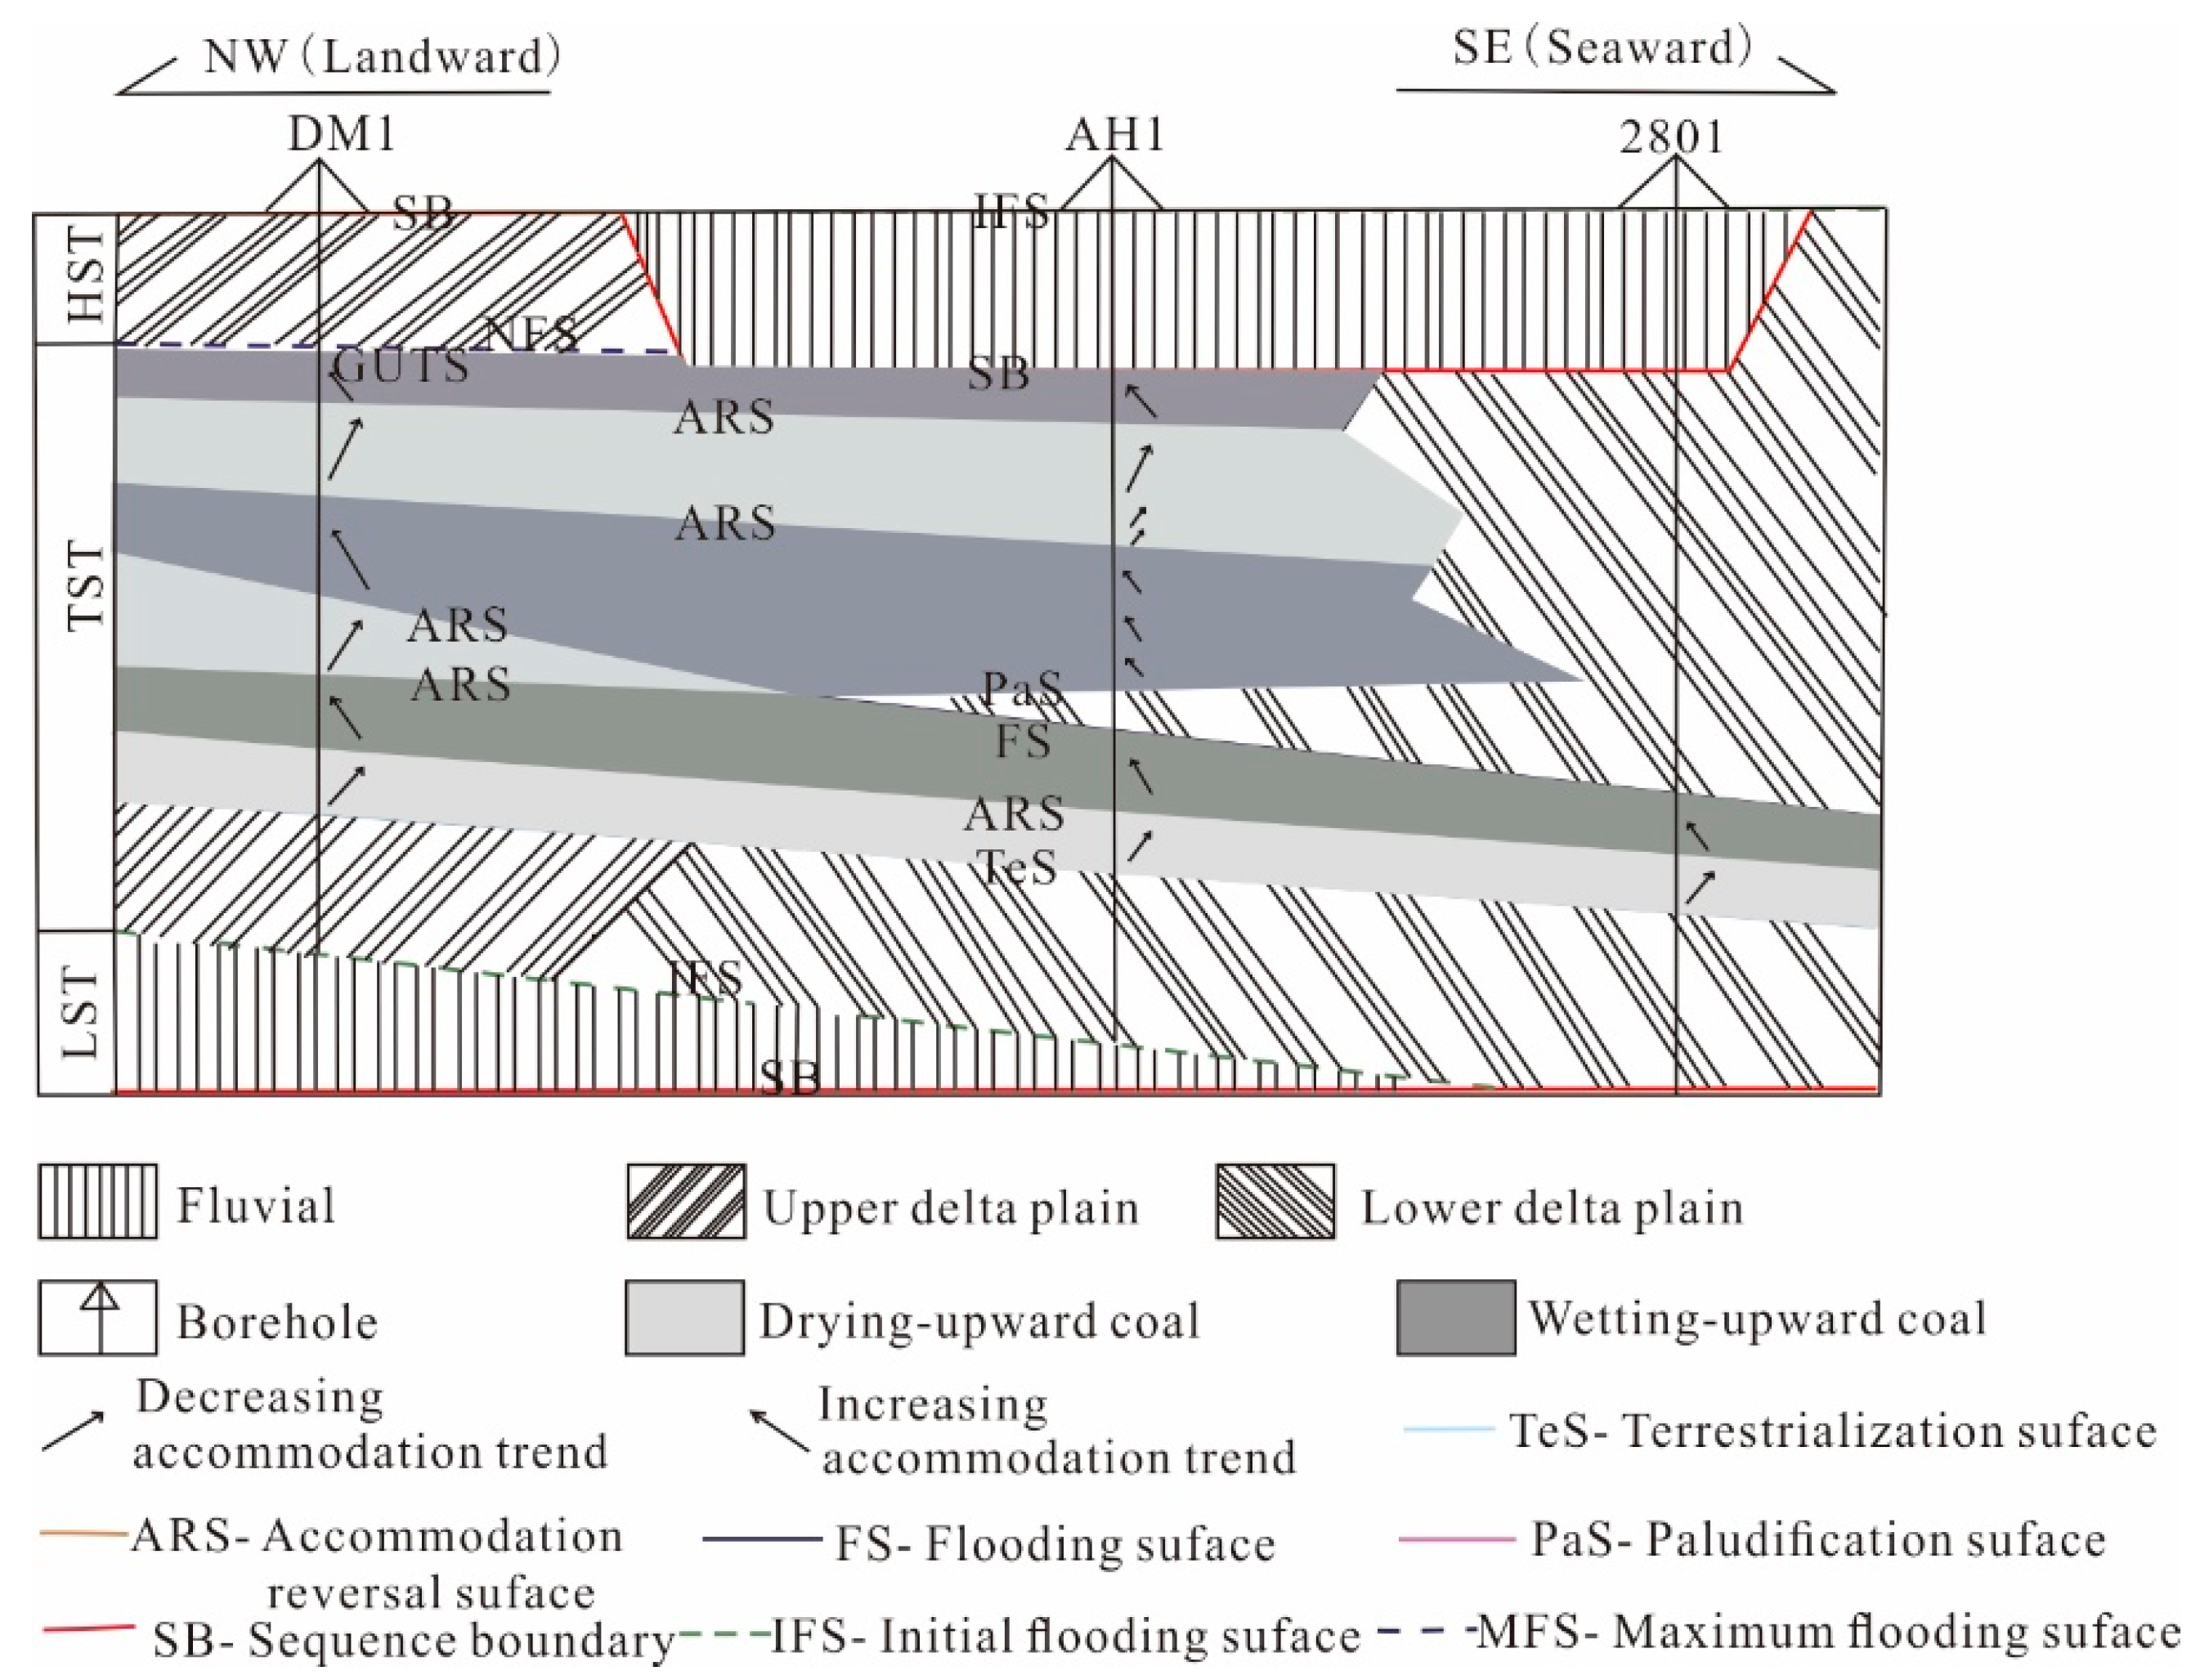
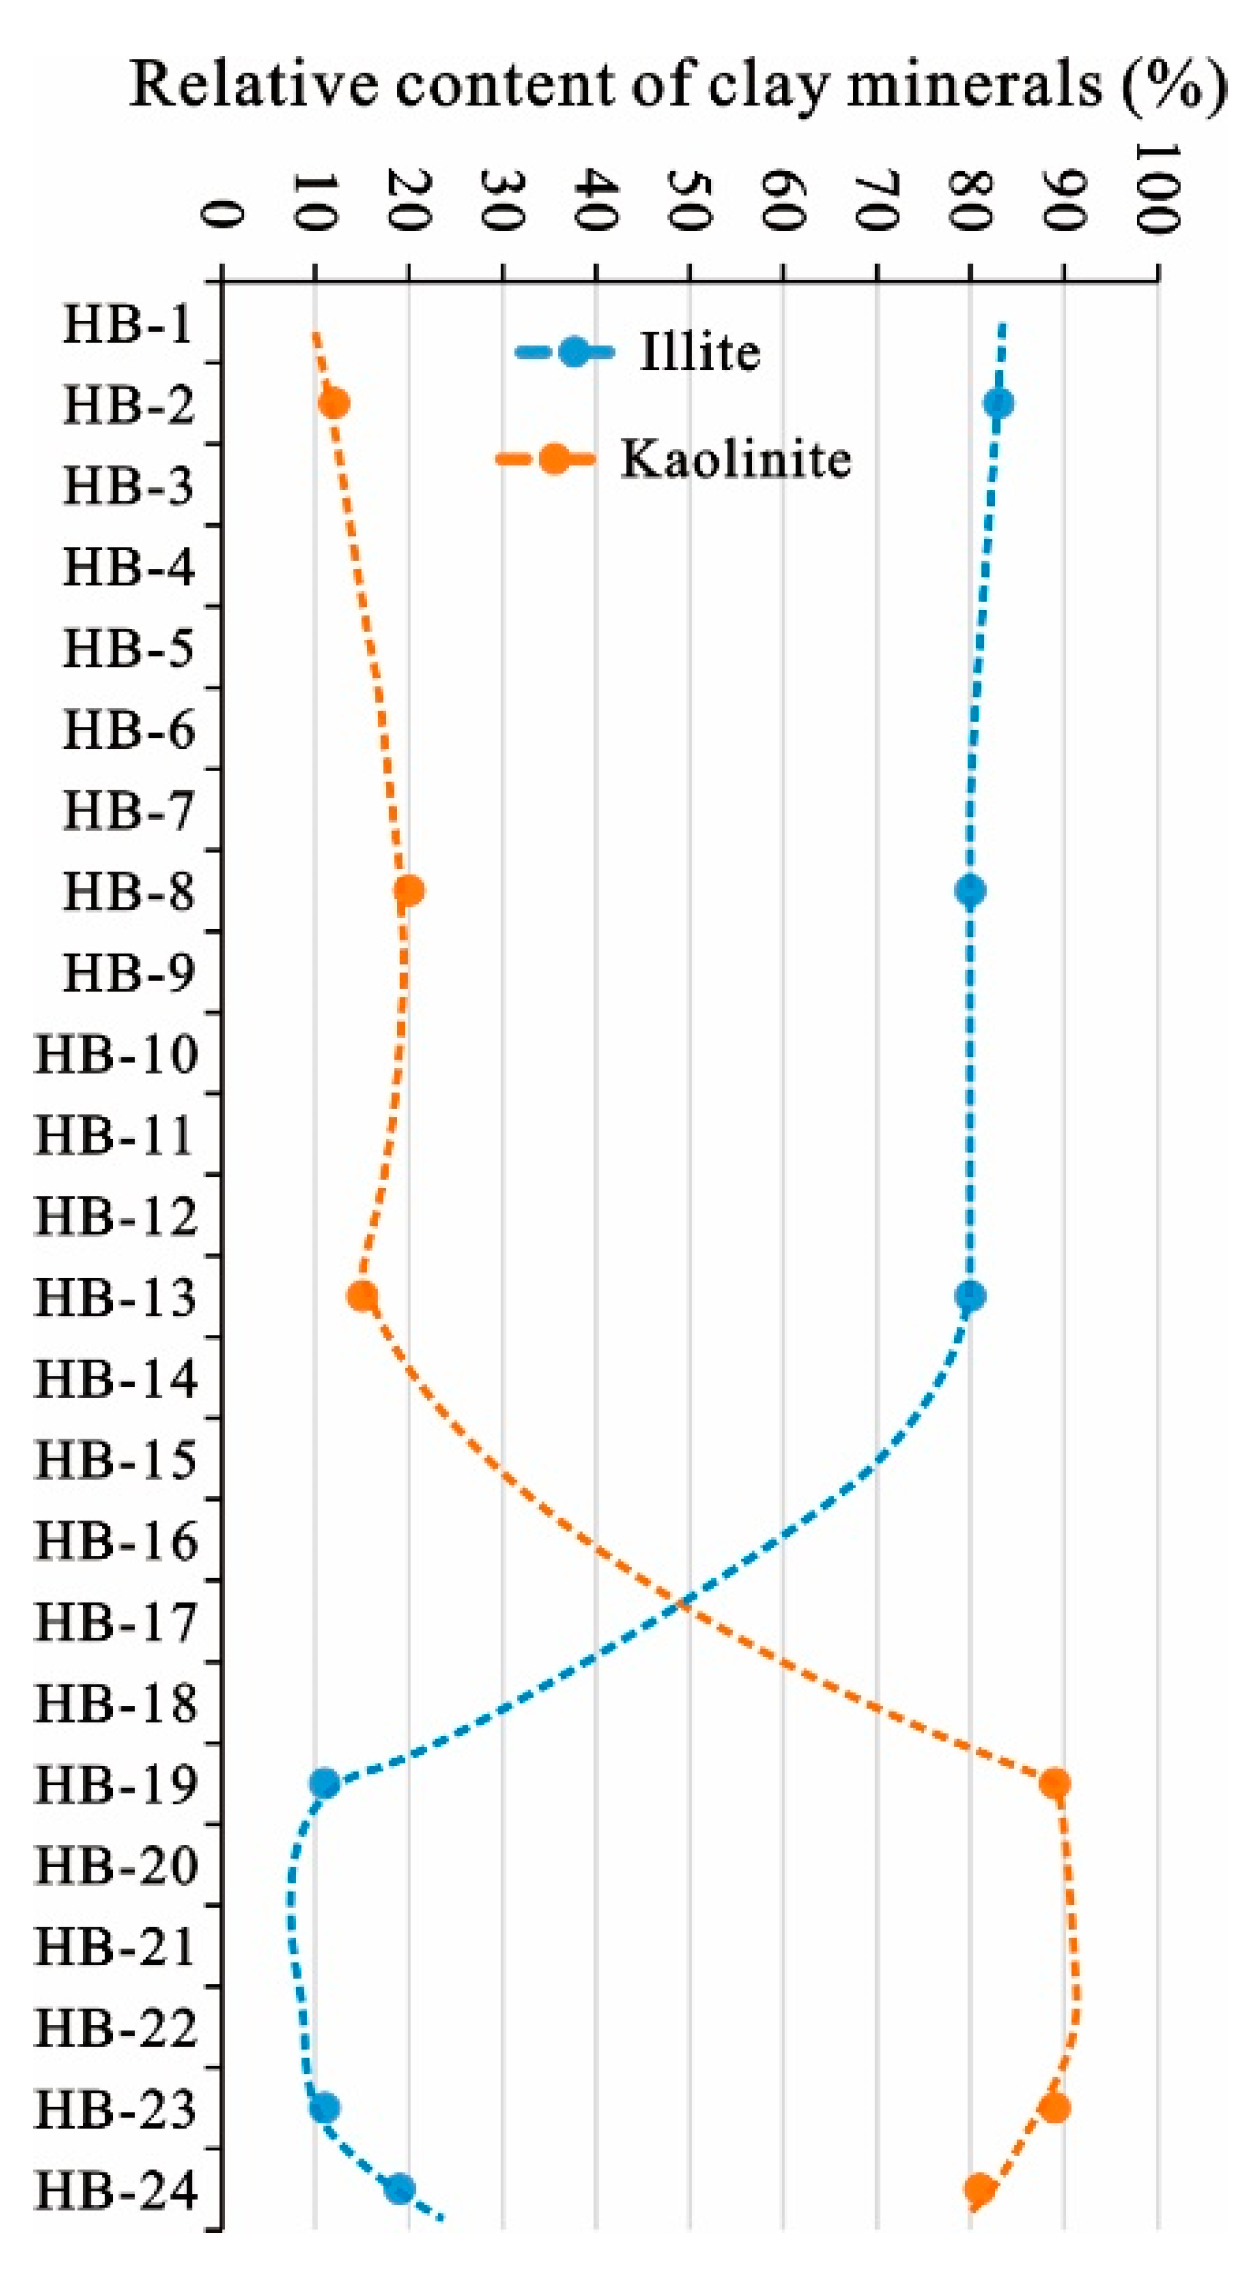
Table 1.
Concentrations of the trace elements of duplicate blank samples (ug/g), method detection limits (MDL, ug/g), and measurement modes (MD) for the ICP-MS analysis in the present study.
Table 1.
Concentrations of the trace elements of duplicate blank samples (ug/g), method detection limits (MDL, ug/g), and measurement modes (MD) for the ICP-MS analysis in the present study.
| Element | Li | Be | Sc | Cr | Mn | Co | Ni | Cu | Zn | Ga | Rb | Sr | Y | Nb | Mo | Cd | In | Cs | Ba | La |
| Blank 1 | 0.025 | 0.038 | 0.23 | 1.032 | 1.054 | 0.123 | 0.214 | 0.192 | 0.324 | 0.053 | 0.046 | 1.681 | 0.125 | 0.204 | 0.086 | 0.008 | 0.008 | 0.042 | 1.362 | 0.162 |
| Blank 2 | 0.031 | 0.034 | 0.18 | 1.027 | 1.067 | 0.136 | 0.182 | 0.174 | 0.406 | 0.084 | 0.057 | 2.035 | 0.203 | 0.184 | 0.102 | 0.012 | 0.007 | 0.036 | 1.248 | 0.206 |
| MDL | 1 | 0.4 | 1 | 5 | 3 | 0.5 | 0.5 | 0.5 | 1 | 0.5 | 0.5 | 5 | 0.3 | 0.5 | 0.2 | 0.02 | 0.01 | 0.1 | 5 | 0.5 |
| MD | STD | STD | KED | KED | KED | STD | STD | STD | STD | KED | KED | KED | KED | KED | STD | STD | STD | STD | KED | KED |
| Element | Ce | Pr | Nd | Sm | Eu | Gd | Tb | Dy | Ho | Er | Tm | Yb | Lu | Ta | W | Tl | Pb | Bi | Th | U |
| Blank 1 | 0.214 | 0.015 | 0.062 | 0.026 | 0.014 | 0.024 | 0.024 | 0.008 | 0.042 | 0.047 | 0.014 | 0.024 | 0.027 | 0.031 | 0.022 | 0.014 | 0.142 | 0.016 | 0.024 | 0.007 |
| Blank 2 | 0.126 | 0.024 | 0.042 | 0.017 | 0.018 | 0.031 | 0.018 | 0.012 | 0.036 | 0.052 | 0.014 | 0.031 | 0.019 | 0.024 | 0.031 | 0.026 | 0.201 | 0.024 | 0.032 | 0.004 |
| MDL | 0.5 | 0.1 | 0.1 | 0.1 | 0.1 | 0.1 | 0.1 | 0.1 | 0.1 | 0.1 | 0.1 | 0.1 | 0.1 | 0.1 | 0.1 | 0.1 | 0.5 | 0.05 | 0.5 | 0.1 |
| MD | KED | KED | KED | KED | KED | KED | KED | KED | KED | KED | KED | KED | KED | STD | STD | STD | STD | STD | STD | STD |
Notes: STD, standard mode; KED, kinetic energy discrimination mode.
Table 2.
Proximate analysis (%) and sulfur (%) contents of the samples from the Hebi No. 6 mine.
| Sample | Mad | Ad | Vdaf | St.d | Sp.d | Ss.d | So.d |
|---|---|---|---|---|---|---|---|
| HB-1 | 0.3 | 13.7 | 18.0 | 0.26 | 0.12 | bdl | 0.14 |
| HB-2 | 0.4 | 13.4 | 15.7 | 0.32 | 0.05 | bdl | 0.27 |
| HB-3 | 0.6 | 10.6 | 15.6 | 0.27 | 0.03 | 0.01 | 0.23 |
| HB-4 | 0.4 | 13.4 | 15.9 | 0.25 | 0.05 | 0.01 | 0.19 |
| HB-5 | 0.5 | 10.9 | 15.6 | 0.25 | 0.05 | 0.01 | 0.19 |
| HB-6 | 0.5 | 13.3 | 17.1 | 0.27 | 0.05 | 0.01 | 0.21 |
| HB-7 | 0.5 | 15.4 | 17.8 | 0.26 | 0.1 | 0.02 | 0.14 |
| HB-8 | 0.5 | 31.8 | 20.2 | 0.2 | 0.05 | bdl | 0.15 |
| HB-9 | 1.1 | 13.4 | 18.7 | 0.26 | 0.06 | 0.02 | 0.18 |
| HB-10 | 0.4 | 12.1 | 15.8 | 0.28 | 0.04 | 0.01 | 0.23 |
| HB-11 | 0.5 | 12.3 | 16.6 | 0.28 | 0.02 | 0.04 | 0.22 |
| HB-12 | 0.5 | 12.1 | 16.2 | 0.27 | 0.01 | 0.04 | 0.22 |
| HB-13 | 0.5 | 12.1 | 16.9 | 0.24 | 0.02 | 0.02 | 0.2 |
| HB-14 | 0.5 | 9.4 | 16.1 | 0.24 | 0.04 | 0.02 | 0.18 |
| HB-15 | 0.5 | 12.8 | 19.7 | 0.28 | 0.02 | 0.02 | 0.24 |
| HB-16 | 0.4 | 7.4 | 14.9 | 0.28 | 0.04 | 0.01 | 0.23 |
| HB-17 | 0.5 | 8.7 | 15.3 | 0.26 | 0.03 | 0.02 | 0.21 |
| HB-18 | 0.7 | 13.8 | 16.0 | 0.3 | 0.05 | 0.02 | 0.23 |
| HB-19 | 0.7 | 55.9 | 28.6 | 0.14 | bdl | bdl | bdl |
| HB-20 | 0.7 | 52.1 | 26.9 | 0.24 | 0.11 | 0.02 | 0.11 |
| HB-21 | 0.6 | 58.4 | 30.0 | 0.3 | 0.16 | 0.06 | 0.08 |
| HB-22 | 0.7 | 58.4 | 29.2 | 0.32 | 0.18 | 0.05 | 0.09 |
| HB-23 | 0.5 | 37.8 | 25.8 | 0.35 | 0.2 | 0.03 | 0.12 |
Notes: M—moisture; A—ash yield; V—volatile matter; St—total sulfur; Ss—sulfate sulfur; Sp—pyritic sulfur; So—organic sulfur; d—dry basis; daf—dry and ash-free basis; ad—air-dry basis; bdl—below detection limit.
Table 3.
Maceral composition (Vol.%) and mineral contents (Vol.%) of the No. 21 coal samples.
| Sample | Vitrinite | Inertinite | Mineral | |||||||||||||
|---|---|---|---|---|---|---|---|---|---|---|---|---|---|---|---|---|
| T | CT | CD | VD | T-V | F | SF | Mac | Mic | ID | T-I | Clay | Sul | Carb | Si | T-M | |
| HB-1 | 10.0 | 1.3 | 47.4 | - | 58.7 | 1.7 | 21.3 | - | - | 8.3 | 31.3 | 8.3 | - | 1.7 | - | 10.0 |
| HB-2 | 9.4 | 1.4 | 46.7 | - | 57.5 | 0.9 | 25.2 | 0.5 | 0.9 | 6.5 | 34.1 | 7.0 | - | 0.5 | 0.9 | 8.4 |
| HB-3 | 14.7 | 3.3 | 33.6 | - | 51.7 | 2.8 | 25.6 | 0.9 | 0.5 | 10.0 | 39.8 | 8.0 | - | - | 0.5 | 8.5 |
| HB-4 | 15.4 | 1.3 | 43.2 | - | 59.9 | 1.7 | 21.1 | 0.9 | 0.9 | 6.2 | 30.8 | 7.1 | - | 1.8 | 0.4 | 9.3 |
| HB-5 | 8.6 | 1.8 | 53.4 | - | 63.8 | 1.9 | 12.2 | - | - | 14.0 | 28.1 | 5.8 | - | 1.4 | 0.9 | 8.1 |
| HB-6 | 5.7 | 1.7 | 58.7 | - | 66.1 | 0.9 | 14.8 | 1.3 | 1.7 | 7.8 | 26.5 | 5.7 | - | 1.3 | 0.4 | 7.4 |
| HB-7 | 3.6 | 2.8 | 65.6 | 0.8 | 72.8 | 0.8 | 9.6 | 0.4 | 1.2 | 5.6 | 17.6 | 8.0 | - | 1.2 | 0.4 | 9.6 |
| HB-8 | 4.1 | 1.0 | 39.8 | - | 44.9 | 0.5 | 15.3 | - | - | 6.6 | 22.4 | 25.6 | - | 5.1 | 2.0 | 32.7 |
| HB-9 | 13.5 | 1.4 | 47.8 | - | 62.8 | 1.0 | 19.8 | 0.5 | - | 7.7 | 29.0 | 6.7 | - | 1.0 | 0.5 | 8.2 |
| HB-10 | 17.0 | 0.9 | 42.7 | 0.4 | 61.0 | 3.1 | 16.2 | 3.1 | 1.3 | 5.9 | 29.6 | 7.2 | - | 1.8 | 0.4 | 9.4 |
| HB-11 | 14.1 | 0.8 | 46.3 | 1.3 | 62.5 | 1.6 | 15.8 | 1.7 | - | 9.2 | 28.3 | 5.9 | - | 3.3 | - | 9.2 |
| HB-12 | 13.3 | 2.7 | 41.4 | 0.4 | 57.8 | 3.9 | 15.2 | 1.6 | 1.6 | 9.7 | 32.0 | 6.3 | - | 3.9 | - | 10.2 |
| HB-13 | 21.1 | 0.9 | 36.6 | 1.9 | 60.6 | 0.9 | 16.5 | - | 0.9 | 12.2 | 30.5 | 4.7 | - | 3.3 | 0.9 | 8.9 |
| HB-14 | 17.3 | 1.2 | 42.1 | 0.4 | 61.0 | 0.8 | 16.4 | - | - | 14.5 | 31.7 | 6.9 | - | - | 0.4 | 7.3 |
| HB-15 | 4.2 | 2.9 | 56.1 | 2.9 | 66.1 | - | 11.7 | 0.8 | 0.5 | 13.4 | 26.4 | 4.2 | - | 3.3 | - | 7.5 |
| HB-16 | 13.0 | 1.3 | 50.9 | 2.1 | 67.3 | 0.4 | 12.6 | - | 0.8 | 11.8 | 25.6 | 5.9 | - | 0.8 | 0.4 | 7.1 |
| HB-17 | 6.7 | 1.3 | 53.6 | - | 61.6 | - | 15.4 | 1.3 | - | 14.6 | 31.3 | 4.6 | - | 1.7 | 0.8 | 7.1 |
| HB-18 | 10.7 | - | 49.1 | 14.3 | 74.1 | - | 13.8 | - | - | 3.6 | 17.4 | 6.7 | - | 1.8 | - | 8.5 |
| HB-23 | 10.9 | 6.5 | 44.8 | - | 62.2 | 1.0 | 1.5 | - | - | 1.5 | 4.0 | 20.4 | - | 12.4 | 1.0 | 33.8 |
Notes: T—telinite; CT—collotelinite; CD—collodetrinite; VD—vitrodetrinite; T-V—total vitrinites; F—fusinite; SF—semifusinite; Mic—micrinite; Mac—macrinite; ID—inertodetrinite; T-I—total inertinites; clay, clay minerals; Sul, sulfide minerals; Carb, carbonate minerals; Si, Silica minerals; T-M, total minerals; -, no test or no result.
Table 4.
The major-element oxides (%) in the No. 21 coal and parting samples on a whole coal/rock basis.
Table 4.
The major-element oxides (%) in the No. 21 coal and parting samples on a whole coal/rock basis.
| Sample | LOI | SiO2 | TiO2 | Al2O3 | Fe2O3 | MgO | CaO | MnO | Na2O | K2O | SiO2/Al2O3 | Al2O3/TiO2 |
|---|---|---|---|---|---|---|---|---|---|---|---|---|
| HB-1 | 86.35 | 4.88 | 0.16 | 4.44 | 0.72 | 0.14 | 3.03 | bdl | 0.25 | 0.02 | 1.10 | 27.75 |
| HB-2 | 86.56 | 6.17 | 0.28 | 5.34 | 0.37 | 0.06 | 0.94 | bdl | 0.27 | 0.03 | 1.16 | 19.07 |
| HB-3 | 89.42 | 4.69 | 0.15 | 3.76 | 0.42 | 0.07 | 1.26 | bdl | 0.21 | 0.02 | 1.25 | 25.07 |
| HB-4 | 86.65 | 6.02 | 0.16 | 5.22 | 0.66 | 0.06 | 0.91 | bdl | 0.29 | 0.02 | 1.15 | 32.63 |
| HB-5 | 89.08 | 4.7 | 0.16 | 4.17 | 0.46 | 0.07 | 1.16 | bdl | 0.18 | 0.02 | 1.13 | 26.06 |
| HB-6 | 86.73 | 5.84 | 0.17 | 5.13 | 0.56 | 0.1 | 1.16 | bdl | 0.29 | 0.02 | 1.14 | 30.18 |
| HB-7 | 84.59 | 6.83 | 0.19 | 6.35 | 0.74 | 0.14 | 0.85 | bdl | 0.27 | 0.04 | 1.08 | 33.42 |
| HB-8 | 68.16 | 16.08 | 0.45 | 13.5 | 0.7 | bdl | 0.73 | bdl | 0.3 | 0.08 | 1.19 | 30.00 |
| HB-9 | 86.62 | 6.16 | 0.38 | 5.06 | 0.37 | 0.06 | 1.12 | bdl | 0.22 | 0.03 | 1.22 | 13.32 |
| HB-10 | 87.89 | 5.37 | 0.32 | 5 | 0.29 | 0.06 | 0.85 | bdl | 0.21 | 0.02 | 1.07 | 15.63 |
| HB-11 | 87.73 | 5.13 | 0.14 | 4.52 | 0.52 | 0.05 | 1.54 | bdl | 0.33 | 0.02 | 1.13 | 32.29 |
| HB-12 | 87.93 | 5.29 | 0.21 | 4.56 | 0.37 | 0.05 | 1.3 | bdl | 0.25 | 0.03 | 1.16 | 21.71 |
| HB-13 | 87.86 | 4.87 | 0.19 | 4.12 | 0.38 | 0.01 | 2.26 | bdl | 0.28 | 0.03 | 1.18 | 21.68 |
| HB-14 | 90.65 | 3.8 | 0.17 | 3.15 | 0.48 | 0.07 | 1.43 | 0.03 | 0.21 | 0.02 | 1.21 | 18.53 |
| HB-15 | 87.21 | 2.8 | 0.09 | 2.35 | 1.34 | 0.63 | 5.32 | 0.02 | 0.24 | 0.02 | 1.19 | 26.11 |
| HB-16 | 92.6 | 2.86 | 0.14 | 2.46 | 0.4 | 0.11 | 1.18 | bdl | 0.24 | 0.01 | 1.16 | 17.57 |
| HB-17 | 91.3 | 3.33 | 0.22 | 2.81 | 0.54 | 0.18 | 1.35 | bdl | 0.21 | 0.05 | 1.19 | 12.77 |
| HB-18 | 86.19 | 6.85 | 0.23 | 5.63 | 0.41 | 0.1 | 0.29 | bdl | 0.18 | 0.12 | 1.22 | 24.48 |
| HB-19 | 44.09 | 29.29 | 0.84 | 22.96 | 0.89 | 0.31 | 0.18 | bdl | 0.21 | 1.23 | 1.28 | 27.33 |
| HB-20 | 47.94 | 27.83 | 0.73 | 20.7 | 0.95 | 0.31 | 0.17 | bdl | 0.21 | 1.16 | 1.34 | 28.36 |
| HB-21 | 41.6 | 32.49 | 0.85 | 21.89 | 1.2 | 0.3 | 0.26 | bdl | 0.16 | 1.25 | 1.48 | 25.75 |
| HB-22 | 41.65 | 32.72 | 0.83 | 21.43 | 1.29 | 0.3 | 0.23 | 0.01 | 0.24 | 1.3 | 1.53 | 25.82 |
| HB-23 | 62.2 | 18.09 | 0.51 | 13.17 | 1.07 | 0.18 | 4.09 | 0.02 | 0.07 | 0.61 | 1.37 | 25.82 |
| Average in Coal | 6.30 | 0.23 | 5.30 | 0.57 | 0.12 | 1.62 | bdl | 0.24 | 0.06 | 1.19 | 23.32 | |
| Chinaa | 8.47 | 0.33 | 5.98 | 4.85 | 0.22 | 1.23 | 0.02 | 0.16 | 0.19 | 1.42 | 18.12 |
Notes: LOI, loss on ignition; bdl, below detection limit; a, major-element oxides in Chinese coals. Data from Dai et al. [12].
Table 5.
Concentrations of trace elements in coal and non-coal samples from the Hebi No. 6 mine (μg/g, on a whole coal basis).
Table 5.
Concentrations of trace elements in coal and non-coal samples from the Hebi No. 6 mine (μg/g, on a whole coal basis).
| Sample | Li | Be | Sc | Cr | Mn | Co | Ni | Cu | Zn | Ga | Rb | Sr | Y | Nb | Mo | Cd | In | Cs | Pb | Bi |
| HB-1 | 68 | 0.68 | 2.4 | 7.8 | 13 | 1.7 | 4.5 | 9.2 | 5.5 | 5.0 | 0.82 | 1183 | 8.4 | 2.8 | 0.90 | 0.03 | 0.02 | 0.37 | 7.2 | 0.16 |
| HB-2 | 100 | 0.98 | 4.1 | 15 | 6.7 | 1.1 | 3.3 | 18 | 6.5 | 4.9 | 0.98 | 584 | 13 | 7.4 | 0.68 | 0.04 | 0.03 | 0.39 | 13 | 0.28 |
| HB-3 | 71 | 0.90 | 3.5 | 13 | 11 | 1.1 | 3.3 | 8.9 | 6.4 | 4.2 | 0.88 | 501 | 12 | 4.0 | 0.51 | 0.03 | 0.02 | 0.37 | 9.0 | 0.20 |
| HB-4 | 84 | 0.83 | 3.2 | 10 | 10 | 0.98 | 2.6 | 8.8 | 5.0 | 4.2 | 0.77 | 1033 | 12 | 3.1 | 0.46 | 0.03 | 0.02 | 0.37 | 5.9 | 0.15 |
| HB-5 | 66 | 0.85 | 3.5 | 11 | 12 | 1.1 | 2.9 | 9.4 | 8.0 | 4.4 | 0.68 | 640 | 12 | 3.5 | 0.60 | 0.03 | 0.02 | 0.35 | 7.1 | 0.20 |
| HB-6 | 88 | 0.69 | 3.0 | 8.9 | 16 | 1.4 | 2.8 | 11 | 6.7 | 7.0 | 0.93 | 353 | 9.7 | 3.9 | 1.2 | 0.03 | 0.02 | 0.39 | 11 | 0.22 |
| HB-7 | 103 | 0.60 | 3.3 | 7.8 | 11 | 2.0 | 3.4 | 9.0 | 6.6 | 15 | 1.6 | 261 | 9.8 | 6.6 | 1.4 | 0.03 | 0.03 | 0.43 | 17 | 0.24 |
| HB-8 | 183 | 0.79 | 4. 5 | 12 | 11 | 1.4 | 8.6 | 9.5 | 11 | 15 | 3.6 | 195 | 9.6 | 20 | 0.94 | 0.06 | 0.04 | 0.88 | 14 | 0.49 |
| HB-9 | 77 | 0.87 | 5. 8 | 14 | 21 | 1.3 | 3.2 | 13 | 12 | 8.2 | 1.0 | 743 | 16 | 9.6 | 0.88 | 0.05 | 0.03 | 0.38 | 10 | 0.26 |
| HB-10 | 88 | 0.76 | 4.2 | 11 | 8.9 | 1.2 | 2.7 | 13 | 5.4 | 6.5 | 0.67 | 1013 | 13 | 6.7 | 0.58 | 0.03 | 0.02 | 0.35 | 13 | 0.22 |
| HB-11 | 60 | 0.57 | 2.1 | 6.4 | 29 | 1.4 | 3.6 | 9.3 | 5.8 | 5.1 | 0.70 | 608 | 8.3 | 2.7 | 0.64 | 0.03 | 0.02 | 0.37 | 8.2 | 0.14 |
| HB-12 | 66 | 0.59 | 2.7 | 10 | 18 | 1.3 | 4.2 | 12 | 5.7 | 4.5 | 0.93 | 466 | 9.8 | 4.2 | 0.72 | 0.03 | 0.02 | 0.38 | 8.1 | 0.19 |
| HB-13 | 56 | 0.54 | 2.4 | 8.3 | 22 | 1.1 | 4.6 | 9.3 | 4.8 | 3.8 | 0.83 | 754 | 8.8 | 3.6 | 0.71 | 0.03 | 0.02 | 0.37 | 7.0 | 0.16 |
| HB-14 | 51 | 0.55 | 2.4 | 7.7 | 20 | 2.4 | 6.4 | 11 | 5.6 | 3.6 | 1.5 | 396 | 8.3 | 3.3 | 0.71 | 0.01 | 0.02 | 0.18 | 6.3 | 0.14 |
| HB-15 | 40 | 0.42 | 1.7 | 6.9 | 100 | 1.9 | 7.4 | 5.6 | 4.5 | 2.1 | 1.8 | 433 | 8.7 | 1.8 | 0.66 | 0.02 | 0.02 | 0.19 | 3.7 | 0.06 |
| HB-16 | 41 | 0.43 | 2.5 | 9.5 | 16 | 3.2 | 9.1 | 9.9 | 5.5 | 2.4 | 1.3 | 405 | 7.0 | 2.3 | 0.82 | 0.02 | 0.02 | 0.16 | 5.6 | 0.11 |
| HB-17 | 42 | 0.51 | 2.9 | 12 | 25 | 3.0 | 8.0 | 10 | 6.0 | 2.4 | 2.3 | 681 | 8.5 | 3.3 | 0.51 | 0.01 | 0.02 | 0.27 | 5.1 | 0.10 |
| HB-18 | 76 | 1.7 | 7.5 | 17 | 23 | 20 | 25 | 24 | 11 | 15 | 8.2 | 110 | 21 | 8.2 | 2.6 | 0.02 | 0.05 | 0.93 | 31 | 0.35 |
| HB-19 | 260 | 3.7 | 17 | 65 | 23 | 25 | 34 | 49 | 20 | 40 | 64 | 125 | 31 | 28 | 1.7 | 0.01 | 0.19 | 6.8 | 26 | 0.42 |
| HB-20 | 202 | 3.5 | 17 | 68 | 25 | 28 | 34 | 35 | 20 | 37 | 63 | 121 | 33 | 27 | 1.2 | 0.01 | 0.11 | 5.7 | 32 | 0.34 |
| HB-21 | 181 | 3.6 | 16 | 61 | 40 | 34 | 35 | 37 | 24 | 37 | 70 | 122 | 36 | 25 | 0.77 | 0.01 | 0.09 | 5.9 | 29 | 0.33 |
| HB-22 | 171 | 3.4 | 16 | 57 | 54 | 23 | 28 | 23 | 29 | 35 | 69 | 145 | 39 | 25 | 0.85 | 0.02 | 0.10 | 5.9 | 28 | 0.38 |
| HB-23 | 142 | 2.7 | 22 | 43 | 146 | 22 | 33 | 61 | 59 | 28 | 37 | 235 | 38 | 18 | 1.1 | 0.12 | 0.09 | 4.6 | 184 | 0.40 |
| HB-24 | 244 | 4.4 | 20 | 57 | 44 | 9.9 | 22 | 47 | 72 | 39 | 92 | 201 | 43 | 29 | 0.72 | 0.08 | 0.10 | 7.7 | 54 | 0.48 |
| World Coal A | 12 | 1.6 | 3.9 | 16 | 71 | 5.1 | 13 | 16 | 23 | 5.8 | 14 | 110 | 8.4 | 3.7 | 2.2 | 0.22 | 0.03 | 1.0 | 7.8 | 0.97 |
| World Clay B | 54 | 3.0 | 15 | 110 | 800 | 19 | 49 | 36 | 89 | 16 | 133 | 240 | 31 | 11 | 1.6 | 0.91 | 0.06 | 13 | 14 | 0.38 |
| Sample | Ba | La | Ce | Pr | Nd | Sm | Eu | Gd | Tb | Dy | Ho | Er | Tm | Yb | Lu | Ta | W | Tl | Th | U |
| HB-1 | 317 | 20 | 32 | 3.2 | 10 | 1.8/1.6 | 0.28 | 1.7 | 0.27 | 1.7/1.4 | 0.39 | 0.88 | 0.13 | 0.86 | 0.13 | 0.25 | 0.66 | 0.17 | 5.8 | 1.1 |
| HB-2 | 265 | 18 | 32 | 3.4 | 12 | 2.3/2.0 | 0.39 | 2.4 | 0.38 | 2.7/2.1 | 0.59 | 1.4 | 0.22 | 1.4 | 0.21 | 0.69 | 0.73 | 0.32 | 14 | 2.2 |
| HB-3 | 245 | 21 | 35 | 3.5 | 11 | 2.4/2.0 | 0.38 | 2.1 | 0.37 | 2.5/2.0 | 0.46 | 1.3 | 0.19 | 1.2 | 0.18 | 0.46 | 0.49 | 0.17 | 8.2 | 1.3 |
| HB-4 | 337 | 32 | 57 | 5.6 | 20 | 3.1/2.9 | 0.47 | 2.8 | 0.43 | 2.5/2.1 | 0.48 | 1.3 | 0.19 | 1.3 | 0.18 | 0.4 | 0.43 | 0.21 | 6.9 | 1.1 |
| HB-5 | 260 | 24 | 40 | 4.0 | 14 | 2.4/2.3 | 0.41 | 2.3 | 0.43 | 2.4/2.1 | 0.47 | 1.3 | 0.19 | 1.3 | 0.19 | 0.31 | 0.49 | 0.14 | 5.3 | 1.1 |
| HB-6 | 236 | 14 | 25 | 2.8 | 9.5 | 1.9/1.7 | 0.35 | 1.6 | 0.29 | 1.9/1.6 | 0.38 | 1.0 | 0.17 | 1.1 | 0.16 | 0.25 | 0.62 | 0.16 | 4.3 | 1.3 |
| HB-7 | 194 | 11 | 25 | 2.9 | 9.8 | 2.0/1.7 | 0.32 | 1.7 | 0.3 | 1.9/1.6 | 0.39 | 1.1 | 0.17 | 1.2 | 0.17 | 0.37 | 0.68 | 0.14 | 5.8 | 2.1 |
| HB-8 | 274 | 12 | 25 | 3.1 | 11 | 2.0/1.9 | 0.36 | 1.7 | 0.32 | 2.3/1.6 | 0.41 | 1.1 | 0.19 | 1.3 | 0.20 | 1.9 | 1.2 | 0.26 | 21 | 3.6 |
| HB-9 | 256 | 45 | 69 | 6.4 | 23 | 3.9/3.7 | 0.68 | 3.6 | 0.63 | 3.9/3.0 | 0.69 | 1.9 | 0.31 | 1.9 | 0.28 | 0.66 | 0.92 | 0.20 | 11 | 2.7 |
| HB-10 | 314 | 49 | 73 | 6.6 | 23 | 3.6/3.5 | 0.6 | 3.4 | 0.5 | 2.9/2.4 | 0.62 | 1.5 | 0.22 | 1.5 | 0.22 | 0.59 | 0.52 | 0.13 | 9.4 | 2.0 |
| HB-11 | 251 | 18 | 31 | 3.2 | 10 | 1.8/1.7 | 0.3 | 1.6 | 0.26 | 1.6/1.4 | 0.31 | 0.87 | 0.14 | 0.90 | 0.14 | 0.2 | 0.37 | 0.16 | 3.7 | 0.92 |
| HB-12 | 231 | 13 | 24 | 2.7 | 9.4 | 1.0/1.6 | 0.32 | 1.7 | 0.27 | 1.9/1.51 | 0.35 | 0.97 | 0.16 | 1.0 | 0.16 | 0.38 | 0.48 | 0.18 | 4.4 | 0.98 |
| HB-13 | 229 | 18 | 29 | 3.0 | 10 | 1.4/1.7 | 0.31 | 1.6 | 0.26 | 1.6/1.4 | 0.31 | 0.91 | 0.13 | 0.90 | 0.14 | 0.3 | 0.42 | 0.18 | 5.0 | 1.2 |
| HB-14 | 171 | 12 | 20 | 2.2 | 8.2 | 145/1.4 | 0.26 | 1.5 | 0.22 | 1.5/1.3 | 0.31 | 0.89 | 0.12 | 0.83 | 0.14 | 0.32 | 0.42 | 0.11 | 3.6 | 0.94 |
| HB-15 | 207 | 4.7 | 13 | 1.9 | 7.8 | 1.6/1.4 | 0.3 | 1.3 | 0.22 | 1.3/1.3 | 0.27 | 0.73 | 0.11 | 0.70 | 0.11 | 0.12 | 0.23 | 0.21 | 1.8 | 0.49 |
| HB-16 | 164 | 13 | 21 | 2.2 | 7.8 | 1.4/1.3 | 0.25 | 1.2 | 0.19 | 1.2/1.1 | 0.31 | 0.65 | 0.10 | 0.67 | 0.10 | 0.18 | 0.31 | 0.16 | 2.5 | 0.55 |
| HB-17 | 203 | 29 | 43 | 4.2 | 16 | 2.1/2.3 | 0.37 | 1.9 | 0.26 | 1.6/1.4 | 0.31 | 0.85 | 0.14 | 0.87 | 0.12 | 0.27 | 0.35 | 0.11 | 3.5 | 0.71 |
| HB-18 | 115 | 20 | 38 | 4.3 | 16 | 3.1/2.8 | 0.54 | 2.6 | 0.51 | 3.7/3.1 | 0.69 | 1.9 | 0.26 | 1.7 | 0.24 | 0.66 | 1.2 | 0.20 | 7.3 | 3.1 |
| HB-19 | 473 | 43 | 78 | 8.0 | 31 | 5.0/4.7 | 0.77 | 4.0 | 0.72 | 5.2/4.5 | 1.2 | 3.6 | 0.48 | 3.2 | 0.48 | 2.2 | 1.8 | 0.36 | 18 | 5.7 |
| HB-20 | 413 | 41 | 74 | 8.2 | 29 | 4.9/4.5 | 0.79 | 4.2 | 0.77 | 5.3/4.7 | 1.2 | 3.3 | 0.48 | 3.3 | 0.48 | 2.0 | 1.7 | 0.46 | 18 | 5.3 |
| HB-21 | 475 | 48 | 90 | 10 | 42 | 7.7/6.5 | 1.1 | 6.3 | 0.99 | 6.5/5.6 | 1.3 | 3.6 | 0.52 | 3.5 | 0.52 | 2.0 | 1.8 | 0.38 | 19 | 3.8 |
| HB-22 | 515 | 51 | 98 | 11 | 49 | 9.6/7.6 | 1.3 | 6.9 | 1.1 | 7.6/6.2 | 1.5 | 3.9 | 0.55 | 3.7 | 0.54 | 2.1 | 1.9 | 0.39 | 18 | 3.9 |
| HB-23 | 288 | 29 | 56 | 6.8 | 26 | 5.9/6.0 | 1.5 | 5.1 | 1.1 | 7.3/5.9 | 1.5 | 4.0 | 0.57 | 3.8 | 0.54 | 1.3 | 0.81 | 0.28 | 14 | 6.0 |
| HB-24 | 621 | 75 | 146 | 16 | 51 | 7.1/7.6 | 1.3 | 6.6 | 1.2 | 7.8/6.6 | 1.6 | 4.7 | 0.68 | 4.6 | 0.69 | 2.3 | 2.2 | 0.62 | 22 | 4.9 |
| World Coal a | 150 | 11 | 23 | 3.5 | 12 | 2.0 | 0.47 | 2.7 | 0.32 | 2.1 | 0.54 | 0.93 | 0.31 | 1.0 | 0.20 | 0.28 | 1.1 | 0.63 | 3.3 | 2.4 |
| World Clay b | 460 | 48 | 75 | 10 | 36 | 8.0 | 1.2 | 5.8 | 0.83 | 4.4 | 0.90 | 1.9 | 0.50 | 2.5 | 0.39 | 1.4 | 2.6 | 1.3 | 14 | 4.3 |
Notes: a, averages for world coals, data from Ketris and Yudovich, 2009 [69]; b, averages for world clay, data from Grigoriev, N.A., 2009 [90]; x/y, test data/corrected data calculated by interpolation. Note that because the test values of Sm and Dy are abnormal, in this paper, they are corrected by interpolation. The calculation formula of the corrected data is as follows: Sm = SmN * the concentration of Sm in the upper continental crust (UCC) [91]; SmN = 0.5 * (NdN + EuN); Dy = DyN * the concentration of Dy in the upper continental crust (UCC) [91]; DyN = 0.5 * (TbN + YN); NdN, EuN, TbN, and YN, the ratios of Nd, Eu, Tb, and Y values (tested data) to those in the upper continental crust, respectively.
Table 6.
REY geochemical parameters for the No. 21 coal and non-coal samples from the Hebi No. 6 mine.
Table 6.
REY geochemical parameters for the No. 21 coal and non-coal samples from the Hebi No. 6 mine.
| Sample | ΣLREY | ΣMREY | ΣHREY | ΣREY | LaN/LuN | LaN/SmN | GdN/LuN | EuN/EuN* | CeN/CeN* | δY |
|---|---|---|---|---|---|---|---|---|---|---|
| HB-1 | 67.13 | 12.34 | 2.39 | 81.86 | 1.61 | 1.70 | 1.10 | 0.78 | 0.89 | 0.79 |
| HB-2 | 67.85 | 19.05 | 3.84 | 90.74 | 0.93 | 1.18 | 0.94 | 0.80 | 0.92 | 0.82 |
| HB-3 | 73.69 | 17.40 | 3.31 | 94.40 | 1.28 | 1.34 | 1.01 | 0.80 | 0.92 | 0.95 |
| HB-4 | 117.08 | 17.85 | 3.40 | 138.32 | 1.94 | 1.59 | 1.34 | 0.79 | 0.95 | 0.89 |
| HB-5 | 84.78 | 17.80 | 3.38 | 105.97 | 1.35 | 1.51 | 1.02 | 0.80 | 0.92 | 0.94 |
| HB-6 | 52.48 | 13.84 | 2.86 | 69.18 | 0.90 | 1.11 | 0.83 | 0.94 | 0.91 | 0.92 |
| HB-7 | 50.76 | 14.02 | 2.97 | 67.74 | 0.71 | 0.87 | 0.81 | 0.83 | 0.99 | 0.92 |
| HB-8 | 52.66 | 14.25 | 3.21 | 70.12 | 0.64 | 0.86 | 0.72 | 0.88 | 0.95 | 0.85 |
| HB-9 | 146.55 | 24.65 | 5.06 | 176.26 | 1.72 | 1.73 | 1.08 | 0.86 | 0.90 | 0.84 |
| HB-10 | 155.13 | 20.19 | 4.00 | 179.32 | 2.39 | 2.03 | 1.29 | 0.85 | 0.89 | 0.76 |
| HB-11 | 64.20 | 12.05 | 2.35 | 78.60 | 1.43 | 1.54 | 1.02 | 0.86 | 0.92 | 0.96 |
| HB-12 | 50.75 | 13.92 | 2.67 | 67.35 | 0.89 | 1.07 | 0.93 | 0.90 | 0.92 | 1.02 |
| HB-13 | 60.74 | 12.48 | 2.40 | 75.61 | 1.37 | 1.51 | 0.97 | 0.89 | 0.88 | 1.02 |
| HB-14 | 43.21 | 11.77 | 2.29 | 57.26 | 0.92 | 1.22 | 0.89 | 0.91 | 0.87 | 0.98 |
| HB-15 | 29.26 | 11.80 | 1.92 | 42.98 | 0.47 | 0.46 | 1.004 | 0.98 | 0.99 | 1.18 |
| HB-16 | 44.42 | 9.80 | 1.84 | 56.06 | 1.30 | 1.38 | 0.95 | 0.95 | 0.88 | 0.82 |
| HB-17 | 94.07 | 12.54 | 2.29 | 108.90 | 2.58 | 2.06 | 1.31 | 0.93 | 0.87 | 1.00 |
| HB-18 | 81.75 | 28.09 | 4.70 | 114.53 | 0.88 | 0.96 | 0.92 | 0.85 | 0.94 | 1.09 |
| HB-19 | 165.45 | 42.05 | 8.98 | 216.48 | 0.96 | 1.28 | 0.71 | 0.79 | 0.96 | 0.97 |
| HB-20 | 157.33 | 43.97 | 8.69 | 209.99 | 0.91 | 1.25 | 0.74 | 0.79 | 0.91 | 1.02 |
| HB-21 | 197.18 | 51.11 | 9.53 | 257.82 | 0.99 | 0.93 | 1.02 | 0.78 | 0.94 | 0.98 |
| HB-22 | 219.43 | 55.75 | 10.18 | 285.36 | 1.00 | 0.80 | 1.07 | 0.74 | 0.94 | 0.96 |
| HB-23 | 123.32 | 52.92 | 10.33 | 186.57 | 0.56 | 0.73 | 0.80 | 1.18 | 0.92 | 0.92 |
| HB-24 | 293.61 | 59.96 | 12.33 | 365.90 | 1.17 | 1.60 | 0.81 | 0.86 | 0.97 | 0.96 |
| Av-coal | 76.83 | 17.72 | 3.43 | 97.99 | 1.26 | 1.31 | 1.00 | 0.88 | 0.92 | 0.93 |
Notes: Units of LREY, MREY, HREY, and REY are μg/g; EuN/EuN* = EuN/(SmN × 0.67) + (TbN × 0.33)]; CeN/CeN* = CeN/(0.5*LaN + 0.5*PrN); δY = YN/HoN [93]; Av, average value.
Table 7.
Element affinities between the concentrations of elevated elements and the ash yield or selected elements in coal samples.
Table 7.
Element affinities between the concentrations of elevated elements and the ash yield or selected elements in coal samples.
| Correlation with Ash Yield | |
|---|---|
| Group 1: rash = 0.70–1.00 | Li (0.87), Ga (0.87), Nb (0.91), Th (0.76), SiO2 (0.98), TiO2 (0.81), Al2O3 (0.97), K2O (0.80) |
| Group 2: rash = 0.4–0.69 | Fe2O3 (0.50), Pb (0.78, 0.49 *) |
| Group 3: rash < 0.4 | CaO (0.28), REY (0.34), Sr (-0.38), Na2O (-0.33) |
| Aluminosilicate Affinity | |
| rAl–Si = 0.70–1.00 | Li, Ga, Nb, Th, TiO2, K2O |
| rAl–Si = 0.4–0.69 | Pb |
| rAl–Si < 0.4 | Fe2O3, REY |
| Correlation Coefficients between Selected Elements | |
| Li–Ga 0.75, Nb–Ga 0.83, Nb–Li 0.91, Pb–Li 0.48, Pb–Ga 0.84, Th–Nb 0.90, Th–Li 0.90, REY–Li 0.29 | |
Notes: rash, correlation of elements with ash yield; rAl-Si, correlation of elements with Al2O3 and SiO2; the numbers in brackets are the correlation coefficients; *, the correlation coefficients of the two points in high-ash areas were not included.
© 2020 by the authors. Licensee MDPI, Basel, Switzerland. This article is an open access article distributed under the terms and conditions of the Creative Commons Attribution (CC BY) license (http://creativecommons.org/licenses/by/4.0/).
Share and Cite
MDPI and ACS Style
Wei, Y.; He, W.; Qin, G.; Fan, M.; Cao, D. Lithium Enrichment in the No. 21 Coal of the Hebi No. 6 Mine, Anhe Coalfield, Henan Province, China. Minerals 2020, 10, 521. https://doi.org/10.3390/min10060521
AMA Style
Wei Y, He W, Qin G, Fan M, Cao D. Lithium Enrichment in the No. 21 Coal of the Hebi No. 6 Mine, Anhe Coalfield, Henan Province, China. Minerals. 2020; 10(6):521. https://doi.org/10.3390/min10060521
Chicago/Turabian StyleWei, Yingchun, Wenbo He, Guohong Qin, Maohong Fan, and Daiyong Cao. 2020. "Lithium Enrichment in the No. 21 Coal of the Hebi No. 6 Mine, Anhe Coalfield, Henan Province, China" Minerals 10, no. 6: 521. https://doi.org/10.3390/min10060521
Note that from the first issue of 2016, this journal uses article numbers instead of page numbers. See further details here.