Review

SEM-Based Automated Mineralogy and Its Application in Geo- and Material Sciences

1
Institute of Mineralogy, Economic Geology and Petrology, TU Bergakademie Freiberg, Brennhausgasse 14, D-09599 Freiberg, Germany
2
ERZLABOR Advanced Solutions GmbH, Halsbrücker Str. 34, D-09599 Freiberg, Germany
*
Author to whom correspondence should be addressed.
Minerals 2020, 10(11), 1004; https://doi.org/10.3390/min10111004
Submission received: 30 September 2020 / Revised: 8 November 2020 / Accepted: 9 November 2020 / Published: 11 November 2020

Abstract

:
Scanning electron microscopy based automated mineralogy (SEM-AM) is a combined analytical tool initially designed for the characterisation of ores and mineral processing products. Measurements begin with the collection of backscattered electron (BSE) images and their handling with image analysis software routines. Subsequently, energy dispersive X-ray spectra (EDS) are gained at selected points according to the BSE image adjustments. Classification of the sample EDS spectra against a list of approved reference EDS spectra completes the measurement. Different classification algorithms and four principal SEM-AM measurement routines for point counting modal analysis, particle analysis, sparse phase search and EDS spectral mapping are offered by the relevant software providers. Application of SEM-AM requires a high-quality preparation of samples. Suitable non-evaporating and electron-beam stable epoxy resin mixtures and polishing of relief-free surfaces in particles and materials with very different hardness are the main challenges. As demonstrated by case examples in this contribution, the EDS spectral mapping methods appear to have the most promising potential for novel applications in metamorphic, igneous and sedimentary petrology, ore fingerprinting, ash particle analysis, characterisation of slags, forensic sciences, archaeometry and investigations of stoneware and ceramics. SEM-AM allows the quantification of the sizes, geometries and liberation of particles with different chemical compositions within a bulk sample and without previous phase separations. In addition, a virtual filtering of bulk particle samples by application of numerous filter criteria is possible. For a complete mineral phase identification, X-ray diffraction data should accompany the EDS chemical analysis. Many of the materials which potentially could be characterised by SEM-AM consist of amorphous and glassy phases. In such cases, the generic labelling of reference EDS spectra and their subsequent target component grouping allow SEM-AM for interesting and novel studies on many kinds of solid and particulate matter which are not feasible by other analytical methods.

1. Introduction

During the last decade, software developments in Scanning Electron Microscopy (SEM) provoked a notable increase of applications to the study of solid matter. The mineral liberation analysis for the optimisation of mineral processing of metal ores is the economic and thus important drive for innovations which led to various SEM application software versions. These combine the assessment of the backscattered electron (BSE) image to the directed steering of the electron beam for energy dispersive X-ray spectroscopy (EDS) to various measurement routines of Automated Mineralogy applications. The term Automated Mineralogy (AM) does not have a proper definition and is used in somewhat varying meanings. However, as artificial materials can be analysed by this technology too, Automated Materials Characterisation may be used in addition. The term Auto-SEM-EDS can delineate the instrumental combination. Despite a wide distribution of SEM instruments in material research, geosciences and industry, the potential of SEM-based Automated Mineralogy (SEM-AM) is still under-utilised. Characterisation of primary ores, and the optimisation of comminution, flotation, mineral concentration and metallurgical processes in the mining industry by generating quantified reliable data is still the major application field of SEM-AM [1,2,3,4,5,6,7,8]. However, there arises interesting economic and scientific potential beyond the classical fields. Geometallurgy, ore fingerprinting and applications in petrology are still closely related topics [9,10,11,12,13,14]. Slags, pottery, stoneware and artefacts can be studied in an archaeological context for recognition of provenance and trade routes, but also for the better understanding of their production processes [15,16,17,18]. Soil and solid particles of all kinds are objects in forensic science [19,20,21]. SEM-based Automated Mineralogy allows novel insight in the fields of process chemistry and recycling technology [22,23,24].
Here, we refer to the main and principle hard- and software components and their combinations to the advanced SEM-based Automated Mineralogy, beyond the pioneering compilations [2,14,25,26,27,28,29,30,31,32]. Potentials and limits of the SEM-AM technology are presented in case studies dealing with metamorphic petrology, ore fingerprinting, slags and firing experiments on archaeological pottery.

2. Principles and Limits of SEM-Based Automated Mineralogy

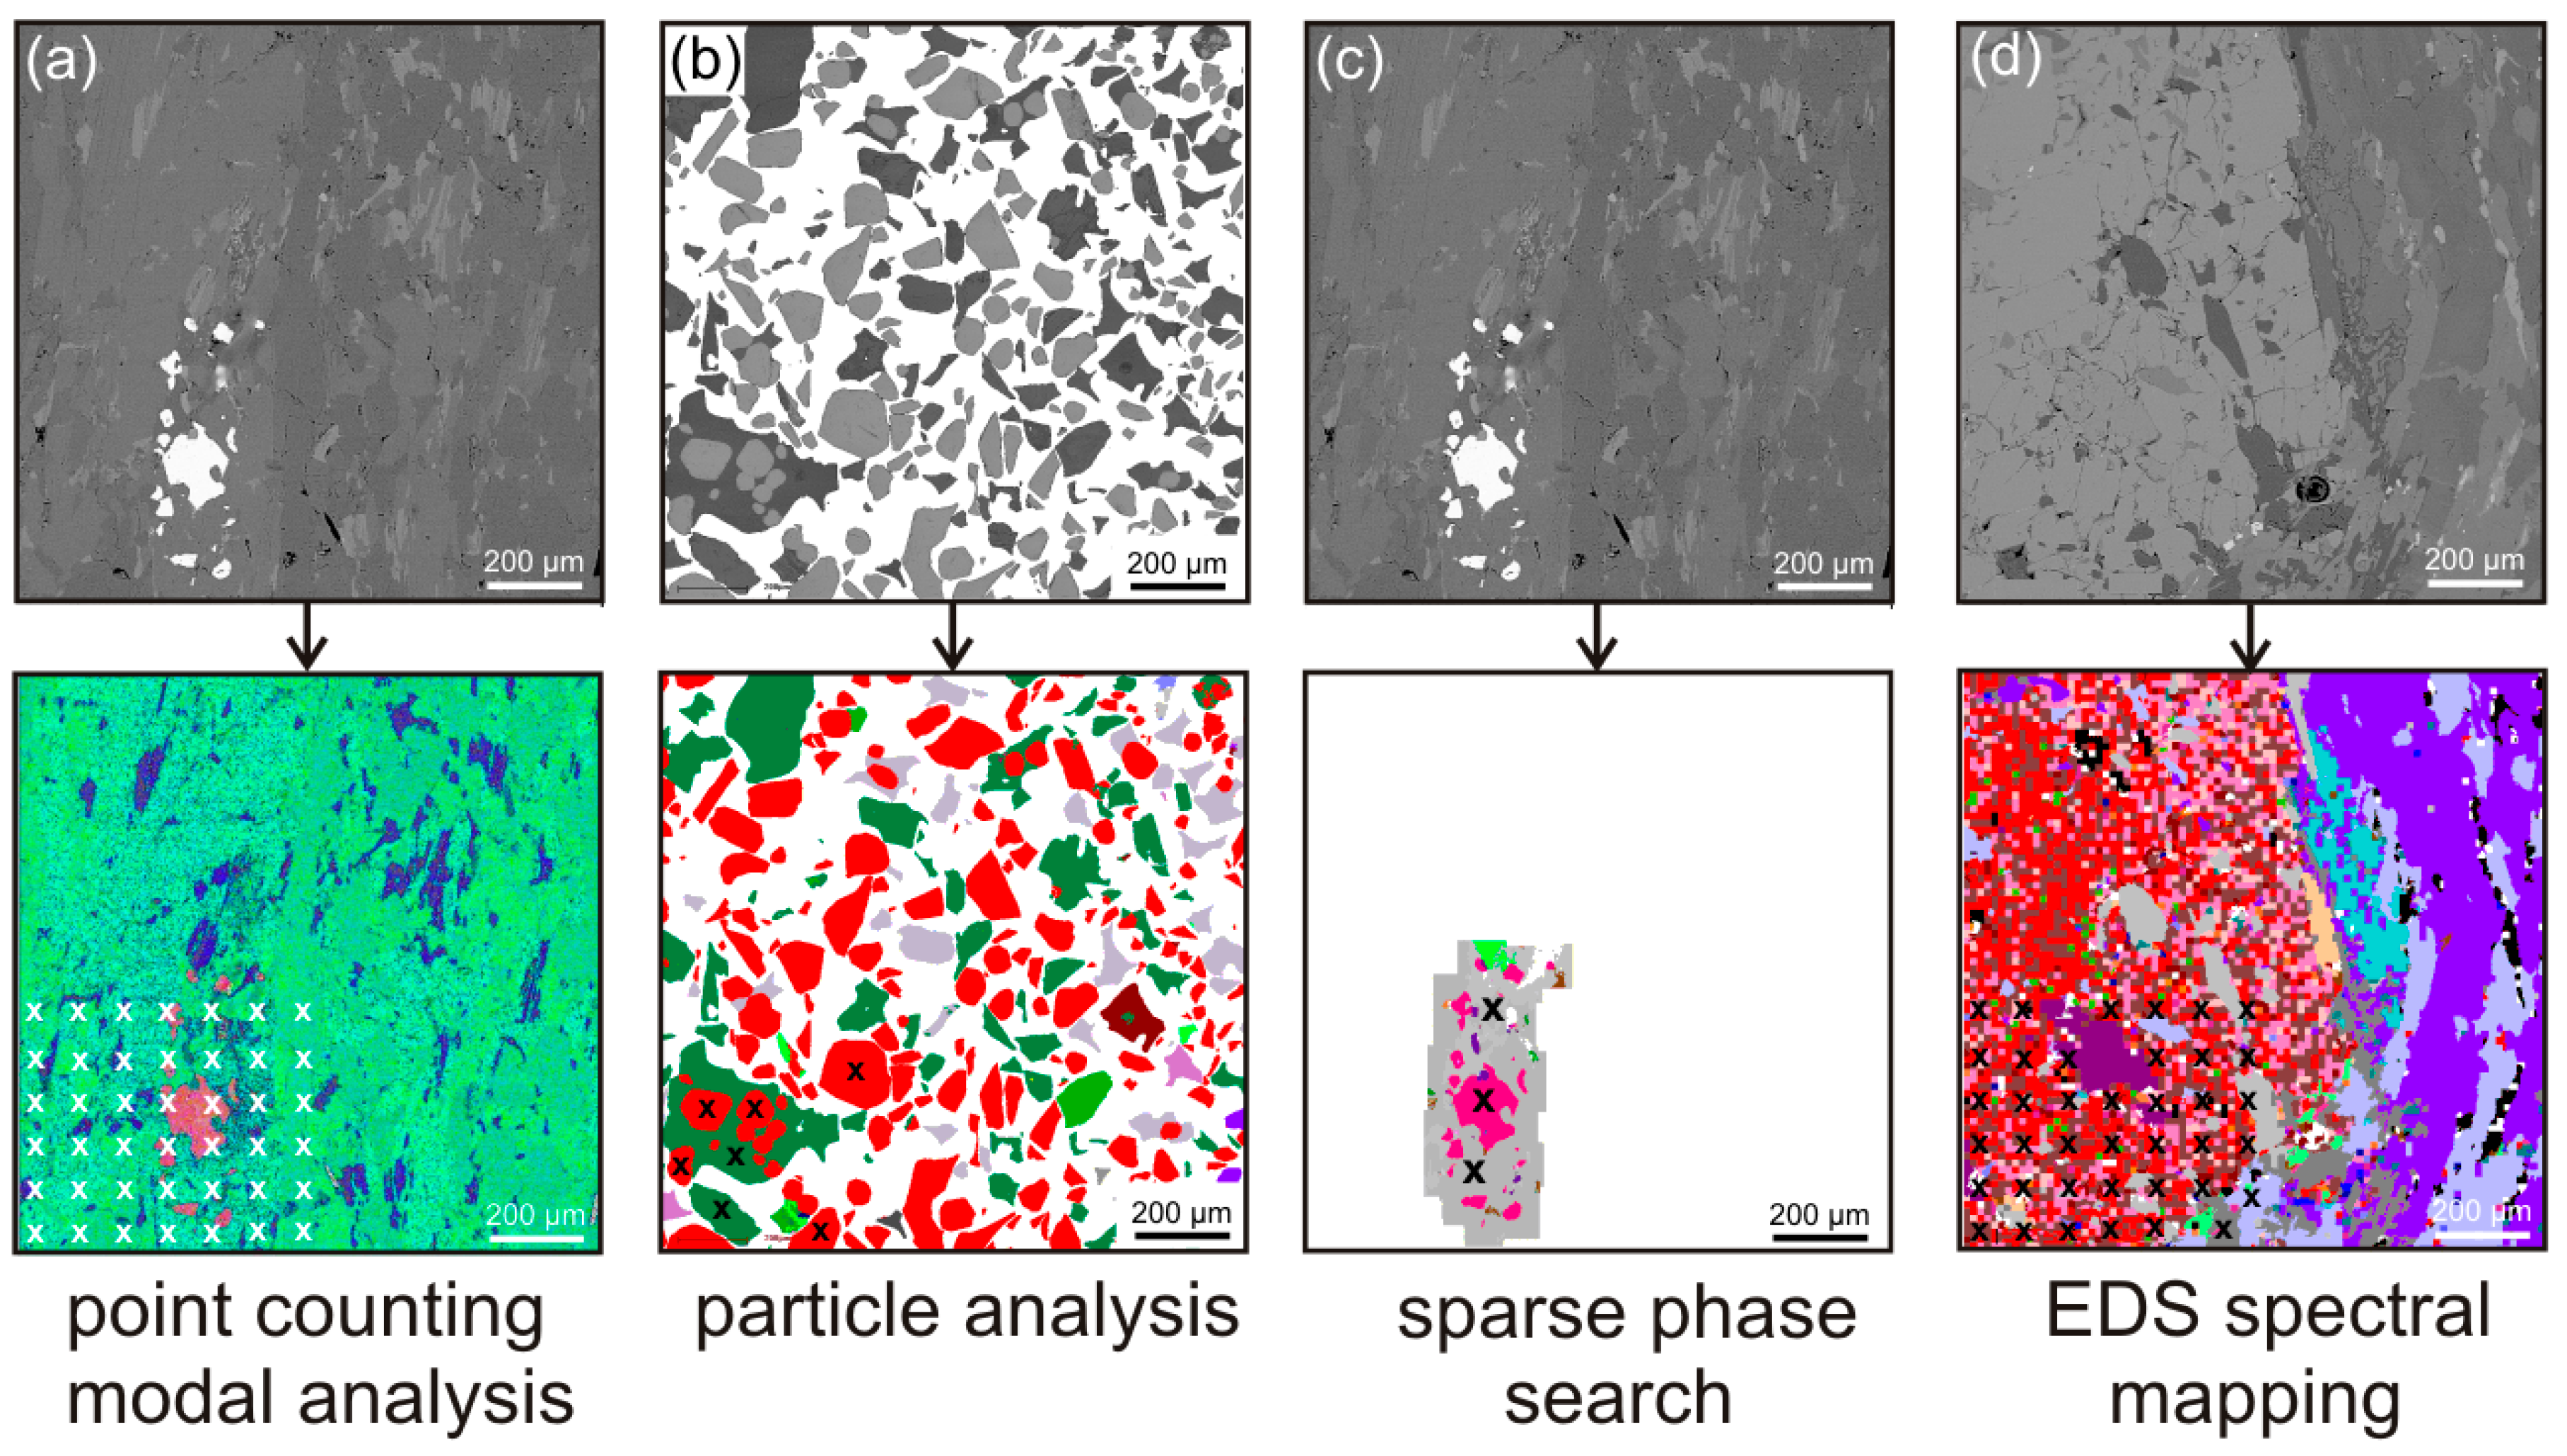
2.1. Basic Measurement Routines

Common to all SEM-AM systems is the combination of a hardware platform and a specific image analysis and processing software. Almost every scanning electron microscope (SEM) can be used as a hardware platform for AM. For the use in AM, the SEM needs additional internal main boards and must have a high vacuum operation mode. The required pressure range is on the order of 10−5 to 10−7 Pa. Tungsten cathodes and field emission guns are offered as the electron sources. As long-term stability of the electron beam is required for automated measurements, the field emission guns can be recommended, but tungsten cathodes are economically favourable. SEMs for automated mineralogy are often equipped with two or more EDS spectrometers to increase the count rate of X-rays and subsequently the speed of analysis. A large sample chamber is advantageous to allow a larger number of samples to be analysed in one measurement session. The SEM should have a very accurate stage movement which allows a precise positioning in small intervals. An excellent BSE detector is crucial for good analysis results. The BSE image quality and especially BSE image stability is a critical factor for SEM-AM analysis, as the image is used, in combination with the EDS spectrum, for mineral or phase discrimination. To allow constant BSE image grey levels, fixed working distances must be set prior to measurement. This ensures that a specific mineral or phase always has the same BSE image grey level, as long the image calibration is constant. Usually, the BSE image grey level can be calibrated with reference materials with different BSE grey levels, as gold (very bright), copper (intermediate) and quartz (dark grey). When copper or quartz are used for the BSE image grey level calibration, then particulate materials with dark or intermediate BSE grey levels as many industrial ashes or slags (reported below) are better resolved in the images.
The BSE image analysis and processing software controls the automated to semi-automated measurements and allows thorough data processing and comprehensive results extraction. After the collection of a BSE image for a given frame or area, several steps of image processing are performed. As an example, the FEI-MLA software (version 3.1.4, FEI Company, Hillsboro, OR, USA) versions involve:
(1)
Background removal
(2)
De-agglomeration
(3)
Clean-up of undersized particles and/or of particles touching the frame boundary
(4)
Segmentation of internal particle structures
For the background removal, different values of BSE grey level can be defined. The de-agglomeration step uses specific particle shape factors like circle ratio, rectangular ratio and a combined circle and rectangular ratio to determine if particles are agglomerated. Subsequent routines are performed for their separation. The clean-up function allows the deletion of undersized particles prior to the EDS measurement. Removal of particles touching the frame boundary will avoid artefacts in grain size distribution measurement. At the final segmentation step, the grain boundaries in a particle are determined based on BSE grey level differences. This step also removes any polishing artefacts from the image such as cracks or holes in the particles. A high-quality polished surface is essential for the segmentation procedure. The image processing routines offer variable software functions for the handling of these image analysis procedures. In addition, these image processing steps can be arranged in variable sequences and different weighting in dependence of the sample properties. The design of the image processing routines mostly targets the fast treatment of granular samples of ore and gangue minerals as encountered in mineral processing studies. In non-granular samples with closed surfaces such as petrographic thin sections or plates, most of the image processing steps cannot be performed or will need a specific and adapted software solution. Four principal measurement routines, starting with the collection of a BSE image with a calibrated grey tone level, can be outlined for SEM-AM technology (Figure 1):
(1) The classical point counting method in which mineral or phase identification is determined by one EDS analysis at each counting point (Figure 1a). This measurement uses the BSE imaging merely to discriminate particle matter from background and then collects one EDS spectrum from each grid point across the sample. This method only produces modal mineralogy information, such as the percentages of the mineral or phase components of the sample. The point counting can also be implemented to produce a line scan measurement mode that produces traditional linear intercept data. EDS spectra are taken at a step size of one pixel in the x-direction and a user-defined y-interval determines the line spacing. Typically, ~104–106 EDS spectra are taken at a fixed step size (for example 10 µm) per sample. The grid step size can be chosen in dependence on the required resolution. This routine does not gather particle sizes and shapes. However, visual information can be taken from the BSE image which is stored during measurement. A summary of the mineral modal compositions in area % and in wt% can be recalculated by introducing an area to each point of the grid and average densities listed in mineral databases for each sort of EDS spectrum, respectively. A calculated chemical assay can be derived from the mineral mode, densities and quantified mineral chemical compositions for each EDS spectrum. The calculated assays represent an approximation of the bulk rock composition in the analysed sample surface area and may differ from the bulk composition gained from a larger volume of material.
(2) Particle analysis by EDS (Figure 1b) has been developed for fast automated characterisation of grain mounts with up to 106 particles, as for example encountered in milled products from mining and mineral processing. Some versions of this method use the BSE images of segmented particles to analyse each segment with a single EDS spectrum, as a particle can be composed by several different grains. The particle analysis uses only a comparably small number of EDS analyses to define all particles in a sample. The geometrical parameters of particles and grains as well as their liberation characteristics are extracted from the acquired data. This measurement routine allows the quantification of sizes, geometries, associations and liberation of particles with different chemical compositions within a bulk sample and without previous phase separations. In contrast, this is not possible by conventional sedimentological particle size and size distribution analysis methods.
(3) Sparse phase search (Figure 1c) combines a backscattered electron (BSE) grey tone value trigger and single spot EDS spectral analysis of grains. Grains are selected to be measured by EDS when they match the grey tone level of the defined and pre-set BSE grey level range. These specific grains of interest can then be measured either with a single EDS analysis or the spectral mapping technique (reported below). Not only the sparse phase grain of interest but also its surrounding minerals or the complete particle are analysed within a pre-set µm-scale range of distance. This is also appropriate for massive rock applications, such as in thin sections and drill cores, where mineral liberation data is not relevant. When the BSE grey level trigger is set to high and bright values, this enables the detection of rare phases with such BSE grey levels, such as gold or platinum group minerals. The method also allows grain counts, phase area estimates, and the recording of geometrical grain parameters of sparse phase grains of interest. However, it does not provide bulk mineralogy information, as only selected particles in the sample are analysed. The selectivity of the sparse phase search measurement is designed to efficiently measure liberation of trace minerals in tailings and low-grade feed ores. The method also can be followed by further routines, as a subsequent imaging and spectral mapping at a higher magnification.
(4) Spectral mapping by EDS (Figure 1d) combines BSE image analysis with EDS spectral mapping. It employs a narrow grid (= mapping) of single EDS spectra on both granular and non-granular samples. The mapping can be performed by defined BSE image grey level triggers or by EDS spectrum triggers. Grains which are not selected for EDS mapping will be analysed with a single EDS spectrum. The method is applied where fine details of mineral intergrowths are of interest, especially in particles where grains with similar BSE grey levels and thus similar average atomic numbers (z-numbers) but different chemical compositions are associated and thus cannot be segmented. Such features are not applicable by the particle analysis method. In contrast to the point counting method, the geometrical parameters of particles and grains are fully extracted from the BSE image and the related EDS data.

2.2. Software and Hardware Solutions for Measurement Routines

The image analysis and processing software controls the automated to semi-automated measurements and allows thorough data processing and comprehensive results extraction. Most of the AM providers bundle their image analysis software to their own SEM hardware, such as TESCAN, ZEISS and FEI (now part of Thermo Fisher Scientific). Others allow the usage of their software at any hardware, such as the vendors of EDS spectrometers as Oxford Instruments and Bruker. Summaries of software suites, in common use at present, are described in the following.
An important feature which is poorly explained in the software manuals is the classification of the EDS spectra as a mineral or phase. Such a spectrum is generated by the digital pulse processing of the signals from an X-ray-collecting silicon drift detector and expressed by normalised counts/s per channels along the keV scale (Figure 2). Classification means the comparison of such a single sample EDS spectrum to an extensive list of reference EDS spectra. The FEI-MLA software allows a list of 250 reference spectra; other AM systems can handle more spectra or derivational specific parameters. According to this comparison, the sample EDS spectrum is assigned to the matching reference EDS spectrum. For example, a sample EDS spectrum is assigned to “Albite” when it matches a reference EDS spectrum which has been labelled as “Albite” from the reference EDS spectra list. This list of reference EDS spectra can be compiled by various procedures. Reference EDS spectra can be gained from the sample and/or known reference materials and furnished with corresponding mineral names and/or by generic labels derived from elemental analysis [33,34]. It is also possible to build up a list by constructing synthetic reference EDS spectra by suitable software.
QEMSCAN or Quantitative Evaluation of Minerals by SCANning Electron Microscopy (FEI Company, Hillsboro, OR, USA) is the oldest of all AM solutions, but the sale is terminated now. However, QEMSCAN systems are still in use all over the world. The software suite is bundled to the SEM hardware platforms by the FEI Company. The data acquisition has a strict X-ray centric approach. This means that, from each analysis point, both X-ray spectra and BSE grey value are acquired in a measurements grid (comparable to classical point counting). Thus, the level of detail of the analysis is dependent on the distances in the grid of analysis points. While measured, EDS spectra are acquired and saved for each analysis point. The EDS spectra of the measurement are compared against a Species Identification Protocol (SIP). For the SIP, the count rate information from single channels along the keV scale is condensed (Figure 2a). Two methods of SIP to EDS spectrum comparison can be used. The first (and older one) is the peak intensities method, which compares the exact energy ranges of the elements and the number of X-ray photons in the energy range. The second (and younger one) is the concentrations method which simulates the acquired EDS spectrum by a synthetically computed spectrum. Following this, the elemental composition of the synthetic spectrum is calculated. The concentrations of elements present in the calculation for the spectra are compared against the reference calculations in the SIP. For mineral identification, QEMSCAN uses a first match principle (Figure 2a). This means that, when a matching entry in the SIP list is found, the following entries are not considered anymore [35]. The software for data processing and results extraction is powerful and complex but requires an expert user.
Five types of measurement modes can be applied in QEMSCAN measurement software (version 5.3.2., FEI Company, Hillsboro, OR, USA), BMA (Bulk Mineral Analysis), PMA (Particle Mineral Analysis), SMS (Specific Mineral Search), TMS (Trace Mineral Search) and FieldImage/FieldScan. The BMA mode is a one-dimensional line scan measurement mode which collects EDS data from the x-direction in an xy coordinates grid only. Before EDS acquisition, the background is distinguished from the particles using a BSE threshold. Only analysis points falling on a particle are measured. As the full sample area is not measured, but lines of intersection on the particles, BMA is a very fast measurement mode. However, only modal mineralogy, calculated assay, estimated particle and grain sizes and mineral association data are obtained. PMA mode is an EDS mapping measurement mode which analyses the full sample area. A custom mapping resolution can be set by defining the interval of analysis points. A false colour mineral map is stored for every single particle, but not a full field map as in FieldImage mode. Before EDS acquisition, the background is distinguished from the particles using a BSE threshold, so that particles are analysed, but not the background. In PMA mode, all particles are analysed, unless a specific filter criterium, for example, the upper particle size was set. From the PMA measurement mode, the full range of results provided by the QEMSCAN software can be extracted. This includes quantitative modal mineralogy, grain sizes, mineral association data, liberation and locking statistics. The SMS and TMS measurement modes are search modes which can be used to find minerals of interest which are present in low amounts or in traces in the sample material. Only particles containing matching mineral grains will be analysed but not the full sample area. Typical examples for areas of application of the SMS mode are the investigation of sulphides in tailings or the search for penalty element-bearing minerals in concentrates. A typical example for an area of application of the TMS mode is the search for precious metal grains in the sample material. The SMS and TMS modes use a custom BSE grey value as a threshold for searching. For these measurement modes, the analytical procedure is similar to PMA. As only a subpopulation of particles in the sample is analysed, SMS and TMS do not provide bulk mineral information. However, the list of results is similar to PMA, with respect to the mineral selective acquisition of data. The FieldImage mode (also known as FieldScan) is an EDS mapping measurement mode which is typically applied to thin sections or coarse-grained particles. It is comparable with the classical point counting procedure at an optical light microscope. FieldImage analyses the full sample area. From each field, a false colour mineral map is stored, so that a composite image of the sample can be produced after measurement. Before EDS acquisition, the background is distinguished from the particles using a BSE threshold, so that only measurement points falling on particles are analysed. The FieldImage mode allows the quantification of the modal mineralogy but also investigating textures and fabrics of larger samples [25,29,36]
By the MLA or Mineral Liberation Analysis software (FEI Company MLA) for each analysis point, a full EDS spectrum is stored during analysis. After completion of the measurement, the spectra are compared (= classified) against a list of reference EDS spectra. The comparison is performed using a Chi-Square difference test. Here, the full spectrum pattern is compared against all the reference spectra pattern. The sample spectrum classification is based on a best match principle. This means that the sample EDS spectrum will be assigned according to the reference EDS spectrum with the highest matching score or probability according to the Chi-Square difference test (Figure 2b). The matching score or probability of match can be selected and adjusted. When a sample EDS spectrum has no matching reference EDS spectrum within the given probability of match, it will be classified as “unknown”. As the reference EDS spectra can be directly gained from the sample and receive then their labelling from the operator, the compilation of the reference spectra list is comparably time-saving, simple and user-friendly. This considerably facilitates the characterisation of complex artificial materials as slags or ashes. The composition could be qualitatively estimated by an EDS analysis at the same location where the reference EDS spectrum has been gained. However, as not every single elemental peak is compared one-to-one, complex spectrum pattern, showing many peaks or several neighbouring peaks, can cause misidentification. To overcome this issue, advanced classification rules can be used to allow, force or deny specific elements.
Four types of measurement modes can be applied in the FEI-MLA measurement software (version 3.1.4., FEI Company, Hillsboro, OR, USA), the point counting modal analysis XMOD, a particle analysis routine labelled as XBSE, a sparse phase search routine labelled as SPL, and an EDS spectral mapping mode, named as GXMAP. These principal measurement methods are completed by subroutines, which are designed for the automated collection of reference EDS spectra. For the sparse phase measurement method, subroutines including double zoom or combinations with spectral mapping are also available.
Another AM solution software is TIMA-X (TESCAN Integrated Mineral Analyzer TIMA) (TESCAN ORSAY HOLDING, a.s., Brno, Czech Republic). TIMA-X is based on TESCANs MIRA or VEGA SEM platforms. The software was introduced in 2012. Depending on the analysis mode, the sequence of analytical steps is different. Four acquisition modes are available for TIMA-X. In the ‘High Resolution Mapping’ mode (resembling EDS spectral mapping), from every measurement point, the BSE signal is taken first. For points above the background BSE threshold, the EDS spectrum is acquired subsequently. BSE and EDS spectra are collected in the same regular grid. Thus, it is very precise but slow and can be used for analysis of samples having complex textures or when a high mapping resolution is required. The ‘Dot Mapping’ mode starts like ‘High Resolution Mapping’, by collecting the BSE signal in a high-resolution grid. This is followed by the low-resolution EDS spectrum acquisition in a somewhat wider grid than the BSE grid. Again, the BSE signal is used to exclude areas of background, such as epoxy resin, from analysis. The BSE signal is not only used for background removal, but also for particle segmentation. This mode is faster than the ‘High Resolution Mapping’ mode, but still enables precise and detailed analysis results. In the ‘Point Spectrometry’ mode (resembles particle analysis), a high-resolution BSE image grid is collected to detect areas of background and identify areas of constant BSE image grey levels (homogeneous segments) in the particles. Each segment is analysed using a single EDS spectrum acquisition point in the centre of the segment. The whole segment will be assigned to the mineral which corresponds to the composition of the single EDS spectrum point. It should be noted that minerals having similar BSE image grey level, but different chemical composition exist. Thus, the ‘Point Spectrometry’ mode can lead to wrong results if such minerals occur together in a sample. This mode is very fast, but less precise and should be used only if a good BSE image grey level contrast among the phases is ensured. The ‘Line Mapping’ mode starts by acquiring the high-resolution BSE image grid for background and particle segment identification. The EDS spectrum points are placed in short regular distances on horizontal lines. The distance between these lines are larger. After EDS spectrum acquisition, the lines are divided into linear sections using BSE and EDS signal information. This mode has a high analysis speed but does not provide the full set of quantitative textural data, due to the one-dimensional type of analysis. TIMA-X can be operated in four measurement analysis types, in particular, ‘Modal Analysis’, ‘Liberation Analysis’, ‘Bright Phase Search’ and ‘Section Analysis’. The ‘Modal Analysis’ can be used only in ‘High Resolution Mapping’ acquisition mode and is suitable especially for large area samples. ‘Liberation Analysis’ can be used in all four acquisition modes mentioned above. This analysis type is most suitable for particulate materials and delivers modal information, process mineralogy-related parameters such as mineral liberation as well as textural information. The ‘Bright Phase Search’ analysis type can be used to search for rare phases. The BSE signal, chemical composition, or both can be used as a threshold for searching. This analysis type can be used in all acquisition modes, except ‘Line mapping’. ‘Section Analysis’ can be used in all four acquisition modes and is designed for the analysis of thin sections. The classification of the sample EDS spectra is performed already online during the measurement. The mineral or phase identification is performed by comparison of the sample spectra against a library. The library consists of mineral definition rules which can be either determined automatically from standard spectra or are calculated from a theoretical composition or are user-defined. Multiple information can be used here in combination such as BSE image grey levels, EDS spectral counts and/or their ratios. In addition, information from other detectors such as cathodoluminescence (CL) or secondary electrons (SE) can be used for mineral identification. The elemental composition of the minerals can be computed from the EDS spectra directly for library entry, if the theoretical stoichiometric composition does not satisfy. This produces first results already by the time when the analysis is finished. The TIMA-X software has an integrated quantitative EDS analysis which allows the calculation of the elemental composition of minerals directly from TIMA-X measurement data [14,37].
The SEM-AM software (Carl Zeiss Microscopy Ltd., Cambridge, UK) routines labelled as Mineralogic Mining are bundled to the SEM instruments ZEISS SIGMA and EVO. The MinSCAN Ruggedized SEM platform allows the application even in a mine-site environment. Mineralogic Mining features four measurement modes: mapping, spot centroid, feature scan and line scan. A high-resolution BSE image is always taken first. There is a measurement routine which uses the different BSE image grey levels to classify the minerals. As this mode does not acquire EDS spectra, it is the fastest analysis mode. However, there is no published information about the quality of results. The ‘mapping analysis’ is comparable to point counting in optical light microscopy. This full analysis method is accurate but slow. ‘Spot centroid analysis’ is a particle analysis routine and measures the centre of each segment in the BSE-segmented grains within particles. The composition of this analysis point is then assigned to the segment. Due to the low number of analysis points, the analysis is very fast, but susceptible to BSE image grey level related issues (see explanations in section TESCAN-TIMA-X). The ‘feature scan’ mode, an EDS spectral mapping routine also segments the particles, using BSE signal information, but uses an X-ray grid to measure the particles. The EDS spectra of each segment are summarised, and the average composition is assigned to the segment. This mode is placed between ‘mapping analysis’ and ‘spot centroid analysis’ in speed and accuracy. The ‘line scan’ analysis mode measures EDS spectra of points along horizontal lines which go through the centre of the particles. This is a fast analysis mode which provides valid bulk mineralogy results and gives an indication about textural information. The full quantitative EDS spectrum classification is performed already during the measurement. Thus, the analysis results are ready when the analysis is finished. The elemental composition of a mineral is quantified directly from its EDS spectrum [32,38].
The Advanced Mineral Identification and Characterization System AMICS was developed by Ying Gu, the original inventor of Mineral Liberation Analysis (MLA) software (Bruker Nano GmbH, Berlin, Germany), and purchased by Bruker in 2016. There is no direct bundle of AMICS to a hardware platform, as Bruker does not produce SEM instruments. AMICS analysis starts with a high-resolution BSE image acquisition. After several image processing steps, this is followed by EDS spectra acquisition. The mineral identification is performed online during analysis. This allows direct results extraction after analysis. AMICS software allows for calculating relative error for modal data. [39,40]
The INCAMineral software as a part of the INCAFeature particle analysis solution (Oxford Instruments plc, High Wycombe, UK) was launched in 2012. AZtecMineral was introduced in 2019 (Oxford Instruments) and is part of the AZtecFeature particle analysis system. Both products are not SEM bundled but can be used with a wide range of SEM instruments. At the beginning of analysis, a BSE image is taken and processed. This is followed by EDS spectra acquisition. The mineral identification is made online during analysis based on measured chemical composition. The classification can be based on single element measurements or ratios of elements. The results of analysis can be explored in the software but can be exported to HSC Chemistry software too [30,41,42,43].

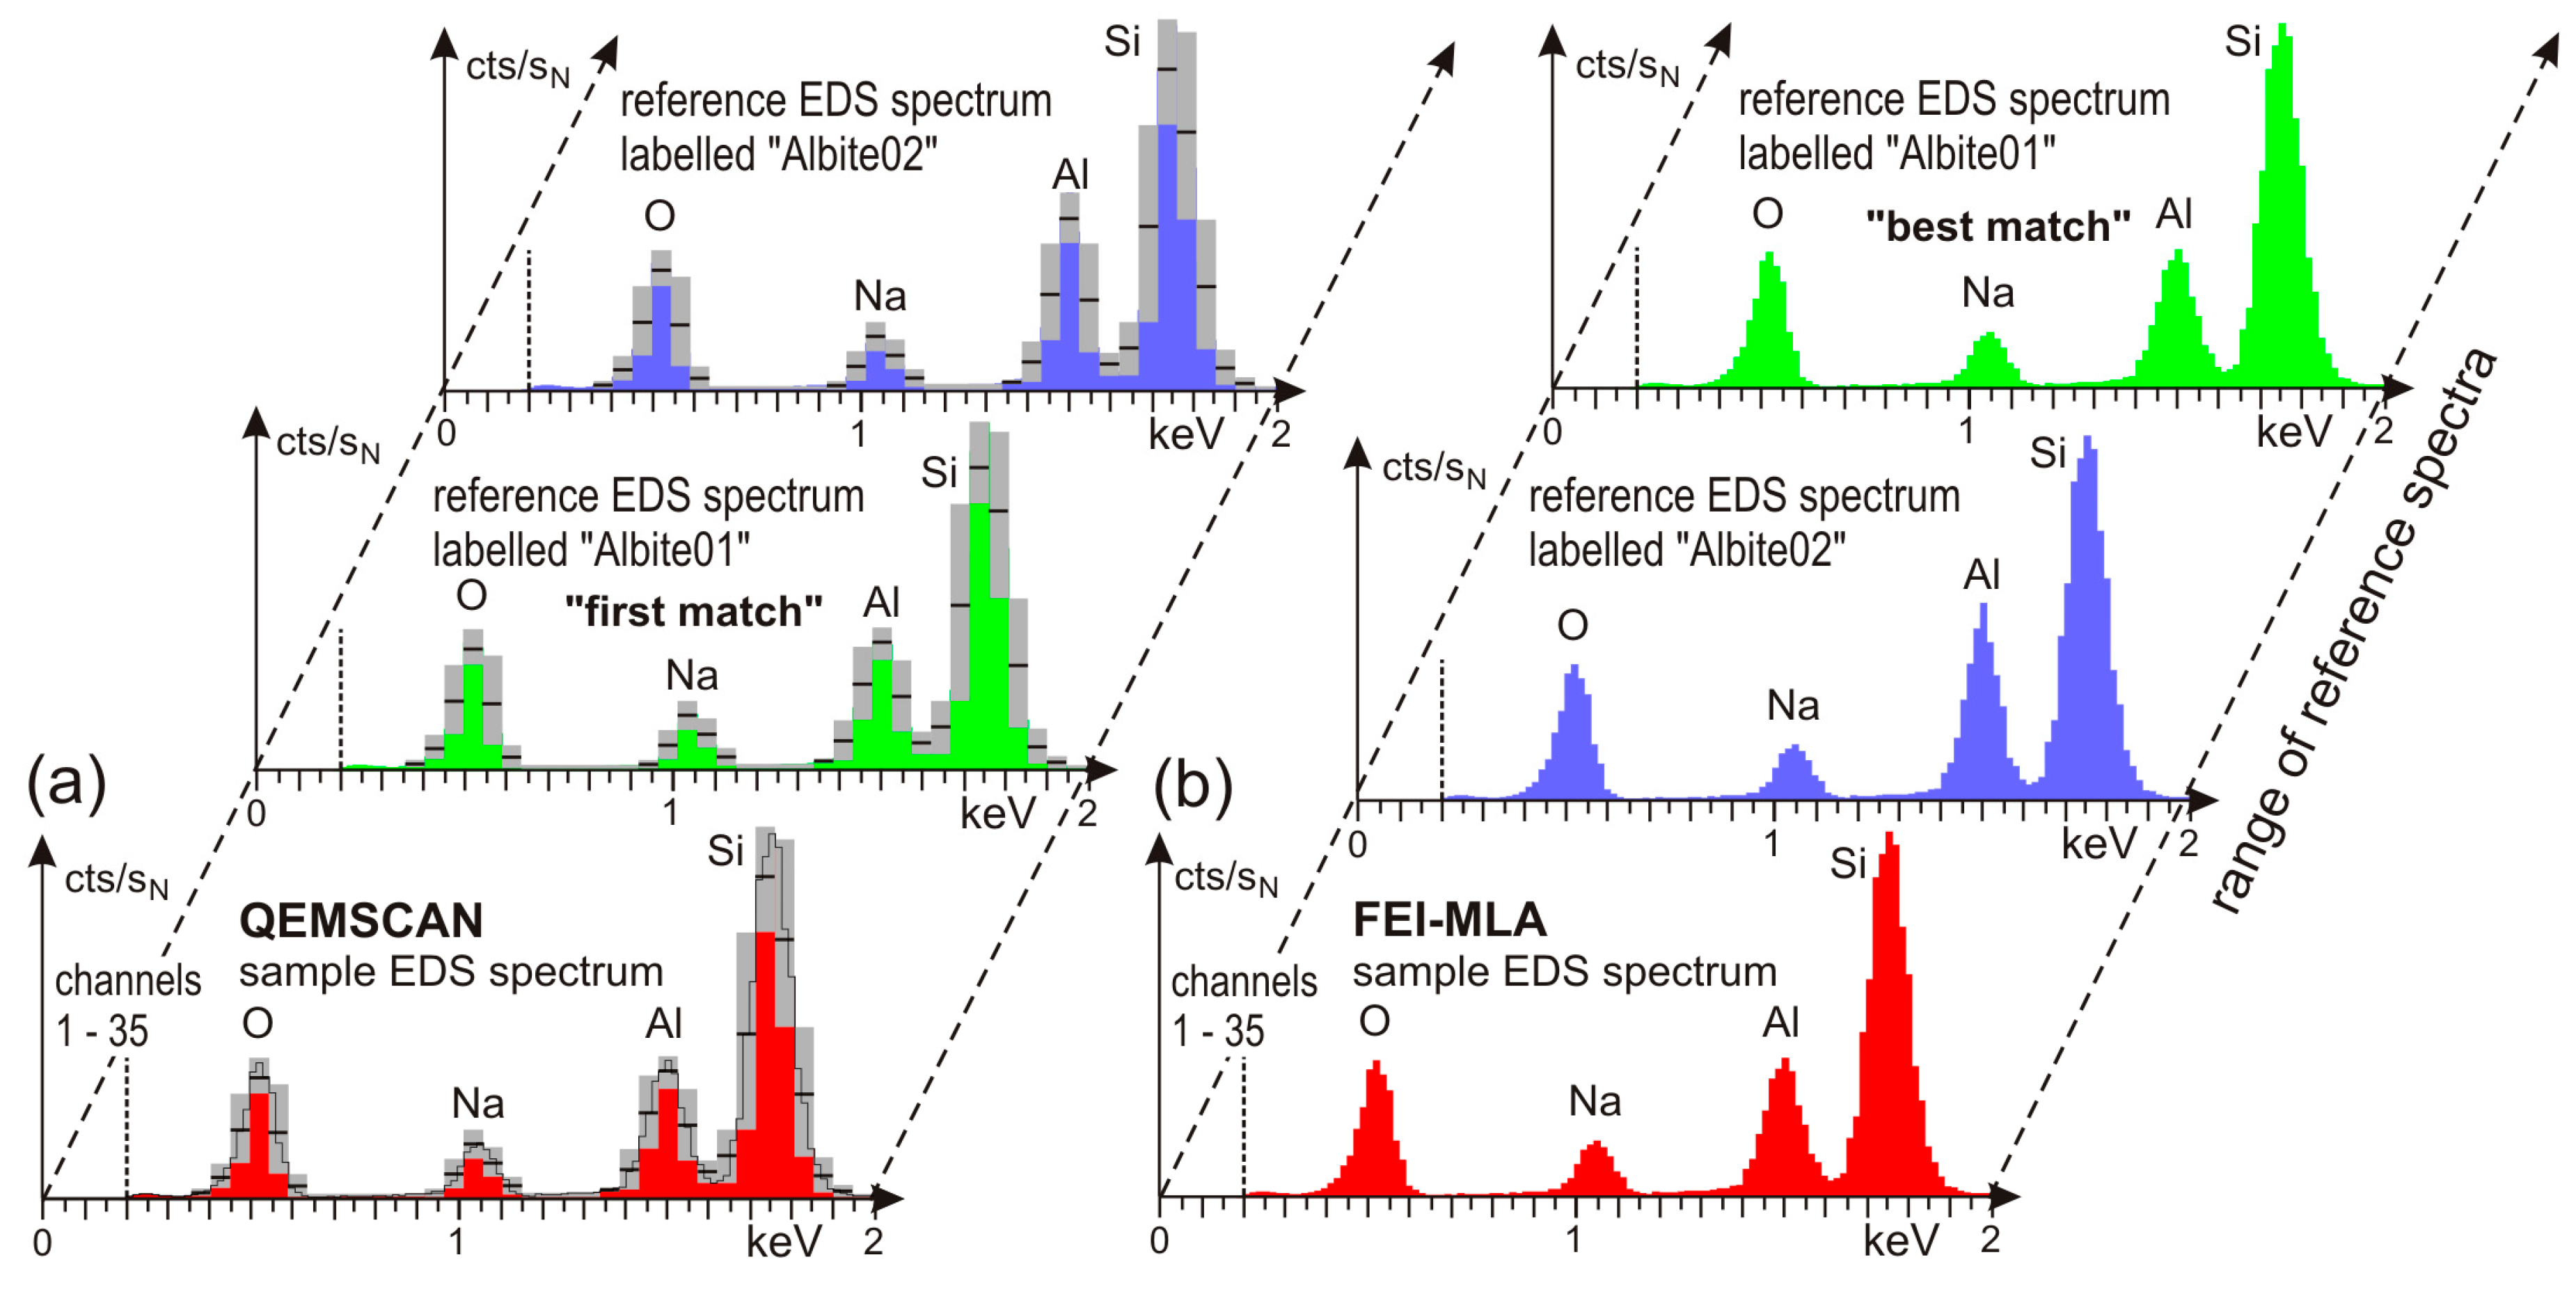
2.3. Uncertainties and Problems of Phase Identification by EDS Spectra

The SEM-based Automated Mineralogy usually claims that minerals can be identified by their EDS spectrum, as is exemplified in Figure 2 by the feldspar mineral albite. However, this cannot be fully correct, as minerals are characterised in the first place by their crystal lattice in XRD and only in the second place by their elemental composition as given by quantification through an EDS spectrum. In consequence, the identification of a mineral or a phase by its EDS spectrum remains incomplete, as it considers only the elemental composition. In addition, an identification by the chemical composition alone is severely hampered by the occurrence of numerous minerals which crystallise as solid solution. There are examples of minerals with identical chemical composition, but different crystal structure, as ilmenite and pseudorutile (reported below). A further challenge of mineral identification and discrimination are minerals having rather similar elemental composition. Magnetite (Fe3O4), for example, is composed of 72 wt% Fe and 28 wt% O, where hematite (Fe2O3) is composed of 70 wt% Fe and 30 wt% O. For both minerals, the EDS spectra look relatively similar and the slight differences in the Fe and O peaks cannot be resolved. In such cases, the BSE image grey level is used as an additional differentiation criterion. However, a specific BSE contrast and brightness calibration is needed for such a measurement.
Another aspect is that the detection range of EDS spectrometers does not cover the whole periodic system of elements. The first light elements, H, He, Li, and Be cannot be detected by EDS spectrometers, due to their design. This causes specific problems in mineral identification. Hydrogen and/or water are components of numerous minerals. As they cannot be detected, minerals such as gypsum (CaSO4·2H2O) and anhydrite (CaSO4) cannot be differentiated. In addition, albite cannot be distinguished from zeolites that contain H2O (Figure 3a,b). Thus, a naming of the phase in the form of ‘mineral A/mineral B’ is required, in order to show that it can be either the one or the other. The elements lithium and beryllium occur in several minerals in significant amounts. As both are not detectable by EDS, additional data, such as X-ray diffraction (XRD) analysis or XRF bulk sample composition, are required to identify the Li or Be-bearing minerals. Fortunately, the majority of Li or Be-bearing minerals have often characteristic other elemental ratios outside of Li and Be, so that they can be identified and differentiated by these specific characteristics. For the lithium-bearing minerals petalite and spodumene, this has been shown [44], as they can be distinguished by their different Si/Al ratios (Figure 3c,d). The micas are a mineral family with a wide range of solid solution along different single and coupled element substitution vectors combined to the occasional occurrence of lithium (Figure 3e,f). Mineralogical expertise is required here for a clarification. There are numerous examples of complex composed minerals in nature, as for instance the REE-bearing minerals [33]. Such minerals have numerous peaks und subpeaks of EDS at different energy levels (Figure 3h). Additionally, the REE-bearing mineral groups are characterised by the occurrence of H2O, CO3 and F at low energy levels, whereas the peaks for the light REE show considerable interferences at intermediate energy levels (Figure 3h). Phases showing numerous peaks in their EDS spectrum can be expected in artificial products, as slags or ashes too (Figure 3g). Such phases often consist of glass or amorphous material which cannot be characterised and identified by XRD. In such cases, not a mineral naming but a generic labelling of the reference EDS spectra offers a pathway for the successful characterisation of these materials by SEM-AM [33,34].

3. Sample Preparation and Related Issues

An optimal sample preparation is a crucial step for any SEM-AM analytical success. There are several possible sample types that can be analysed with SEM-AM. It depends on the size of the SEM sample chamber and the configuration of the holder systems. For granular and particulate matter, preparations as grain mounts in round epoxy blocks with 25, 30 and 40 mm in diameter are mostly used. Petrographic glass-mounted thin or thick sections (standard size is 48 × 28 mm) are often used for preparation of compact and massive matter as rocks. It is also possible to produce thin grain mounts with 25 mm in diameter on glass. It is necessary that round blocks and samples on glass can be mounted parallel to the BSE detector and perpendicular to the electron beam.
For samples of granular, particulate and non-compact matter, as broken, grinded or hand-picked single grains, the grain mounts in epoxy blocks are the best form to prepare [45]. Because most of the AM software packages are not able to separate grains with the same grey scale in the BSE image, it is useful to stir graphite (quality fine and pure) as a distance material into the epoxy resin blocks [45,46]. Some granular sample materials show a wide range of densities among the phases. Thus, when the material is stirred with the graphite-saturated epoxy resin, there will occur phase separation with gradation of particles with high densities and with large grain sizes toward the bottom of the block. While analysing the polished bottom of such a block, the less dense and small grains will be missed. For these kinds of samples, the round block will be cut into vertical slices. These slices will be remounted as a vertical section [47,48]. With some EDS detectors, it is possible to also study material as coals or synthetic polymers. Because the BSE grey value of this organic matter is the same as for epoxy resin, one should use an alternative embedding material [49]. Carnauba wax can replace the epoxy resin [50], but it is a very soft substance and not easy to polish. For better stability, carnauba wax blocks of 25 mm can be double mounted in epoxy resin blocks of 30 mm diameter. Another possibility is to dope the epoxy resin with iodoform [49,51]. The epoxy resin then has a higher molecular number than the organic matter and can be therefore extracted as background. There are numerous sorts of epoxy resin available. In addition, the filler and hardener proportions can be varied. The main difficulty is to choose an epoxy resin which hardens within convenient time frames and temperature conditions, which does not evaporate under high vacuum conditions and which remains stable under the electron beam of 25 kV. Continuous application tests are the recommended way to solve the problem.
The preparation of thin and thick sections is quite simple if the sample material is massive, solid, compact and dry. If the sample is porous and or brittle, a previous impregnation with epoxy resin stabilizes the material before sawing. There are several authors, which describe the procedure of thin section production [52,53]. For the lapping of the sample material previous to the mounting on glass, mostly silicon carbide (600–1000 mesh) is used. For soft and brittle material, a SiC 1000 leads to better results with a minimum of substance loss, instead using the SiC 600 for the standard lapping procedure. Thin sections have the advantage that one can check the minerals or phases with an optical microscope, if there are minerals with a close chemical composition but different optical properties. In addition, glassy phases can be recognised under the microscope with polarised light by their optical isotropy. This information is helpful when creating the reference EDS spectra list.
All SEM-AM analyses of grain mounts in epoxy blocks and of thin and thick sections need a well-polished and plane surface. The polishing is always a work of craftsmanship because all materials need a specific treatment. Mostly the polishing procedure is performed with water. If there are minerals or materials which can be dissolved in water or react with it, they can be prepared with water free liquids like ethylene glycol [48]. This is recommended for many sorts of industrial ashes (e.g., sewage and power plant ashes), as these can contain anhydrite. To prevent the formation of a relief due to different grades of hardness among the particles, it is recommended to use polishing plates covered with hard textile cloths. Polishing plates with embedded diamonds reduce the relief. If there are ore minerals or soft metals or minerals, soft polishing cloths with long fibres will give convenient results. The polishing procedure is performed in several successive steps (3 to 5 steps, dependent on the material) with decreasing grain sizes, e.g., abrasive papers followed by grinding and polishing powders on textile cloth. It is not advised to use the traditional polishing plates with lead-bearing alloys. Although they produce relief-free surfaces due to the fixed polishing grains, a severe sample contamination by the lead cannot be excluded. Diamond powder with lubricant or diamond paste with a grain size of 1 µm on textile cloths is very effective for the last step of polishing. It is recommended to use a microscope with reflected light to control the results during the successive polishing steps.
A carbon coating of the polished samples for the dissipation of the impinging electrons is essential to obtain optimal BSE images. Otherwise, even a partial charging of the sample surface will severely hamper the analysis. The evaporation of a carbon-loaded thread under vacuum (10−4 Pa) leads to a carbon layer with a constant and reproducible thickness of several nanometres on the underlaying samples. The thickness of the carbon coating layer can be controlled by the carbon load of the thread, e.g., 27 g/m load of carbon produces a layer of ~6 nm thickness on a sample surface of 50 cm2. Alternative carbon coating methods with carbon rods and electronic thickness control are less economic.

4. Case Studies

4.1. Applications in Petrology and Applied Sedimentology

Petrological investigations on igneous, metamorphic and sedimentary rocks are mainly based on polished thin sections. The thickness of a thin section is usually ~30 µm, which allows for optical microscopy under transmitted polarised light. Modern in situ analytical methods with a spatial resolution at the µm-scale as electron probe microanalysis (EPMA), laser ablation inductively coupled plasma mass spectrometry (LA-ICP-MS) and secondary ion mass spectrometry (SIMS) require a precise imaging and characterisation of the potential analytical target positions. Zircon, monazite and an increasing number of other minerals (e.g., rutile, sphene, garnet) are subject of in situ radiochronology. The suitable mineral grain sizes are <200 µm and often hardly to be detected and located by optical microscopy. Measurement routines of SEM-AM to find rare mineral grains, labelled as sparse phase search, initially designed for detection of gold and platinum group minerals, provide an efficient tool for the preparation of in situ dating techniques. In the case of EPMA-Th-U-Pb monazite dating, the potential target grains in meta-psammopelites were detected and located in thin sections by the sparse phase search routine using a BSE grey level trigger of bright grey (i.e., >100) at a gold-calibrated 0–254 grey scale [13,52]. A catalogue of all monazite, xenotime and zircon intermineral relationships is gained by the measurement (Figure 4a,b). This was used to select monazite grains for detailed investigation in BSE imaging under the SEM, and quantitative wavelength-dispersive (WDS) analysis with EPMA. The same routine can be also used for distinguishing different generations of zircon in a set of rhyolite samples [53].
The study of unzoned and zoned garnet in micaschists, gneisses and metabasites is of special interest for geothermobarometry [13,54] and age dating [55]. The WDS element mapping by EPMA is considered as the best method for the characterisation of zoned minerals. However, this method is time-consuming and thus hardly suitable to investigate a multitude of garnet grains in a 25 × 45 mm sized sample. Here, the EDS spectral mapping by SEM-AM provides a faster solution. The routine produces a narrow grid of ~1600 single EDS spectra per mm2 in grains selected by a BSE grey scale trigger. For the classification of the sample EDS spectra, a list of reference EDS spectra was established by collecting spectra from defined parts of several zoned garnet porphyroblasts (core-mid-rim). It is indispensable to use sample garnets for this procedure, as the spectra from the available standard garnets and arbitrary other garnet-bearing rocks will not match due to the highly variable different element compositions in natural garnet solid solutions. Garnet reference spectra are further characterized by EDS single spot elemental analyses which revealed strong variations of Fe, Mg, Mn and Ca in the porphyroblasts. In a next step, the reference spectra were labelled in a generic way with the corresponding garnet Fe-Mg-Mn-Ca compositions. When the pixels which correspond to the labelled spectra are arranged in a colour scale, they visualise semi-quantitative garnet zonation maps (Figure 4c). The measurements were classified against the reference EDS spectra list with a high degree of probability of match [13,54]. The spectral mapping allowed for selecting garnets with a well-developed and complete concentrical chemical zonation out of dozens of porphyroblasts for quantitative WDS analysis by EPMA (Figure 4d). For the EDS spectral mapping of metabasites, it is recommended to adjust the BSE grey level trigger for an analysis of the complete sample excluding the glass and epoxy background at the margins (30–254, based on calibration at gold 254). The reason behind this is that the BSE grey levels of pyroxene, amphibole, biotite, chlorite, epidote and garnet in the metabasites are relatively similar (Figure 4e).
Coarse-grained rocks or materials with grain sizes above 5 mm are problematic to be analysed for their mineral mode and bulk rock chemical composition. For bulk rock chemical analysis, a corresponding large volume of rock has to be comminuted and then thoroughly homogenised. SEM-AM offers a novel way to relate the bulk material chemical data to a mineral or phase modal content by the analysis of grain mounts from the same pulverised sample. This has been used for the characterisation of lithologically zoned coarse-grained lithium-caesium-tantalum pegmatites [56].
The application of SEM automated mineralogy to sedimentary rocks is a fast evolving field. An important routine application is the investigation of heavy mineral separates in provenance studies or as a completion of bulk rock geochemical analyses [57]. Interesting applications of the EDS spectral mapping routine have been reported from the experimental petrology of sedimentary rocks. The mineralogical and physical property changes linked to geo-chemical alteration processes in chalk are of great interest for the oil and gas industry. Ultra-long-term tri-axial tests enclosing the flooding by MgCl2-brines on 7 cm long cores of a reference material (outcrop chalk from Belgium) were performed under reservoir conditions [58]. It is shown that newly formed crystals of magnesite containing minor calcium impurities crystallised together with clay-minerals in the fine-grained calcite matrix. Dolomite or low- and high-Mg-calcite are not observed. Textures of larger micro-fossils are often preserved, but the mineralogy of their shells is altered. A sharp transition zone along the alteration front shows the highest porosity in the cores. This pattern resembles that the alterations are driven by phase dissolution and subsequent precipitation. Compositional variations of the injection fluid effectively control the amount of chemical reaction in chalk. This allowed for predicting changes in geo-mechanical parameters induced by mineral replacements [58,59].

4.2. Characterisation of Granular and Particulate Raw Materials

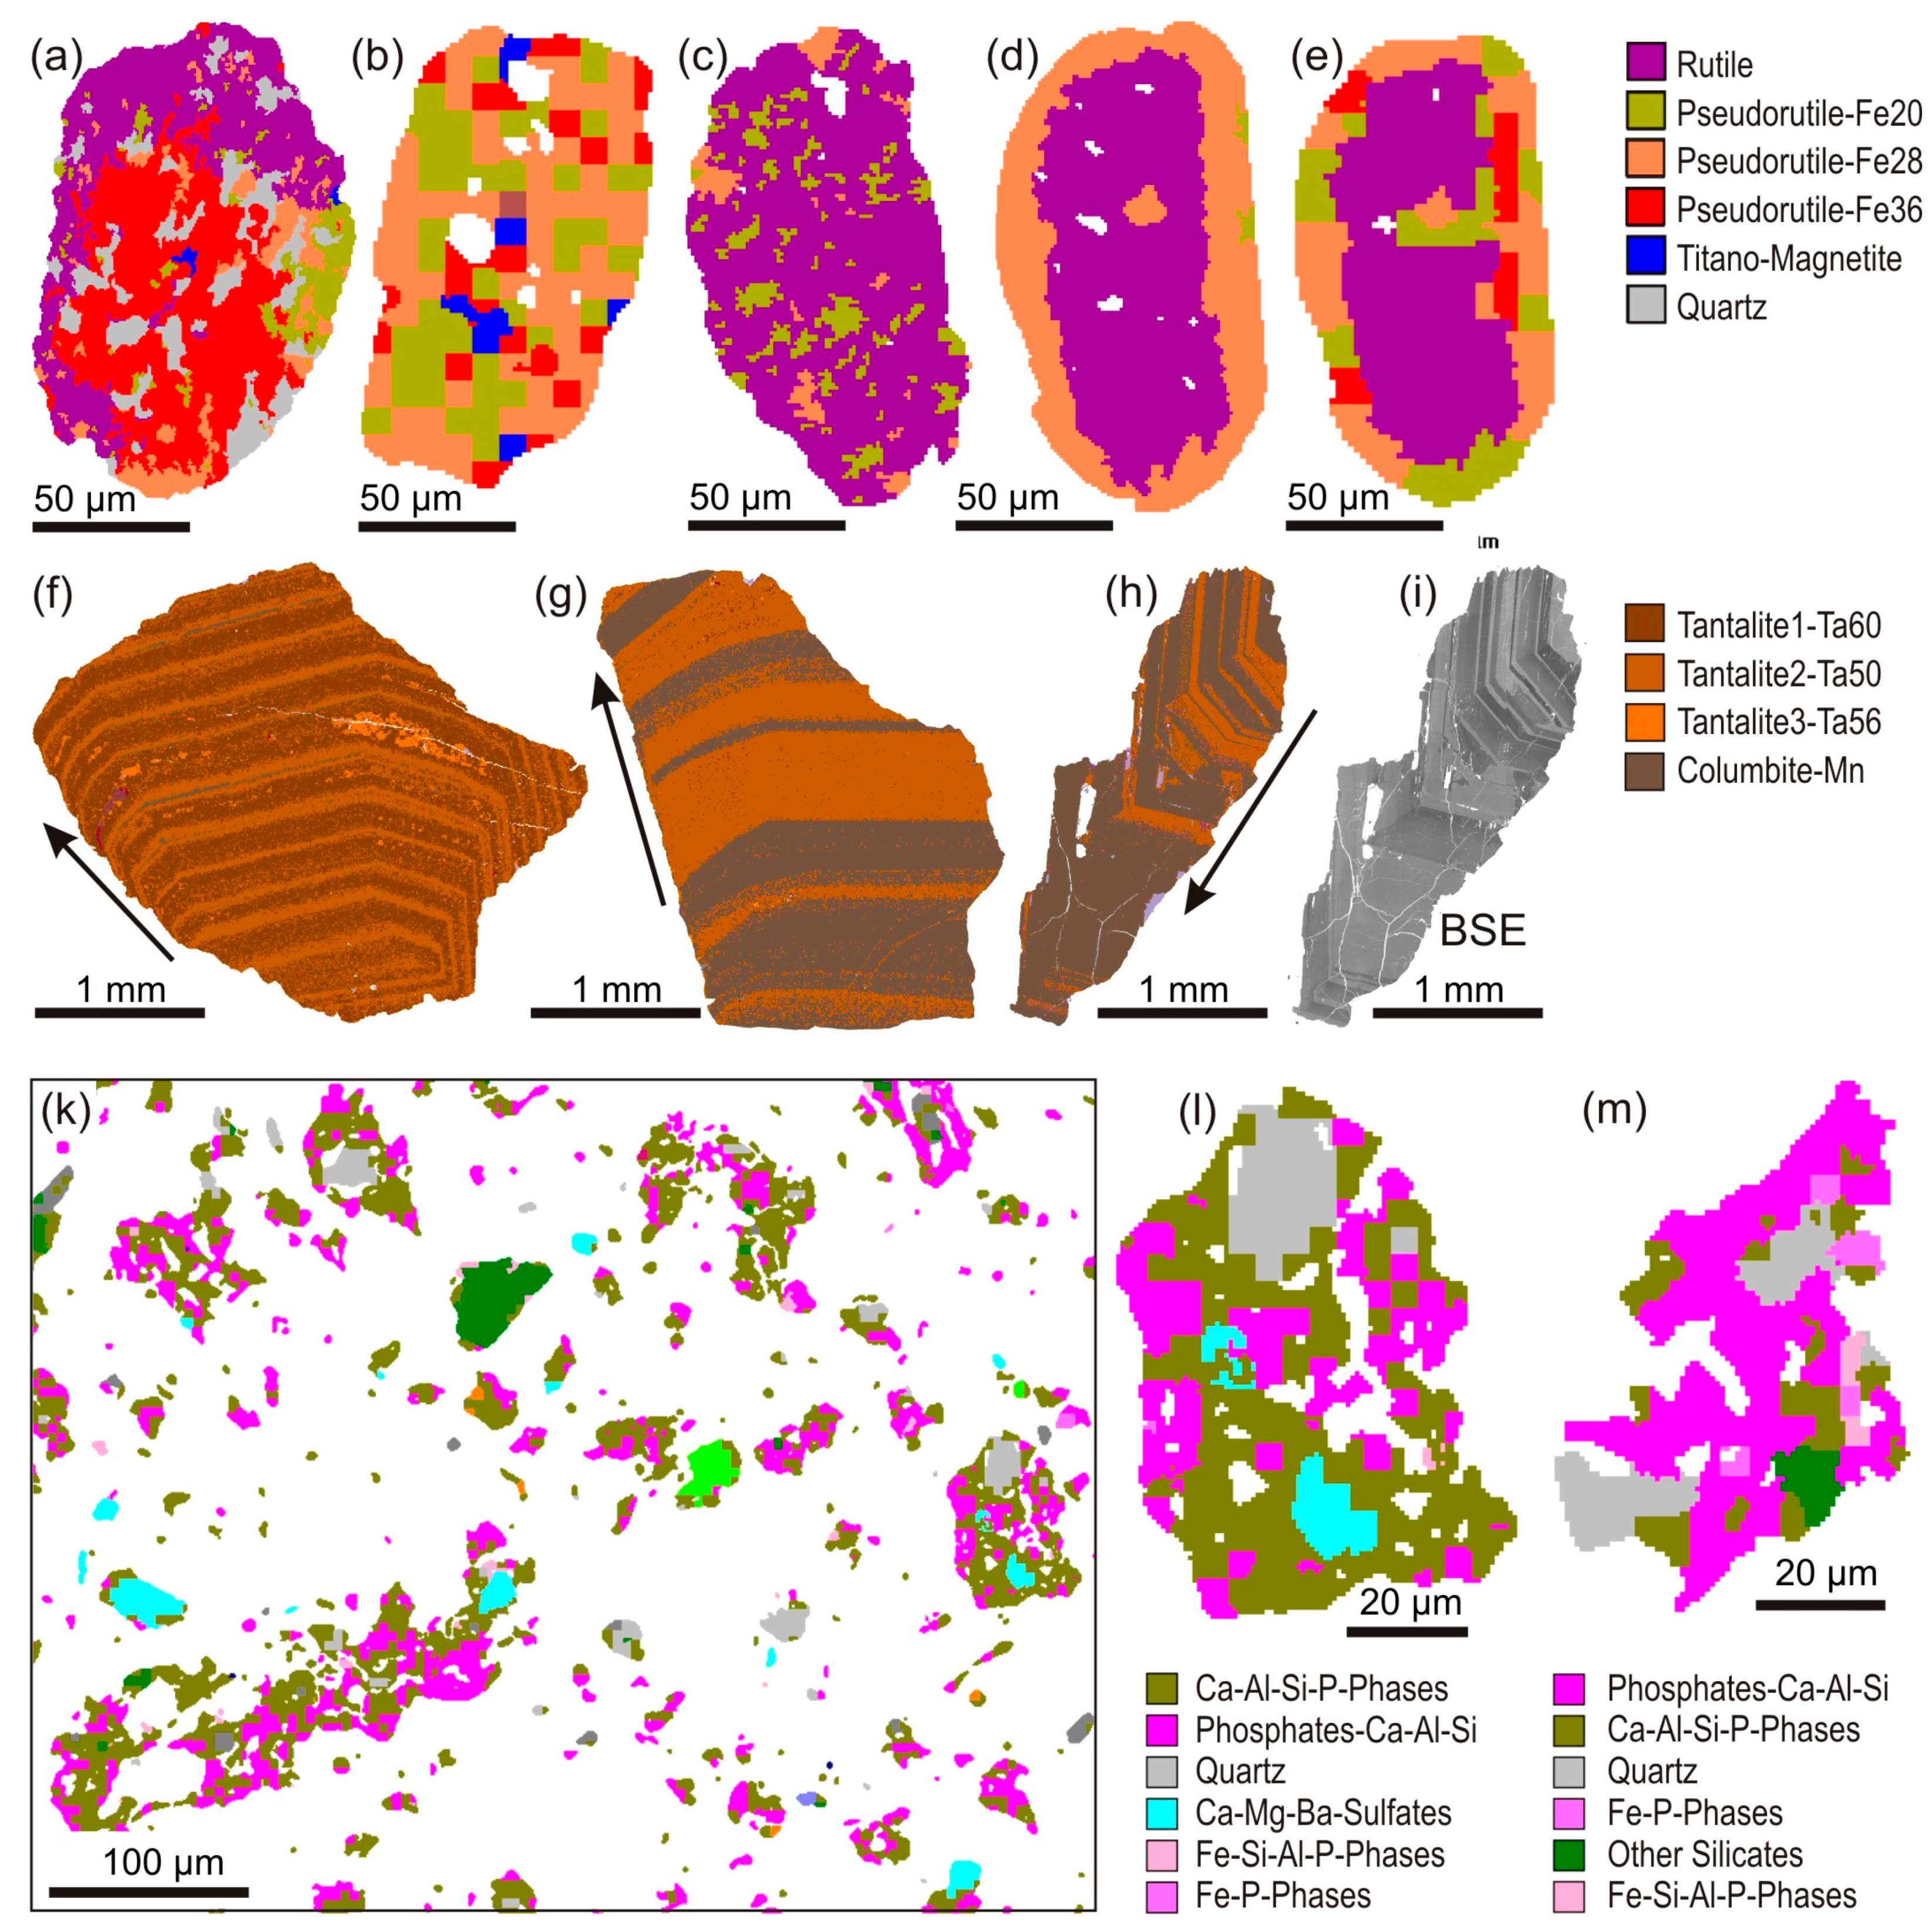
4.2.1. The Ilmenite-to-Leucoxene Alteration Process

The development of the SEM Automated Mineralogy analytical systems was mainly driven by the demands of mineral processing. This encloses the analysis of polished grain mounts with particle sizes mostly < 200 µm by the particle analysis routines and increasingly by the EDS spectral mapping measurements. The alteration of ilmenite (FeTiO3) is a near-surface process which controls the economic value of placers. Degree and type of the ilmenite alteration also has an important influence on the beneficiation of Ti-bearing placer sediments by magnetic and gravity separation methods. It has been shown by ore microscopy and microprobe analyses that the alteration of ilmenite is characterised by a continuous loss of Fe and gain of OH that finally leads to leucoxene (TiFe)3O6(OH)6. The process can be compared to an in situ leaching of ilmenite, as often porous phases with less density than ilmenite appear during intermediate stages. By involving powder X-ray diffraction (XRD), the alteration sequence has been established as ilmenite-leached ilmenite/pseudorutile-leached pseudorutile-leucoxene. The leucoxene was found to be a fine-grained polycrystalline aggregate of rutile [60]. By XRD, the leached ilmenite can be characterised as pseudorutile due to its changed lattice parameters. The XRD method cannot distinguish among large crystals as a single grain and aggregates of rutile microcrystals as leucoxene. The ilmenite alteration sequence was addressed in a novel study by SEM-AM methods by applying a list of generically labelled reference spectra which cover the Ti-Fe compositions of ilmenite s. str. (Ti 31, Fe 36 wt%), pseudorutile (Ti 36, Fe 28 wt%), leached pseudorutile (Ti 40, Fe 18 wt%) and leucoxene (Ti 60, Fe < 5 wt%). About 30,000 particles in polished grain mounts were analysed by a narrow grid (~10 × 10 µm) of single EDS spectra [61]. This measurement mode allows to resolve chemical heterogeneities within particles showing no or only slight variations of grey level values in their BSE image. Classification by the special Ti-Fe-spectra list provides the degree of ilmenite-to-leucoxene alteration for each particle. The ilmenite alteration features are visualised in detail by relating distinct colours to the pixel areas defined by EDS spectra related to different contents of Ti-Fe, reported as Fe in wt% in the legend (Figure 5a–e). Altered ilmenite particles are characterised by core-mantle structures with ilmenite in the cores and several successive coronas of pseudorutile followed by leached pseudorutile and then leucoxene Ti-Fe compositions toward the rims (Figure 5a,b). Although the leucoxene still contains small amounts of Fe (<5 wt%), it cannot be properly distinguished from rutile (TiO2) by EDS and XRD spectra. As a consequence, particles with the “inverse” zonation, in detail visible by leucoxene/rutile cores mantled by pseudorutile or ilmenite-typical Ti-Fe compositions, then should be interpreted as preserved relics of initial magmatic or metamorphic origin (Figure 5c–e). Summarising the alteration in all Ti-Fe particles in combination with virtual particle size classing then provides indications for beneficiation concepts.

4.2.2. Nb-Ta Ore Fingerprinting

The Analytical Fingerprint (AFP) method is a scientific tool which can be used to check the documented origin and provenance of tin, tungsten, and tantalum (3T) ore mineral shipments. AFP is designed as an optional proof of origin within the framework of mineral certification. The process of AFP combines geochemical features of ore grains analysed by LA-ICP-MS with SEM automated mineralogy of ore concentrates in grain mounts [10,62,63,64,65,66]. Six grain mounts of Nb-Ta ore concentrate of unknown African origin were investigated using EDS analysis, SEM-AM as well as transmitted light and reflected light microscopy [67]. Costly further methods such as LA-ICP-MS and U-Pb dating of the mineral grains which are enclosed in routine AFP methodology by the Bundesanstalt für Geowissenschaften and Rohstoffe (BGR) were not applied. One aim of the investigation was to test the feasibility of SEM-AM alone to encircle the provenance of the samples despite the limited analytical methodology. Results were compared with published data from various authors. Tantalite, columbite-(Fe), columbite-(Mn) as well as microlith and tapiolite-(Fe) were determined as Nb-Ta minerals in the samples by EDS spectral mapping. The stoichiometrically overlaying Nb-Ta minerals can be sorted in the columbite quadrilateral with tapiolite (FeTa2O6), tantalite (MnTa2O6), columbite-(Fe) (FeNb2O6) and columbite-(Mn) (MnNb2O6) endmembers. Minor constituents and accessory minerals of the samples such as cassiterite, wolframite, garnet, iron oxides, tourmaline, staurolite, orthopyroxene, primary and secondary mica are indicators that the host rock of the samples may be a metasedimentary rock. The absence of feldspar, sulphides, secondary tourmaline, quartz, and the abundance of iron oxides are indications of possible greisenisation. The cumulative grain size distribution curves of the samples are indicators of artisanal mining, which is carried out in many coltan deposits in Africa. The mineral associations and a characteristic sequence of various oscillatory zonation trends of the columbite-tantalite minerals document a fractionation trend of Nb-Ta analogous to Fe-Mn described from Kibara deposits [65]. For visualising the zonations, a list of generically labelled reference EDS spectra which enclose variations of the Ta contents in tantalite has been established (Figure 5f–i). The oscillatory zonation trends provide evidence that the samples originate from the same deposit, despite their different modal compositions. Occurrence of tapiolite-(Fe) is a strongly limiting argument for the origin of the samples [9] on the African continent and signals Rwanda and the Democratic Republic of Congo. A further limitation based exclusively on tapiolite-(Fe) is not representative due to the limited availability of comparative data. The Manono-Kitotolo deposit (Democratic Republic of Congo) appears as a possible source for the samples, as both mineralogy of some of the pegmatite zones of the deposit match and an intense greisenisation is known. Due to the low number of investigated samples and the lacking complementary LA-ICP-MS data, this statement is not statistically representative. However, the case study documents the usefulness of the SEM-AM for materials fingerprinting when comparative data are available.

4.2.3. Sewage Sludge Ashes

Sewage sludge ashes (SSA) are an artificial product from the incineration of residual sludge from sewage treatment plants when previous disposal choices are no longer a legal option. The waste management sector started working on commodity recovery from materials previously regarded as disposable. In consequence, industrial ashes are now categorised as potential resources [68]. Due to its considerable contents, sewage sludge ash (SSA) turned into the focus of the recovery of phosphorous [22]. SSA is not only complex in composition, but also diverse, depending on provenance, incineration parameters and other factors. In order to optimise recovery techniques, it is necessary to characterise the primary ash particles in terms of their phosphorous and related element contents, their phase associations, particle and grain sizes, shapes and aggregations. In addition, after experiments with acid leaching, the residual particles need thorough investigation. The X-ray diffractometry (XRD) cannot measure all essential parameters, as the SSA are composed of fine-grained polyphase particles with many amorphous components. Therefore, the EDS spectral mapping method of SEM-AM has been applied as a novel method to powder samples of untreated, treated, digested, rinsed and dried SSA in polished grain mounts. The goal was to study phosphate phase associations and their behaviour towards chemical processes [22,34]. For a better resolution of the BSE image, for the analyses, the upper BSE grey level was calibrated at a maximum value of 254 with Cu instead of gold. Particles smaller than 10 µm were identified by a single measurement point. Fractions of the sample are given in area-% since the density of SSA material is difficult to assess. Keeping proportions representative, densities (even of identified crystalline minerals) were set to one, so that the mode in % of the sample refers to area-%. Proportions of the elemental contents in the reference spectra are in weight-%; thus, shares of phosphorus within the material are also in wt%. EDS spectra of SSA turned out to be complex (Figure 3h), with a multitude of peaks for Si, Al, Ca, Fe, S and P at various counts. Further elements found are Ba, Cl, Cr, Cu, K, Mg, Mn, Na and Ti. Due to small grain sizes and transitions between grains of different compositions, there are also some “mixed” spectra which display a combination of peaks from elements in adjacent grains. These conditions, in addition to amorphous, artificially produced material phases, render an interpretation of the spectra with mineral names as impossible. As a consequence, the list of reference EDS spectra is then composed by natural minerals as quartz, and generically labelled EDS spectra of particles according to their compositional ranges of elements (Figure 5k–m). A further refinement of the investigation is possible: Using the EDS elemental analysis for quantifying the Si, Al, Ca, Fe, S and P-contents, 53 spectra were collected from the samples, which were subsequently used as generically labelled reference spectra for the classification [34]. The classified sample spectra then were grouped under target-element aspects, phosphorus (P) in this case. Spectra groups summarising the spectra within a range of P-contents (in wt%) are then named descriptively according to the P contents, for example <1 %P, 5–10 %P, 10–15 %P, >15 %P. This step is called the target component grouping. Such a target-element focused classification has been also used for QEMSCAN for investigation of eudialyte acid digestion residue [69].
There is an interesting tendency of elemental complexity (number of elements detected) decreasing as P-content rises. With regard to incineration, the reorganisation of P-phases from those generated during P-precipitation in wastewater treatment to those present in ashes does currently not favour a clean recovery of calcium-phosphates. P-recovery always had to deal with Al, Fe and other major elements in the process [70]. In phosphate recycling, recovering a few other elements in addition to P is desirable as it reduces the need for product purification. Particles classified by three distinct EDS spectra are exclusively present in the untreated SSA material. In conclusion, these particles were completely resolved by acid digestion. The amount of such dissolvable particles varies and can be controlled by a pre-digestive thermochemical treatment. Thus, thermochemical treatment resulted in an improved P-recovery [22,34]. In that way, SEM-AM studies of SSA can help to assess different combustion regimes and their suitability towards P-recovery.

4.3. Slags and Ceramics

The characterisation of slags is a very challenging task. It starts by the sample preparation by mounting the often porous material in epoxy blocks and continues in choosing a suitable analytical method. A bulk chemical analysis appears as less problematic. The XRD-Rietveld methods may identify and quantify crystallised phases at modes of >1 wt%, dependent on the material, but mainly fail to characterise the often dominant amorphous or glassy phases. Slags are encountered in numerous domains. They are studied in an archaeological context [71] and for estimations of the environmental impacts and/or the raw material potential of slag heaps. The understanding and optimisation of pyro-metallurgical primary production and recycling processes is a recently growing field of slag characterisation. Waste of electrical and electronic equipment (WEEE) is one of the fastest growing waste streams globally. Therefore, recycling of the valuable metals of this stream plays a vital role in establishing a circular economy. The smelting process of WEEE leads to significant amounts of valuable metals and rare earth elements (REEs) trapped in the slag phase. The effective manipulation of this phase transfer process necessitates detailed understanding. Adequate process control is required to bring these metal contents into recoverable structures [72].
An alternative way for the phosphorus recycling strategy of sewage sludge is the transformation into a slag under high temperatures. Corresponding experiments were performed by the combustion of sewage sludge in ceramic crucibles. The ceramic crucibles with the slag were cut into plates, embedded in epoxy blocks, and then polished and studied by SEM-AM. The EDS spectral mapping is the recommended method, as the slag matrix and the embedded needle-like grains have relatively similar grey levels in BSE imaging (Figure 6a–c). The reference spectra have been generically labelled for the classification [34,73]. The matrix of the slag is dominated by an oxygen-bearing glassy phase with 11 wt% P, 9 wt% Ca and 7 wt% Fe (normalised to 100 wt%), where needle-shaped grains with 10 wt% P and 11 wt% Ca are randomly distributed (Figure 6b–d). Particles in the slag may contain maximal 18 wt% of P. Fe-rich particles are concentrated at the free surface of the slag (Figure 6d). This allows a quantified comparison of experimental slags generated under variable parameters like combustion temperatures, oxygen fugacity conditions and sewage pre-treatment processing.
Another emerging field where SEM-AM can be applied outside the traditional mineral processing domain is the study of ceramics, pottery and stoneware. As slags, the ceramics, pottery and stoneware are often investigated in an archaeological context in order to identify raw material sources and provenance [15,17,74]. Pottery from the Cycladic Bronze Age site of Akrotiri (Thera) was analysed by SEM-AM involving EDS spectral mapping measurements by QEMSCAN [15]. On the other hand, firing and calcination experiments give knowledge about the ancient production processes [75]. To obtain more precise estimates on the temperature regime of sequential ceramic transformations recorded in Sueki sherds from the Nakadake archaeological kiln site cluster (southern Japan), a series of firing experiments along well-controlled temperature-time paths and reducing conditions has been performed [17]. The firing was carried out in sloping single-chamber tunnel kilns at reducing conditions and temperatures exceeding 1000 °C. Set in a vitrified matrix (glass, mullite, minor spinel and cristobalite), quartz and feldspar constitute ubiquitous clast components. The varying degree of vitrification (15–60 wt% glass phase) and reversely correlated modal proportions of quartz and feldspar clasts likely reflect superposed effects of varying exposure time to peak-firing temperature and temperature gradients in the kilns [17]. Comparison of the feldspar melting phenomena in experiments with the archaeological samples suggests that firing temperatures did not exceed ca. 1150 °C [17]. Apart from temperature, the soaking time may influence the reaction process during firing. Experiments with an increased soaking time of 48 h have been performed on clay samples from the Nakadake archaeological kiln site. The illitic clay closely matches the bulk chemistry and particulate mineralogy of low-fired sherds recovered from the site [76]. Firing experiments on dried clay plates (25 × 45 × 5 mm) were performed in 50 °C steps over the temperature range from 700 °C to 1250 °C, using a N2-flushed tube furnace. After a soaking time of 48 h, the furnace was switched off and the ceramic slabs allowed to cool-down slowly [77]. Petrographic thin sections were produced from the firing experiments and investigated by the EDS spectral mapping mode with SEM-AM. As the material is composed by natural mineral grains as quartz and feldspars, and also by glass phases induced by the melting of feldspars and the clay minerals, two sets of reference EDS spectra were combined for classification (Figure 7). One set of spectra includes the minerals of the raw material. The other set was established by generic labelling of EDS spectra from glassy areas. The latter was completed in a stepwise manner by several classification steps. After a first classification, some larger domains of “unknown” remained in the sample. Then, further spectra were gained from these “unknown” domains and added to the reference spectra set for a second round of classification. By repetition of the steps, a high degree of areal coverage of classified sample domains has been achieved. By means of SEM-AM, a quantitative comparison of the experiments at different temperatures to the archaeological material is possible. The SEM-AM results allow for comparing the experimental results not only for the temperature, but also for other parameters like the soaking time [77].

5. Conclusions

SEM-AM is a combined analytical tool of upgrading an SEM. It was initially developed and adopted for the fast and effective characterisation of metal-bearing ores and their processing products. A main driving force of SEM-AM development was to control and improve the effectivity of mineral processing.
The SEM-AM is organised in several successive steps (1–3) which can be controlled and adopted by the users. A measurement begins by the collection of a BSE image and its processing by various image analysis software routines (step 1). In step 2, the electron beam is focussed to induce EDS spectra at selected points according to the adjustments of the BSE image analysis. Step 3 is the classification of the gained sample EDS spectra against a list of approved reference EDS spectra. Different algorithms of the EDS spectra classification are realised by the various SEM-AM software providers.
Combinations of steps 1 and 2 lead to the principal SEM-AM measurement routines (1) point counting modal analysis; (2) particle analysis; (3) sparse phase search, and (4) EDS spectral mapping. These can be applied for the characterisation of natural and artificial electron-beam stable particulate, granular and solid massive materials. The routine (1) follows the traditional point counting method for estimation of the modal contents of different phases in a sample and provides no further information on particle properties and geometries. The particle analysis (2) measurement routines are designed for the analyses of grain mounts with 104–106 particles for addressing the special tasks in mineral processing and mining. This measurement routines allows the quantification of modal mineralogy, calculated assay, sizes and geometries of particles and grains as well as association and liberation of particles with different chemical compositions within a bulk sample and without previous phase separations. This is not possible by conventional sedimentological particle size and size distribution analysis methods. The sparse phase search measurement routines (3) were developed to find rare phases like small grains of gold and platinum group minerals which is hard and time-consuming in a manual search. BSE triggers allow for focusing the SEM-AM sparse phase search on other interesting phases. The EDS spectral mapping methods appear as the most versatile routines to resolve intra-particle details, chemical zonation and phase relationships in combination with the full particle sizes and geometries.
The application of SEM-AM requires a high-quality preparation of the samples. Grain mounts with epoxy raisins in blocks and on glass, epoxy-embedded hard material fragments and epoxy-glued thin (30 µm) and thick (100 µm) sections on glass are the mostly used compounds. The detection and selection of a suitable epoxy type and mixture which does not evaporate under high vacuum conditions and remains stable under the electron beam after hardening is one of the principal challenges in sample preparation. The other difficulty is the development of sample-specific multi-step polishing procedures to produce relief-free planar surfaces in samples containing phases of very different hardness.
As demonstrated by several case studies in this contribution, the EDS spectral mapping measurement methods appear to have the most promising potential for novel applications apart from metal-bearing ores and mineral processing. This especially concerns the SEM-AM applications to artificial materials such as ashes, slags and ceramics. It has to be clarified that the complete identification of minerals and their denotation through the classification of their EDS spectra remains incomplete. For this, a full and reliable mineral identification requires additional XRD data. It also appears that XRD data identifies phases which appear in microcrystalline aggregates and not in larger grains. Many of the materials which potentially could be characterised by SEM-AM consist of microcrystalline, amorphous and glassy phases. In such cases, the generic labelling of reference EDS spectra and their subsequent target component grouping allow an interesting utilisation of the SEM-AM for novel studies not feasible by other analytical methods.

Author Contributions

Conceptualisation, B.S., D.S.; methodology, D.S., S.G.; investigation, B.S., D.S., S.G.; resources, B.S.; data curation, B.S., DS, S.G.; writing—original draft preparation, B.S., D.S.; writing—review and editing, B.S., D.S., S.G.; visualisation, B.S., D.S.; project administration, B.S., D.S., S.G. All authors have read and agreed to the published version of the manuscript.

Funding

This research was funded by the Helmholtz Institute Freiberg for Resource Technology, the Deutsche Forschungsgemeinschaft (DFG) Grant SCHU676/20 and through contract work for numerous enterprises. The Open Access Funding and APC was funded by the Publication Fund of the TU Bergakademie Freiberg.

Acknowledgments

The authors acknowledge the great expertise of Andreas Bartzsch, Roland Würkert and Michael Stoll in preparation of numerous standard and special geomaterials at Helmholtz Institute Freiberg for Resource Technology. The constructive comments of three anonymous reviewers considerably contributed to improvement of the manuscript.

Conflicts of Interest

The authors declare no conflict of interest.

References

  1. Baum, W.; Lotter, N.O.; Whittaker, P.J. Process mineralogy—A new generation for ore characterization and plant optimization. In Proceedings of the 2004 SME Annual Meeting, Denver, CO, USA, 23–25 February 2004; Society for Mining, Metallurgy and Exploration: Englewood, CO, USA, 2004; pp. 73–77. [Google Scholar]
  2. Lastra, R. Seven practical application cases of liberation analysis. Int. J. Miner. Process. 2007, 84, 337–347. [Google Scholar] [CrossRef]
  3. Hoal, K.O.; Stammer, J.G.; Appleby, S.K.; Botha, J.; Ross, J.K.; Botha, P.W. Research in quantitative mineralogy: Examples from diverse applications. Miner. Eng. 2009, 22, 402–408. [Google Scholar] [CrossRef]
  4. Ford, F.D.; Wercholaz, C.R.; Lee, A. Predicting process outcomes for Sudbury platinum-group minerals using grade-recovery modeling from mineral liberation analyzer (MLA) data. Can. Mineral. 2011, 49, 1627–1642. [Google Scholar] [CrossRef]
  5. Grammatikopoulos, T.; Mercer, W.; Gunning, C.; Prout, S. Quantitative Characterization of the REE Minerals by QEMSCAN from the Nechalacho Heavy Rare Earth Deposit, Thor Lake Project, NWT, Canada; SGS Minerals Services: Lakefield, ON, Canada, 2011; p. 11. [Google Scholar]
  6. Rollinson, G.K.; Andersen, J.C.O.; Stickland, R.J.; Boni, M.; Fairhurst, R. Characterisation of non-sulphide zinc deposits using QEMSCAN®. Miner. Eng. 2011, 24, 778–787. [Google Scholar] [CrossRef]
  7. MacDonald, M.; Adair, B.; Bradshaw, D.; Dunn, M.; Latti, D. Learnings from five years of on-site MLA at Kennecott Utah Copper Corporation. In Proceedings of the 10th International Congress for Applied Mineralogy (ICAM 2011), Trondheim, Norway, 1–5 August 2011; Broekmans, M.A.T.M., Ed.; Springer: Berlin/Heidelberg, Germany, 2012; pp. 419–426. [Google Scholar] [CrossRef]
  8. Anderson, K.F.E.; Wall, F.; Rollinson, G.K.; Moon, C.J. Quantitative mineralogical and chemical assessment of the Nkout iron ore deposit, Southern Cameroon. Ore Geol. Rev. 2014, 62, 25–39. [Google Scholar] [CrossRef]
  9. Melcher, F.; Graupner, T.; Henjes-Kunst, F.; Oberthür, T.; Sitnikova, M.; Gäbler, E.; Gerdes, A.; Brätz, H.; Davis, D.; Dewaele, S. Analytical Fingerprint of Columbite-Tantalite (Coltan) Mineralisation in Pegmatites—Focus on Africa. In Proceedings of the Ninth International Congress for Applied Mineralogy (ICAM 2008), Brisbane, Australia, 8–10 September 2008; Australasian Institute of Mining and Metallurgy (AusIMM): Carlton, VIC, Australia, 2008; pp. 615–624. [Google Scholar]
  10. Gäbler, H.-E.; Melcher, F.; Graupner, T.; Bahr, A.; Sitnikova, M.A.; Henjes-Kunst, F.; Oberthür, T.; Brätz, H.; Gerdes, A. Speeding Up the Analytical Workflow for Coltan Fingerprinting by an Integrated Mineral Liberation Analysis/LA-ICP-MS Approach. Geostand. Geoanal. Res. 2011, 35, 431–448. [Google Scholar] [CrossRef]
  11. Lamberg, P.; Rosenkranz, J.; Wanhainen, C.; Lund, C.; Minz, F.; Mwanga, A.; Parian, M. Building a Geometallurgical Model in Iron Ores using a Mineralogical Approach with Liberation Data. In Proceedings of the Second AusIMM International Geometallurgy Conference (GeoMet 2013), Brisbane, Australia, 30 September—2 October 2013; Australasian Institute of Mining and Metallurgy (AusIMM): Carlton, VIC, Australia, 2013; pp. 317–324. [Google Scholar]
  12. Lund, C.; Lamberg, P.; Lindberg, T. Practical way to quantify minerals from chemical assays at Malmberget iron ore operations—An important tool for the geometallurgical program. Miner. Eng. 2013, 49, 7–16. [Google Scholar] [CrossRef]
  13. Schulz, B. Polymetamorphism in garnet micaschists of the Saualpe Eclogite Unit (Eastern Alps, Austria), resolved by automated SEM methods and EMP-Th-U-Pb monazite dating. J. Metamorph. Geol. 2017, 35, 141–163. [Google Scholar] [CrossRef]
  14. Hrstka, T.; Gottlieb, P.; Skála, R.; Breiter, K.; David Motl, D. Automated mineralogy and petrology—Applications of TESCAN Integrated Mineral Analyzer (TIMA). J. Geosci. 2018, 63, 47–63. [Google Scholar] [CrossRef] [Green Version]
  15. Knappett, C.; Pirrie, D.; Power, M.R.; Nikolakopoulou, I.; Hilditch, J.; Rollinson, G.K. Mineralogical analysis and provenancing of ancient ceramics using automated SEM-EDS analysis (QEMSCAN®): A pilot study on LB I pottery from Akrotiri, Thera. J. Archaeol. Sci. 2011, 38, 219–232. [Google Scholar] [CrossRef]
  16. Šegvić, B.; Ugarković, M.; Süssenberger, A.; Mählmann, R.F.; Moscariello, A. Compositional properties and provenance of Hellenistic pottery from the necropolis of Issa with evidences on the cross-Adriatic and the Mediterranean-scale trade. Mediterr. Archaeol. Archaeom. 2016, 16, 23–52. [Google Scholar] [CrossRef]
  17. Raith, M.M.; Hoffbauer, R.; Spiering, B.; Shinoto, M.; Nakamura, N. Melting behaviour of feldspar clasts in high-fired Sue ware. J. Eur. Mineral. 2016, 28, 385–407. [Google Scholar] [CrossRef]
  18. Bevins, R.E.; Pirrie, D.; Ixer, R.A.; O’Brien, H.; Pearson, M.P.; Power, M.R.; Shail, R.K. Constraining the provenance of the Stonehenge ‘Altar Stone’: Evidence from automated mineralogy and U–Pb zircon age dating. J. Archaeol. Sci. 2020, 120, 105188. [Google Scholar] [CrossRef]
  19. Pirrie, D.; Butcher, A.R.; Power, M.R.; Gottlieb, P.; Miller, G.L. Rapid quantitative mineral and phase analysis using automated scanning electron microscopy (QemSCAN); potential applications in forensic geoscience. Geol. Soc. Spec. Publ. 2004, 232, 123–136. [Google Scholar] [CrossRef]
  20. Pirrie, D. Forensic geology in serious crime investigation. Geol. Today 2009, 25, 188–192. [Google Scholar] [CrossRef]
  21. Pirrie, D.; Crean, D.E.; Pidduck, A.J.; Nicholls, T.M.; Awbery, R.P.; Shail, R.K. Automated mineralogical profiling of soils as an indicator of local bedrock lithology: A tool for predictive forensic geolocation. Geol. Soc. Spec. Pub. 2019, 492. [Google Scholar] [CrossRef]
  22. Greb, V.G.; Guhl, A.; Weigand, H.; Schulz, B.; Bertau, M. Understanding phosphorous phases in sewage sludge ashes: A wet-process investigation coupled with automated mineralogy analysis. Miner. Eng. 2016, 99, 30–39. [Google Scholar] [CrossRef]
  23. Hoang, D.H.; Kupka, N.; Peuker, U.A.; Rudolph, M. Flotation study of fine grained carbonaceous sedimentary apatite ore—Challenges in process mineralogy and impact of hydrodynamics. Miner. Eng. 2018, 121, 196–204. [Google Scholar] [CrossRef]
  24. Sandmann, D.; Jäckel, H.G.; Gutzmer, J. Clues to Greater Recycling Efficiency—Characterization of a Crushed Mobile Phone by Mineral Liberation Analysis (MLA). Mater. Sci. Forum 2019, 959, 134–141. [Google Scholar] [CrossRef]
  25. Gottlieb, P.; Wilkie, G.; Sutherland, D.; Ho-Tun, E.; Suthers, S.; Perera, K.; Jenkins, B.; Spencer, S.; Butcher, A.; Rayner, J. Using quantitative electron microscopy for process mineralogy applications. JOM 2000, 52, 24–25. [Google Scholar] [CrossRef]
  26. Petruk, W. Applied Mineralogy in the Mining Industry, 1st ed.; Elsevier Science: Amsterdam, Netherlands, 2000; p. 288. [Google Scholar]
  27. Gu, Y. Automated scanning electron microscope based mineral liberation analysis. An introduction to JKMRC/FEI Mineral Liberation Analyser. J. Miner. Mater. Charact. Eng. 2003, 2, 33–41. [Google Scholar] [CrossRef]
  28. Fandrich, R.; Gu, Y.; Burrows, D.; Moeller, K. Modern SEM-based mineral liberation analysis. Int. J. Miner. Process. 2007, 84, 310–320. [Google Scholar] [CrossRef]
  29. Pirrie, D.; Rollinson, G.K. Unlocking the applications of automated mineral analysis. Geol. Today 2011, 27, 226–235. [Google Scholar] [CrossRef]
  30. Liipo, J.; Lang, C.; Burgess, S.; Otterström, H.; Person, H.; Lamberg, P. Automated mineral liberation analysis using INCAMineral. In Proceedings of the Process Mineralogy ‘12, Cape Town, South Africa, 7–9 November 2012; Minerals Engineering International (MEI): Falmouth, UK, 2012; p. 7. [Google Scholar]
  31. Sylvester, P. Use of the Mineral Liberation Analyzer (MLA) for Mineralogical Studies of Sediments and Sedimentary Rocks. In Quantitative Mineralogy and Microanalysis of Sediments and Sedimentary Rocks; Sylvester, P., Ed.; Mineralogical Association of Canada (MAC): St. John’s, NL, Canada, 2012; Volume 42, pp. 1–16. [Google Scholar]
  32. Graham, S.D.; Brough, C.; Cropp, A. An Introduction to ZEISS Mineralogic Mining and the correlation of light microscopy with automated mineralogy: A case study using BMS and PGM analysis of samples from a PGE-bearing chromitite prospect. In Proceedings of the Precious Metals ‘15, Falmouth, UK, 11 May 2015; Minerals Engineering International (MEI): Falmouth, UK, 2015; p. 11. [Google Scholar]
  33. Schulz, B.; Merker, G.; Gutzmer, J. Automated SEM Mineral Liberation Analysis (MLA) with Generically Labelled EDX Spectra in the Mineral Processing of Rare Earth Element Ores. Minerals 2019, 9, 527. [Google Scholar] [CrossRef] [Green Version]
  34. Guhl, A.C.; Greb, V.-G.; Schulz, B.; Bertau, M. An improved evaluation strategy for ash analysis using scanning electron microscope automated mineralogy. Minerals 2020, 10, 484. [Google Scholar] [CrossRef]
  35. Haberlah, D.; Owen, M.; Botha, P.W.S.K.; Gottlieb, P. SEM-EDS based protocol for subsurface drilling mineral identification and petrological classification. In Proceedings of the 10th International Congress for Applied Mineralogy (ICAM 2011), Trondheim, Norway, 1–5 August 2011; Broekmans, M.A.T.M., Ed.; Springer: Berlin/Heidelberg, Germany, 2012; pp. 265–273. [Google Scholar] [CrossRef]
  36. FEI Company. QEMSCAN® 650F Automated, Quantitative Petrographic Analyzer; Brochure DS0038 12-2011; FEI Company: Hillsboro, OR, USA, 2011; p. 4. [Google Scholar]
  37. TESCAN. TIMA−X—TESCAN Integrated Mineral Analyser; Brochure 2017.04.10; TESCAN: Brno, Czech Republic, 2017; 16p. [Google Scholar]
  38. Zeiss—Microscopes for Automated Mineral Analysis. Available online: https://web.archive.org/web/20200724134840/https://www.zeiss.com/microscopy/int/products/scanning-electron-microscopes/mineralogic-systems.html (accessed on 24 July 2020).
  39. Bruker. AMICS Software—Advanced Mineral Identification and Characterization System; Brochure DOC-H82-EXS018, Rev.1; Bruker: Berlin, Germany, 2017; p. 2. [Google Scholar]
  40. Bruker—AMICS—Advanced Mineral Identification and Characterization System. Available online: https://web.archive.org/web/20200810115608/https://www.bruker.com/de/products/x-ray-diffraction-and-elemental-analysis/eds-wds-ebsd-sem-micro-xrf-and-sem-micro-ct/quantax-eds-for-sem/amics-software.html (accessed on 10 August 2020).
  41. Oxford Instruments INCAMineral. Available online: https://web.archive.org/web/20200810110842/ (accessed on 10 August 2020).
  42. Oxford Instruments—AztecMineral: Dedicated Mineralogy on Multi-Purpose SEM. Available online: https://web.archive.org/web/20200810111028/ (accessed on 10 August 2020).
  43. Oxford Instruments. INCAFeature. High Performance Feature Detection, Analysis and Classification; Brochure OINA/075/E/0412; Oxford Instruments: High Wycombe, UK, 2012; 4p. [Google Scholar]
  44. Sandmann, D.; Bachmann, K.; Gutzmer, J. From ore to metal—Advanced Materials Characterisation by Automated Mineralogy. World Min. Surf. Undergr. 2019, 71, 283–291. [Google Scholar]
  45. Jackson, B.R.; Reid, A.F.; Wittemberg, J.C. Rapid production of high quality polished sections for automated image analysis of minerals. Proc. Australas. Inst. Min. Metall. 1984, 289, 93–97. [Google Scholar]
  46. Røisi, I.; Aasly, K. The effect of graphite filler in sample preparation for automated mineralogy—A preliminary study. Mineralproduksjon 2018, 8, A1–A23. [Google Scholar]
  47. Kwitko-Ribeiro, R. New Sample Preparation Developments to Minimize Mineral Segregation in Process Mineralogy. In Proceedings of the 10th International Congress for Applied Mineralogy (ICAM 2011), Trondheim, Norway, 1–5 August 2011; Broekmans, M.A.T.M., Ed.; Springer: Berlin/Heidelberg, Germany, 2012; pp. 411–417. [Google Scholar] [CrossRef]
  48. Bartzsch, A.; Gilbricht, S.; Bachmann, K.; Heinig, T. A Method of Preparing a Sample Preparation, Sample Preparation, and Method of Assaying a Sample Material. Patent DE102017128355, 17 January 2019. [Google Scholar]
  49. Rahfeld, A.; Gutzmer, J. MLA-Based Detection of Organic Matter with Iodized Epoxy Resin—An Alternative to Carnauba. J. Miner. Mater. Charact. Eng. 2017, 5, 198–208. [Google Scholar] [CrossRef] [Green Version]
  50. O’Brien, G.; Gu, Y.; Adair, B.J.I.; Firth, B. The use of optical reflected light and SEM imaging systems to provide quantitative coal characterisation. Miner. Eng. 2011, 24, 1299–1304. [Google Scholar] [CrossRef]
  51. Gomez, C.O.; Strickler, D.W.; Austin, L.G. An iodized mounting medium for coal particles. J. Electron Microsc. Tech. 1984, 1, 285–287. [Google Scholar] [CrossRef]
  52. Green, O.R. Thin Section and Slide Preparation Techniques of Macro- and Microfossil Specimens and Residues. In A Manual of Practical Laboratory and Field Techniques in Palaeobiology; Springer: Dordrecht, The Netherlands, 2001. [Google Scholar] [CrossRef]
  53. Grundmann, G.; Scholz, H. Preparation Methods in Mineralogy and Geology: The Preparation of Thin Sections, Polished Sections, Acetate Foil Prints, Preparation for Elutriation Analysis and Staining Tests for the Optical and Electron Microscopy. 2015. Available online: https://www.researchgate.net/publication/275948069_Preparation_methods_in_Mineralogy_and_Geology_The_preparation_of_thin_sections_polished_sections_acetate_foil_prints_preparation_for_elutriation_analysis_and_staining_tests_for_the_optical_and_electro (accessed on 10 November 2020). [CrossRef]
  54. Schulz, B.; Krause, J.; Zimmermann, R. Electron microprobe petrochronology of monazite-bearing garnet micaschists in the Oetztal-Stubai Complex (Alpeiner Valley, Stubai). Swiss J. Geosci. 2019, 112, 597–617. [Google Scholar] [CrossRef]
  55. Burisch, M.; Gerdes, A.; Meinert, L.D.; Albert, R.; Seifert, T.; Gutzmer, J. The essence of time—Fertile skarn formation in the Variscan Orogenic Belt. Earth Planet. Sci. Lett. 2019, 519, 165–170. [Google Scholar] [CrossRef]
  56. Dittrich, T.; Seifert, T.; Schulz, B.; Hagemann, S.; Gerdes, A.; Pfänder, J. Archean Rare-Metal Pegmatites in Zimbabwe and Western Australia; Geology and Metallogeny of Pollucite Mineralisations; Springer Briefs in Worlds Mineral Deposits; Springer: Cham, Switzerland, 2019; p. 125. [Google Scholar] [CrossRef]
  57. von Eynatten, H.; Tolosana-Delgado, R.; Karius, V.; Bachmann, K.; Caracciolo, L. Sediment generation in humid Mediterranean setting: Grain-size and source-rock control on sediment geochemistry and mineralogy (Sila Massif, Calabria). Sediment. Geol. 2016, 336, 68–80. [Google Scholar] [CrossRef]
  58. Minde, M.W.; Zimmermann, U.; Madland, M.V.; Korsnes, R.I.; Schulz, B.; Gilbricht, S. Mineral replacement in long-term flooded porous carbonate rocks. Geochim. Cosmochim. Acta 2020, 268, 485–508. [Google Scholar] [CrossRef]
  59. Andersen, P.Ø.; Wang, W.; Madland, M.V.; Zimmermann, U.; Korsnes, R.I.; Bertolino, S.R.A.; Minde, M.W.; Schulz, B.; Gilbricht, S. Comparative study of five outcrop chalks flooded at reservoir conditions: Chemo-mechanical behaviour and profiles of compositional alteration. Transp. Porous Media 2018, 121, 135–181. [Google Scholar] [CrossRef]
  60. Mücke, A.; Bhadra Chaudhuri, J.N. The continuous alteration of ilmenite through pseudorutile to leucoxene. Ore Geol. Rev. 1991, 6, 25–44. [Google Scholar] [CrossRef]
  61. Schulz, B.; Haser, S. The ilmenite-pseudorutile-leucoxene alteration sequence in placer sediments in the view of automated SEM mineral liberation analysis. In Abstracts of GeoBerlin 2015; Joint Meeting of DGGV and DMG; GFZ German Research Centre for Geosciences: Potsdam, Germany, 2015; p. 336. [Google Scholar] [CrossRef]
  62. BGR—Mineral Certification at the BGR. Available online: https://www.bgr.bund.de/EN/ Themen/Min_rohstoffe/CTC/Home/CTC_node_en.html (accessed on 8 September 2020).
  63. Gäbler, H.-E.; Schink, W.; Goldmann, S.; Bahr, A.; Gawronski, T. Analytical Fingerprint of Wolframite Ore Concentrates. J. Forensic Sci. 2017, 62, 881–888. [Google Scholar] [CrossRef]
  64. Melcher, F.; Graupner, T.; Sitnikova, M.A.; Oberthür, T.; Gäbler, H.-E.; Bahr, A.; Henjes-Kunst, F. Herkunftsnachweis von Columbit-Tantalit-Erzen: Status-quo-Bericht; BGR Open File Report no. 11082/09; Bundesanstalt für Geowissenschaften und Rohstoffe (BGR): Hannover, Germany, 2009; p. 154. [Google Scholar]
  65. Melcher, F.; Graupner, T.; Sitnikova, M.; Henjes-Kunst, F.; Oberthür, T.; Gäbler, H.-E.; Bahr, A.; Gerdes, A.; Brätz, H.; Rantitsch, G. Ein Herkunftsnachweis für Niob-Tantalerze am Beispiel afrikanischer Selten-Element-Pegmatite. Mitt. Österr. Miner. Ges. 2009, 155, 231–268. [Google Scholar]
  66. Schütte, P.; Melcher, F.; Gäbler, H.-E.; Sitnikova, M.; Hublitz, M.; Goldmann, S.; Schink, W.; Gawronski, T.; Ndikumana, A.; Nziza, L. The Analytical Fingerprint (AFP) Method and Application, Process Manual Version 1.4, Bundesanstalt für Geowissenschaften und Rohstoffe (BGR). 2018. Available online: https://www.bgr.bund.de/EN/Themen/Min_rohstoffe/CTC/Downloads/AFP_Manual.pdf?__blob=publicationFile&v=7 (accessed on 26 September 2020).
  67. Weber, A. Charakterisierung afrikanischer Niob-Tantal-Erze mit REM-MLA und Eingrenzung der unbekannten Herkunftsorte. Master Thesis, TU Bergakademie, Freiberg, Germany, 2019; p. 107. [Google Scholar]
  68. Werther, J.; Ogada, T. Sewage sludge combustion. Prog. Energy Combust. Sci. 1999, 25, 55–116. [Google Scholar] [CrossRef]
  69. Ma, Y.; Stopic, S.; Gronen, L.; Friedrich, B. Recovery of Zr, Hf, Nb from eudialyte residue by sulfuric acid dry digestion and water leaching with H2O2 as a promoter. Hydrometall. 2018, 181, 206–214. [Google Scholar] [CrossRef]
  70. Fang, L.; Li, J.-S.; Donatello, S.; Cheeseman, C.R.; Wang, Q.; Poon, C.S.; Tsang, D.C.W. Recovery of phosphorus from incinerated sewage sludge ash by combined two-step extraction and selective precipitation. Chem. Eng. J. 2018, 348, 74–83. [Google Scholar] [CrossRef]
  71. Pietranik, A.; Kierczak, J.; Tyszka, R.; Schulz, B. Understanding heterogeneity of a slag derived Technosol: The role of automated SEM-EDS analyses. Minerals 2018, 8, 513. [Google Scholar] [CrossRef] [Green Version]
  72. Buchmann, M.; Borowski, N.; Leißner, T.; Heinig, T.; Reuter, M.A.; Friedrich, B.; Peuker, U.A. Evaluation of Recyclability of a WEEE Slag by Means of Integrative X-Ray Computer Tomography and SEM-Based Image Analysis. Minerals 2020, 10, 309. [Google Scholar] [CrossRef] [Green Version]
  73. Guhl, A.C.; Brett, B.; Schulz, B.; Bertau, M. Particle responses of stabilised fly ash to chemical treatment for resource extraction: An automated mineralogy investigation. Miner. Eng. 2020, 145. [Google Scholar] [CrossRef]
  74. Heimann, R.B.; Maggetti, M. Ancient and Historical Ceramics: Materials, Technology, Art, and Culinary Traditions; Schweizerbart Science Publishers: Stuttgart, Germany, 2014; p. 550. [Google Scholar]
  75. Rasmussen, K.L.; de la Fuente, G.A.; Bond, A.D.; Mathiesen, K.K.; Vera, S.D. Pottery firing temperatures: A new method for determining the firing temperature of ceramics and burnt clay. J. Archaeol. Sci. 2012, 39, 1705–1716. [Google Scholar] [CrossRef] [Green Version]
  76. Raith, M.M.; Euler, H.; Spiering, B.; Hoffbauer, R.; Nakamura, N.; Shinoto, M. Firing conditions in Anagama kilns: Constraints from the archaeometric study of kiln wall samples from the Nakadake-Sanroku archaeological site. In Proceedings of the Abstracts of GeoBremen 2017. Joint Meeting of DGGV and DMG, Bremen, Germany, 24–29 September 2017; p. A-178. [Google Scholar]
  77. Raith, M.M.; Euler, H.; Spiering, B.; Hoffbauer, R. Ceramic transformations during firing of ancient Japanese stone ware (Sueki): Insights from firing experiments. In Proceedings of the Abstracts of GeoMünster 2019. Joint Meeting of DGGV and DMG, Münster, Germany, 22–25 September 2019; p. 286. [Google Scholar]
Figure 1. SEM Automated Mineralogy measurement methods in BSE (upper row) and classified EDS images (lower row) of one measurement frame. Points of X-ray analyses are marked by white or black crosses; only some points are shown. (a) EDS point counting method for quantification of modal composition. (b) EDS particle analysis method for fast measurement of numerous particles with presentation of their geometrical and liberation parameters. (c) EDS sparse phase search method for detection and location of rare phases in grain mounts or thin sections. The peripheral mineral associations are analysed within a pre-set µm-scale range of distance. (d) EDS spectral mapping combines BSE image analysis with EDS mapping. Each grain with a distinguishable BSE grey level is mapped by numerous single EDS analysis points and visualised as colour-coded pixels, e.g., the red-coloured pixels signal a garnet grain.
Minerals 10 01004 g001
Figure 2. EDS spectra classification modes. Channels 1–35 along the keV scale are not considered and values > 2 of keV scale are omitted for presentation. Scales have been adjusted for visualisation. (a) FEI-QEMSCAN software: The sample spectrum is segmented by embracing several channels and compared to a list of reference spectra. Note slightly different counts for Al in the reference spectra. The reference spectra have user-defined minimum and maximal counts, and positions in the keV scale for each segment. The comparison to the range of reference spectra is performed by the “first match principle”. (b) FEI-MLA software: A Chi-Square test is performed for comparison of the sample EDS spectrum to each of the reference spectra in the list. The comparison to the list of reference spectra is performed by the “best match principle”, within user-defined probability limits.
Minerals 10 01004 g002
Figure 3. Challenges for classification of EDS spectra. (a,b) Two different phases have similar element contents. One of the phases contains H2O which can not be detected by EDS. (c,d) The element Li cannot be detected by EDS. Different Al/Si ratios of the minerals and independent detection of Li by another method (XRF of the bulk sample) allow a distinction. (e,f) Example of the widely ramified mineral group of mica. Some members of the mica mineral group have the undetectable element Li. The Al/Si and Fe/Mg ratios vary due to substitutions. (g,h) EDS spectra with numerous peaks. In the REE-bearing mineral bastnaesite, many peaks are close together at the low energy range while overlapping peaks of LREE at higher energy ranges complicate element identification and quantification. Artificial materials like sewage sludge ash (SSA) bear many elements in unusual combinations which are rarely realised in nature.
Minerals 10 01004 g003
Figure 4. SEM-AM in metamorphic petrology applications. (a,b) Sparse phase search method as applied for the search for monazite in micaschists. Monazite (Mnz) for EPMA-Th-U-Pb dating is characterised by coronas of allanite (Aln) and apatite (Ap); matrix minerals are biotite (Bt), K-feldspar (Kfs) and muscovite (Ms). (c) EDS spectral map of garnet with chemical zonation in a micaschist, modified from [54]. The EDS spectra for garnet are generically labelled according to the contents in Fe-Mg-Mn-Ca of a normalised analysis at the same position where the reference EDS spectrum has been gained in a porphyroblast and the corresponding pixels are coloured (see text). Ap—apatite; Bt—biotite; Chl—chlorite; Pl—plagioclase; Qtz—quartz. (d) EDS spectral map of a cordierite-sillimanite-garnet gneiss (kinzigite) from Saxonian Granulite Massif. Garnet 1 (Grt1) and garnet 2 (Grt2) porphyroblast generations can be distinguished by the lacking of Ca-rich garnet 1 core with corresponding pixels of the EDS spectra labelled by blue colours. Sil—sillimanite. (e) EDS spectral map of a glaucophane eclogite from metamorphic Zone 1 in Ile de Groix. EDS spectra for classification of zoned garnet are labelled generically and the corresponding pixels are coloured.
Minerals 10 01004 g004
Figure 5. SEM-AM in particle analysis applications. (ae) EDS spectral mapping and particle analysis (coarse pixels) for the characterisation of various grains in a sieved heavy mineral concentrate from a river sand. The pixels corresponding to generically labelled EDS spectra are coloured according to the ilmenite to leucoxene (rutile) natural weathering sequence. (fi) EDS spectral map views and BSE image of zoned tantalite-columbite grains in an ore concentrate from Africa with an unknown provenance. Growth direction of oscillatory zonation is indicated by arrows. (k) Frame view of an EDS spectral map from a sewage sludge ash sample, see legends of (l,m). (l,m) Details of sewage sludge ash particles as seen in spectral map with legends combining mineralogical and generic spectra labelling. The legends below the particles are arranged according to decreasing pixel number representing the area %.
Minerals 10 01004 g005
Figure 6. SEM-AM applied for the characterisation of a slag produced by melting of sewage sludge in a ceramic crucible. (a) Slag in a backscattered electron image (BSE). (b) Corresponding EDS spectral map of the slag. (c) BSE image of square marked in (b). (d) Details of slag in spectral map from (b). Needles and grains of P-Ca phases appear with random spatial distribution in a glassy phosphorous-calcium matrix. Fe-particles are enriched at the surface of the slag.
Minerals 10 01004 g006
Figure 7. SEM-AM applied for the characterisation of firing experiment products for reproducing the historical stoneware production, modified from [17,77]. (a,b) BSE image and related EDS spectral map of a measurement frame of the experimental product at 950 °C. (c,d) BSE image and related spectral map of experimental product at 1250 °C. Angular quartz fragments, plagioclase, K-feldspar, chlorite and enstatite grains are embedded in a matrix composed of diverse glassy phases. Matrix components are characterised by generically labelled EDS spectra and correspondingly coloured pixels. Area percent of components and matrix refer to the complete sample. Note the differences in modal proportions of matrix phases in area %.
Minerals 10 01004 g007
Publisher’s Note: MDPI stays neutral with regard to jurisdictional claims in published maps and institutional affiliations.

