Article

Study on the Anisotropy of Strength Properties of Columnar Jointed Rock Masses Using a Geometric Model Reconstruction Method Based on a Single-Random Movement Voronoi Diagram of Uniform Seed Points

1
Key Laboratory of Ministry of Education of Geomechanics and Embankment Engineering, Hohai University, Nanjing 210098, China
2
Jiangsu Research Center for Geotechnical Engineering, Hohai University, Nanjing 210098, China
3
College of Harbor, Coastal and Offshore Engineering, Hohai University, Nanjing 210098, China
*
Author to whom correspondence should be addressed.
Symmetry 2023, 15(4), 944; https://doi.org/10.3390/sym15040944
Submission received: 17 March 2023 / Revised: 17 April 2023 / Accepted: 18 April 2023 / Published: 20 April 2023
(This article belongs to the Topic Mathematical Modeling)

Abstract

:
The unique structural characteristics and special symmetry of columnar jointed rock mass result in its complex mechanical properties and strong anisotropy, which seriously affects the safety of engineering construction. To better simulate natural columnar jointed rock mass, a geometric model reconstruction method based on a single-random movement Voronoi diagram of uniform seed points using the feasible geological parameters of horizontal polygon density, irregular factor, dip angle, strike angle, transverse joint spacing, and transverse joint penetration rate is proposed in this paper. Based on this method, numerical simulation of CJRM models with varying strike angles, dip angles, and irregular factors under uniaxial compression were conducted. The results show that the uniaxial compression strengths versus strike angle and dip angle both decrease with the increase in the irregular factor, showing a U-shape and a gentle W-shape, respectively. The strength anisotropy of the strike angle decreases from 1.1057 to 1.0395 with the increase in the irregular factor, indicating relatively isotropy. With the increase int the irregular factor, the strength anisotropy of the dip angle increases from 4.3381 to 6.7953, indicating an increasing strong anisotropy at a high degree, and the effect of the irregular factor on strength behavior has the strongest and weakest impact at the dip angles of 60° and 90°, respectively.

1. Introduction

Columnar jointed rock mass (CJRM) is commonly believed to be formed by the rapid cooling and contraction of high-temperature lava after coming into contact with a cold surface [1,2]. This process results in the intact rock mass being divided into relatively regular prisms by an interconnected fissure network with special symmetry. CJRM is mainly distributed in China, the USA, Australia, and other countries, with the most famous CJRM being the giant embankment in Northern Ireland [3]. The mechanical properties of CJRM become very complex due to the existence of special joint structures generated during its formation process, which show obvious discontinuity and strong anisotropy, bringing great challenges to the safe and stable operation of such rock engineering construction [4,5]. Therefore, an accurate understanding of the anisotropic mechanical properties of CJRM is crucial.
The Baihetan Hydropower Station is a large-scale hydropower station located in Southwest China, with large-scale CJRM as the dam foundation. The widely distributed CJRM has poor mechanical properties and strong anisotropy, which has a great impact on the construction and long-term stability of important projects, such as water conveyance tunnels, dam foundations, and underground powerhouses. Recently, numerous researchers have studied CJRM, taking the Baihetan Hydropower Station as the engineering background. By analyzing the existing literature, it can be seen that the current research methods mainly include the field test, physical model test, and numerical simulation.
Since the planning of the Baihetan Hydropower Station, many researchers have conducted geological exploration and field tests on the project site, including in-situ true triaxial tests [6,7], situ drilling tests [8], acoustic wave tests [9], and in-situ compression creep tests [10], which provide vital support for the design and construction of CJRM engineering projects.
The use of similar material physical models has the advantages of simple preparation, the ability to simulate various engineering conditions [11] not limited to the project site conditions, and a relatively low cost, becoming an effective means of studying the mechanical properties of CJRM. Ji et al. [12] and Xiao et al. [13] used several materials to fabricate regular hexagonal CJRM models and analyzed the failure modes and mechanical behavior of CJRM under unconfined conditions. Lu et al. [14] prepared regular hexagonal CJRM models with different dip angles and conducted polyaxial tests to study the influence of the dip angle on the anisotropy of CJRM. Que et al. [15] prepared quadrangular, pentagonal, and hexagonal CJRM models for multiaxial tests to study the influence of the cross-section shape on the strength and deformation characteristics of CJRM. These physical models were prepared to simulate regular cross-section CJRM and are reasonable simplifications of natural CJRM, but they are inconsistent with the geological characteristics of natural CJRM. With the maturity of 3D printing technology and its successful application in physical model tests, Xia et al. [16,17] fabricated 3D printing models based on the geological characteristics of the Baihetan Hydropower Station and conducted the true triaxial compression test with one free face to study the mechanical properties and excavation responses of CJRM in the Baihetan Hydropower Station. Nevertheless, due to the high cost brought by the high precision requirement of 3D printing, it is still difficult to fabricate 3D printing models in large quantities to simulate various engineering conditions.
The numerical simulation also provides an effective method to study the anisotropy of CJRM. Reconstructing irregular cross-section CJRM using a Voronoi diagram is a common method in current numerical simulation studies of CJRM. Based on this diagram, Di et al. [18] studied the representative element volume (REV) scale and equivalent strength parameters of CJRM using 3DEC software. Zhu et al. [19] studied the failure characteristics of columnar joints in the diversion tunnel and simulated the failure mechanism using numerical methods. Meng et al. [20,21] proposed a numerical model generation method using modified centroidal Voronoi diagrams, which can be effectively combined with geological investigations, and carried out a numerical homogenization study on CJRM to predict its mechanical properties. Zhang [22] proposed a modified Voronoi polygons method to simulate the special joint network characteristics of CJRM well combined with engineering geological measurements and to study the stress–strain characteristics of CJRM under different regularities using 3DEC software. At present, the above two methods are mainly used in simulating the cross-section of CJRM. Nevertheless, the generation process is often accompanied by uncontrollable randomness and research on the generation of transverse joints by these two methods is not studied. Therefore, the generation of a geometric model that can make full use of the statistical data obtained from geological exploration as much as possible to better simulate a realistic CJRM is needed.
In this study, a single-random movement Voronoi diagram to simulate the irregular horizontal section of CJRM was proposed. Based on this, a geometric model reconstruction method was developed using feasible geological statistical parameters for CJRM to better simulate it in numerical research and physical model tests. Numerical uniaxial compression tests were performed on the numerical CJRM models generated by this method. Based on the test results, the effects of the strike angle and dip angle on the strength behavior and anisotropy of CJRM with different irregular factors were analyzed. The results and method can provide a valuable reference for related engineering applications.

2. Geometric Model Reconstruction Method for CJRM

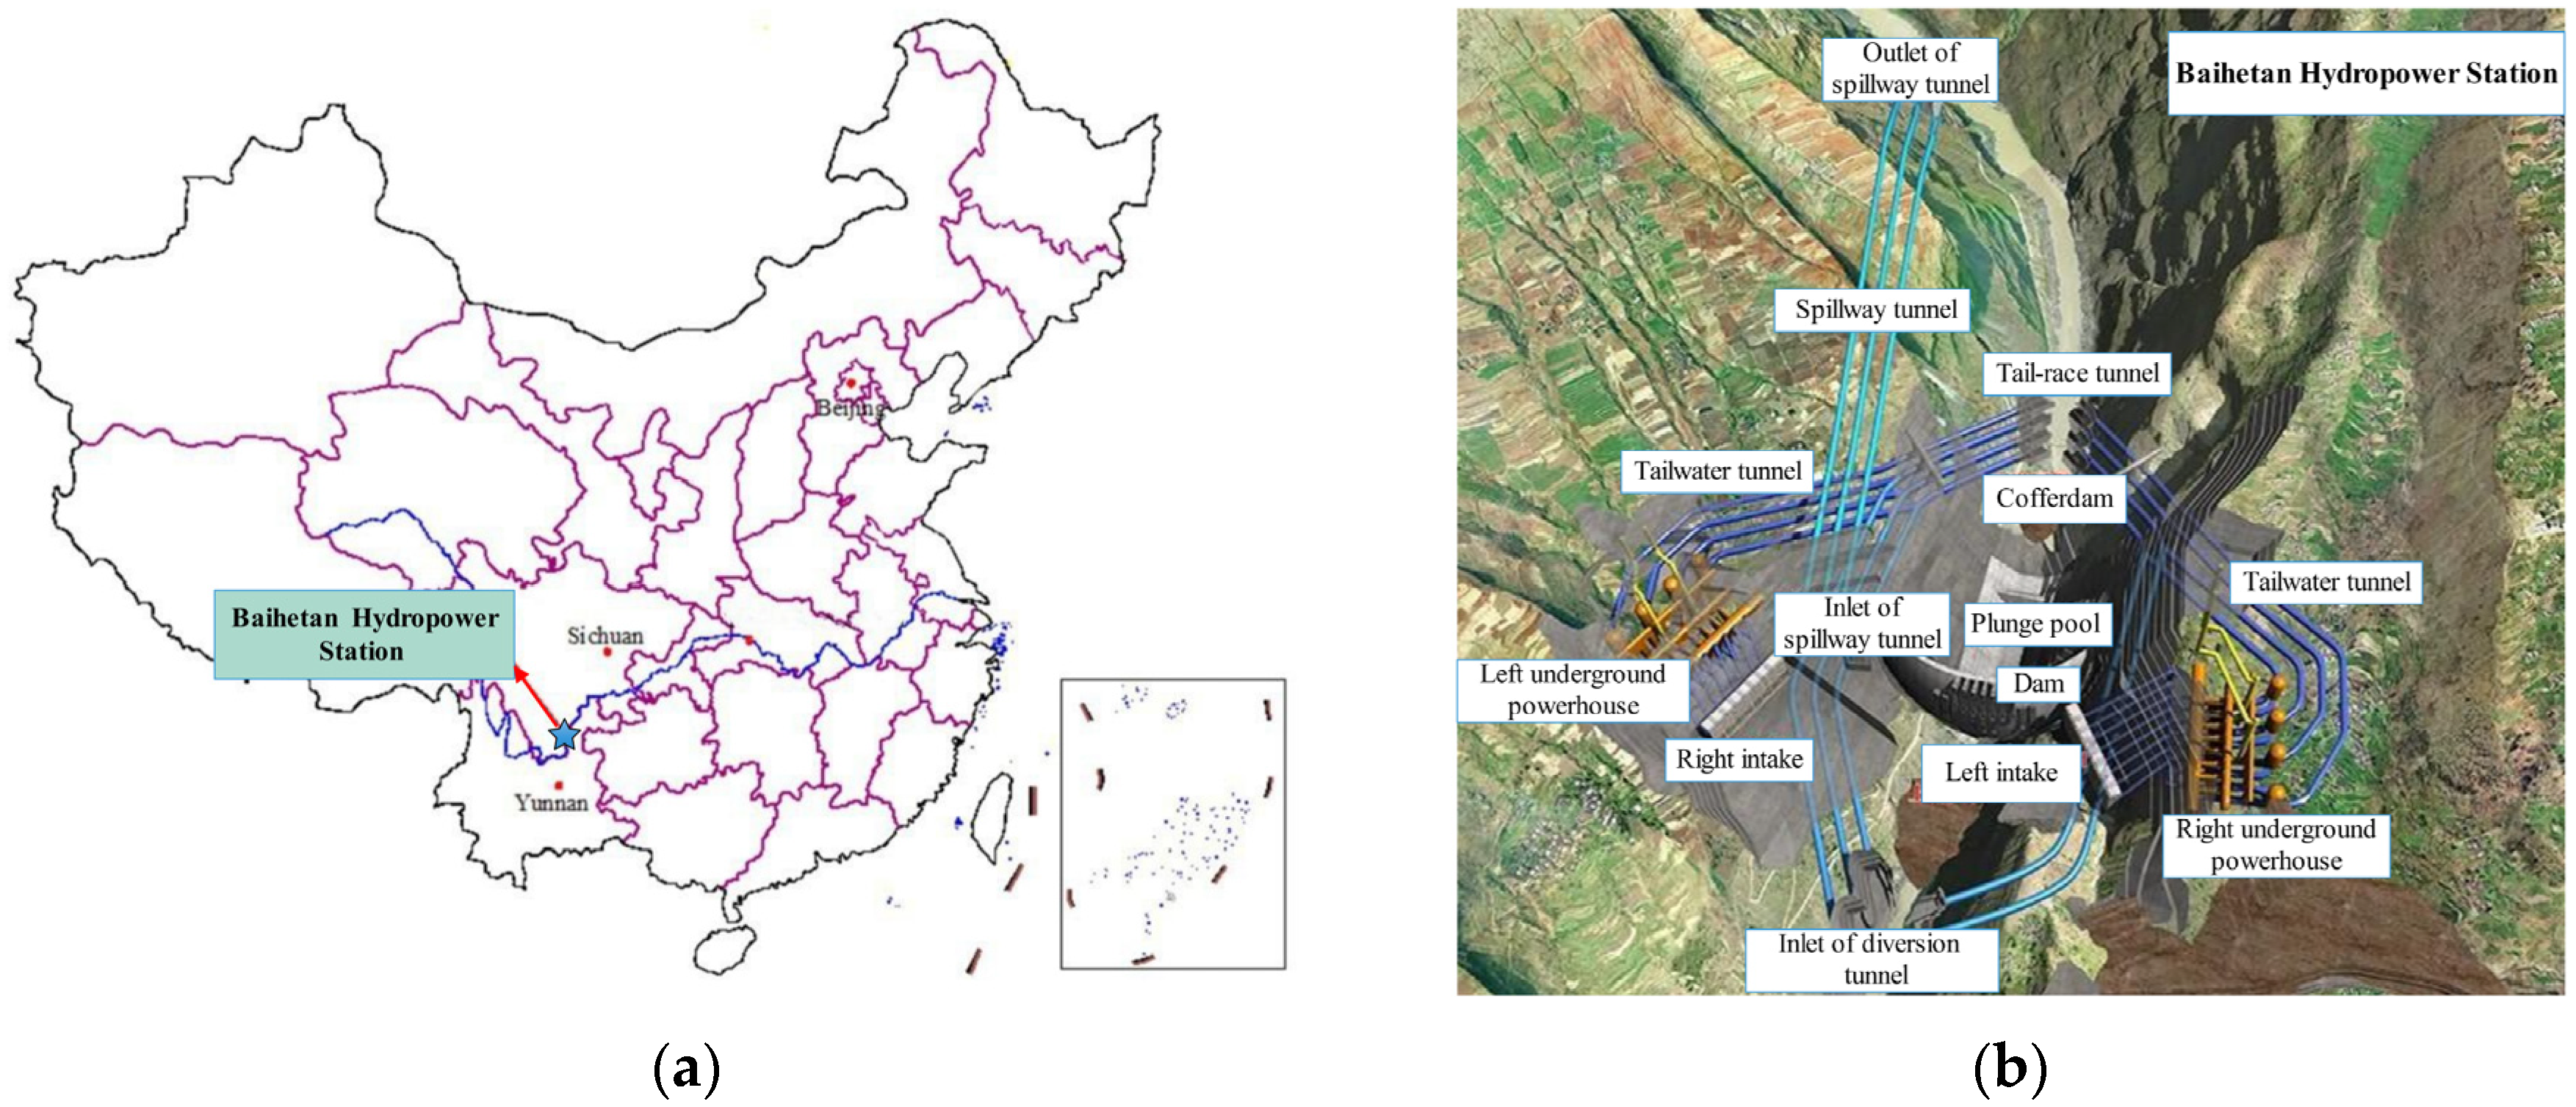
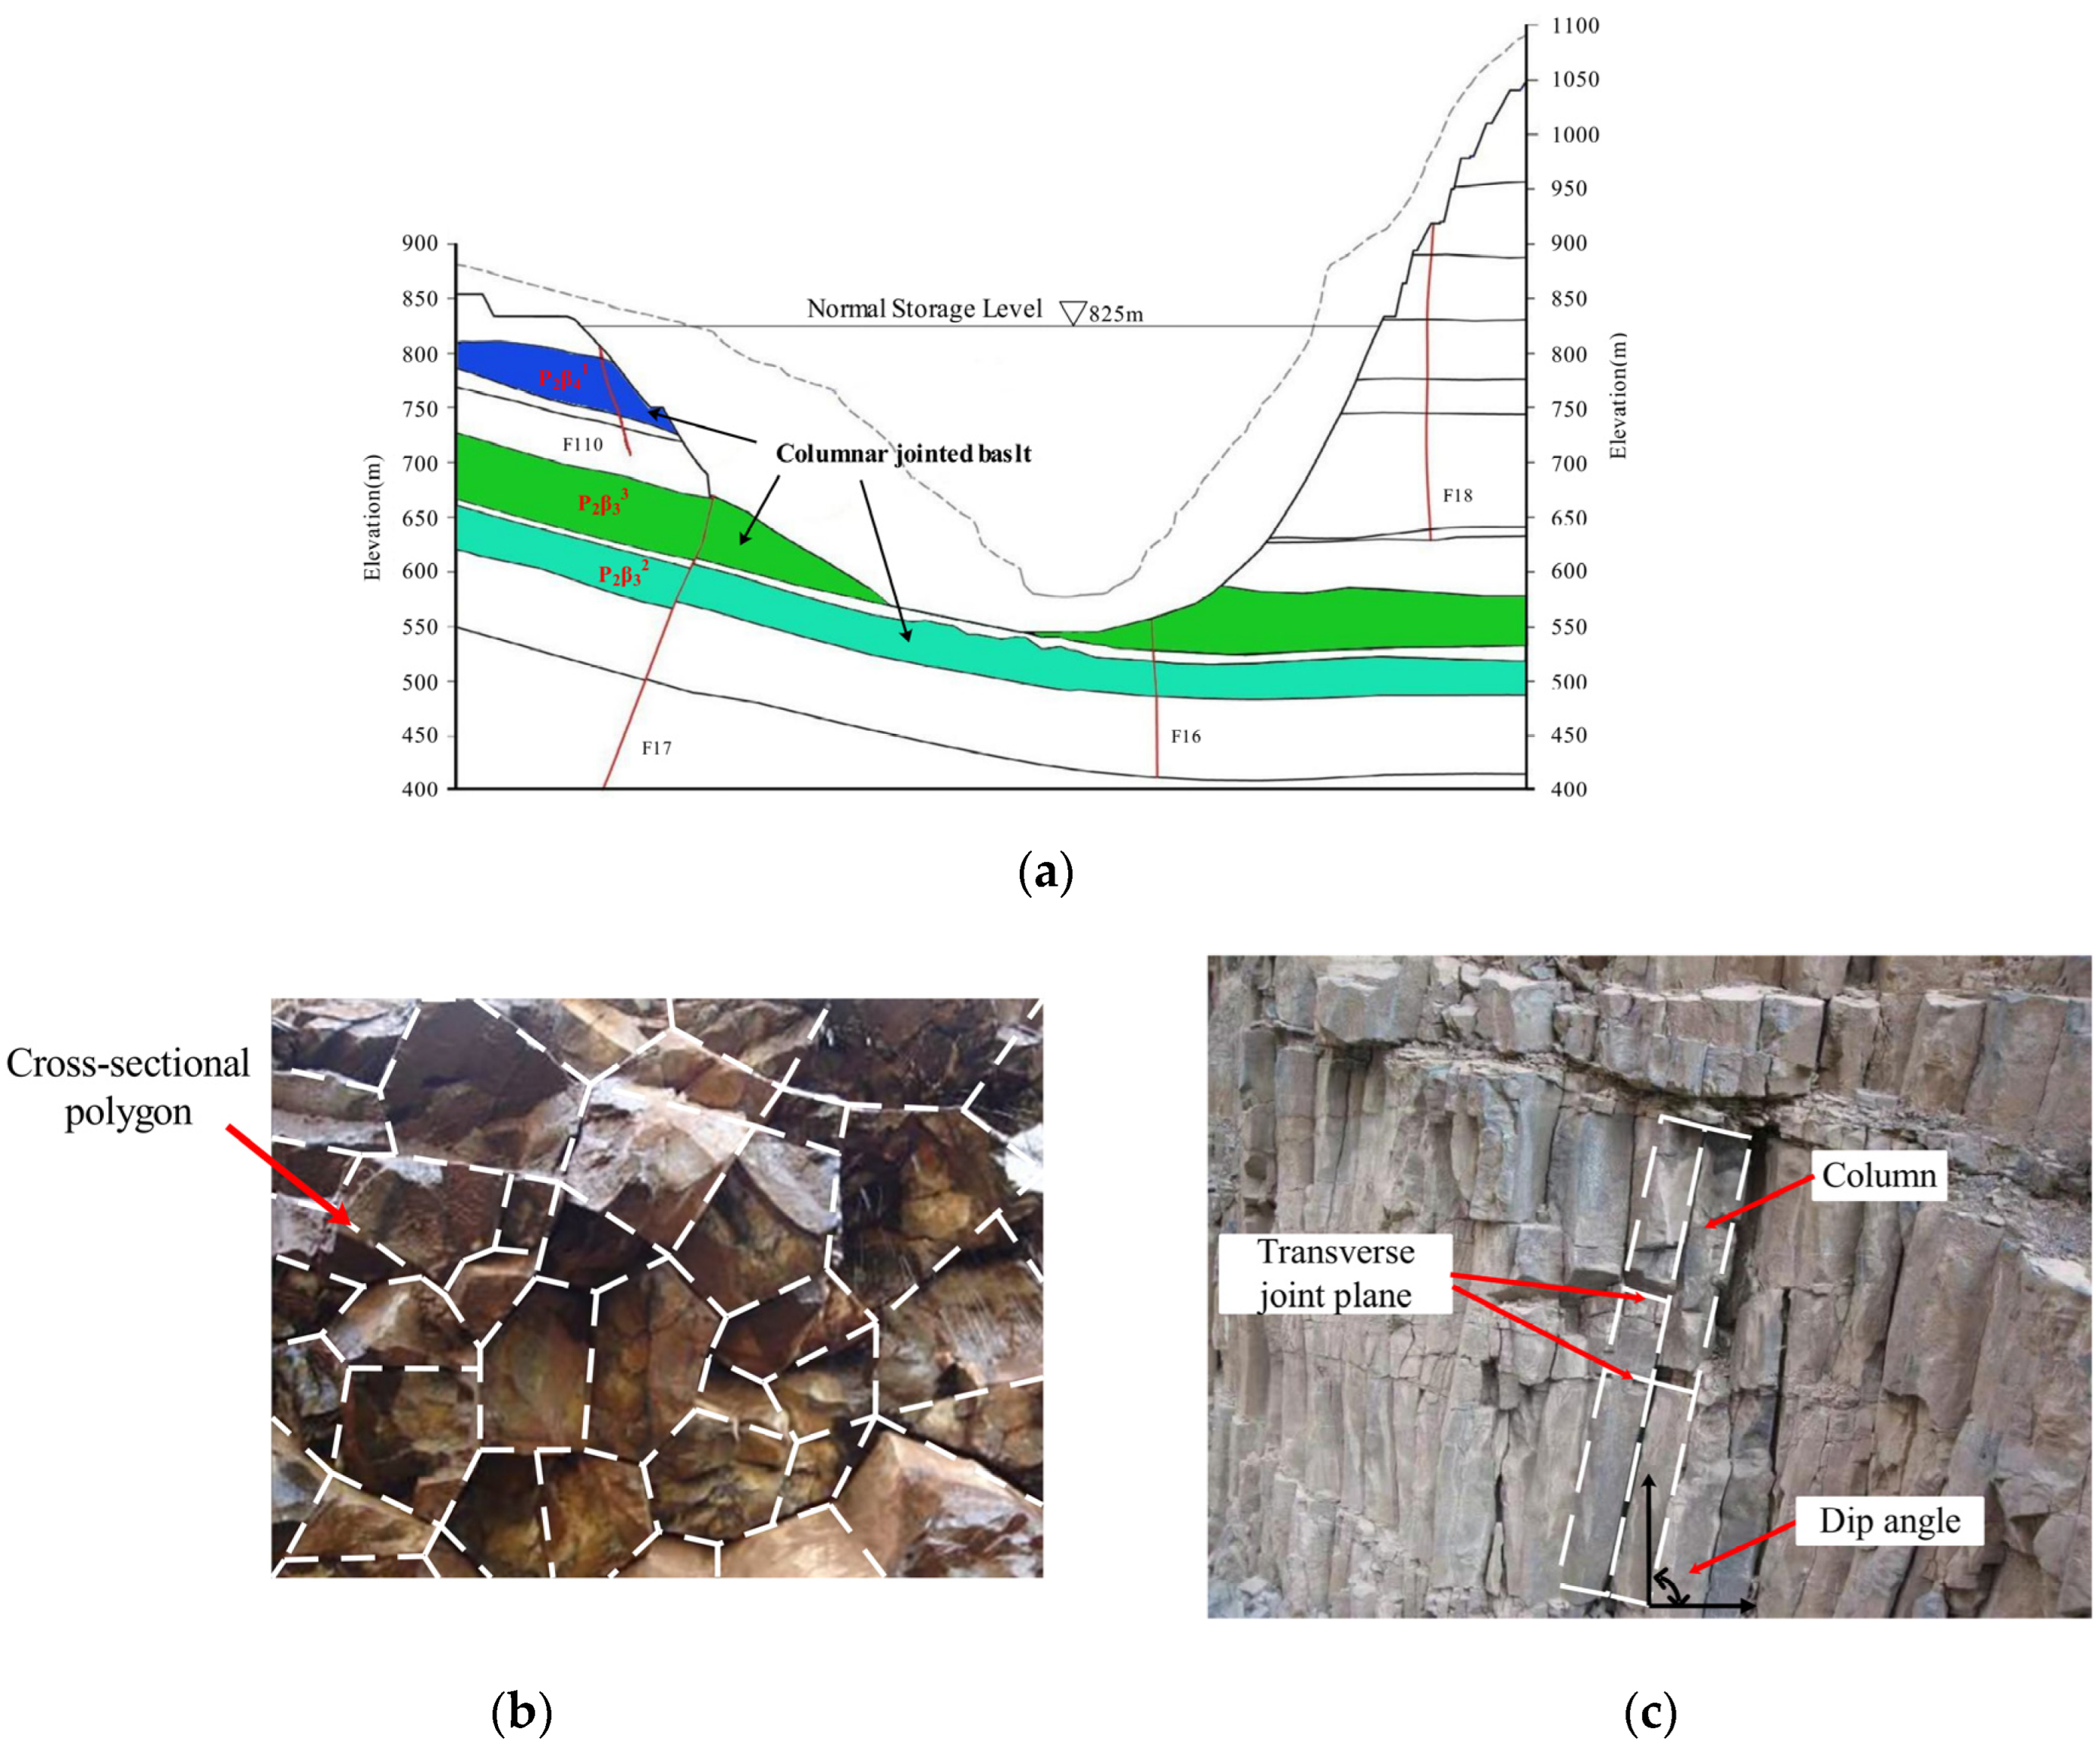
2.1. Engineering Background of the Baihetan Hydropower Station and Feasible Geological Statistical Parameters

The Baihetan Hydropower Station is situated in the lower reaches of the Jinsha River, located at the junction of Yunnan Province and Sichuan Province in Southwest China, as illustrated in Figure 1a. It has a total installed capacity of 16,000 MW, making it the world’s second-largest hydropower station. The system comprises arch dams, water conveyance pipes, and underground water diversion and power generation systems, reaching a height of 289 m, as shown in Figure 1b.
The geological exploration and construction of the dam foundation at the Baihetan Hydropower Station encountered highly complex geological conditions. The rock lithology in the area consists mainly of columnar jointed basalt, aphanitic basalt, and breccia lava, as shown in Figure 2a. These geological conditions have presented significant difficulties and challenges in ensuring the subsequent safe and stable operation. Columnar jointed basalt is mainly distributed in P2β3–P2β4 (a transitional interval between the Lower Permian P2β3 and Upper Permian P2β4) rock stratum [23], the CJRM horizontal cross-sectional shapes are composed of irregular polygons, primarily including quadrilateral, pentagonal, and hexagonal polygons, as shown in Figure 2b. Additionally, there are transverse joints with a large penetration rate in the vertical cross-section, as shown in Figure 2c.
Detailed geological exploration of representative CJRM regions of Baihetan Hydropower Station is an essential step to study the mechanical behavior of the CJRM [24]. Through prospecting the visible CJRM horizontal cross-section in the representative area, statistical data regarding the areas of each cross-sectional polygons, Ai, and the total area of the visible region, A, can be acquired. For the description of the geometric characteristics of the irregular polygons of the CJRM horizontal cross-section, the polygon density, Q, of the horizontal cross-section and the irregular factor, Ir, of the cross-sectional polygons are adopted [25,26]. The horizontal cross-sectional polygon density, Q, can be calculated by dividing the number of irregular polygons in the exploration region by the area of the exploration region, A. To describe the irregular factor, Ir, of the horizontal cross-sectional polygons, the variation coefficient of the polygon area is adopted, that is, the ratio of the standard deviation of each polygon area within the exploration region to the average polygon area, as shown in the following Equation (1):
I r = S D M N = 1 n 1 i = 1 n ( A i i = 1 n A i n ) i = 1 n A i n × 100 %
where SD is the standard deviation of each polygon area within the exploration region, MN is the average polygon area of the cross-section, n is the total number of polygons of the cross-section, and Ai is the area of the polygon, i.
Through the geological exploration and statistical analysis of CJRM occurrence and the vertical cross-section in the representative region, the average representative values of the dip angle, Da, strike angle, Sa, transverse joint spacing, S, and transverse joint penetration rate, P, are also available.

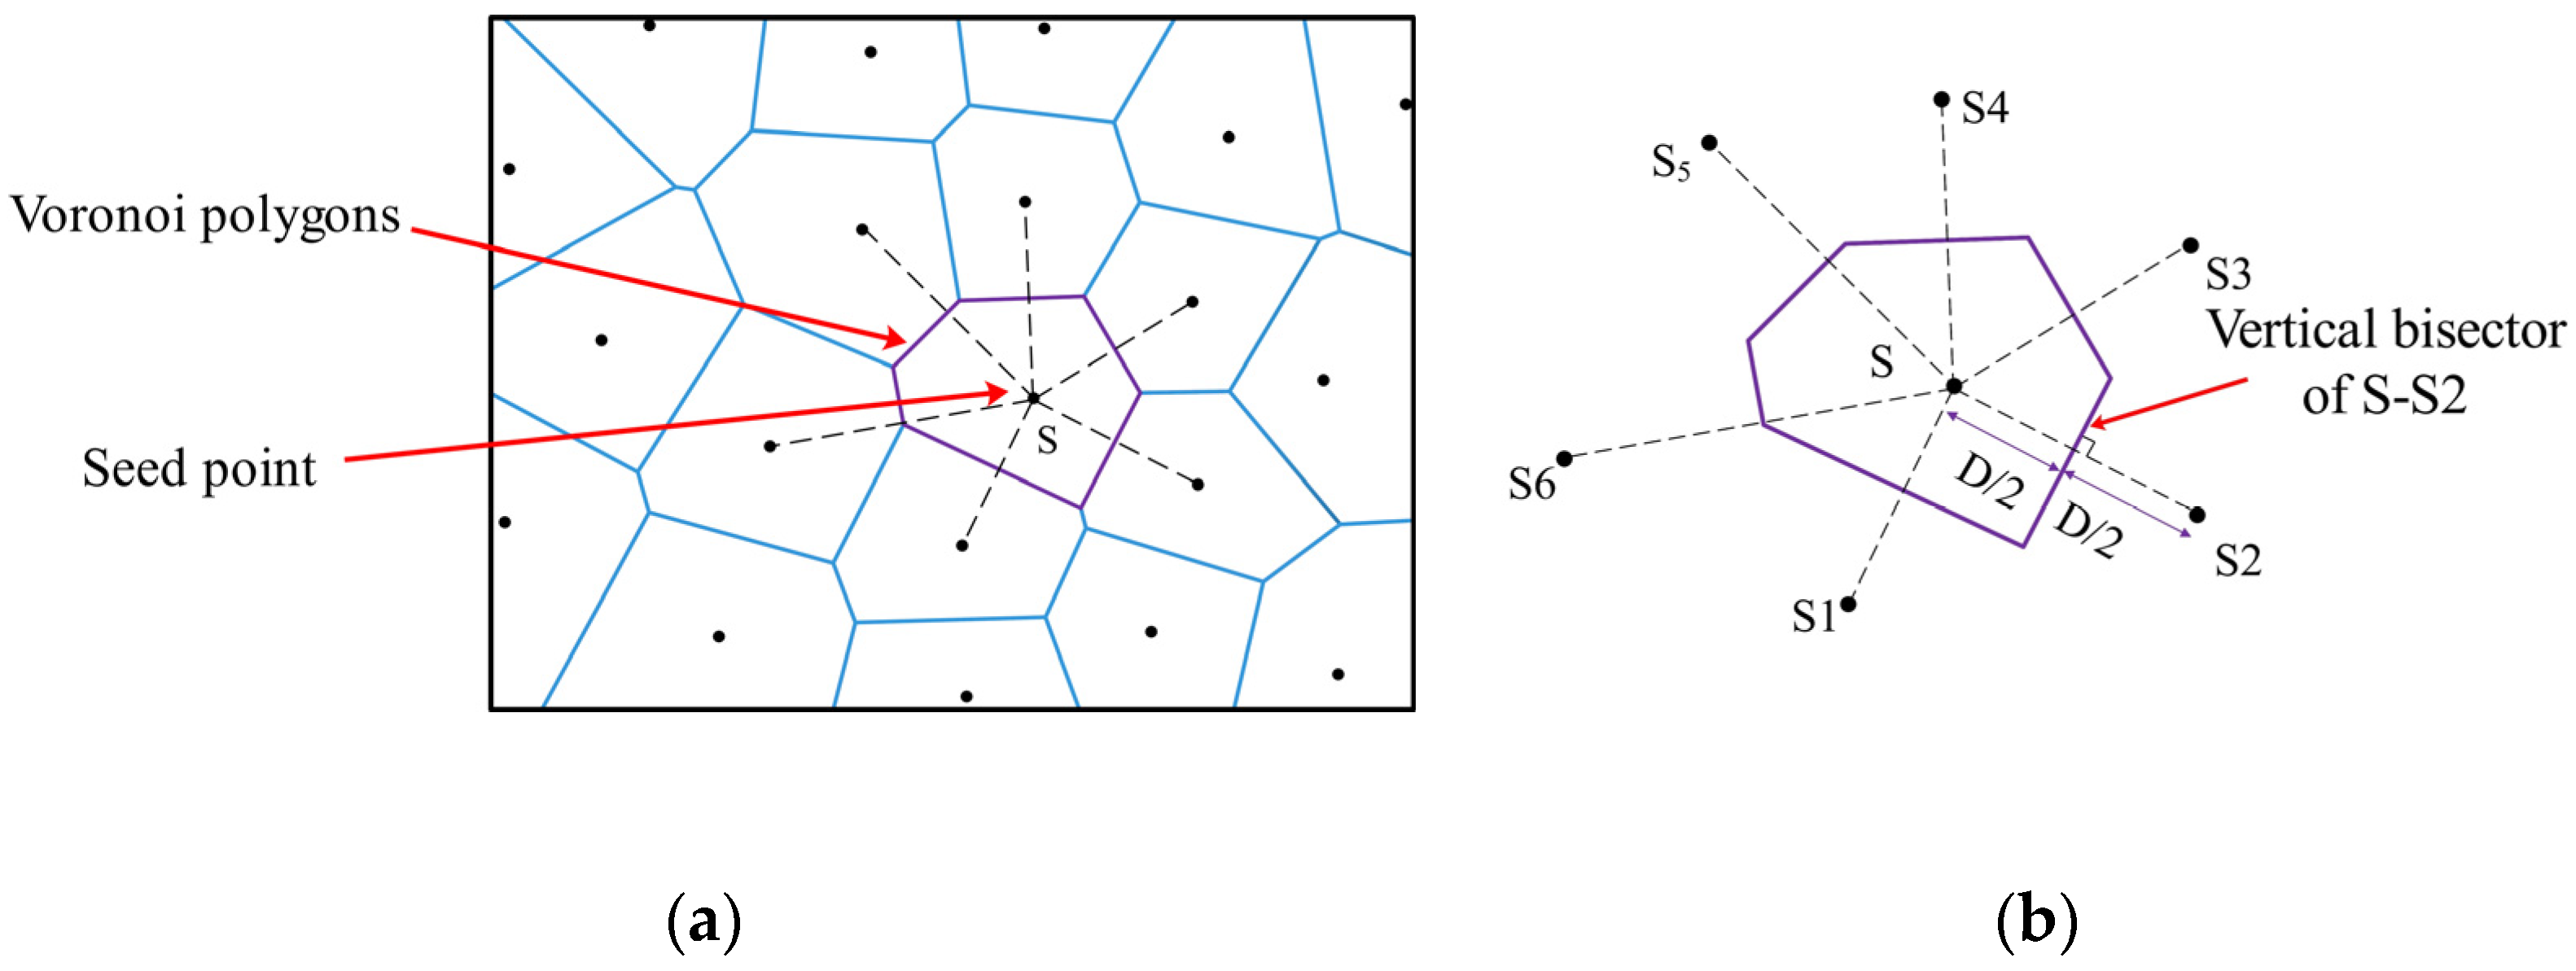
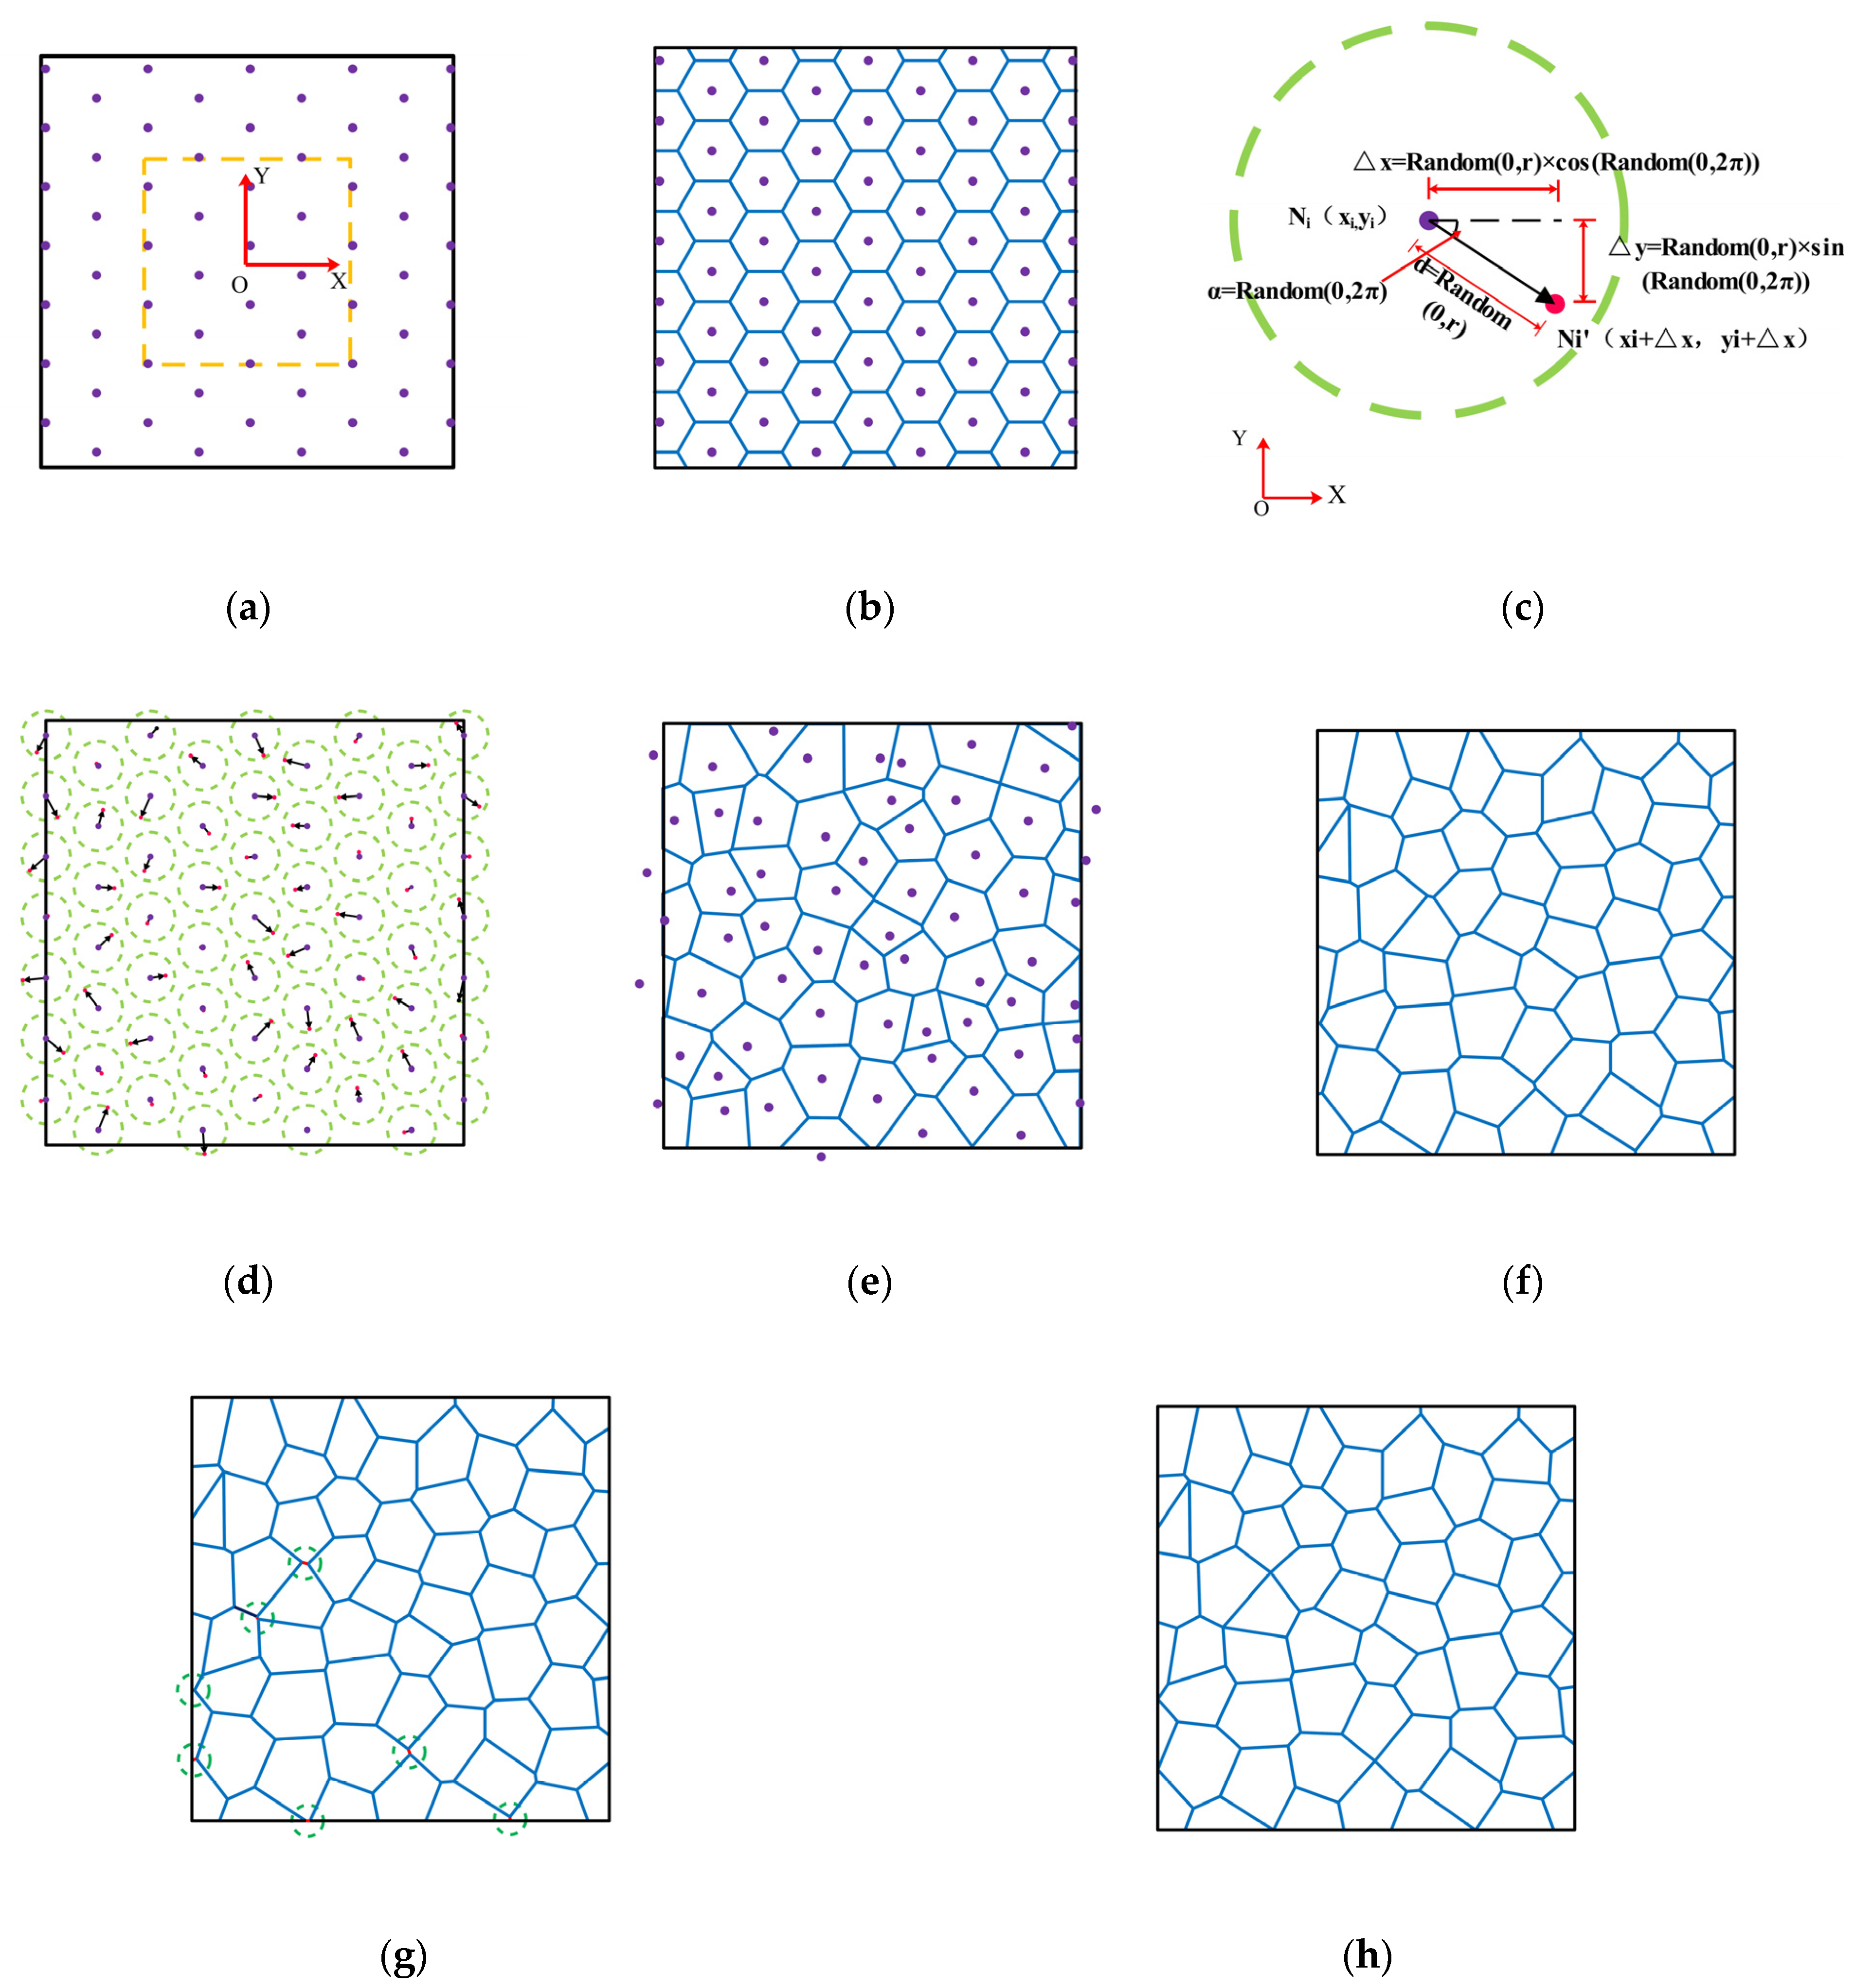
2.2. Single-Random Movement with a Range Constraint Voronoi Diagram of Uniform Seed Points

The Voronoi diagram is a polygonal network structure formed around randomly distributed seed points, S, according to the nearest neighbor principle [27]. It is composed of a group of continuous polygons composed of vertical bisectors of two adjacent seed points, as shown in Figure 3. The Delaunay triangulation algorithm can be used to generate these polygons [28]. Currently, the Voronoi diagram is widely used in many fields, including geotechnical engineering, computer science, sociology, etc., and has been proven to be effective in simulating the horizontal cross-section of CJRM [29].
CJRM is widely believed to be formed by the contraction of high-temperature lava after sharp cooling. Under ideal conditions, high-temperature lava will form a certain number of uniform and regular contraction centers when encountering relatively low-temperature air. The high-temperature lava then shrinks around the contraction center, producing tensile joints from the surface encountering cold air to the interior of lava. These tensile joints are exactly columnar joints. Since the distance between adjacent contraction centers is equal, regular hexagonal prisms with symmetry are generated. In reality, environmental conditions are very complicated and the high-temperature lava is non-homogeneous; the uniformly distributed contraction center under ideal conditions will be disturbed. Due to irregularly distributed contraction centers, the CJRM form horizontal cross-sectional polygons showing geometric features similar to Voronoi diagrams. To simulate this phenomenon as accurately as possible and obtain the Voronoi diagrams of specific cross-sectional polygon density, Q, and irregular factor, Ir, a method to generate single-random movement with a range constraint Voronoi diagram of uniform seed points is proposed. The method consists of the following four procedures (taking a target reconstruction 2D model with plane size of 1 m × 1 m, polygon density, Q, of 10 m−2, and a factor, Ir, of 35%) for example:
(a) Generate uniformly distributed seed points in the expanded region based on polygon density, Q, and model plane size, L × H (length and height). The number of the seed points, Nc, is calculated by Equation (2):
N c = Q × A e = Q × 2 L × 2 H
where Ae is the area of the expanded region, and the expansion multiple is set as 2 (Ae = 2L × 2H) for the 3D geometry rotation in the subsequent procedure.
Create the coordinate system with the center of expanded region as the origin, and the coordinate point of each seed point, I, is Ni (xi,yi), as shown in Figure 4a.
The Voronoi diagram generated by the uniformly distributed seed points is a regular hexagon, which is consistent with the horizontal cross-section of CJRM under ideal conditions, and the irregular factor, Ir, of the Voronoi diagram is 0, as shown in Figure 4b.
(b) Randomly single move each uniformly distributed seed point in the expanded region within a circle with radius r. The radius, r, is set using Equation (3):
r = l × η × I r ( η = ( 100 + i ) % )
where l is the distance between adjacent seed points, which is equal for each seed point due to uniform distribution and can be easily calculated, η is the range factor defined to control the size of the constraint range, i is the number of iterations, and the initial number of iterations is 0.
The single-random movement is realized by letting each seed point move towards a random angle, α, ranging between 0 and 2π and a random distance, d, ranging between 0 and r, which can be easily realized using Equations (4) and (5):
x i = x i + Δ x = x i + Random ( 0 , r ) × Cos ( Random ( 0 , 2 π )
y i = y i + Δ y = y i + Random ( 0 , r ) × Sin ( Random ( 0 , 2 π )
as shown in Figure 4c,d.
Generate the Voronoi diagram of the moved seed points in the expanded region, as shown in Figure 4e.
(c) Calculate the irregular factor, Iri, of the new generated Voronoi diagram. Calculate the error range, Ei, between the irregular factor, Iri, and the target irregular factor, Ir. If the error range does not meet the requirement (set by specific engineering conditions), perform a new random-single movement according to procedure (b) and repeat procedure (c) until the error range meets the requirement, as shown in Figure 4f. Before performing a new random-single movement, compare the irregular factor, Iri, with the target irregular factor, Ir; if Iri < Ir, then i = i + 1, if IriIr, then the defined range factor η remains unchanged in the subsequent iterations.
(d) Eliminate relatively short edges in the final generated Voronoi diagram. The existence of the short edges will cause extensive calculations when meshing the model in the numerical simulation research process. Short edges also bring tremendous trouble when conducting the physical model test in mold design and demolding process, so shorter edges need to be deleted. The short edge is defined as less than or equal to 0.1l, and the method of eliminating the shorter edge in the Voronoi diagram is to combine the two endpoints of the short edge, as shown in Figure 4g.
The Voronoi diagram with the target polygon density and irregular factor, and without relative short edges, is successfully generated to simulate the horizontal cross-section of CJRM, as shown in Figure 4h, after following the above four procedures.

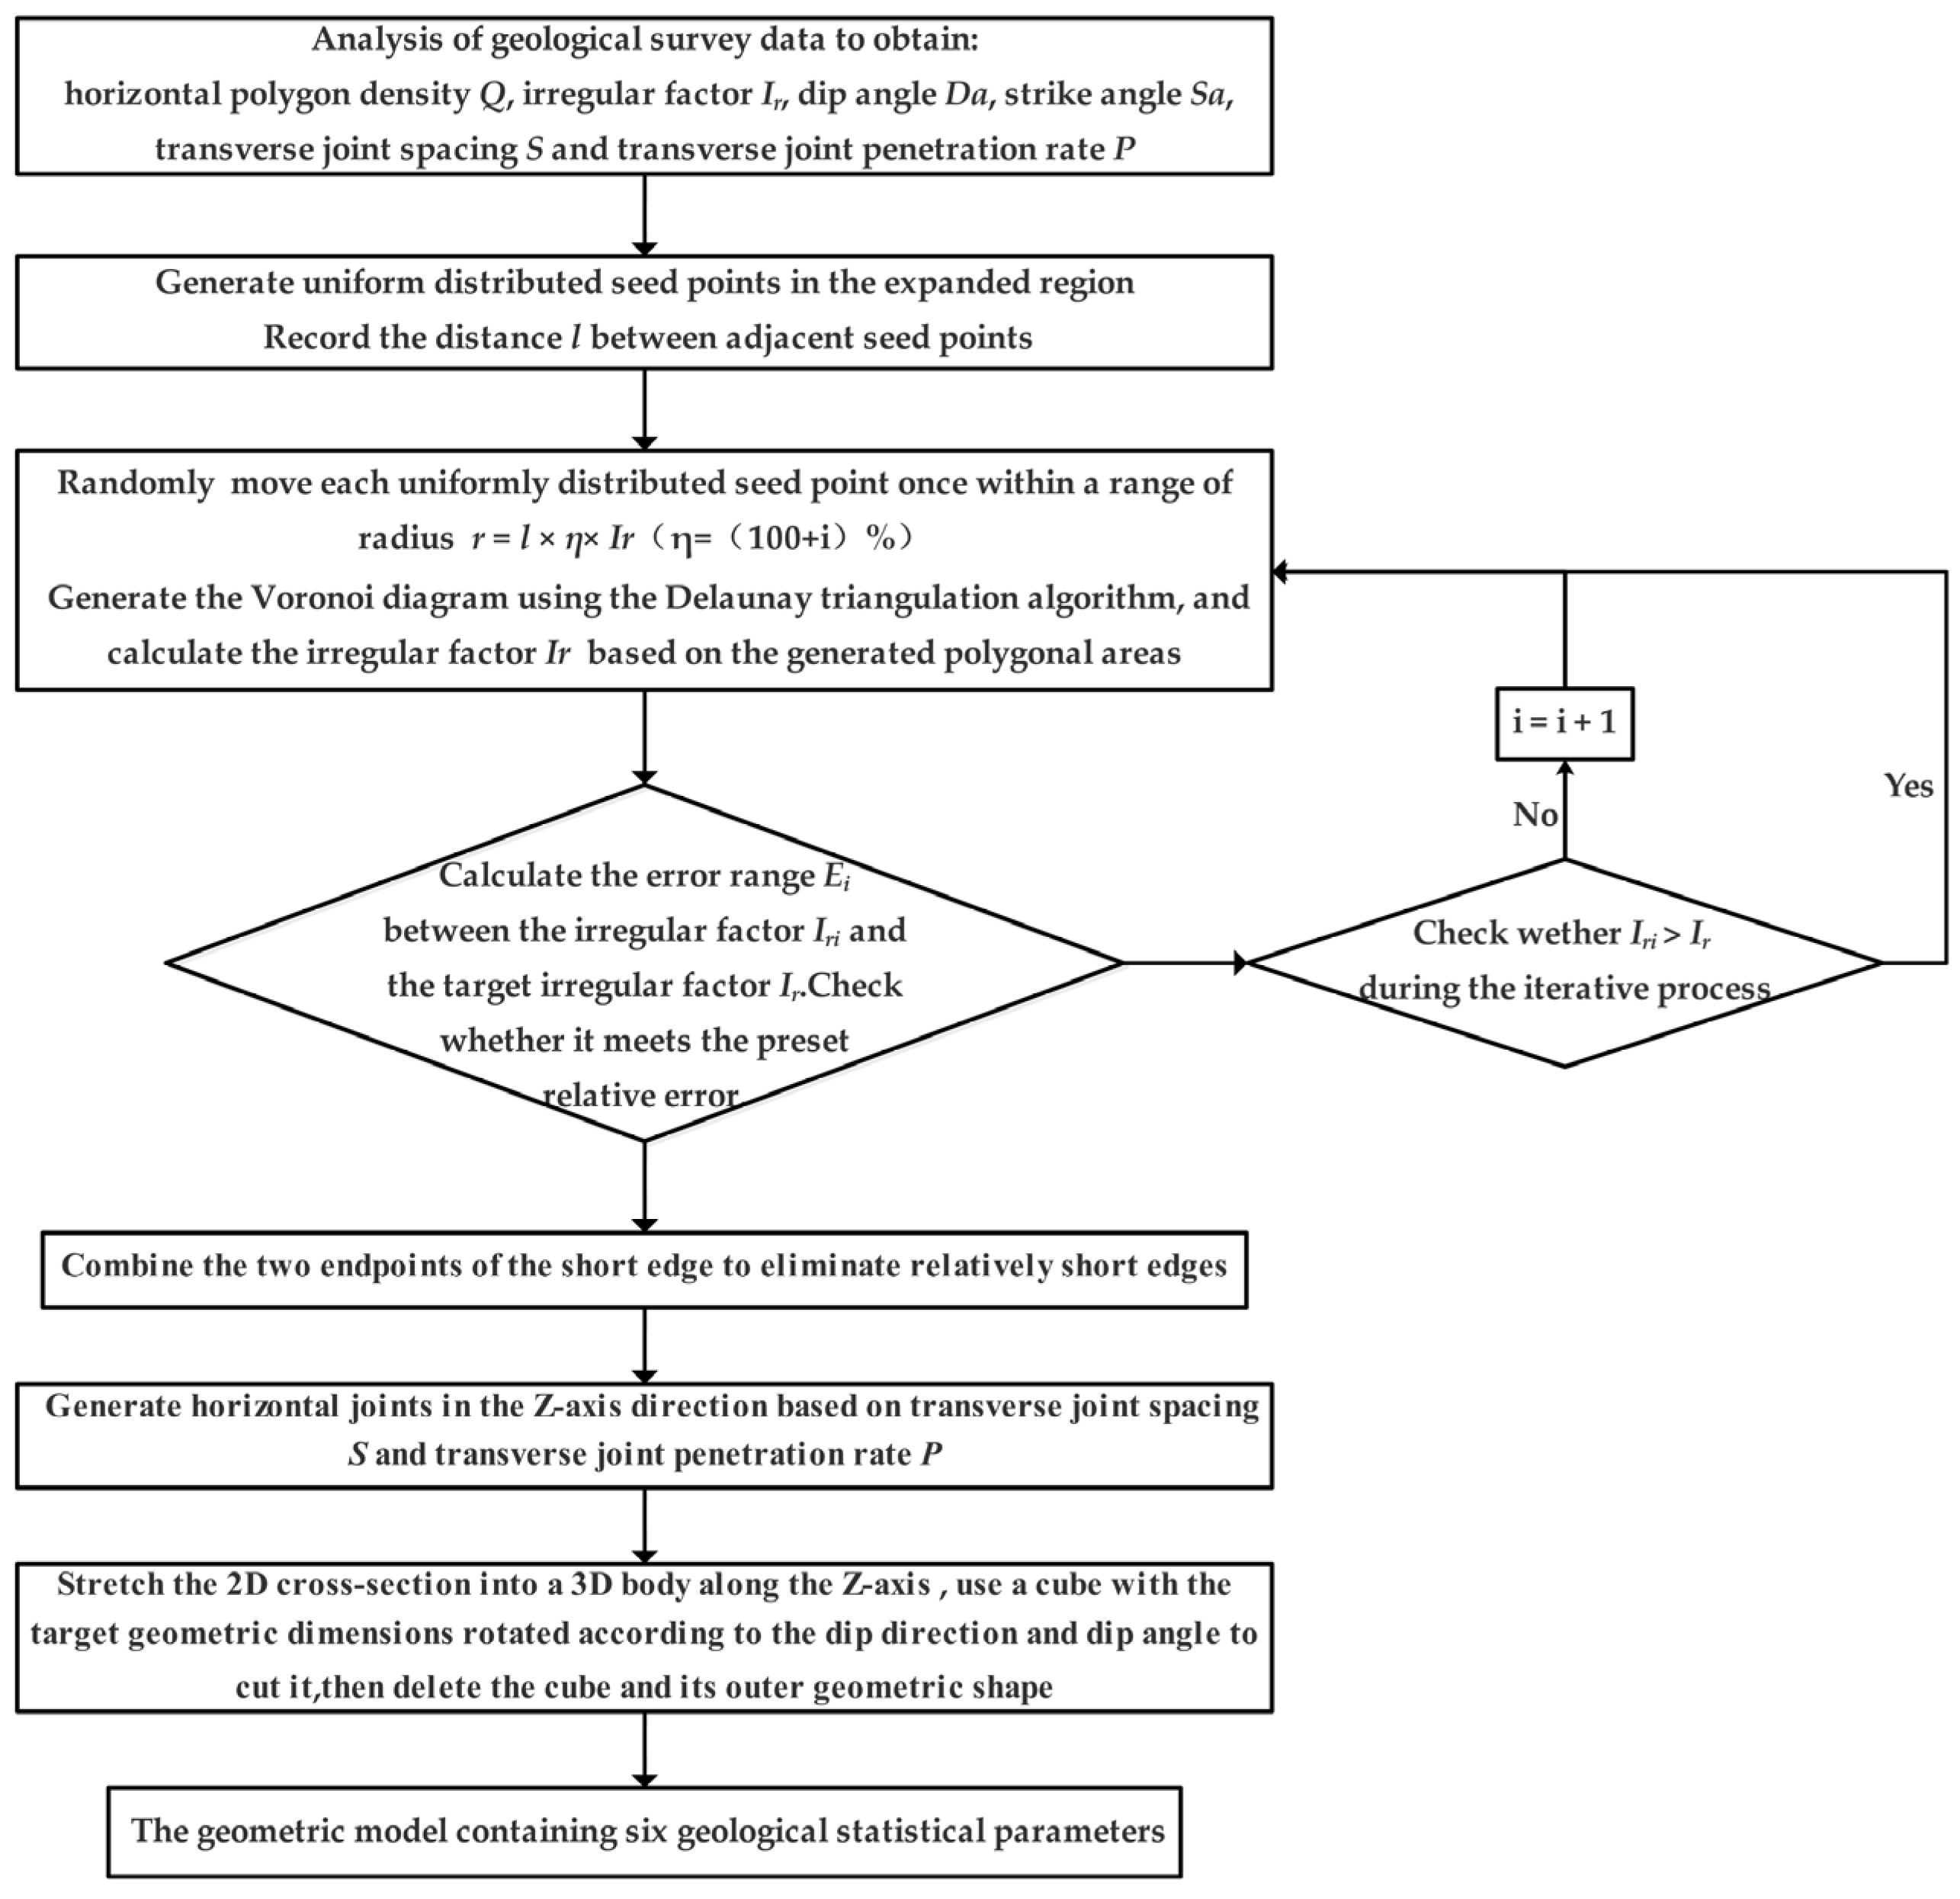
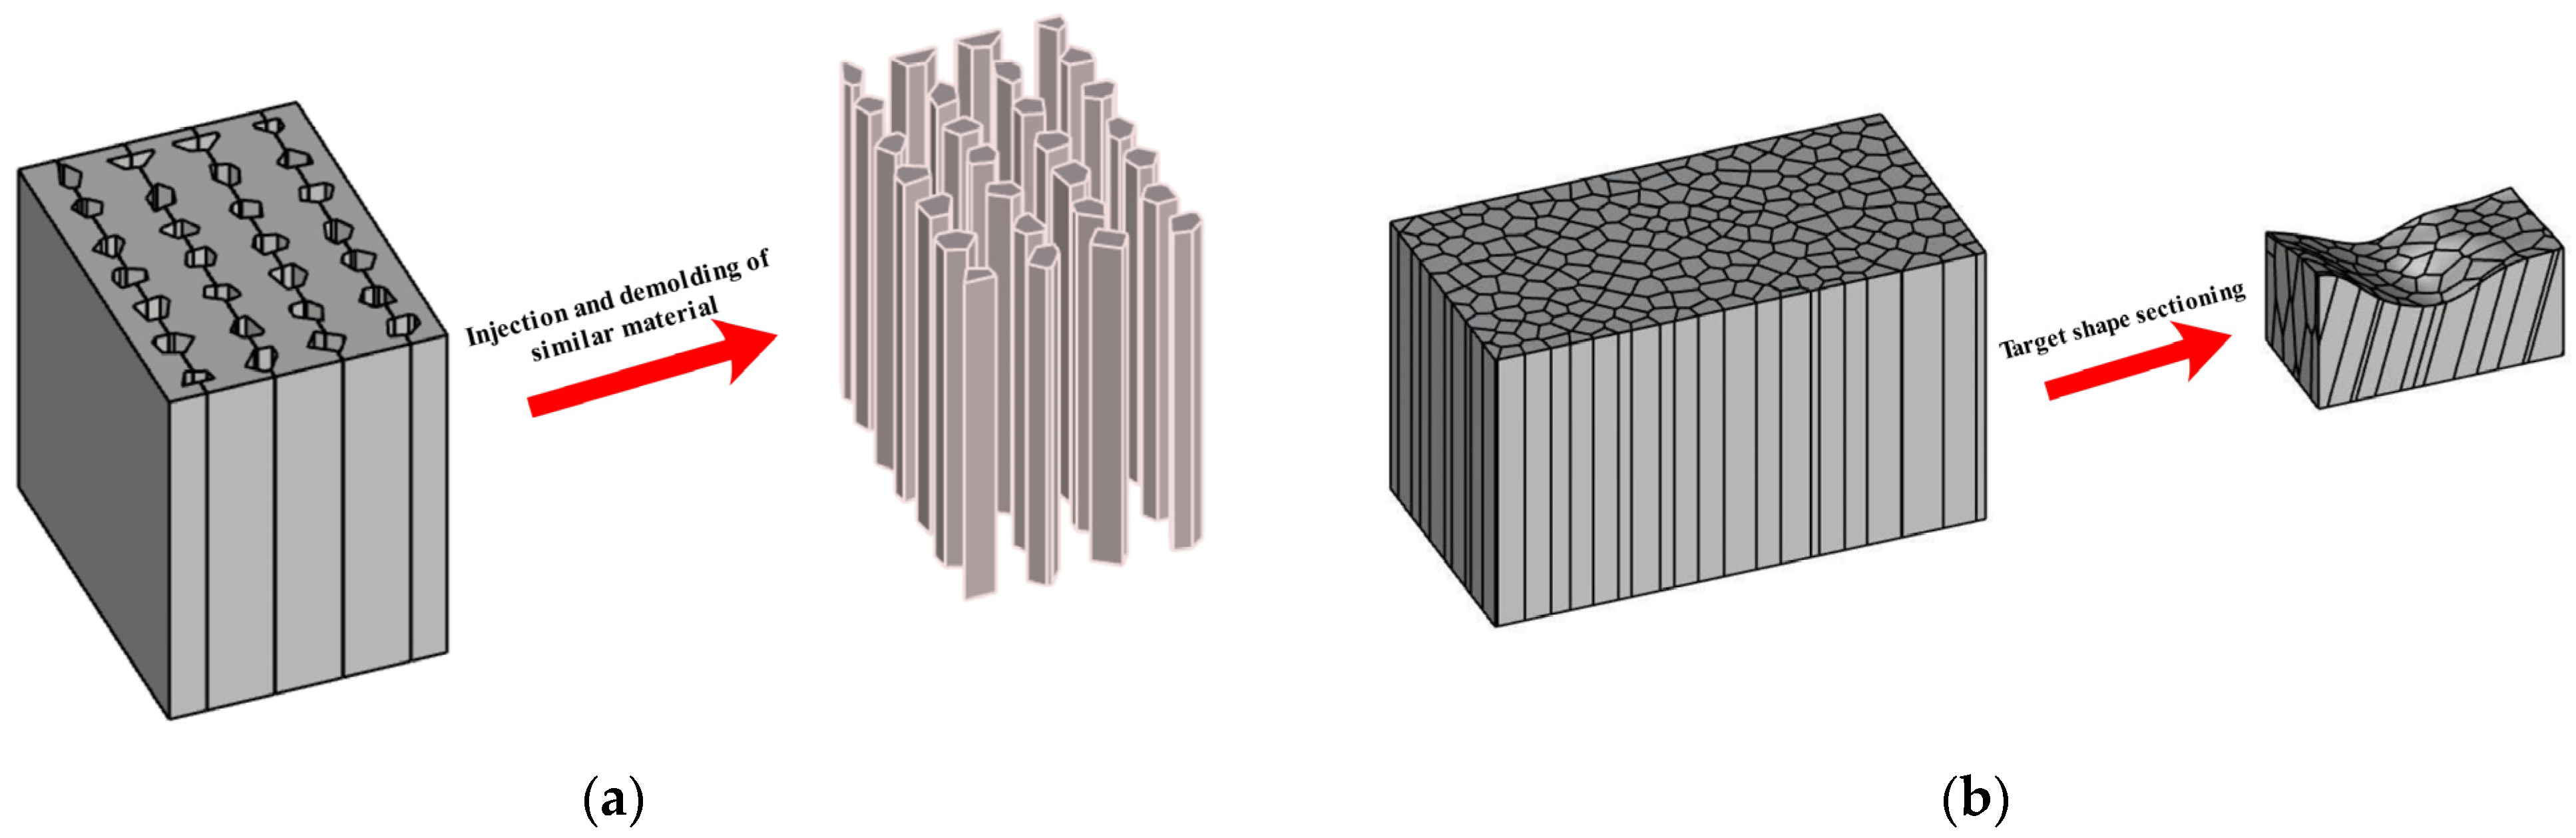
2.3. CJRM Geometric Model Reconstruction Method

After generating the Voronoi diagram using the above procedures, the 2D plane figure possesses two geological exploration statistical parameters: polygon density, Q, and irregular factor, Ir. The CJRM geometric model needs to be generated on this 2D plane, which is divided into the following three procedures:
(a) Establish a Z-axis vertically from the origin of the 2D Voronoi diagram. Copy the diagram along the Z-axis with spacing, S (transverse joint spacing), in the range of Z = 0–2H (H is the target height).
Select Ni polygons randomly in each 2D diagram, and Ni is calculated by Equation (6):
N s = N c × P
where Ns is the number of the selected polygons in each 2D diagram, Nc is the number of polygons in the 2D diagram, and P is the transverse joint penetration rate.
Delete the unselected polygons, as shown in Figure 5a.
(b) Extrude the 2D diagram along the Z-axis from Z = 0 to Z = 2H to form the geometric model, which only includes prisms and joint planes. The joints are composed by columnar joints and transverse joints.
Move the origin of the coordinate axis to the center of the geometric model, as shown in Figure 5b.
(c) Generate a cube with a size of L × W × H, taking the origin as the central point. Rotate the cube strike angle Sa clockwise around the Z-axis on the X–Y plane with the origin as the center. Rotate the cube dip angle, Da, clockwise around X-axis on the Y–Z plane with the origin as the center, as shown in Figure 5c.
Use this cube to clip the geometric model and remove prisms and joint planes outside the range of the cube. Delete the cube, and the final CJRM geometric model with six geological statistical parameters is finally generated, as shown in Figure 5d.
The above geometric model reconstruction method for CJRM can be easily achieved using Python, C++, and other programs. Though this method, the geometric model contains six geological statistical parameters, including the horizontal polygon density, Q, irregular factor, Ir, dip angle, Da, strike angle, Sa, transverse joint spacing, S, and transverse joint penetration rate, P, can be generated to better simulate the CJRM in numerical research and physical model tests. The entire procedure of the CJRM geometric model reconstruction method is shown in Figure 6.

2.4. Application of the CJRM Geometric Model Reconstruction Method

In addition to in-situ tests, the current research methods for CJRM mainly involve similar material physical model tests and numerical simulation. Many studies have been conducted on the likelihood ratio and preparation method of an artificial CJRM sample. The main preparation method involves preparing prisms demolded by plaster, cement, and other materials, gluing the prisms together, and clipping the glued prisms to form CJRM samples. The prisms are usually regular quadrangular, pentagonal, and hexagonal shapes. Combining the CJRM geometric model reconstruction method presented in this paper, a special structure design for the mold can be created to prepare irregular prisms. Irregular CJRM can be prepared using these irregular prisms to better simulate the natural CJRM, as shown in Figure 7a. With the maturation of 3D printing technology, 3D printing of a CJRM sample has become an optional novel method. However, the cost of direct printing of columnar joints is significantly higher than that of traditional preparation methods. In combination with the CJRM geometric model, irregular joint skeletons can be printed using 3D printing technology. The printing irregular joint skeletons can then be poured with similar material to fabricate CJRM samples. This method is worth practicing.
The method can also be applied in numerical simulation research. Based on the existing research and with the help of numerical simulation software, the CJRM model that is more consistent with the natural CJRM under engineering conditions can be reconstructed through the geometric model generation method presented in this paper. The reconstructed numerical CJRM model can be used for uniaxial compression, true triaxial compression, and other tests to conduct the anisotropy research of CJRM, as discussed in Section 3 of this paper.
Combined with the geometric model and topographic data of the real project, a numerical geomechanics model, as shown in Figure 7b, can be established to study CJRM tunnel excavation and support deformation, providing reference for engineering design and construction of CJRM engineering.

3. CJRM Numerical Simulation

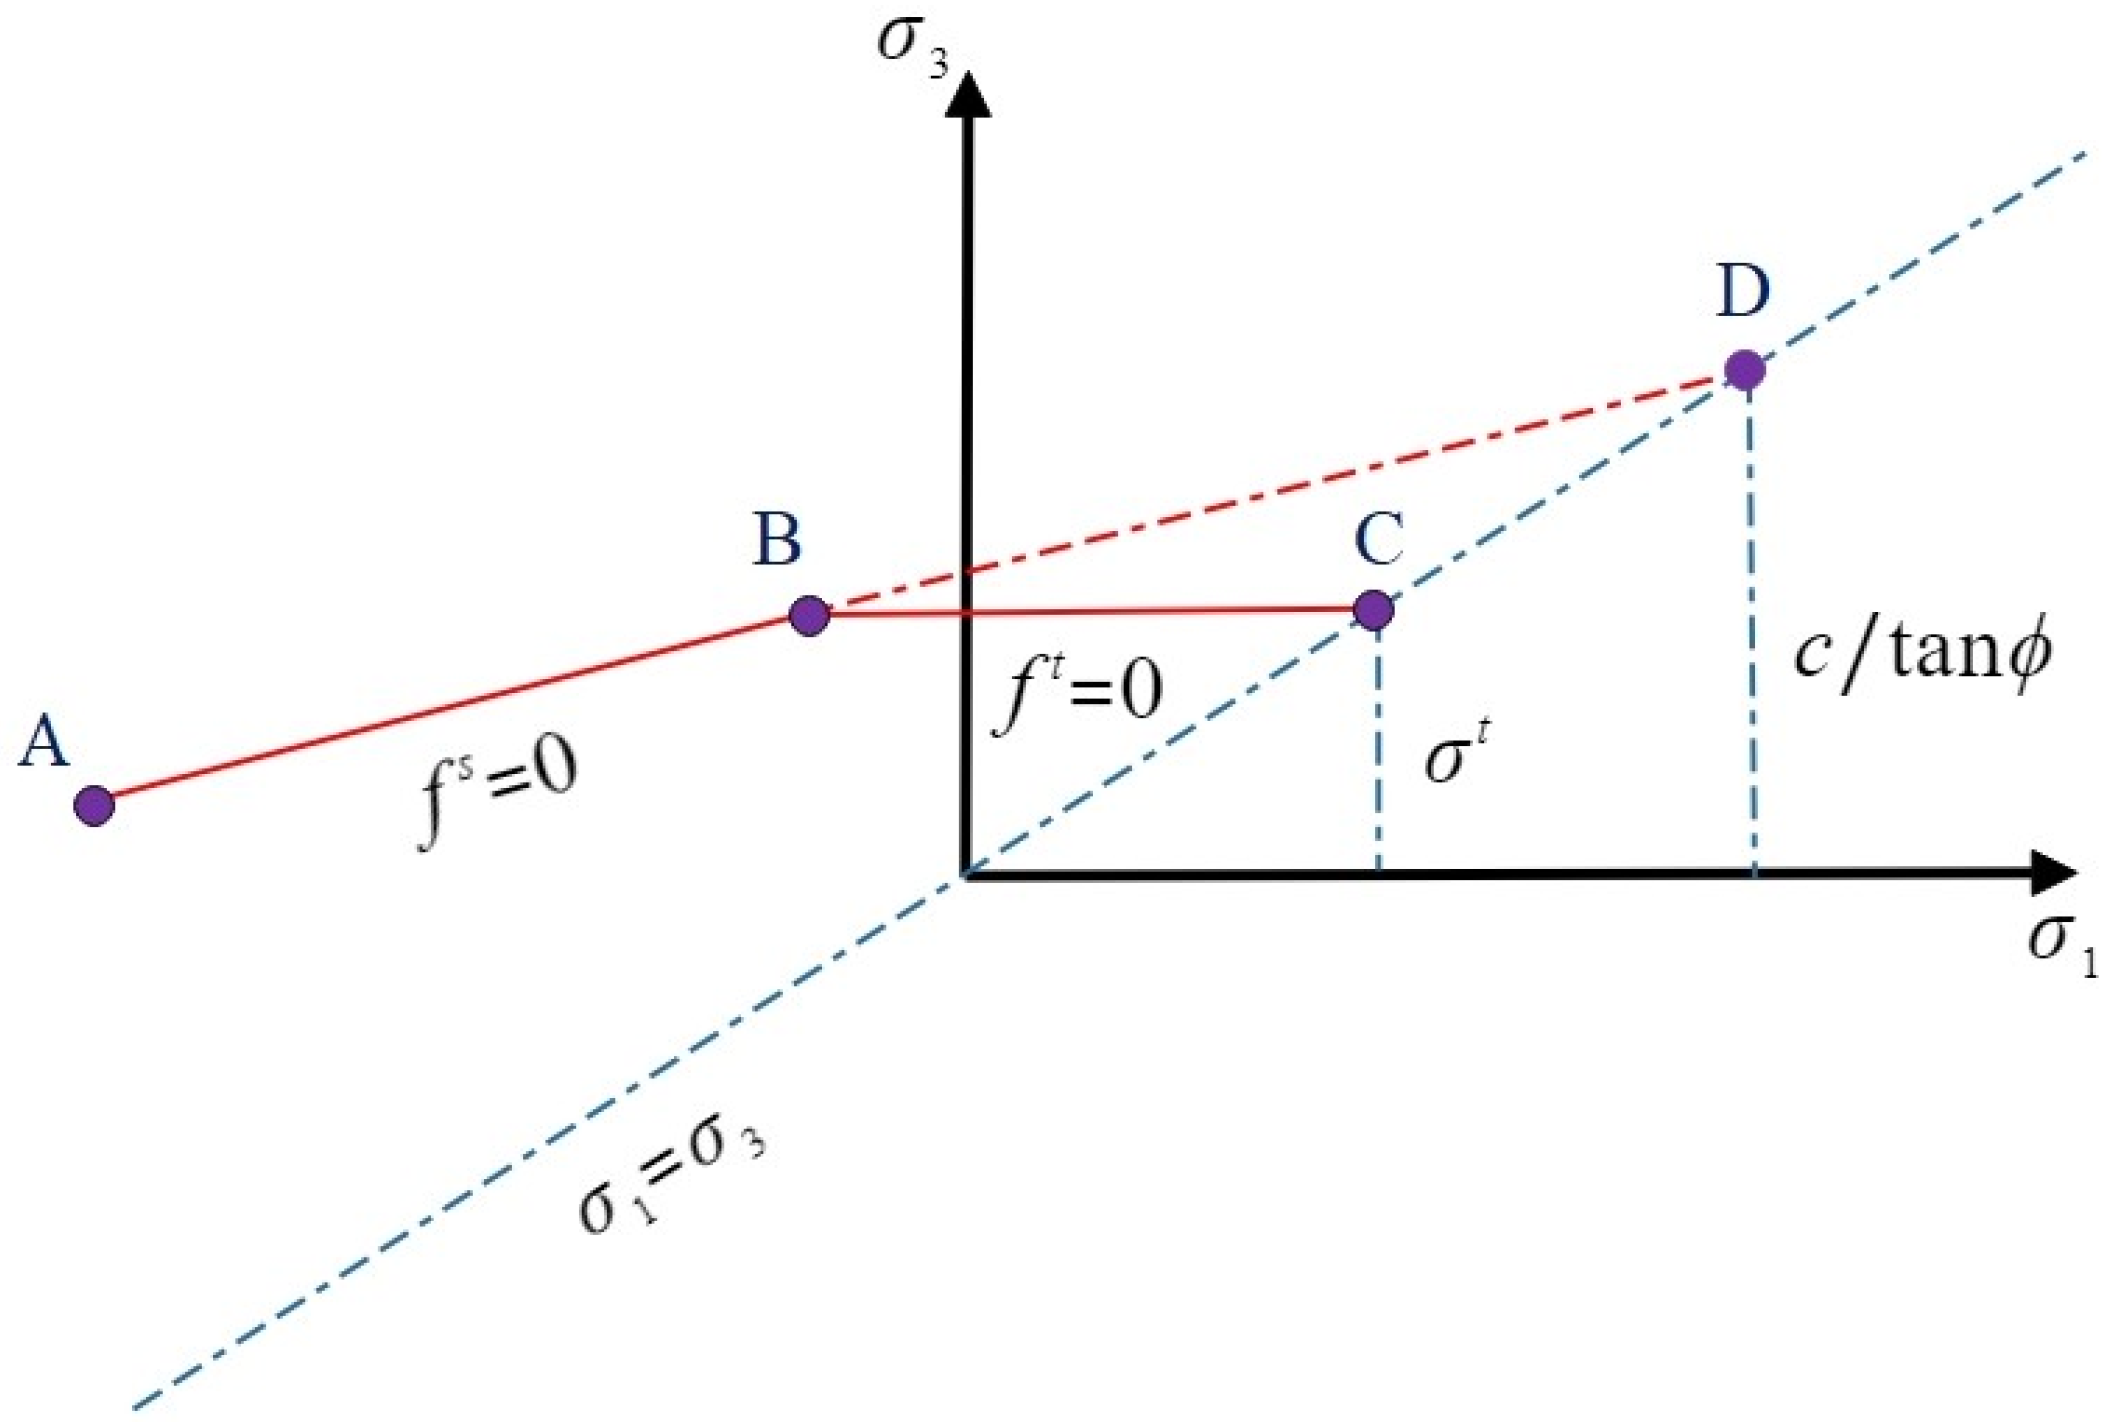
3.1. Numerical Modeling of CJRM

3DEC is a calculation and analysis program based on the discrete element method, and it is particularly suitable for simulating geotechnical engineering problems with a large number of discontinuities, which is very consistent with the structural characteristics of CJRM. Many scholars have used this numerical simulation software to study the size effect and anisotropy of CJRM. Di et al. [18] has studied the size effect of CJRM using this software, and determined the REV of CJRM as 3 m × 3 m × 3 m. In the numerical simulation research of this paper, the REV of CJRM was also 3 m × 3 m × 3 m.
The numerical model of CJRM can be considered as a joint-column binary medium model, consisting of intact columns clipped by columnar joints and transverse joints. In order to better simulate the CJRM, the Mohr–Coulomb constitutive model is assigned for the columns. The failure envelope of this model corresponds to the Mohr–Coulomb criterion (shear yield function) and tension cut-off (tension yield function). The position of the stress point on the envelope line is controlled by the irrelevant flow rules of shear failure and the relevant rules of tensile failure, as shown in Figure 8, which can effectively simulate the mechanical characteristics of basalt columns. For rock mass requiring elastic–plastic deformation strength parameters and equivalent deformation, the Mohr–Coulomb joint model is well suited to its structural plane. Therefore, the joint plane is assigned by the Mohr–Coulomb joint model, which provides a linear representation of joint stiffness and yield limit. The model is based on the elastic stiffness, friction, viscosity, tensile strength characteristics, and shear expansion characteristics of rock joints, and the mechanical characteristics of basalt joint plane can be well simulated. The properties of the numerical model [18,30] are listed in Table 1 and Table 2.
Note that the failure mode of basalt CJRM is mainly brittle failure, including the sliding failure mode, splitting failure mode, and tensile-shear failure mode, which are mainly controlled by the dip angle of the columns. The stress–strain curve under polyaxial compression simulated by the numerical model using this constitutive relationship shows excellent agreement with the failure strength of basalt CJRM, whereas the numerical CJRM model exhibits plasticity after failure, as shown in Figure 9. Therefore, in this study, only the strength characteristics and anisotropy of CJRM are studied using the numerical model.

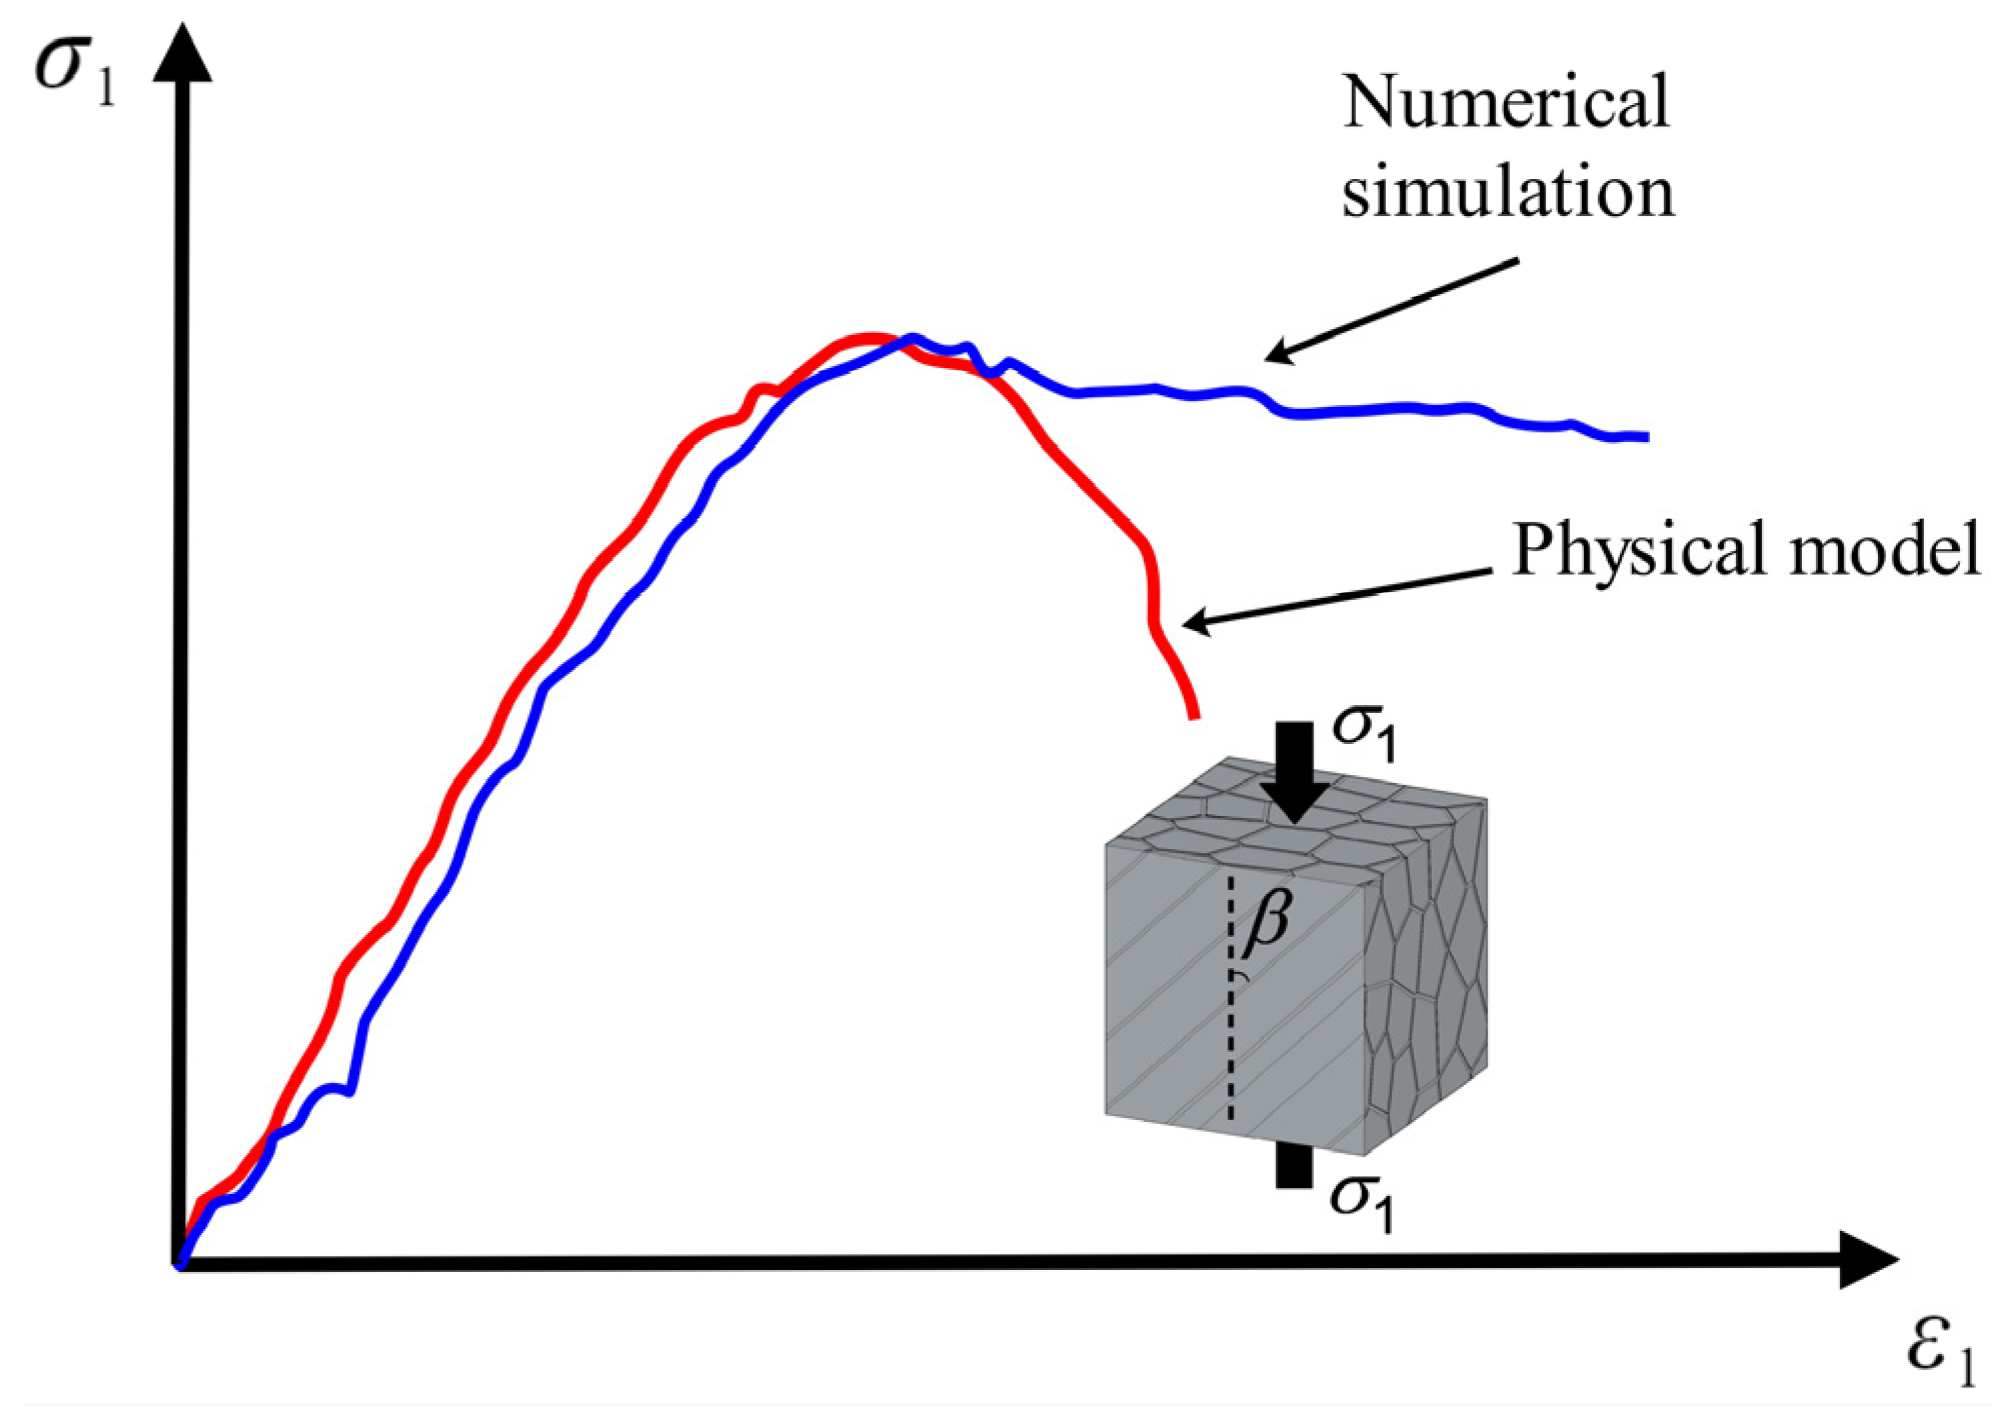
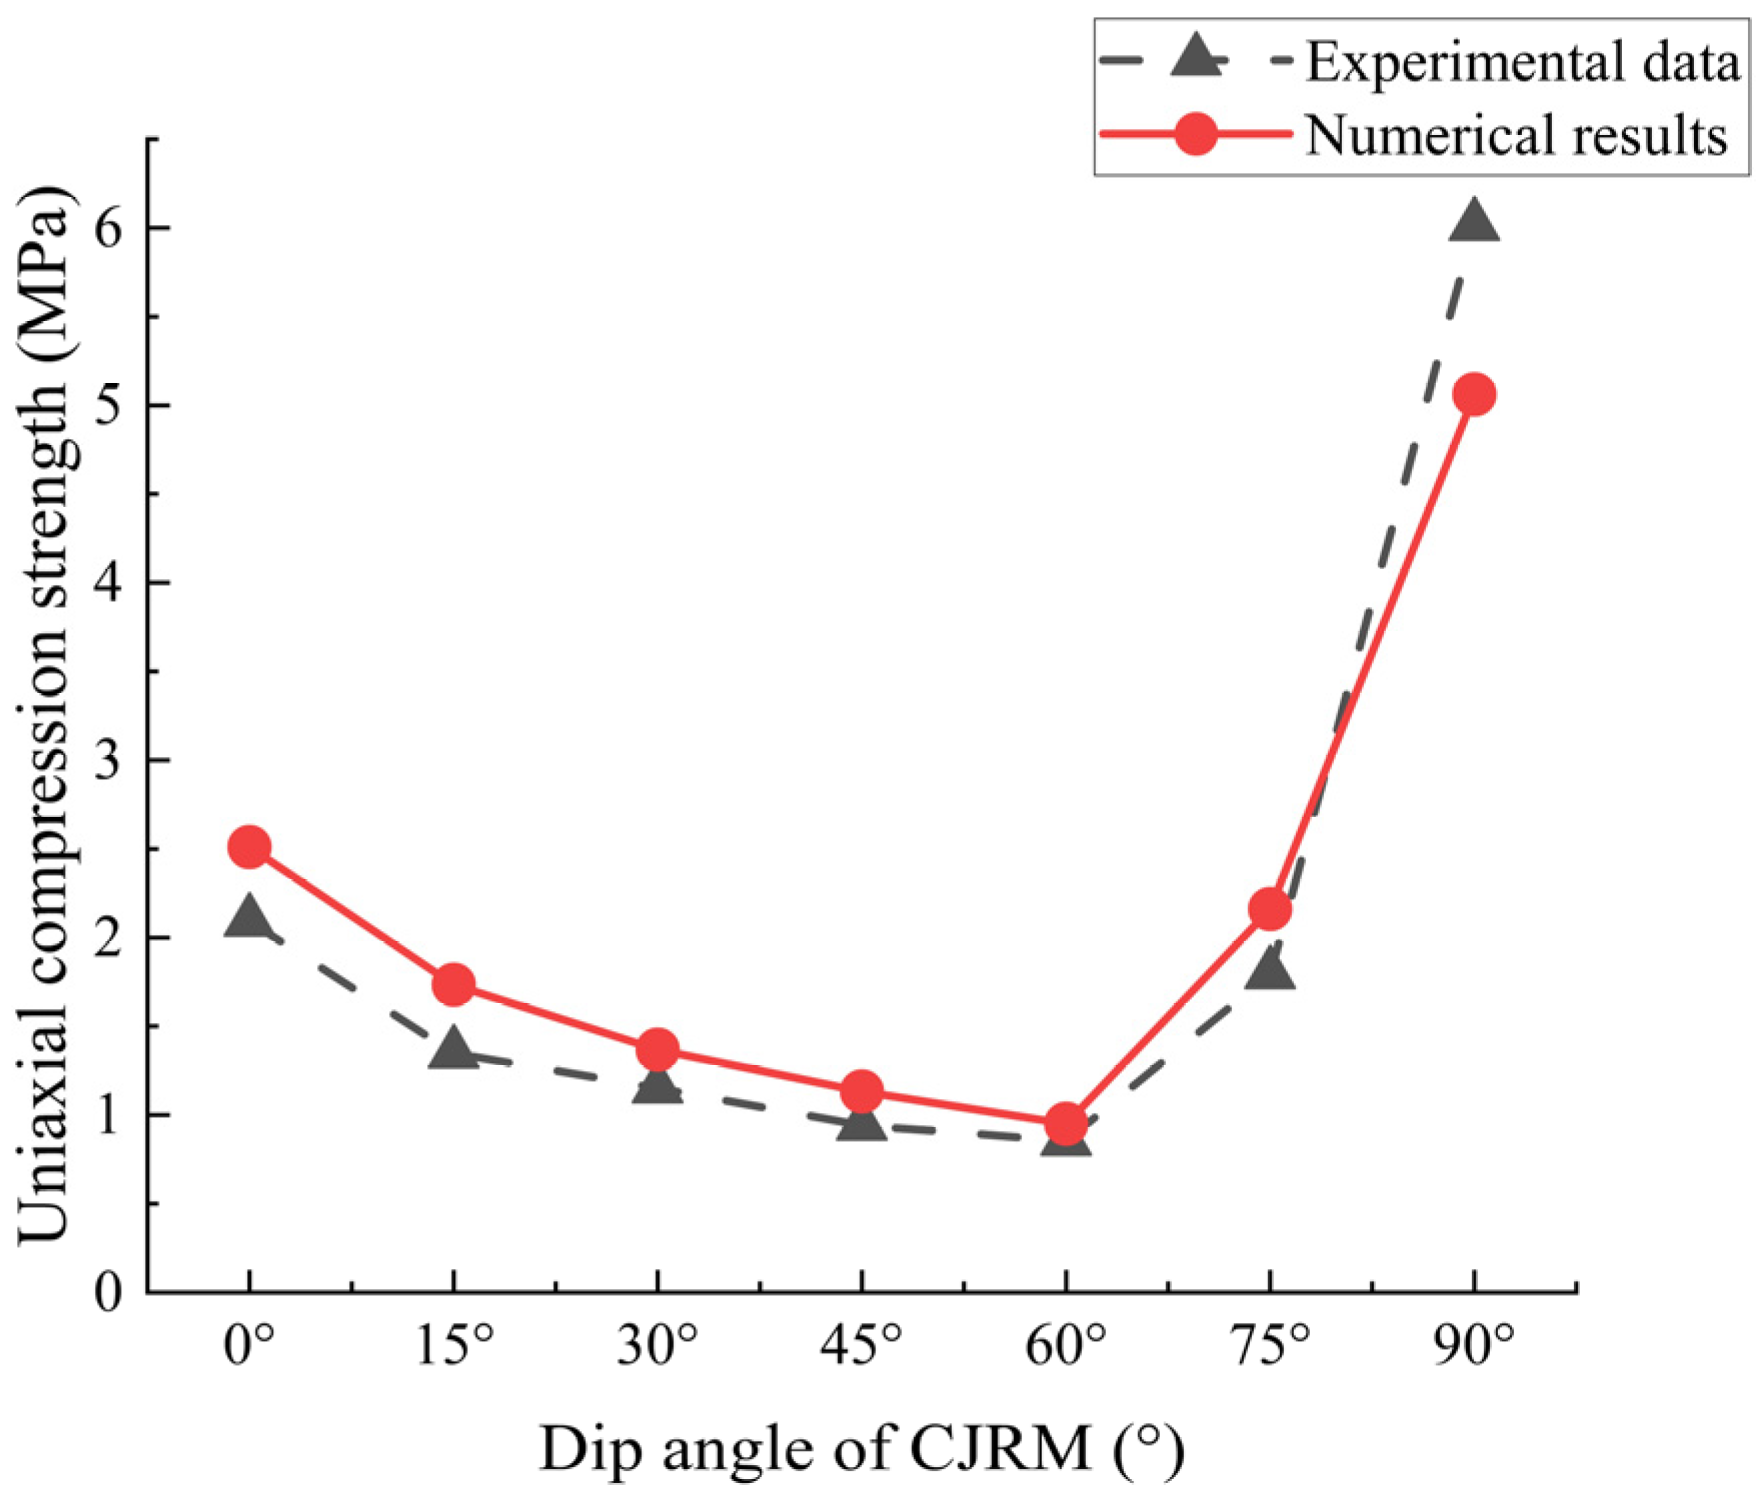
3.2. Validation of the Numerical Modeling

The laboratory physical tests can be utilized to validate the rationality and accuracy of numerical simulations. In this study, regular hexagonal numerical CJRM models were simulated under the uniaxial compression test based on the physical model tests conducted by Que et al. [15]. The mechanical parameters of the numerical CJRM model, as listed in Table 3 and Table 4, and the test scheme are consistent with the physical tests. The variations of uniaxial compressive strength with the dip angle are shown in Figure 10.
In the physical model test, the strength of CJRM versus the dip angle are observed to have a U-shaped anisotropy, showing strong anisotropy. The numerical simulation results also show U-shaped anisotropy, reflecting significant anisotropy. The deviation of the numerical results from the physical model test results ranges from 11.2% to 20.3%, which is deemed acceptable. Moreover, the maximum and minimum strengths are similarly observed at dip angles of 90° and 60°. It can be seen that the results of the numerical simulation are consistent with the results of the physical model test and show significant anisotropy of the CJRM.

4. Calculation Results and Discussion

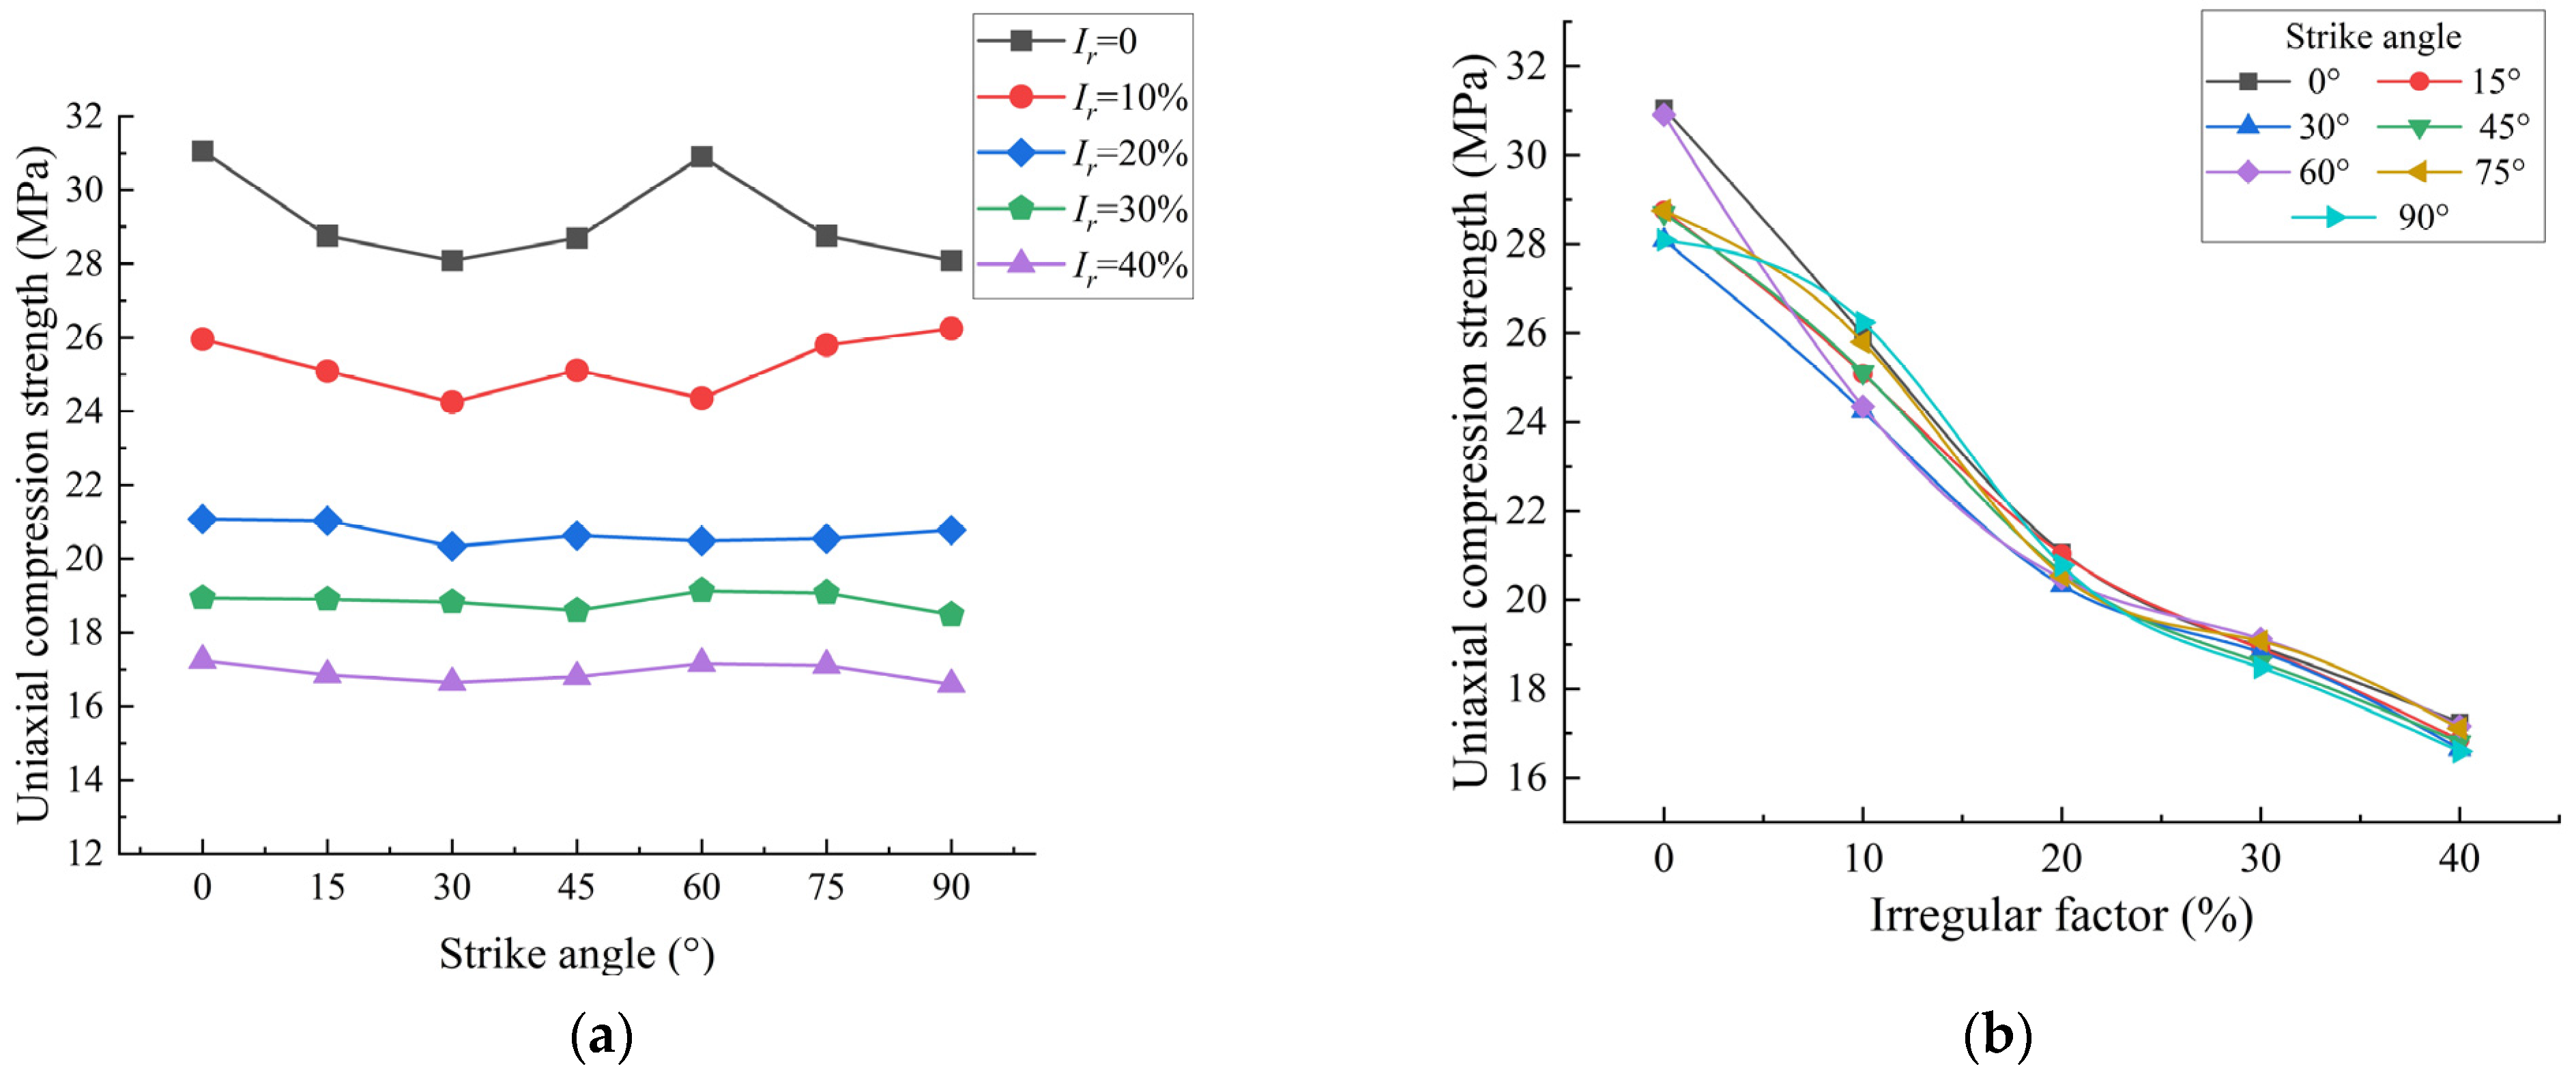
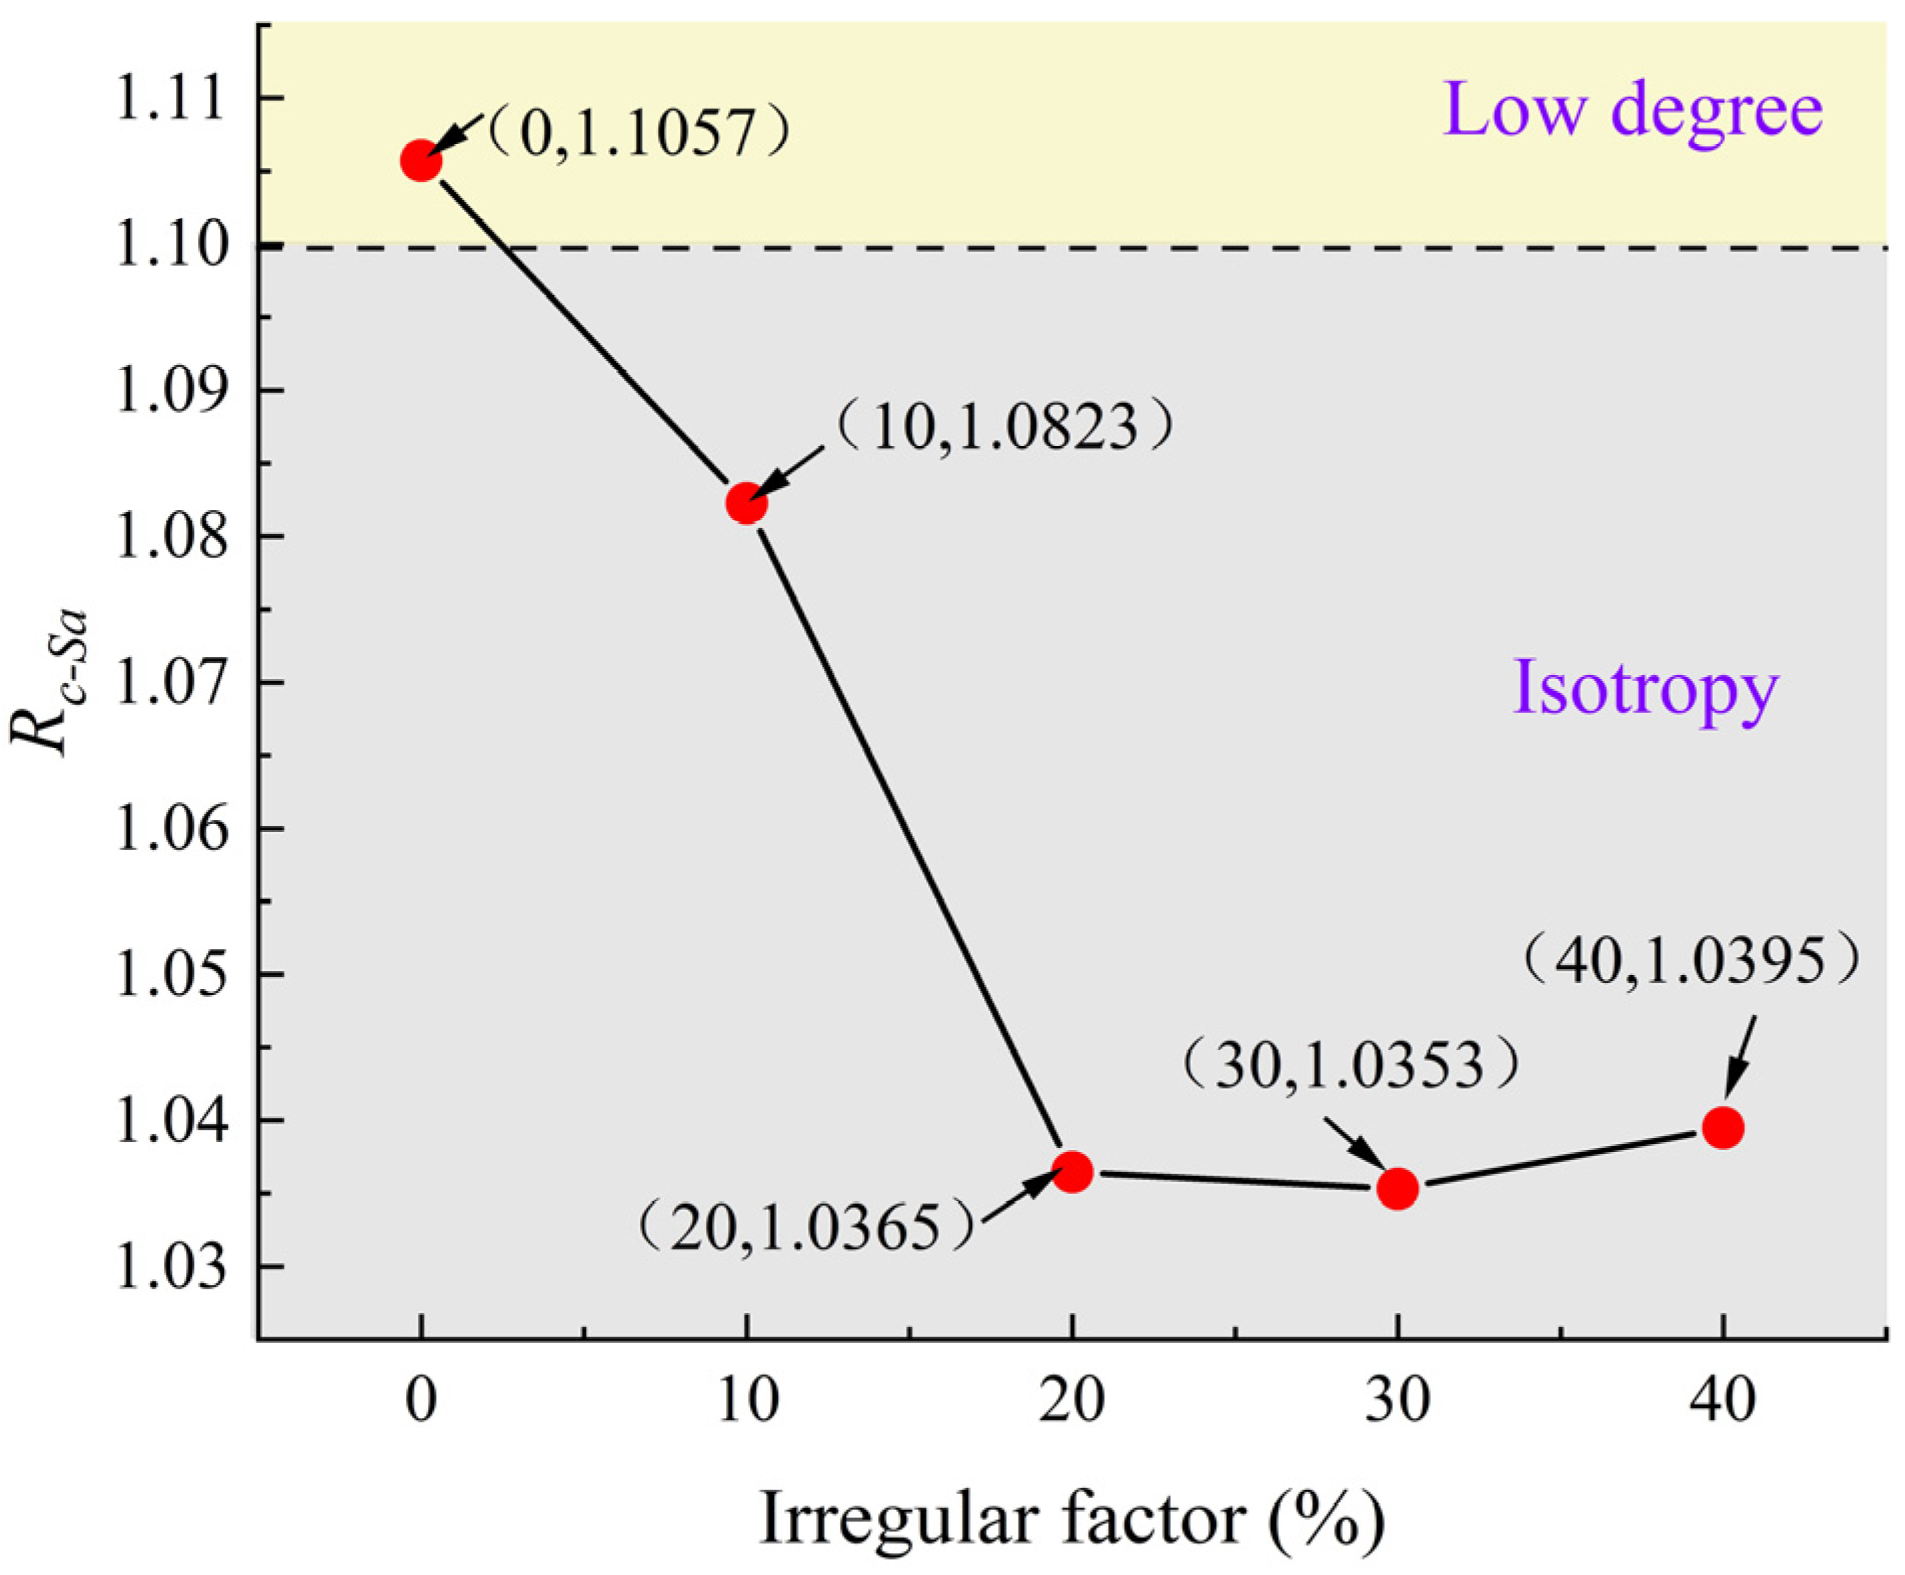
4.1. The Effect of Strike Angle on CJRM Strength Behavior with Different Irregular Factors

In the numerical simulation, numerical CJRM models with different strike angles and irregular factors were generated using the geometric model reconstruction method for uniaxial compression test simulation. The axial loading is selected by displacement control at a rate of 2 × 10⁻³ mm/step. The mechanical properties of the numerical model are listed in Table 1 and Table 2. The geometric parameters of the numerical model are listed in Table 5.
Figure 11a shows the uniaxial compressive strengths of the numerical models with different irregular factors versus the strike angle. Figure 11b shows the uniaxial compressive strengths of the numerical models with different strike angles versus the irregular factor (described by the variation coefficient of polygon areas). When Ir = 0, representing the numerical model as a regular hexagonal CJRM model, the curve of the uniaxial compressive strengths versus the strike angle curve is W-shaped. The strength has a maximum of 31.06 MPa when the strike angel is 0°, and the strength has a minimum of 28.10 MPa when the strike angle is 30°. As the irregular factor increases, the uniaxial compressive strength with different strike angles decreases, and the decrease is relatively uniform. The curve of the strength versus strike angle gradually changes from W-shaped to flat. When the irregularity factor is 40%, the curve of uniaxial compressive strength versus the strike angle shows an approximate straight line. For the numerical CJRM model, the maximum uniaxial compressive strength is 17.25 MPa when the strike angle is 0°, while the minimum uniaxial compressive strength is 16.59 MPa when the strike angle is 90°.
To quantitatively analyze the effect of the strike angle and dip angle on the strength behavior and describe the anisotropy of the jointed rock mass, the anisotropy ratio Rc proposed by Singh et al. [31] was introduced. Rc is defined as the ratio of the maximum strength to the minimum strength versus the dip angle or strike angle under the same stress conditions. The specific expression is:
R c = σ max / σ min
where σmax and σmin are the maximum and minimum values of failure strength under the same stress conditions, respectively. With the increase in the anisotropy ratio Rc, the jointed rock mass shows more obvious anisotropy, and the degree of anisotropy are divided into isotropy (1 < Rc ≤ 1.1), low degree anisotropy (1.1 < Rc ≤ 2), medium degree anisotropy (2 < Rc ≤ 4), and high degree anisotropy (Rc > 4) based on the anisotropy classification method of rock mass proposed by Rammamurthy [32].
Figure 12 shows the CJRM strength anisotropy ratio of the strike angle Rc-Sa with different irregular factors. With the increase in the irregular factor, Rc-Sa gradually decreases from 1.1057 to 1.0395, and changes from low degree anisotropy to isotropy, indicating that the effect of the strike angle on the strength behavior of the CJRM weakens. The basalt CJRM encountered during project construction has an irregular factor ranging from 30% to 40% and a strike angle anisotropy below 1.1, which is approximately isotropic. Therefore, the effect of strike angle on strength anisotropy of basalt CJRM can be considered negligible.

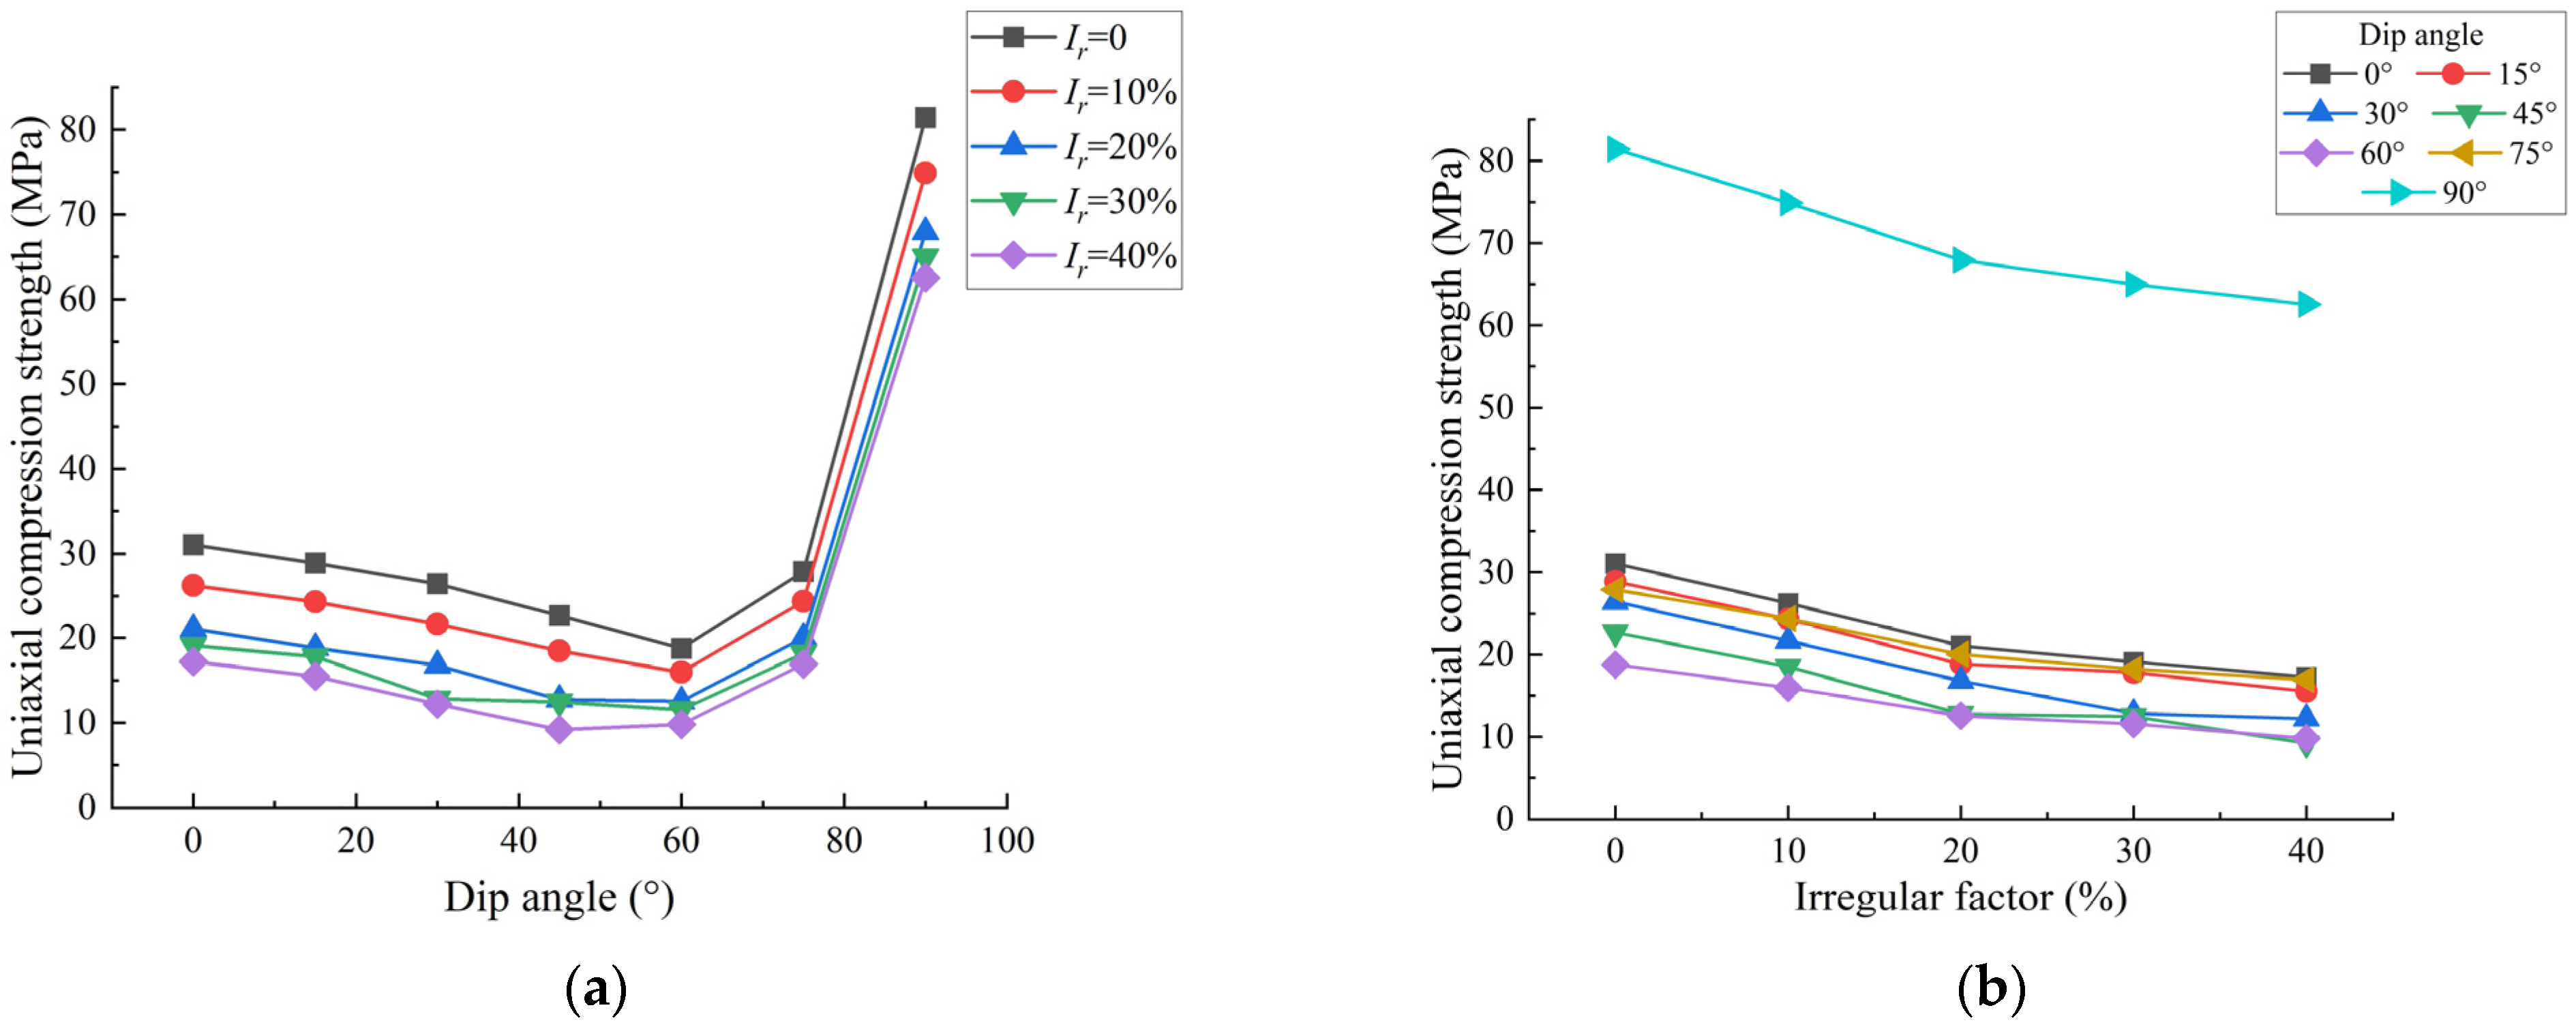
4.2. The Effect of Dip Angle on CJRM Strength Behavior with Different Irregular Factors

Numerical CJRM models with different dip angles and irregular factors were generated for the uniaxial compression test simulation using the same method and test scheme as that described in Section 4.1. The geometric parameters of the numerical model are listed in Table 6.
Figure 13a shows the uniaxial compressive strengths of numerical models with different irregular factors versus the dip angel. Figure 13b shows the uniaxial compressive strengths of numerical models with different dip angles versus the irregular factor.
When Ir = 0, the numerical model is a regular hexagonal CJRM model with prevalent physical samples; with the increase in the dip angle, the compressive strength initially decreases to the minimum value of 18.77 MPa when Da = 60°, and then increases to the maximum value of 81.42 Mpa when Da = 90°, showing a U-shaped curve that is consistent with current physical model test results. With the increase in the irregular factor, the uniaxial compressive strength with different dip angles decreases, and the decreases are all from sharp to steady. When Da = 60°, the effect of the irregular factor on strength behavior has the strongest impact with a decrease of 59.4% from Ir = 0 to Ir = 40%. The weakest impact of irregular factor occurs when Da = 90°, with a decrease of 23.17% from Ir = 0 to Ir = 40%. According to the relevant test analysis, the uniaxial compressive strength is mainly affected by the strength of the column when the dip angle is 90°, and the influence of the irregular coefficient is insignificant.
Figure 14 shows the CJRM strength anisotropy ratio of the dip angle Rc-Da with different irregular factors. As the irregular factor increases, Rc-Da increases continuously from 4.3381 to 6.7953 at a high degree, showing strong anisotropy, which indicates that the effect of the dip angle on the strength behavior is enhanced. Therefore, in the engineering design and construction of CJRM, great attention should be paid to the effect of the dip angle on strength anisotropy.

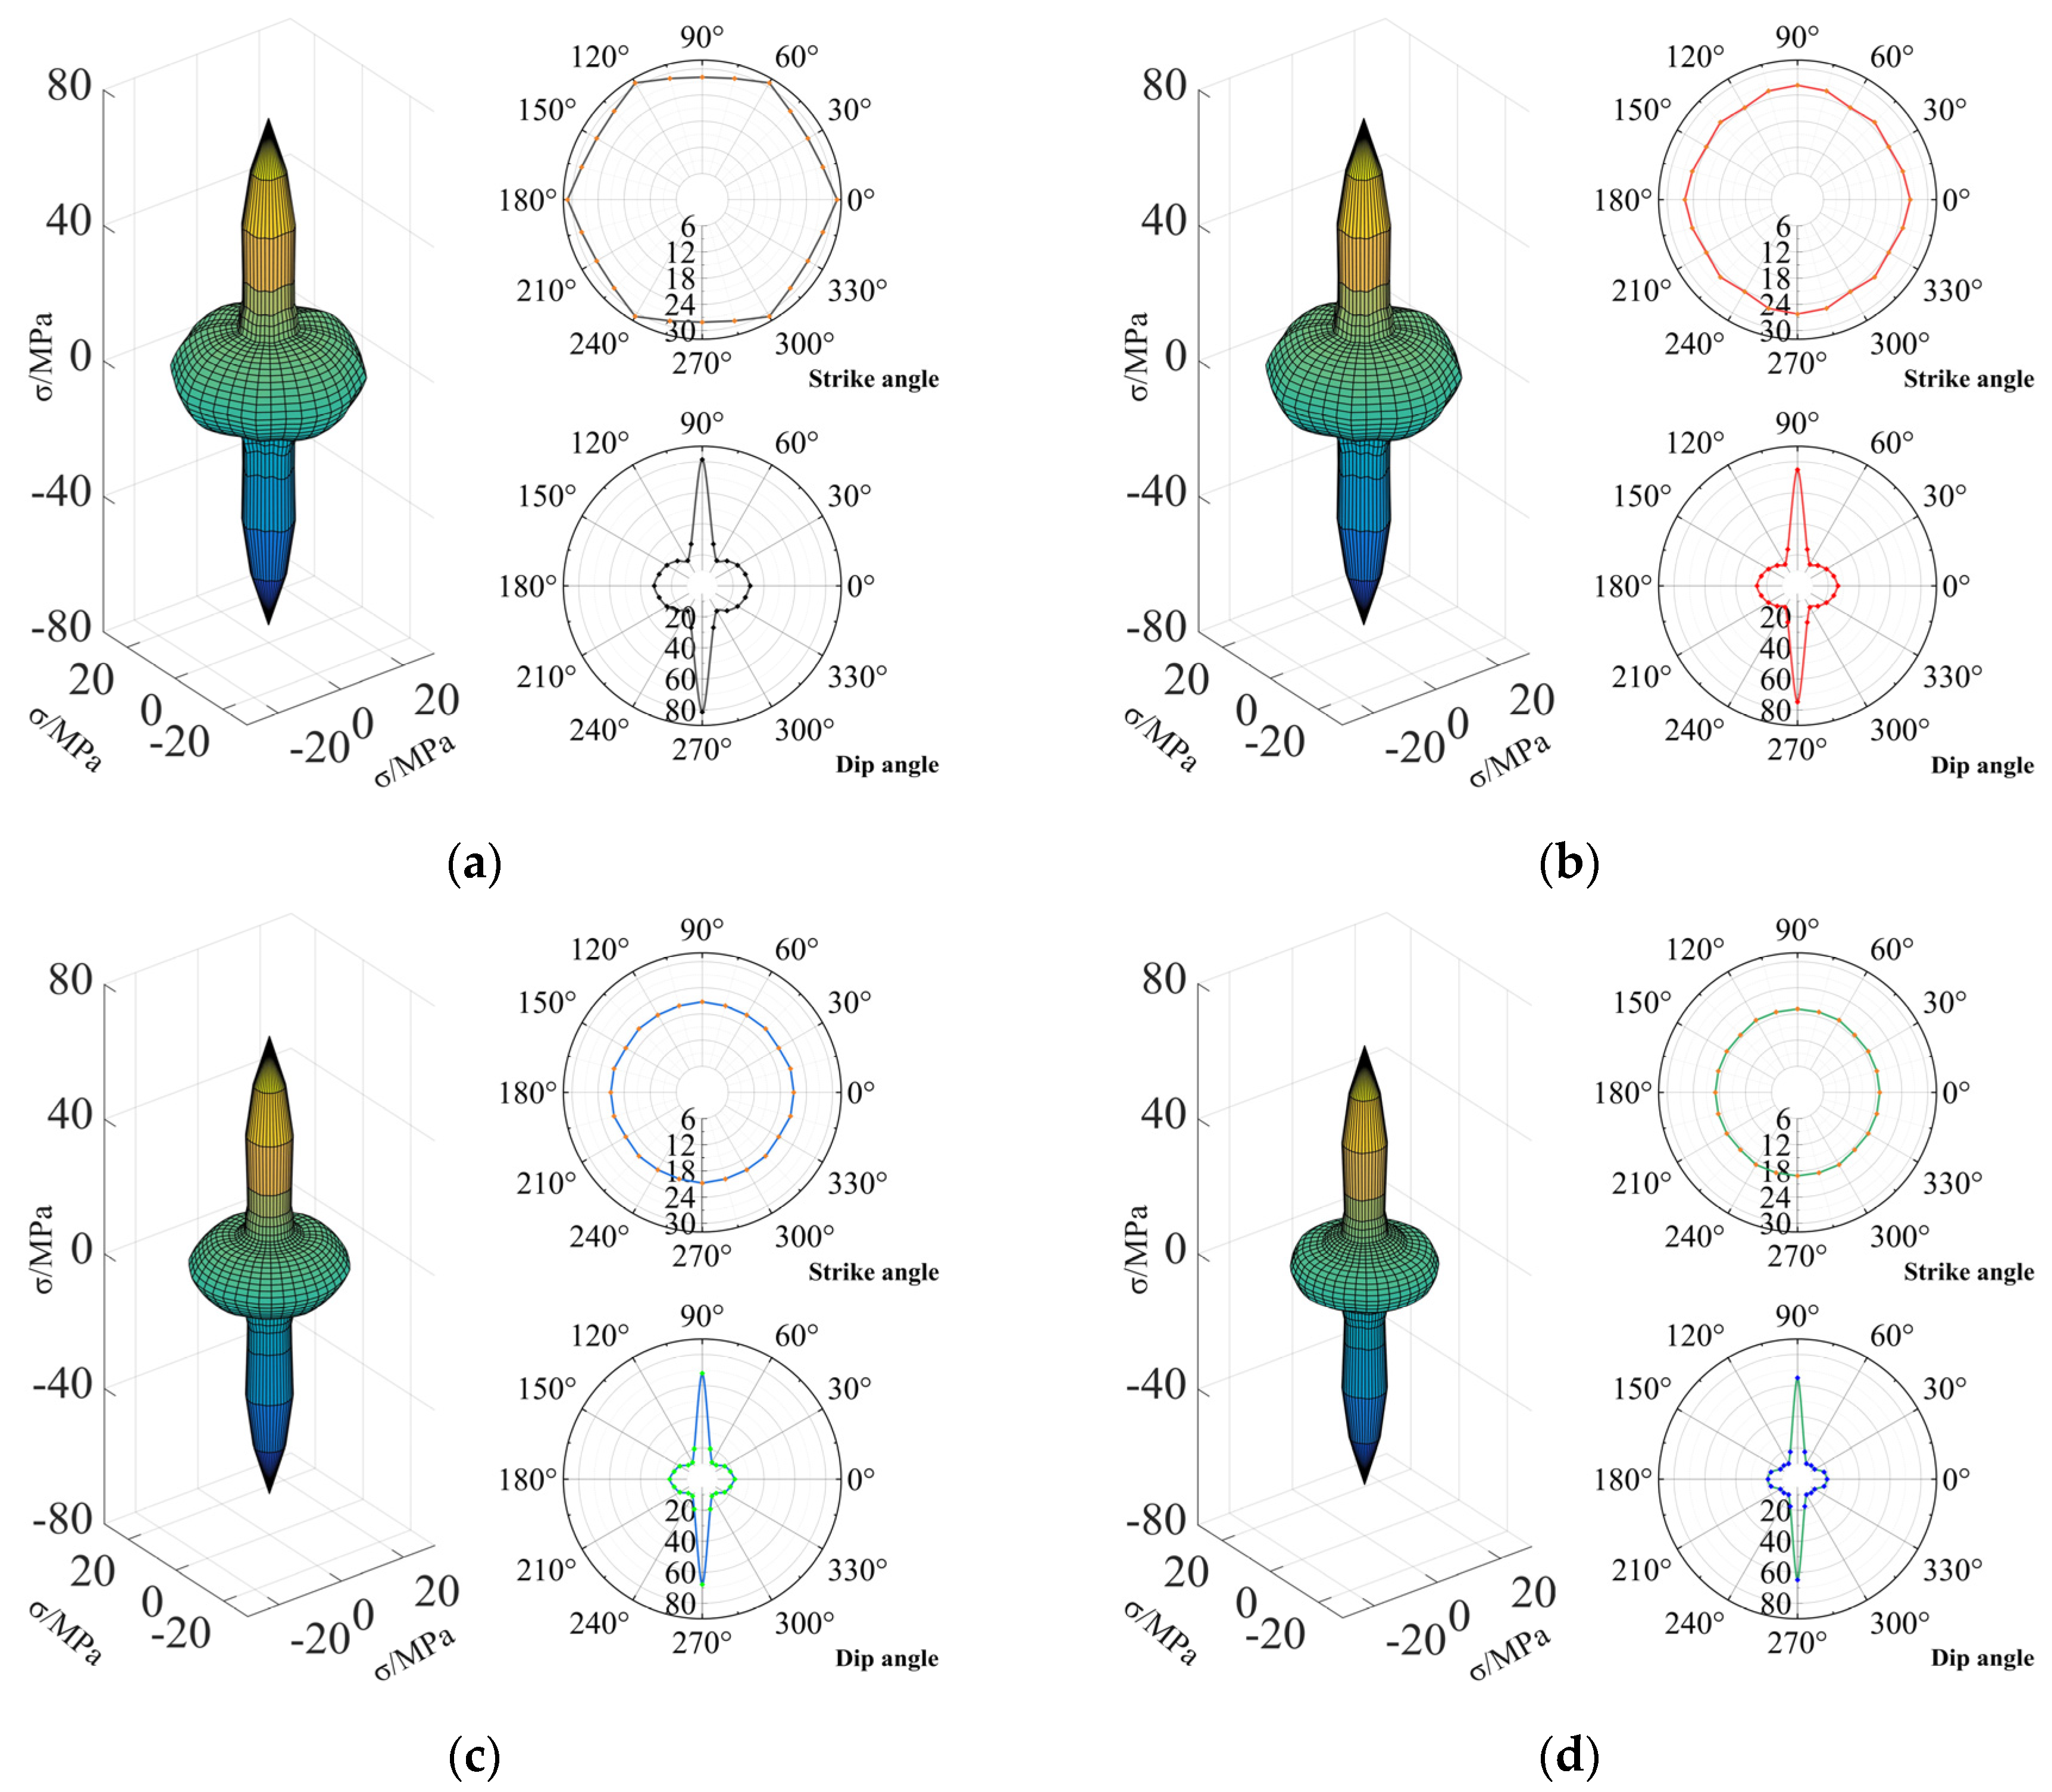
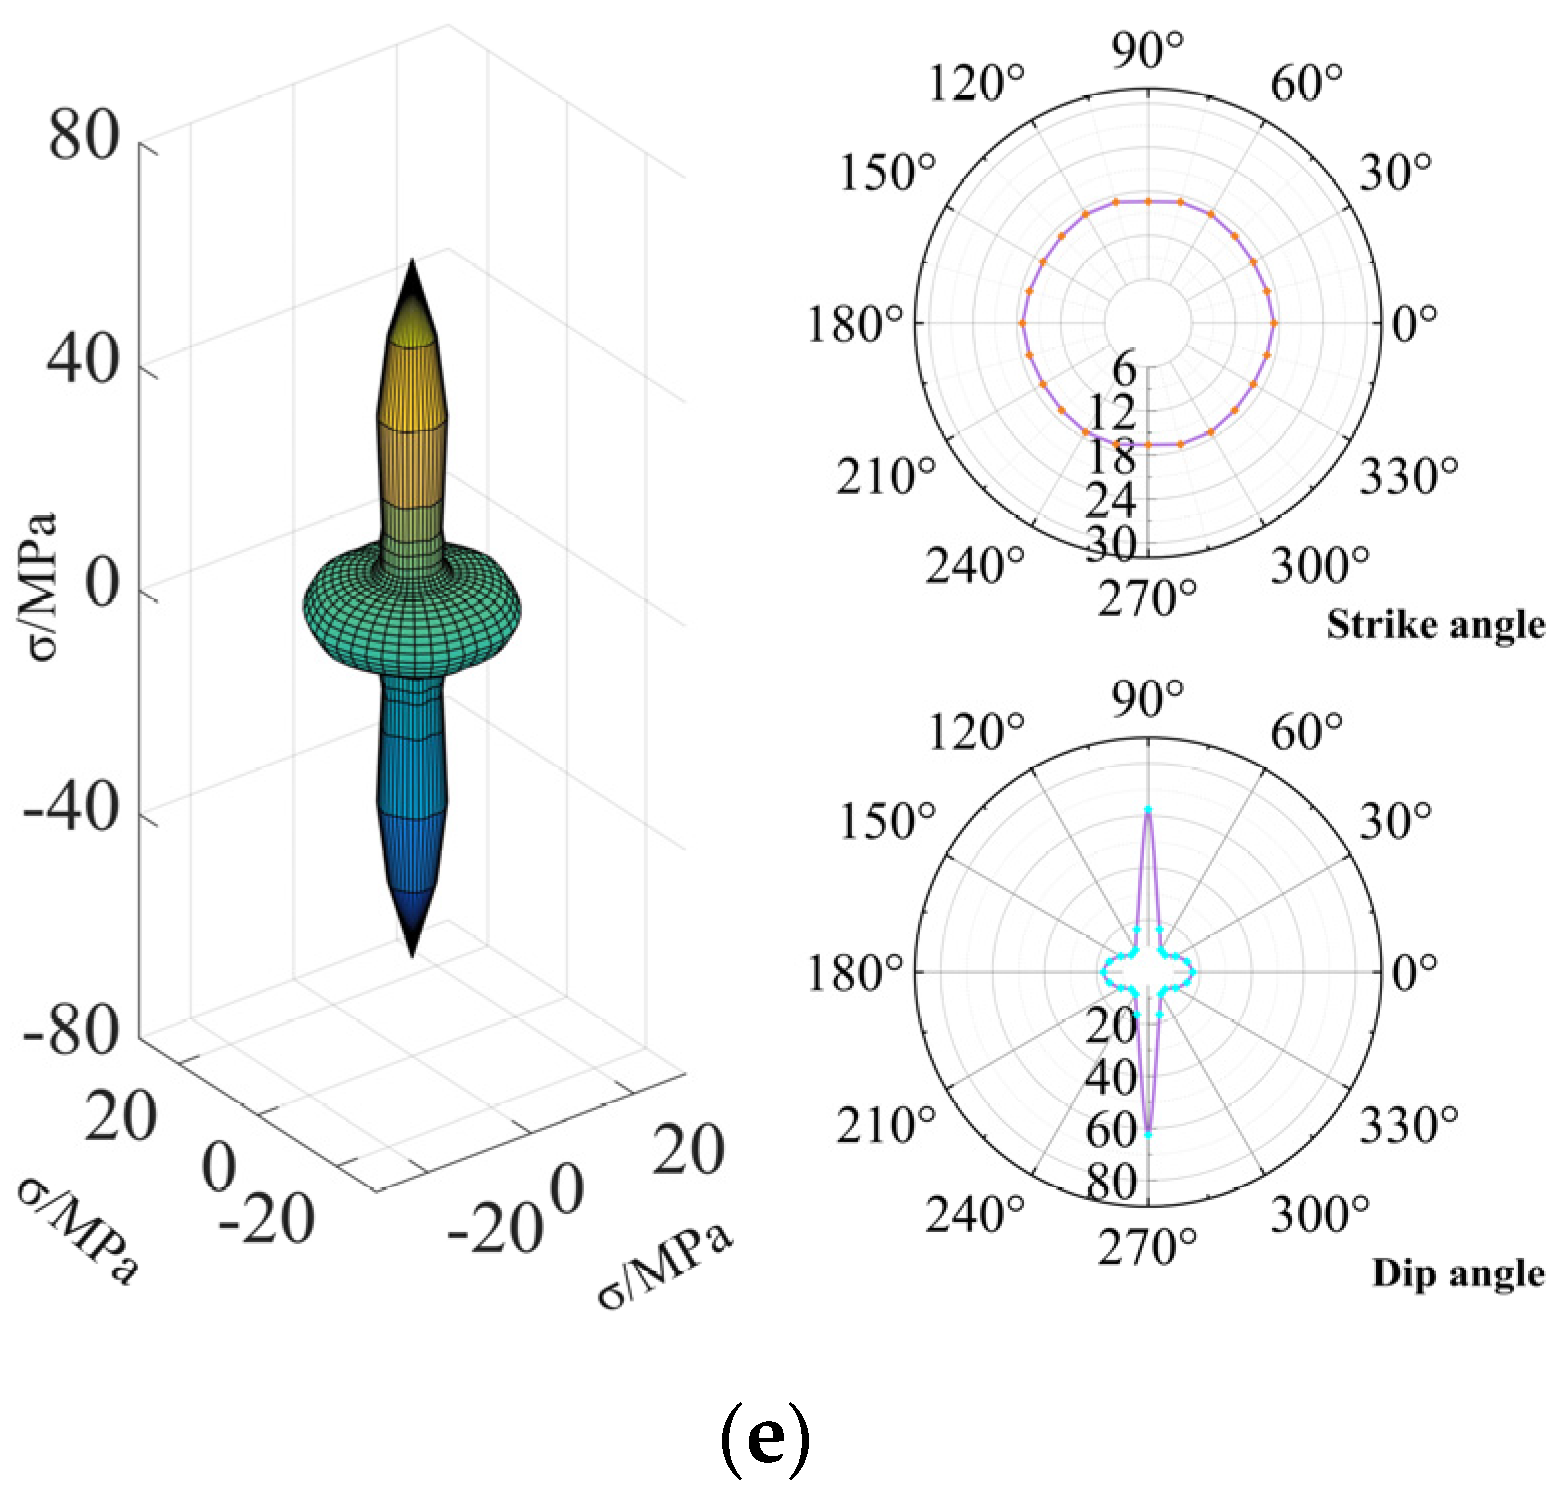
4.3. Three-Dimensional Strength Anisotropy of CJRM

To visually describe the anisotropy characteristics of CJRM with different irregular factors, the numerical simulation results from Section 4.1 and Section 4.2 were transformed from the rectangular coordinate system to a two-dimensional and three-dimensional polar coordinate system, as shown in Figure 15.
Each three-dimensional strength anisotropy of the numerical CJRM models with different irregular factors is significantly strong. When Ir = 0, the three-dimensional strength anisotropy in the three-dimensional space shows a gyroscopic shape, and the horizontal plane figure changing with the strike angle and the vertical plane figure changing with the dip angle shows an approximate hexagonal shape and gyroscopic shape, respectively. With the increase in the irregular factor, the three-dimensional shape remains a gyroscopic shape but continues to shrink. The approximate hexagonal shape in the horizontal plane changes into a smaller approximate circular shape and tends towards isotropic. The gyroscopic shape in the vertical plane has a reduced overall shape with a larger reduction on both sides, showing increasing anisotropy. Therefore, the irregular factor increases the strength anisotropy of the dip angle and decreases the strength anisotropy of the strike angle. The dip angle has a great effect on the strength anisotropy of CJRM.

5. Conclusions

To better study the strong behavior and anisotropy of CJRM, a method using feasible geological parameters of geometric model reconstruction of CJRM was proposed. By combining this method with numerical simulation, the effect of the strike and dip angle on the strength behavior and anisotropy of CJRM with different irregular factors was investigated. The main conclusions are summarized as follows:
(1)
A single-random movement with a range constraint Voronoi diagram of uniform seed points is proposed for simulating the irregular horizontal section of the CJRM. Based on this, a geometric model reconstruction method is developed using feasible geological statistical parameters, including horizontal polygon density, Q, irregular factor, Ir, dip angle, Da, strike angle, Sa, transverse joint spacing, S, and transverse joint penetration rate, P. With this method, a geometric modeling approach that is more practical and relatively simple, with better integration and actual engineering provided for the production of similar material models and numerical simulation modeling. In addition, the method also has exploitable value for other types of sedimentary rocks, such as conglomerates, sandstones, metamorphic rocks, such as shales, and intrusive rocks, such as granites.
(2)
In the numerical simulation of numerical CJRM models with different strike angles and irregular factors under uniaxial compression, when Ir = 0, the curve of the uniaxial compressive strengths versus the strike angle was W-shaped, the maximum strength and minimum strength with a small gap are at the strike angles of 0°and 30°, respectively. As the irregular factor increases, the uniaxial compressive strength with different strike angles decreases uniformly, and the strength anisotropy of the strike angle decreases from 1.1057 to 1.0395, indicating that the numerical CJRM models change from low degree anisotropy to isotropy. Therefore, the effect of the strike angle on the strength anisotropy of basalt CJRM can be considered negligible.
(3)
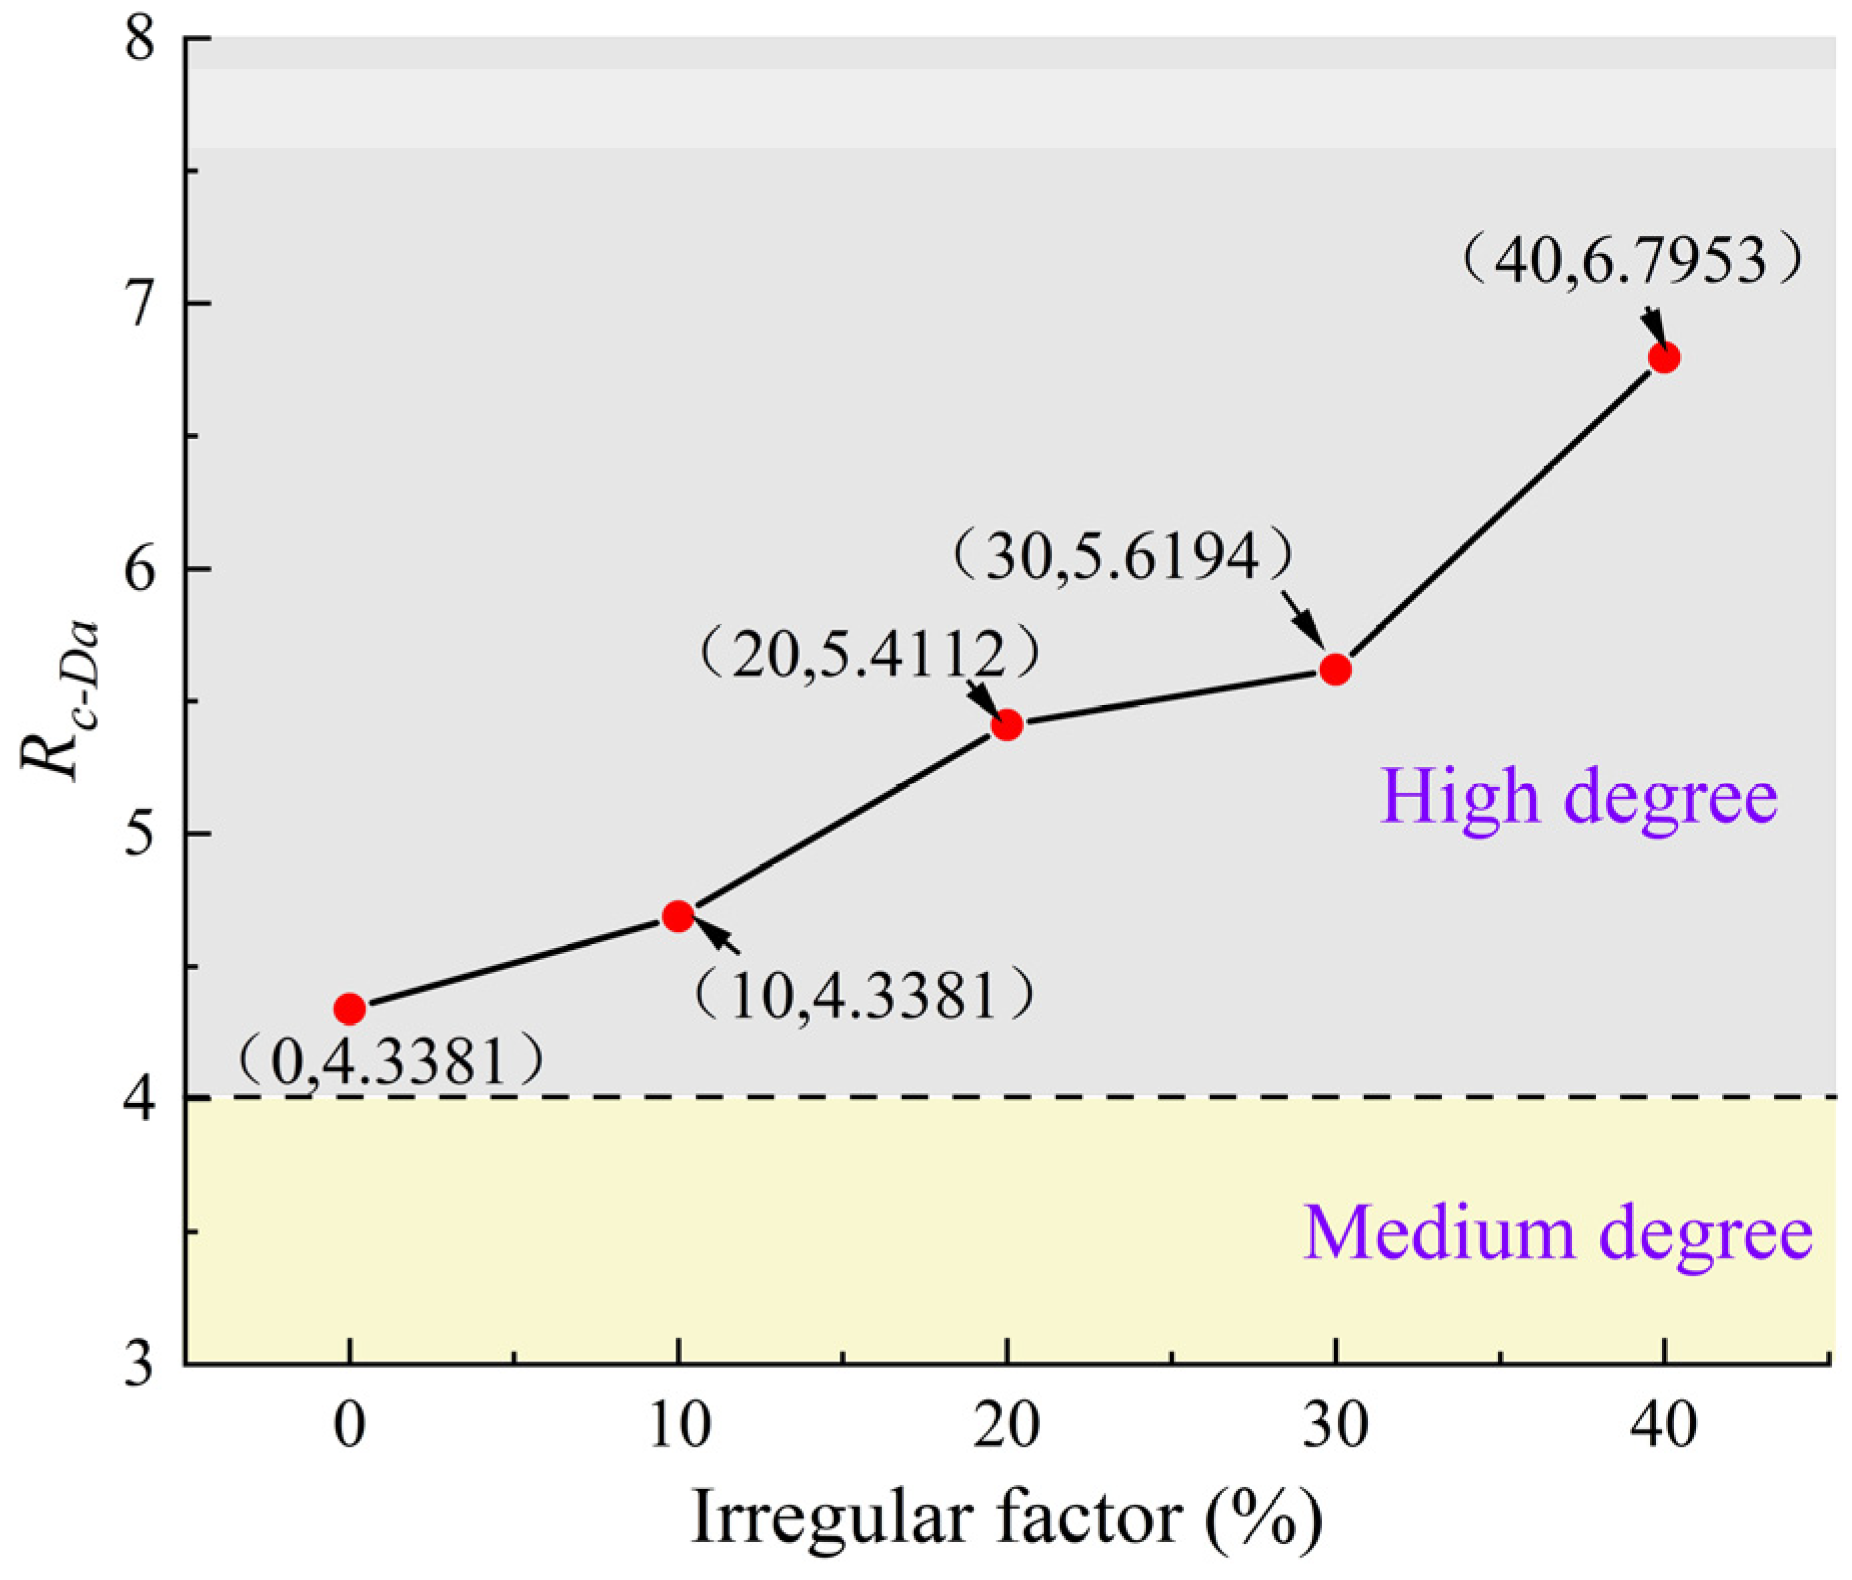
In the numerical simulation of numerical CJRM models with different dip angles and irregular factors under uniaxial compression, when Ir = 0, the curve of the uniaxial compressive strengths versus the dip angle shows a U-shape, with the maximum strength and minimum strength at the dip angles of 90°and 60°, respectively. As the irregular factor increases, the uniaxial compressive strength with different dip angles decreases, and the decreases are all from sharp to steady. The effect of the irregular factor on strength behavior has the strongest and weakest impact on the dip angles at 60° and 90°, respectively. The strength anisotropy of the dip angle increases from 4.3381 to 6.7953, showing an increasing strong anisotropy at a high degree, indicating that the effect of the dip angle on the strength behavior is enhanced. Therefore, in the engineering design and construction of the CJRM, great attention should be paid to the effect of the dip angle on strength anisotropy.

Author Contributions

L.W., Z.Z. and S.Z. contributed to the study conception and design. L.W., S.Z. and J.W. performed the numerical tests. The first draft of the manuscript was written by Z.Z. and L.W. All authors commented on previous versions of the manuscript. All authors have read and agreed to the published version of the manuscript.

Funding

This study was funded by the National Natural Science Foundation of China (Grant Nos. 41831278 and 51878249) and the Jiangsu Excellent Postdoctoral Program (Grant Nos. 2022ZB177).

Data Availability Statement

Not applicable.

Acknowledgments

This study was supported by the National Natural Science Foundation of China (Grant Nos. 41831278 and 51878249) and the Jiangsu Excellent Postdoctoral Program (Grant Nos. 2022ZB177).

Conflicts of Interest

The authors declare no conflict of interest.

References

  1. Gilman, J.J. Basalt columns: Large scale constitutional supercooling? J. Volcanol. Geoth Res. 2009, 184, 347–350. [Google Scholar] [CrossRef]
  2. Mondal, T.K.; Chowdhury, A.; Sain, A.; Chatterjee, S. Understanding the maturity of columnar joints and its spatial relationship with eruptive centre: A critical appraisal from the Rajmahal basalt, India. Phys. Earth Planet. Inter. 2022, 326, 106867. [Google Scholar] [CrossRef]
  3. Philpotts, A.R.; Burkett, D.H. Structures, Textures, and Cooling Histories of Columbia River Basalt Flows: Discussion and Reply: Discussion. Geol. Soc. Am. Bull. 1987, 99, 886–887. [Google Scholar] [CrossRef]
  4. Zhu, S.; Zheng, J.; Zhu, Z.; Zhu, Q.; Zhou, L. Experiments on Three-Dimensional Flaw Dynamic Evolution of Transparent Rock-Like Material under Osmotic Pressure. Tunn. Undergr. Space Technol. 2022, 128, 13. [Google Scholar] [CrossRef]
  5. Hao, X.-J.; Feng, X.-T.; Yang, C.-X.; Jiang, Q.; Li, S.-J. Analysis of Edz Development of Columnar Jointed Rock Mass in the Baihetan Diversion Tunnel. Rock Mech. Rock Eng. 2016, 49, 1289–1312. [Google Scholar] [CrossRef]
  6. Fan, Q.; Wang, Z.; Xu, J.; Zhou, M.; Jiang, Q.; Li, G. Study on Deformation and Control Measures of Columnar Jointed Basalt for Baihetan Super-High Arch Dam Foundation. Rock Mech. Rock Eng. 2017, 51, 2569–2595. [Google Scholar] [CrossRef]
  7. Shi, A.C.; Wei, Y.F.; Zhang, Y.H.; Tang, M.F. Study on the Strength Characteristics of Columnar Jointed Basalt with a True Triaxial Apparatus at the Baihetan Hydropower Station. Rock Mech. Rock Eng. 2020, 53, 4947–4965. [Google Scholar] [CrossRef]
  8. Sun, Q.C.; Li, S.J.; Guo, H.S.; Zheng, M.Z.; Yang, Z.Y. In Situ Test of Excavation Damaged Zone of Columnar Jointed Rock Masses under Different Borehole Conditions. Bull. Eng. Geol. Environ. 2021, 80, 2991–3007. [Google Scholar] [CrossRef]
  9. Lin, P.; Shi, J.; Wei, P.; Fan, Q.; Wang, Z. Shallow Unloading Deformation Analysis on Baihetan Super-High Arch Dam Foundation. Bull. Eng. Geol. Environ. 2019, 78, 5551–5568. [Google Scholar] [CrossRef]
  10. Wei, Y.; Chen, Q.; Huang, H.; Xue, X. Study on Creep Models and Parameter Inversion of Columnar Jointed Basalt Rock Masses. Eng. Geol. 2021, 290, 106206. [Google Scholar] [CrossRef]
  11. Zhao, Y.S.; Cheng, Z.Q.; Gao, Y.T.; Wu, S.C.; Chen, C.C. Review of Geomechanical Similar-Material Test Systems. Arab. J. Geosci. 2020, 13, 19. [Google Scholar] [CrossRef]
  12. Ji, H.; Zhang, J.C.; Xu, W.Y.; Wang, R.B.; Wang, H.L.; Yan, L.; Lin, Z.N. Experimental Investigation of the Anisotropic Mechanical Properties of a Columnar Jointed Rock Mass: Observations from Laboratory-Based Physical Modelling. Rock Mech. Rock Eng. 2017, 50, 1919–1931. [Google Scholar] [CrossRef]
  13. Xiao, W.M.; Deng, R.G.; Zhong, Z.B.; Fu, X.M.; Wang, C.Y. Experimental Study on the Mechanical Properties of Simulated Columnar Jointed Rock Masses. J. Geophys. Eng. 2015, 12, 80–89. [Google Scholar] [CrossRef]
  14. Lu, W.B.; Zhu, Z.D.; He, Y.X.; Que, X.C. Strength Characteristics and Failure Mechanism of a Columnar Jointed Rock Mass under Uniaxial, Triaxial, and True Triaxial Confinement. Rock Mech. Rock Eng. 2021, 54, 2425–2439. [Google Scholar] [CrossRef]
  15. Que, X.C.; Zhu, Z.D.; Niu, Z.H.; Lu, W.N. Estimating the Strength and Deformation of Columnar Jointed Rock Mass Based on Physical Model Test. Bull. Eng. Geol. Environ. 2021, 80, 1557–1570. [Google Scholar] [CrossRef]
  16. Xia, Y.J.; Liu, B.C.; Zhang, C.Q.; Liu, N.; Zhou, H.; Chen, J.; Tang, C.N.; Gao, Y.; Zhao, D.C.; Meng, Q.K. Investigations of Mechanical and Failure Properties of 3D Printed Columnar Jointed Rock Mass under True Triaxial Compression with One Free Face. Geomech. Geophys. Geo Energy Geo Resour. 2022, 8, 1–24. [Google Scholar] [CrossRef]
  17. Xia, Y.-J.; Zhang, C.Q.; Zhou, H.; Hou, J.; Su, G.S.; Gao, Y.; Liu, N.; Singh, H.K. Mechanical Behavior of Structurally Reconstructed Irregular Columnar Jointed Rock Mass Using 3D Printing. Eng. Geol. 2020, 268, 105509. [Google Scholar] [CrossRef]
  18. Di, S.J.; Xu, W.Y.; Ning, Y.; Wang, W.; Wu, G.Y. Macro-Mechanical Properties of Columnar Jointed Basaltic Rock Masses. J. Cent. South Univ. Technol. 2011, 18, 2143–2149. [Google Scholar] [CrossRef]
  19. Zhu, X.D.; Hu, L.X.; Jiang, Q.; Li, S.J.; Li, J. Failure Characteristics and Support Optimal Design of Columnar Jointed Rock Mass at a Diversion Tunnel. Appl. Mech. Mater. 2013, 353, 1680–1684. [Google Scholar] [CrossRef]
  20. Meng, Q.X.; Wang, H.L.; Xu, W.Y.; Chen, Y.L. Numerical Homogenization Study on the Effects of Columnar Jointed Structure on the Mechanical Properties of Rock Mass. Int. J. Rock Mech. Min. Sci. 2019, 124, 104127. [Google Scholar] [CrossRef]
  21. Meng, Q.X.; Yan, L.; Chen, Y.L.; Zhang, Q. Generation of Numerical Models of Anisotropic Columnar Jointed Rock Mass Using Modified Centroidal Voronoi Diagrams. Symmetry 2018, 10, 618. [Google Scholar] [CrossRef]
  22. Zhang, J.C.; Jiang, Q.; Feng, G.L.; Li, S.J.; Pei, S.F.; He, B.G. Geometrical Characteristic Investigation of the Baihetan Irregular Columnar Jointed Basalt and Corresponding Numerical Reconstruction Method. J. Cent. South Univ. 2022, 29, 455–469. [Google Scholar] [CrossRef]
  23. Zhang, T.; Xu, W.Y.; Wang, H.L.; Wang, R.B.; Yan, L.; Hu, M.T. Anisotropic Mechanical Behaviour of Columnar Jointed Rock Masses Subjected to Cyclic Loading: An Experimental Investigation. Int. J. Rock Mech. Min. Sci. 2021, 148, 104954. [Google Scholar] [CrossRef]
  24. Dershowitz, W.S.; Einstein, H.H. Characterizing Rock Joint Geometry with Joint System Models. Rock Mech. Rock Eng. 1998, 21, 21–51. [Google Scholar] [CrossRef]
  25. Minciacchi, D.; Granato, A. How Relevant Are Subcortical Maps for the Cortical Machinery? An Hypothesis Based on Parametric Study of Extrarelay Afferents to Primary Sensory Areas. Adv. Psychol. 1997, 119, 149–168. [Google Scholar]
  26. Duyckaerts, C.; Gilles, G. Voronoi Tessellation to Study the Numerical Density and the Spatial Distribution of Neurones. J. Chem. Neuroanat. 2000, 20, 83–92. [Google Scholar] [CrossRef]
  27. Bae, S.W. An Almost Optimal Algorithm for Voronoi Diagrams of Non-Disjoint Line Segments. Comput. Geom. Theory Appl. 2016, 52, 34–43. [Google Scholar] [CrossRef]
  28. Boots, B.; Sugihara, K.; Chiu, S.N.; Okabe, A. Spatial Tessellations:Concepts and Applications of Voronoi Diagrams; John Wiley & Sons, Inc.: Hoboken, NJ, USA, 2000. [Google Scholar]
  29. Ning, Y.U.; Weiya, X.U.; Wentang, Z.; Guotao, M.; Anchi, S.H.I.; Guanye, W.U. Study of Random Simulation of Columnar Jointed Rock Mass and Its Representative Elementary Volume Scale. Chin. J. Rock Mech. Eng. 2008, 27, 1202–1208. [Google Scholar]
  30. Di, S.J.; Zheng, W.T.; Zhang, J.K. Back Analysis on Mechanical Deformation Parameters of Columnar Jointed Rock Mass. Appl. Mech. Mater. 2011, 55–57, 1947–1950. [Google Scholar] [CrossRef]
  31. Ramamurthy, T. Strength and Modulus Responses of Anisotropic Rocks. Compr. Rock Eng. 1993, 19, 147–166. [Google Scholar]
  32. Ramamurthy, T.; Rao, G.V.; Singh, J. Engineering Behaviour of Phyllites. Eng. Geol. 1993, 33, 209–225. [Google Scholar] [CrossRef]
Figure 1. Baihetan Hydropower Station. (a) Location of the hydropower station. (b) Layout of the project.
Symmetry 15 00944 g001
Figure 2. Geological environment of the Baihetan dam foundation. (a) Typical engineering geological section of the dam foundation. (b) Vertical cross-section of the CJRM (parallel to the column axis direction). (c) Horizontal cross-section of the CJRM (perpendicular to the column axis direction).
Symmetry 15 00944 g002
Figure 3. Voronoi diagram. (a) The Voronoi diagram generated by random seed points. (b) The Voronoi polygon with adjacent seed points.
Symmetry 15 00944 g003
Figure 4. Single-random movement with range constraint Voronoi diagram of uniform seed points. (a) Expanded region (2 m × 2 m) with uniformly distributed seed points. (b) Voronoi diagram generated by uniform distributed seed points (Ir = 0). (c) Single-random movement with range constraint diagram. (d) Single-random moved seed points. (e) Voronoi diagram generated by single-random moved seed points. (f) Voronoi diagram with Ir = 35%. (g) Existence and elimination of relative short edges. (h) Voronoi diagram with target polygon density and irregular factor without relative short edges.
Symmetry 15 00944 g004
Figure 5. CJRM geometric model reconstruction method. (a) Generation of transverse joint. (b) Generation of the coordinate axis. (c) Rotation of the cube. (d) The final CJRM geometric model with six geological statistical parameters.
Symmetry 15 00944 g005
Figure 6. The entire procedure of the CJRM geometric model reconstruction method.
Symmetry 15 00944 g006
Figure 7. CJRM geometric model reconstruction method. (a) Special mold for sample preparation. (b) Generation of the real project geometric model.
Symmetry 15 00944 g007
Figure 8. Failure criterion of Mohr–Coulomb criterion in the 3DEC software.
Symmetry 15 00944 g008
Figure 9. Comparison of the physical model test and numerical simulation under uniaxial compression.
Symmetry 15 00944 g009
Figure 10. Comparison of the uniaxial compressive strength between experimental data [15] and numerical results.
Symmetry 15 00944 g010
Figure 11. Variation in uniaxial compression strength of the numerical CJRM model with different strike angles and irregular factors. (a) Varying strike angles. (b) Varying irregular factors.
Symmetry 15 00944 g011
Figure 12. Variations in strength anisotropy of the strike angle with irregular factor.
Symmetry 15 00944 g012
Figure 13. Variation in the uniaxial compression strength of the numerical CJRM model with different dip angles and irregular factors. (a) Varying dip angles. (b) Varying irregular factors.
Symmetry 15 00944 g013
Figure 14. Variations in strength anisotropy of the dip angle with irregular factor.
Symmetry 15 00944 g014
Figure 15. Visualization of three-dimensional anisotropy characteristics in the CJRM with varied irregular factors using Polar Coordinate System Transformation. (a) Ir = 0; (b) Ir = 10%; (c) Ir = 20%; (d) Ir = 30%; (e) Ir = 40%.
Symmetry 15 00944 g015aSymmetry 15 00944 g015b
Table 1. Properties of complete columns in the numerical simulation.
Bulk Density
(kg/m3)
Elastic Modulus
(GPa)
Friction Angle
(°)
Poisson’s RatioTensile Strength
(MPa)
Cohesion
(MPa)
28006056.130.2512.4
Table 2. Properties of joints in the numerical simulation.
Cohesion
(MPa)
Normal Stiffness (GPa/m)Shear Stiffness (GPa/m)Friction Angle
(°)
Tensile Strength
(MPa)
0.610050360
Table 3. Column parameters of the numerical CJRM model.
Bulk Density
(kg/m3)
Elastic Modulus
(GPa)
Friction Angle
(°)
Poisson’s RatioTensile Strength
(MPa)
Cohesion
(MPa)
11701.2451.30.190.841.37
Table 4. Joint plane parameters of the numerical CJRM model.
Cohesion
(MPa)
Normal Stiffness (GPa/m)Shear Stiffness (GPa/m)Friction Angle
(°)
Tensile Strength
(MPa)
0.049.214.72320.04
Table 5. Geometric parameters of the numerical models with different strike angles and irregular factors.
Size
(m)
Polygon Density (m−2)Irregular FactorDip Angle
(°)
Strike Angle
(°)
Transverse Joint Spacing
(m)
Transverse Joint Penetration
3 × 3 × 320.150
10%
20%
30%
40%
0000
15
30
45
60
75
90
Table 6. Geometric parameters of the numerical modells with different dip angles and irregular factors.
Size
(m)
Polygon Density (m−2)Irregular FactorDip Angle
(°)
Strike Angle
(°)
Transverse Joint Spacing
(m)
Transverse Joint Penetration
3 × 3 × 320.150
10%
20%
30%
40%
0000
15
30
45
60
75
90
Disclaimer/Publisher’s Note: The statements, opinions and data contained in all publications are solely those of the individual author(s) and contributor(s) and not of MDPI and/or the editor(s). MDPI and/or the editor(s) disclaim responsibility for any injury to people or property resulting from any ideas, methods, instructions or products referred to in the content.

