1. Introduction
Color solutions improve the perception of complex information. According to Maxwell’s theory of color perception [
1], there are three principal color channels—red, green, and blue. These three channels are structurally comparable to the trinity of nucleotide sub-alphabets. As with nucleotides, these channels have a “complementary” CMYK system (
Figure 1). The presence of a trinity of binary sub-alphabets underlies the comparison: 2 or 3 hydrogen bonds, keto-amino properties, and purine-pyrimidine properties. There are also three sub-alphabets for the complementary strand of DNA. These triplets of sub-alphabets are structurally related to the color triangle. There are also more complex relationships between the phenomenon of the degeneracy of genetic coding and color theory, described in the works of Sergey Petoukhov [
2,
3]. Petoukhov described the connection of these color triangles with genetic algebras [
4]. However, we will consider other features also explored by Petoukhov. Namely, we will colorize our visualizations, previously analyzed and presented in [
5,
6,
7], according to the principles illustrated in this work. This group of complex visualization methods combines several techniques, including animated computer graphics and combining various techniques for visualizing genetic information.
Visualization of the structure of molecular genetic information has long been of interest to researchers. Presently, it is possible to observe the DNA structure by employing X-ray analysis. However, because of the quantum mechanical effects, we cannot receive a clear picture of DNA, not to mention color. Simultaneously, color perception is inherent in humans and simplifies the processing of vast volumes of complexly structured information. It is worth noting that the geometrization and visualization of voluminous data issues related to the ergonomics of perception and optimization of the intellectual work of operators working with considerable amounts of information. To date, it has been possible to visualize complex molecular genetic information using various graphs, pictograms, diagrams, and analytical algorithms. If you open a file containing sequenced genetic data in a text editor, you can observe a four-character sequence—nucleotides A, G, T/U, and C. That is a display of a specific DNA section on the monitor screen. Simultaneously, the present methods for representing molecular genetic information have advantages and disadvantages. The benefits include displaying and highlighting particular genes and building various analytical histograms and distributions, including the possibility of interaction of the operator–researcher with genetic information through computer interfaces. The drawbacks of such methods include that they are not always practical or sufficiently clear to the end user.
Let us consider some aspects of DNA imaging technologies and molecular genetic modeling covered in the scientific literature. The nucleus of a cell is a complex, highly organized system. In [
8], advancements in chromosome imaging tools reveal further insights into the topology of the three-dimensional genome. It is worth noting that chromosome imaging techniques have demonstrated the presence of chromosome territories, useful nuclear landmarks, and topologically related domains. A crucial principle governing nuclear reactions is the spatial placement of the chromosome [
9]. The software 4D Nucleome Network is used to clarify the intricate arrangement of chromosomes in the nucleus and the consequences of their disruption on biology [
10]. Ref. [
11] describes the software package to retrieve, group, and display the genetic data from the knowledge base. Utilizing the tool described in [
12], users can obtain a clear image of the chromosomal distribution pattern through the visualization of genome-wide data mapping. The paper [
13] describes the optical reconstruction of chromatin architecture (ORCA), a method that can trace the DNA path in single cells with nanoscale accuracy and genomic resolution reaching two kilobases.
The study [
14] proposes taxonomies and tasks related to genomic data visualization. The study [
15] describes an alignment genetic visualization tool. It is a system that helps understand structural variants by displaying the position of alignments. The paper [
16] presents a method for predicting the 3D structures of chromosomes. In their research [
17], authors demonstrate how to simulate the supercoiling and condensation of a bacterial chromosome by using a molecular dynamics engine. Interestingly, modeling and visualization of chromosomes are closely related to the mechanical properties of the genetic molecule. The mechanistic models presented in the article [
18] offer verifiable theories regarding the fundamentals of genome folding. By concentrating on the fundamental biophysical mechanisms, fitting-free mechanistic models based on polymer simulations forecast chromatin folding in three dimensions. As follows from the literature analysis, there are several main groups for visualization, including methods for visualizing quantitative data (charts, histograms, and graphs) and techniques for visualizing textual information (semantic networks, tree displays, and diagrams). Furthermore, they distinguish between methods for visualizing concepts (concept maps or Gantt charts), methods for the visualization of metaphors (a template can serve as a basis), and methods for the visualization of strategies (for example, road maps). Refs. [
19,
20,
21] discuss some facets of visualization methods. Refs. [
22,
23,
24] describe the mathematical aspects of the four-color problem.
The study aims to analyze the results of DNA visualization algorithms using various coloring options. Let us show two variants of coloring—one based on the first letter of the fragments of the molecule and the other based on the frequencies of these fragments.
2. Materials and Methods
In his works, Sergey Petoukhov, the founder of matrix genetics, paid much attention to the theory of color and its connection with the algebras of genetic code.
Figure 1 shows the Star of David, a multiplication-closed set of genetic matrices obtained by analyzing the degeneracy of the genetic code using the matrix approach. These matrices were acquired by permutations in triplets. Ref. [
25] describes this algorithm at greater length. It is worth noting the structural connection between these matrices and color theory. Matrices fully reproduce color representations because of the multiplication operation. Algorithms for coloring genetic representations help enhance the perception of complex genetic information using color. Simultaneously, this opens up some perspectives in the study of the algebras of the genetic code. That also opens up a connection with the degeneracy of the genetic code encoded by triplets.
As we noted, the objective of this study is to describe the techniques of chromatic differentiation (coloring) of the mappings of molecular genetic information described earlier in our papers [
5,
6,
7]. Earlier in our work, we proposed the concept of geometry or genetic visualization through algebraic geometrization in biology. We used different representations in parametric spaces, various dimensions, and diverse coordinate systems.
Let us describe the chief ideas of the proposed set of methods for chromatic differentiation of the composition of nucleic acids. The genetic code represents a system of four nucleotides, mathematically described by Hadamard matrices and Walsh functions. As shown in [
26], tetra representations remain an adequate description of the phenomenon of genetic coding. In genometric visualization algorithms, we deal with nucleic acid fragments of identical length. We will color each one in the same color as its last nucleotide. We have four nucleotides in total. Thereupon, we will make use of four colors. Each color will correspond to a nucleotide. Thus, considering the quaternary nature of the molecular genetic code, it seems rational to employ the basic set of four colors. To select specific colors, let us turn to the RGB color model.
To color genometric mappings with four colors, one can rely on the well-known RGB scheme proposed by Maxwell [
1,
27]. The RGB representation in
Figure 2 structurally corresponds to the projection of a pair of Sierpinski tetrahedra, sculpting a three-dimensional figure comprising two complementary tetrahedra. We previously constructed the latter utilizing a system of binary sub-alphabets and Hadamard nucleotide matrices [
5]. Note that the missing two vertices, which are absent in
Figure 2, are present in volume—these are black and white, which can be checked simply by mixing the colors of the vertices of each corresponding triangle. Each N-plet, moving inside the Sierpinski fractal with its two coordinates bijectively and functionally, sets the color. We will make use of this feature for further research. However, before we proceed to the results, let us describe the relationship between the system of methods we have been developing and the well-known DNA visualization system—Chaos Game Representation [
28].
3. Relation with Chaos Game Representation (CGR)
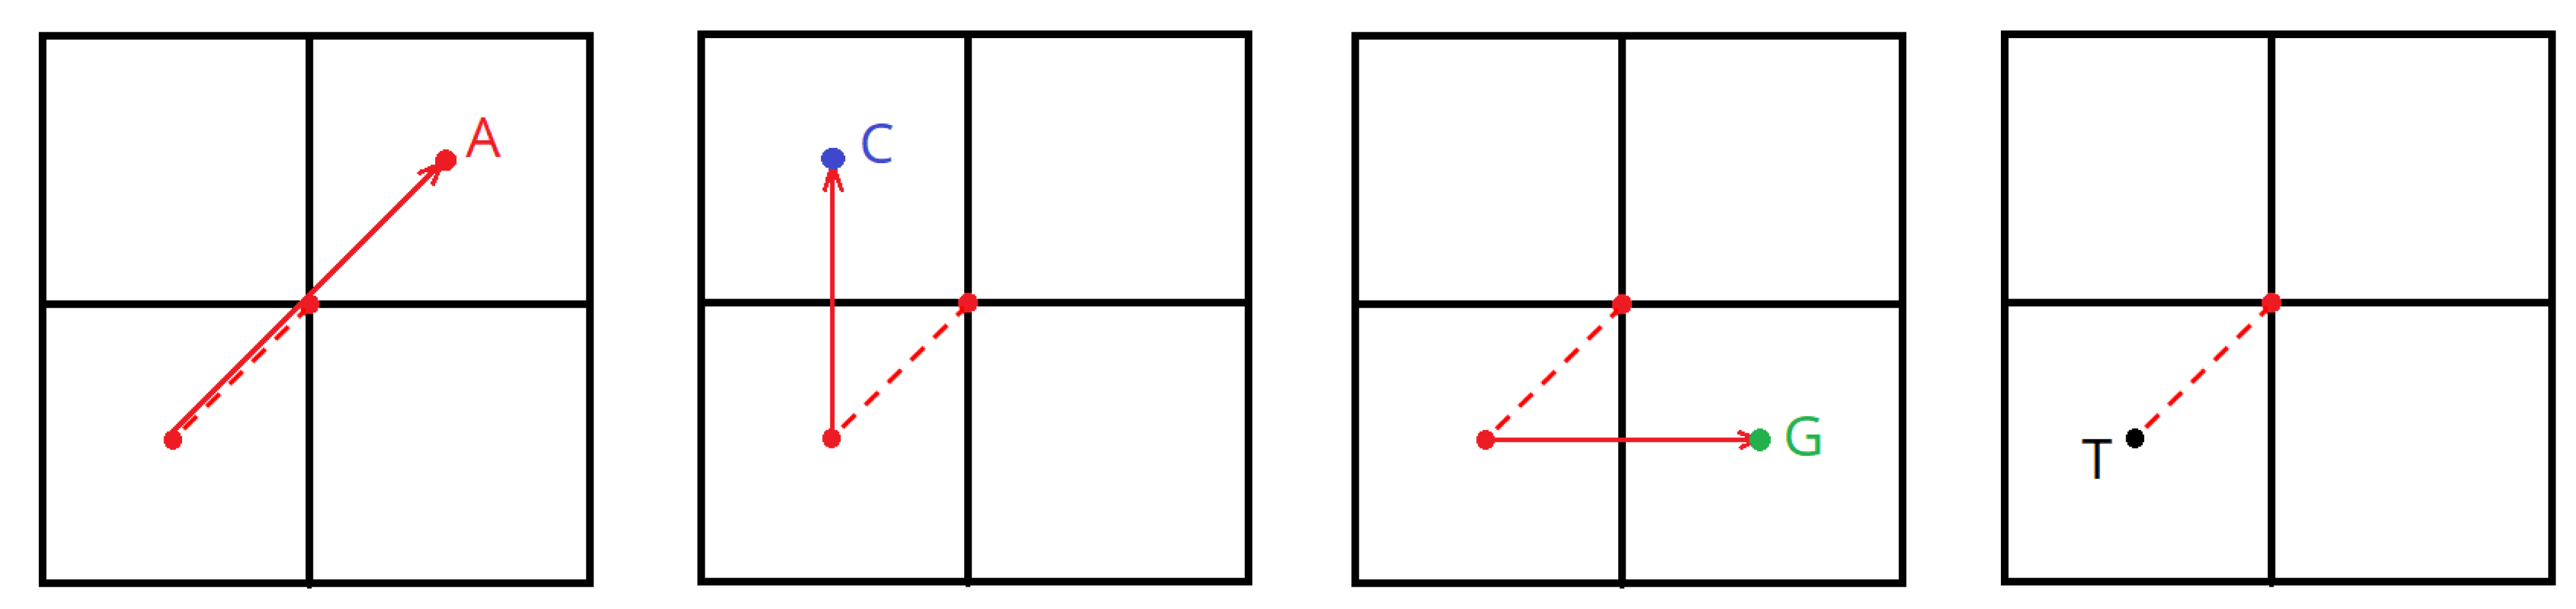
The creation of a fractal using the chaos game method is as follows:
Set the starting point coordinate—the center of the plane (X = width/2, Y = height/2);
Divide the X and Y values in two (see
Figure 3);
Depending on the current nucleotide, perform the following operations over the coordinates:
A: X = X + width/2; Y = Y + height/2;
C: X remains unaltered; Y = Y + height/2;
G: X = X + width/2; Y remains unaltered;
T/U: X remains unaltered; Y remains unaltered;
Mark a point in the plane.
Perform steps 2 to 5 over the next nucleotide; concurrently, the starting point will be the current one, i.e., the one marked in step 4.
Thus, each nucleotide falls within its subquadrant.
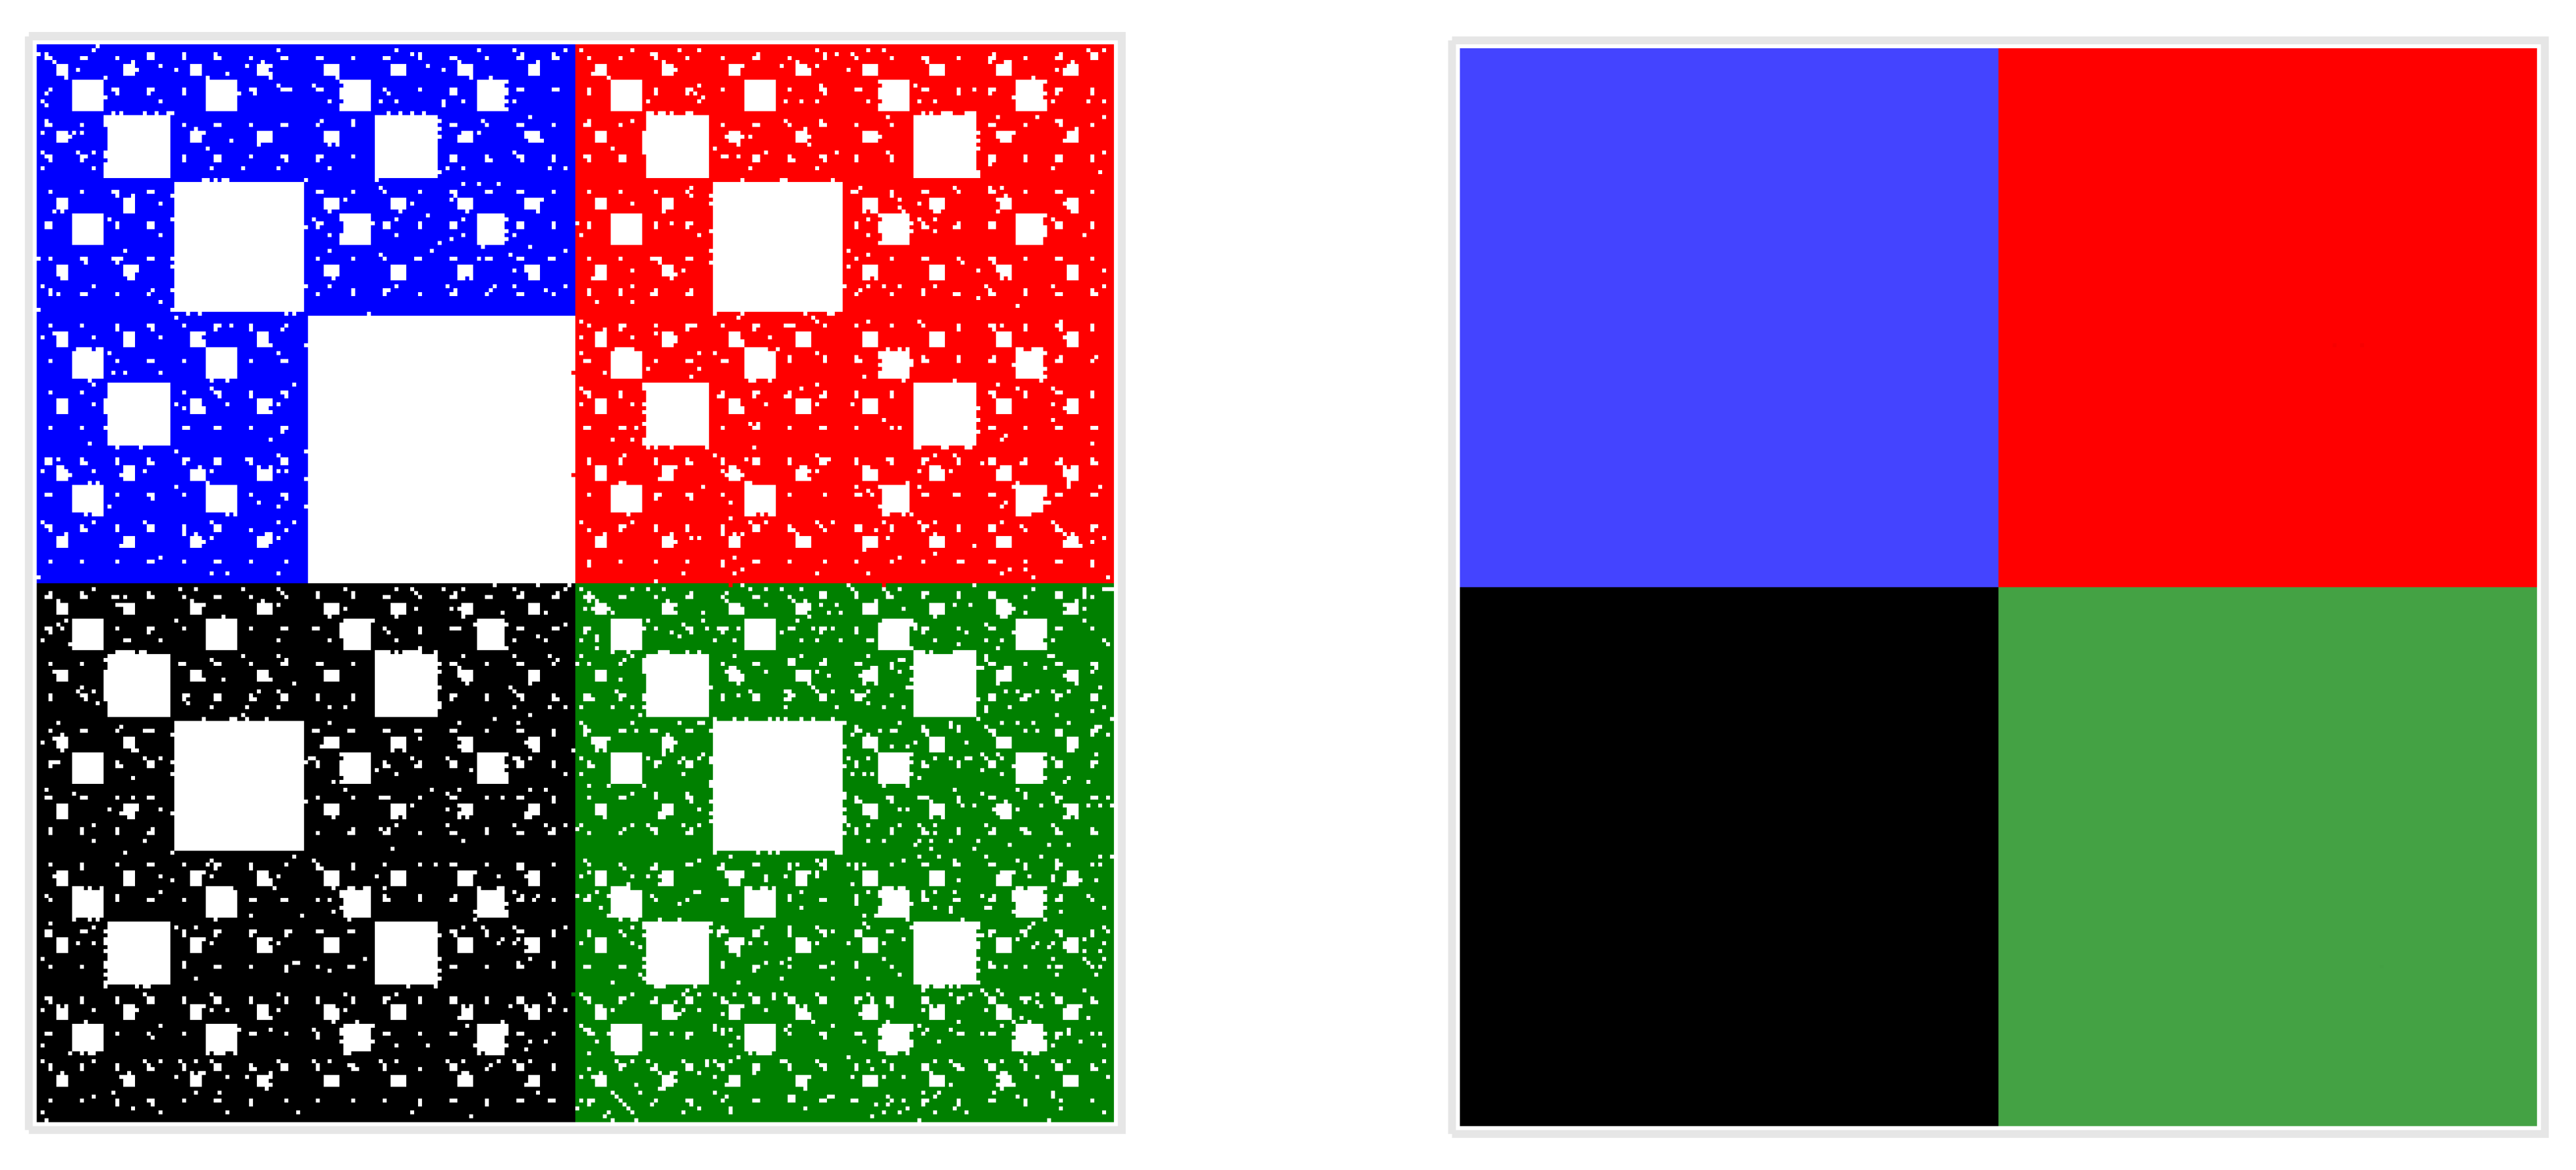
Compared to our described and developed methods with nucleotide Walsh functions at N = 1, the operational logic will remain the same. However, the nucleotide frequency is displayed in the subquadrant with the brightness of the point and not through its fractal.
Thus, the number of points from subquadrant A of the chaos game method will equal the frequency in subquadrant A by the techniques employing Walsh functions, matching the number of nucleotides A in the sequence.
Figure 4 demonstrates different approache between CGR and Walsh methods.
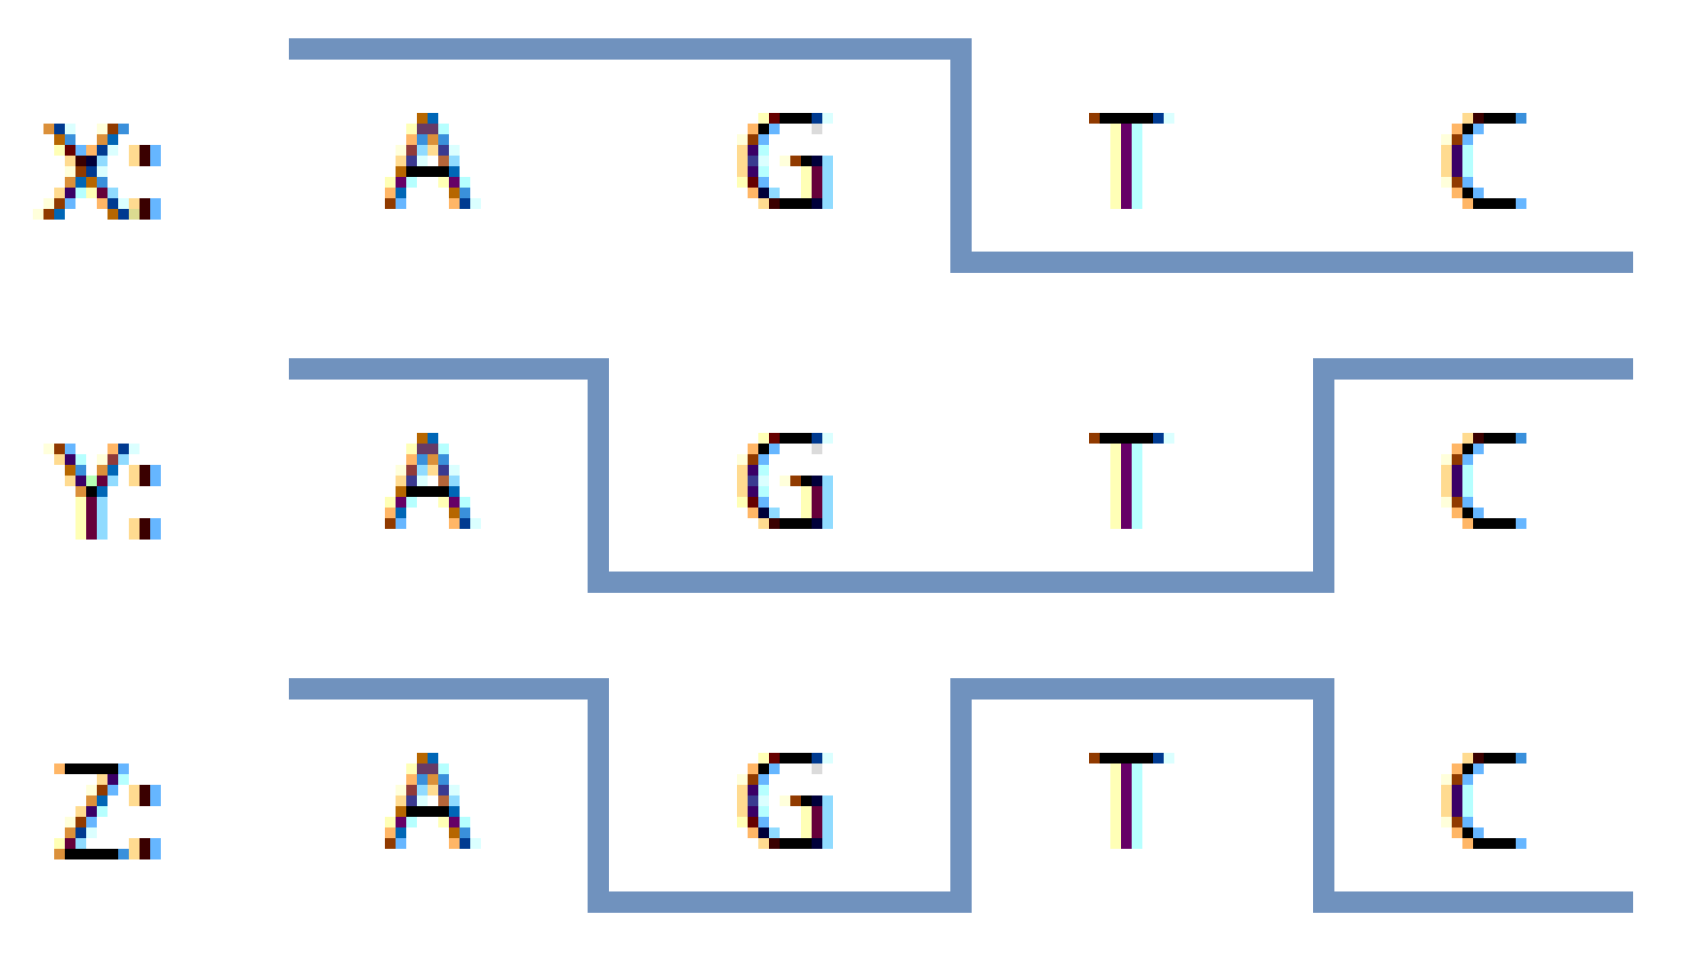
It is possible to extend coordinate variation rules to 3D cases, following the system of binary sub-alphabets (
Figure 5). There, for 1, we set a coordinate value, and 0 remains unaltered:
A:
1: X = X + width/2;
1: Y = Y + height/2;
1: Z = Z + depth/2;
C:
G:
1: X = X + width/2;
0: Y remains unaltered;
0: Z remains unaltered;
T/U:
0: X remains unaltered;
0: Y remains unaltered;
1: Z = Z + depth/2.
In this way, all sub-quadrants can be compared across all projections of nucleotide binary sub-alphabets and the chaos game.
Following the chaos game method, we have developed a visualization technique for N-plets, in which not simply each nucleotide but a substring of nucleotides is considered (as with the binary sub-alphabets system).
CGR extension. Let us complete the Chaos Game Representation (CGR) algorithm as follows:
Take the starting point coordinate–the center of the plane
Divide the X and Y values in two (see
Figure 6);
Depending on the current nucleotide, perform the following operations over the coordinates:
A: X = X + width/2; Y = Y + height/2;
C: X remains unaltered; Y = Y + height/2;
G: X = X + width/2; Y remains unaltered;
T/U: X remains unaltered; Y remains unaltered.
Shift the center of coordinates to the obtained point. Wherein:
width = width/2,
height = height/2.
Employ the next nucleotide from the N-plet and follow steps 2 through 5 until the entire nucleotide is processed. In this case, the starting point will be the current one-the new center of coordinates obtained in step 4.
Mark a point in the plane when all nucleotides of the N-plet have been processed.
Return the starting width and height values, and follow steps 2 to 7 for the next N-plet. In this case, the starting point will be the current one, i.e., obtained in step 6.
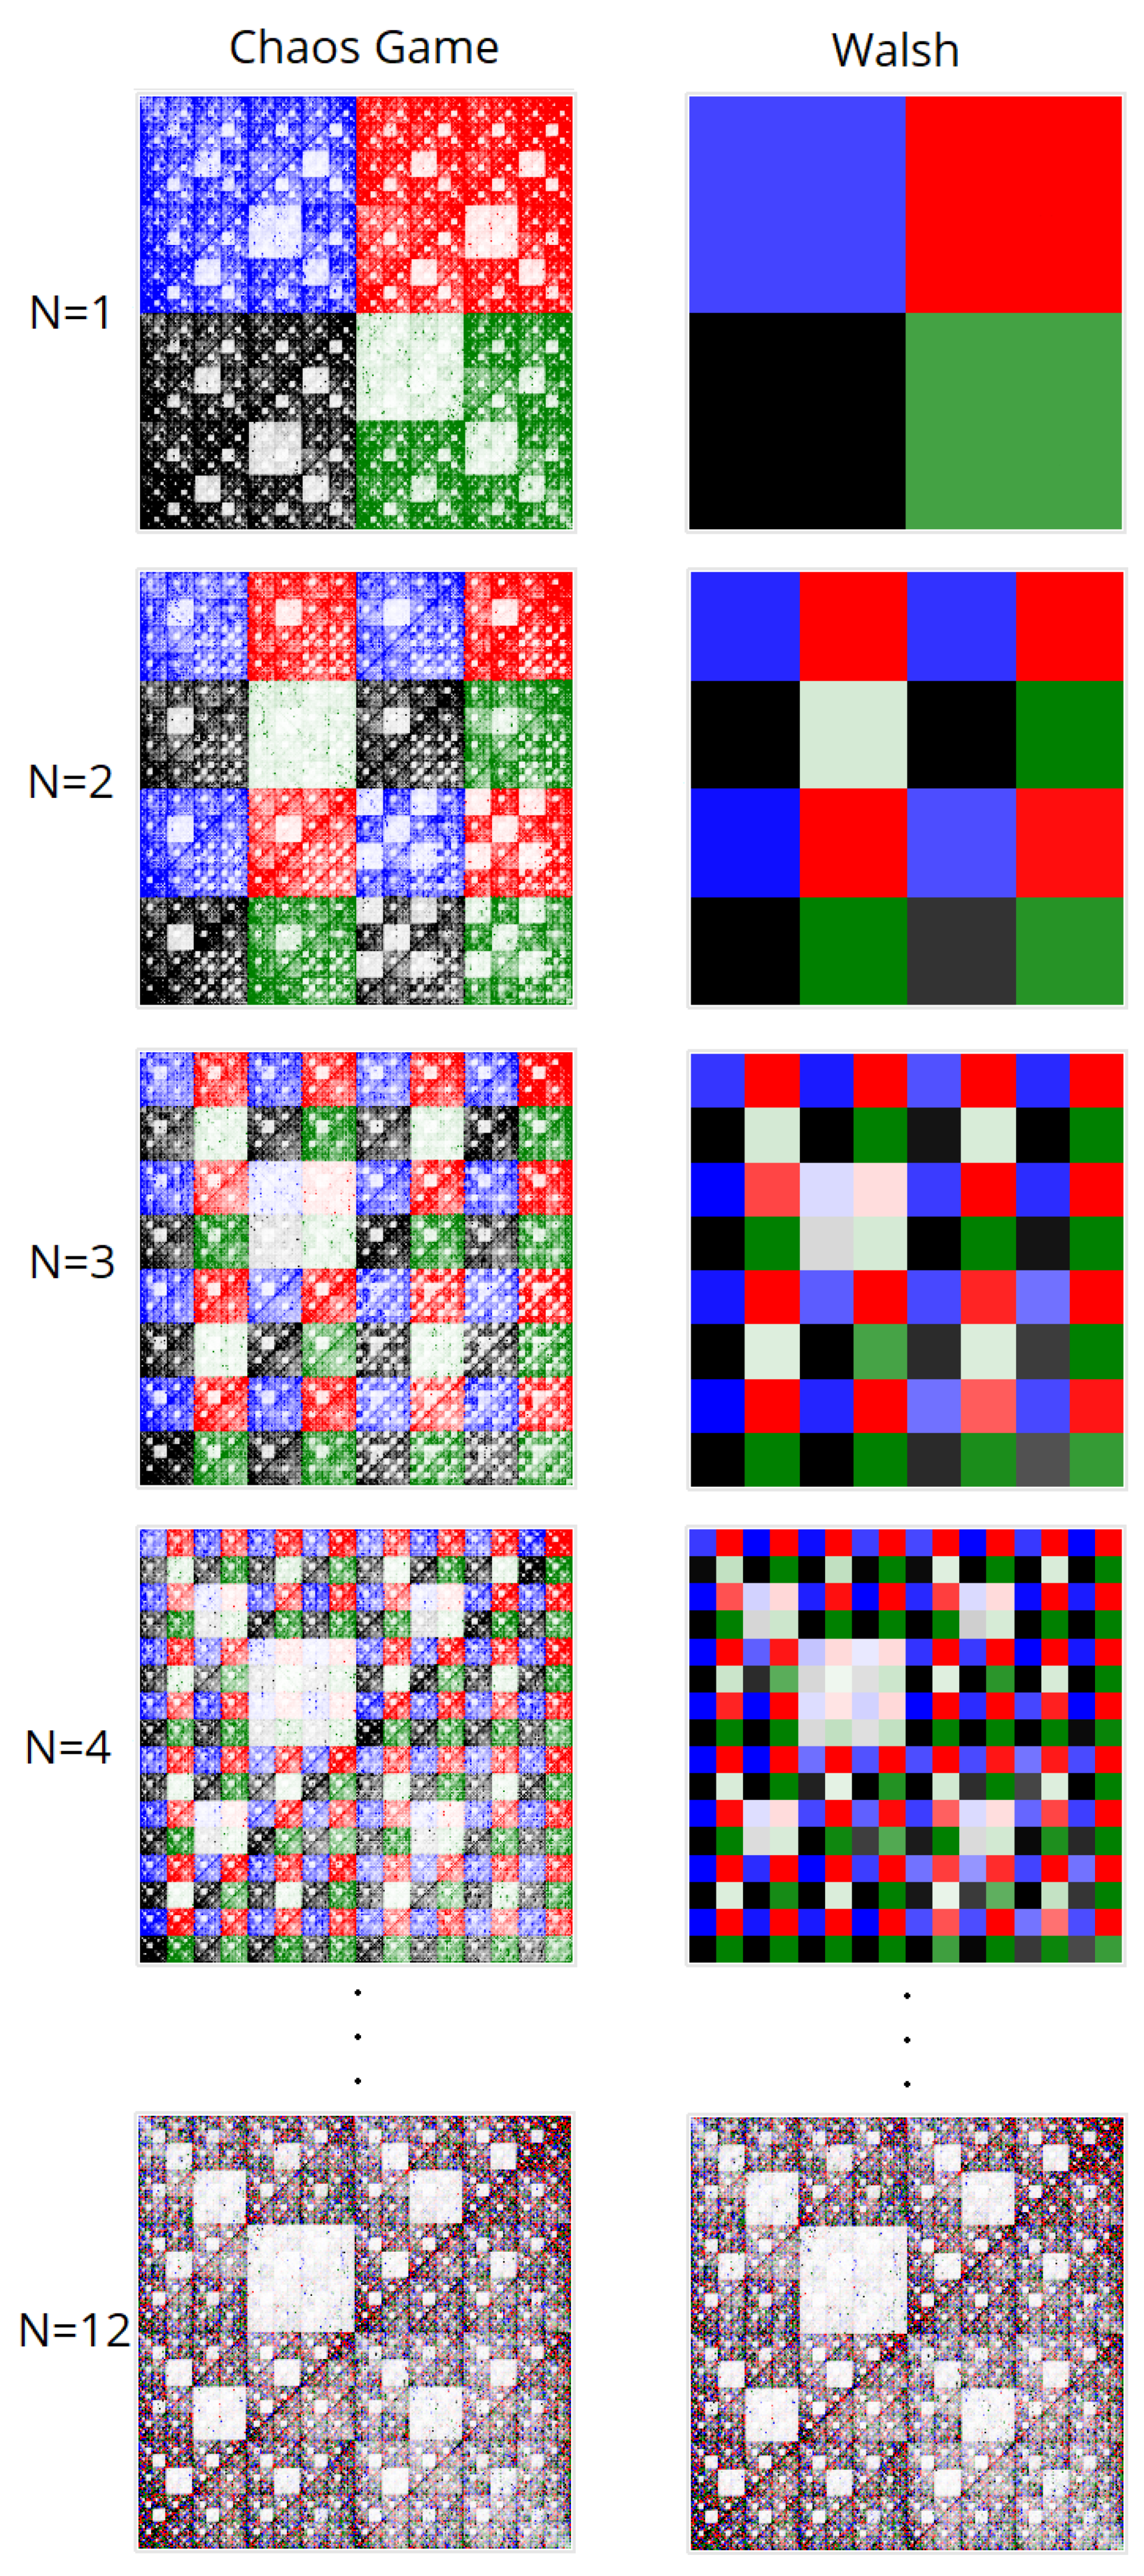
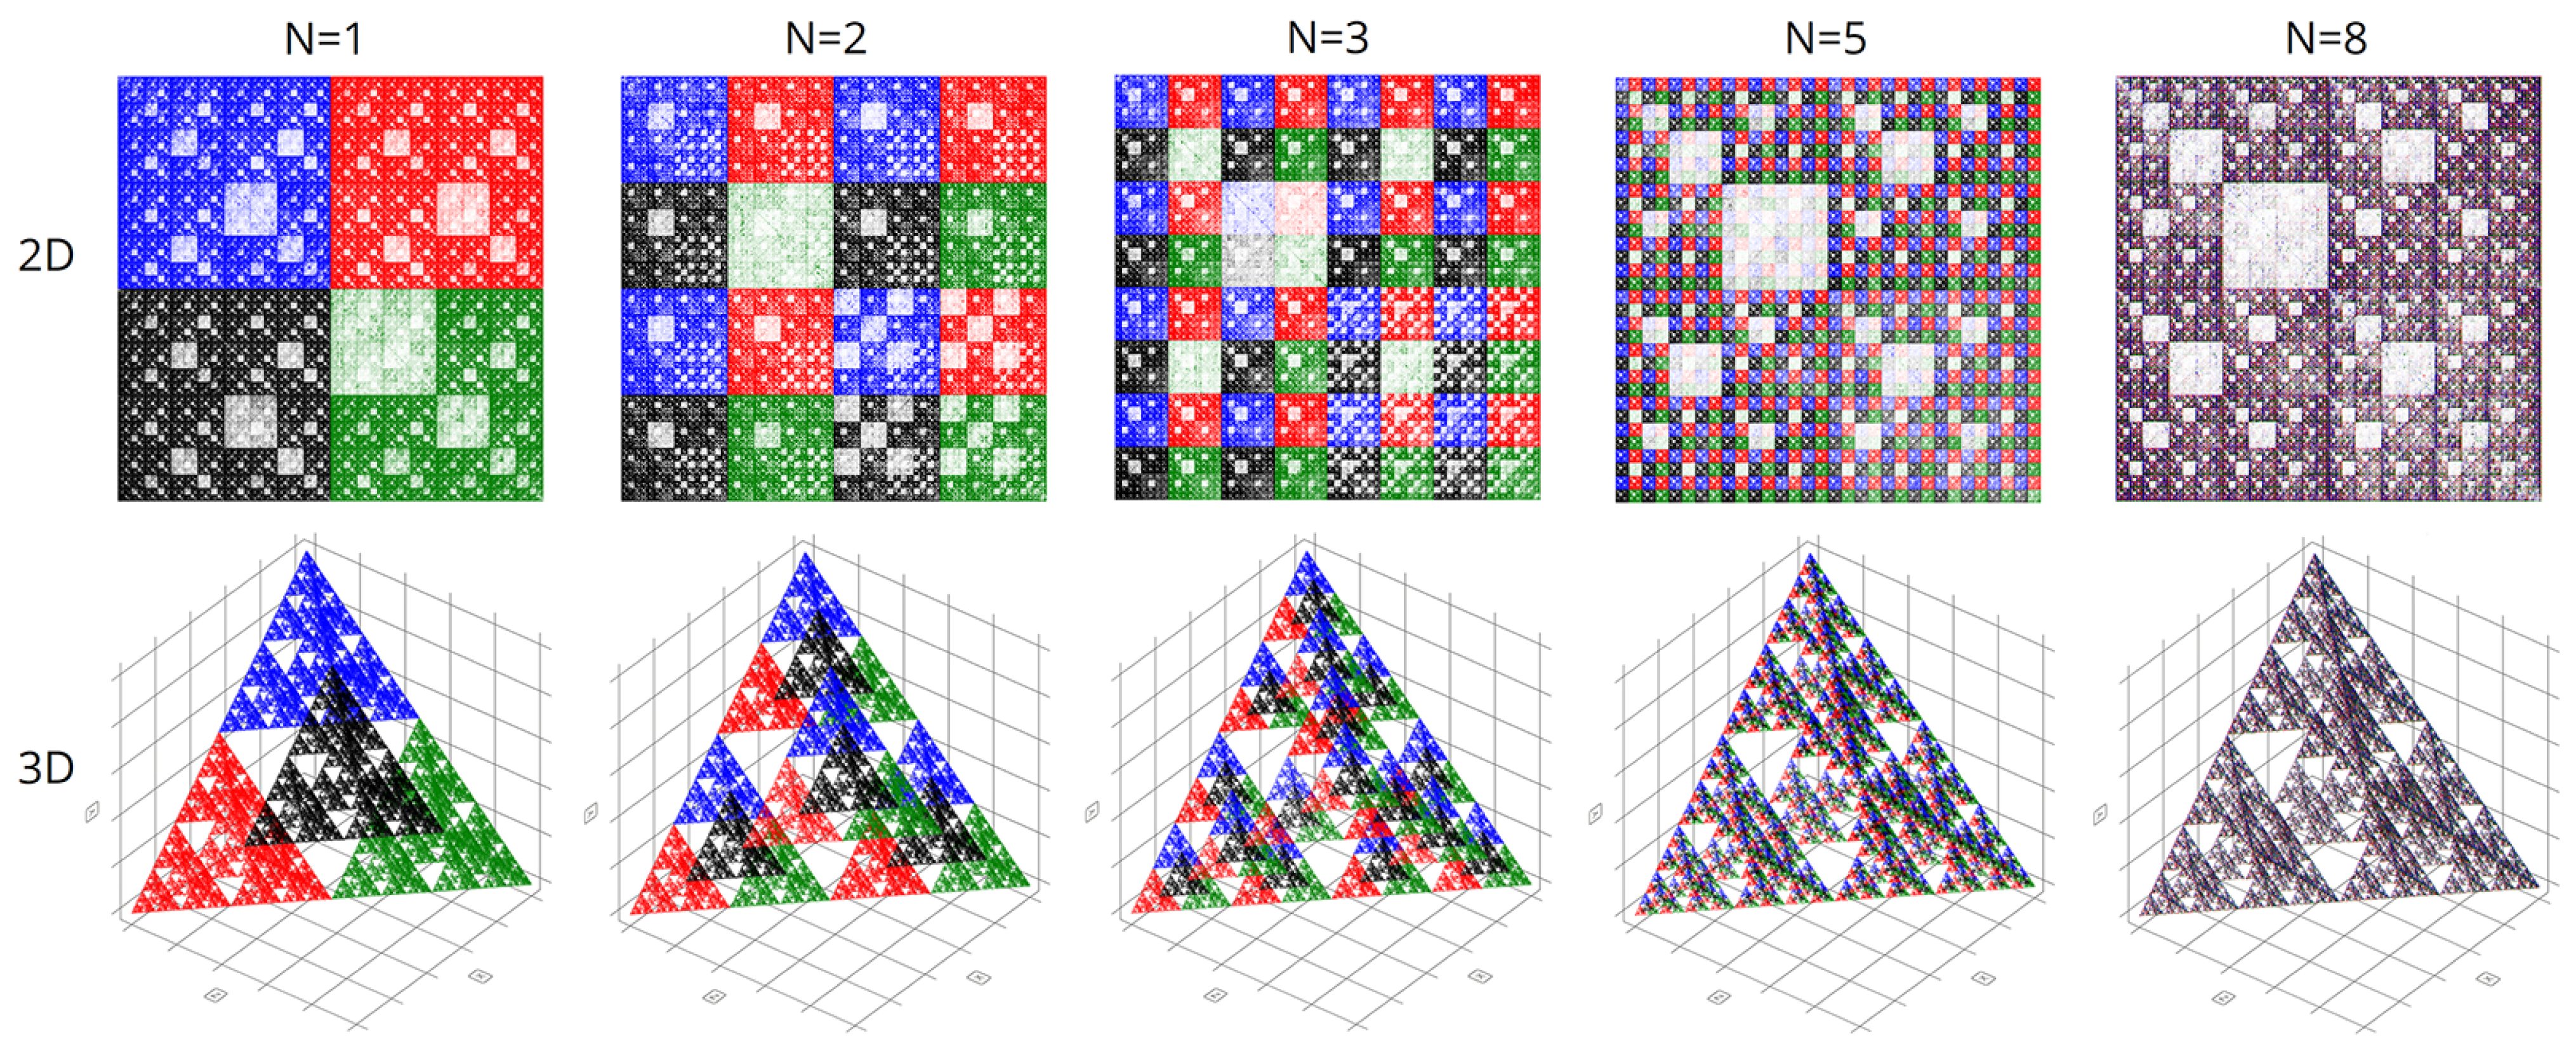
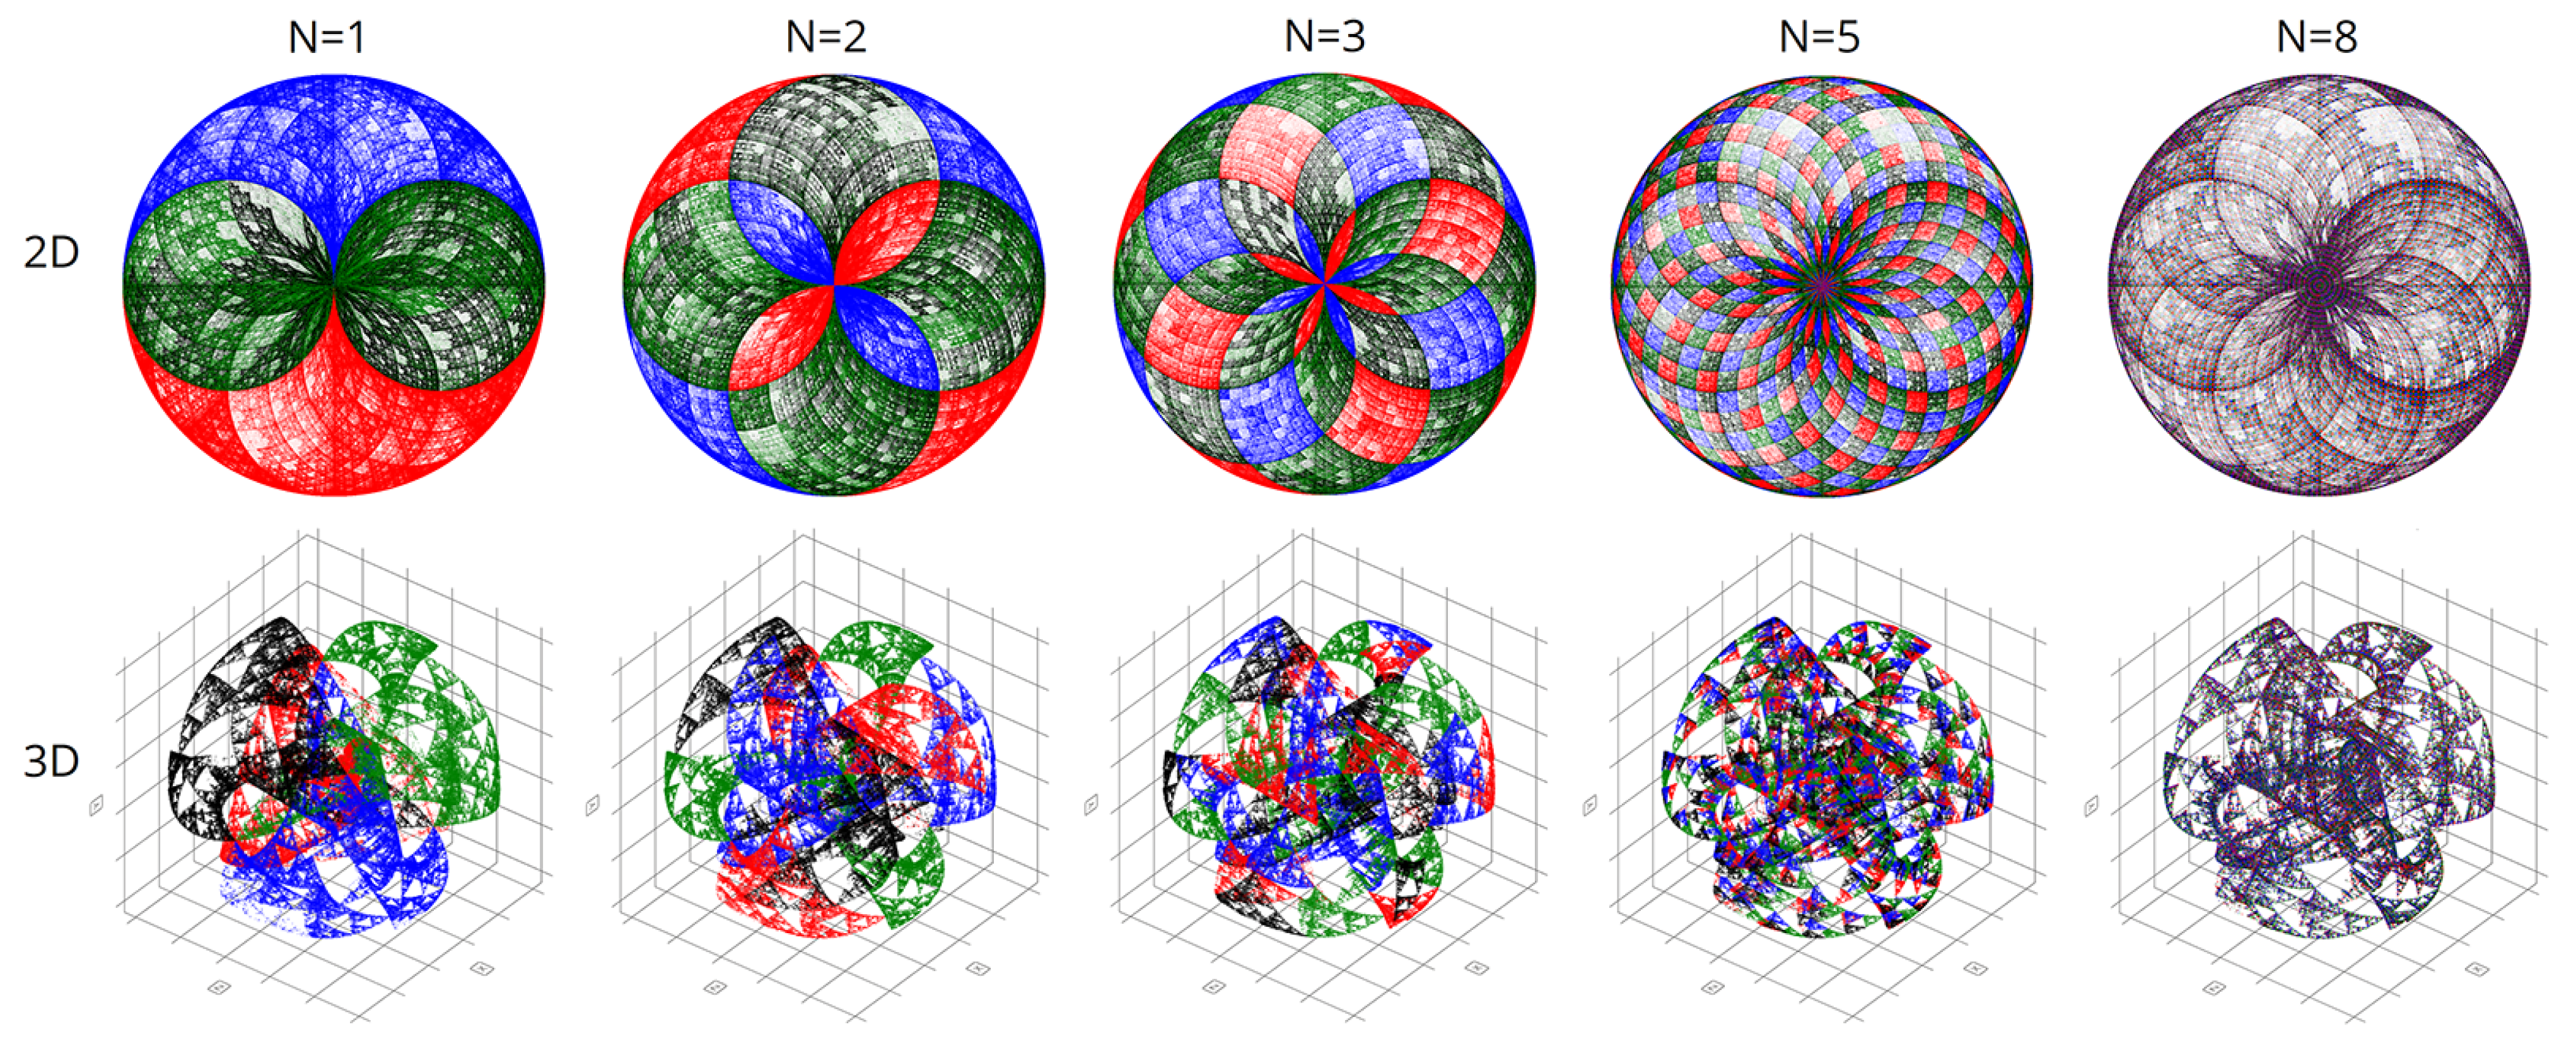
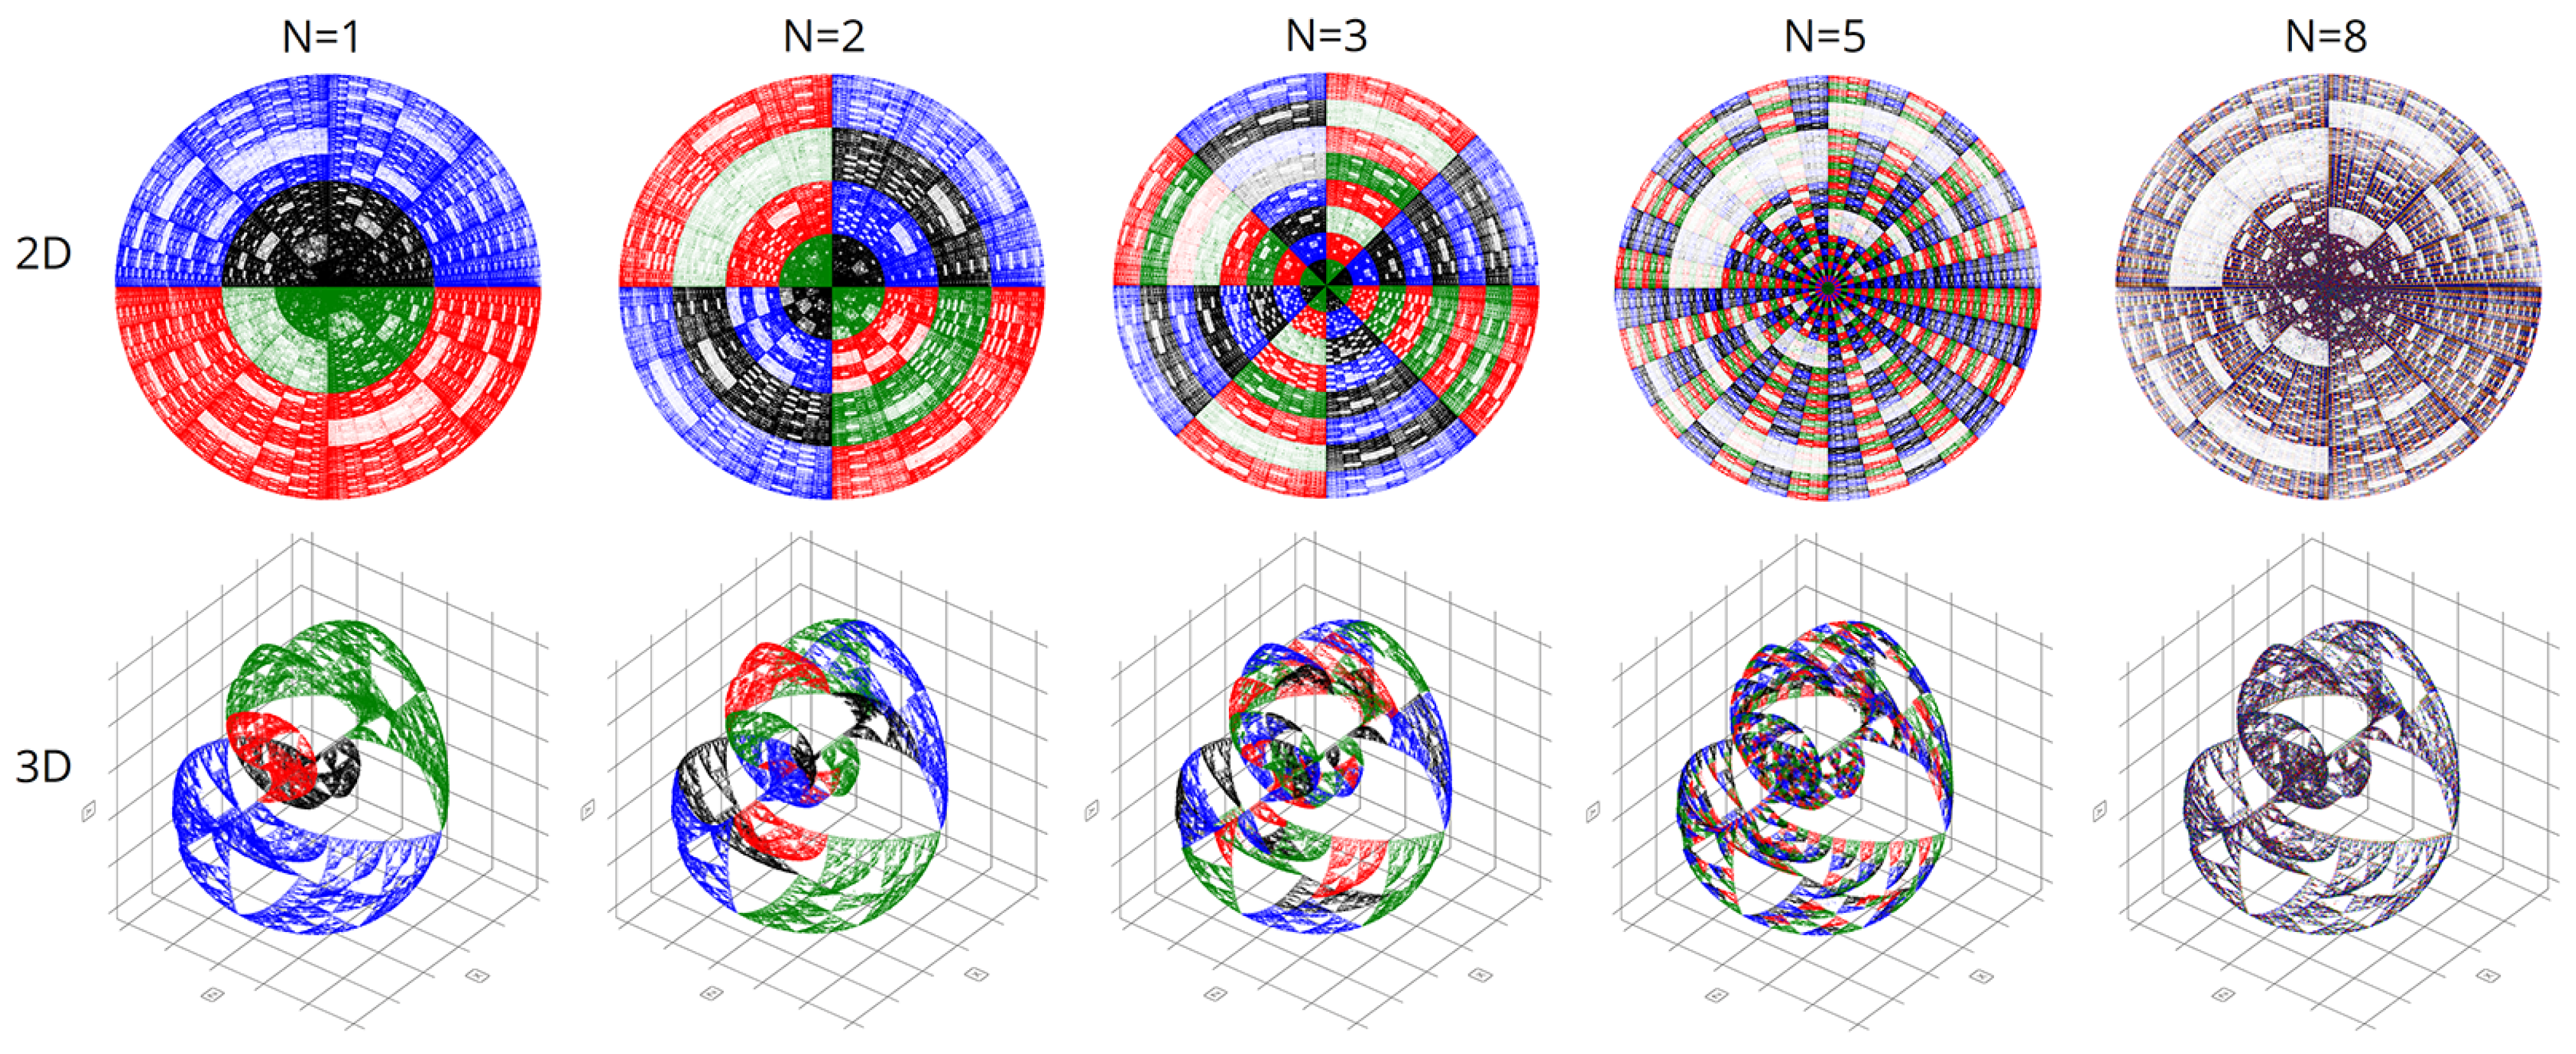
Figure 7 shows the final comparison of visualizations obtained using the CGR and Walsh methods at different parameters of the scaling factor N.
4. Results and Discussion
We created the first pilot version of our program in Python. However, this language proved to be disappointingly slow and unproductive for processing the voluminous genetic data. Therefore, we obtained all the results in this article using C++. This considerably accelerated the calculations and allowed the construction of more accurate graphical representations.
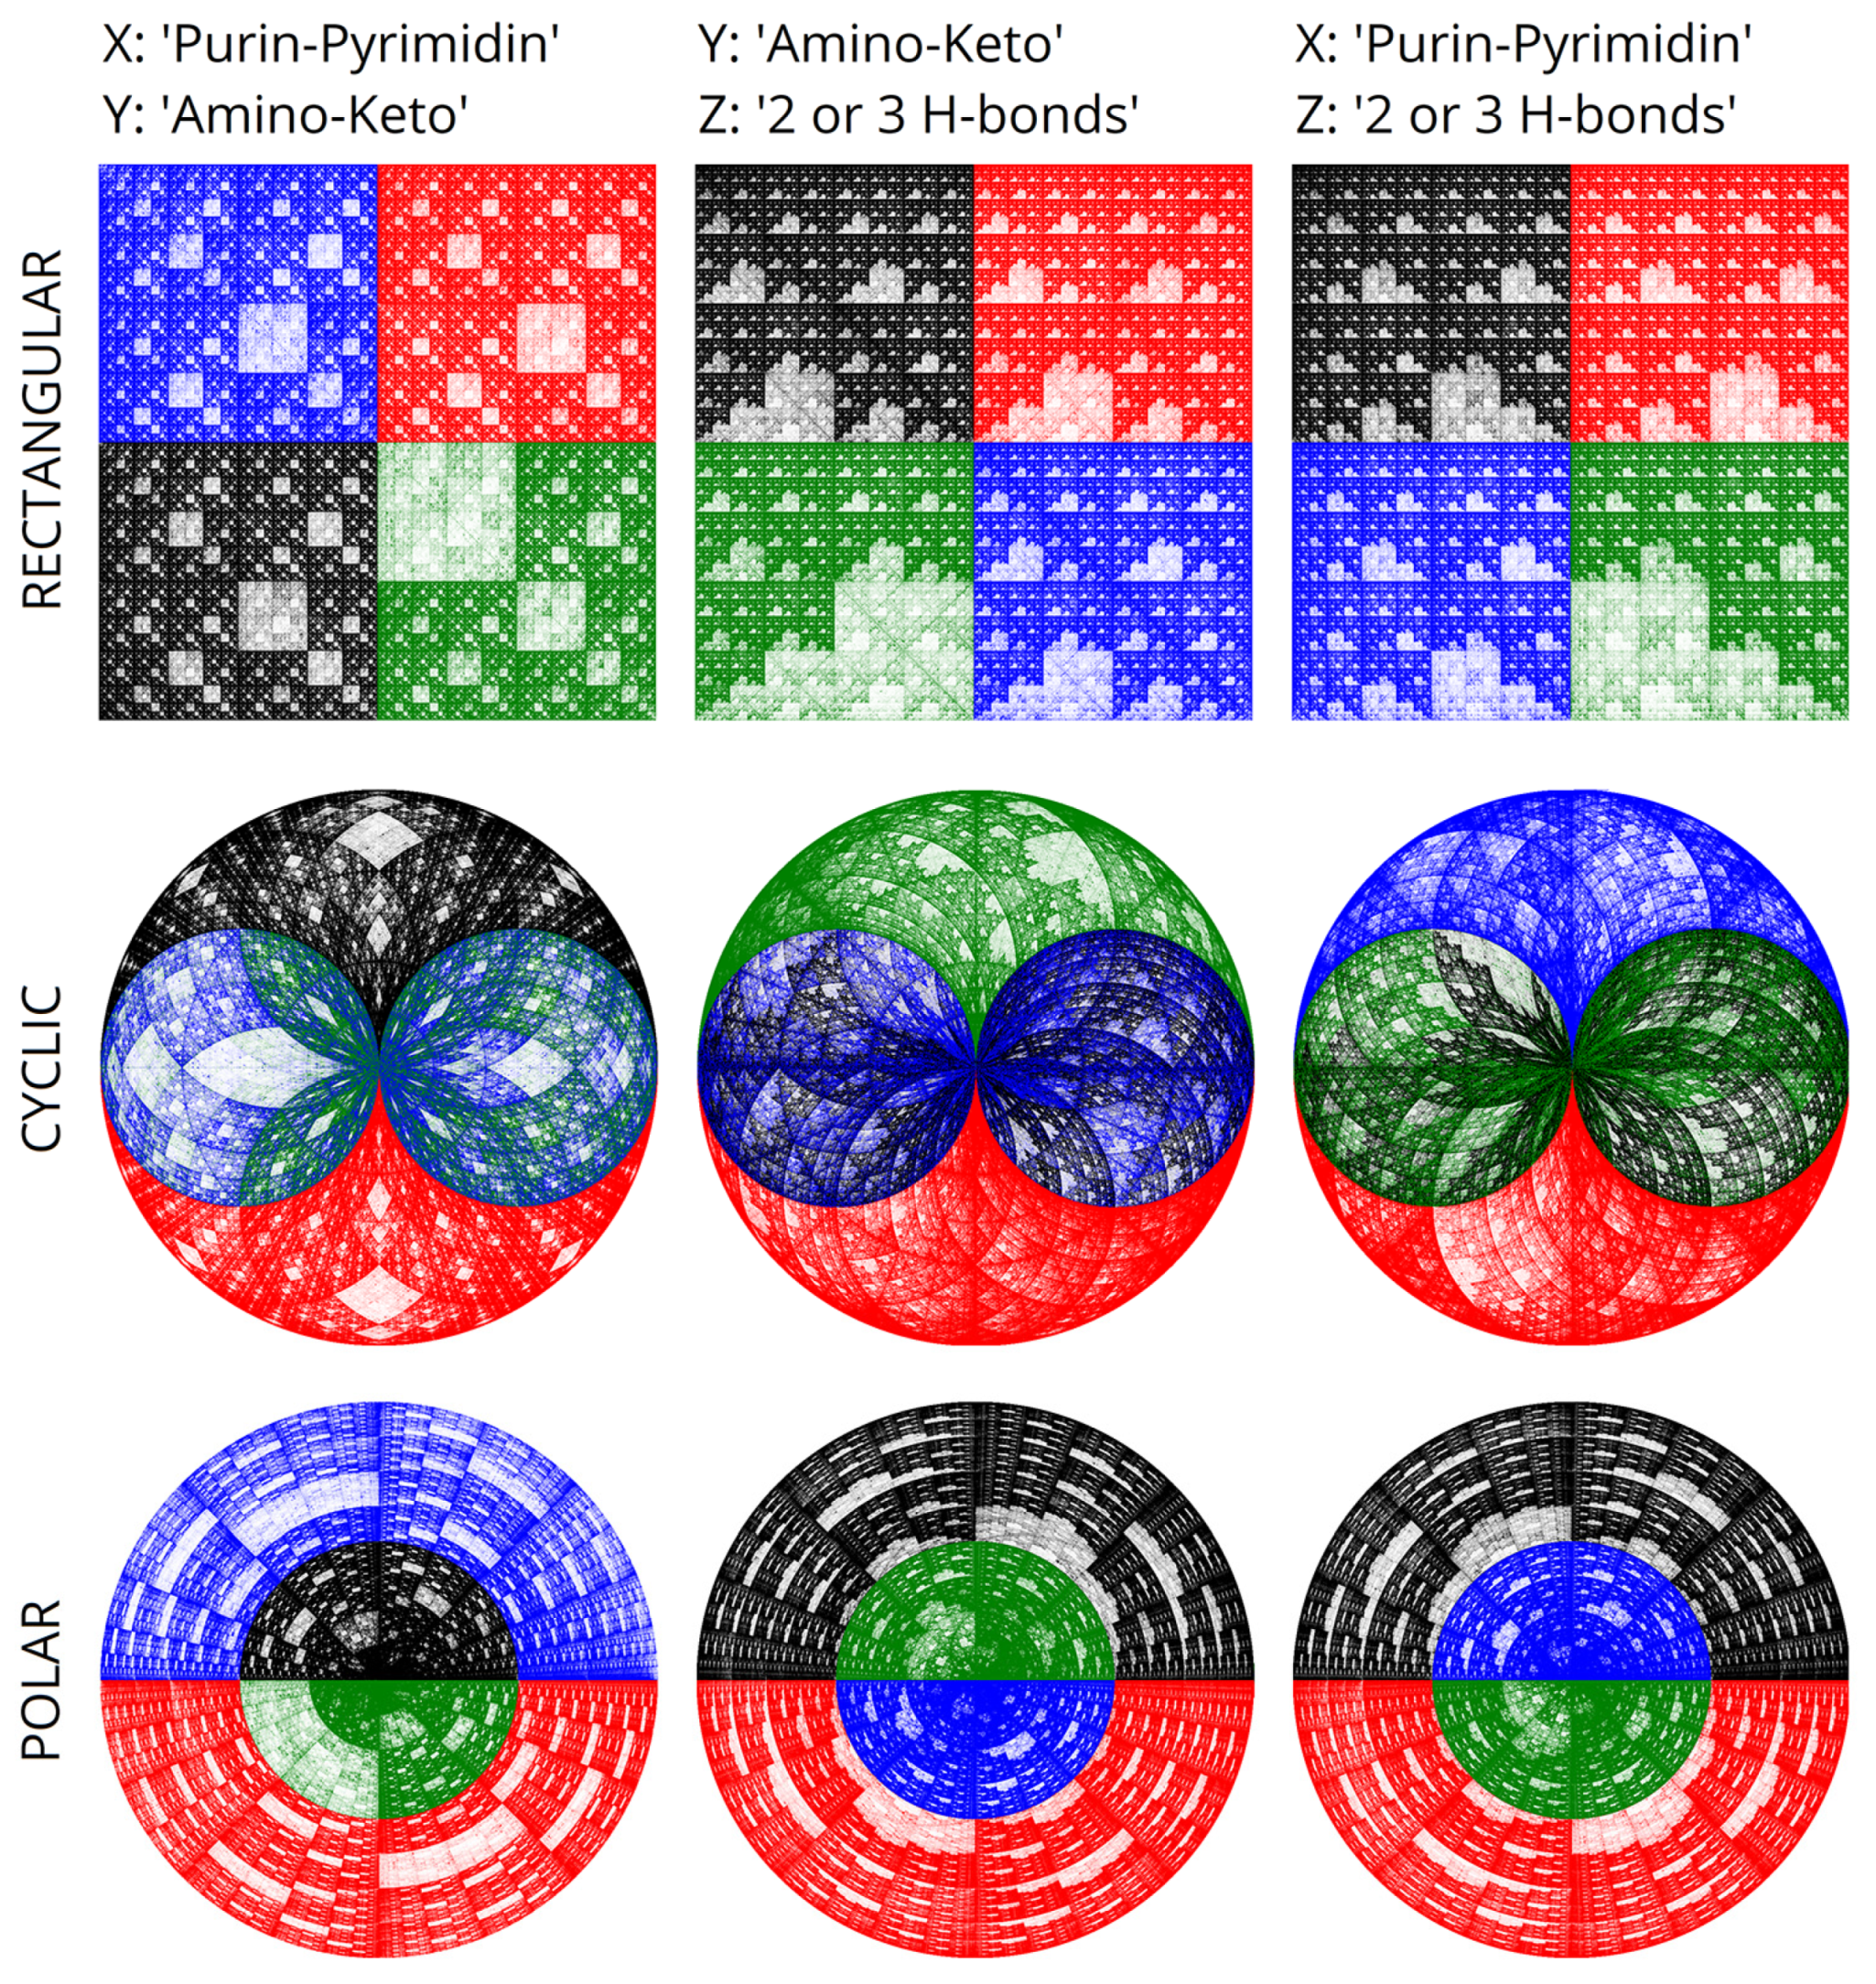
In computational experiments, we saw multiple genomes of many organisms in various coordinate systems. Spherical and cyclic coordinate systems in two and three dimensions are of particular interest. These visualizations exhibit beautiful fractal patterns and variety.
It is worth noting that with chromatic differentiation, there is an increase in computational loads compared to the basic approach. Therefore, we refrained from calculating the colors for each point to conserve computational resources. We computed colors based solely on the last nucleotide in the N-plet. Hence, only four colors were utilized in the visualizations, per the pyramid of Sierpinski, as depicted in
Figure 2.
Figure 8,
Figure 9,
Figure 10 and
Figure 11 are visualizations of the tenth human chromosome.
Animated 3D visualizations of human chromosome 10 at N = 3 are shown in the following video:
https://youtu.be/FdyrLvCsLGA, accessed on 1 April 2023.
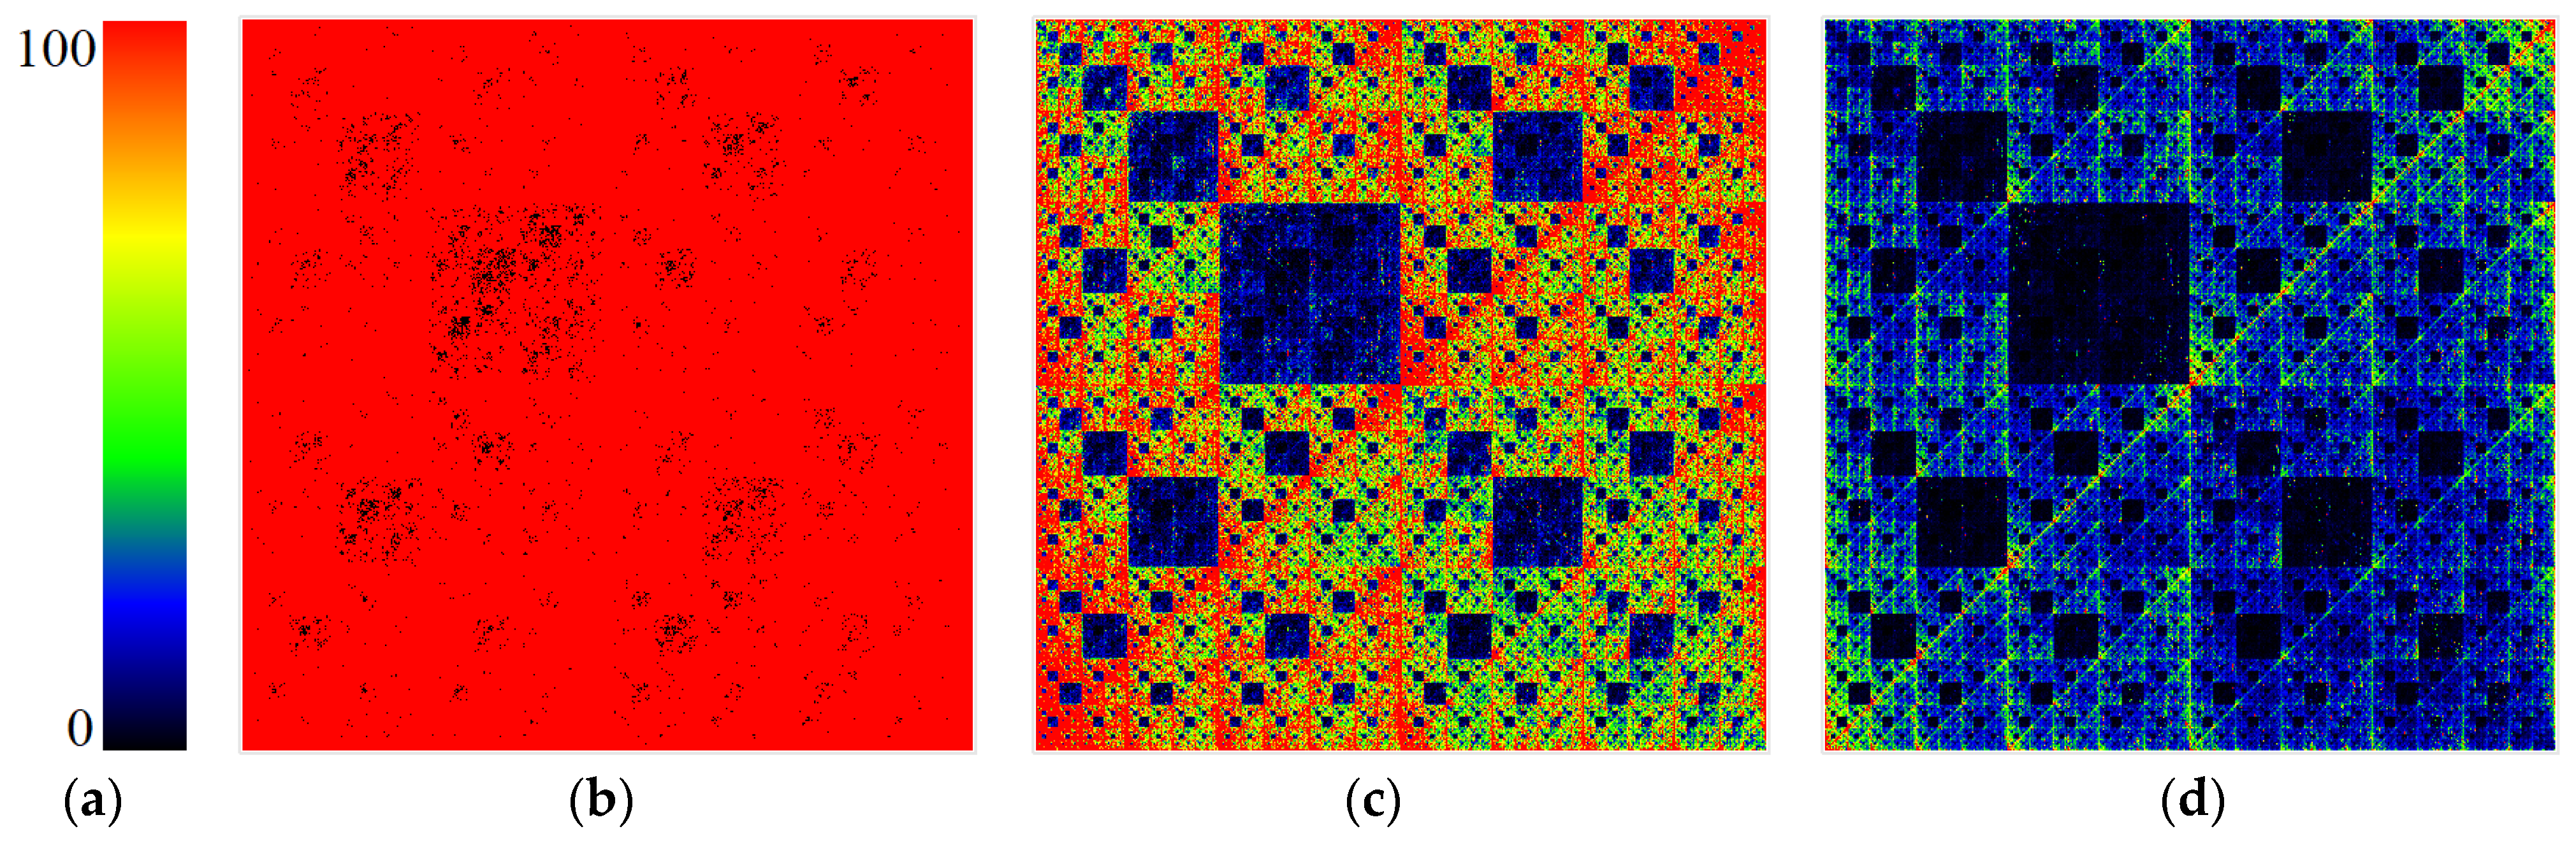
5. A Method of Chromatic Differentiation That Binds the Color to the Frequency of N-Plets
Considering the relevance of the frequency of occurrence of N-plets, we have developed an alternative method of chromatic differentiation (or genometric mapping coloring), a technique that allows each frequency to have its color. The frequency gradation and an example of visualization are shown in
Figure 12. Blue corresponds to low frequencies, and red corresponds to high frequencies. This visualization method appears to be more aesthetic and beautiful. Colors are selectable thanks to the color gradient bound to such objective physical and chemical parameters of DNA and RNA as the frequencies of particular molecule fragments.
From the point of view of biological applications, this topic can be potentially valuable for visualization and comparative visualization of genomes. Earlier in [
5,
6], we showed comparative genomic algorithms, in which we employed color tools to mark differences and similarities in different genes.
For a pictorial presentation, our team created an animation in which we demonstrated an example of integrated visualization with coloring in a similar manner. The scale, i.e., the length of N-plets, will change within each animation frame. Given the high resolution and high-information content, this animation is of particular scientific interest, as it displays the nucleotide sequence structure in dynamics when zoomed. The video illustrates a change in the parameter N in dynamics. For each frame, we calculated the frequency of points anew; each frame had its frequency range.
We find it rational to calculate the color for each point once and for all instead of performing repeated calculations. Considering the presence of symmetries in the arrangement of colors relative to the principal diagonal, the number of computations will significantly decrease. This fits into the concept of an analog of quantum computing, where instead of calculations, we read the addresses of the answers. Note that we can witness manifestations of this computational concept in many other phenomena and processes, described, like DNA, by symmetric square matrices.
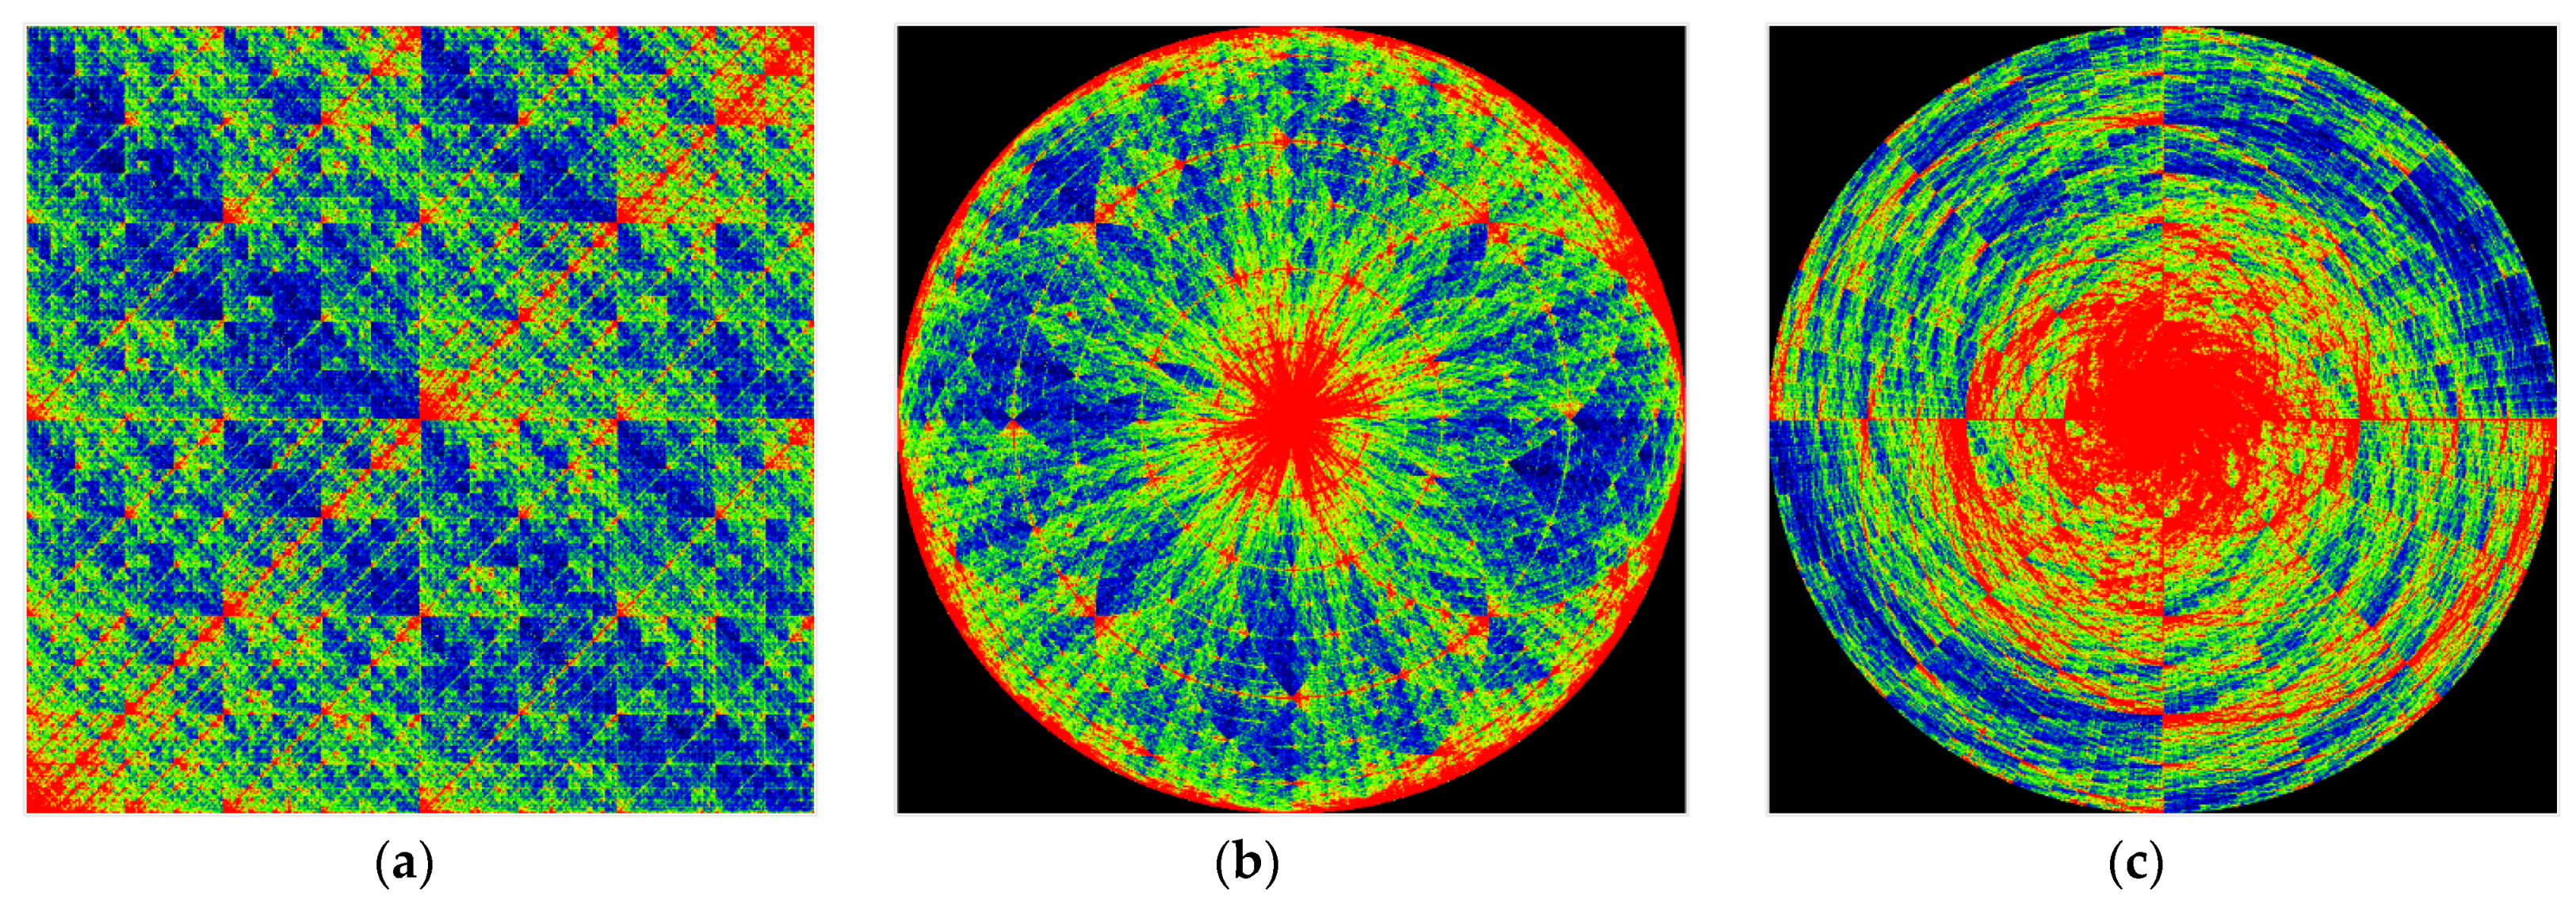
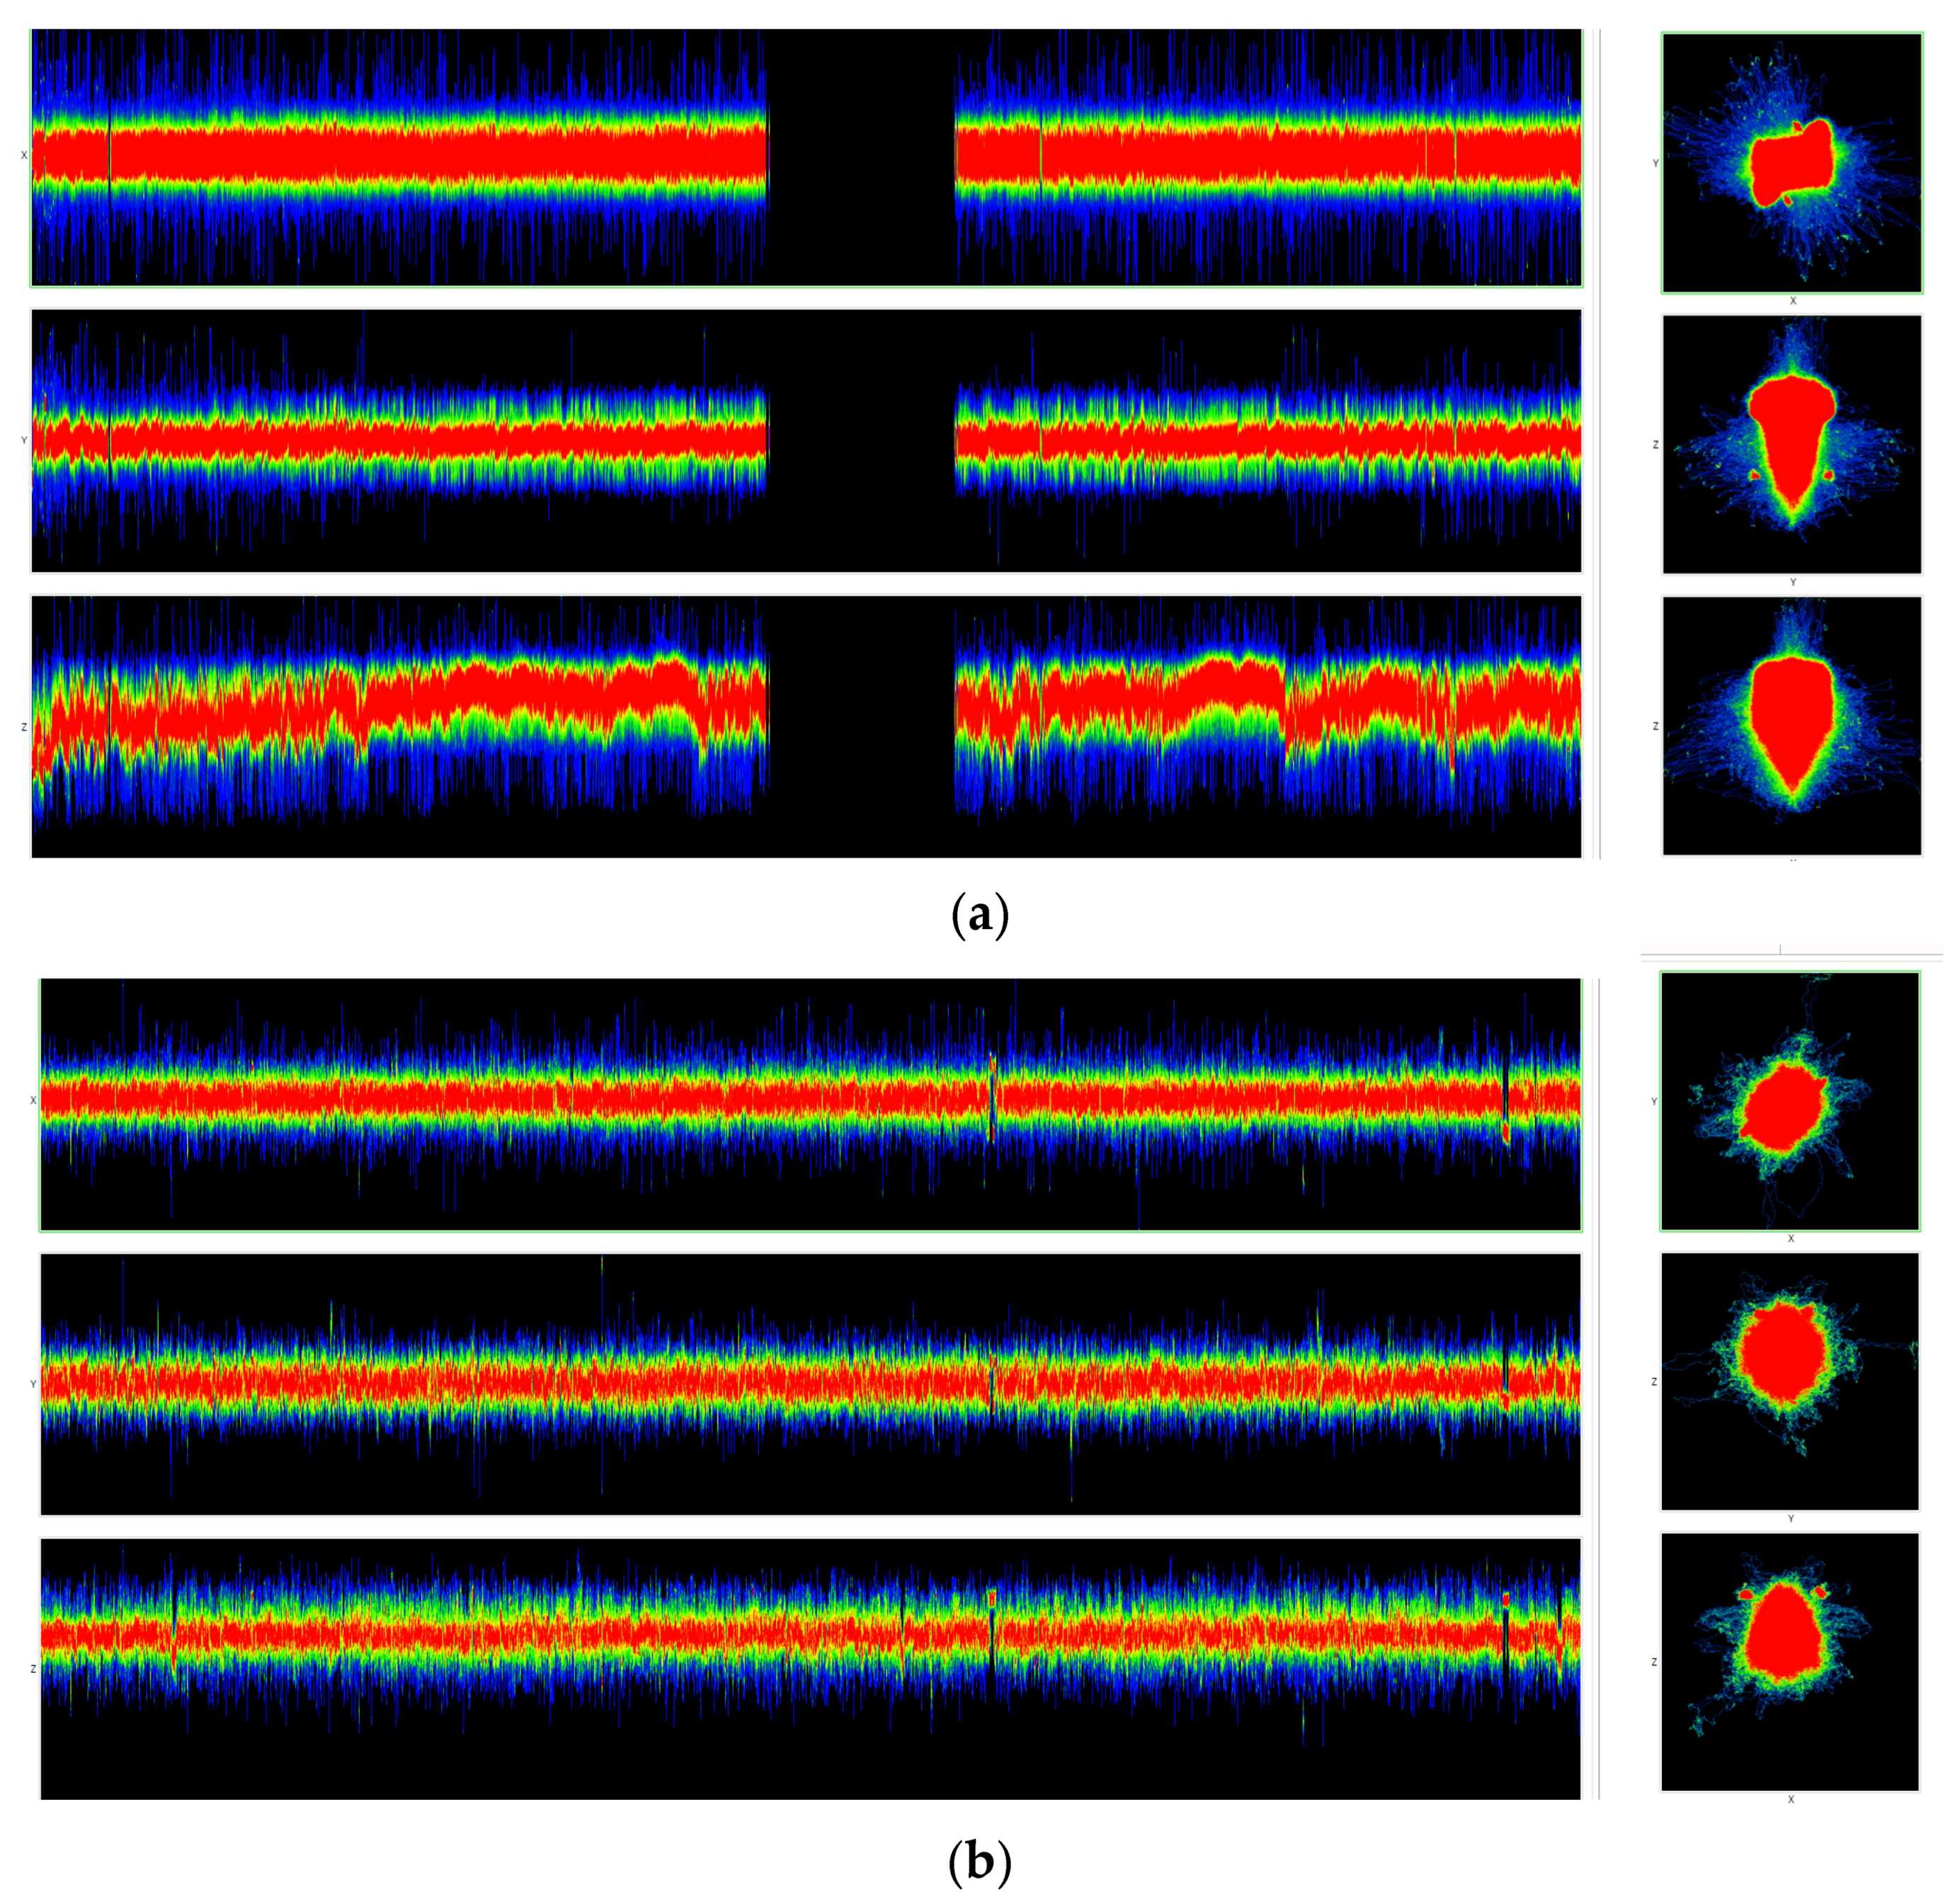
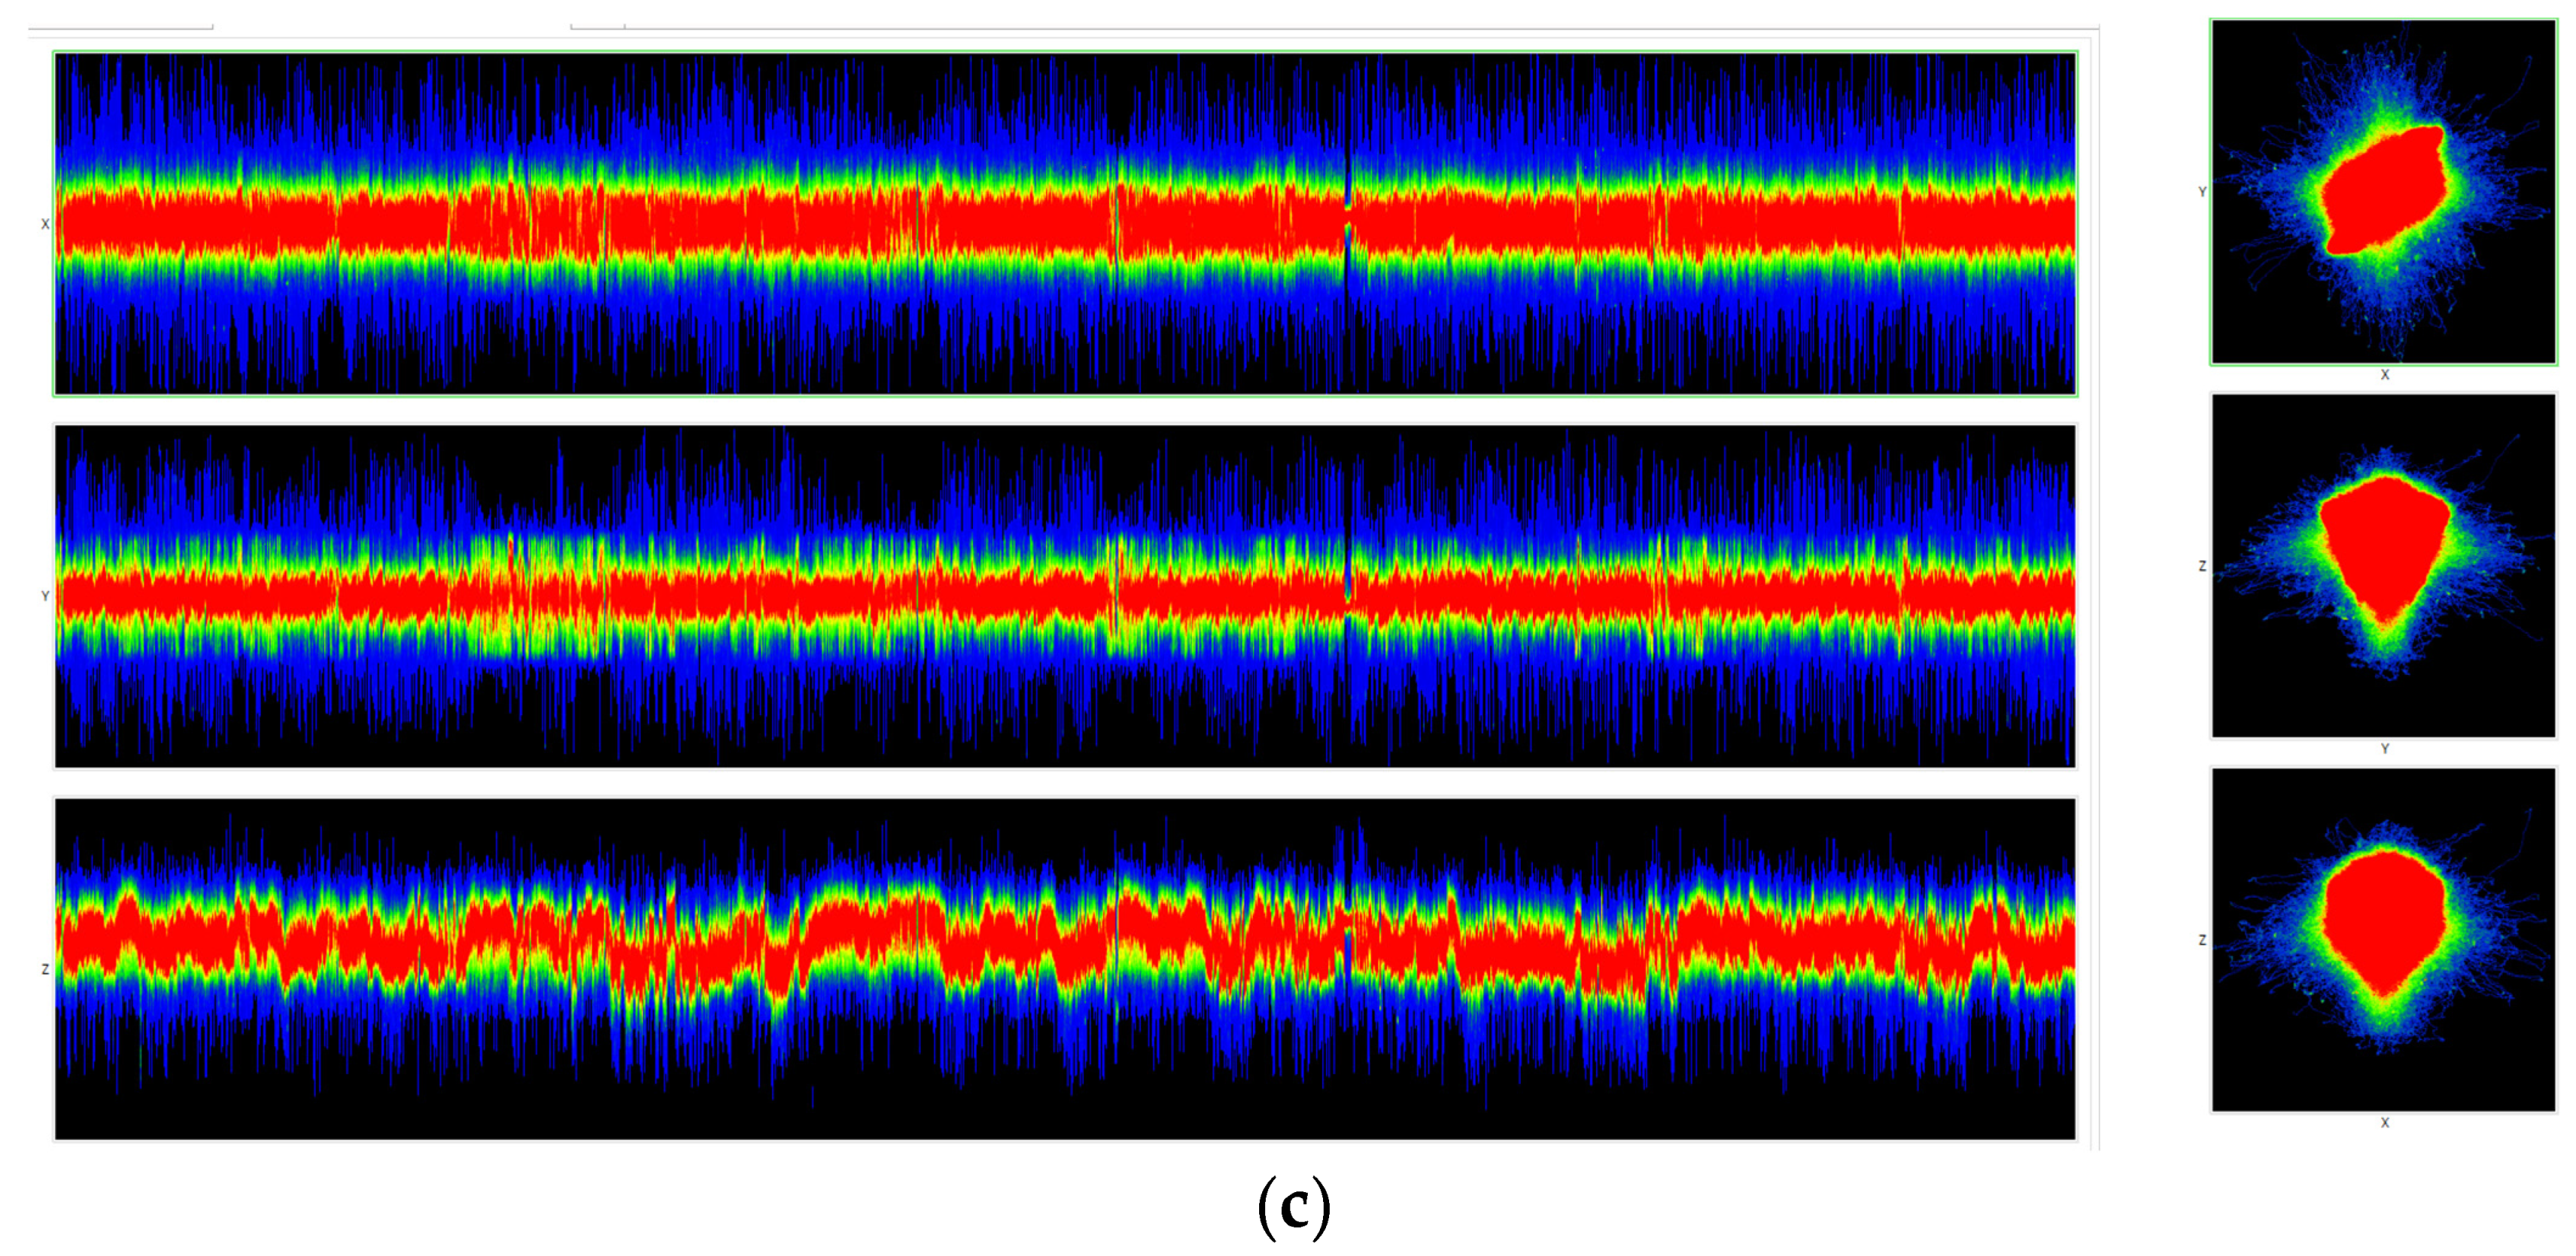
Identification of features of the genetic composition of nucleotide sequences allows for a visual comparison of the physicochemical parameters of DNA in various organisms. It is effective for comparative analysis of DNA, establishing relationships, visualization of genetic markers of predisposition to diseases, etc. Several approaches to DNA and RNA visualizations are equally possible based on structural, integral, and frequency mappings in parametric spaces of various dimensions.
Figure 13 and
Figure 14 show DNA chromatic differentiation images from different organisms in different types of imaging.
6. Conclusions
Functional representation of the molecular genetic composition of DNA in the form of visualization in a specific parametric space is an urgent scientific problem. The proposed methodology extends the previously developed visualization algorithms by coloring these representations. The presented methods help facilitate the perception of voluminous genetic data stored in DNA and RNA molecules. Earlier, we developed tools to analyze various DNA and RNA, including a comparative study of diverse viruses and their variants [
6]. The new algorithms rely upon the basis system of Hadamard-Walsh binary-orthogonal functions, enabling the mapping of nucleic acids according to levels corresponding to their physicochemical parameters. These algorithms additionally allow for the performance of spectral composition and decomposition [
7] with visualization and chromatic differentiation of their structural–parametric representations.
The results of the conducted research additionally allow us to speak about a new direction of scientific art, as everything created by nature is beautiful. New visualization algorithms allow for showing this beauty in high resolution. This area of computer art is associated with the concept of pentagram music we developed earlier [
29].
As a result of the research, meaningful and convenient or perceptual color displays were obtained, some of which are suitable for the visual presentation of genetic information. The other part is yet to be comprehended. Thus, we have considered various options for visualization with chromatic differentiation. These visualizations are rather vivid and representative sets that allow you to see the internal structure and beauty of the molecular genetic code within.
It is worth noting the enormous computational complexity of these methods, which, despite their great simplicity, remain very demanding on computational resources, even though they are highly parallelizable.
For all our measurements and studies, we used an in-house specialized computer program exploiting supercomputer technologies. Furthermore, we constructed great 3D animated models that enabled us to modify various visualization parameters dynamically and obtain fantastic animations. The results presented in this and our previous works allow us to speak about a particular nexus of biology and computer science, namely a theory of information processing and computer graphics.
The analysis and color visualization of colossal amounts of genetic information made it possible to construct structures resembling something alive but, at the same time, with traceable computer–metaphorical meanings. All the above allows us to look at the DNA and everything it controls within the cell as the most complex molecular machine, which, in principle, a living cell is.


