Article

Bio-Inspired Machine Learning Approach to Type 2 Diabetes Detection

1
Department of Computer Information Systems, King Abdullah II School of Information Technology, The University of Jordan, Amman 11942, Jordan
2
Department of Computer Science, King Abdullah II School of Information Technology, The University of Jordan, Amman 11942, Jordan
3
Department of Computer Science, King Hussein School of Computing Sciences, Princess Sumaya University for Technology, Amman 11941, Jordan
4
Abdul Aziz Al Ghurair School of Advanced Computing, Luminus Technical University College, Amman 11118, Jordan
5
Department of Artificial Intelligence, King Abdullah II School of Information Technology, The University of Jordan, Amman 11942, Jordan
*
Author to whom correspondence should be addressed.
Symmetry 2023, 15(3), 764; https://doi.org/10.3390/sym15030764
Submission received: 22 February 2023 / Revised: 11 March 2023 / Accepted: 18 March 2023 / Published: 20 March 2023
(This article belongs to the Special Issue Machine Learning and Data Analysis)

Abstract

:
Type 2 diabetes is a common life-changing disease that has been growing rapidly in recent years. According to the World Health Organization, approximately 90% of patients with diabetes worldwide have type 2 diabetes. Although there is no permanent cure for type 2 diabetes, this disease needs to be detected at an early stage to provide prognostic support to allied health professionals and develop an effective prevention plan. This can be accomplished by analyzing medical datasets using data mining and machine-learning techniques. Due to their efficiency, metaheuristic algorithms are now utilized in medical datasets for detecting chronic diseases, with better results than traditional methods. The main goal is to improve the performance of the existing approaches for the detection of type 2 diabetes. A bio-inspired metaheuristic algorithm called cuttlefish was used to select the essential features in the medical data preprocessing stage. The performance of the proposed approach was compared to that of a well-known bio-inspired metaheuristic feature selection algorithm called the genetic algorithm. The features selected from the cuttlefish and genetic algorithms were used with different classifiers. The implementation was applied to two datasets: the Pima Indian diabetes dataset and the hospital Frankfurt diabetes dataset; generally, these datasets are asymmetry, but some of the features in these datasets are close to symmetry. The results show that the cuttlefish algorithm has better accuracy rates, particularly when the number of instances in the dataset increases.

1. Introduction

Non-communicable chronic diseases are the leading cause of death in the world [1]. Non-communicable chronic diseases are a group of illnesses that do not transmit infections from one person to another because they do not involve viruses or bacteria. Such diseases occur slowly, and patients do not show any signs of illness. Non-communicable chronic diseases are closely related to lifestyles and healthy behavior, such as the type of food we eat, motor behavior (daily exercises), or bad habits such as smoking. Diabetes is one of the most common non-communicable chronic diseases in the world. According to the World Health Organization (WHO), most people with diabetes have type 2 diabetes (https://www.who.int/news-room/fact-sheets/detail/diabetes, accessed on 14 February 2023). This type of diabetes is primarily caused by excessive body weight and physical inactivity. Recent statistics from the International Diabetes Federation (IDF) showed that type 2 diabetes accounts for 90% of all diabetes cases (https://www.idf.org/aboutdiabetes/type-2-diabetes.html, accessed on 14 February 2023). The IDF reported that the current number of cases of diabetes will rise to approximately 700 million by 2045. This is concerning, especially considering the scary side effects of type 2 diabetes, such as malfunctioning and permanent damage to body organs. In the long run, type 2 diabetes may result in several critical conditions such as retinopathy (not life-threatening but sight-threatening), diabetic kidney disease, coma, destruction of pancreatic beta cells, joint failure, and many other conditions. Injection of adequate insulin is the best remedy option for treating type 2 diabetes. Although there is no long-term cure, type 2 diabetes can be controlled if detected at an early stage [2]. One way to predict type 2 diabetes is through the predictive modeling and analysis of medical datasets.
Researchers have used data mining and machine learning techniques to analyze medical datasets to determine the best ways to increase the accuracy and efficiency of type 2 diabetes prediction [3]. Data-mining methods are used to preprocess datasets to discover hidden patterns and select the most relevant dataset of features [4]. This will enable faster training of machine-learning algorithms for detecting type 2 diabetes [5]. However, analyzing medical datasets is not a trivial task, as medical datasets are often massive in dimension and have complex features, leading to data noise and dependency among features. Therefore, it is vital to remove irrelevant and redundant features before analyzing datasets to increase prediction accuracy and improve result comprehensibility. Feature selection is a complex process that requires artificial intelligence methods to solve it [6]. The success of the feature selection process depends on reducing the number of attributes and increasing accuracy rates. Several studies have been conducted on the detection of type 2 diabetes using ordinary feature selection algorithms (a recent review can be found in [7]).
However, limited research has focused on the use of bio-inspired metaheuristic feature selection algorithms to detect type 2 diabetes [8]. The efficiency of metaheuristic algorithms can be attributed to their ability to imitate the best natural features [9]. Among several bio-inspired metaheuristic feature selection algorithms, the genetic algorithm (GA) has proven to be one of the most effective evolutionary techniques for solving a wide range of global optimization problems [10]. To the best of our knowledge, the GA is the only metaheuristic algorithm used to diagnose type 2 diabetes. The work in [2] combined GA with a multiple objective evolutionary fuzzy classifier (MOEFC) to predict type 2 diabetes in the Pima Indian Diabetes dataset. While the GA has successfully handled feature selection in detecting type 2 diabetes with an accuracy rate of (83.0435%), however, our work aims to enhance the accuracy rates by utilizing a bio-inspired feature selection algorithm called the cuttlefish algorithm (CFA). The essential subset of features selected by the CFA was evaluated using six classifiers: K-nearest neighbor (KNN), support vector machine (SVM), naïve Bayes (NB), random forest (RF), decision tree (DT), and logistic regression (LR).
The implementation of the algorithms was applied to two datasets: the Pima Indian Diabetes (PID) dataset, which was extracted from the UCI repository, and the hospital Frankfurt Diabetes (HFD) dataset. PID and HFD datasets are two of the most widely used medical datasets for predicting type 2 diabetes [7]. The PID dataset contained information about 768 instances (i.e., patients), whereas the HFD dataset contains 2000 instances. Both datasets shared the same features (eight features), including insulin level, body mass index (BMI), and blood pressure; generally, these datasets are asymmetry, but some of the features in these datasets are close to symmetry. The evaluation results showed that the accuracy rates for the CFA were better than those of the GA, particularly when data instances were increased (using the HFD dataset, which has more instances than the PID dataset).
The main contributions of this research are as follows:
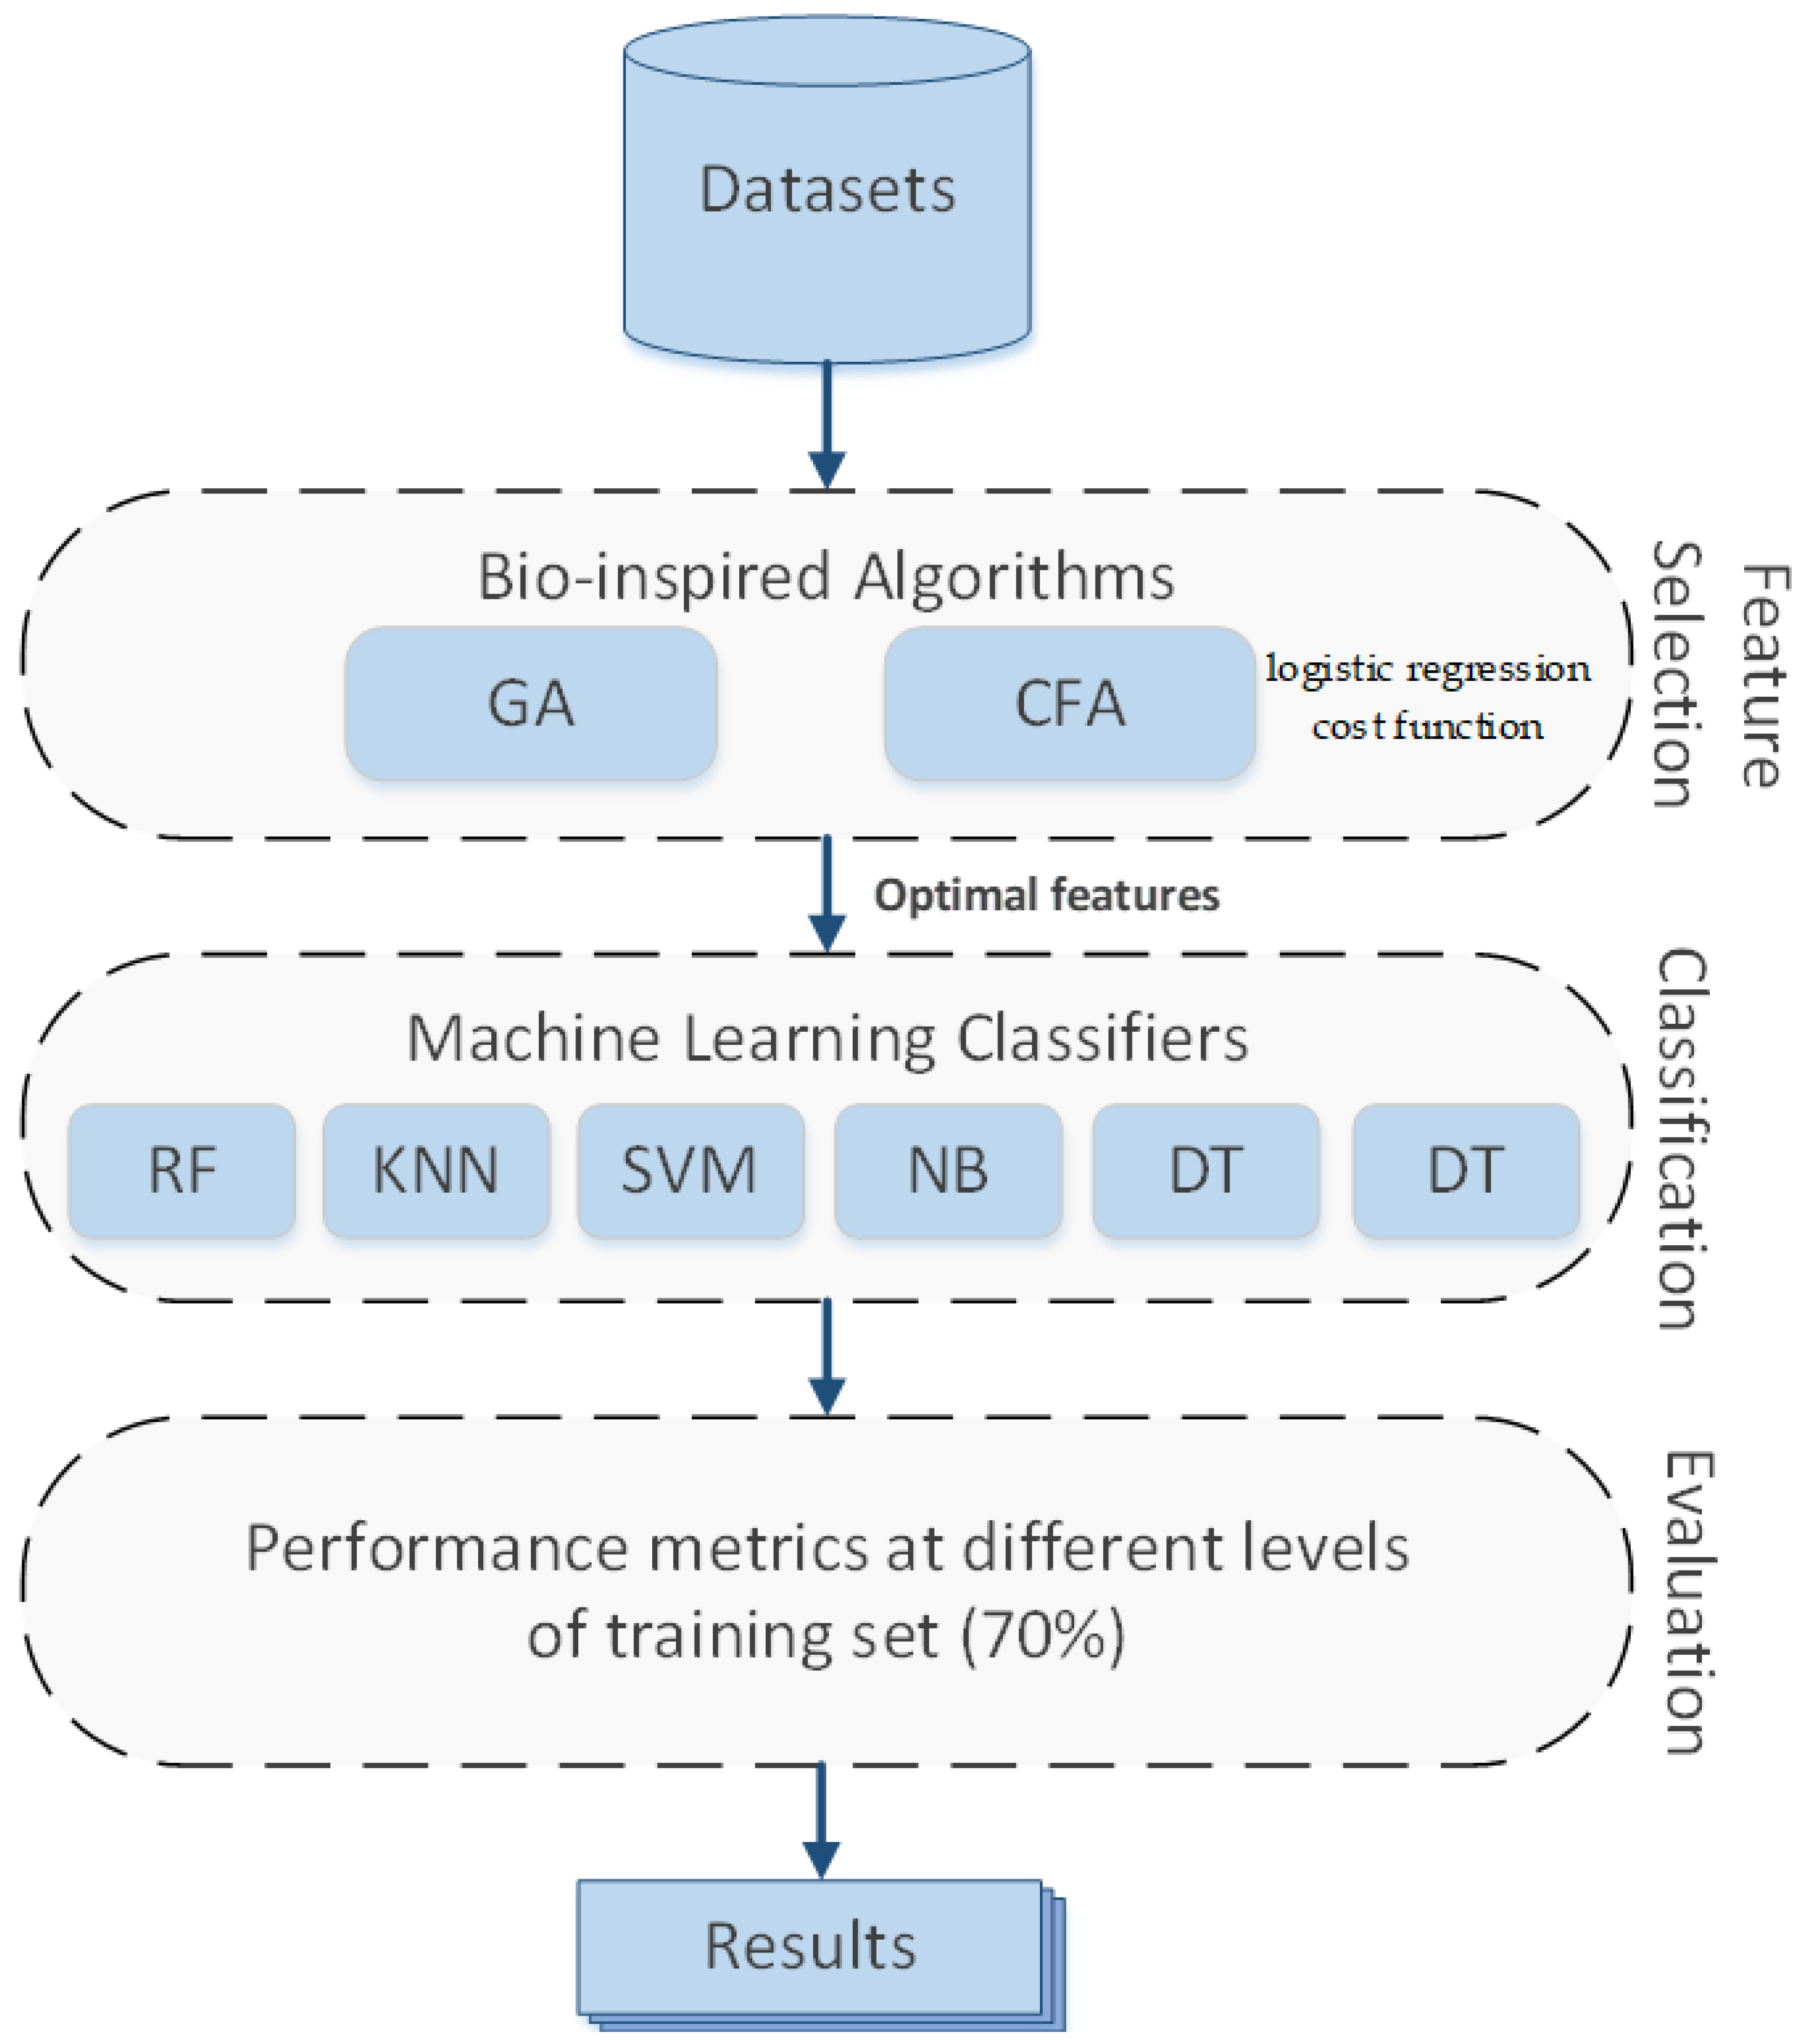
  • Apply the CFA and GA bio-inspired metaheuristic algorithms to the PID and HFD datasets for feature selection. Features in both datasets were reduced by applying a cost function for the logistic regression for the CFA.
  • Combine the CFA and GA bio-inspired metaheuristic algorithms with several classification algorithms to predict type 2 diabetes.
  • Analyze the performance of the CFA and GA over two datasets: PID and HFD.
The remainder of this paper is organized as follows. Section 2 discusses related work. Section 3 presents preliminaries. The proposed approach is presented in Section 4. Section 5 describes the results, and Section 6 concludes the paper.

2. Related Works

In this section, relevant related work to feature selection and classification algorithms that were applied to detecting diabetes and other medical applications contexts such as Parkinson’s and cancer are highlighted.
Several feature selection algorithms have been applied to detect type 2 diabetes. The study in [2] proposed a feature selection approach that applied the GA to the PID dataset. The four best features in the PID dataset were identified. Several classification approaches have been used, including naïve Bayes (NB), decision tree (DT), and MOEFC. The results showed that the MOEFC provided the highest accuracy rate of (83.04%). A feature selection approach using ranker and wrapper algorithms was applied in [11] to two datasets: the PID dataset and the Diabetes 130-US hospital dataset. The authors used a support vector machine (SVM) classification algorithm and applied a 10-fold cross-validation. The results showed that the ranker algorithm had the highest accuracy of (72.49%), whereas the wrapper algorithm had lower accuracy of (71.11%). Machine learning classification algorithms were applied in [12] to predict type 2 diabetes. The algorithms included logistic, K-nearest neighbor (KNN), SVM, NB, DT, and random forest (RF). The results indicated that RF provided the highest accuracy of (77.4%). The work in [13] used F-score feature selection to identify valuable features. A fuzzy SVM was used to train the dataset and generate fuzzy rules, and accuracy rates reached (89.02%). The study in [14] used RF, DT, and NB classification algorithms to identify significant features for predicting diabetes. The results showed that NB had the highest accuracy of (82.30%). The authors of [15] compared three machine learning algorithms, namely LR, NB, and DT, and applied them to a diabetic dataset to predict diabetes. The results show that the three algorithms yielded the same accuracy of (76.60%). The work in [16] used fusion classifiers based on belief functions together with traditional machine learning classifiers to detect diabetes, where accuracy results reached (98.00%) when the long short-term memory and gated recurrent unit methods were combined.
Feature selection algorithms have also been applied in other medical domain applications, such as diagnosing Parkinson’s and cancer. For example, the CFA was used to diagnose Parkinson’s at an early stage [17]. This approach had an accuracy rate of (94.00%) with KNN. The work in [18] proposed an enhanced moth-flame optimization (MFO) feature selection algorithm. The approach was applied to 23 medical datasets of different contexts taken from the UCI and Kaggle repositories, and the results showed that the proposed approach outperformed other methods across (83%) of the datasets. An approach for encoding gene data based on unsupervised deep learning clustering with GA was proposed in [19]. Three classifiers were used: support vector machine (SVM), KNN, and RF. This approach was applied to six cancer datasets. Accuracy results ranged between 66.00% for the RF and 99.00% for the SVM. A hybrid deep learning model based on a Laplacian core-convolutional neural network was proposed in [20] for the gene selection and classification of cancer data. Ten datasets were used to test the performance. The results show that the proposed model outperforms other algorithms.
Another application of feature selection algorithms is the work in [21], where the authors used a GA based on hierarchical feature selection to optimize handwritten word images. The proposed method was applied to 12 K words, and the results showed that word recognition was enhanced by 1.28% compared with the recognition obtained with the unreduced feature set.
Bio-inspired metaheuristic algorithms have become powerful optimization tools for complex problems [22]. Among the several purposes of bio-inspired algorithms, we focused on the feature-selection problem. Previous studies have shown that metaheuristic bio-inspired algorithms are more efficient than ordinary feature selection algorithms [23]. However, research on the utilization of bio-inspired algorithms to detect type 2 diabetes is limited. To the best of our knowledge, the GA is the only natural bio-inspired metaheuristic algorithm that has been utilized for diagnosing type 2 diabetes [7]. In this work, we utilized another bio-inspired metaheuristic algorithm called CFA as a search strategy to ascertain the optimal subset of features for diagnosing type 2 diabetes. The obtained features from CFA were classified using several classification algorithms. The proposed approach was applied to two datasets of different sizes: the PID and HFD datasets.

3. Preliminaries

This section describes two bio-inspired algorithms for diagnosing type 2 diabetes: the cuttlefish algorithm and the genetic algorithm.

3.1. Cuttlefish Algorithm

The cuttlefish algorithm (CFA) was proposed in [24] as a bio-inspired optimization algorithm that mimics the color-changing behavior of a marine animal called cuttlefish. Compared to other bio-inspired metaheuristic algorithms, such as the GA and bees algorithm, the CFA algorithm has shown its effectiveness in solving optimization problems [25]. Reflection and visibility are two important processes responsible for changing cuttlefish color. In the reflection process, the CFA simulates the light-reflection mechanism using chromatophores, iridophores, and leucophore skin layers, and the visibility process simulated the visibility of the matching patterns of the cuttlefish. Figure 1a,b show examples of how the CFA layers are stacked and combined together to change reflective color. Overall, six cases were included in the CFA, as shown in Figure 2.
Cases 1 and 2 (reflected color or light) were produced by interacting cells of chromatophores and iridophore skin layers, respectively. The muscles of the chromatophore cells are stretched or shrank, and iridophore cells (light-reflecting cells) reflect the light that comes from the chromatophore cells, causing them to penetrate. In cases 3 and 4, the iridophore cells reflected light (with a specific color) from the outside environment. In case 5, the light passes through the chromatophore cells with a specific color, and the color of the reflected light is very similar to that of the incoming light. The incoming color is assumed to be the best solution (Best), and the reflected color represents any value around the best solution. In Case 6, the leucophore cells reflected the incoming light. These cells reflect mirrors of the predominant wavelength of light in the environment, reflecting white color (white light) and brown color (brown color). Accordingly, cuttlefish blends itself based on the surrounding environment. This case works as an initialization and is used to find new solutions.
Algorithm 1 describes the steps of the CFA. The CFA starts with random solutions to initialize the population. Then, the six cases shown in Figure 2 are applied until a stop condition is met (the stop condition is the number of maximum iterations). The main steps of the CFA algorithm are summarized as follows. The algorithm takes the maximum number of iterations and four random values as the input and identifies the best four features as the output (lines 1 and 2). The algorithm in line 3 initializes the population and the number of features to be selected. The algorithm then evaluates the population using a fitness function (Line 4) and stores the best solution (Line 5). The population was divided into four independent groups (Line 6). The first two groups (G1 and G2) were used for the global search, whereas the other two groups (G3 and G4) were used for the local search. The combination of visibility and reflection processes provides six different cases and a new possible solution using Equation (1).
n e w _ p o p u l a t i o n = r e f + v i s
Algorithm 1 The cuttlefish algorithm
1Input: Max Iteration, v1, v2, r1, r2, Upper, Lower
2Output: Find the best 4 features
3Initialize the number of populations with dimensions
4Evaluate the fitness of the population
5Store the best solution
6Divide cells into four groups G1, G2, G3, and G4
7while I <= Max iteration do
8  Calculate average of best solution, and store in best
9 for each cell in G1 do             //Cases 1&2
10     Generate new solution using (1), (2), and (3)
11     Ref = rand(r1, r2) × G1[i].Points[j]
12      Vis = rand(v1, v2)×(Best.Point[j])–G1[i].Points[j]
13      Calculate fitness for new solution
14      if (fitness > best subset) then current = new Sol
15     end if
16  end for
17 for each cell in G2 do               //Cases 3&4
18     Generate new solution using (1) and (3)
19     Ref = Best.Point[j]
20     Vis = rand(v1,v2)×(Best.Points[j]– G2[i].Points[j])
21     Calculate the fitness for the new solution
22     if (fitness > best subset) then current = new sol
23      end if
24  end for
25 for each cell in G3 do               //Case 5
26     Generate new solution using (1) and (7)
27     Ref = Best.Point[j]
28     Vis = rand(v1, v2) × (Best.Points[j] − AVbest)
29     Calculate the fitness for the new_sol
30     if (fitness > best subset) then current = new_sol
31      end if
32  end for
33 for each cell in G4 do               //Case 6
34     Generate random solution using (1)
35     P[i].points[j] = rand ×(Upper − Lower) + Lower
36     Calculate the fitness for the new_sol
37     if (fitness > best subset) then current = new_sol
38     end if
39  end for
40I = I + 1;
41end while
The interaction operator between chromatophores (i.e., stretch and shrink processes) and iridophore cells in cases 1 and 2 ( G 1 : lines 9–16) use reflection and the visibility of the pattern to produce a new solution in equation (2), where G 1 is a group of cells with i and P o i n t s j represent the i th cell and j t h point of the i t h cell in G 1 , respectively. Then, Equation (3) formulates the visibility of the matching background, where Best.Points represent the best solution points, R is a parameter used to determine the stretch or shrink interval of the saccule, and V is the visibility degree of the pattern.
r e f j = R × G 1 i . P o i n t s [ j ]
v i s = V × B e s t . P o i n t s j G 1 i . P o i n t s j
Equations (4) and (5) are used to determine the values of both R and V , respectively ( r 1 and r 2 are constants).
R = r a n d ( ) × r 1 r 2 + r 2
V = r a n d ( ) × v 1 v 2 + v 2
In cases 3 and 4 (Lines 17–24), a new solution is calculated based on the reflected light from the best solution and the matching pattern visibility (i.e., local search). Equation (6) (R = 1) produces an interval around the best solution as a new search area.
r e f [ j ] = R × B e s t . P o i n t s [ j ]
Similar to (6), the algorithm in Equation (7) uses leucophore cells to provide a new solution by reflecting light from the area around the best solution and visibility of the pattern (case 5, lines 25–32), where AVbest is the average value of the Best.Points. A random solution was produced using the leucophore cell operator in case 6 ( G 4 , Lines 33–39).
v i s j = V × ( B e s t . P o i n t s j A V b e s t )

3.2. Genetic Algorithm

The genetic algorithm (GA) was proposed by John Holland in the 1970s as an important search technique for finding the best option for a set of available solutions [26]. GA was applied to the PID dataset to reduce the number of features using the fitness function (8) [2]. The algorithm initializes the population in the dataset and performs the selection, crossover, mutation, and termination operators. The selection process was based on survival of the fittest. The experiment in [26] was simulated using a multi-object fuzzy classifier.
f x = f i t n e s s   o f   a n   i n d i v i d u a l   f i s u m   o f   f i t n e s s   o f   a l l   i n d i v i d u a l   f ( I )

4. Methodology

4.1. Approach

Figure 3 illustrates the main steps of the proposed approach followed in this research. This approach comprises three phases. In the first phase, two bio-inspired algorithms were applied to select the optimal features, where a cost function for logistic regression was used in CFA. In the second phase, six machine learning classifiers were applied for training. Finally, the performance metrics were used to validate the algorithms.

4.2. Datasets

Two datasets were used to evaluate the proposed feature-selection algorithm: the Pima Indian Diabetes (PID) (https://www.kaggle.com/uciml/pima-indians-diabetes-database (accessed on 14 February 2023)) and Hospital Frankfurt Diabetes (HFD) (https://www.kaggle.com/datasets/johndasilva/diabetes (accessed on 14 February 2023)). Both datasets are publicly available and are commonly used to predict type 2 diabetes [27,28]. The PID dataset was collected from the UCI machine learning repository, which originated from the National Institute of Diabetes and Digestive and Kidney Diseases (sNIDDK) and was used to predict whether a patient had diabetes. The PID dataset contains information on 768 females and eight features. The HFD dataset was obtained from Hospital Frankfurt, Germany. The HFD dataset contained 2000 instances and eight features. Both datasets share the same features (Table 1); generally, these datasets are asymmetry, but some of the features in these datasets are close to symmetry.

4.3. Feature Selection

An abundant increase in medical data involves the incorporation of various attributes and features. Most attributes do not contribute to the results of predictive applications, leading to an increased computation time and resources. Hence, the selection of a subset of features is required to achieve high accuracy rates. In this research, CFA and GA were implemented on PID and HFD datasets to select the best subset of features. Features in the datasets were reduced by applying the cost function for the logistic regression for CFA in equation (9) and the correlation-based feature selection for GA (8) [17], where m is the number of examples, h is the hypothesis function, and Y is the output value. For the PID and HFD, the FCA and GA were applied to the training set (70% of the entire dataset). Table 2 lists the subset of features selected from the CFA and GA.
F i t ( Y ) = 1 × 1 m × ( log h × Y + log 1 h × 1 Y )

4.4. Classification

Because we successfully identified the most appropriate features in the PID and HFD datasets and cleaned up all potentially noisy data based on the feature selection process in the previous step, the next step is to start the classification process, where the set of features is trained using different classifiers. We experimented with different parameters in the CFA and GA, such as the number of iterations (repetition of a process to generate an outcome) and population (populations are created randomly to find the best population size depending on the problem). We tested 10 to 70 iterations and 10 to 100 populations.

4.5. Evaluation

In order to evaluate the CFA and GA algorithms, three performance metrics were used: kappa statistics and mean absolute error. Accuracy is a measure of statistical bias that represents the proportion of the success rate of a given test, where low accuracy values indicate a difference between the result set and true values. Accuracy (10) uses four test measures, as shown in the confusion matrix for classification in Table 3, which represents the classification of the possible result of a recommendation of an item to a user.
A c c u r a c y = T P + T N T P + T N + F P + F N
The kappa statistic (K) is a metric used to examine classifiers by comparing observed and expected accuracy [29]. According to [30], it is advantageous to use the kappa coefficient to compare the accuracy of the classification algorithms. Values of kappa statistics vary between 0 (agreement equivalent) and 1 (perfect agreement). Equation (11) represents the metric for K, where p a is the proportion of trials agreed by judges and p c is the proportion of trials in which agreement would be expected by chance. Interpretation of the strength of agreement [31] is listed in Table 4.
K = p a p c 1 p c
Mean absolute error (MAE) was used to test the mean absolute values of the individual prediction errors for all instances in the test set. Equation (12) presents the MAE metric, where yi represents the predicted value, xi represents the true value, and n is the number of instances.
A E = i = 1 n y i x i n

5. Results and Discussion

The CFA was evaluated against the GA using two datasets, PID and HFD. To the best of our knowledge, the GA is the only metaheuristic algorithm used to detect type 2 diabetes. Both the CFA and GA algorithms were evaluated using six classifiers: K-NN, RF, DT, LR, SVM, and NB. The algorithms were trained using the same methodology to ensure the fairness of the results. The classifiers were available in the scikit-learn library in Python (Python provides built-in libraries that are used to implement feature selection algorithms). The implementation of the CFA uses several input parameters (line 1 in Algorithm I). Table 5 lists the input parameters used in the implementation. Values of the parameters were identified through experimentation.
Table 6 presents the average accuracy of 30 runs for the CFA on the PID and HFD datasets using the logistic classifier. Both datasets (PID and HFD) were divided into 70% for training and 30% for testing. The algorithms were examined using different numbers of iterations (10 to 70) and different populations (10 to 100). The experimental results showed that the CFA and GA provided better accuracy results with 50 iterations and 100 populations because the operations in the GA depend on the possibility of selecting the best features, whereas the operations in the CFA depend on using its equation. Accordingly, all reported results were based on 50 iterations and 100 populations.
Table 7 and Table 8 present the evaluation results for CFA and GA on the PID and HFD datasets, respectively, in terms of accuracy, kappa, and MAE. As for accuracy results, it is clear from the results that CFA had better results than GA on the HFD dataset, and the highest accuracy values were achieved with the RF classifier (maximum accuracy = 0.97). However, this was not the case with the PID dataset. The accuracy results for the CFA and GA on the PID varied for the different classifiers. The results showed that CFA provided better accuracy results with the LR, SVM, and NB classifiers. This shows that the CFA works well with larger datasets, particularly with the RF and DT classifiers. This is because DT is a series of sequential decisions made to reach a specific result regarding the importance of features, and the sequence of attributes to be checked is decided based on criteria such as the Gini Impurity Index or information gain. RF leverages the power of multiple decision trees to make decisions (i.e., a forest of trees).
As a more conservative measure than accuracy, kappa results were measured and observed for the CFA and GA. The results showed that the CFA, in general, provided better performance than the GA, especially with the HFD dataset, because the HFD dataset has a large number of instances, and the classifier is trained using many instances. All classifiers provided better results, except the RF, which provided only (0.01) less than the GA. The performance of the classification algorithms using kappa varied in the PID, with all values being less than 0.50. This shows that the kappa coefficient aligns well with the accuracy results, particularly for larger datasets. Furthermore, classification algorithms should possess reduced MAE rates to prove that they have a better performance. The MAE results showed that the proposed CFA outperformed the GA in all cases on the PID and HFD datasets because the CFA selected better features than the GA. This suggests the application of the MAE as a performance metric for evaluating classification algorithms on datasets of various sizes. 
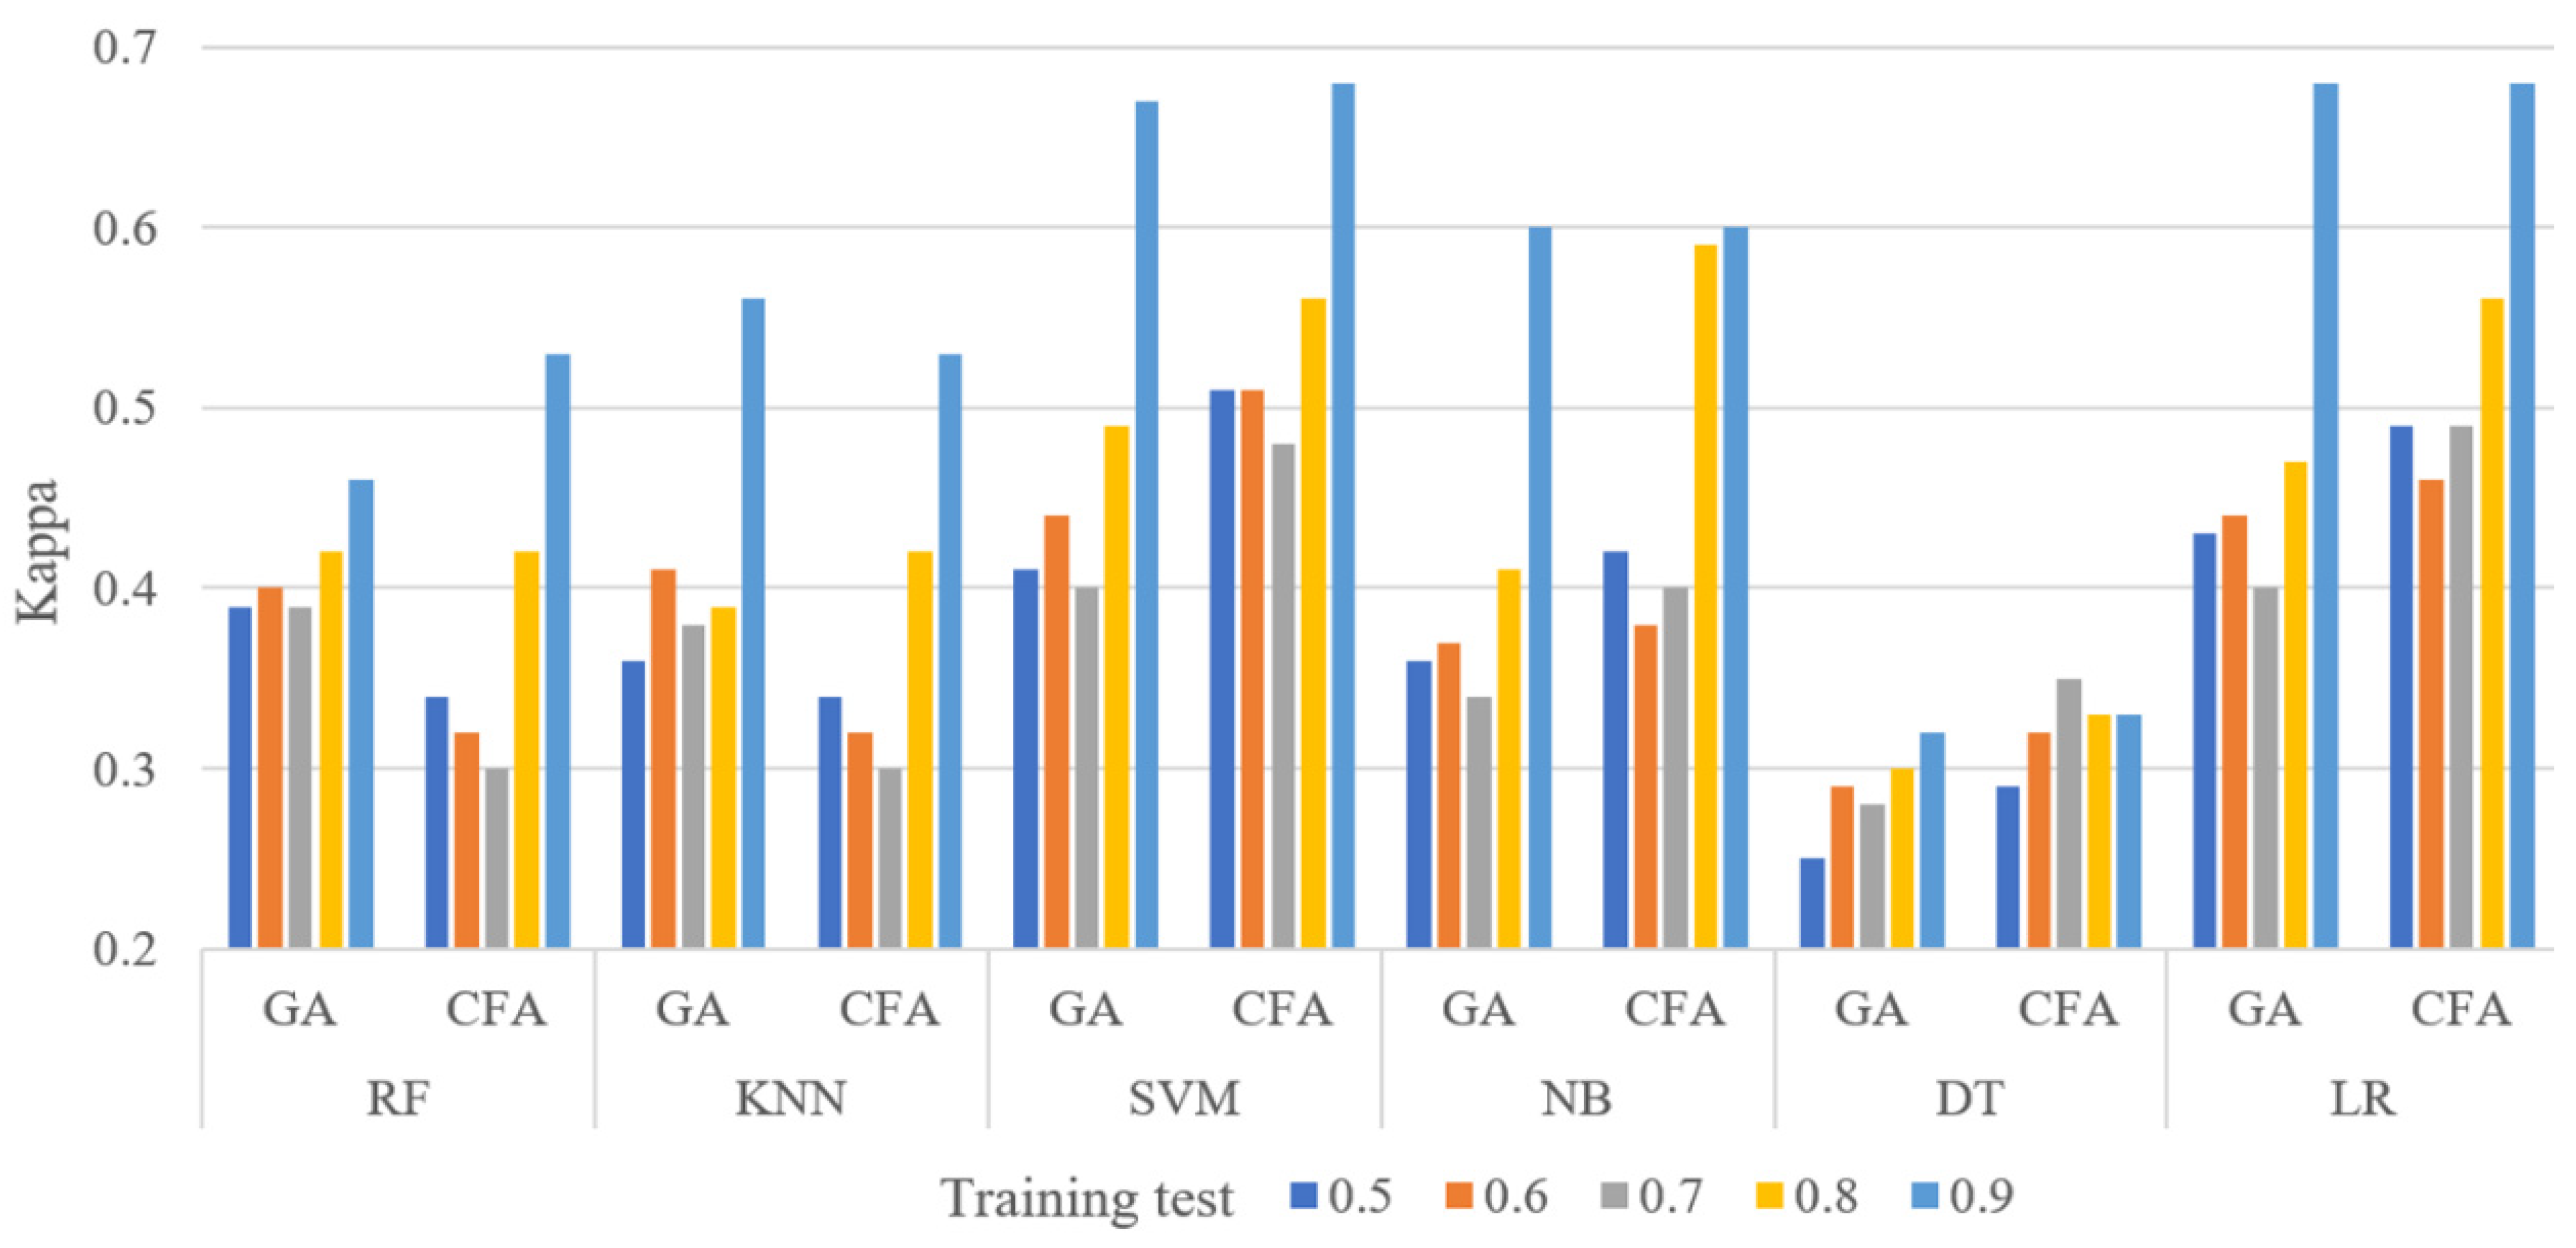
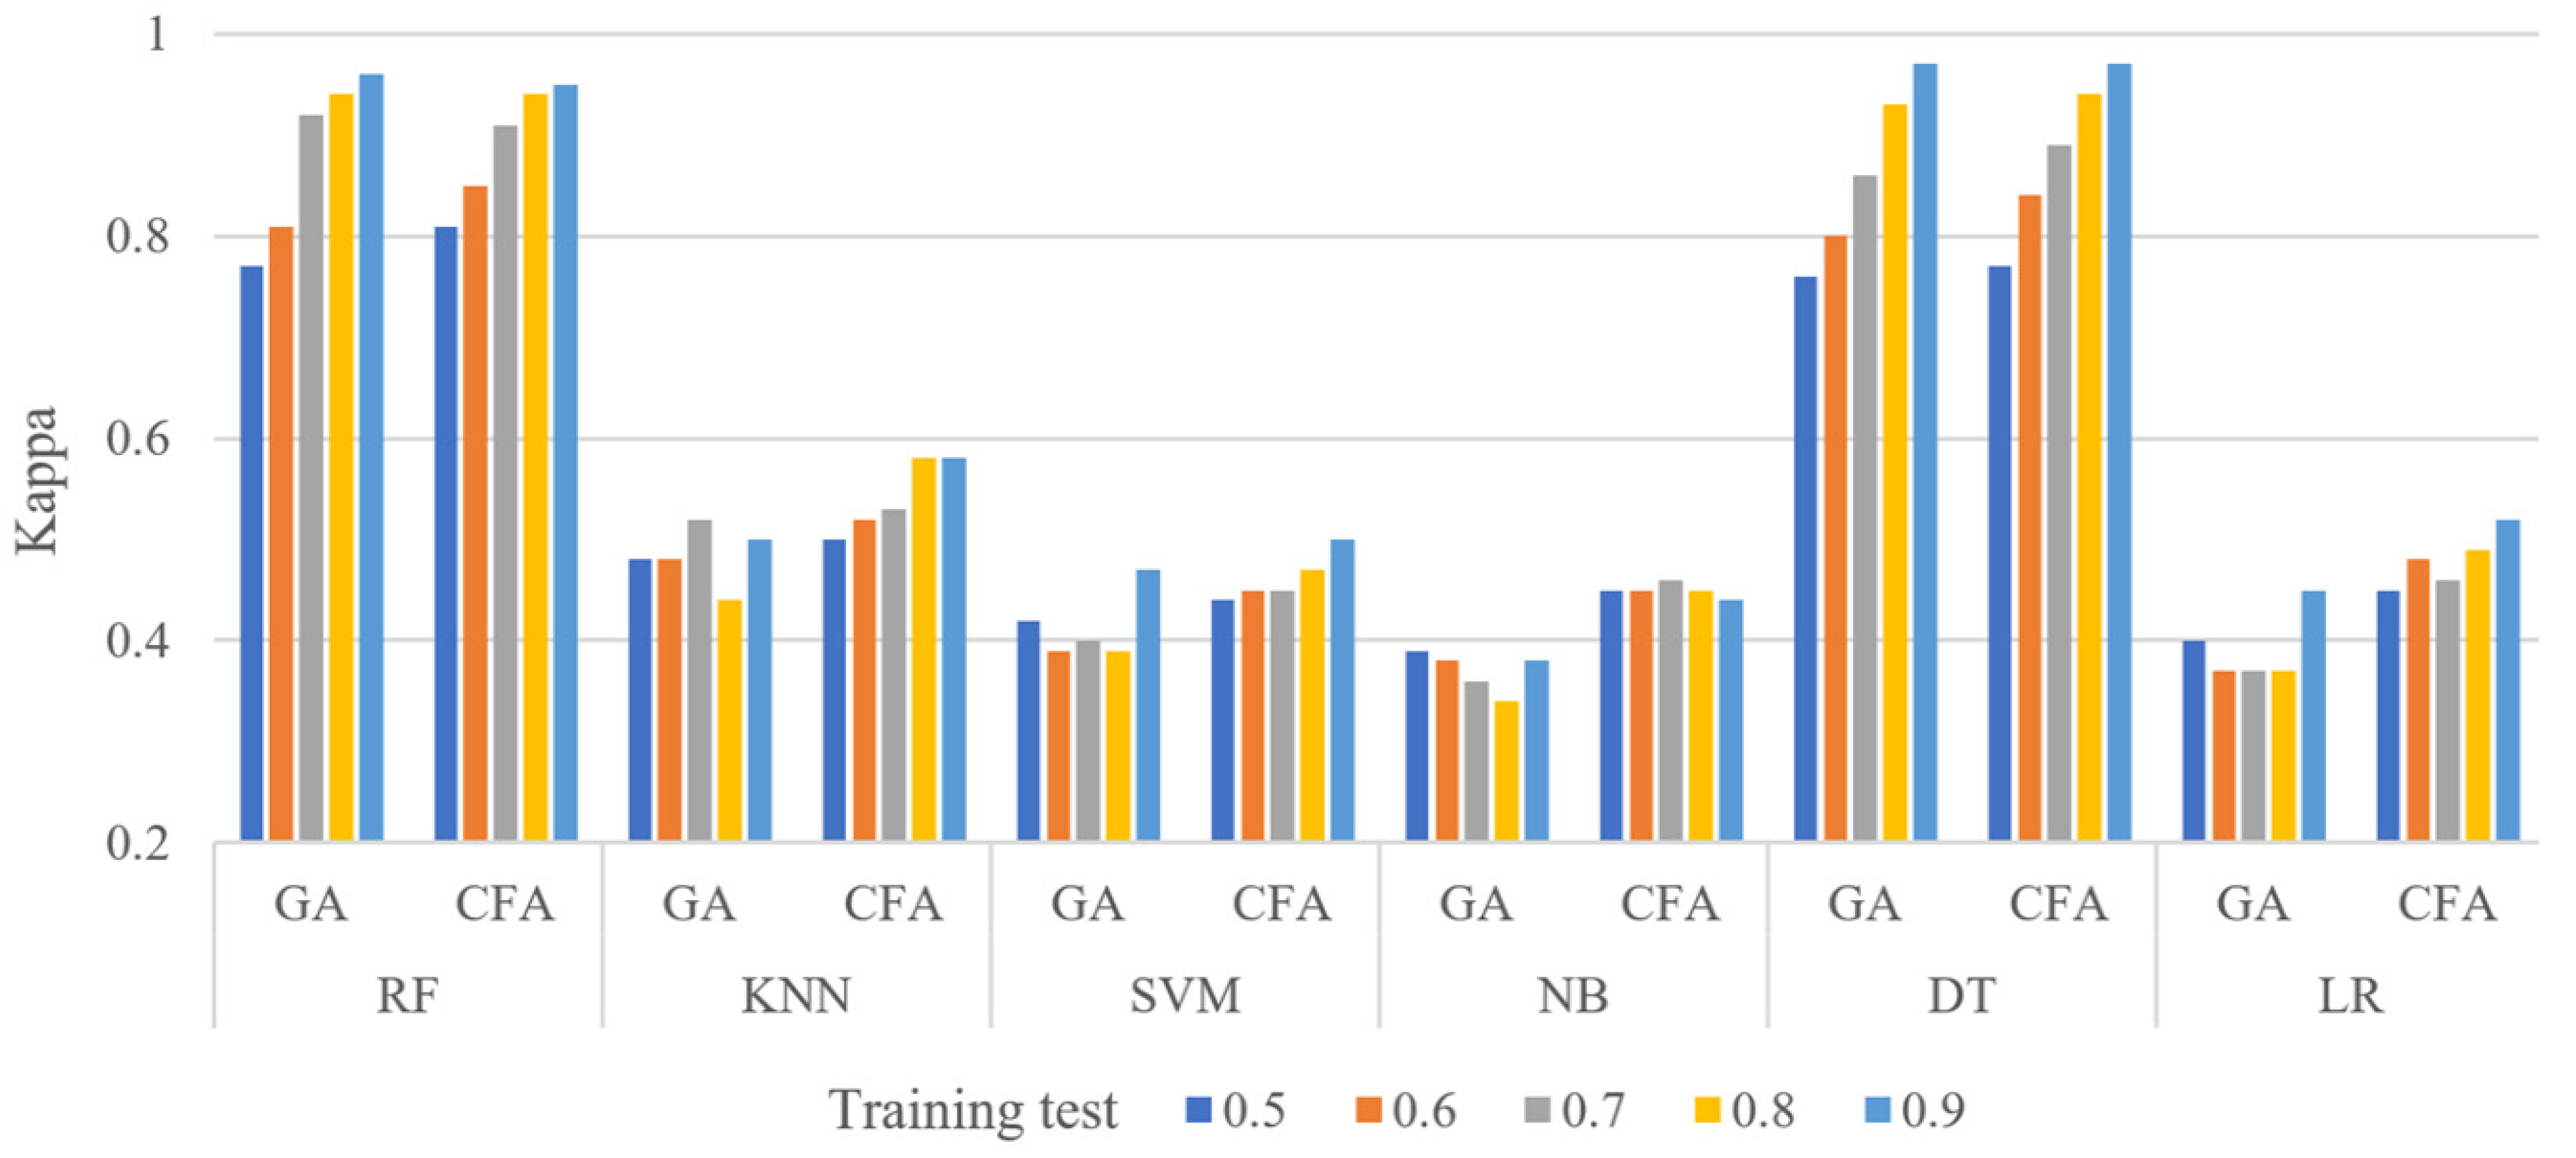
Figure 4 shows the kappa results of the six classifiers for the PID dataset at different training set levels (0.5 to 0.9). The features selected by the CFA in Figure 4 provided better results than the GA when the LR, SVM, and NB classifiers were used because these classifiers are based on linear probability theory and statistics.
Figure 5 shows the kappa results of the six classifiers for the HFD dataset at different training set levels (0.5 to 0.9). As shown in Figure 5, the CFA provided better results than the GA on the HFD, particularly with RF and DT, because these classifiers depend on ensemble learning algorithms. This suggests the need to use the RF and DT classifiers with larger datasets. This shows that the performance of the classifiers varied across datasets of different sizes. RF and DT outperformed the other classifiers when applied to a larger dataset (HFD), whereas LR, SVM, and NB provided better results for the CFA when applied to the PID dataset.
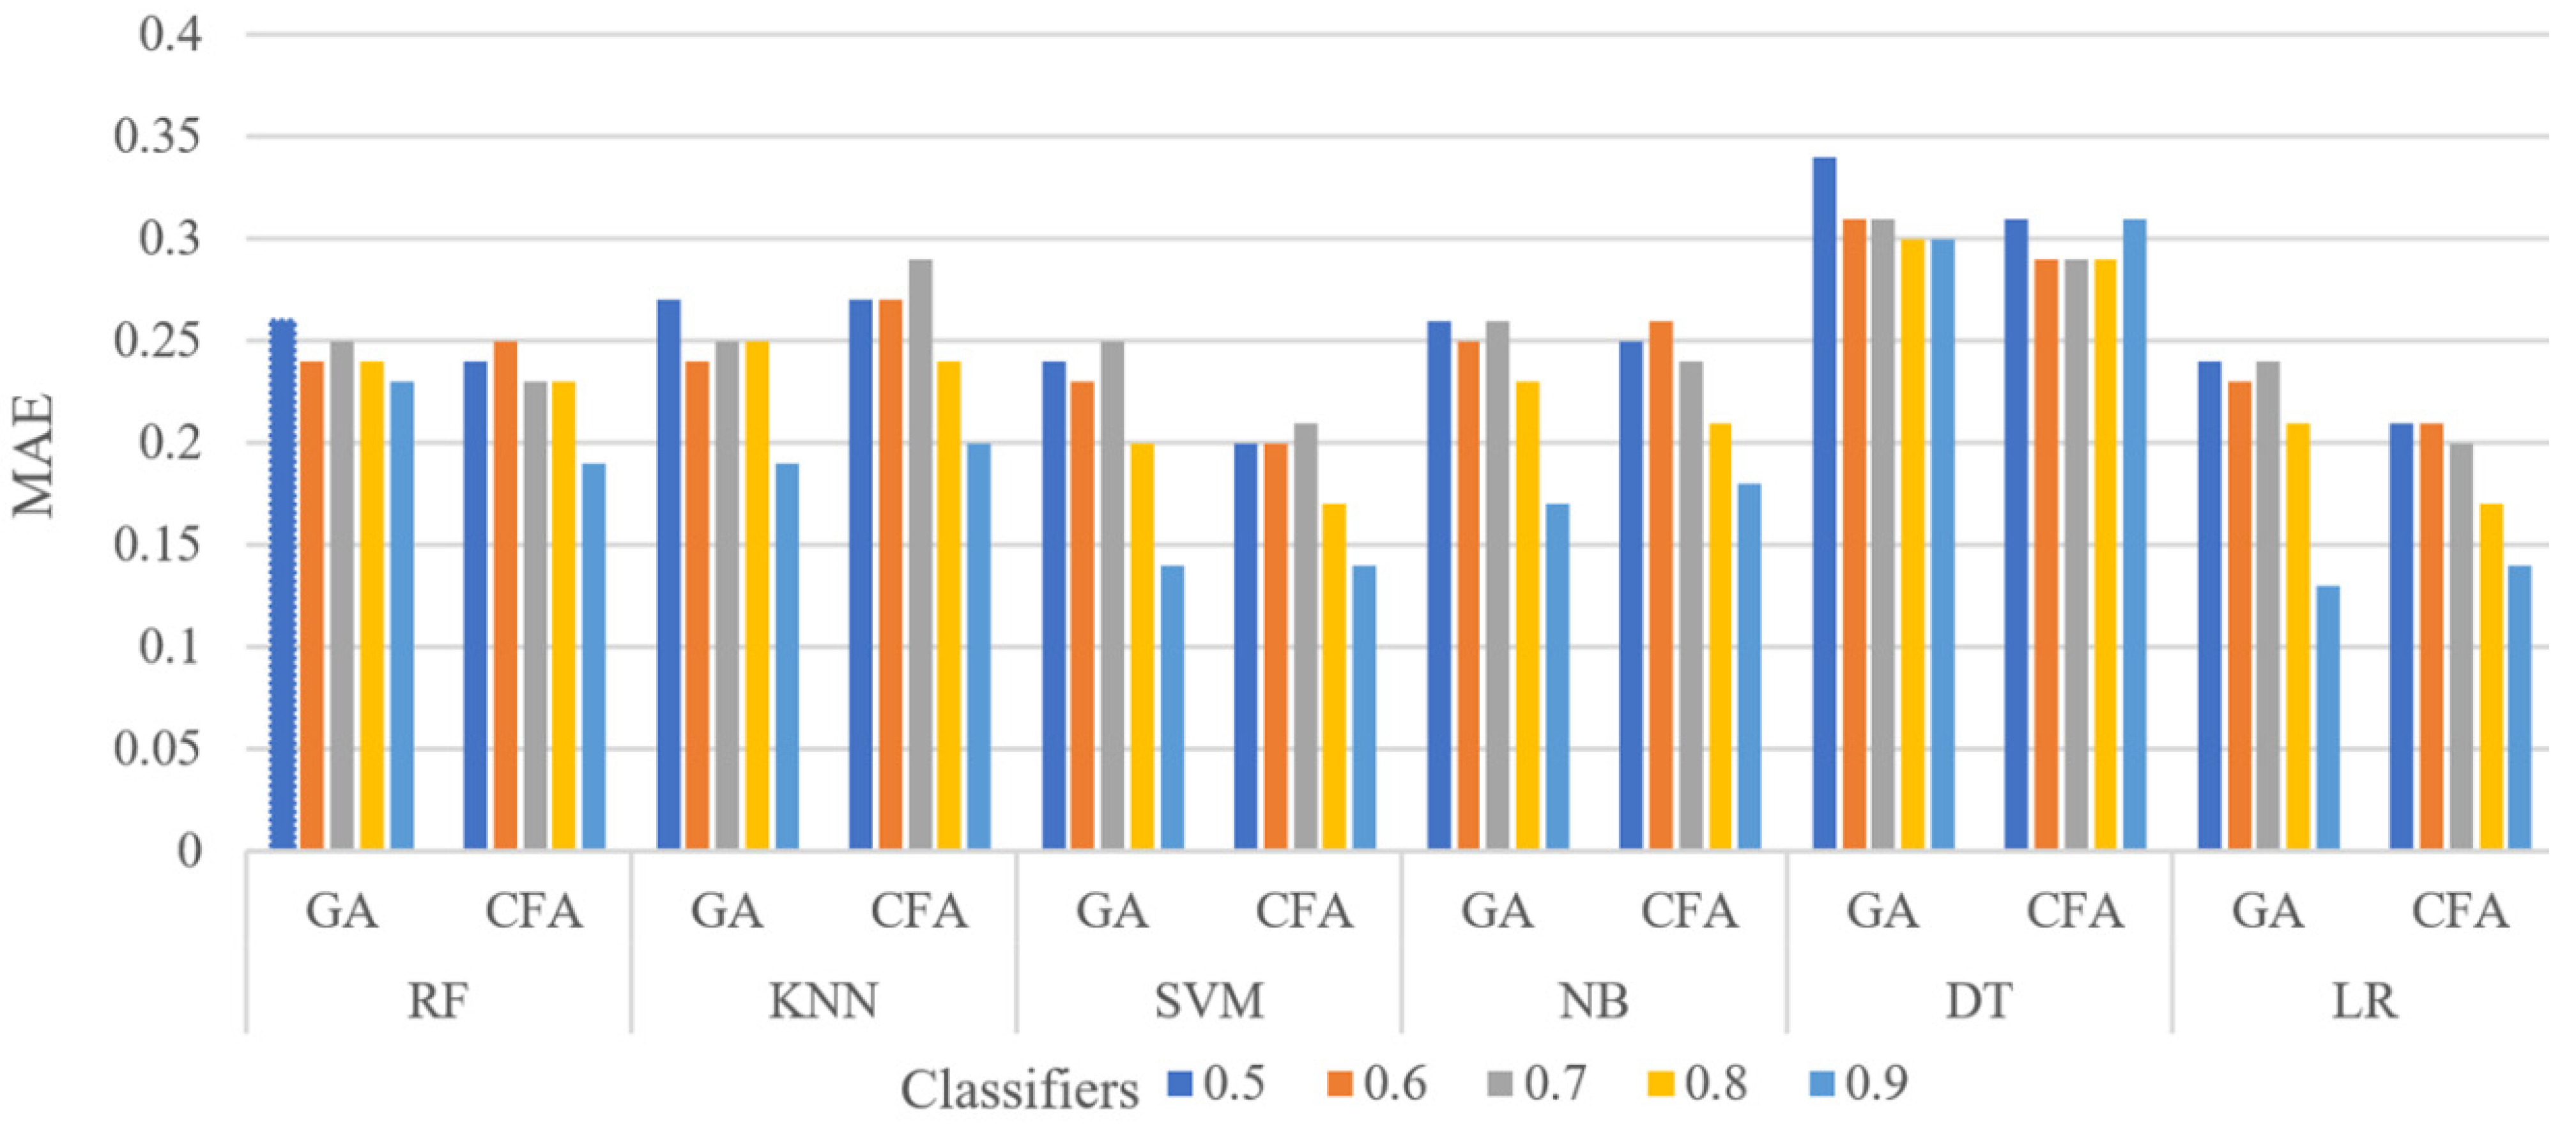
Figure 6 shows the MAE values of the six classifiers for the PID dataset at different training set levels (0.5 to 0.9) with 50 iterations and 100 iterations as the population size. The results show that each time the number of training samples in the PID dataset is increased, the features selected by the CFA provide better results than the GA using all classifiers except KNN.
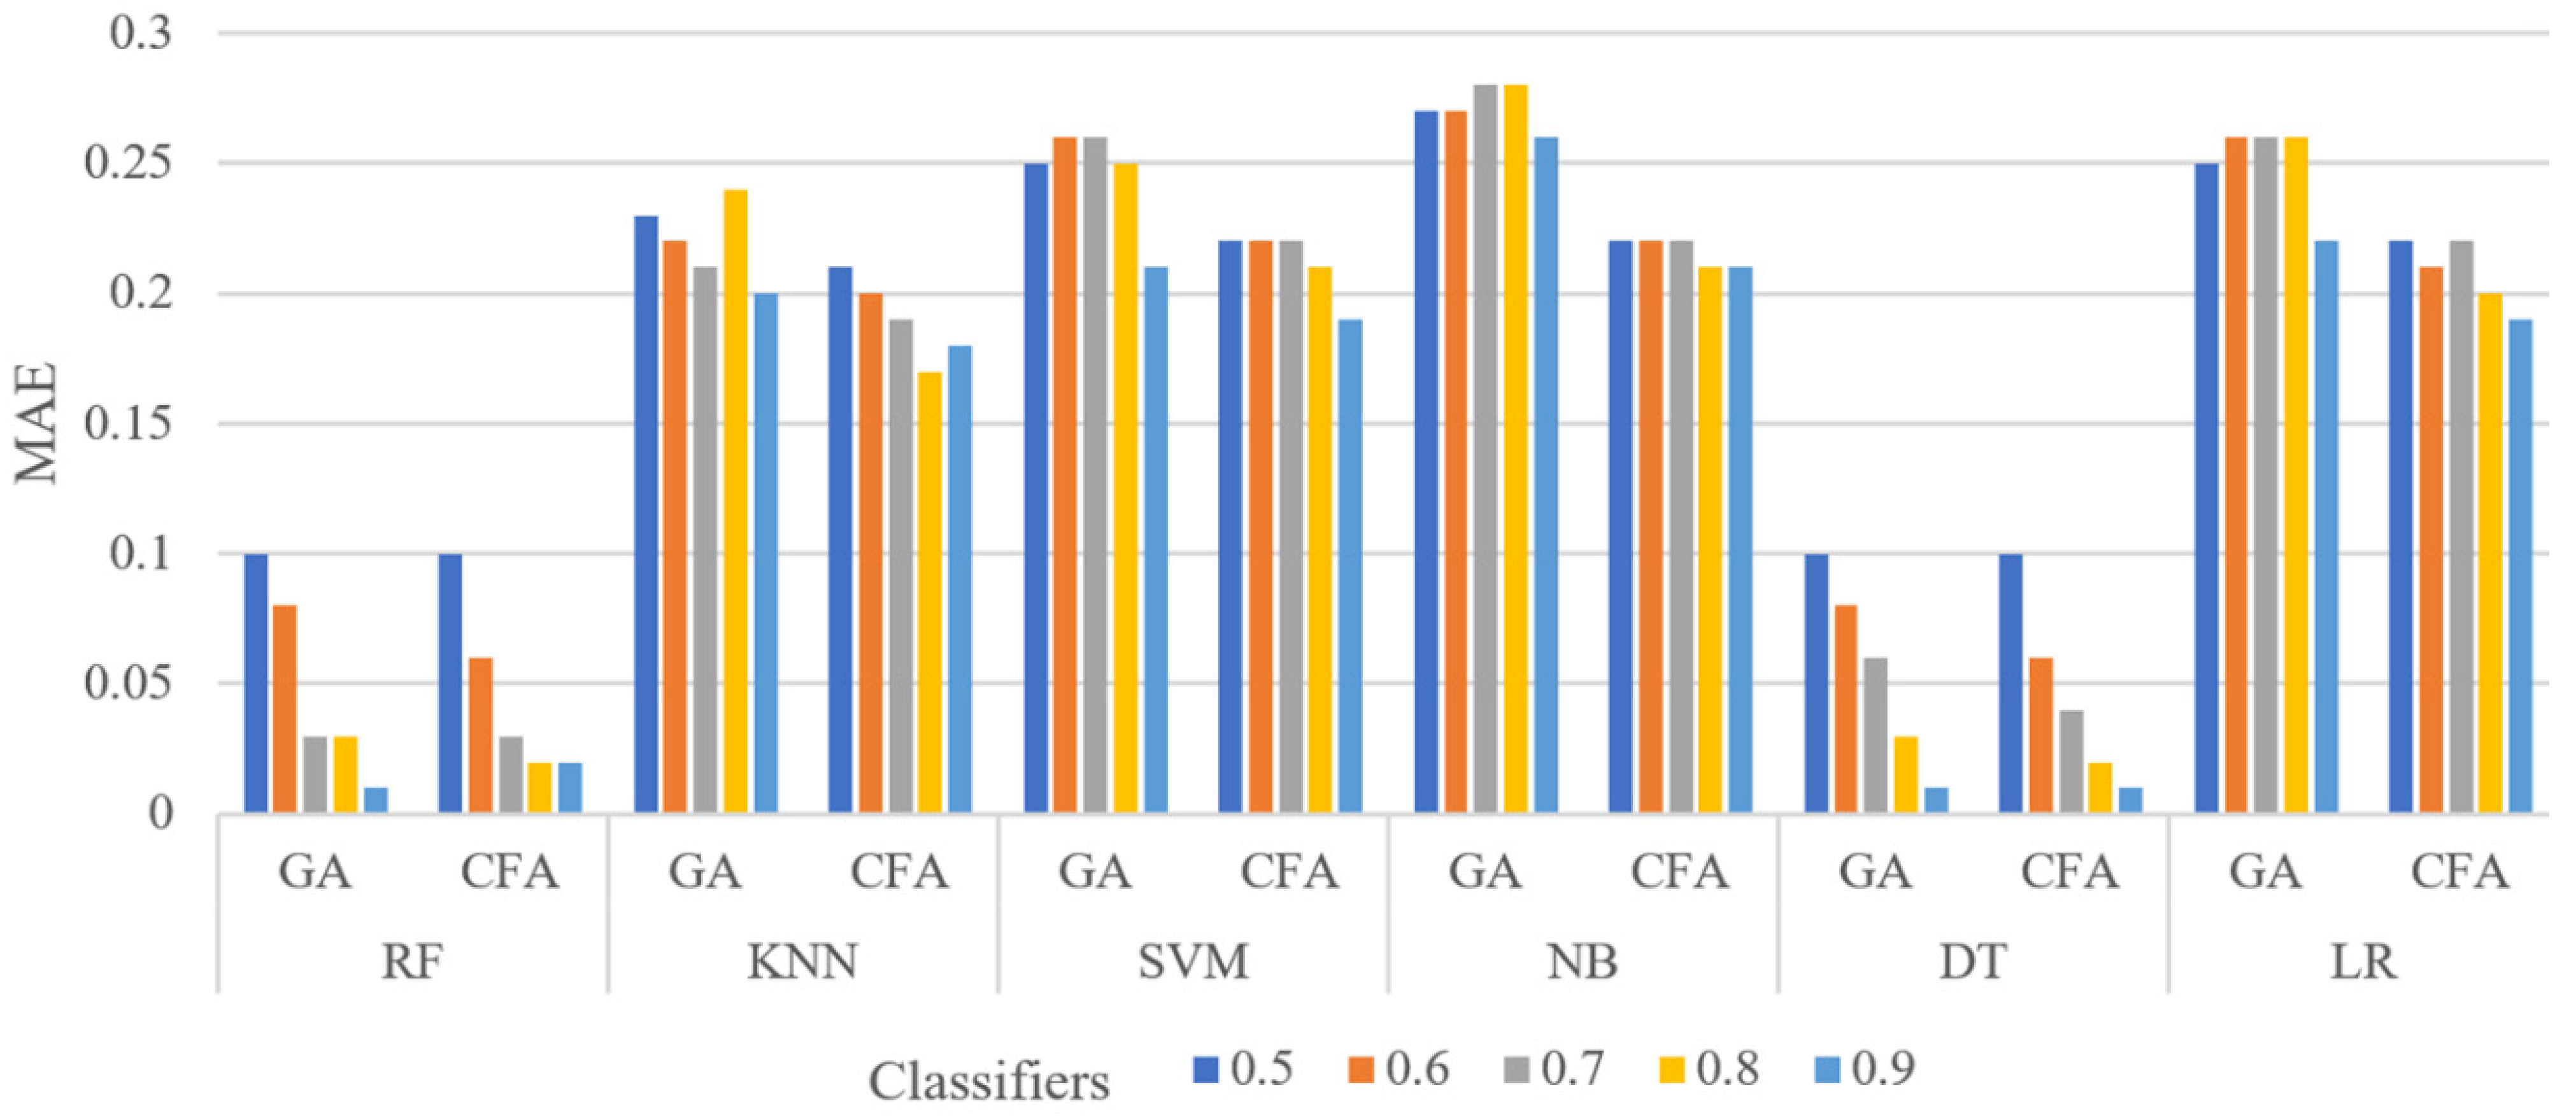
Figure 7 shows the MAE values of the six classifiers for the HFD dataset at different training set levels (0.5 to 0.9) with 50 iterations and 100 as the population size. The CFA provided better results than the GA, particularly with RF and DT. The main reason for this is that DT operates as a series of sequential decisions made to reach a particular output of the importance of features and attribute sequences based on criteria such as the Gini impurity index. The RF leverages the power of multiple DTs to make a decision.
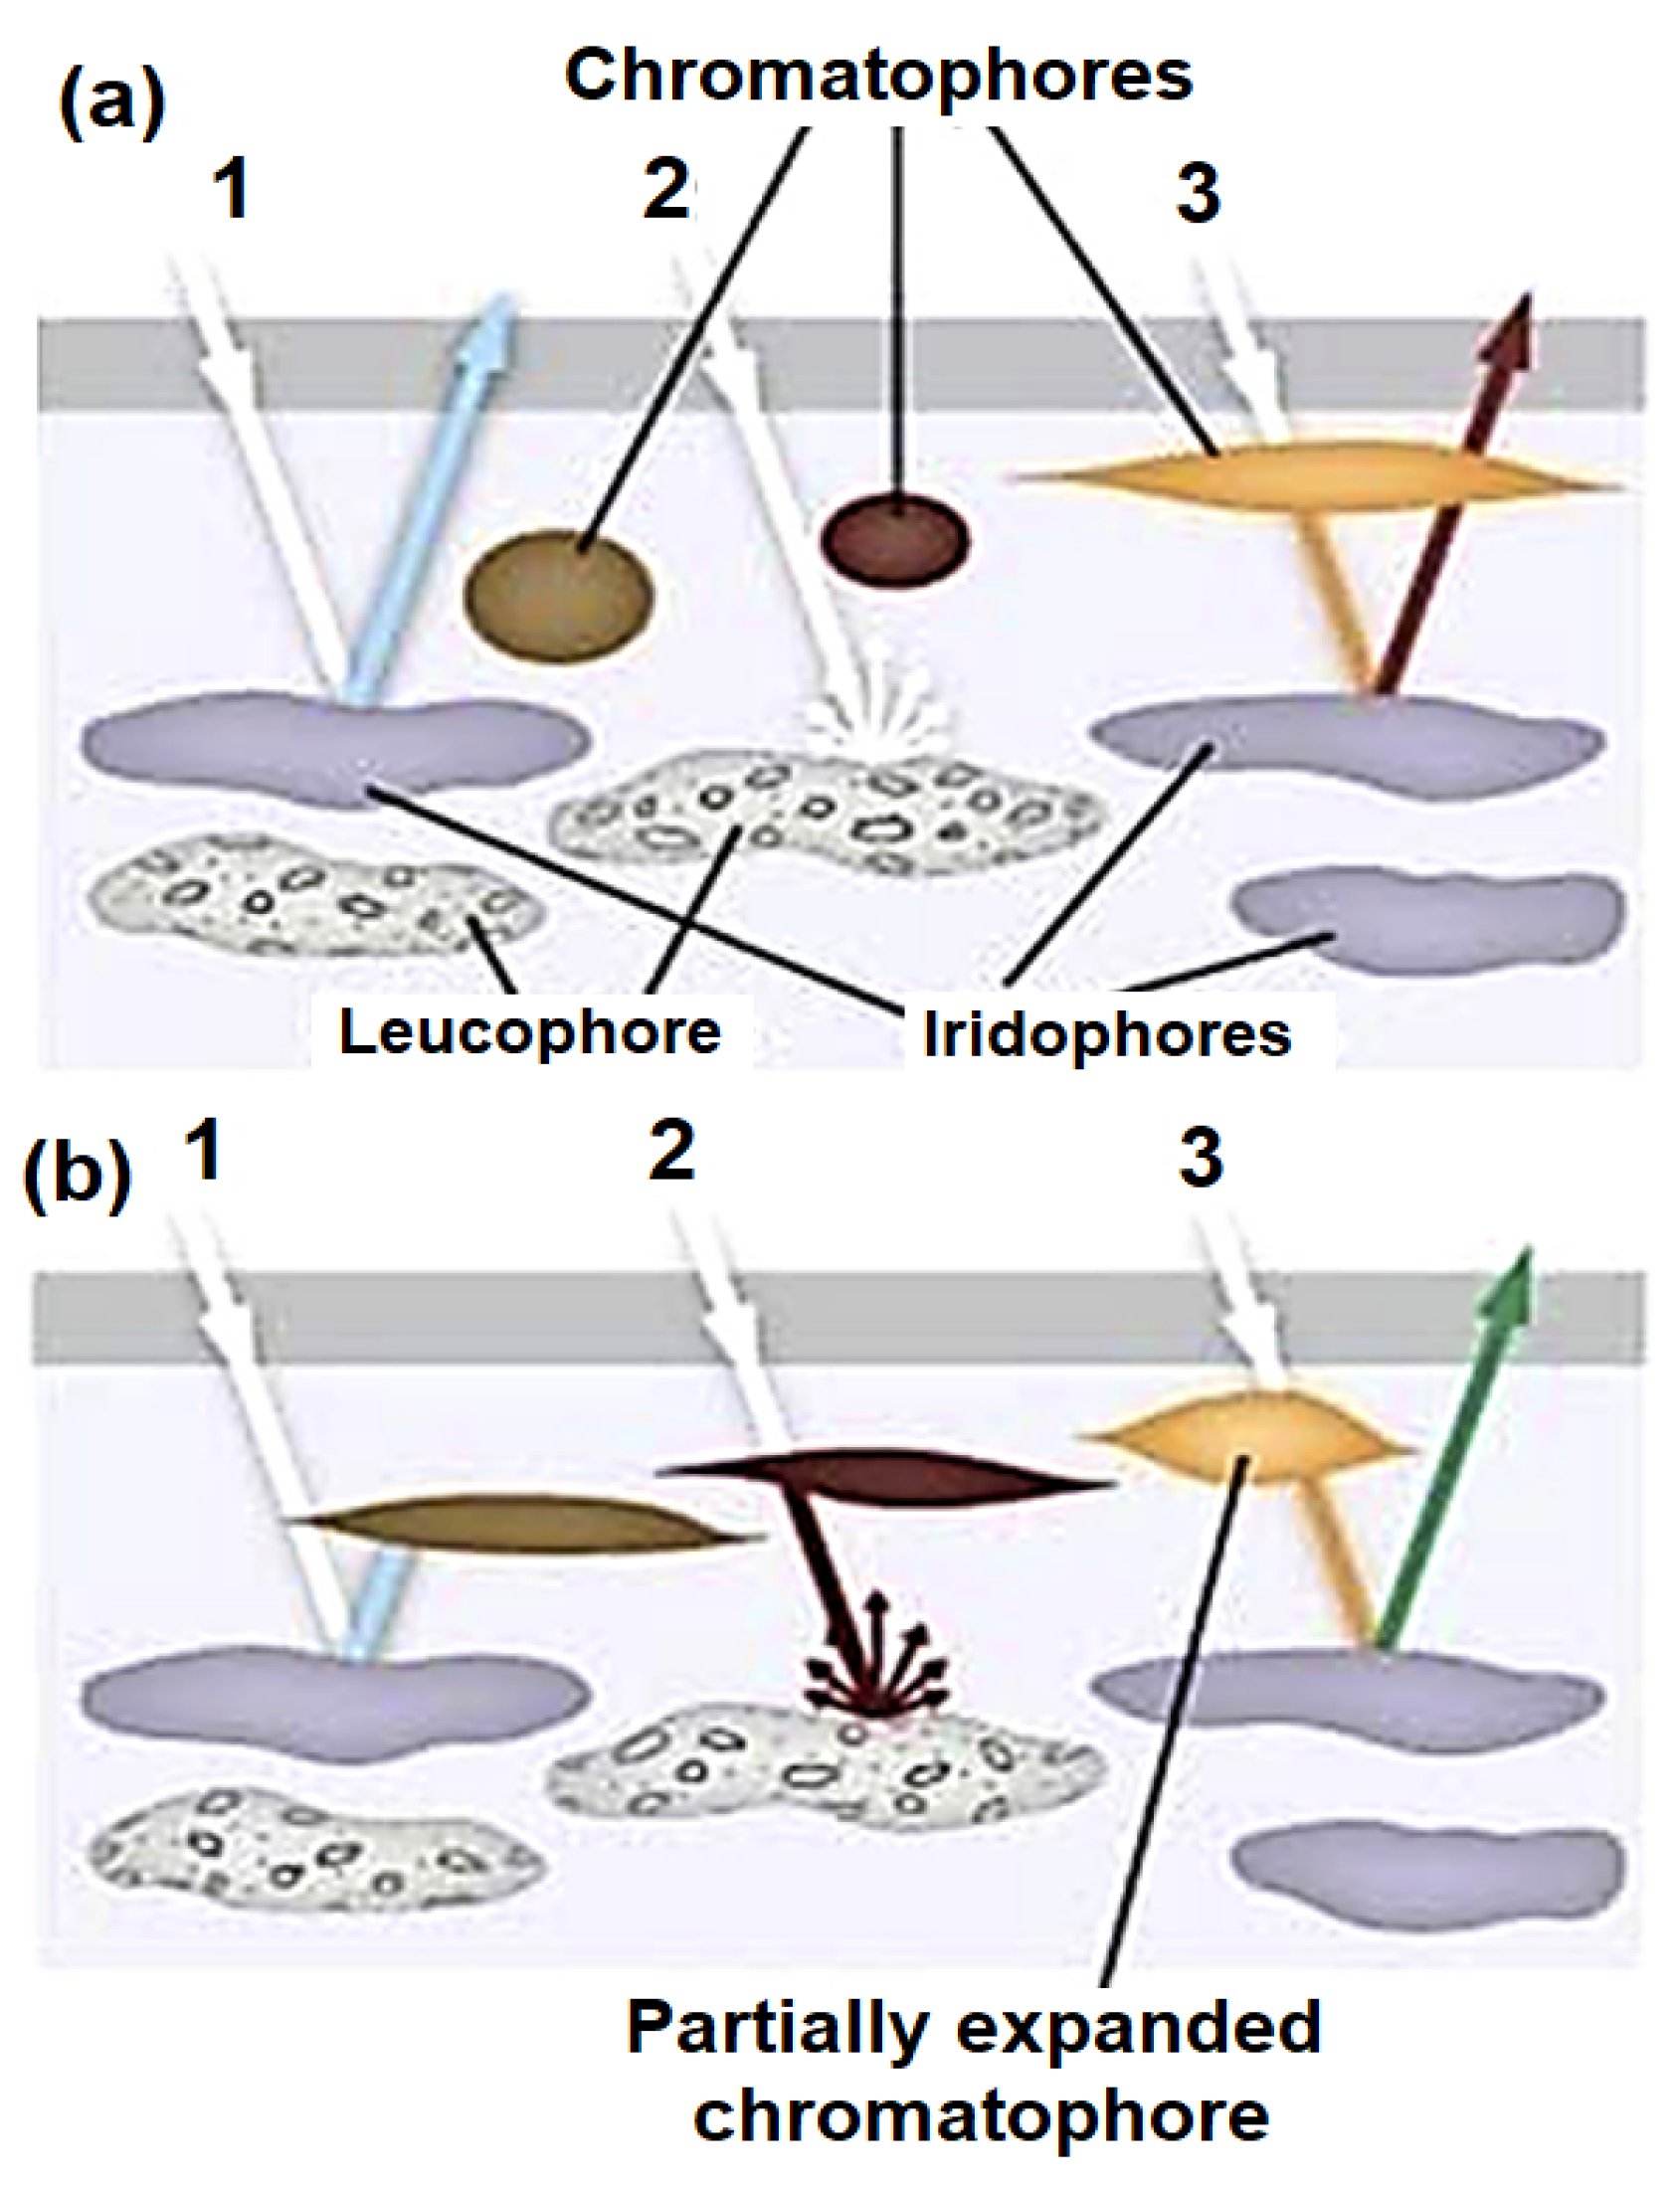
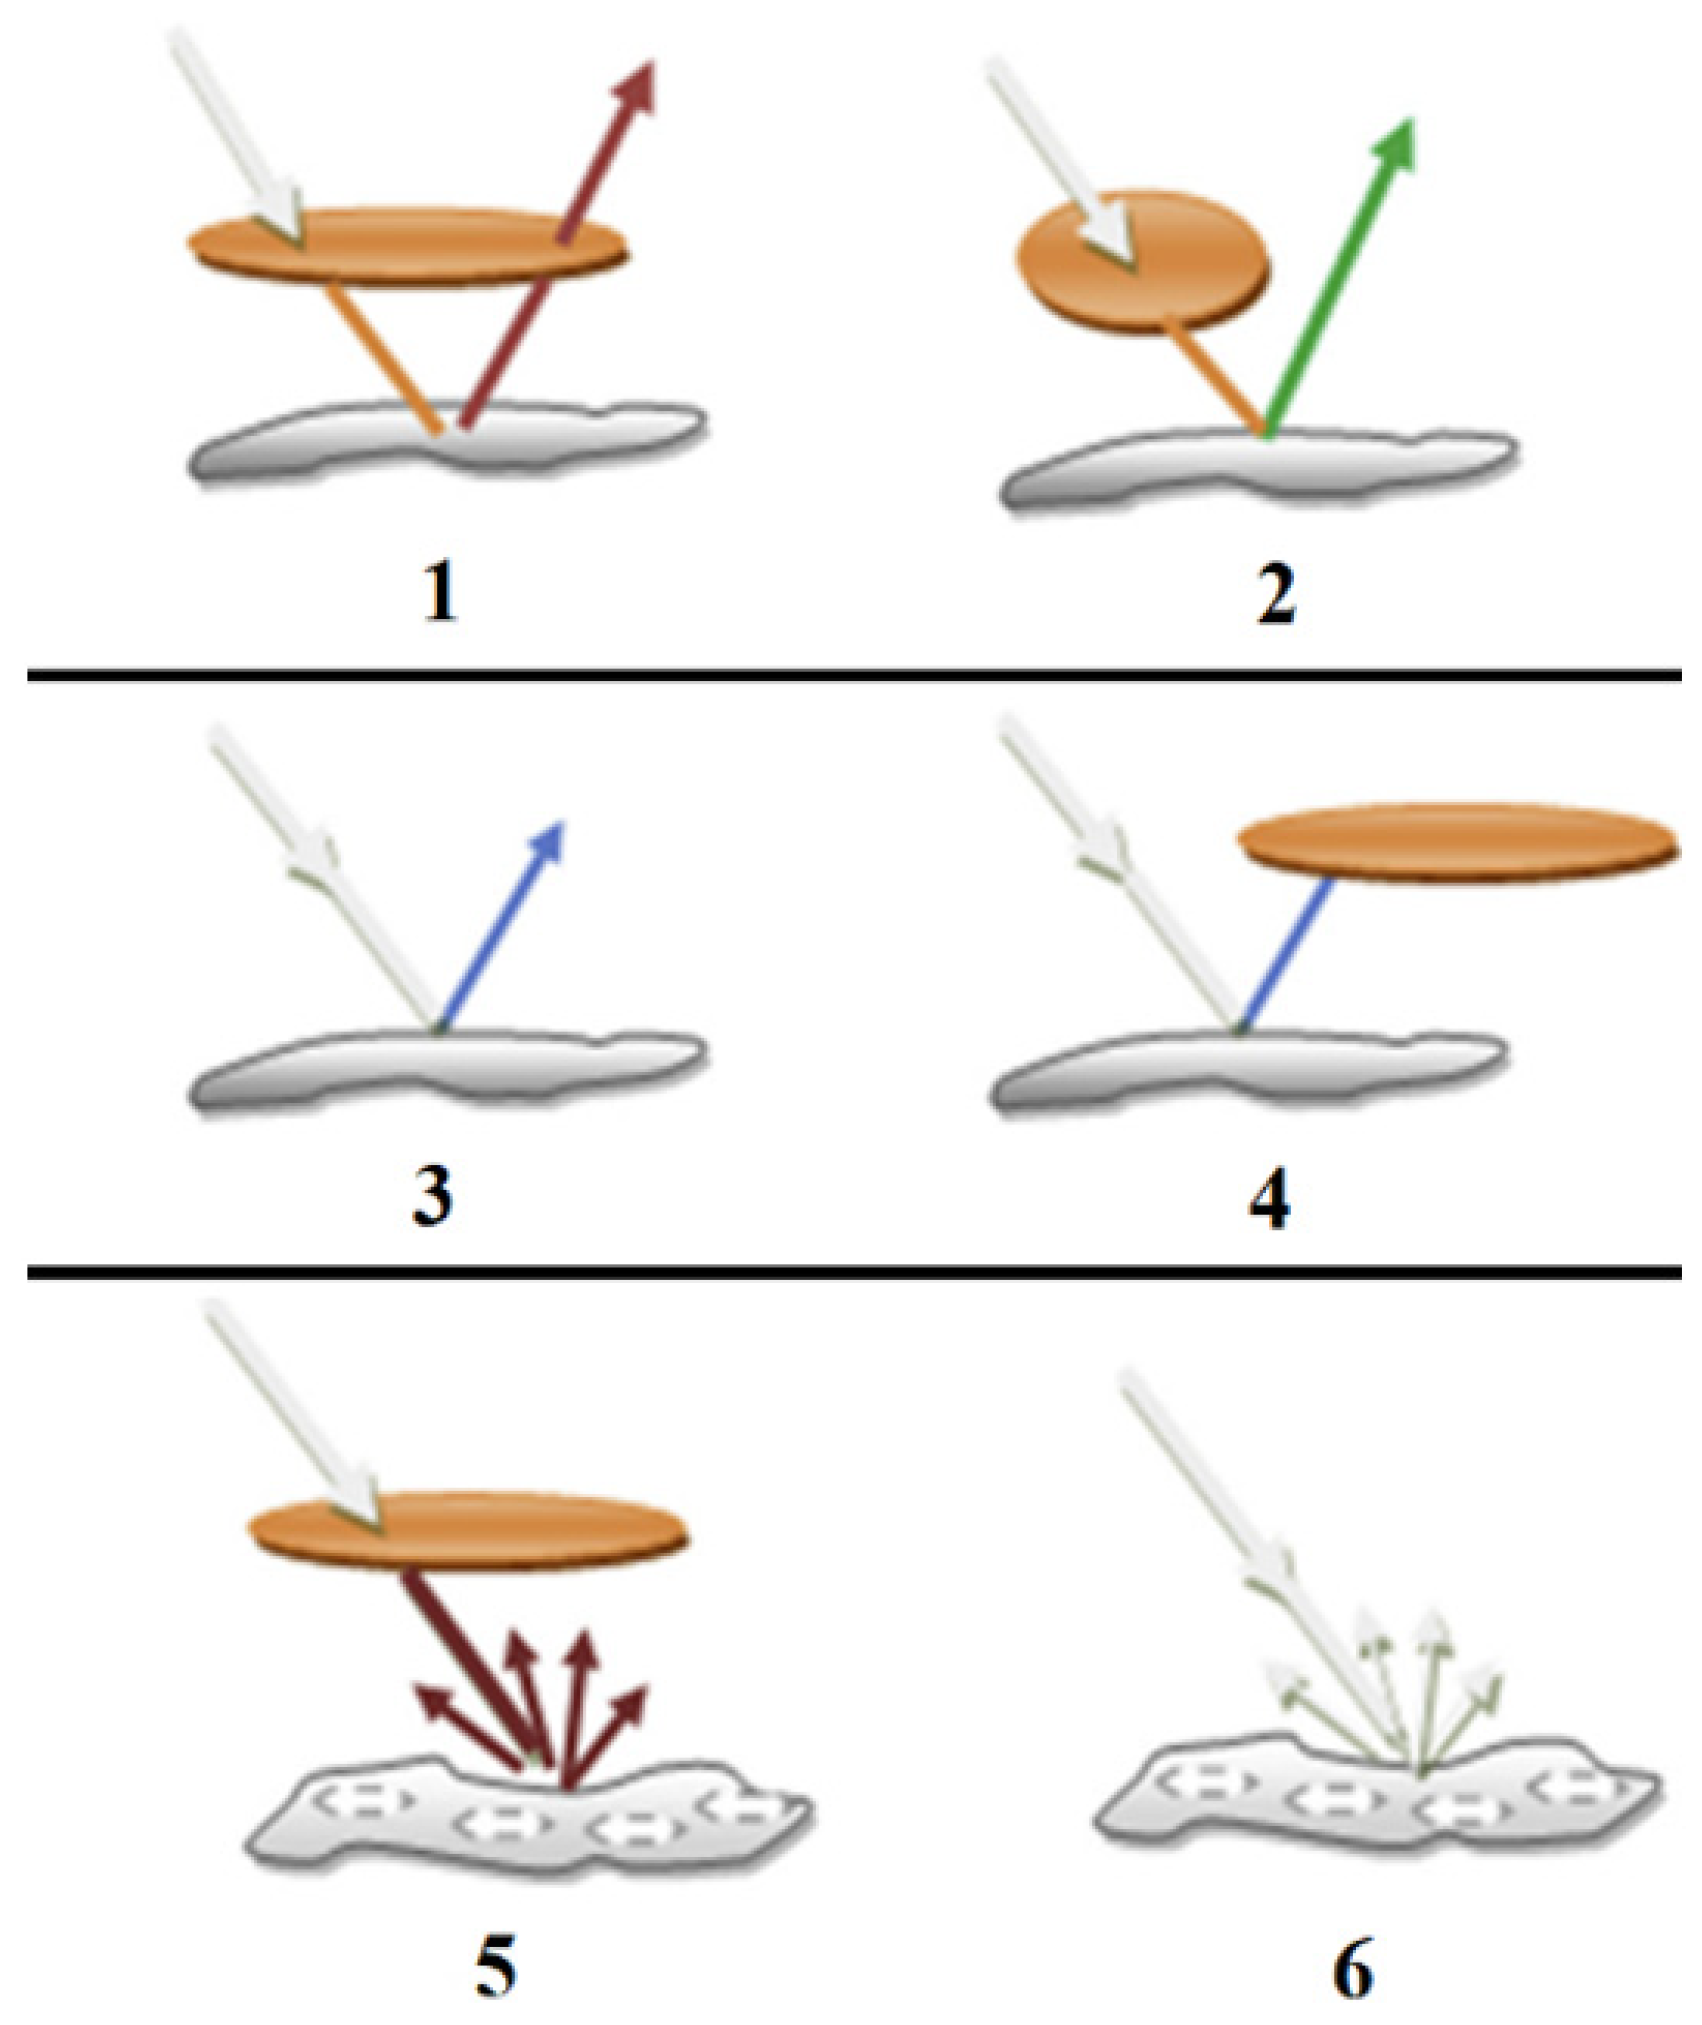
Examination of the execution time of the CFA and GA showed that the CFA outperformed the GA in terms of execution time (CFA: 55 sec for the PID dataset and 68 sec for the HFD dataset; GA: 64 sec for PID and 75 sec for HFD). The algorithmic design of the GA was different from that of the CFA, and the solutions were ranked based on their fitness values. A GA usually clusters around good solutions within a population. This is based on the observation that the selection of parents in the GA is based on probabilities that favor fitness individuals. The solutions are more likely to be similar to the parents’ because the crossover operation produces offspring with the parents’ parts. The diversification aspect of GA is accomplished through a mutation operation that injects some differences in the solutions from time to time. The solution time of the GA also increases nonlinearly as the population size increases, whereas the CFA aims to find the optimal solution based on color-changing behavior. The patterns and colors observed in cuttlefish were produced by light reflected from the three layers. The simulation of light reflection and visibility of the matching patterns used was formulated.

6. Conclusions and Future Directions

Medical data analysis is a critical research field in which decisions can be made. However, medical datasets are often massive in dimension with complex redundant features, which increases the possibility of noise and dependency among features. Therefore, identifying a proper feature selection approach is important in the data preprocessing stages to reduce the redundancy and irrelevance among features, which positively affects the speed of performance and prediction accuracy. In this research, a bio-inspired algorithm called cuttlefish was adapted for feature selection, which was inspired by the color-changing behavior of cuttlefish to find the optimal solution. Earlier research has proven the effectiveness of the cuttlefish algorithm compared to other bio-inspired algorithms, such as the genetic algorithm, for solving various optimization problems. We applied the cuttlefish and genetic algorithms to two datasets: the Pima Indian diabetes dataset and the hospital Frankfort dataset, and the results were observed. The results show that the cuttlefish algorithm works well in predicting type 2 diabetes and has better performance and execution time than the genetic algorithm. The classification results showed that the RF and DT classifiers outperformed other classifiers when a larger dataset was used. The results also suggested using LR, SVM, and NB classifiers with small-scale datasets.
For future research directions, we propose using richer databases for predicting type 2 diabetes using modern features such as the features proposed in [32]. Future applications of the CFA algorithm in the medical domain include the prediction of chronic kidney disease in diabetics, the prediction of chronic obstructive pulmonary disease in smokers, the prediction of strokes in patients with hypertension, the prediction of diabetes treatment choices, the prediction of cancer diseases, and classification of diabetic retinopathy caused by high blood sugar levels damaging the back of the eye (retina). Furthermore, the CFA algorithm can be applied to diabetes images [33]. In addition, various heuristic and metaheuristic algorithms can be applied to predict diabetes, such as the A* heuristic search algorithm [34], iterative deepening A* (IDA*) algorithm [35], 2-opt local search algorithm [36], nearest neighbor search algorithm [37], harmony search algorithm [38], chemical reaction optimization [39], grey wolf optimizer [40], and the most valuable player algorithm [41] for different large high-dimensional datasets.

Author Contributions

Conceptualization, M.A.-T., B.A.M. and A.A.T.; methodology, M.A.-T., B.A.M., A.A.T. and I.A.; software, M.A.-T., B.A.M. and A.A.T.; validation, M.A.-T., B.A.M., A.A.T. and I.A.; formal analysis, M.A.-T., B.A.M. and I.A.; resources, M.A.-T., B.A.M. and A.A.T.; data curation, M.A.-T., B.A.M. and A.A.T.; writing—original draft preparation, M.A.-T. and A.A.T.; writing—review and editing M.A.-T., B.A.M., A.A.T. and I.A.; visualization, M.A.-T., B.A.M. and A.A.T.; supervision, M.A.-T., B.A.M. and I.A.; project administration, M.A.-T. and B.A.M. All authors have read and agreed to the published version of the manuscript.

Funding

This research received no external funding.

Institutional Review Board Statement

Not applicable.

Informed Consent Statement

Not applicable.

Data Availability Statement

The data utilized in this work can be found at PID dataset: https://www.kaggle.com/uciml/pima-indians-diabetes-database (accessed on 14 February 2023); HFD dataset: https://www.kaggle.com/datasets/johndasilva/diabetes (accessed on 14 February 2023).

Acknowledgments

Part of Basel A. Mahafzah’s work was accomplished when he was on sabbatical leave from 2022 to 2023 from the King Abdullah II School of Information Technology, University of Jordan, to the Department of Computer Science, King Hussein School of Computing Sciences, Princess Sumaya University for Technology, Amman, Jordan.

Conflicts of Interest

The authors declare no conflict of interest.

References

  1. Yach, D.; Hawkes, C.; Gould, C.L.; Hofman, K.J. The Global Burden of Chronic DiseasesOvercoming Impediments to Prevention and Control. JAMA 2004, 291, 2616–2622. [Google Scholar] [CrossRef] [PubMed]
  2. Vaishali, R.; Sasikala, R.; Ramasubbareddy, S.; Remya, S.; Nalluri, S. Genetic algorithm based feature selection and MOE Fuzzy classification algorithm on Pima Indians Diabetes dataset. In Proceedings of the 2017 International Conference on Computing Networking and Informatics (ICCNI), Lagos, Nigeria, 29–31 October 2017; pp. 1–5. [Google Scholar]
  3. Khanam, J.J.; Foo, S.Y. A comparison of machine learning algorithms for diabetes prediction. ICT Express 2021, 7, 432–439. [Google Scholar] [CrossRef]
  4. Khalid, S.; Khalil, T.; Nasreen, S. A survey of feature selection and feature extraction techniques in machine learning. In Proceedings of the 2014 Science and Information Conference, London, UK, 27–29 August 2014; pp. 372–378. [Google Scholar]
  5. Swapna, G.; Vinayakumar, R.; Soman, K.P. Diabetes detection using deep learning algorithms. ICT Express 2018, 4, 243–246. [Google Scholar] [CrossRef]
  6. Yu, L.; Liu, H. Efficient feature selection via analysis of relevance and redundancy. J. Mach. Learn. Res. 2004, 5, 1205–1224. [Google Scholar]
  7. Ismail, L.; Materwala, H.; Tayefi, M.; Ngo, P.; Karduck, A.P. Type 2 Diabetes with Artificial Intelligence Machine Learning: Methods and Evaluation. Arch. Comput. Methods Eng. 2021, 29, 313–333. [Google Scholar] [CrossRef]
  8. Yusta, S.C. Different metaheuristic strategies to solve the feature selection problem. Pattern Recognit. Lett. 2009, 30, 525–534. [Google Scholar] [CrossRef]
  9. Gandomi, A.H.; Yang, X.-S.; Alavi, A.H. Cuckoo search algorithm: A metaheuristic approach to solve structural optimization problems. Eng. Comput. 2013, 29, 17–35. [Google Scholar] [CrossRef]
  10. Yang, X.-S. Nature-Inspired Metaheuristic Algorithms; Luniver Press: London, UK, 2010. [Google Scholar]
  11. Negi, A.; Jaiswal, V. A first attempt to develop a diabetes prediction method based on different global datasets. In Proceedings of the 2016 Fourth International Conference on Parallel, Distributed and Grid Computing (PDGC), Waknaghat, India, 22–24 December 2016; pp. 237–241. [Google Scholar]
  12. Tigga, N.P.; Garg, S. Prediction of Type 2 Diabetes using Machine Learning Classification Methods. Procedia Comput. Sci. 2020, 167, 706–716. [Google Scholar] [CrossRef]
  13. Lukmanto, R.B.; Suharjito; Nugroho, A.; Akbar, H. Early Detection of Diabetes Mellitus using Feature Selection and Fuzzy Support Vector Machine. Procedia Comput. Sci. 2019, 157, 46–54. [Google Scholar] [CrossRef]
  14. Sneha, N.; Gangil, T. Analysis of diabetes mellitus for early prediction using optimal features selection. J. Big Data 2019, 6, 13. [Google Scholar] [CrossRef]
  15. Nibareke, T.; Laassiri, J. Using Big Data-machine learning models for diabetes prediction and flight delays analytics. J. Big Data 2020, 7, 78. [Google Scholar] [CrossRef]
  16. Ellouze, A.; Kahouli, O.; Ksantini, M.; Alsaif, H.; Aloui, A.; Kahouli, B. Artificial Intelligence-Based Diabetes Diagnosis with Belief Functions Theory. Symmetry 2022, 14, 2197. [Google Scholar] [CrossRef]
  17. Gupta, D.; Julka, A.; Jain, S.; Aggarwal, T.; Khanna, A.; Arunkumar, N.; de Albuquerque, V.H.C. Optimized cuttlefish algorithm for diagnosis of Parkinson’s disease. Cogn. Syst. Res. 2018, 52, 36–48. [Google Scholar] [CrossRef]
  18. Abu Khurmaa, R.; Aljarah, I.; Sharieh, A. An intelligent feature selection approach based on moth flame optimization for medical diagnosis. Neural Comput. Appl. 2020, 33, 7165–7204. [Google Scholar] [CrossRef]
  19. Uzma; Al-Obeidat, F.; Tubaishat, A.; Shah, B.; Halim, Z. Gene encoder: A feature selection technique through unsupervised deep learning-based clustering for large gene expression data. Neural Comput. Appl. 2020, 34, 8309–8331. [Google Scholar] [CrossRef]
  20. Shah, S.H.; Iqbal, M.J.; Ahmad, I.; Khan, S.; Rodrigues, J.J.P.C. Optimized gene selection and classification of cancer from microarray gene expression data using deep learning. Neural Comput. Appl. 2020. [Google Scholar] [CrossRef]
  21. Malakar, S.; Ghosh, M.; Bhowmik, S.; Sarkar, R.; Nasipuri, M. A GA based hierarchical feature selection approach for handwritten word recognition. Neural Comput. Appl. 2020, 32, 2533–2552. [Google Scholar] [CrossRef]
  22. Gandomi, A.H.; Yang, X.-S.; Talatahari, S.; Alavi, A.H. Metaheuristic algorithms in modeling and optimization. In Metaheuristic Applications in Structures and Infrastructures; Elsevier: Amsterdam, The Netherlands, 2013; pp. 1–24. [Google Scholar]
  23. Almomani, A.; Alweshah, M.; Al, S. Metaheuristic algorithms-based feature selection approach for intrusion detection. In Machine Learning for Computer and Cyber Security; CRC Press: Boca Raton, FL, USA, 2019. [Google Scholar]
  24. Eesa, A.S.; Brifcani, A.M.A.; Orman, Z. Cuttlefish algorithm-a novel bio-inspired optimization algorithm. Int. J. Sci. Eng. Res. 2013, 4, 1978–1986. [Google Scholar]
  25. Eesa, A.S.; Brifcani, A.M.A.; Orman, Z. A new tool for global optimization problems-cuttlefish algorithm. Int. J. Math. Comput. Nat. Phys. Eng. 2014, 8, 1208–1211. [Google Scholar]
  26. Holland, J.H. Adaptation in Natural and Artificial Systems: An Introductory Analysis with Applications to Biology, Control, and Artificial Intelligence; MIT Press: Cambridge, MA, USA, 1992. [Google Scholar]
  27. Azbeg, K.; Boudhane, M.; Ouchetto, O.; Jai Andaloussi, S. Diabetes emergency cases identification based on a statistical predictive model. J. Big Data 2022, 9, 31. [Google Scholar] [CrossRef]
  28. Jayanthi, N.; Babu, B.V.; Rao, N.S. Survey on clinical prediction models for diabetes prediction. J. Big Data 2017, 4, 26. [Google Scholar] [CrossRef]
  29. Ben-David, A. Comparison of classification accuracy using Cohen’s Weighted Kappa. Expert Syst. Appl. 2008, 34, 825–832. [Google Scholar] [CrossRef]
  30. Vieira, S.M.; Kaymak, U.; Sousa, J.M.C. Cohen’s kappa coefficient as a performance measure for feature selection. In Proceedings of the International Conference on Fuzzy Systems, Barcelona, Spain, 18–23 July 2010; pp. 1–8. [Google Scholar]
  31. Landis, J.R.; Koch, G.G. The measurement of observer agreement for categorical data. Biometrics 1977, 33, 159–174. [Google Scholar] [CrossRef] [PubMed] [Green Version]
  32. Rodríguez-Rodríguez, I.; Rodríguez, J.-V.; González-Vidal, A.; Zamora, M.-Á. Feature Selection for Blood Glucose Level Prediction in Type 1 Diabetes Mellitus by Using the Sequential Input Selection Algorithm (SISAL). Symmetry 2019, 11, 1164. [Google Scholar] [CrossRef] [Green Version]
  33. Aslan, M.F.; Sabanci, K. A Novel Proposal for Deep Learning-Based Diabetes Prediction: Converting Clinical Data to Image Data. Diagnostics 2023, 13, 796. [Google Scholar] [CrossRef]
  34. Mahafzah, B.A. Performance evaluation of parallel multithreaded A* heuristic search algorithm. J. Inf. Sci. 2014, 40, 363–375. [Google Scholar] [CrossRef]
  35. Mahafzah, B.A. Parallel multithreaded IDA* heuristic search: Algorithm design and performance evaluation. Int. J. Parallel Emergent Distrib. Syst. 2011, 26, 61–82. [Google Scholar] [CrossRef]
  36. Al-Adwan, A.; Sharieh, A.; Mahafzah, B.A. Parallel heuristic local search algorithm on OTIS hyper hexa-cell and OTIS mesh of trees optoelectronic architectures. Appl. Intell. 2019, 49, 661–688. [Google Scholar] [CrossRef]
  37. Al-Adwan, A.; Mahafzah, B.A.; Sharieh, A. Solving traveling salesman problem using parallel repetitive nearest neighbor algorithm on OTIS-Hypercube and OTIS-Mesh optoelectronic architectures. J. Supercomput. 2018, 74, 1–36. [Google Scholar] [CrossRef]
  38. Al-Shaikh, A.A.; Mahafzah, B.A.; Alshraideh, M. Hybrid harmony search algorithm for social network contact tracing of COVID-19. Soft Comput. 2021, 27, 3343–3365. [Google Scholar] [CrossRef]
  39. Mahafzah, B.A.; Jabri, R.; Murad, O. Multithreaded scheduling for program segments based on chemical reaction optimizer. Soft Comput. 2021, 25, 2741–2766. [Google Scholar] [CrossRef]
  40. Al-Shaikh, A.; Mahafzah, B.A.; Alshraideh, M. Metaheuristic approach using grey wolf optimizer for finding strongly connected components in digraphs. J. Theor. Appl. Inf. Technol. 2019, 97, 4439–4452. [Google Scholar]
  41. Khattab, H.; Sharieh, A.; Mahafzah, B.A. Most valuable player algorithm for solving minimum vertex cover problem. Int. J. Adv. Comput. Sci. Appl. 2019, 10, 159–167. [Google Scholar] [CrossRef] [Green Version]
Figure 1. Diagram of cuttlefish skin detailing the three main skin structures [24].
Symmetry 15 00764 g001
Figure 2. Reorder of the six cases in Figure 1 [24].
Symmetry 15 00764 g002
Figure 3. Steps for predicting type 2 diabetes.
Symmetry 15 00764 g003
Figure 4. Kappa values on the PID dataset at different levels of the training set.
Symmetry 15 00764 g004
Figure 5. Kappa values on the HFD dataset at different levels of the training set.
Symmetry 15 00764 g005
Figure 6. MAE values on the PID dataset at different levels of the training set.
Symmetry 15 00764 g006
Figure 7. MAE values on the HFD dataset at different levels of the training set.
Symmetry 15 00764 g007
Table 1. Features of the PID and HFD datasets.
No.FeatureDescription
1PregnanciesNumber of times pregnant
2GlucosePlasma glucose concentration 2 h in an oral glucose tolerance test
3Blood PressureDiastolic blood pressure (mm Hg)
4Skin ThicknessTriceps skinfold thickness (mm)
5Insulin2-Hour serum insulin (mu U/mL)
6BMIBody Mass Index (weight in kg/(height in m)2)
7AgeAge in year
8Diabetes Pedigree FunctionDiabetes diagnostic history of the person’s relatives
Table 2. Features selected by CFA and GA.
DatasetAlgorithmSelected Features
PIDCFAGlucose, skin thickness, BMI, and insulin
GAGlucose, BMI, diabetes pedigree function, and age
HFDCFADiabetes pedigree function, age, glucose, and BMI
GAPregnancies, glucose, insulin, and age
Table 3. Confusion matrix for classification.
RecommendedNot Recommended
PreferredTrue Positive (TP)False Negative (FN)
Not preferredFalse Positive (FP)True Negative (TN)
Table 4. Strength of agreement interpretation of kappa.
KappaStrength of Agreement
<0.00Poor
0.00–0.2Slight
0.21–0.40Fair
0.41–0.60Moderate
0.61–0.80Substational
0.81–1.00Almost perfect
Table 5. CFA input parameters.
ParameterDescriptionValue
DimensionNumber of features4
UpperMaximum limit to initialize population8
LowerMinimum limit to initialize population1
r1Maximum limit to find reflection1.5
r2Minimum limit to find reflection−1.5
v1Maximum limit to find visibility2.5
v2Minimum limit to find visibility−2.5
Table 6. Average accuracy rates for CFA and GA on the PID and HFD datasets.
DatasetPopulation Iteration102030405060708090100
PID100.770.780.770.770.790.780.770.800.790.79
200.750.750.750.760.760.770.760.790.790.80
300.750.760.770.780.790.790.800.790.800.80
400.740.750.750.760.770.770.790.790.800.79
500.740.750.770.770.760.780.790.800.800.80
600.750.760.770.770.770.780.790.790.800.80
700.760.770.770.780.770.780.780.800.800.80
HFD100.760.770.760.750.760.760.760.740.750.73
200.760.740.750.740.730.750.770.740.760.74
300.750.750.760.760.750.760.770.750.750.75
400.740.760.760.760.770.770.780.730.740.75
500.750.760.760.770.770.770.780.750.750.76
600.740.770.770.770.760.770.770.740.750.76
700.740.750.760.760.760.770.770.740.760.77
Table 7. Difference between the performance of the CFA and the GA using different classification algorithms on the PID dataset.
ClassifierAlgorithmAccuracy ± STDAccuracy MaximinAccuracy MinimumKappaMAE
LRCFA0.80 ± 0.030.820.700.490.2
GA0.78 ± 0.040.800.700.40.24
RFCFA0.77 ± 0.040.770.730.30.23
GA0.78 ± 0.030.790.720.390.25
K-NNCFA0.72 ± 0.020.730.690.300.29
GA0.74 ± 0.020.750.710.380.25
SVMCFA0.80 ± 0.030.810.700.480.21
GA0.76 ± 0.030.770.730.40.25
NBCFA0.76 ± 0.020.770.690.40.24
GA0.75 ± 0.030.760.730.340.26
DTCFA0.69 ± 0.020.700.640.350.29
GA0.72 ± 0.030.750.670.280.31
Table 8. Difference between the performance of the CFA and the GA using different classification algorithms on the HFD dataset.
ClassifierAlgorithmAccuracy ± STDAccuracy MaximinAccuracy MinimumKappaMAE
LRCFA0.79 ± 0.020.780.690.460.22
GA0.73 ± 0.020.730.690.370.26
RFCFA0.97 ± 0.010.970.900.910.03
GA0.96 ± 0.030.970.890.920.03
KNNCFA0.77± 0.040.820.720.530.19
GA0.76 ± 0.030.780.740.520.21
SVMCFA0.75 ± 0.020.780.690.450.22
GA0.73 ± 0.030.740.700.40.26
NBCFA0.75 ± 0.020.770.690.460.22
GA0.72 ± 0.040.730.690.360.28
DTCFA0.95 ± 0.040.970.760.890.04
GA0.93 ± 0.010.960.940.860.06
Disclaimer/Publisher’s Note: The statements, opinions and data contained in all publications are solely those of the individual author(s) and contributor(s) and not of MDPI and/or the editor(s). MDPI and/or the editor(s) disclaim responsibility for any injury to people or property resulting from any ideas, methods, instructions or products referred to in the content.

