
Intermolecular Interactions in Binary and Ternary Solutions of a Zwitterionic Compound Studied by Solvatochromism


Faculty of Physics, Alexandru Ioan Cuza University, 11 Carol I Blvd., 700506 Iasi, Romania
*
Author to whom correspondence should be addressed.
Symmetry 2023, 15(2), 563; https://doi.org/10.3390/sym15020563
Submission received: 26 December 2022
/
Revised: 23 January 2023
/
Accepted: 16 February 2023
/
Published: 20 February 2023
(This article belongs to the Collection Feature Papers in Chemistry)
Abstract
:The 1-dithiocarboxy-2-ethoxy-1-(isoquinolin-2-yl)-2-oxoethan-1-ylid (iQTCY) zwitterionic molecule has been studied by computational and spectral means in order to establish some of its structural parameters in the ground electronic state as well as the nature and the strength of its universal and specific interactions with different solvents. The prevalence of the orientation–induction interactions in the diluted solutions of iQTCY in aprotic solvents and the additional specific interactions by hydrogen bonds (HB) in the protic solvents were demonstrated. Three theoretical models were comparatively used to estimate the composition of the first solvation shell of the iQTCY molecule in ternary solutions. The difference between the interaction energies in molecular pairs solute–solvent was computed based on the statistical cell model of ternary solutions of iQTCY in mixtures of water–ethanol and water–methanol. Using the electro-optical parameters computed by the quantum-mechanical technique and the results of the solvatochromic study, the excited state dipole moment of iQTCY was estimated within the limit of the variational method applicable to molecules that show only an absorption electronic spectrum.
1. Introduction
Iso-quinolinium ylids are zwitterionic compounds in which the nitrogen atom of the iso-quinolinium heterocycle is positively charged and covalently bonded with one negative carbon atom, named carbanion [1,2,3]. The ylid carbanion can be mono- or di-substituted. In the carbanion monosubstituted iso-quinolinium ylids, one of the substituted atoms is hydrogen, and, in order to assure the ylid stability, the second substituent of the carbanion is an atomic group with high electronegativity. Two electron-withdrawing atomic groups are substituted to the carbanion disubstituted iso-quinolinium ylids. The higher the substituents’ electronegativity, the more stable the ylid is. According to the basic literature, the carbanion disubstituted iso-quinolinium ylids are more stable than that of the carbanion mono-substituted [3].
The positive nitrogen from the iso-quinolinium ring confers to iso-quinolinium ylids their aromatic character, the basicity, the proton and electron-attracting ability, and the strong electron-withdrawing capacity [4].
Due to their reactivity, the iso-quinolinium ylids have also been considered for further usage in synthesis reactions [5,6,7].
Aside from their utilization in the industries of dyes, insecticides, and antifungal products, the aromatic feature of iso-quinoline has made it useful in the preparation of vanilla spice.
In the natural vegetation, there are various species belonging to Papaveraceae, Berberidaceae, and Ranunculaceae, which produce iso-quinoline alkaloids with remarkable biological activity [8]; for example, papaverine is a benzylisoquinoline alkaloid isolated from Papaver somniferum for its property of a vasodilator and antispasmodic drug. Among the isoquinoline alkaloids, the most beneficial for medical treatments are morphine and codeine as well as the antibiotic berberine.
The spectral behavior of quinoline and iso-quinoline derivatives was first studied some decades ago [9,10], and have been continued in recent years [11,12,13,14].
Iso-quinolinium ylids show a visible electronic absorption band very sensitive to the solvent nature, attributed to an intramolecular charge transfer (ICT) through the carbanion toward the heterocycle [14,15]. The change in color of the solution due to the shift in the spectral band as a function of the solvent nature recommends iso-quinolinium ylids as acid–base indicators in organic chemistry [3].
Iso-quinolinium ylids are used as precursors in obtaining new heterocycles [3,16,17]. For this reason, knowledge regarding their physico-chemical parameters both in vacuum and in different solvents is very important. Most of the iso-quinolinium ylid reactions underlying practical applications in technical or biomedical domains are accomplished in situ, thus the study of the intermolecular interactions in diluted solutions of these ylids has become a real challenge. Experimental and computational approaches could provide interesting data on the molecule’s structural and energetical features as well as on its behavior in the presence of liquids able to develop intermolecular interactions.
Intermolecular interactions are usually studied by solvatochromic methods. Specialized research groups have developed basic solvatochromic models to describe the various types of interactions in diluted solutions of solute molecules and suitable solvents [18,19,20,21]. The proposed models are based on mathematical relationships between the molecular electronic (absorption/fluorescence) spectra of the solute molecule and the microstructural properties of both the solute and solvent molecules. Mainly, the determination of the excited state parameters [22,23,24,25,26,27] has been accomplished by the corroboration of experimental data regarding the electronic spectra (absorption/fluorescence) of the solute and the mathematical approach of the underlying solute–solvent interaction phenomena.
When the solute molecules show only absorption spectra, a variational method [28,29] can be applied to estimate the excited state dipole moment and the angle between the dipole moments in the electronic states responsible for the visible absorption band. This method is based on the supposition of McRae [18] and Kawski [30] that in the photon absorption process, the molecular polarizability does not change its value.
The present study is focused on the computational and spectral analysis of a carbanion disubstituted iso-quinolinium ylid with two substituents characterized by a high electron withdrawing ability [3] named 1-dithiocarboxy-2-ethoxy-1-(isoquinolin-2-yl)-2-oxoethan-1-ylid (iQTCY). It is a stable compound, soluble in many solvents, and the corresponding solutions have different colors depending on the solvent properties [3,14].
The molecule iQTCY was previously studied in binary solvents [14] and the nature of its visible absorption band has been established as being an intramolecular charge transfer (ICT) from the ylid carbanion toward the heterocycle. The linear dependence between the wavenumber in the maximum of the visible absorption band (expressed in kcal/mol) of iQTCY and the empirical polarities, Z (kcal/mol), defined by Kosower [31], proved [14] the assignment of this band to ICT. The high contribution of the orientation–induction interactions in the polar solvents on the visible absorption band was explained [14] by the dipolar nature of the iQTCY molecule in its ground electronic state.
Based on the previous solvatochromic study in binary solutions, we intend now to estimate, within the limits of the variation method, the excited state dipole moment of iQTCY. Concomitantly, a solvatochromic study of the ternary solutions of iQTCY in the mixture of two solvents (one active and the second a few active from the interaction point of view) was conducted in order to search the applicability of the statistical cell model [32] and also to estimate, within the limits of this model, the difference between the interactions energies in molecular pairs of the types of ylid—active solvent and ylid—inactive solvent.
2. Materials and Methods
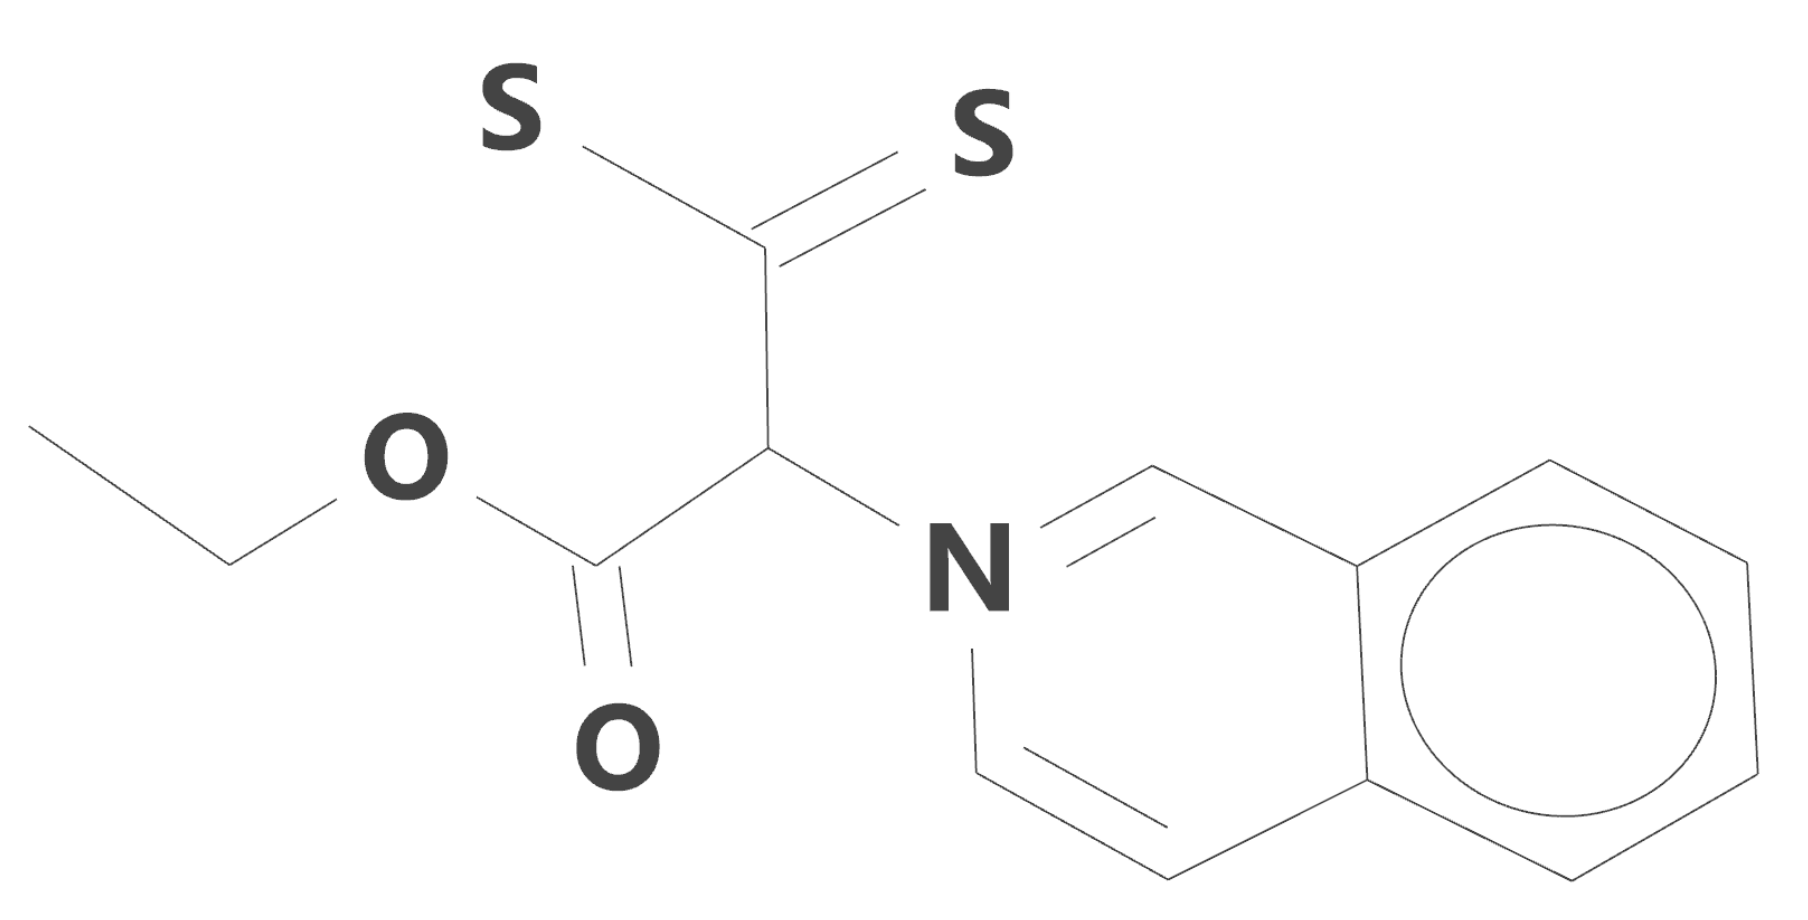
The studied (iQTCY) ylid was prepared by the salt method [3] and its purity was checked by quantitative elemental and spectral (FTIR and 1H NMR) means. The structural formula of the studied iso-quinolinium ylid (having the formula C14H13NO2S2 and the molecular weight 291.395 amu) is shown in Figure 1.
The spectral grade solvents were obtained from Fluke Analytical and Sigma Aldrich and used without any further purification. The list of solvents is provided later in the article.
The solutions of ylid were prepared with a concentration of 10−4 mol/L. The weighing was performed using a Metter XSR105 analytical balance with 10−5 g precision. The solvent volumes were measured with a micropipette.
The electronic absorption band from the visible range was recorded with a Specord UV–Vis Carl Zeiss Jena spectrophotometer with a data acquisition system, having a precision of 0.1 cm−1.
The quantum mechanical characterization was carried out by using Spartan’14 software [33] in order to establish the electro-optical parameters of the studied ylid in its ground electronic state. The EDF2/6-31G* density functional model [34] was used to determine some of the computed parameters for the calculation of the excited state dipole moment of iQTCY.
3. Theoretical Basis
The ylid was used here in diluted solutions, in order to eliminate the interactions between its molecules and to obtain information only about the interactions of the types of solute–solvent and solvent–solvent.
The spectral data were analyzed based on the relations established in solvatochromic studies. The wavenumbers in the maximum of the visible band of the studied ylid in different solvents are correlated [35,36,37,38] with the solvent parameters by a relation in Equation (1).
where f(ε) = (ε − 1)/(ε + 2), f(n) = (n2 − 1)/(n2 + 2); ε is the dielectric constant and n is the refractive index of the solvent; and are the wavenumbers corresponding to the maximum of the electronic absorption band of the spectrally active molecule (iQTCY) in its diluted solution and in vacuum (isolated state), respectively. The correlation coefficients, C1−C4, and the free term, , in Equation (1) were determined by statistical analysis (multilinear regression) based on the experimental data. In Equation (1), the first three terms result from the theories regarding the solvent influence on the electronic band positions in the absorption electronic spectrum [18], while the last two terms were empirically introduced [20] in order to accord the experimental and theoretical values of the wavenumber in the maximum of the absorption band. They take into consideration the specific interactions that have been neglected in the existing theories. The empirical parameters α and β characterize the ability of the solvent molecules to participate in specific interactions: by donating (HBD for α) and by accepting (HBA for β) protons in hydrogen bonding [20]. The influence of the universal interactions on the wavenumber of the electronic absorption band is expressed by the terms depending on the solvent macroscopic parameters ε and n. The correlation coefficients C1 and C2 give, by their magnitude, the strength of the orientation–induction and dispersion interactions, respectively, of the solute molecule with the solvent and by their sign, show the sense of the band shift in the electronic spectrum (towards the small wavenumbers by the sign—and towards the large wavenumbers by the positive sign). They depend on the solute molecular parameters [36,37,38] as shown in Equations (2) and (3).
In Equations (2) and (3), the parameters’ significance is as follows: C1 and C2 are the regression coefficients in Equation (1), indicating the strength of the orientation–induction and dispersion interactions in the diluted solutions of the studied ylid; µ and α are the molecular dipole moment and polarizability of the solute molecule; I signifies the ionization potential; and r is the Onsager radius of the solute molecule. The indices g and e refer to the ground and excited electronic states of the solute, while the indices u and v refer to the solute and solvent molecules, respectively. The angle between the dipole moments of the studied molecule in its electronic states responsible for the visible photon absorption is noted with φ and is expressed in degree. The Onsager radius of the solute molecules can be calculated, in a first approximation, by using the area (A) and the volume (V) of the molecule in its ground electronic state, computed by quantum chemical methods.
In all of the calculations from this paper, the above-mentioned parameters are expressed in centimeter–gram–seconds (CGS) units.
Some results obtained in the computational analysis and those obtained by solvatochromic study were applied here to determine the excited state dipole moment of the spectrally active molecule by using a variational method [28,29]. In the case when the solute molecule does not show a fluorescence spectrum, the data obtained by computational and solvatochromic study are not sufficient for the determination of the excited state parameters (excited state polarizability, excited state dipole moment, and the angle between the dipole moments in the electronic states participating in the visible absorption) of such molecules.
One can evaluate the value and orientation of the excited state dipole moment of a spectrally active substance only in the absorption process, if one admits the hypothesis of McRae regarding the invariance of the molecular electric polarizability in the photon absorption process and one varies the angle φ between the ground and excited state dipole moments within the limits in which the problem has real solutions. In accordance with McRae [18] and Kawski [30], the absorption of the visible photon is achieved when the excited state polarizability becomes equal to the ground state polarizability.
The statistical cell model of ternary solutions [32] establishes a relation between the wavenumber in the maximum of the absorption band of the solute molecule measured in ternary (index t) and binary solutions achieved in each component of the solvent mixture, (in solvent indexed by 1) and (in solvent indexed by 2). The solvents were indexed bearing in mind their contribution to the spectral shifts. This model establishes Equation (5) between the statistical relative average weights, p1 and p2, with p1 + p2 = 1, of the two liquids in the first solvation shell of the spectrally active molecule and the wavenumbers , , and .
Consequently, the average statistic weights p1 and p2 of the two solvents in the first solvation shell of the solute can be calculated using the experimentally determined wavenumbers in the maximum of the visible electronic absorption band in binary solvent solutions for each bulk molar fraction of solvents x1 and x2, with x1 + x2 = 1. Equation (6) between the parameters p1 and p2 and x1 and x2 [32] is established in the statistical cell model of ternary solution:
where w2 − w1 is the difference between the interaction energies in molecular pairs of solute−solvent (1) and solute−solvent (2) types; k is the Boltzmann constant; and T is the absolute temperature. The difference w2 − w1 is difficult to determine by other experimental methods, and the statistical cell model of the ternary solutions can be used for its evaluation, as it results from other spectral studies [36].
4. Results and Discussion
4.1. Computational Analysis
The optimized structure of the iQTCY molecule, obtained by Spartan’14 software [33] with Density Functional EDF2 model [34] and the basis set 6-31G*, is shown in Figure 2.
The ylid bond N+–C− belongs to the plane of the iso-quinolinium heterocycle and the molecular dipole moment makes an angle of about 40° with the ylid bond. The iQTCY molecule possesses an asymmetric carbanion and the vector electric dipole moment is not parallel to the ylid bond as in the case of pyridinium dicarbethoxy methylid (PCCM) with carbanion symmetrically disubstituted, as previously studied [36]. In the case of PCCM, the symmetric carbanion determines the symbiosis effect responsible for the small value of its molecular dipole moment. The symmetric distribution of the electronic charge on the carbanion of the PCCM molecule determines the parallelism between the ylid bond and electric dipole moment.
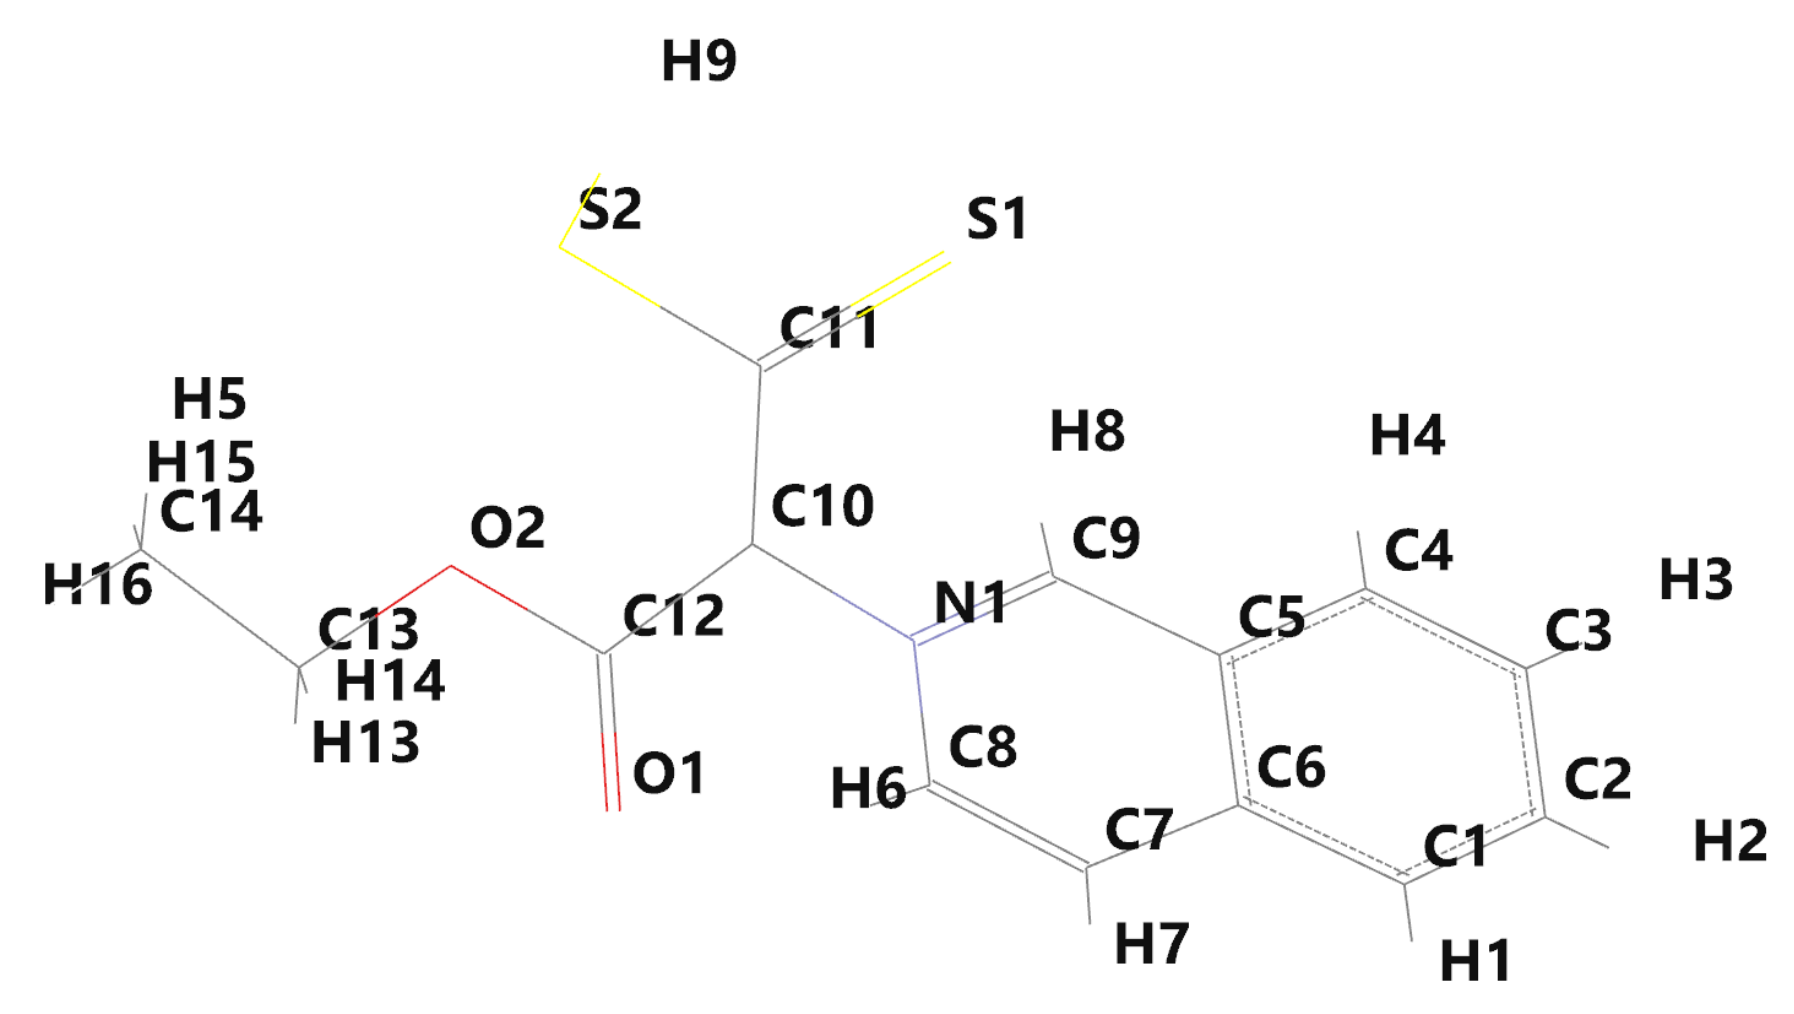
The labels of the molecular atoms are given in Figure 3, while the electronic charges near the molecular atoms [14], computed by Spartan’14, are given in Table 1. A negative value of electronic charge indicates the excess of electrons near an atom, while the positive one shows a deficiency of electrons [39,40].
If one compares the electronic charges of the ylid iQTCY’ bond from Table 1 with those computed for the symmetrically substituted methylid PCCM [36], one can say that a high charge separation is characteristic for the last molecule in which the carbanion hybridization is sp2 and its symmetry can be attributed to the C2v point group of symmetry. In the iQTCY molecule, the carbanion hybridization is between sp2 and sp3, determining a 3D spatial distribution of the molecular atoms.
The separated charges on the ylid bond, C−–N+, give the zwitterionic character of the studied compound. The high dipole moment in the ground electronic state of iQTCY makes possible orientation–induction interactions between the ylid molecule and the solvent molecules. At the same time, the studied ylid has a basic character, being able to receive protons from the solvent molecules in specific interactions of the hydrogen bond type (its HBA count is equal to 4, while 1 is its HBD count in Table 2).
The highest occupied molecular orbital (HOMO) and lowest unoccupied molecular orbital (LUMO) maps of iQTCY are illustrated in Figure 4, together with the electronic levels participating in the spectral transition.
From Figure 4, it can be seen that in the light absorption process, the valence electron cloud shifts from the ylid carbanion toward the heterocycle. Through the intramolecular charge transfer (ICT), the ylid heterocycle is enriched in electrons and the electric dipole moment of the molecule decreases.
Some energetic and electro-optic parameters of iQTCY in the isolated state, water, and ethanol, computed by Spartan’14, are listed in Table 2.
Table 2 shows the results of the good stability of the iQTCY molecule (its energy is high in modulus). The molecule’s polar surface area (PSA) was small enough, showing the ability of the molecule to penetrate both the cell membrane and the blood–brain barrier [41]. The molecule’s ovality (defined as the ratio between the surface of the molecule and the surface of a sphere with the same volume) was 1.44. This value demonstrates that the theory of the solvents’ influence on the wavenumbers in the maxima of the electronic spectra (developed in the hypothesis of spherical molecules [18]) can be applied to the solutions of this molecule. The hydrogen bond acceptor (HBA) count was 4, showing the ability of the ylid to accept protons in the hydrogen bonds in four places, while its HBD was 1, characterizing the ylid’s low donating ability for protons. The ground state dipole moment of the isolated (in vacuum) iQTCY molecule had a considerable value (7.89 D), while for PCCM, the dipole moment was 2.87 D. In hydroxy solvents (water and ethanol), the computed ground state dipole moment increased compared with the isolated state of iQTCY, as shown in Table 2. A considerable increase in the ground state dipole moment was established in [36] for PCCM when this molecule was passed from the isolated state in hydroxy solutions achieved in water and in ethanol.
4.2. Spectral Analysis
The solvent parameters and the wavenumber in the maximum of the visible electronic absorption band of iQTCY are given in Table 3. The electronic absorption band of iQTCY was recorded and they are in good accordance with those from [14], where the solvent parameters can be found.
The spectral data from [14] were verified for all solvents given in Table 3 and used to compute in percent the contribution of each type of interaction taken into consideration in Equation (7) for the binary diluted solutions of iQTCY.
The solvent influence on the visible electronic absorption band of iQTCY can be described by a linear multi-parametric relation of the type (1) [35,36,37,38]. The statistical analysis of the multi-parametric Equation (1) with the data obtained in the quantum chemical computation (Table 2) and solvatochromic data (from Table 3) gives Equation (7).
The value of the multilinear correlation coefficient was R = 0.9195.
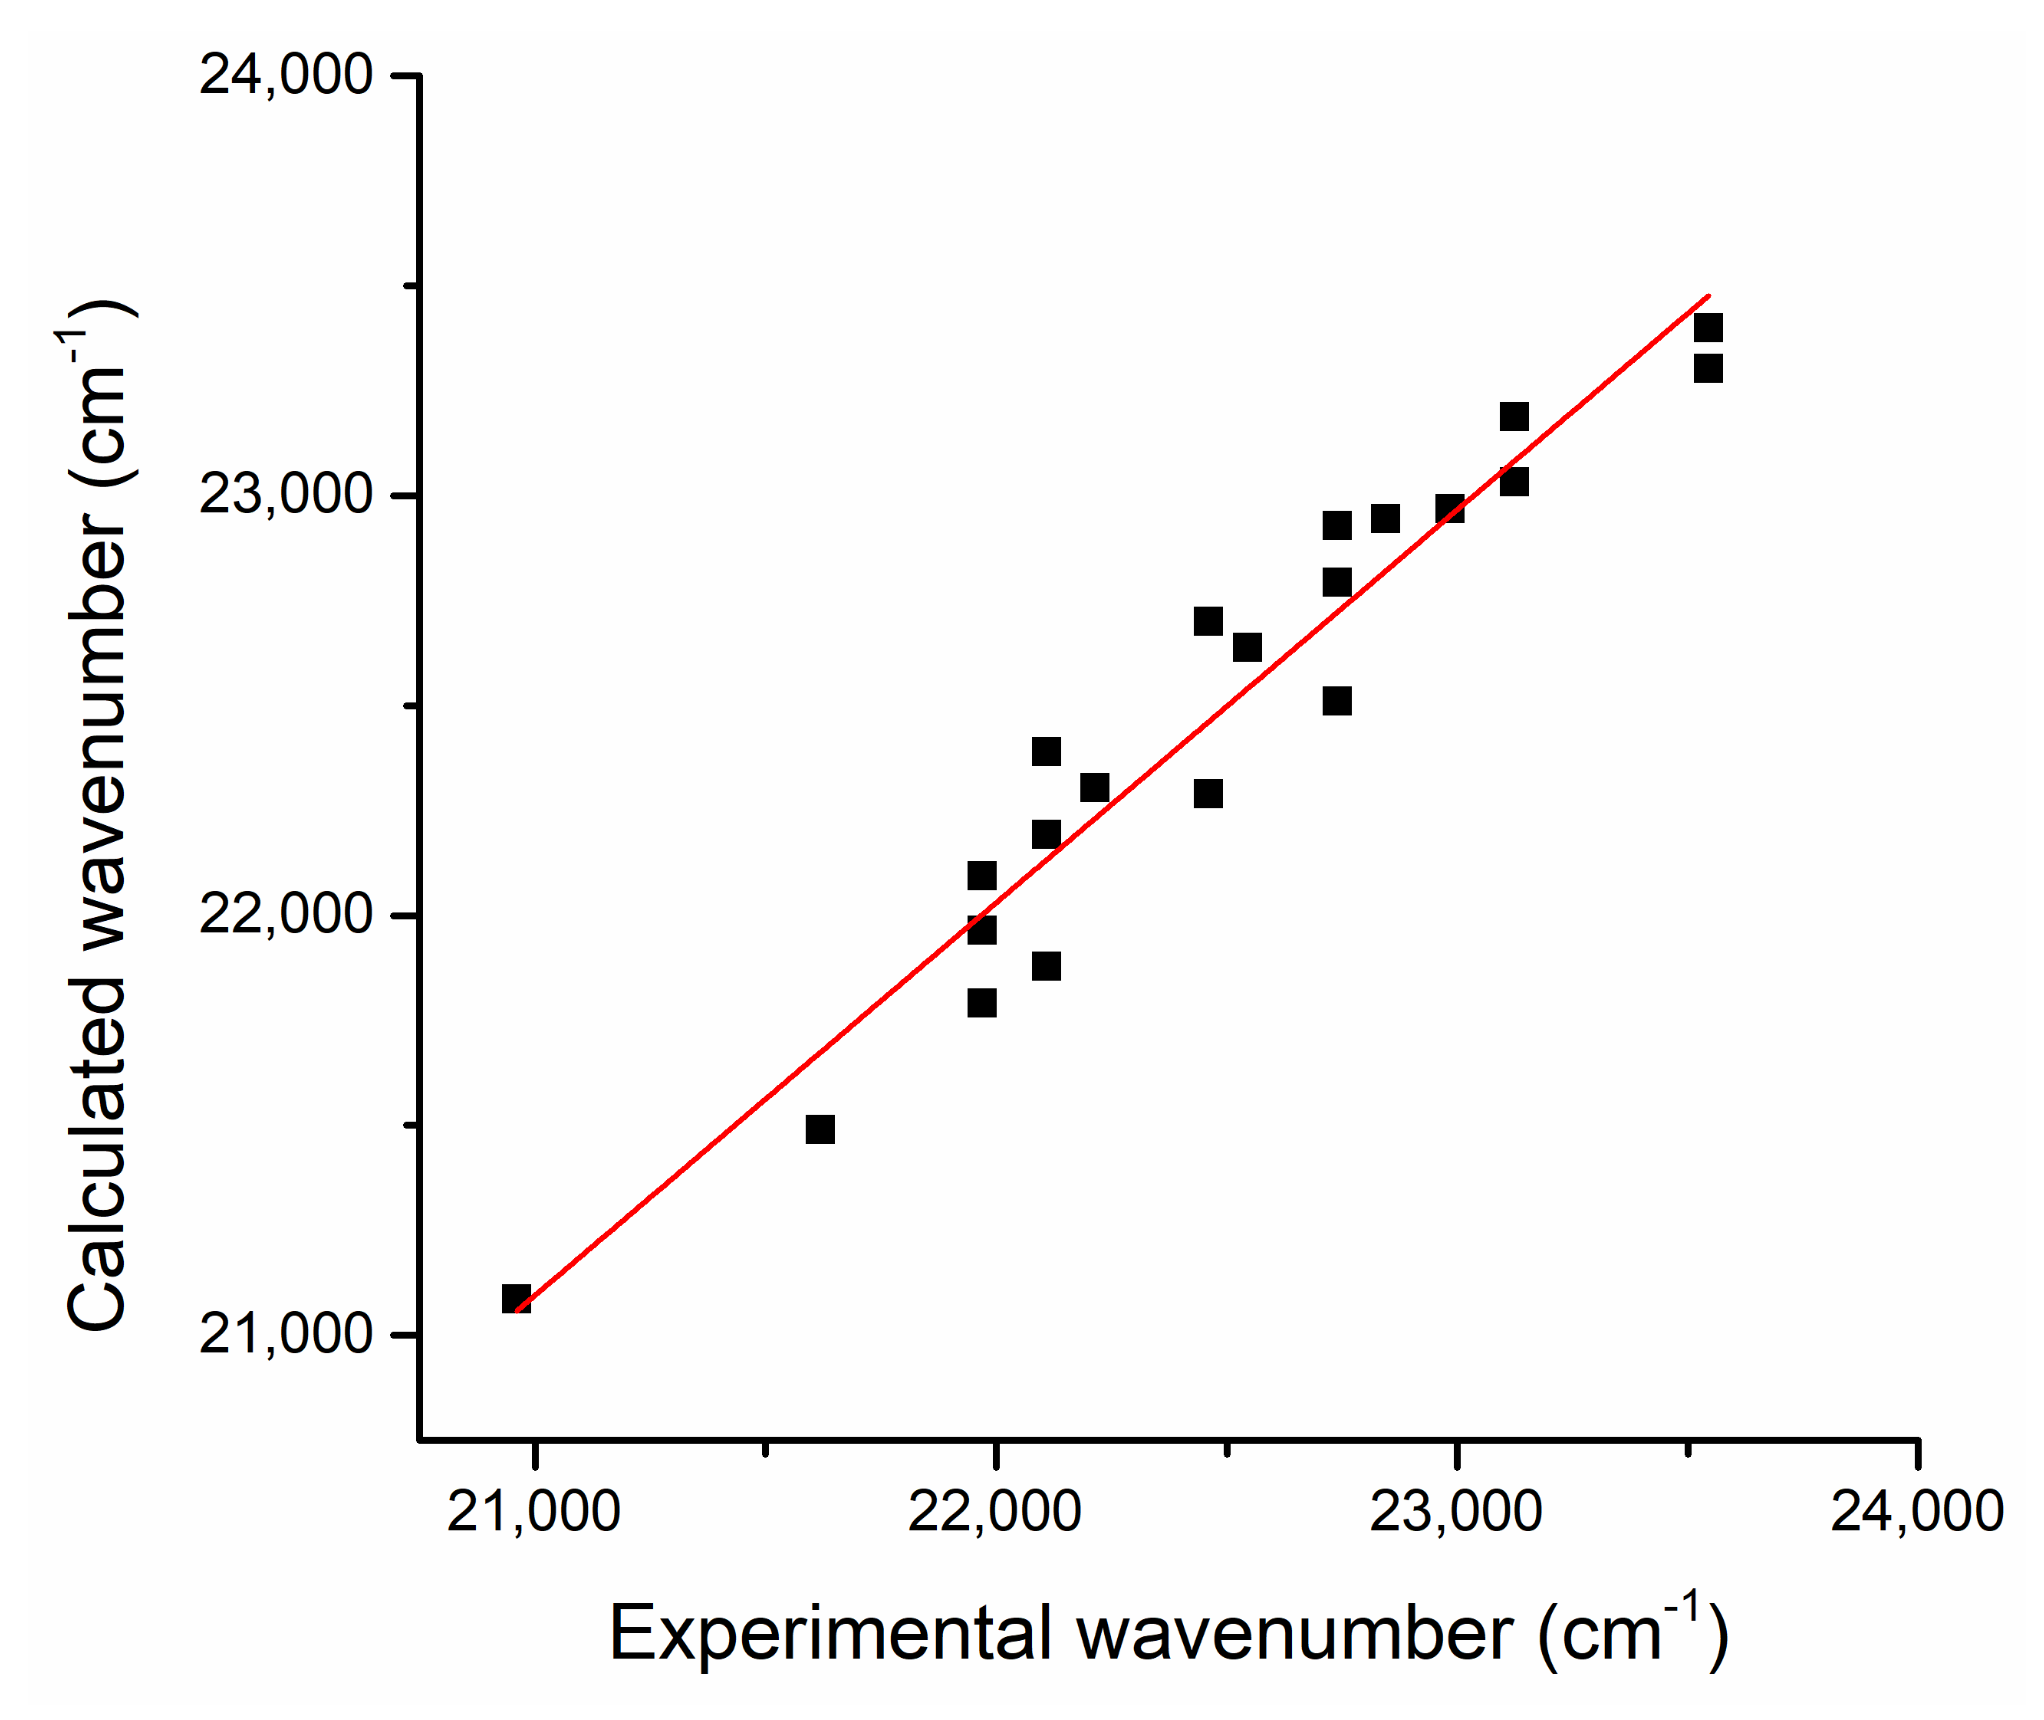
Figure 5 shows the calculated (by Equation (7)) versus experimental wavenumbers corresponding to the maximum of the electronic absorption band (Table 3). A good correlation could be observed, the slope of the linear fit being 0.94, while the linear correlation coefficient had the value R = 0.97.
The values of the regression coefficients C1−C4 from Equation (7) were used to compute the contributions of each type of intermolecular interaction to the total spectral shift of the visible electronic absorption band of iQTCY, given as a percent in Table 3. It can be observed that the orientation–induction interactions were predominant, with a contribution of more than 50% for each of the solvents. The dispersion interactions were important for nonpolar solvents (e.g., 43.70% for benzene), while the specific interactions had a share of 20–25% for alcohols (HBD solvents). The specific interactions with the HBA solvents had the smallest contribution to the spectral shift, as shown in Table 3, in accordance with the small value of the HBD count of iQTCY (see Table 2).
The data related to the statistical cell model of ternary solutions iQTCY + water (1) + ethanol (2) and iQTCY + water (1) + methanol (2) are given in Table 4 and Table 5.
Since the intermolecular interaction energies are proportional to R−6 [42,43,44], where R is the distance between the molecules, in solvatochromism, in the first approximation, only the interactions between the spectrally active molecule and the solvent’s molecules from its first solvation shell are considered. In the case of the ternary solutions, the interaction strengths between the spectrally active molecule and the molecules of the two solvents are different, so the composition of the first solvation shell is different from that of the whole solution. Consequently, to study the shift of the electronic absorption spectral band in such solutions, it is very important to know the composition of the first solvation shell. There are several models [30,31,45,46,47,48] that can be used to estimate this composition.
The statistical cell model of ternary solutions [30,31] consider the system formed by the spectrally active molecule and the solvents’ molecules from its first solvation shell as a thermodynamic macro canonical ensemble, for which the reservoir is the rest of the solution. In such a frame, the model estimates the average statistical weights, p1 and p2, of the two solvents’ molecules in the first solvation shell function of the molecular fractions of the two solvents in the whole solution, x1 and x2, temperature T, and the interaction energies, w1 and w2, in the pairs of molecules solute–solvent (1) and solute–solvent (2), respectively.
The Suppan model of preferential solvation through dielectric enrichment [46] establishes a relation between the ratio of the mole fractions of the two solvents in solution x2/x1 and the ratio of the mole fractions of the two solvents in the first solvation shell p2/p1. This relation allows for the calculation of the mole fraction p1 and p2 by first determining the index of preferential solvation Z [49].
Unlike the statistical cell model and Suppan model, the Bosch–Rosés model takes into consideration the formation of the 1:1 complex between the molecules of the two solvents. Based on the two-step solvent exchange model proposed by Skwierczynski and Connors [50], the Bosch–Rosés model proposes a relation between the charge transfer energy at the solvation ECT and the mole fraction of the second solvent x2 in the whole solution. The nonlinear regression of this equation makes the determination of the mole fractions p1, p2, and p12 of the two solvents and the complex, respectively, possible in the first solvation shell of the solute molecule.
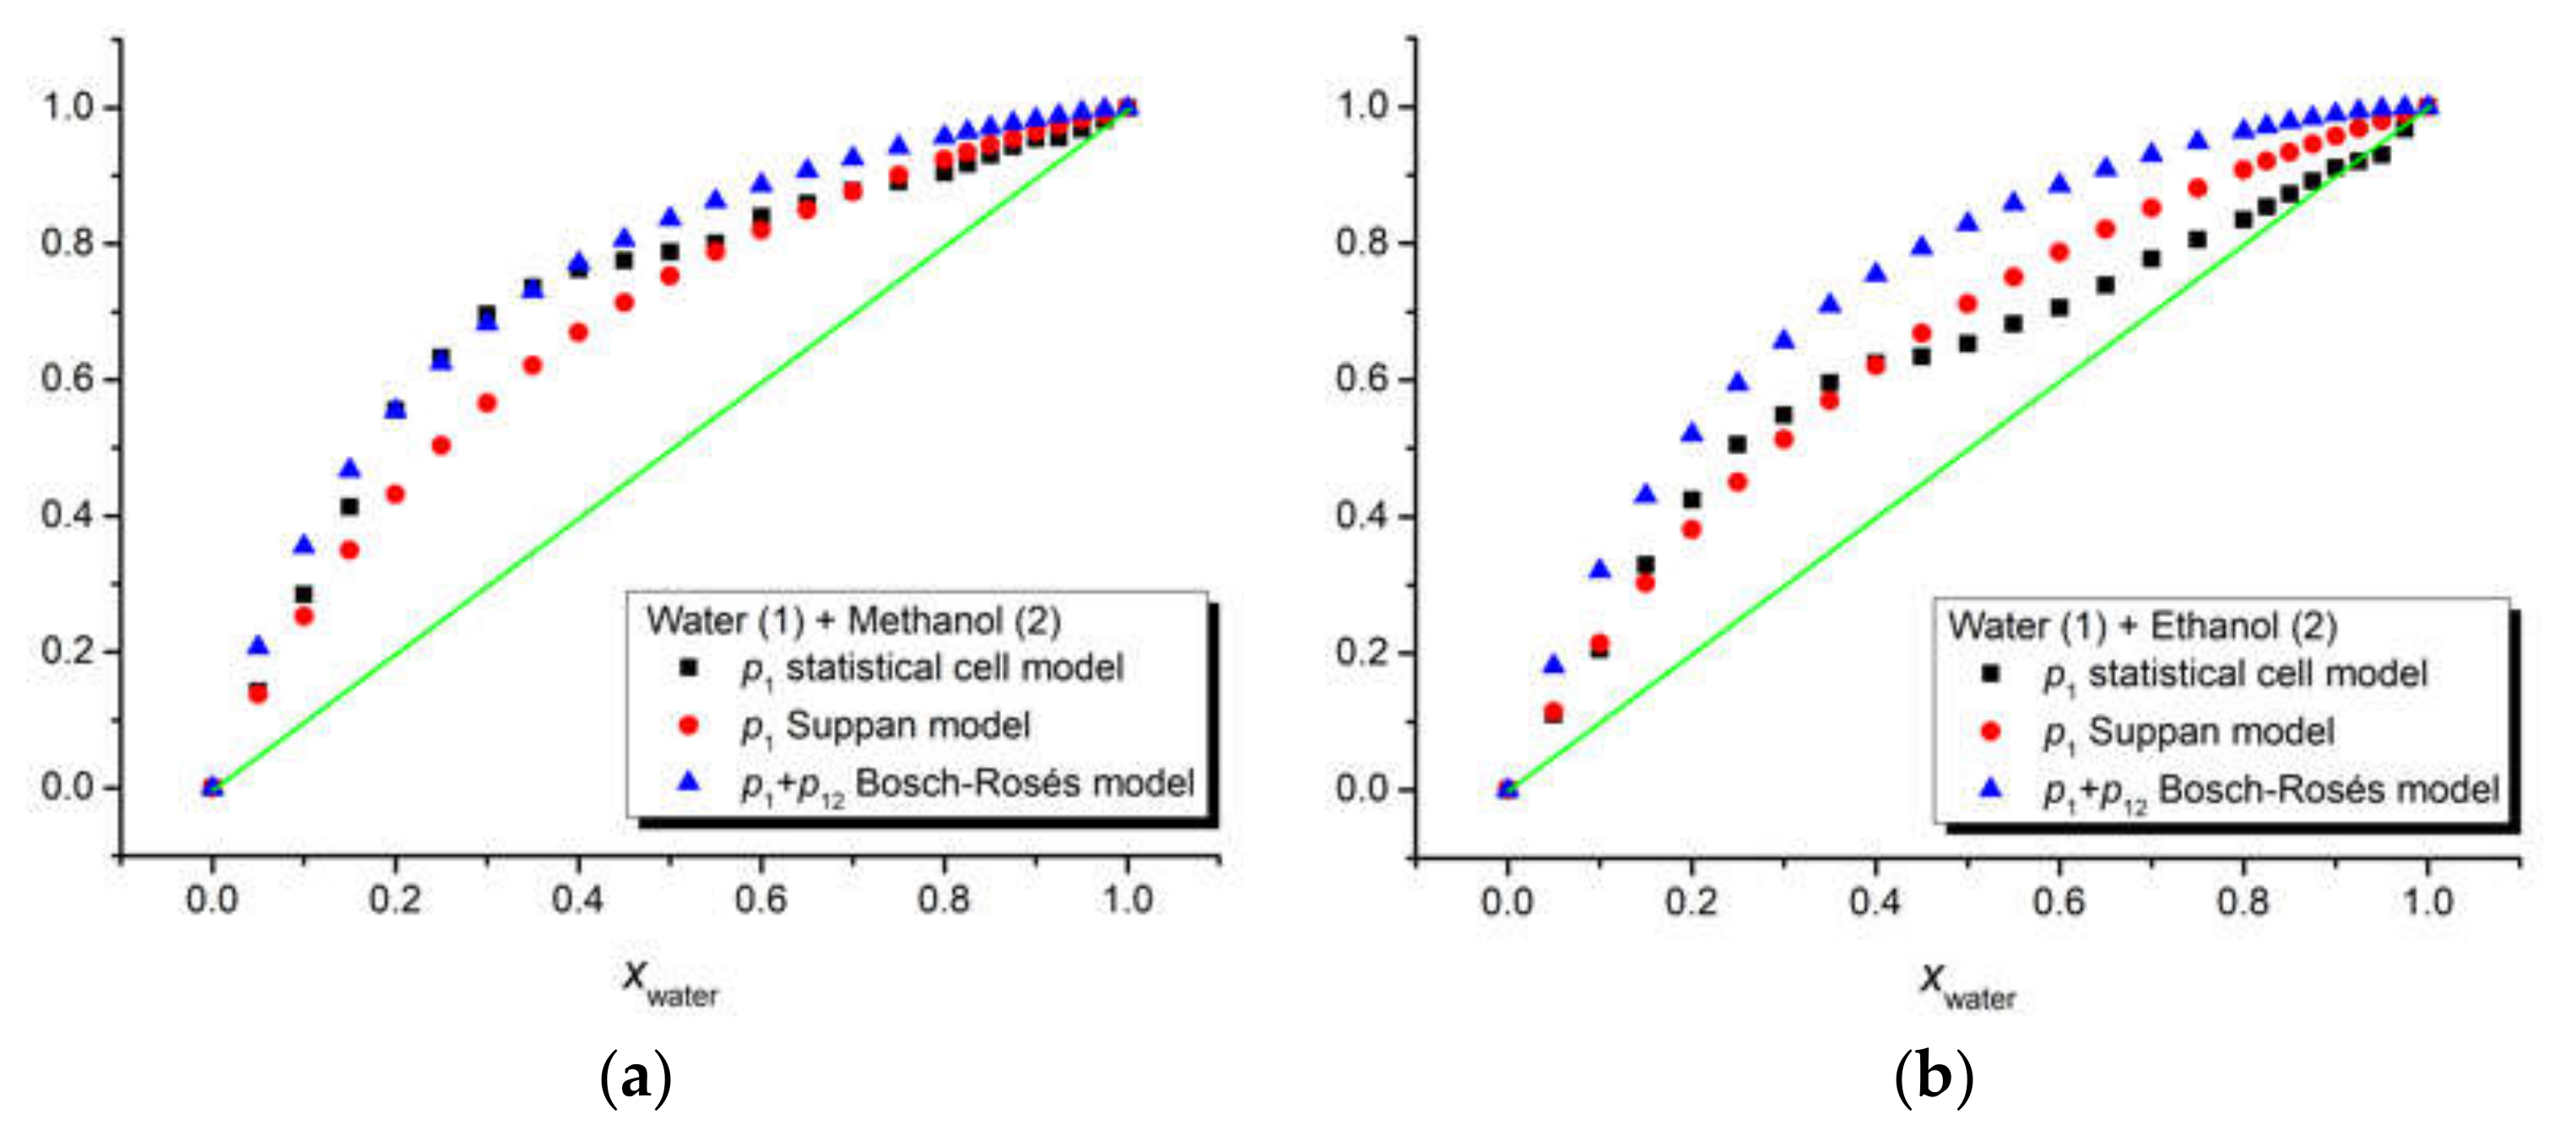
The three above-mentioned models were applied to our ternary solutions iQTCY + water (1) + methanol (2) and iQTCY + water (1) + ethanol (2). The comparative results of the estimation of the first solvation shell’s composition are shown in Figure 6. It can be observed that water was the active solvent (i.e., the water molecules have stronger interactions with the ylid molecules compared with the alcohol molecules). It should be mentioned that, according to the literature [51], in this comparison, the sum p1 + p12 is considered for the Bosch–Rosés model.
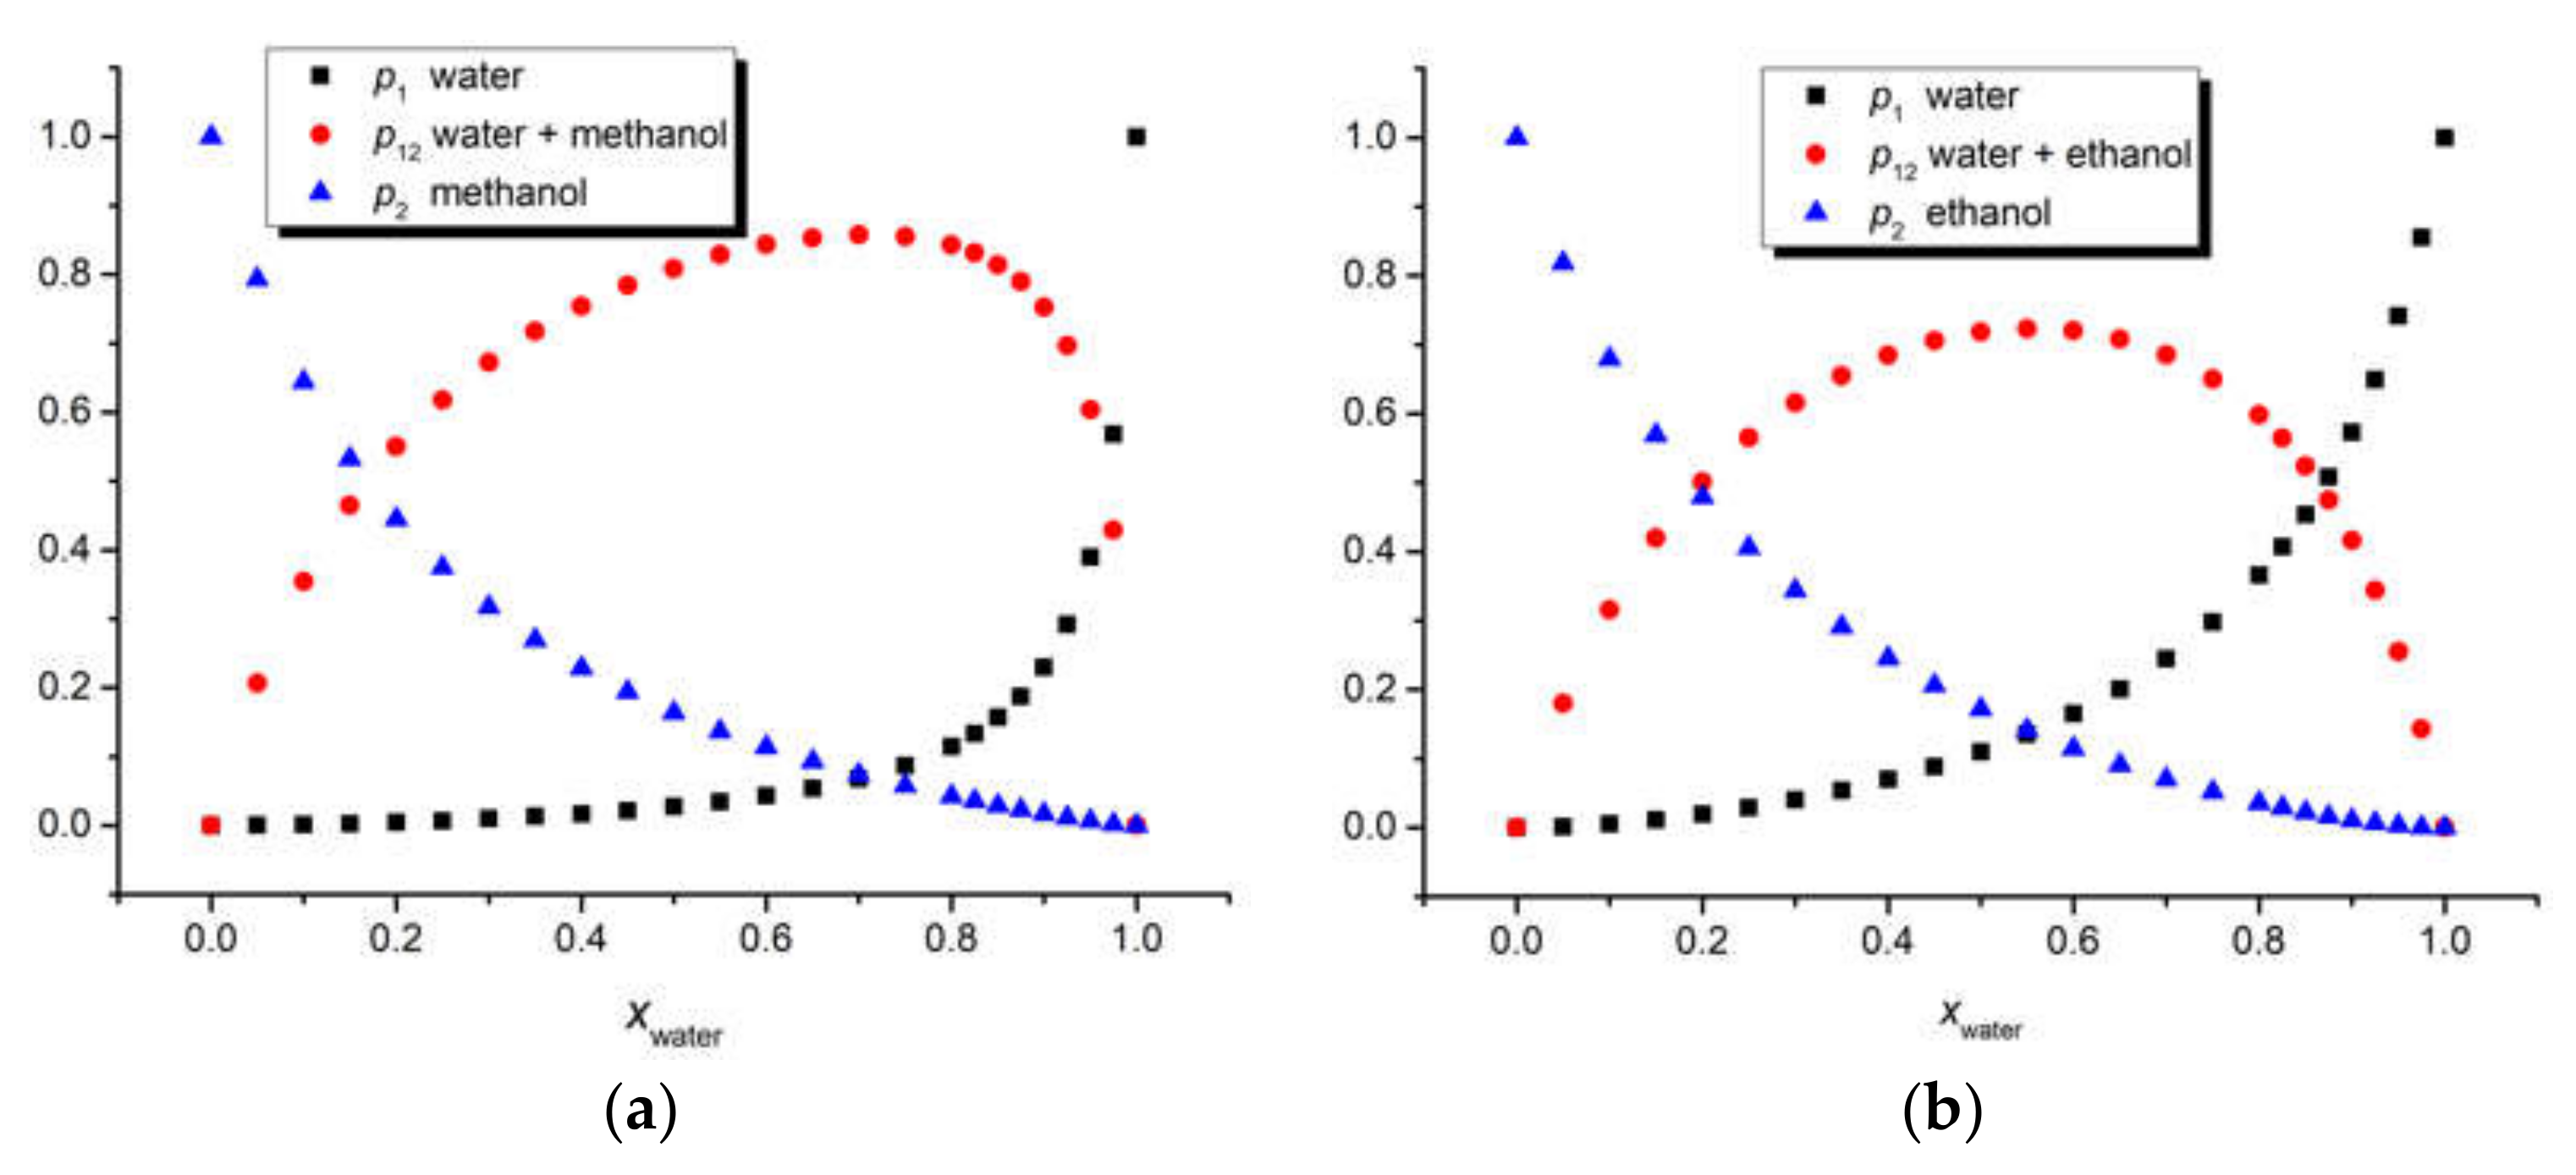
Figure 7 shows the dependence of the mole fractions of the two solvents and of their complex in the first solvation shell of the ylid molecule on the mole fraction of water in the whole solution, demonstrating that the mole fraction of the complex is not negligible at all, even being dominant for a large intermediate interval of the mole fractions of solvents in the whole solution.
The data related to the statistical cell model of ternary solutions iQTCY + water (1) + ethanol (2) and iQTCY + water (1) + methanol (2) are presented in Table 4 and Table 5.
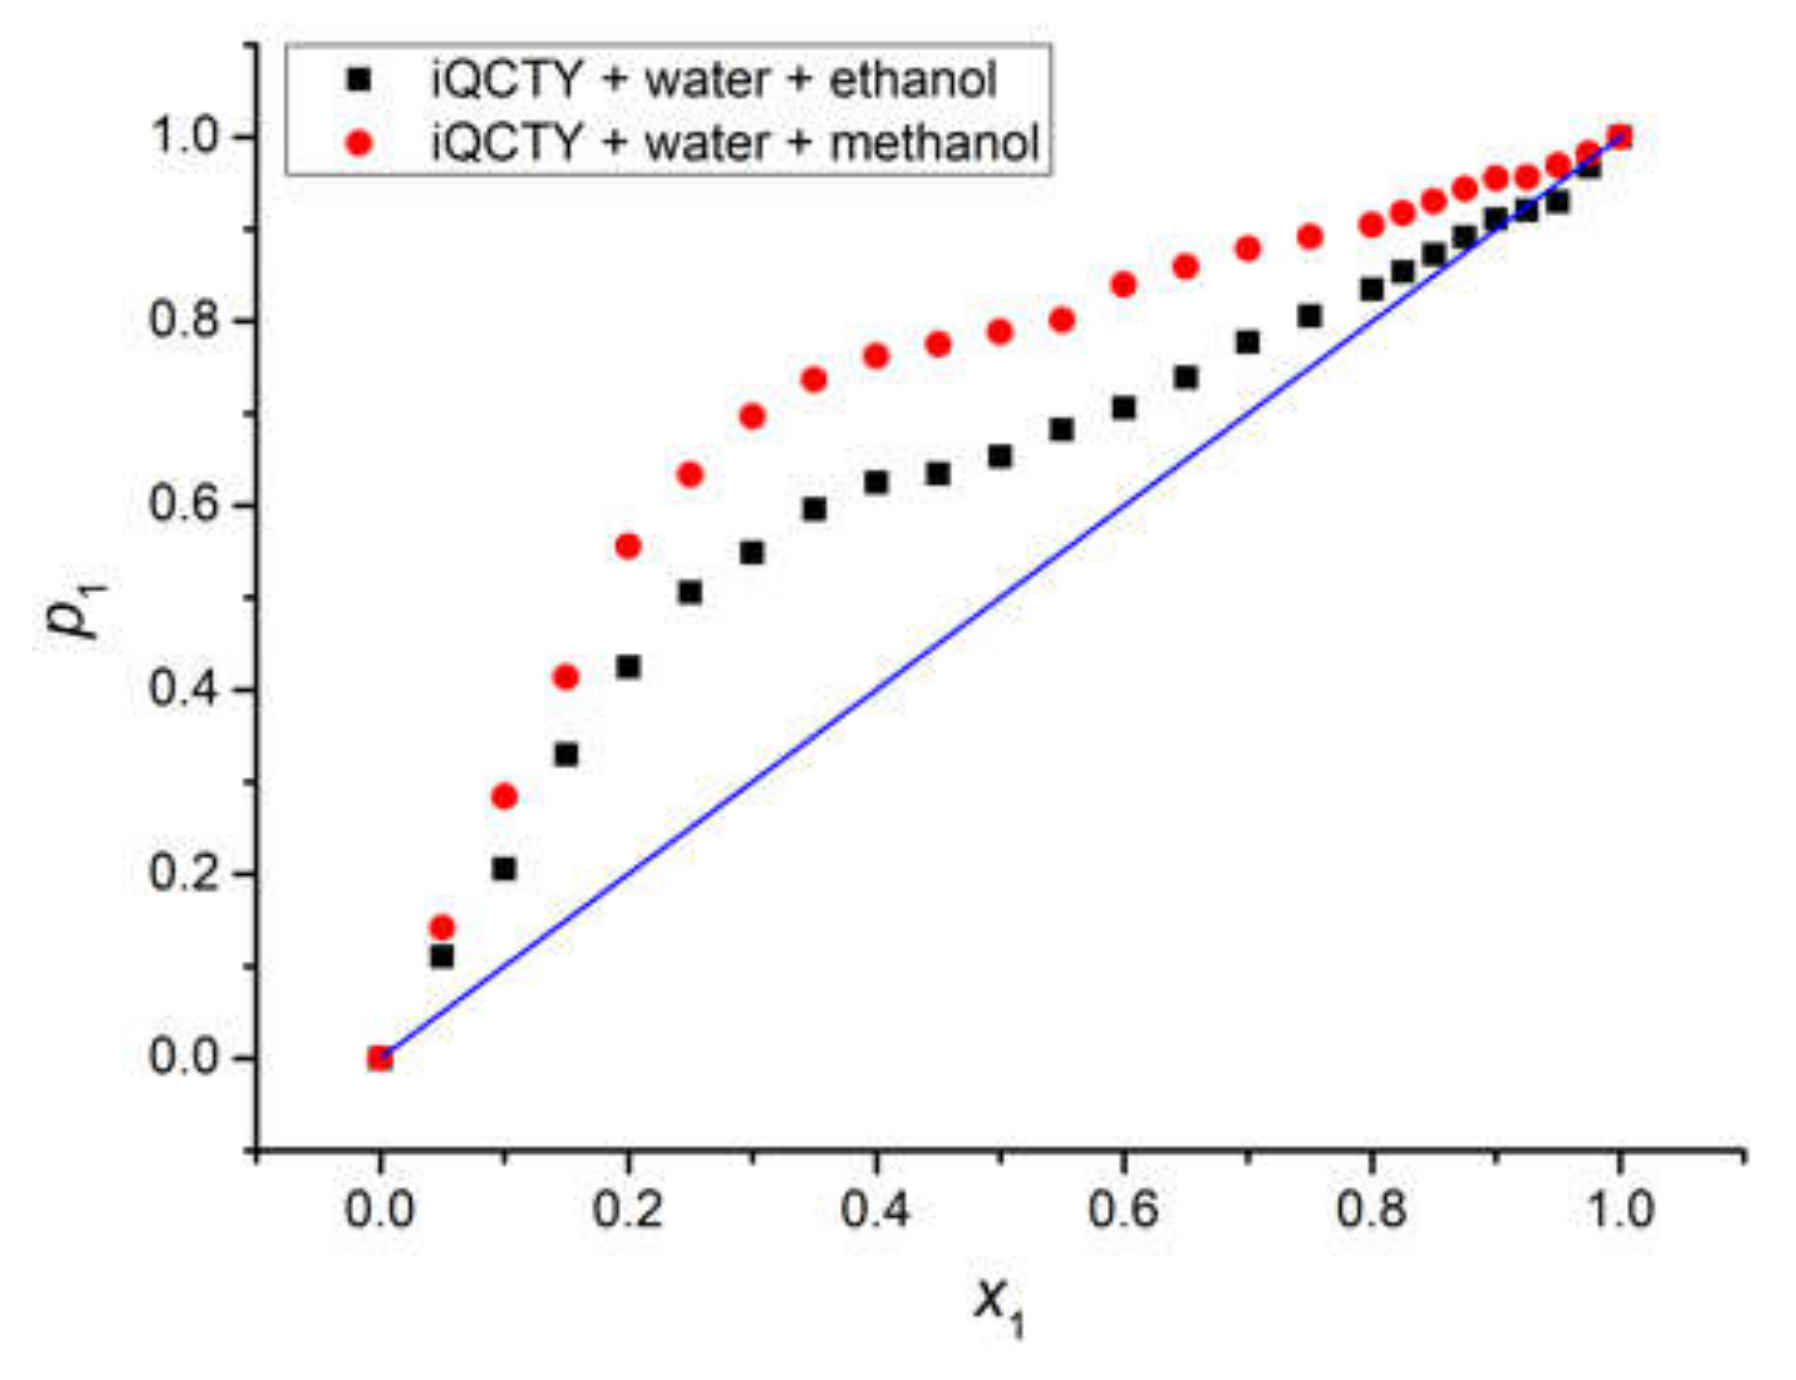
The graphical representation of p1 versus x1 for the water in the two binary solvents, shown in Figure 8, clearly emphasizes that water was the active solvent, while the alcohols were less active solvents, since p1 was higher than x1. The average statistic weight of methanol, p2, in the first solvation shell of the iQTCY molecule was smaller than that of ethanol, showing that ethanol was more active than methanol from the intermolecular interaction point of view.
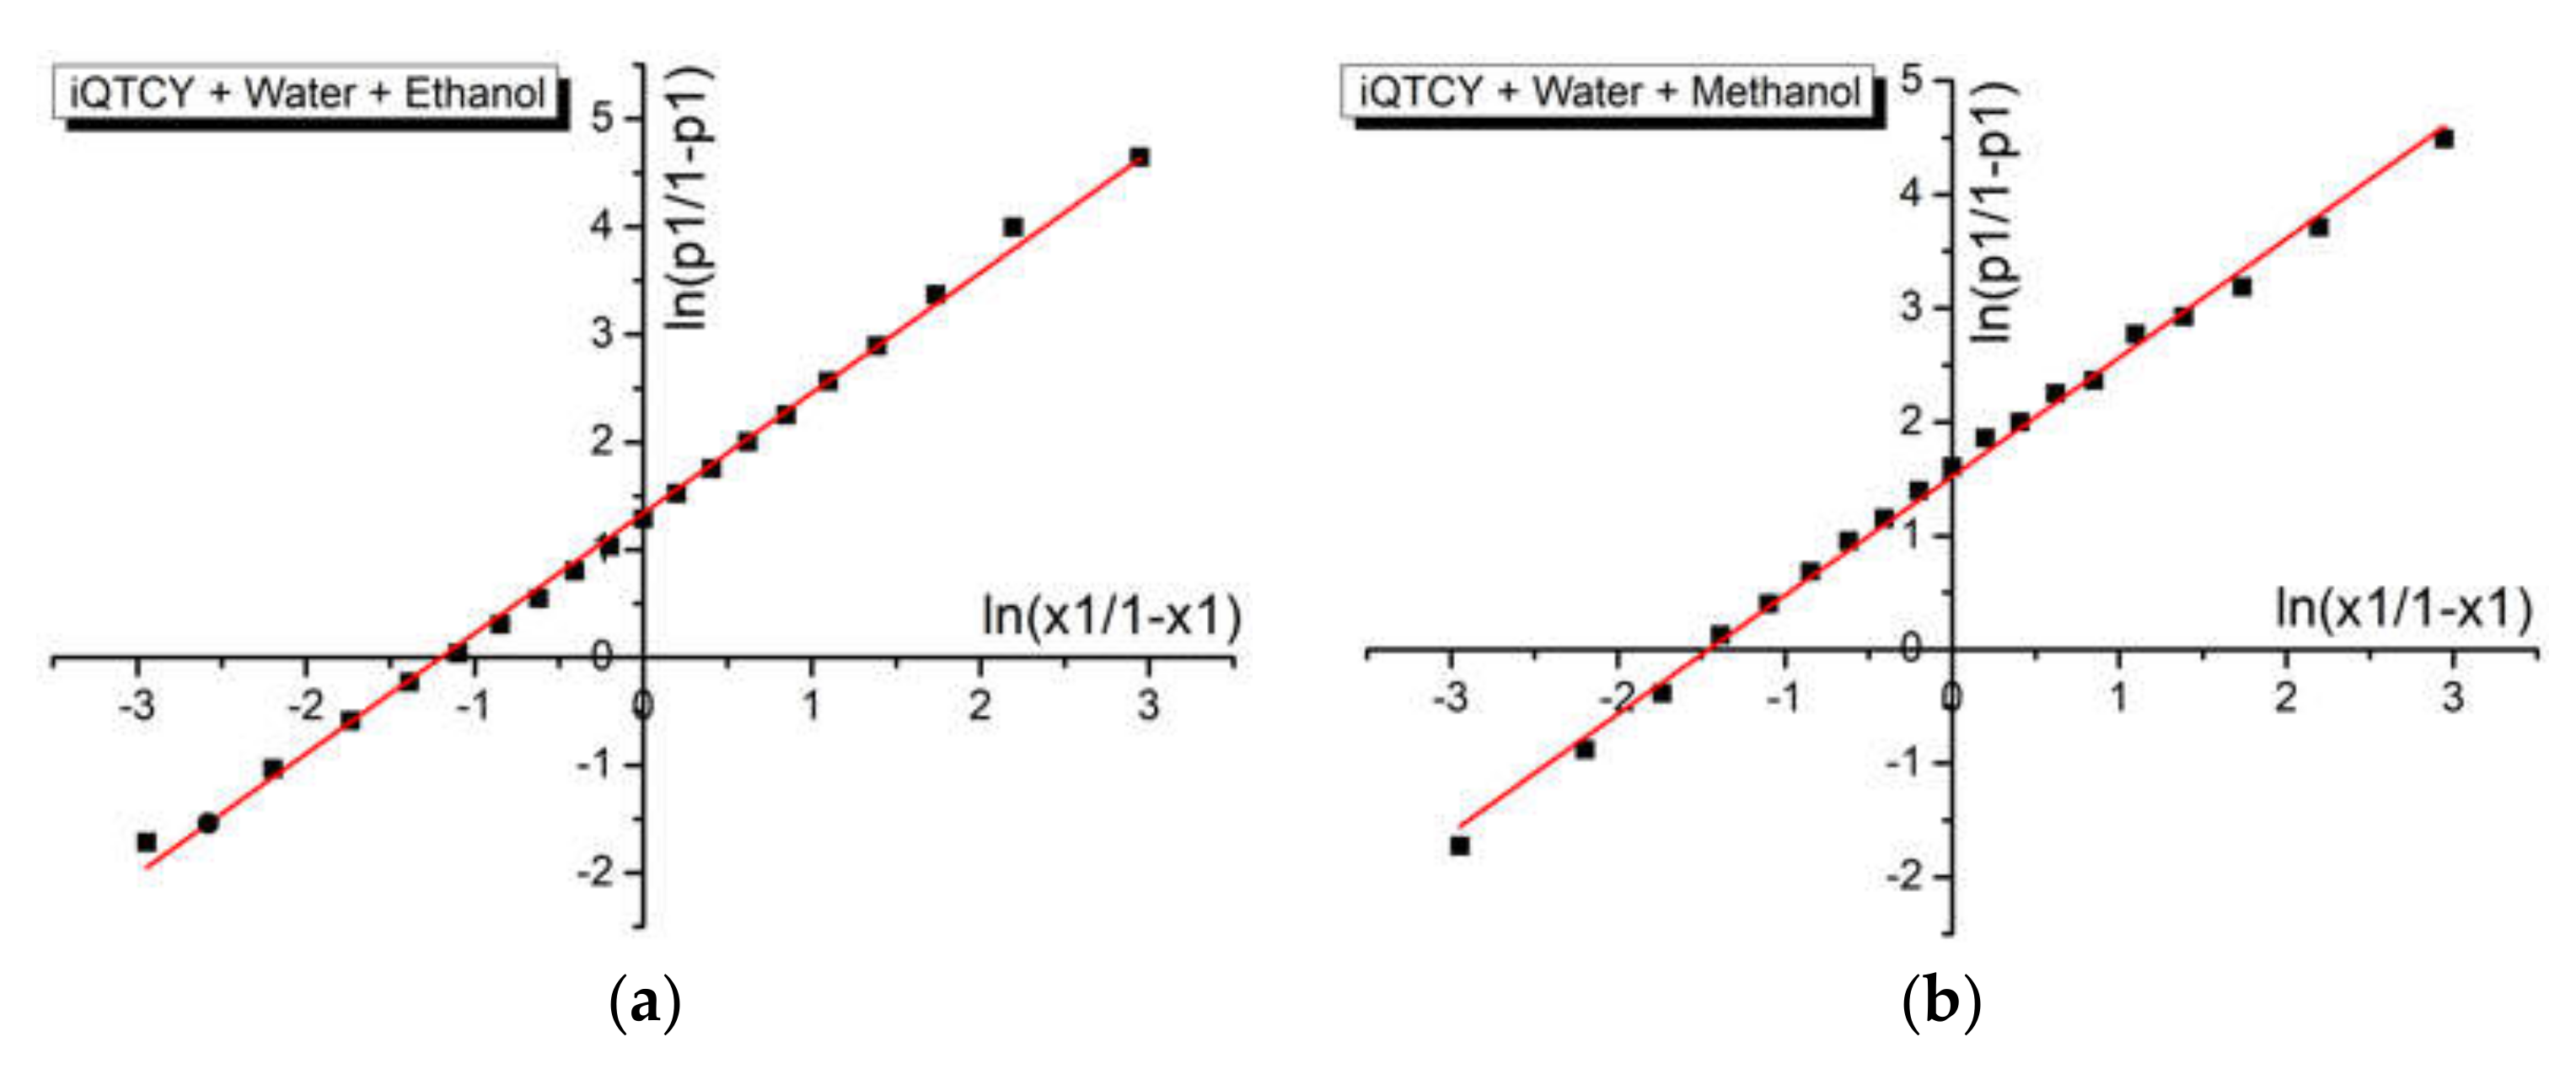
Figure 9 shows the graphical representation of data described by Equation (4) for the binary solvent mixtures water + ethanol and water + methanol, respectively. The linear fitting of these graphs allows for the estimation of the difference between the interaction’s energies in molecular pairs of the types of ylid–water and ylid–alcohol. The results are shown in Table 6. There was good agreement between these results and those previously obtained for protic binary solvents [52,53] and similar zwitterionic spectrally active molecules.
Good values for the linear correlation coefficient (R = 0.997 for water + ethanol and R = 0.996 for water + methanol, see Table 6) were obtained for both sets of ternary solutions.
As Equation (4) establishes, the intercept approximates the difference w2 − w1 between the interaction energies in molecular pairs of the types: iQTCY–water (1) and iQTCY–alcohol (2): where it was higher in the binary solvent water–methanol than in water–ethanol.
4.3. Excited State Dipole Moment of 1-Dithiocarboxy-2-ethoxy-1-(isoquinolin-2-yl)-2-oxoethan-1-ylid Determined by Variational Method
The values of the parameters C1 and C2 from Equations (1)–(3) are given in Equation (7). The ionization potential of cyclohexane was used in the computations due to its very small contribution to the orientation–induction interactions.
By using the sum C1 + C2 and the values of parameters C1 and C2 from Equation (7), and the molecular parameters of iQTCY from Table 2, Equation (8) can be obtained:
αe = 70.8900 − 0.1271μe2.
In Equation (2), the parameters are introduced by their values; using Equation (8), one obtains:
0.0154μe2 − 15.78μe cosφ + 114.2698 = 0.
The denominator of Equation (9) is:
Δ = 249.0084cos2φ − 7.0390.
Equation (9) has real solutions for the positive values of Δ and for the values of the angle φ smaller than 80.32°. The solutions of Equation (9) depend on the value of cosφ:
To obtain information about the excited state dipole moment in the superior electronic state of the ICT transition responsible for the visible absorption band appearance, the variational method was applied. The angle φ was varied in the range [0°–80.89°]. The dipole moment and the polarizability of the excited state of the ICT transition were computed based on Equations (11) and (8). The results of the computations are listed in Table 7.
For the angle φ equal to 20.3°, the electric polarizability in the excited state of iQTCY equalizes the ground state polarizability. In accordance with the McRae supposition, for this value of φ, the visible photon absorption is realized. This fact can be demonstrated if one separates the contributions based only the dipole moment variation and those due to the electric polarization variation.
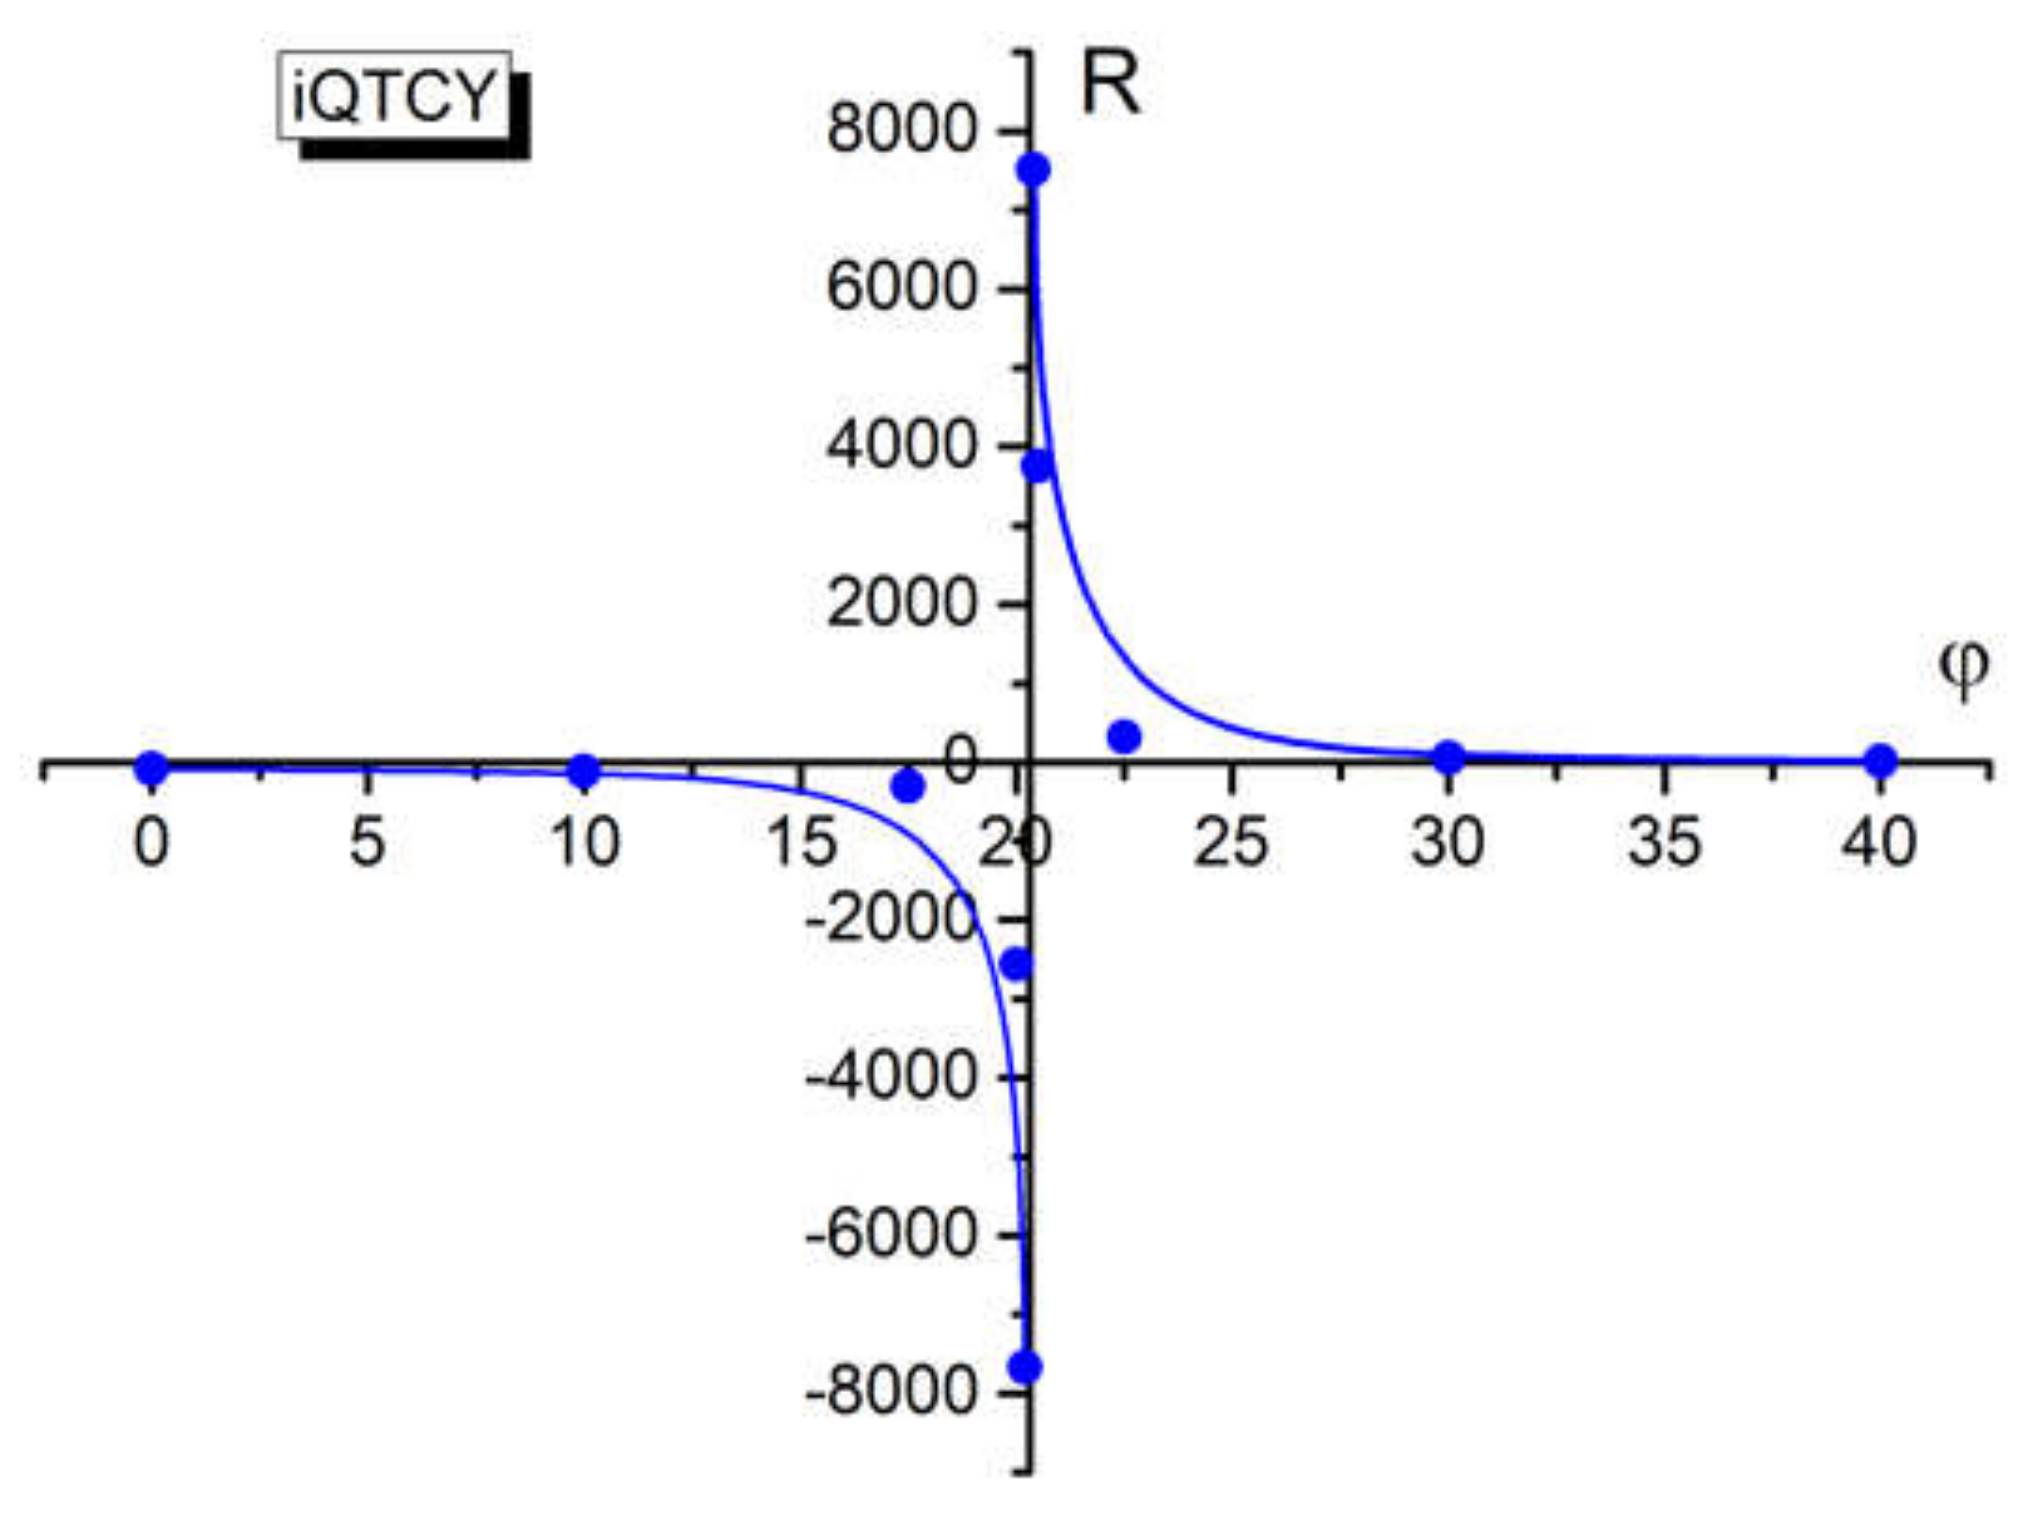
The ratio R between these terms of C1, defined by Equation (14), supports a discontinuity near the angle 20.3° (angle for which the excited state polarizability equalizes the ground state polarizability of the studied molecule and the difference αg − αe changes its sign), as can be seen from Table 7 and Figure 10. The discontinuity in the graph R vs. φ suggests an electronic discontinuity between the two electronic states participating in the absorption process.
By using the values of the dipole moment in the ground state, (7.89 D) and in the first excited state of ylid (7.78 D) and the angle φ determined in the McRae hypothesis (that the photon absorption takes place when the excited state polarizability equalizes the ground state polarizability of the ylid molecule), one can determine the dipole moment variation in the absorption process (2.76 D).
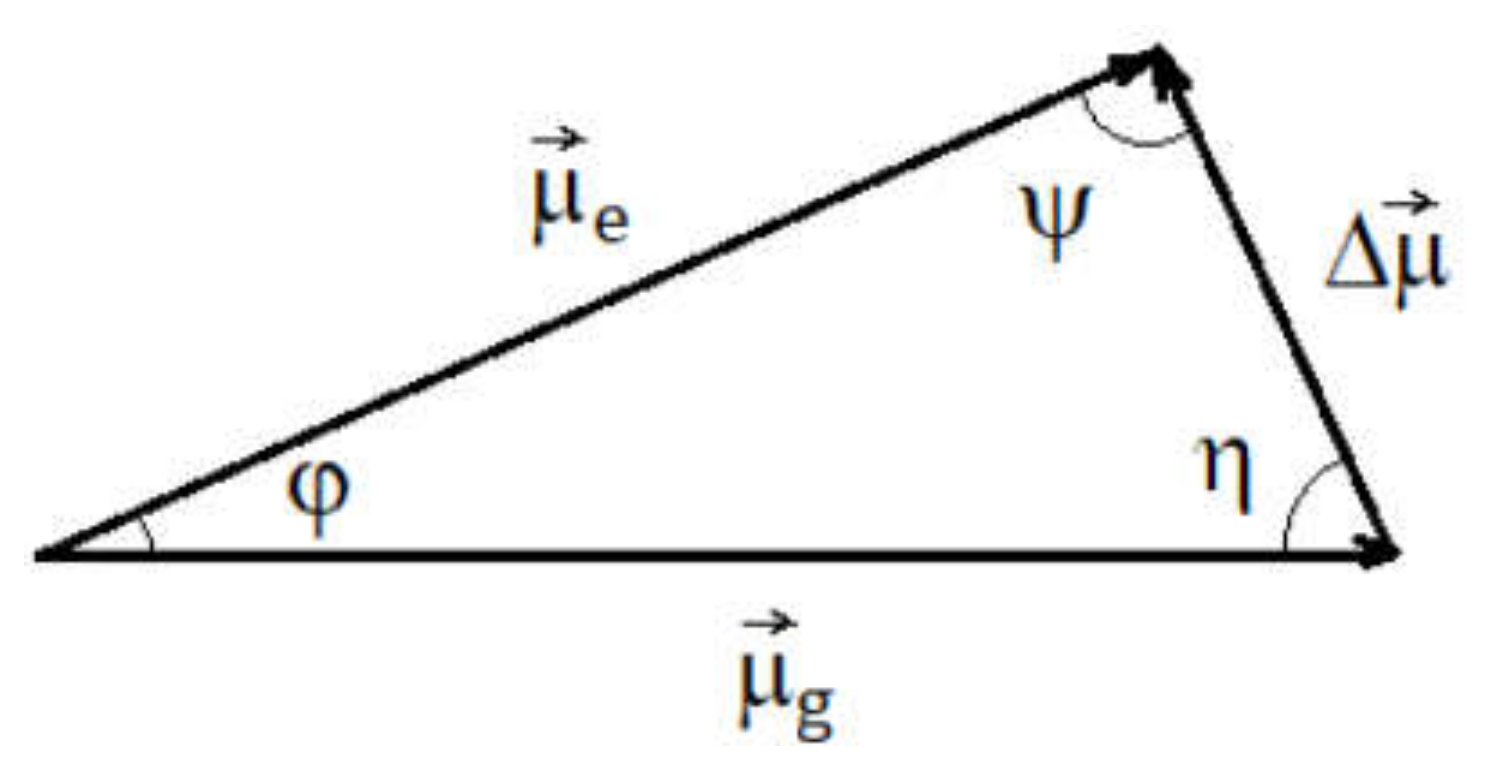
The value of the variation in the molecular dipole moment in the absorption process was obtained by solving the triangle of the electric dipole moments of iQTCY corresponding to the electronic states participating in the ICT (see Figure 11).
One results the values ψ = 82.09 and η = 77.61 and Δμ = 2.76 D. The values obtained in this paragraph demonstrate the decrease in polarity of iQTCY by absorption in the visible range.
5. Conclusions
1-Dithiocarboxy-2-ethoxy-1-(isoquinolin-2-yl)-2-oxoethan-1-ylid was investigated through quantum-chemical modeling and visible electronic absorption spectroscopy. The computational approach allowed for the determination of some characteristic parameters of the molecule. Additionally, the HOMO and LUMO maps demonstrated the internal charge transfer, which is at the origin of the recorded electronic absorption spectral band. Through solvatochromic study performed in binary solutions, the contributions of each type of intermolecular interactions to the total spectral shift of the visible electronic absorption band of iQTCY were estimated, revealing the prevalence of the orientation–induction interactions in all of the binary solutions as well as the increase in the contribution of specific interactions for protic solvents.
The average statistical weights of the solvents in the first solvation shell were comparatively estimated by the analysis of ternary solutions iQTCY + water + ethanol/methanol, in the frame of three theoretical models, and the heterogeneity of the first solvation shell of ylid and the prevalence of water molecule inside it was demonstrated. The statistical cell model of the ternary solutions allowed for the estimation of the difference between the interaction energies in the molecular pairs of the types of ylid–water and ylid–alcohol.
The excited state dipole moment of iQTCY was estimated by a variational method, based on the McRae hypothesis that the electric polarizability does not vary in the visible photon absorption process. The decrease in the value of the electric dipole moment in the absorption process is attested by the increase in the wavenumber value of the ICT band in the dipolar solvents compared with those that were nonpolar.
Author Contributions
Conceptualization, D.O.D. and D.G.D.; Methodology, D.E.C.; Software, D.G.D., D.E.C. and D.O.D.; Validation, D.G.D. and D.O.D.; Formal analysis, D.E.C.; Investigation, D.O.D. and D.E.C.; Resources, D.O.D.; Data curation, D.E.C.; Writing—original draft preparation, D.O.D.; Writing—review and editing, D.O.D.; Visualization, D.G.D.; Supervision, D.O.D. and D.E.C.; Project administration, D.O.D.; Funding acquisition, not applicable. All authors have read and agreed to the published version of the manuscript.
Funding
This research received no external funding.
Institutional Review Board Statement
Not applicable.
Informed Consent Statement
Not applicable.
Data Availability Statement
The data presented in this study are available on request from the corresponding author.
Conflicts of Interest
The authors declare no conflict of interest.
References
- Johnson, A.W. Ylid Chemistry; Academic Press: New York, NY, USA, 1966. [Google Scholar]
- Henrick, C.A.; Ritchie, E.; Taylor, W.C. Pyridinium ylids in synthesis. I. Alkylation of ylids and synthesis of ketones and acids. Aust. J. Chem. 1967, 20, 2441–2453. [Google Scholar] [CrossRef]
- Zugravescu, I.; Petrovanu, M. N-Ylid Chemistry; McGraw Hill: New York, NY, USA, 1976. [Google Scholar]
- Sun, J.; Shen, G.; Huang, Y.; Yan, C.G. Formation of diverse polycyclic spirooxindoles via three-component reaction of isoquinolinium salts, isatins and malononitrile. Sci. Rep. 2017, 7, 41024. [Google Scholar] [CrossRef] [PubMed] [Green Version]
- Seifi, M.; Ebrahimipour, S.Y.; Simpson, J.; Dusek, M.; Eigner, V.; Sheibani, H. Combination of pyridinium and isoquinolinium ylides with phenylisocyanate and isothiocyanates: Synthesis, characterization, and X-Ray crystal structures of mesoionic monosubstituted 3-oxo-propanamides or thioamides. Aust. J. Chem. 2015, 68, 1577–1582. [Google Scholar] [CrossRef]
- Sar, S.; Guha, S.; Prabakar, T.; Maiti, D.; Sen, S. Blue light-emitting diode-mediated in situ generation of pyridinium and isoquinolinium ylides from aryl diazoesters: Their application in the synthesis of diverse dihydroindolizine. J. Org. Chem. 2021, 86, 11736–11747. [Google Scholar] [CrossRef]
- Silyanova, E.A.; Samet, A.V.; Semenov, V.V. A two-step approach to a hexacyclic lamellarin core via 1,3-dipolar cycloaddition of isoquinolinium ylides to nitrostilbenes. J. Org. Chem. 2022, 87, 6444–6453. [Google Scholar] [CrossRef]
- Khan, A.Y.; Kumar, G.S. Natural isoquinoline alkaloids: Binding aspects to functional proteins, serum albumins, hemoglobin, and lysozyme. Biophys. Rev. 2015, 7, 407–420. [Google Scholar] [CrossRef] [Green Version]
- Amma, R.A.; Thakur, S.N.; Nair, K.P.R. Infrared and electronic absorption spectra of isoquinoline. Appl. Spectrosc. 1970, 24, 344–347. [Google Scholar] [CrossRef]
- Mataga, N. Electronic spectra of quinoline and isoquinoline and the mechanism of fluorescence quenching in these molecules. Bull. Chem. Soc. Jpn. 1958, 31, 459–462. [Google Scholar] [CrossRef] [Green Version]
- Khalid, M.; Ullah, M.A.; Adeel, M.; Khan, M.U.; Tahir, M.N.; Braga, A.A.C. Synthesis, crystal structure analysis, spectral IR, UV–Vis, NMR assessments, electronic and nonlinear optical properties of potent quinoline based derivatives: Interplay of experimental and DFT study. J. Saudi Chem. Soc. 2019, 23, 546–560. [Google Scholar] [CrossRef]
- Dos Santos, G.C.; Servilha, R.O.; de Oliveira, E.F.; Lavarda, F.C.; Ximenes, V.F.; da Silva-Filho, L.C. Theoretical-experimental photophysical investigations of the solvent effect on the properties of green- and blue-light-emitting quinoline derivatives. J. Fluoresc. 2017, 27, 1709–1720. [Google Scholar] [CrossRef] [Green Version]
- Fernandes, R.F.; Stroppa, P.H.F.; Ferreira, G.R.; da Silva, A.D.; Edwards, H.G.M.; de Oliveira, L.F.C. Vibrational spectroscopic study of some quinoline derivatives. Vib. Spectrosc. 2016, 86, 128–133. [Google Scholar] [CrossRef]
- Babusca, D.; Morosanu, A.C.; Dimitriu, D.G.; Dorohoi, D.O.; Cheptea, C. Spectroscopic and quantum-chemical study of molecular interactions of iso-quinolinium ylids in polar solutions. Mol. Cryst. Liq. Cryst. 2020, 698, 87–97. [Google Scholar] [CrossRef]
- Dorohoi, D. Electronic Spectra of N-Ylids. J. Mol. Struct. 2004, 704, 31–43. [Google Scholar] [CrossRef]
- Pawda, A. 1,3-Dipolar Cycloaddition Chemistry; Wiley Interscience: New York, NY, USA, 1984. [Google Scholar]
- Petrovanu, M.; Zugravescu, I. Cycloaddition Reactions; Romanian Academy Publishing House: Bucuresti, Romania, 1997. [Google Scholar]
- McRae, E.G. Theory of solvent effects on molecular electronic spectra. Frequency shifts. J. Phys. Chem. 1957, 61, 562–572. [Google Scholar] [CrossRef]
- Abe, T. Theory of solvent effects on molecular electronic spectra. Frequency shifts. Bull. Chem. Soc. Jpn. 1965, 38, 1314–1318. [Google Scholar] [CrossRef] [Green Version]
- Kamlet, M.J.; Abboud, J.L.M.; Abraham, M.H.; Taft, R.W. Linear solvation energy relationships. 23. A comprehensive collection of the solvatochromic parameters, π*, α and β, and some methods for simplifying the generalized solvatochromic equation. J. Org. Chem. 1983, 48, 2877–2887. [Google Scholar] [CrossRef]
- Hossain, A.; Roy, S. Solubility and solute-solvent interactions of DL-alanine and DL-serine in aqueous potassium nitrate solutions. J. Mol. Liq. 2018, 249, 1133–1137. [Google Scholar] [CrossRef]
- Chamma, A.; Viallet, P. Determination du moment dipolaire d’une molécule dans un état excité singulet: Application à l’indole, au benzimidazole et à l’indazole. C.R. Acad. Sci. Paris Ser. C. 1970, 270, 1901–1904. [Google Scholar]
- Zakerhamidi, M.S.; Ghanadzadeh, A.; Moghadam, M. Intramolecular and intermolecular hydrogen-bonding effects on the dipole moments and photophysical properties of some anthraquinone dyes. Spectrochim. Acta A 2011, 79, 74–81. [Google Scholar] [CrossRef]
- Patil, S.K.; Wari, M.N.; Yohannan Panicker, C.; Inamdar, S.R. Solvatochromic study of coumarin 545 in alcohols for the determination of ground and excited state dipole moments. Int. J. Adv. Res. 2013, 1, 616–626. [Google Scholar]
- Thipperudrappa, J. Analysis of solvatochromism of a biologically active ketocyanine due using different solvent polarity scales and estimation of dipole moments. Int. J. Life Sci. Pharma Res. 2014, 4, L-1–L-11. [Google Scholar]
- Zakerhamidi, M.S.; Sorkhabi, S.G.; Shamkhali, A.N. Polar and low polar solvents media effect on dipole moments of some diazo Sudan dyes. Spectrochim. Acta A 2014, 127, 340–348. [Google Scholar] [CrossRef] [PubMed]
- Gahlaut, R.; Tewari, N.; Bridhkoti, J.P.; Joshi, N.K.; Joshi, H.C.; Pant, S. Determination of ground and excited state dipole moments of some naphthols using solvatochromic shift method. J. Mol. Liq. 2011, 163, 141–146. [Google Scholar] [CrossRef]
- Dorohoi, D.O. Excited state molecular parameters determined by spectral means. Ukr. J. Phys. 2018, 63, 701–708. [Google Scholar] [CrossRef] [Green Version]
- Ivan, L.M.; Dimitriu, D.G.; Gritco-Todirascu, A.; Morosanu, A.C.; Dorohoi, D.O.; Cheptea, C. Excited state dipole moment of two pyridazinium-p-nitro-phenacylids estimated from solvatochromic study. Spectrosc. Lett. 2020, 53, 1–11. [Google Scholar] [CrossRef]
- Kawski, A. On the estimation of excited-state dipole moment from solvatochromic shifts of absorption and fluorescence spectra. Z. Nat. A 2002, 57, 255–262. [Google Scholar] [CrossRef]
- Kosower, E.M. An Introduction to Physical Organic Chemistry; Wiley: London, UK, 1968. [Google Scholar]
- Pop, V.; Dorohoi, D.O.; Delibas, M. Consideration on the statistical model of the intermolecular interactions in ternary solutions. An. St. Univ. A I Cuza Lasi s I b Fizica 1987, 32, 79–84. [Google Scholar]
- Hehre, W.; Ohlinger, S. Spartan’14 for Windows, Macintosh and Linux, Tutorial and User’s Guide; Wavefunction Inc.: Irvine, CA, USA, 2014. [Google Scholar]
- Lin, C.Y.; George, M.W.; Gill, P.M.W. EDF2: A density functional for predicting molecular vibrational frequencies. Aust. J. Chem. 2004, 57, 365–370. [Google Scholar] [CrossRef] [Green Version]
- Dorohoi, D.O. About the multiple linear regressions applied in studying the solvatochromic effects. Spectrochim. Acta A 2010, 75, 1030.e1–1030.e5. [Google Scholar] [CrossRef]
- Dorohoi, D.O.; Creanga, D.E.; Dimitriu, D.G.; Morosanu, A.C.; Gritco-Todirascu, A.; Mariciuc, G.G.; Puica Melniciuc, N.; Ardelean, E.; Cheptea, C. Computational and spectral means for characterizing the intermolecular interactions in solutions and for estimating excited state dipole moment of solute. Symmetry 2020, 12, 1299. [Google Scholar] [CrossRef]
- Babusca, D.; Benchea, A.C.; Dimitriu, D.G.; Dorohoi, D.O. Solvatochromic characterization of Sudan derivatives in binary and ternary solutions. Anal. Lett. 2016, 49, 2615–2626. [Google Scholar] [CrossRef]
- Morosanu, A.C.; Benchea, A.C.; Babusca, D.; Dimitriu, D.G.; Dorohoi, D.O. Quantum mechanical and solvatochromic characterization of Quercetin. Anal. Lett. 2017, 50, 2725–2739. [Google Scholar] [CrossRef]
- Holtjie, H.D.; Sippl, W.; Rognan, D.; Folkers, C. Molecular Modeling: Basic Principles and Applications, 3rd ed.; Wiley-VCH: Weinheim, Germany, 2008. [Google Scholar]
- Schlick, T. Molecular Modeling and Simulation: An Interdisciplinary Guide, 2nd ed.; Springer: New York, NY, USA, 2010. [Google Scholar]
- Hitchcock, S.A.; Pennington, L.D. Structure-brain exposure relationships. J. Med. Chem. 2006, 49, 7559–7583. [Google Scholar] [CrossRef]
- Kaplan, I.G. Intermolecular Interactions: Physical Picture, Computational Methods and Model Potentials; John Wiley & Sons: Chichester, UK, 2006. [Google Scholar]
- Israelachvili, J.N. Intermolecular and Surface Forces, 3rd ed.; Academic Press, Elsevier: Amsterdam, The Netherlands, 2011. [Google Scholar]
- Stone, A. The Theory of Intermolecular Forces, 2nd ed.; Oxford University Press: Oxford, UK, 2013. [Google Scholar]
- Marcus, Y. A quasi-lattice quasi-chemical theory of preferential solvation of ions in mixed solvents. Aust. J. Chem. 1983, 36, 1719–1731. [Google Scholar] [CrossRef]
- Suppan, P. Local polarity of solvent mixtures in the field of electronically excited molecules and exciplexes. J. Chem. Soc. Faraday Trans. 1 1987, 83, 495–509. [Google Scholar] [CrossRef]
- Bosch, E.; Rosés, M. Relationship between ET polarity and composition in binary solvent mixtures. J. Chem. Soc. Faraday Trans. 1992, 88, 3541–3546. [Google Scholar] [CrossRef]
- Chatterjee, P.; Bagchi, S. Preferential solvation of a dipolar solute in mixed binary solvent: A study of UV-visible spectroscopy. J. Phys. Chem. 1991, 95, 3311–3314. [Google Scholar] [CrossRef]
- Van, S.-P.; Hammond, G.S. Amine quenching of aromatic fluorescence and fluorescent exciplexes. J. Am. Chem. Soc. 1978, 100, 3895–3902. [Google Scholar] [CrossRef]
- Skwierczynski, R.D.; Connors, K.A. Solvent effects on chemical processes. Part 7. Quantitative description of the composition dependence of the solvent polarity measure ET(30) in binary aqueous-organic solvent mixtures. J. Chem. Soc. Perkin Trans. 2 1994, 1994, 467–472. [Google Scholar] [CrossRef]
- Papadakis, R. Preferential solvation of highly medium responsive pentacyanoferrate (II) complex in binary solvent mixtures: Understanding the role of dielectric enrichment and the specificity of solute-solvent interactions. J. Phys. Chem. B 2016, 120, 9422–9433. [Google Scholar] [CrossRef]
- Dorohoi, D.O.; Dimitriu, D.G.; Morosanu, A.C.; Puica Melniciuc, N.; Hurjui, I.; Miron, M.; Mariciuc, G.G.; Closca, V.; Cheptea, C. Some aryl-1,2,4-triazol-1-ium phenacylids in binary hydroxy solvent mixtures. Computational and spectral study. Symmetry 2021, 13, 1656. [Google Scholar] [CrossRef]
- Dulcescu-Oprea, M.M.; Morosanu, A.C.; Dimitriu, D.G.; Gritco-Todirascu, A.; Dorohoi, D.O.; Cheptea, C. Solvatochromic study of pyridinium-acetyl-benzoyl methylids (PABM) in ternary protic solutions. J. Mol. Struct. 2021, 1227, 129539. [Google Scholar] [CrossRef]
Figure 1.
Structural formula of 1-dithiocarboxy-2-ethoxy-1-(isoquinolin-2-yl)-2-oxoethan-1-ylid (iQTCY).
Figure 1.
Structural formula of 1-dithiocarboxy-2-ethoxy-1-(isoquinolin-2-yl)-2-oxoethan-1-ylid (iQTCY).

Figure 2.
Optimized structure of 1-dithiocarboxy-2-ethoxy-1-(isoquinolin-2-yl)-2-oxoethan-1-ylid (iQTCY) molecule (black—carbon, red—oxygen, grey—hydrogen, blue—nitrogen, yellow—sulfur). The arrow indicates the orientation of the electric dipole moment.
Figure 2.
Optimized structure of 1-dithiocarboxy-2-ethoxy-1-(isoquinolin-2-yl)-2-oxoethan-1-ylid (iQTCY) molecule (black—carbon, red—oxygen, grey—hydrogen, blue—nitrogen, yellow—sulfur). The arrow indicates the orientation of the electric dipole moment.

Figure 3.
Labels of the atoms of the iQTCY molecule.

Figure 4.
HOMO and LUMO maps of the iQTCY molecule.

Figure 5.
The calculated (by Equation (7)) versus experimental wavenumber corresponding to the maximum of the electronic absorption band.
Figure 5.
The calculated (by Equation (7)) versus experimental wavenumber corresponding to the maximum of the electronic absorption band.

Figure 6.
Comparative estimation of the composition of the iQTCY first solvation shell in the binary solvents water (1) + methanol (2) (a) and water (1) + ethanol (2) (b), respectively, through three models: statistical cell model, Suppan model, and Bosch–Rosés model. The green line is the first bisector, meaning the case for which the compositions of the first solvation shell and the whole solution are the same.

Figure 7.
Dependence of the mole fractions of the two solvents and of their complex in the first solvation shell of the ylid molecule on the water’s mole fraction in the whole solution for the binary solvent mixtures water (1) + methanol (2) (a) and water (1) + ethanol (2) (b), respectively.
Figure 7.
Dependence of the mole fractions of the two solvents and of their complex in the first solvation shell of the ylid molecule on the water’s mole fraction in the whole solution for the binary solvent mixtures water (1) + methanol (2) (a) and water (1) + ethanol (2) (b), respectively.

Figure 8.
Average statistic weight in the first solvation shell p1 (computed in the limits of the statistical cell model of ternary solutions) versus the bulk molar fraction x1 for water in the two binary solvents. The blue line is the first bisector, meaning the case for which the compositions of the first solvation shell and the whole solution are the same.

Figure 9.
ln (p1/(1 − p1)) versus ln(x1/(1 − x1)) for the binary solvent mixtures water (1) + methanol (2) (a) and water (1) + ethanol (2) (b), respectively.
Figure 9.
ln (p1/(1 − p1)) versus ln(x1/(1 − x1)) for the binary solvent mixtures water (1) + methanol (2) (a) and water (1) + ethanol (2) (b), respectively.

Figure 10.
Ratio R vs. angle φ for the visible band of iQTCY.

Figure 11.
Triangle of the dipole moments for the ICT process.


Table 1.
Electronic charges (expressed in elementary charge units) near the atoms of the iQTCY molecule.
Table 1.
Electronic charges (expressed in elementary charge units) near the atoms of the iQTCY molecule.
| Atom | Charge | Atom | Charge | Atom | Charge | Atom | Charge |
|---|---|---|---|---|---|---|---|
| C1 | −0.306 | C9 | −0.430 | N1 | 0.523 | H6 | 0.221 |
| C2 | −0.062 | C10 | −0.202 | S1 | −0.347 | H7 | 0.197 |
| C3 | −0.146 | C11 | −0.037 | S2 | −0.189 | H8 | 0.249 |
| C4 | −0.235 | C12 | 0.413 | H1 | 0.172 | H9 | 0.193 |
| C5 | 0.262 | C13 | 0.068 | H2 | 0.141 | H13 | 0.100 |
| C6 | 0.261 | C14 | −0.602 | H3 | 0.153 | H14 | 0.099 |
| C7 | −0.311 | O1 | −0.521 | H4 | 0.170 | H15 | 0.178 |
| C8 | −0.213 | O2 | −0.144 | H5 | 0.176 | H16 | 0.169 |
Table 2.
Energetic and electro-optic parameters of iQTCY in vacuum, water, and ethanol.
| Equilibrium Geometry at Ground State with Density Functional EDF 2, 6–31 G* | |||
|---|---|---|---|
| Property | Vacuum [15] | Water | Ethanol |
| Formula | C14H13NO2S2 | C14H13NO2S2 | C14H13NO2S2 |
| Weight (amu) | 291.395 | 291.395 | 291.395 |
| Energy (au) | −1542.385 | −1542.412 | −1542.421 |
| E HOMO (eV) | −4.88 | −5.28 | −5.19 |
| E LUMO (eV) | −2.64 | −2.27 | −2.27 |
| Dipole Moment (D) | 7.89 | 10.59 | 10.54 |
| Conformers | 216 | 216 | 216 |
| Area (Å2) | 294.74 | 301.19 | 301.17 |
| Volume (Å3) | 276.34 | 278.35 | 278.33 |
| PSA (Å2) | 17.519 | 18.477 | 18.445 |
| Ovality | 1.44 | 1.46 | 1.46 |
| Polarizability (Å3) | 63.19 | 63.16 | 63.18 |
| HBD Count | 1 | 1 | 1 |
| HBA Count | 4 | 4 | 4 |
Table 3.
Wavenumber in the maximum of the ICT electronic absorption band [15] and the contribution (in percent) of each type of intermolecular interaction to the total spectral shift of the iQTCY visible band (the solvent parameters f(ε), f(n), α and β are listed in [14]).
| Solvent | (cm −1) | C1f(ε) (%) | C2f(n) (%) | C3α (%) | C4β (%) | (cm−1) |
|---|---|---|---|---|---|---|
| Benzene | 20,960 | 53.91 | 43.70 | 0.00 | 2.39 | 21,086 |
| Anisole | 21,620 | 64.42 | 30.37 | 0.00 | 5.21 | 21,489 |
| Chloroform | 22,110 | 62.45 | 24.82 | 11.23 | 1.50 | 21,878 |
| Ethyl acetate | 21,970 | 71.67 | 21.50 | 0.00 | 6.83 | 21,792 |
| Dichloromethane | 22,110 | 71.62 | 20.72 | 6.36 | 1.30 | 22,193 |
| Dichloroethane | 21,970 | 76.57 | 22.08 | 0.00 | 1.35 | 22,095 |
| Pyridine | 21,970 | 70.51 | 21.93 | 0.00 | 7.56 | 21,964 |
| Acetone | 22,110 | 75.23 | 15.82 | 3.44 | 5.51 | 22,389 |
| DMF | 22,215 | 75.28 | 17.28 | 0.00 | 7.44 | 22,303 |
| DMSO | 22,460 | 74.04 | 18.09 | 0.00 | 7.87 | 22,290 |
| n-Octyl alcohol | 22,460 | 51.52 | 14.66 | 26.41 | 7.41 | 22,700 |
| Benzyl alcohol | 22,545 | 56.44 | 17.99 | 20.92 | 4.65 | 22,638 |
| n-Amyl alcohol | 22,740 | 55.29 | 13.27 | 23.28 | 8.16 | 22,793 |
| n-Butyl alcohol | 22,740 | 61.07 | 14.62 | 15.29 | 9.02 | 22,511 |
| n-Hexyl alcohol | 22,740 | 53.95 | 13.34 | 25.56 | 7.15 | 22,929 |
| iso-Propyl alcohol | 22,845 | 55.57 | 12.57 | 24.61 | 7.25 | 22,946 |
| iso-Butyl alcohol | 22,985 | 54.88 | 12.70 | 25.26 | 7.16 | 22,968 |
| n-Propyl alcohol | 23,125 | 54.14 | 12.33 | 26.08 | 7.45 | 23,033 |
| Ethanol | 23,125 | 55.82 | 11.36 | 26.63 | 6.19 | 23,189 |
| Methanol | 23,545 | 55.08 | 10.14 | 29.49 | 5.29 | 23,400 |
| Ethylene glycol | 23,545 | 56.06 | 12.86 | 26.93 | 4.15 | 23,303 |
| Water | 24,275 | 56.37 | 9.30 | 30.67 | 3.66 | 23,829 |
Table 4.
Molar water composition (x1), parameters f(ε), f(n), β, and α [36] of the binary solvent water (1) + ethanol (2) and wavenumbers (cm−1) in the maximum of the visible electronic absorption band of iQTCY.
Table 4.
Molar water composition (x1), parameters f(ε), f(n), β, and α [36] of the binary solvent water (1) + ethanol (2) and wavenumbers (cm−1) in the maximum of the visible electronic absorption band of iQTCY.
| x1 | f(ε) | f(n) | α | β | (cm−1) | p1 | |
|---|---|---|---|---|---|---|---|
| 0.000 | 0.886 | 0.222 | 0.98 | 0.83 | 23,125 | - | - |
| 0.050 | 0.886 | 0.221 | 0.97 | 0.83 | 23,285 | 0.152 | −1.72 |
| 0.100 | 0.888 | 0.220 | 0.96 | 0.84 | 23,400 | 0.262 | −1.04 |
| 0.150 | 0.895 | 0.219 | 0.94 | 0.83 | 23,500 | 0.333 | −0.69 |
| 0.200 | 0.899 | 0.218 | 0.93 | 0.83 | 23,590 | 0.443 | −0.23 |
| 0.250 | 0.901 | 0.217 | 0.93 | 0.83 | 23,660 | 0.510 | 0.04 |
| 0.300 | 0.904 | 0.217 | 0.92 | 0.82 | 23,730 | 0.576 | 0.31 |
| 0.350 | 0.909 | 0.216 | 0.91 | 0.81 | 23,790 | 0.633 | 0.55 |
| 0.400 | 0.912 | 0.215 | 0.91 | 0.80 | 23,850 | 0.690 | 0.80 |
| 0.450 | 0.917 | 0.215 | 0.89 | 0.79 | 23,900 | 0.738 | 1.04 |
| 0.500 | 0.921 | 0.214 | 0.90 | 0.79 | 23,948 | 0.784 | 1.29 |
| 0550 | 0.925 | 0.213 | 0.89 | 0.78 | 23,987 | 0.821 | 1.52 |
| 0.600 | 0.930 | 0.212 | 0.89 | 0.77 | 24,020 | 0.852 | 1.75 |
| 0.650 | 0.934 | 0.211 | 0.89 | 0.77 | 24,050 | 0.881 | 2.00 |
| 0.700 | 0.939 | 0.210 | 0.88 | 0.74 | 24,075 | 0.905 | 2.25 |
| 0.750 | 0.944 | 0.210 | 0.86 | 0.71 | 24,100 | 0.929 | 2.56 |
| 0.800 | 0.948 | 0.209 | 0.87 | 0.67 | 24,120 | 0.948 | 2.95 |
| 0.850 | 0.952 | 0.208 | 0.90 | 0.64 | 24,140 | 0.967 | 3.37 |
| 0.900 | 0.956 | 0.207 | 0.97 | 0.59 | 24,156 | 0.982 | 3.99 |
| 0.950 | 0.959 | 0.206 | 1.11 | 0.54 | 24,165 | 0.990 | 4.64 |
| 1.000 | 0.963 | 0.205 | 1.26 | 0.50 | 24,175 | - | - |
Table 5.
Molar water composition (x1), parameters f(ε), f(n), β and α [36] of binary solvent water (1) + methanol (2) and wavenumbers (cm−1) in the maximum of the visible electronic absorption band of iQTCY.
Table 5.
Molar water composition (x1), parameters f(ε), f(n), β and α [36] of binary solvent water (1) + methanol (2) and wavenumbers (cm−1) in the maximum of the visible electronic absorption band of iQTCY.
| x1 | f(ε) | f(n) | α | β | (cm−1) | p1 | |
|---|---|---|---|---|---|---|---|
| 0.000 | 0.913 | 0.203 | 1.14 | 0.74 | 23,545 | - | - |
| 0.050 | 0.918 | 0.203 | 1.14 | 0.74 | 23,640 | 0.151 | −1.73 |
| 0.100 | 0.923 | 0.203 | 1.13 | 0.74 | 23,730 | 0.294 | −0.88 |
| 0.150 | 0.927 | 0.203 | 1.12 | 0.74 | 23,800 | 0.405 | −0.39 |
| 0.200 | 0.931 | 0.203 | 1.10 | 0.74 | 23,880 | 0.532 | 0.13 |
| 0.250 | 0.934 | 0.204 | 1.09 | 0.74 | 23,922 | 0.598 | 0.40 |
| 0.300 | 0.938 | 0.204 | 1.07 | 0.74 | 23,964 | 0.665 | 0.69 |
| 0.350 | 0.940 | 0.204 | 1.06 | 0.74 | 24,000 | 0.722 | 0.96 |
| 0.400 | 0.943 | 0.204 | 1.04 | 0.72 | 24,024 | 0.760 | 1.15 |
| 0.450 | 0.945 | 0.204 | 1.04 | 0.72 | 24,050 | 0.802 | 1.40 |
| 0.500 | 0.948 | 0.204 | 1.02 | 0.71 | 24,070 | 0.833 | 1.61 |
| 0550 | 0.950 | 0.204 | 1.03 | 0.70 | 24,090 | 0.865 | 1.86 |
| 0.600 | 0.951 | 0.204 | 1.02 | 0.68 | 24,100 | 0.881 | 2.00 |
| 0.650 | 0.953 | 0.205 | 1.01 | 0.66 | 24,115 | 0.905 | 2.25 |
| 0.700 | 0.954 | 0.205 | 1.01 | 0.65 | 24,121 | 0.914 | 2.37 |
| 0.750 | 0.955 | 0.205 | 1.01 | 0.63 | 24,138 | 0.941 | 2.77 |
| 0.800 | 0.958 | 0.205 | 1.02 | 0.61 | 24,143 | 0.949 | 2.93 |
| 0.850 | 0.959 | 0.205 | 1.06 | 0.59 | 24,150 | 0.960 | 3.19 |
| 0.900 | 0.961 | 0.205 | 1.07 | 0.58 | 24,160 | 0.976 | 3.71 |
| 0.950 | 0.962 | 0.206 | 1.09 | 0.56 | 24,168 | 0.989 | 4.49 |
| 1.000 | 0.963 | 0.206 | 1.12 | 0.55 | 24,175 | - | - |
Table 6.
Characteristics of the linear fit of the dependence ln (p1/(1-p1)) versus ln ((x1/1 − x1)) for the binary solvent mixture solutions.
Table 6.
Characteristics of the linear fit of the dependence ln (p1/(1-p1)) versus ln ((x1/1 − x1)) for the binary solvent mixture solutions.
| Solution | Slope | Intercept | R | w2 − w1 (10−20 J) |
|---|---|---|---|---|
| iQTCY + water + ethanol | 1.1193 ± 0.0229 | 1.3323 ± 0.0345 | 0.997 | 0.538 ± 0.078 |
| iQTCY + water + methanol | 1.0439 ± 0.0282 | 1.5205 ± 0.0484 | 0.996 | 0.615 ± 0.052 |
Table 7.
Excited state of the dipole moment and polarizability of the studied molecules and the values of the C1μ and C1α computed for each angle φ.
Table 7.
Excited state of the dipole moment and polarizability of the studied molecules and the values of the C1μ and C1α computed for each angle φ.
| φ (°) | μe (D) | αe (Å3) | C1μ × 1011 | C1α × 1016 | R = C1μ/C1α |
|---|---|---|---|---|---|
| 0 | 7.29 | 64.13 | 4.2312 | −51.20 | −82.643 |
| 10 | 7.41 | 63.94 | 4.2196 | −39.58 | −106.606 |
| 17.5 | 7.65 | 63.45 | 4.1941 | −14.02 | −299.188 |
| 20 | 7.76 | 63.25 | 4.1817 | −1.63 | −2564.180 |
| 20.2 | 7.77 | 63.23 | 4.1806 | −0.54 | −7673.179 |
| 20.3 | 7.78 | 63.19 | 4.1801 | 0.00 | −∞ |
| 20.4 | 7.80 | 63.15 | 4.1795 | 0.56 | 7519.579 |
| 20.5 | 7.81 | 63.14 | 4.1790 | 1.11 | 3759.112 |
| 22.5 | 7.90 | 62.95 | 4.1671 | 13.03 | 319.720 |
| 30 | 8.44 | 61.83 | 4.1063 | 73.87 | 55.585 |
| 40 | 9.56 | 59.27 | 3.9660 | 214.37 | 18.5007 |
Disclaimer/Publisher’s Note: The statements, opinions and data contained in all publications are solely those of the individual author(s) and contributor(s) and not of MDPI and/or the editor(s). MDPI and/or the editor(s) disclaim responsibility for any injury to people or property resulting from any ideas, methods, instructions or products referred to in the content. |
© 2023 by the authors. Licensee MDPI, Basel, Switzerland. This article is an open access article distributed under the terms and conditions of the Creative Commons Attribution (CC BY) license (https://creativecommons.org/licenses/by/4.0/).
Share and Cite
MDPI and ACS Style
Dorohoi, D.O.; Creanga, D.E.; Dimitriu, D.G. Intermolecular Interactions in Binary and Ternary Solutions of a Zwitterionic Compound Studied by Solvatochromism. Symmetry 2023, 15, 563. https://doi.org/10.3390/sym15020563
AMA Style
Dorohoi DO, Creanga DE, Dimitriu DG. Intermolecular Interactions in Binary and Ternary Solutions of a Zwitterionic Compound Studied by Solvatochromism. Symmetry. 2023; 15(2):563. https://doi.org/10.3390/sym15020563
Chicago/Turabian StyleDorohoi, Dana Ortansa, Dorina Emilia Creanga, and Dan Gheorghe Dimitriu. 2023. "Intermolecular Interactions in Binary and Ternary Solutions of a Zwitterionic Compound Studied by Solvatochromism" Symmetry 15, no. 2: 563. https://doi.org/10.3390/sym15020563
Note that from the first issue of 2016, this journal uses article numbers instead of page numbers. See further details here.