
Force, Power, and Morphology Asymmetries as Injury Risk Factors in Physically Active Men and Women


Abstract
:1. Introduction
2. Materials and Methods
2.1. Participants
2.2. Measurements
- -
- 3 or more days of vigorous exercise, for a total of at least 1500 MET;
- -
- 7 or more days of any combination of exercise (walking, moderate, or vigorous exercise) exceeding 3000 MET.
2.3. Statistics
3. Results
4. Discussion
5. Conclusions
Author Contributions
Funding
Institutional Review Board Statement
Informed Consent Statement
Data Availability Statement
Conflicts of Interest
References
- Penedo, F.J.; Dahn, J.R. Exercise and well-being: A review of mental and physical Health benefits associated with physical activity. Curr. Opin. Psychiatry 2005, 18, 189–193. [Google Scholar] [CrossRef] [PubMed]
- Warburton, D.E.R.; Bredin, S.S.D. Health benefits of physical activity: A systematic review of current systematic reviews. Curr. Opin. Cardiol. 2017, 32, 541–556. [Google Scholar] [CrossRef] [PubMed]
- Meeuwisse, W.H.; Tyreman, H.; Hagel, B.; Emery, C. A dynamic model of etiology in sport injury: The recursive nature of risk and causation. Clin. J. Sport Med. 2007, 17, 215–219. [Google Scholar] [CrossRef] [PubMed]
- Złotkowska, R.; Skiba, M.; Mroczek, A.; Bilewicz-Wyrozumska, T.; Król, K.; Lar, K.; Zbrojkiewicz, E. Negatywne skutki aktywności fizycznej oraz uprawiania sportu. Hygeia Public Health 2015, 50, 41–46. [Google Scholar]
- Bittencourt, N.F.; Meeuwisse, W.H.; Mendonça, L.D.; Nettel-Aguirre, A.; Ocarino, J.M.; Fonseca, S.T. Complex systems approach for sports injuries: Moving from risk factor identification to injury pattern recognition—Narrative review and new concept. Br. J. Sports Med. 2016, 50, 1309–1314. [Google Scholar] [CrossRef] [Green Version]
- Saragiotto, B.T.; Di Pierro, C.; Lopes, A.D. Risk factors and injury prevention in elite athletes: A descriptive study of the opinions of physical therapists, doctors and trainers. Braz. J. Phys. Ther. 2014, 18, 137–143. [Google Scholar] [CrossRef] [Green Version]
- Domaradzki, J.; Koźlenia, D. The performance of body mass component indices in detecting risk of musculoskeletal injuries in physically active young men and women. PeerJ 2022, 10, e12745. [Google Scholar] [CrossRef]
- de la Motte, S.J.; Gribbin, T.C.; Lisman, P.; Murphy, K.; Deuster, P.A. Systematic Review of the Association Between Physical Fitness and Musculoskeletal Injury Risk: Part 2-Muscular Endurance and Muscular Strength. J. Strength Cond. Res. 2017, 31, 3218–3234. [Google Scholar] [CrossRef]
- de la Motte, S.J.; Lisman, P.; Gribbin, T.C.; Murphy, K.; Deuster, P.A. Systematic Review of the Association Between Physical Fitness and Musculoskeletal Injury Risk: Part 3-Flexibility, Power, Speed, Balance, and Agility. J. Strength Cond. Res. 2019, 33, 1723–1735. [Google Scholar] [CrossRef]
- Emery, C.A.; Pasanen, B. Current trends in sport injury prevention. Best Pract. Res. Clin. Rheumatol. 2019, 33, 3–15. [Google Scholar] [CrossRef]
- Ristolainen, L.; Kettunen, J.A.; Kujala, U.M.; Heinonen, A. Sport injuries as the main cause of sport career termination among Finnish top-level athletes. Eur. J. Sport Sci. 2012, 12, 274–282. [Google Scholar] [CrossRef]
- Krutsch, W.; Krutsch, V.; Hilber, F.; Pfeifer, C.; Baumann, F.; Weber, J.; Schmitz, P.; Kerschbaum, M.; Nerlich, M.; Angele, P. 11.361 sports injuries in a 15-year survey of a Level I emergency trauma department reveal different severe injury types in the 6 most common team sports. Sportverletz. Sportschaden 2018, 32, 111–119. [Google Scholar] [CrossRef] [PubMed]
- Zuzgina, O.; Wdowski, M. Asymmetry of dominant and non-dominant shoulders in university level men and women volleyball players. Hum. Mov. 2019, 20, 19–27. [Google Scholar] [CrossRef]
- Helme, M.; Tee, J.; Emmonds, S.; Low, C. Does lower-limb asymmetry increase injury risk in sport? A systematic review. Phys. Ther. Sport Off. J. Assoc. Chart. Physiother. Sports Med. 2021, 49, 204–213. [Google Scholar] [CrossRef] [PubMed]
- Promsri, A.; Longo, A.; Haid, T.; Doix, A.M.; Federolf, P. Leg Dominance as a Risk Factor for Lower-Limb Injuries in Downhill Skiers-A Pilot Study into Possible Mechanisms. Int. J. Environ. Res. Public Health 2019, 16, 3399. [Google Scholar] [CrossRef] [Green Version]
- Guan, Y.; Bredin, S.; Taunton, J.; Jiang, Q.; Wu, N.; Li, Y.; Warburton, D. Risk Factors for Non-Contact Lower-Limb Injury: A Retrospective Survey in Pediatric-Age Athletes. J. Clin. Med. 2021, 10, 3171. [Google Scholar] [CrossRef]
- Hollander, N.A.; Finestone, A.S.; Yofe, V.; Bader, T.; Magnezi, R. The association between increased body mass index and overuse injuries in Israel defense forces conscripts. Obes. Facts 2020, 13, 152–165. [Google Scholar] [CrossRef]
- Havenetidis, K.; Paxinos, T.; Kardaris, D.; Bissas, A. Prognostic potential of body composition indices in detecting risk of musculoskeletal injury in army officer cadet profiles. Physician Sportsmed. 2017, 45, 114–119. [Google Scholar] [CrossRef]
- Gonell, A.C.; Romero, J.A.; Soler, L.M. Relationship Between The Y Balance Test Scores And Soft Tissue Injury Incidence In A Soccer Team. Int. J. Sports Phys. Ther. 2015, 10, 955–966. [Google Scholar]
- Isern-Kebschull, J.; Mechó, S.; Pruna, R.; Kassarjian, A.; Valle, X.; Yanguas, X.; Alomar, X.; Martinez, J.; Pomés, J.; Rodas, G. Sports-related lower limb muscle injuries: Pattern recognition approach and MRI review. Insights Into Imaging 2020, 11, 108. [Google Scholar] [CrossRef]
- Cowan, D.N.; Jones, B.H.; Frykman, P.N.; Polly, D.W.; Harman, E.A., Jr.; Rosenstein, R.M.; Rosenstein, M.T. Lower limb morphology and risk of overuse injury among male infantry trainees. Med. Sci. Sports Exerc. 1996, 28, 945–952. [Google Scholar] [CrossRef] [PubMed]
- Toomey, C.M.; Whittaker, J.L.; Nettel-Aguirre, A.; Reimer, R.A.; Woodhouse, L.J.; Ghali, B.; Doyle-Baker, P.K.; Emery, C.A. Higher Fat Mass Is Associated With a History of Knee Injury in Youth Sport. J. Orthop. Sports Phys. Ther. 2017, 47, 80–87. [Google Scholar] [CrossRef] [PubMed] [Green Version]
- Mala, L.; Maly, T.; Cabell, L.; Hank, M.; Bujnovsky, D.; Zahalka, F. Anthropometric, Body Composition, and Morphological Lower Limb Asymmetries in Elite Soccer Players: A Prospective Cohort Study. Int. J. Environ. Res. Public Health 2020, 17, 1140. [Google Scholar] [CrossRef] [PubMed] [Green Version]
- Struzik, A.; Winiarski, S.; Zawadzki, J. Inter-limb asymmetry of leg stiffness in national second-league basketball players during countermovement jumps. Symmetry 2022, 14, 440. [Google Scholar] [CrossRef]
- Hart, L.M.; Cohen, D.D.; Patterson, S.D.; Springham, M.; Reynolds, J.; Read, P. Previous injury is associated with heightened countermovement jump force-time asymmetries in professional soccer players. Transl. Sports Med. 2019, 2, 256–262. [Google Scholar] [CrossRef]
- Bredella, M.A. Sex Differences in Body Composition. Adv. Exp. Med. Biol. 2017, 1043, 9–27. [Google Scholar] [CrossRef]
- Struzik, A. Measuring Leg Stiffness during Vertical Jumps: Theory and Methods, 1st ed.; Springer: Cham, Switzerland, 2019. [Google Scholar] [CrossRef]
- Kibler, W.B.; Chandler, T.J.; Uhl, T.; Maddux, R.E. A musculoskeletal approach to the preparticipation physical examination: Preventing injury and improving performance. Am. J. Sports Med. 1989, 17, 525–531. [Google Scholar] [CrossRef]
- Dor-Haim, H.; Katzburg, S.; Revach, P.; Levine, H.; Barak, S. The impact of COVID-19 lockdown on physical activity and weight gain among active adult population in Israel: A cross-sectional study. BMC Public Health 2021, 21, 1521. [Google Scholar] [CrossRef]
- Koźlenia, D.; Domaradzki, J. Prediction and injury risk based on movement patterns and flexibility in a 6-month prospective study among physically active adults. PeerJ 2021, 9, e11399. [Google Scholar] [CrossRef]
- Biernat, E.; Stupnicki, R.; Gajewski, A. International physical activity questionnaire (IPAQ) _Polish version. Pol. J. Sports Med. 2013, 29, 1–15. [Google Scholar]
- Aron, A.; Aron, E.N.; Coups, E.J. Statistics for Psychology, 6th ed.; Pearson International Edition: Upper Saddle River, NJ, USA, 2012. [Google Scholar]
- McLester, C.N.; Nickerson, B.S.; Kliszczewicz, B.M.; McLester, J.R. Reliability and Agreement of Various InBody Body Composition Analyzers as Compared to Dual-Energy X-Ray Absorptiometry in Healthy Men and Women. J. Clin. Densitom. Off. J. Int. Soc. Clin. Densitom. 2020, 23, 443–450. [Google Scholar] [CrossRef] [PubMed]
- Viteckova, S.; Kutilek, P.; Svoboda, Z.; Krupicka, R.; Kauler, J.; Szabo, Z. Gait symmetry measures: A review of current and prospective methods. Biomed. Signal Process. Control 2018, 42, 89–100. [Google Scholar] [CrossRef]
- Sannicandro, I.; Cofano, G.; Rosa, A.R.; Traficante, P.; Piccinno, A. Functional movement screen and lower limb strength asymmetry in professional soccer players. Br. J. Sports Med. 2017, 51, 381–382. [Google Scholar] [CrossRef]
- Mitchell, A.; Holding, C.; Greig, M. The Influence of Injury History on Countermovement Jump Performance and Movement Strategy in Professional Soccer Players: Implications for Profiling and Rehabilitation Foci. J. Sport Rehabil. 2021, 30, 768–773. [Google Scholar] [CrossRef]
- Jordan, M.J.; Aagaard, P.; Herzog, W. Lower limb asymmetry in mechanical muscle function: A comparison between ski racers with and without ACL reconstruction. Scand. J. Med. Sci. Sports 2015, 25, e301–e309. [Google Scholar] [CrossRef] [PubMed]
- Holsgaard-Larsen, A.; Jensen, C.; Mortensen, N.H.; Aagaard, P. Concurrent assessments of lower limb loading patterns, mechanical muscle strength and functional performance in ACL-patients—A cross-sectional study. Knee 2014, 21, 66–73. [Google Scholar] [CrossRef] [PubMed]
- Castanharo, R.; da Luz, B.S.; Bitar, A.C.; D’Elia, C.O.; Castropil, W.; Duarte, M. Males still have limb asymmetries in multijoint movement tasks more than 2 years following anterior cruciate ligament reconstruction. J. Orthop. Sci. Off. J. Jpn. Orthop. Assoc. 2011, 16, 531–535. [Google Scholar] [CrossRef]
- O’Malley, E.; Richter, C.; King, E.; Strike, S.; Moran, K.; Franklyn-Miller, A.; Moran, R. Countermovement Jump and Isokinetic Dynamometry as Measures of Rehabilitation Status After Anterior Cruciate Ligament Reconstruction. J. Athl. Train. 2018, 53, 687–695. [Google Scholar] [CrossRef] [Green Version]
- Bell, D.R.; Sanfilippo, J.L.; Binkley, N.; Heiderscheit, B.C. Lean mass asymmetry influences force and power asymmetry during jumping in collegiate athletes. J. Strength Cond. Res. 2014, 28, 884–891. [Google Scholar] [CrossRef] [Green Version]
- Markovic, G.; Šarabon, N.; Pausic, J.; Hadžić, V. Adductor Muscles Strength and Strength Asymmetry as Risk Factors for Groin Injuries among Professional Soccer Players: A Prospective Study. Int. J. Environ. Res. Public Health 2020, 17, 4946. [Google Scholar] [CrossRef]
- Croisier, J.L.; Ganteaume, S.; Binet, J.; Genty, M.; Ferret, J.M. Strength imbalances and prevention of hamstring injury in professional soccer players: A prospective study. Am. J. Sports Med. 2008, 36, 1469–1475. [Google Scholar] [CrossRef] [PubMed]
- Bahr, R.; Holme, I. Risk factors for sports injuries—A methodological approach. Br. J. Sports Med. 2003, 37, 384–392. [Google Scholar] [CrossRef] [PubMed]
- Melloni, M.; De Almeida Ávila, J.; Páscoa, M.A.; De Oliveira Barbeta, C.J.; Cirolini, V.X.; Gonçalves, E.M.; Guerra-Júnior, G. Can anthropometric, body composition, and bone variables be considered risk factors for musculoskeletal injuries in Brazilian military students? BMC Musculoskelet. Disord. 2018, 19, 377. [Google Scholar] [CrossRef] [PubMed]
- Konishi, Y.; Oda, T.; Tsukazaki, S.; Kinugasa, R.; Hirose, N.; Fukubayashi, T. Relationship between quadriceps femoris muscle volume and muscle torque after anterior cruciate ligament rupture. Knee Surg. Sports Traumatol. Arthrosc. Off. J. ESSKA 2011, 19, 641–645. [Google Scholar] [CrossRef]
- Ryew, C.C.; Lee, A.R.; Hyun, S.H. Effect of muscle mass asymmetric between upper and lower limbs on the postural stability and shock attenuation during landing. J. Exerc. Rehabil. 2019, 15, 488–492. [Google Scholar] [CrossRef]
- McGuine, T.A.; Keene, J.S. The effect of a balance training program on the risk of ankle sprains in high school athletes. Am. J. Sports Med. 2006, 34, 1103–1111. [Google Scholar] [CrossRef]
- Yeow, C.H.; Lee, P.V.; Goh, J.C. Effect of landing height on frontal plane kinematics, kinetics and energy dissipation at lower extremity joints. J. Biomech. 2009, 42, 1967–1973. [Google Scholar] [CrossRef]
- McCaskie, C.J.; Sim, M.; Newton, R.U.; Hart, N.H. Lower-limb injury in elite Australian football: A narrative review of kinanthropometric and physical risk factors. Phys. Ther. Sport Off. J. Assoc. Chart. Physiother. Sports Med. 2021, 52, 69–80. [Google Scholar] [CrossRef]
- Freckleton, G.; Cook, J.; Pizzari, T. The predictive validity of a single leg bridge test for hamstring injuries in Australian Rules Football Players. Br. J. Sports Med. 2014, 48, 713–717. [Google Scholar] [CrossRef]
- Georgeson, E.C.; Weeks, B.K.; McLellan, C.; Beck, B.R. Seasonal change in bone, muscle and fat in professional rugby league players and its relationship to injury: A cohort study. BMJ Open 2012, 2, e001400. [Google Scholar] [CrossRef] [Green Version]
- Murphy, D.F.; Connolly, D.A.; Beynnon, B.D. Risk factors for lower extremity injury: A review of the literature. Br. J. Sports Med. 2003, 37, 13–29. [Google Scholar] [CrossRef] [PubMed] [Green Version]
- Tajdini, H.; Letafatkar, A.; Brewer, B.W.; Hosseinzadeh, M. Association between kinesiophobia and gait asymmetry after ACL reconstruction: Implications for prevention of reinjury. Int. J. Environ. Res. Public Health 2021, 18, 3264. [Google Scholar] [CrossRef] [PubMed]


| Factor | Men | Women | ||
|---|---|---|---|---|
| No Injury (n = 40) | Injury (n = 18) | No Injury (n = 33) | Injury (n = 14) | |
| Mean ± SD 95% CI | Mean ± SD 95% CI | Mean ± SD 95% CI | Mean ± SD 95% CI | |
| Body mass (kg) | 80.5 ± 11.1 | 84.3 ± 8.5 | 61.2 ± 9.0 | 63.6 ± 12.7 |
| 76.9–84.1 | 80.1–88.6 | 57.9–64.4 | 56.3–70.9 | |
| Body height (kg) | 1.80 ± 0.2 | 1.81 ± 0.1 | 1.7 ± 0.1 | 1.67 ± 0.1 |
| 1.8–1.8 | 1.77–1.8 | 1.65–1.7 | 1.62–1.7 | |
| Body mass index—BMI (kg/m2) | 24.8 ± 2.7 | 25.8 ± 2.5 | 21.7 ± 2.6 | 22.6 ± 2.8 |
| 24–25.7 | 24.6–27.1 | 20.8–22.6 | 21.0–24.3 | |
| Relative peak force—SI (%) | 4.0 ± 3.1 | 8.5 ± 7.8 | 7.3 ± 5.9 | 7.8 ± 6.4 |
| 3.0 – 5.0 | 4.6–12.4 | 5.8–9.4 | 4.3–11.7 | |
| Relative peak power—SI (%) | 4.4 ± 3.4 | 4.0 ± 3.7 | 4.9 ± 4.4 | 5.7 ± 4.3 |
| 3.3–5.9 | 2.0–6 | 3.3–6.4 | 3.2–8.2 | |
| LL fat mass%—SI (%) | 4.8 ± 4.1 | 3.9 ± 3.7 | 2.3 ± 2.0 | 2.8 ± 3.0 |
| 3.50–6.1 | 2.1–5.8 | 1.5–3.0 | 1.02–4.5 | |
| LL fat mass kg—SI (%) | 4.1 ± 3.9 | 3.9 ± 3.7 | 2.9 ± 2.1 | 3.9 ± 6.1 |
| 2.9- 5.4 | 1.5–5.2 | 2.8–3.7 | 0.3–7.9 | |
| LL free fat mass—SI (%) | 2.8 ± 1.3 | 2.5 ± 1.3 | 2.2 ± 1.4 | 4.2 ± 3.5 |
| 2.5–3.4 | 1.8–3.2 | 1.7–2.7 | 2.1- 6.7 | |
| LL muscle mass—SI (%) | 2.9 ± 1.3 | 2.5 ± 1.3 | 1.9 ± 1.2 | 3.3 ± 2.2 |
| 2.5–3.3 | 1.8–3.9 | 1.5–2.7 | 2.1–4.6 | |
| Sex | Symmetry Index (%) | Ranks | Z | p | |
|---|---|---|---|---|---|
| No Injury | Injury | ||||
| Men | Relative peak force | 1033.00 | 678.00 | −2.4623 | 0.0138 * |
| Relative peak power | 1235.00 | 476.00 | 0.9160 | 0.3597 | |
| LL fat mass % | 1229.00 | 482.00 | 0.8152 | 0.4150 | |
| LL fat mass kg | 1224.00 | 487.00 | 0.7311 | 0.4647 | |
| LL free-fat mass | 1253.00 | 458.00 | 1.2185 | 0.2230 | |
| LL skeletal muscle mass | 1245.50 | 465.50 | 1.0925 | 0.2746 | |
| Women | Relative peak force | 776.50 | 351.50 | 0.3489 | 0.7271 |
| Relative peak power | 758.00 | 370.00 | 0.7793 | 0.4358 | |
| LL fat mass % | 777.50 | 350.50 | 0.3257 | 0.7447 | |
| LL fat mass kg | 817.50 | 310.50 | −0.5816 | 0.5609 | |
| LL free-fat mass | 714.00 | 414.00 | 1.8028 | 0.0714 | |
| LL skeletal muscle mass | 697.50 | 430.50 | 2.1866 | 0.0288 * | |
| Factor | Rate | SE | Wald | GU 95% CI | OR | OR 95% CI | p |
|---|---|---|---|---|---|---|---|
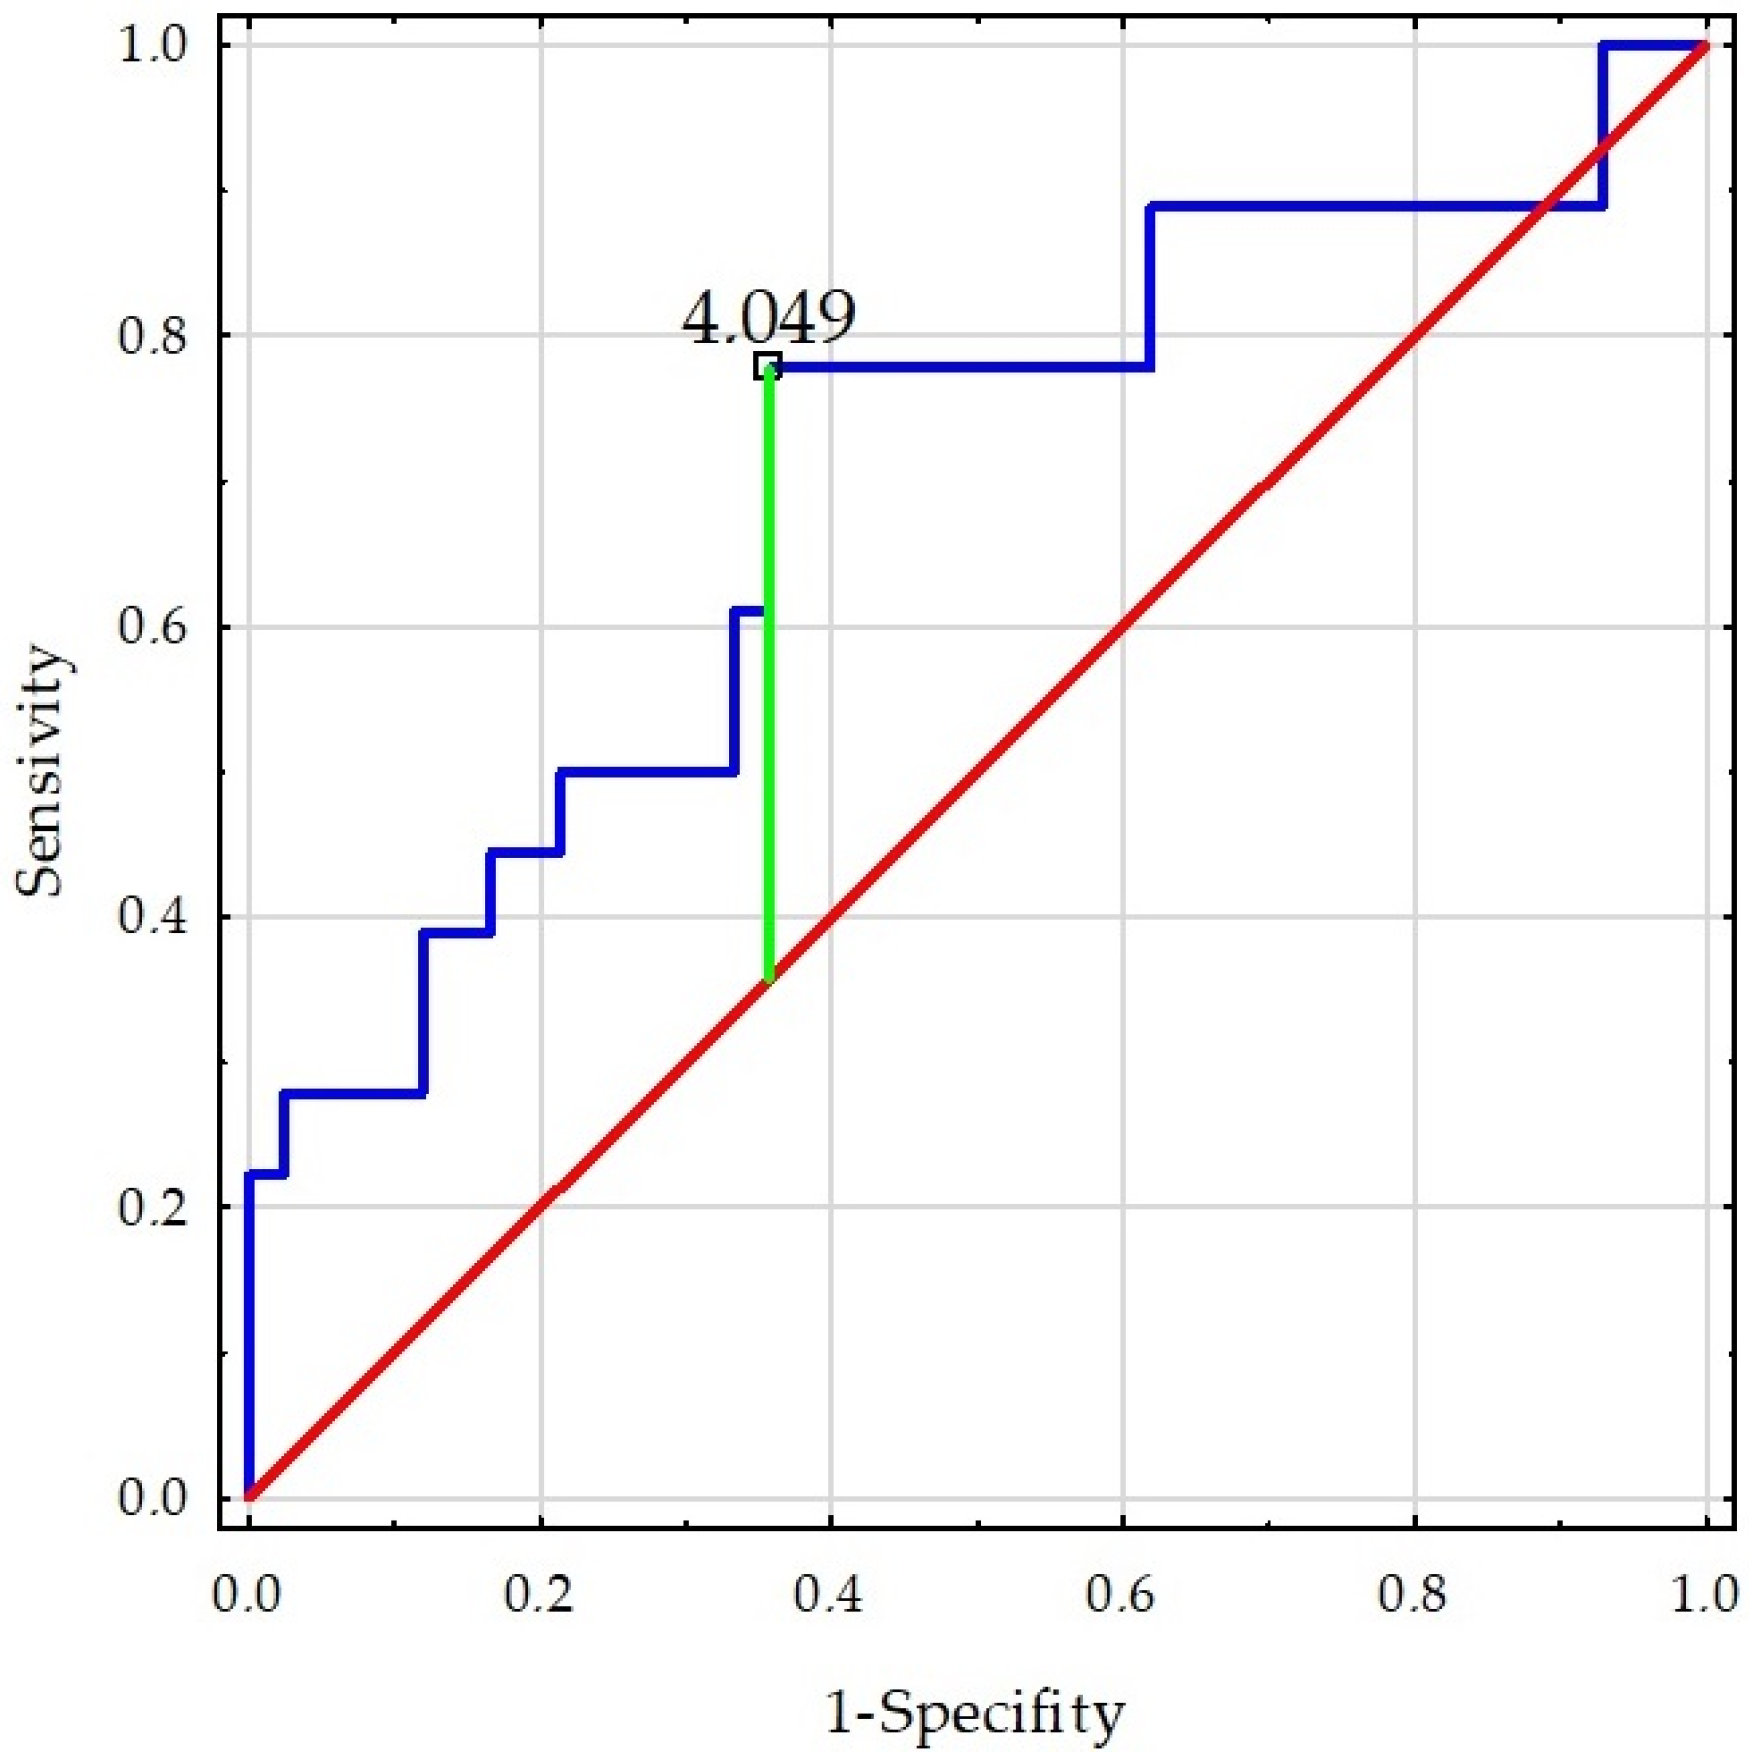
| Men—Relative peak force–SI | 0.181 | 0.073 | 6.118 | 0.038–0.324 | 1.198 | 1.038–1.383 | 0.013 * |
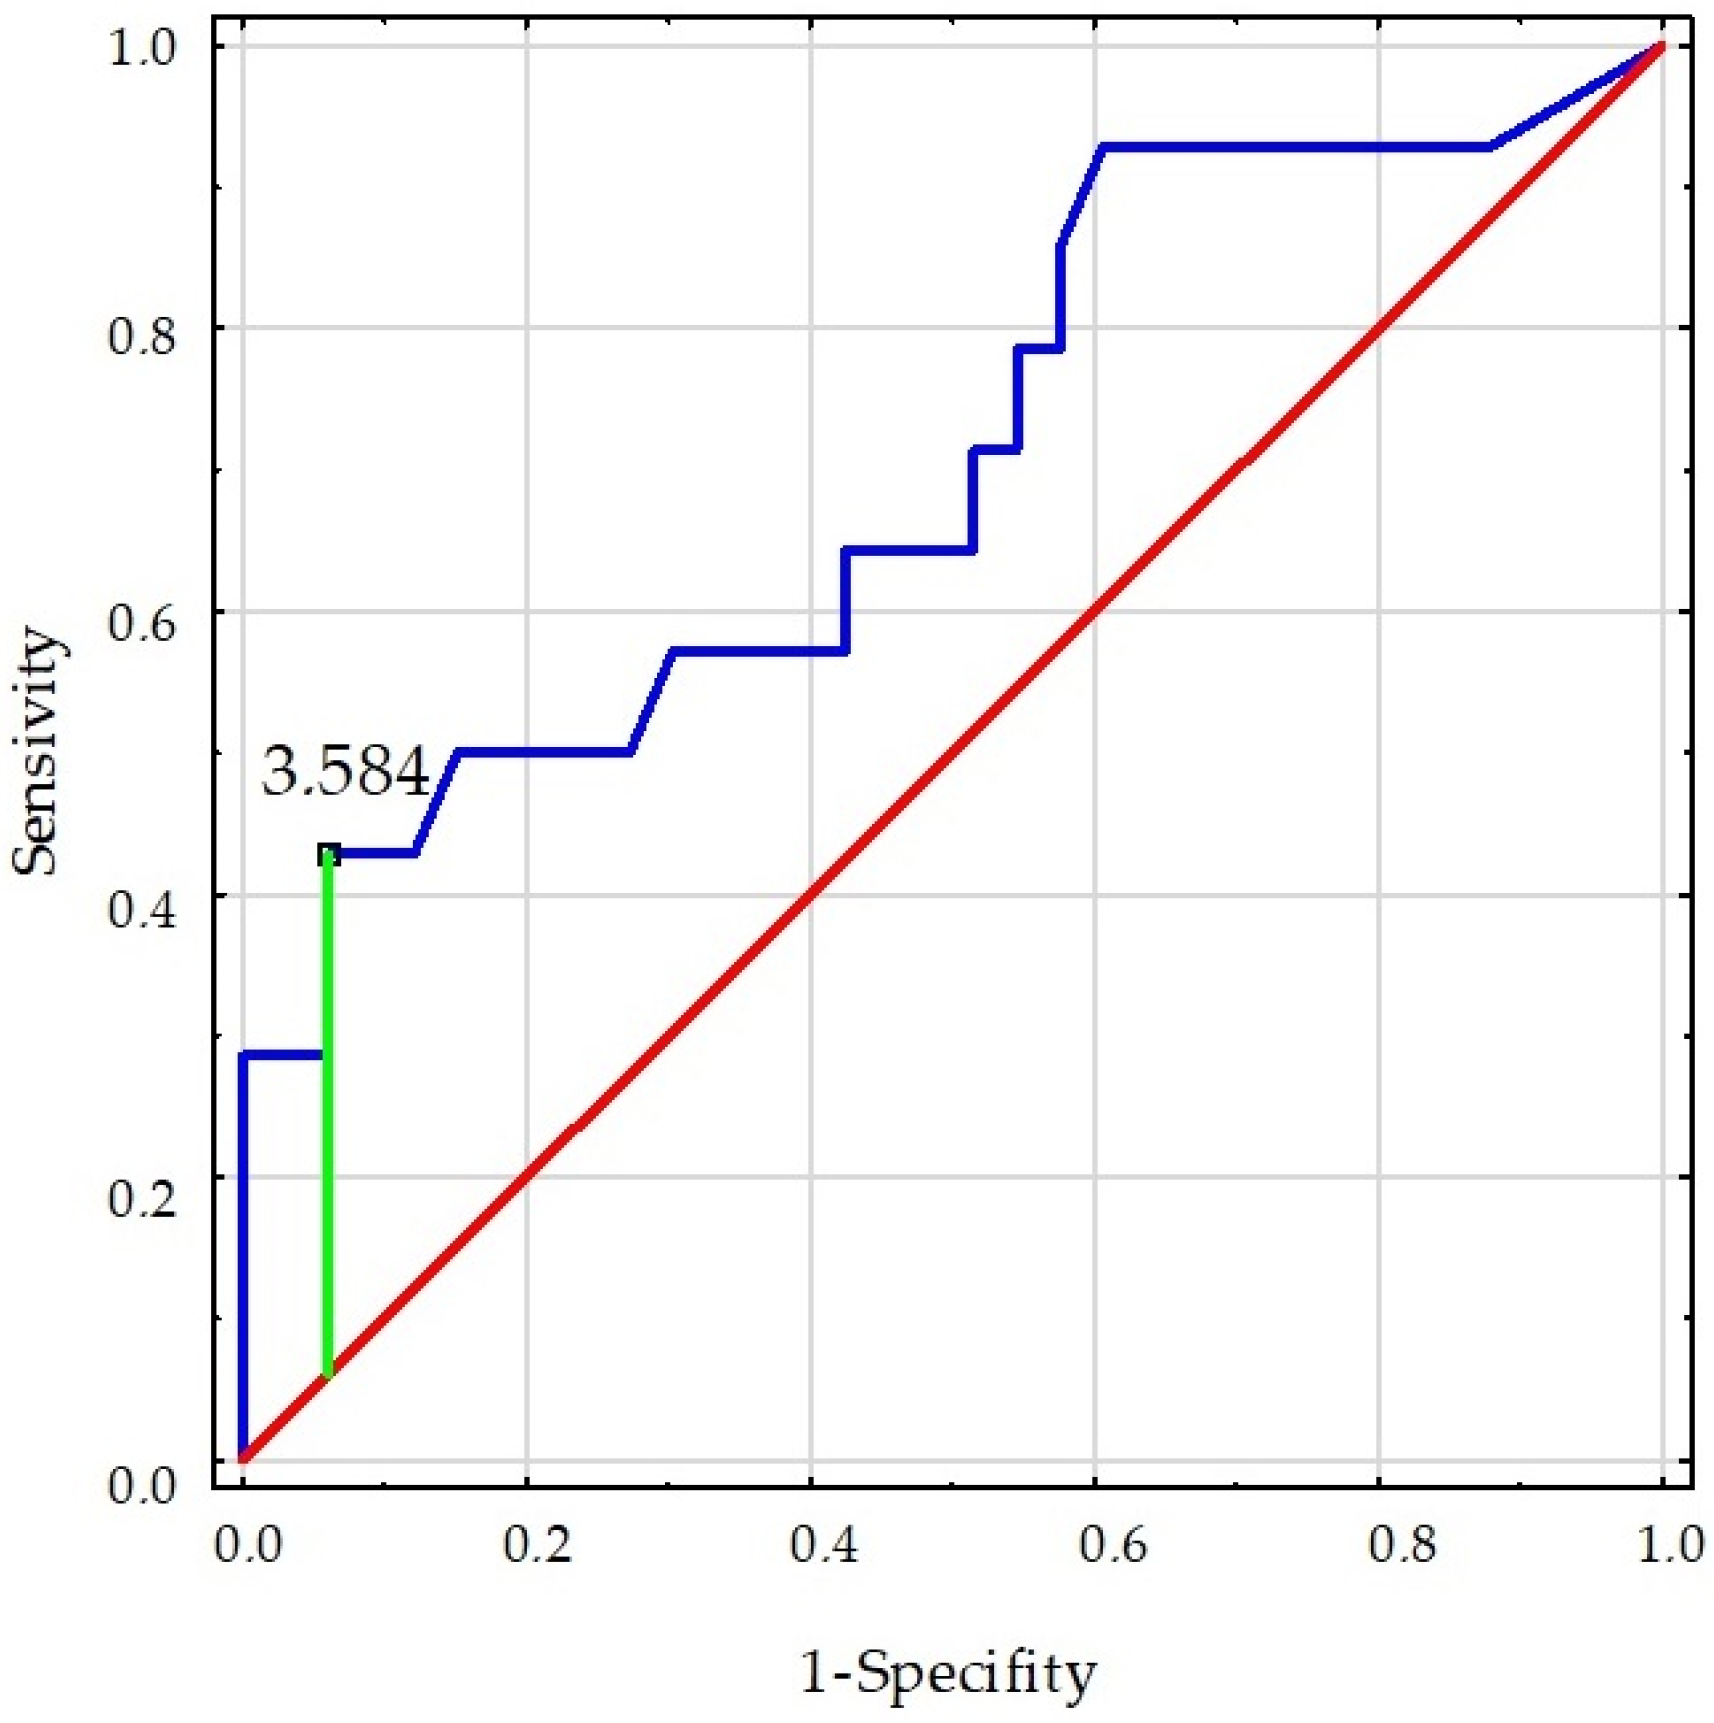
| Women- LL skeletal muscle mass–SI | 0.602 | 0.260 | 5.369 | 0.009–1.111 | 1.826 | 1.097–3.038 | 0.021 * |
Publisher’s Note: MDPI stays neutral with regard to jurisdictional claims in published maps and institutional affiliations. |
© 2022 by the authors. Licensee MDPI, Basel, Switzerland. This article is an open access article distributed under the terms and conditions of the Creative Commons Attribution (CC BY) license (https://creativecommons.org/licenses/by/4.0/).
Share and Cite
Koźlenia, D.; Struzik, A.; Domaradzki, J. Force, Power, and Morphology Asymmetries as Injury Risk Factors in Physically Active Men and Women. Symmetry 2022, 14, 787. https://doi.org/10.3390/sym14040787
Koźlenia D, Struzik A, Domaradzki J. Force, Power, and Morphology Asymmetries as Injury Risk Factors in Physically Active Men and Women. Symmetry. 2022; 14(4):787. https://doi.org/10.3390/sym14040787
Chicago/Turabian StyleKoźlenia, Dawid, Artur Struzik, and Jarosław Domaradzki. 2022. "Force, Power, and Morphology Asymmetries as Injury Risk Factors in Physically Active Men and Women" Symmetry 14, no. 4: 787. https://doi.org/10.3390/sym14040787