Article

A Search for Cosmic Ray Bursts at 0.1 PeV with a Small Air Shower Array

by
Roger Clay
1,*,
Jassimar Singh
1,
Piotr Homola
2,
Olaf Bar
3,
Dmitry Beznosko
4,
Apoorva Bhatt
2,
Gopal Bhatta
5,
Łukasz Bibrzycki
3,
Nikolay Budnev
6,
David E. Alvarez-Castillo
2,7,
Niraj Dhital
8,
Alan R. Duffy
9,
Michał Frontczak
3,
Dariusz Góra
2,
Alok C. Gupta
10,
Bartosz Łozowski
11,
Mikhail V. Medvedev
12,13,
Justyna Mędrala
14,
Justyna Miszczyk
2,
Michał Niedźwiecki
15,
Marcin Piekarczyk
3,
Krzysztof Rzecki
14,
Jilberto Zamora-Saa
16,
Katarzyna Smelcerz
15,
Karel Smolek
17,
Tomasz Sośnicki
14,
Jaroslaw Stasielak
2,
Sławomir Stuglik
2,
Oleksandr Sushchov
2,
Arman Tursunov
18 and
Tadeusz Wibig
19
add Show full author list remove Hide full author list
1
School of Physical Sciences, University of Adelaide, North Terrace, Adelaide 5005, Australia
2
Institute of Nuclear Physics Polish Academy of Sciences, 31-342 Krakow, Poland
3
Institute of Computer Science, Pedagogical University of Krakow, 30-084 Krakow, Poland
4
Department of Chemistry and Physics, Clayton State University, Morrow, GA 30260, USA
5
Astronomical Observatory, Jagiellonian University, 30-244 Krakow, Poland
6
Faculty of Physics, Irkutsk State University, 664003 Irkutsk, Russia
7
Joint Institute for Nuclear Research, Joliot-Curie Street 6, 141980 Dubna, Russia
8
Central Department of Physics, Tribhuvan University, Kirtipur 44613, Nepal
9
Centre for Astrophysics and Supercomputing, Swinburne University of Technology, Melbourne 3122, Australia
10
Aryabhatta Research Institute of Observational Sciences (ARIES), Manora Peak, Nainital 263001, India
11
Faculty of Natural Sciences, University of Silesia in Katowice, Bankowa 9, 40-007 Katowice, Poland
12
Department of Physics and Astronomy, University of Kansas, Lawrence, KS 66045, USA
13
Laboratory for Nuclear Science, Massachusetts Institute of Technology, Cambridge, MA 02139, USA
14
Department of Biocybernetics and Biomedical Engineering, AGH University of Science and Technology, 30-059 Krakow, Poland
15
Department of Computer Science, Faculty of Computer Science and Telecommunications, Cracow University of Technology, 31-155 Krakow, Poland
16
Departamento de Ciencias Fisicas, Universidad Andres Bello, Piso 7, Sazie, Santiago 2212, Chile
17
Institute of Experimental and Applied Physics, Czech Technical University in Prague, Husova 240/5, 110 00 Prague, Czech Republic
18
Research Centre for Theoretical Physics and Astrophysics, Institute of Physics, Silesian University in Opava, Bezručovo nám. 13, CZ-74601 Opava, Czech Republic
19
Theoretical Physics Department, University of Lodz, Pomorska Street 149/153, 90-236 Lodz, Poland
*
Author to whom correspondence should be addressed.
Symmetry 2022, 14(3), 501; https://doi.org/10.3390/sym14030501
Submission received: 28 January 2022 / Revised: 14 February 2022 / Accepted: 25 February 2022 / Published: 1 March 2022
(This article belongs to the Special Issue Symmetry in Cosmic Ray Detections)

Abstract

:
The Cosmic Ray Extremely Distributed Observatory (CREDO) pursues a global research strategy dedicated to the search for correlated cosmic rays, so-called Cosmic Ray Ensembles (CRE). Its general approach to CRE detection does not involve any a priori considerations, and its search strategy encompasses both spatial and temporal correlations, on different scales. Here we search for time clustering of the cosmic ray events collected with a small sea-level extensive air shower array at the University of Adelaide. The array consists of seven one-square-metre scintillators enclosing an area of 10 m × 19 m. It has a threshold energy ~0.1 PeV, and records cosmic ray showers at a rate of ~6 mHz. We have examined event arrival times over a period of over 2.5 years in two equipment configurations (without and with GPS timing), recording ~300 k events and ~100 k events. We determined the event time spacing distributions between individual events and the distributions of time periods which contained specific numbers of multiple events. We find that the overall time distributions are as expected for random events. The distribution which was chosen a priori for particular study was for time periods covering five events (four spacings). Overall, these distributions fit closely with expectation, but there are two outliers of short burst periods in data for each configuration. One of these outliers contains eight events within 48 s. The physical characteristics of the array will be discussed together with the analysis procedure, including a comparison between the observed time distributions and expectation based on randomly arriving events.

1. Introduction

It is usual to treat the arrivals of high-energy cosmic rays as intrinsically independent processes with their modulation in space and time determined only by the directions of their sources and the rotation of the Earth. However, this leaves a region of observational space which may not have been well investigated for observations of charged cosmic rays, that is, the possibility of short-term time correlations, often known as bursts. The CREDO project [1] has a number of facets broadly related to searching for correlations within cosmic ray arrival time series, and one thrust of that project is to investigate possible short-term time correlations. Deflections of charged particles in interstellar and intergalactic magnetic fields preclude a useful memory of time correlations of events at the source, but more localised processes, such as primary particle break-up in transit or more nearby interactions of uncharged messengers, could result in spatial and temporal correlations.
Cosmic ray showers were discovered in the 1930s [2], and their study continues to be a core component of the field of high-energy astrophysics with air shower arrays such as that of the Pierre Auger Observatory [3]. Many searches for bursts in the cosmic ray beam have been made over the past 50 years, particularly since gamma-ray bursts were discovered by the Vela satellites [4], and theories such as that of Hawking (1974) [5] have suggested numerous possible burst mechanisms. Early important reports were those of Fegan et al. (1983) [6] and Smith et al. (1983) [7]. Those early reports described transient increases in the rate of recorded cosmic ray showers (at spaced recording stations [6] and at a single station [7]), which were found in multi-year datasets. A number of further searches have been made for non-random effects in cosmic ray arrival times but with diverse selection criteria and rarely with a priori selection criteria such that statistical significances could be confidently derived (e.g., [8,9,10,11]). Such searches have covered potential burst periods as short as a few microseconds and as long as days. Gamma-ray primary particles have been found by satellites in bursts that can be very short but may have durations up to tens of seconds. Correlated arrival times of charged cosmic rays could extend over very long periods depending on the distance from a possible original particle break-up.
Our aim here is to report a search for temporal correlations (bursts) with a small air shower array sensitive to cosmic particles with energies above ~0.1 PeV. An earlier preliminary report of some of this work is to be found in [12]. The small dimensions of this array, which is predominantly sensitive to the electromagnetic component of air showers, which can have shower front thickness of the order of metres, result in poor individual shower angular resolutions (~20°). We can make some estimates of individual event arrival directions but with poor angular uncertainty (below). Even so, merely the arrival time of a burst and the knowledge that this component is strongly attenuated at large zenith angles gives some directional limits, even without directions derived from array fast timing.
We have had two observing periods, with the recording system having different deadtimes. Our a priori choice of the selection of a burst in the first period (0.5 s deadtime) was five events (four spacings) in a time span within (or equal to) 10 s. Our a priori choice of the selection of a burst in the second period (mean deadtime of 1.5 s) was five events (four spacings) within 20 s. We will describe the observation of four such bursts in this period of ~2.5 years: two in the first period and two in the second.
This paper will describe our small array for the detection of cosmic ray air showers, describe our search for event time correlations over a recording period approaching 2.5years, and discuss the interpretation of our data.

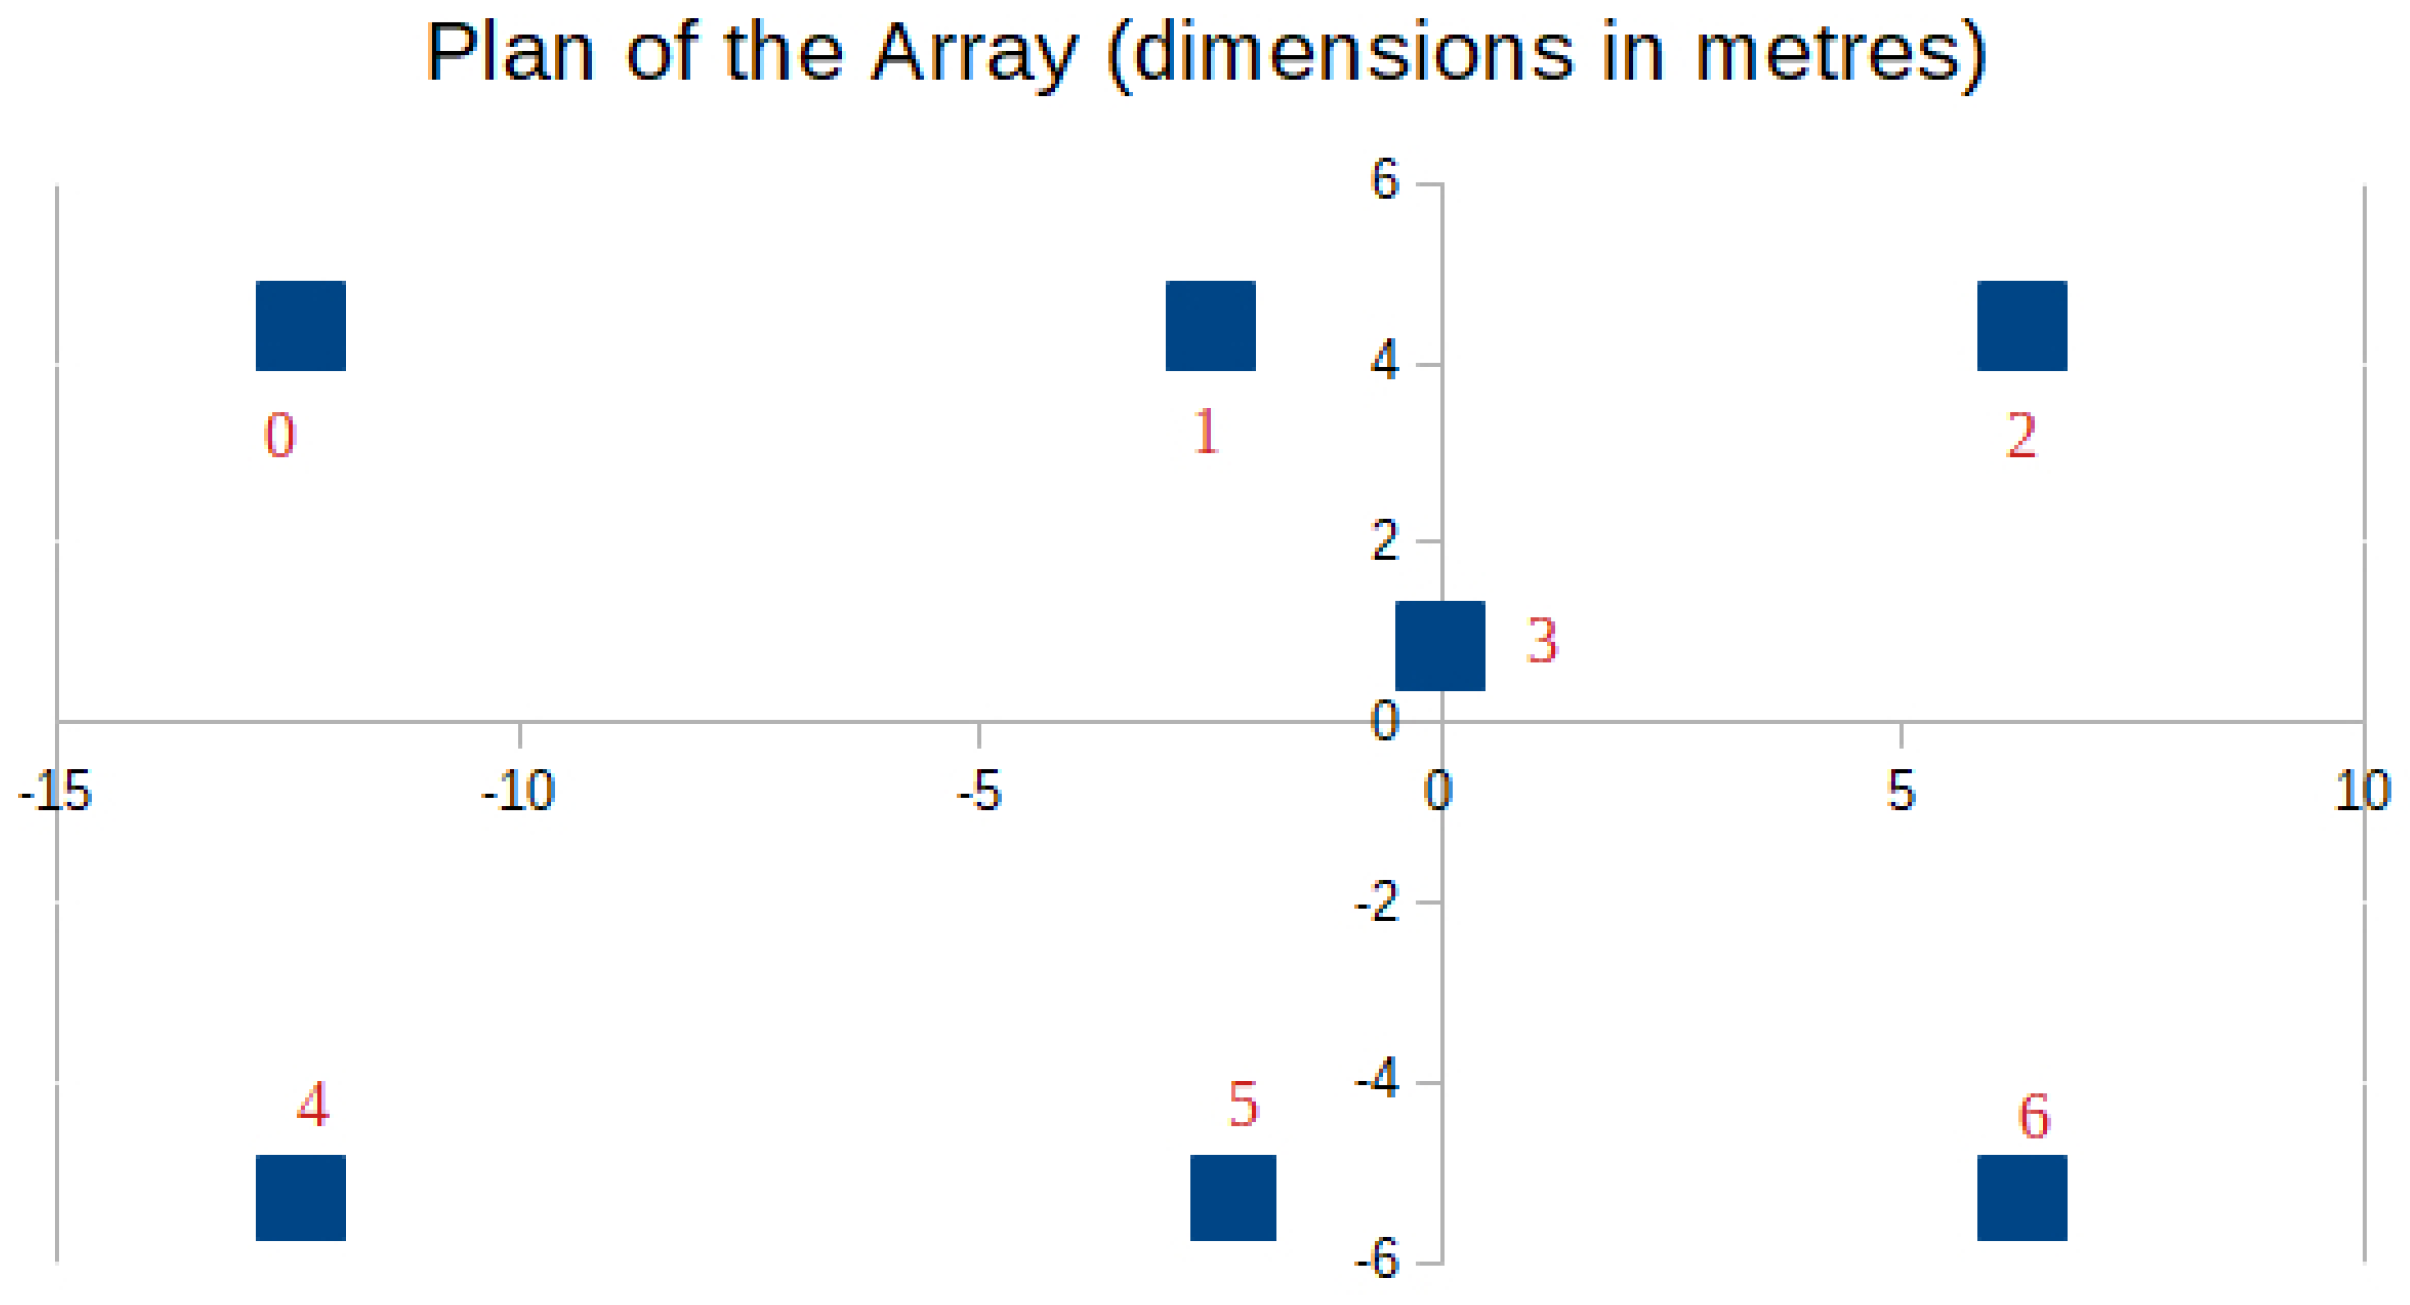
2. Materials and Methods

A small air shower array was built 20 years ago on the roof space of the Physics Department of the University of Adelaide (34.6° S). Its basis is seven one-square-metre scintillators (Nuclear Enterprises NE 102), originally used in the large Buckland Park air shower array. Those scintillators, housed in light-tight boxes, are each of thickness 50 mm and are each viewed by two photomultipliers, one for timing (Philips XP2040, ~2 ns risetime) and one for amplitude measurement (RCA 8055). The original purpose of the array was for use in advanced undergraduate teaching. The array is not temperature controlled, and its directional precision is very limited due to its small dimensions.
The scintillator arrangement is with three scintillators each in two rows of length 18.7 m, separated by 9.7 m, with a roughly central seventh scintillator (Figure 1). This arrangement was constrained to fit within the existing roof space, and the rows are oriented in a direction 34° clockwise from east–west. Event-triggering employed fast discriminators (2 ns rise time but better than 1 ns timing) and required three scintillators to have triggered timing channels (thresholds at ~1.5 particle level), including the central detector. This gave an overall event rate of about 6 mHz. The shower size threshold was about 104 particles, corresponding to ~0.1 PeV primary energy if the primary particles were protons. The overall timing of a shower front particle arrival had an uncertainty ~3 ns.
There were two periods of data recording, with different event timing systems. The first period (21 May 2019 to 12 February 2021) used a computer clock reset to Internet time every 5 min, and 300,236 events were recorded. In this period, event times were recorded as the current UTC second. There was a dead time of ~0.5 s per event for CAMAC data transfer and other overheads. The second period (17 March 2021 to 25 October 2021) used a GPS engine and recorded 100,001 events with events being timed to the nearest 1 ms by counting a 1 kHz clock to the next GPS second. This system had a dead time of 1.0 s (overhead), plus the time required to count to the next GPS second (1.0 s + (0 to 1 s)), a mean of 1.5 s. For this work, the array was maintained in a stable manner (with occasional down time for maintenance or power interruptions) from 21 May 2019 21:55 UTC to the present time (October 2021).
The original purpose of the array was to introduce students to air shower techniques in a local laboratory setting. In order to fit in the available area, the array has small dimensions when compared to the lateral extent of an air shower (characteristic Molière radius ~80 m) and is too small to record good arrival directions by fast timing since the shower front has itself a characteristic thickness of order metres. The angular uncertainty in the event arrival direction is of order 20° for most events (which may not trigger all of the timing detectors), including the uncertainty due to the shower front thickness. Shower sizes are crudely estimated, through modelling, from the total number of recorded particles in an event, whose true core distance is unknown.

3. Results

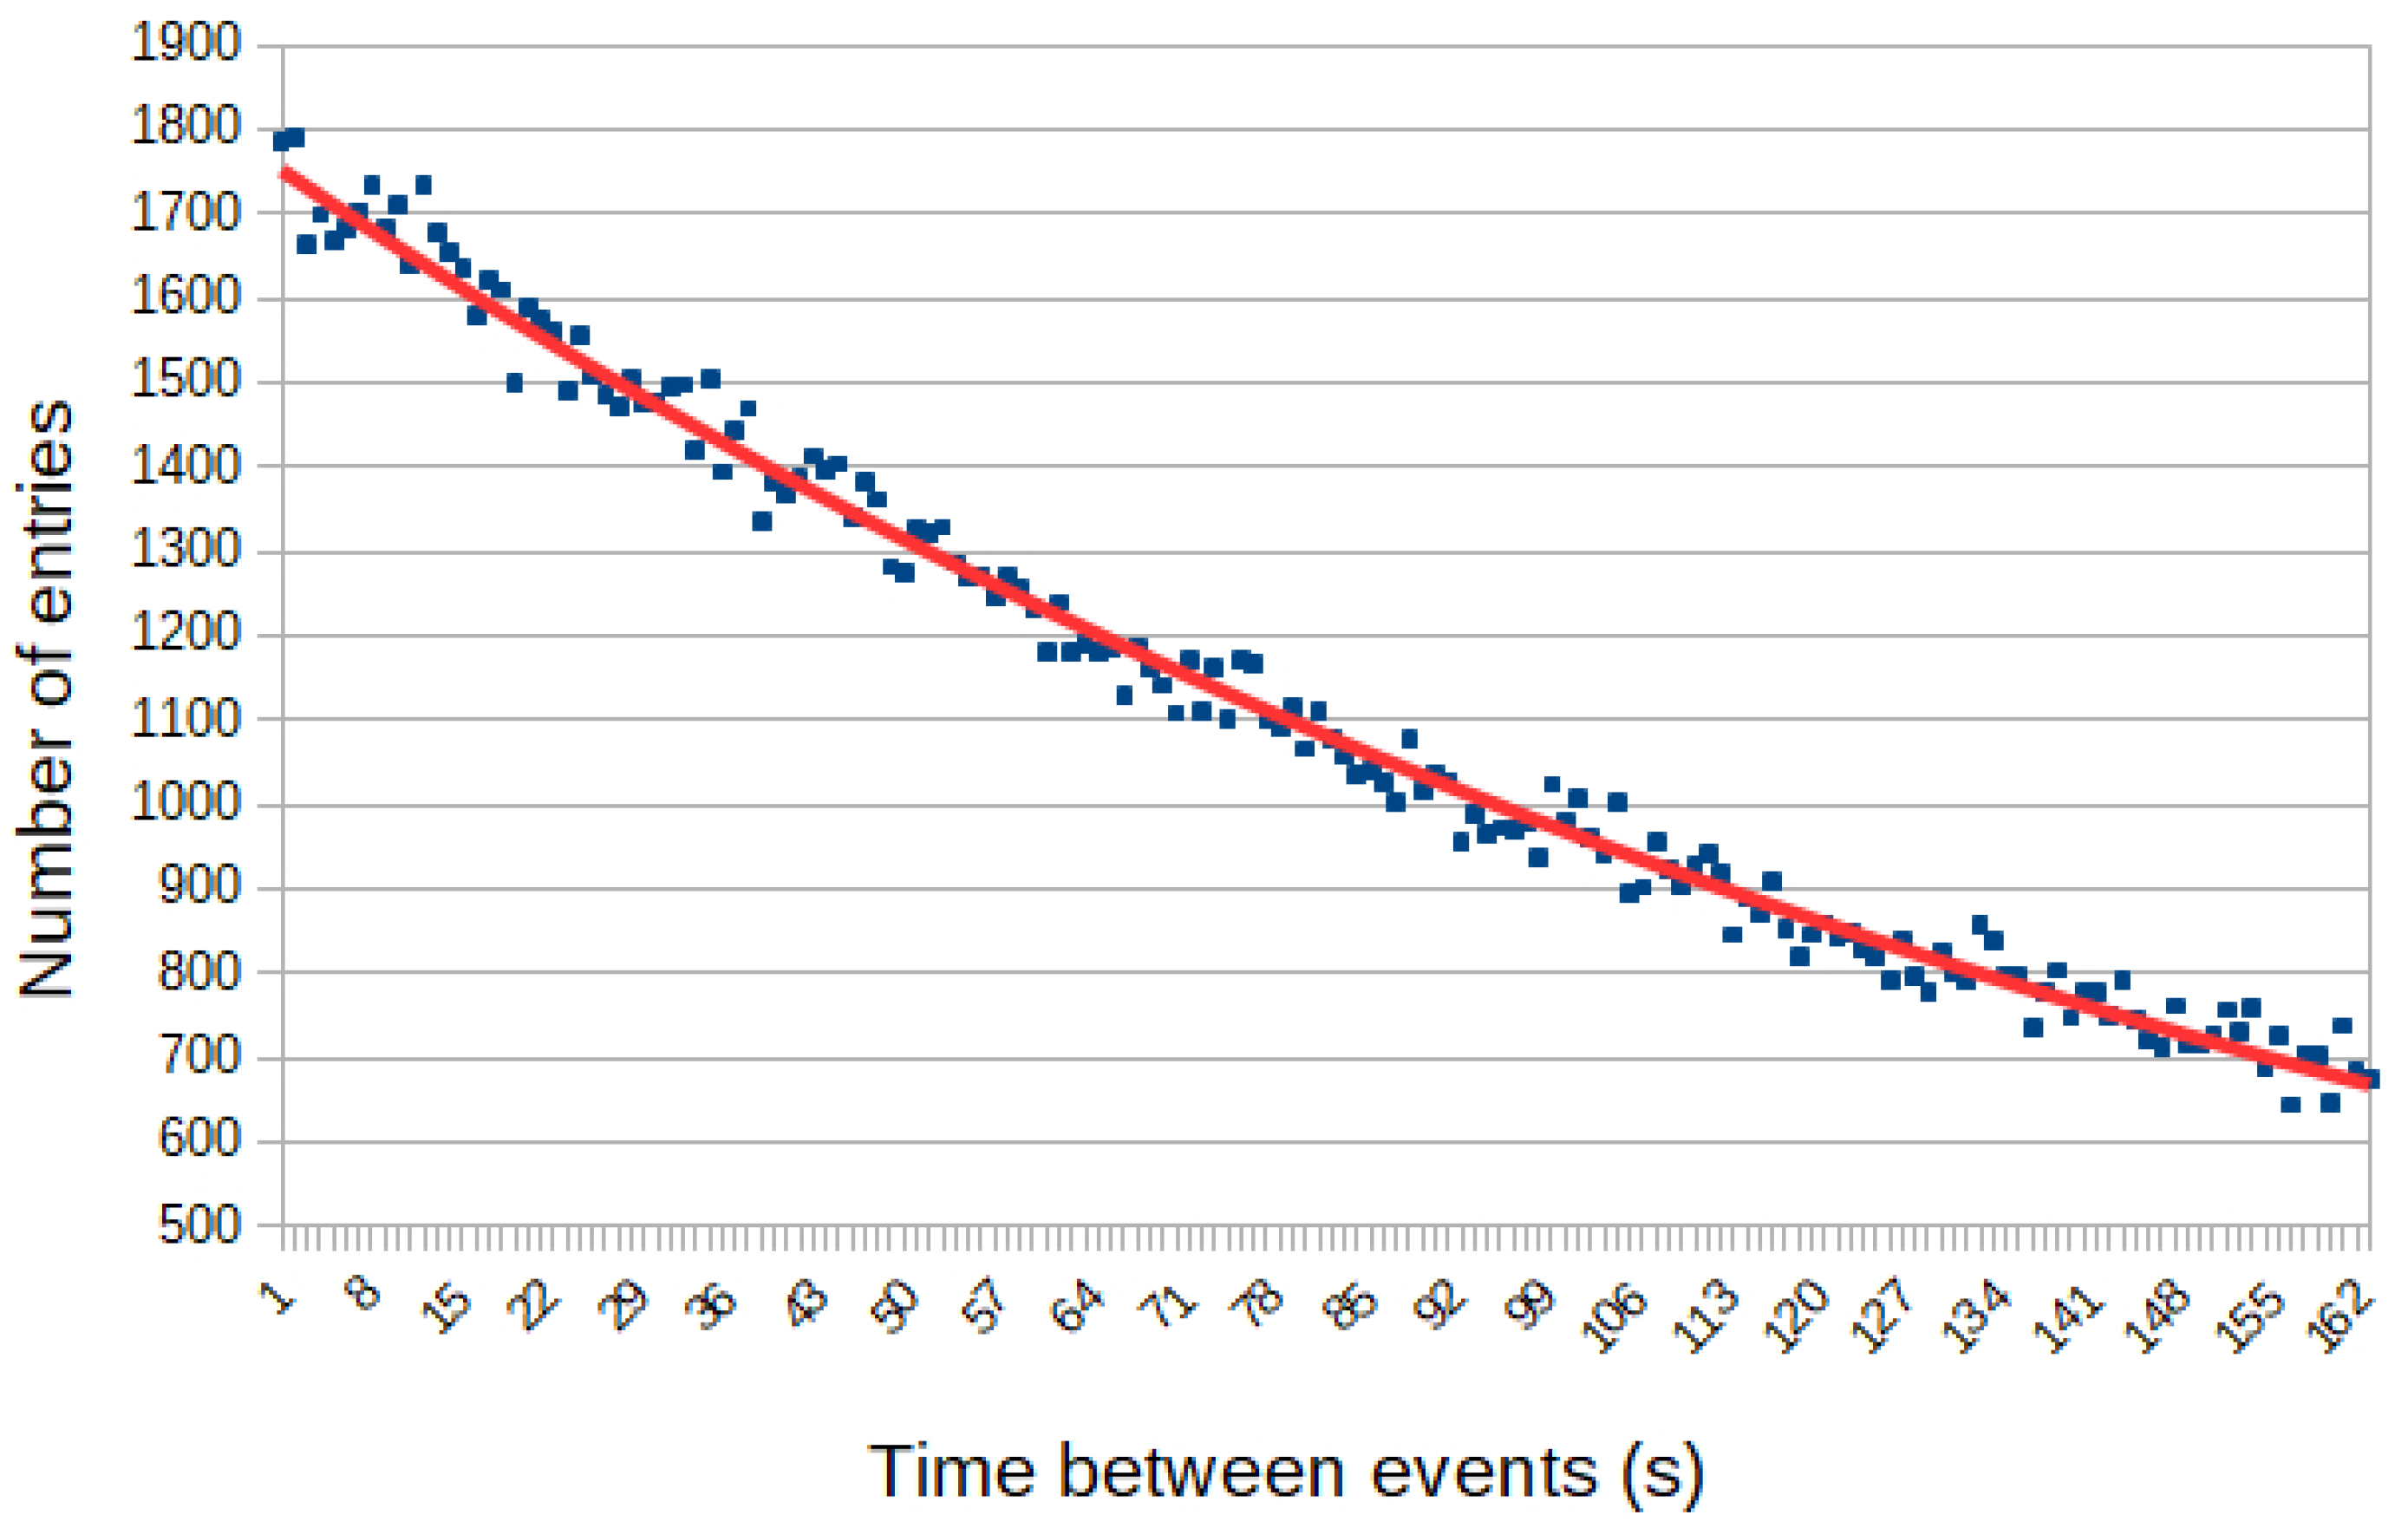
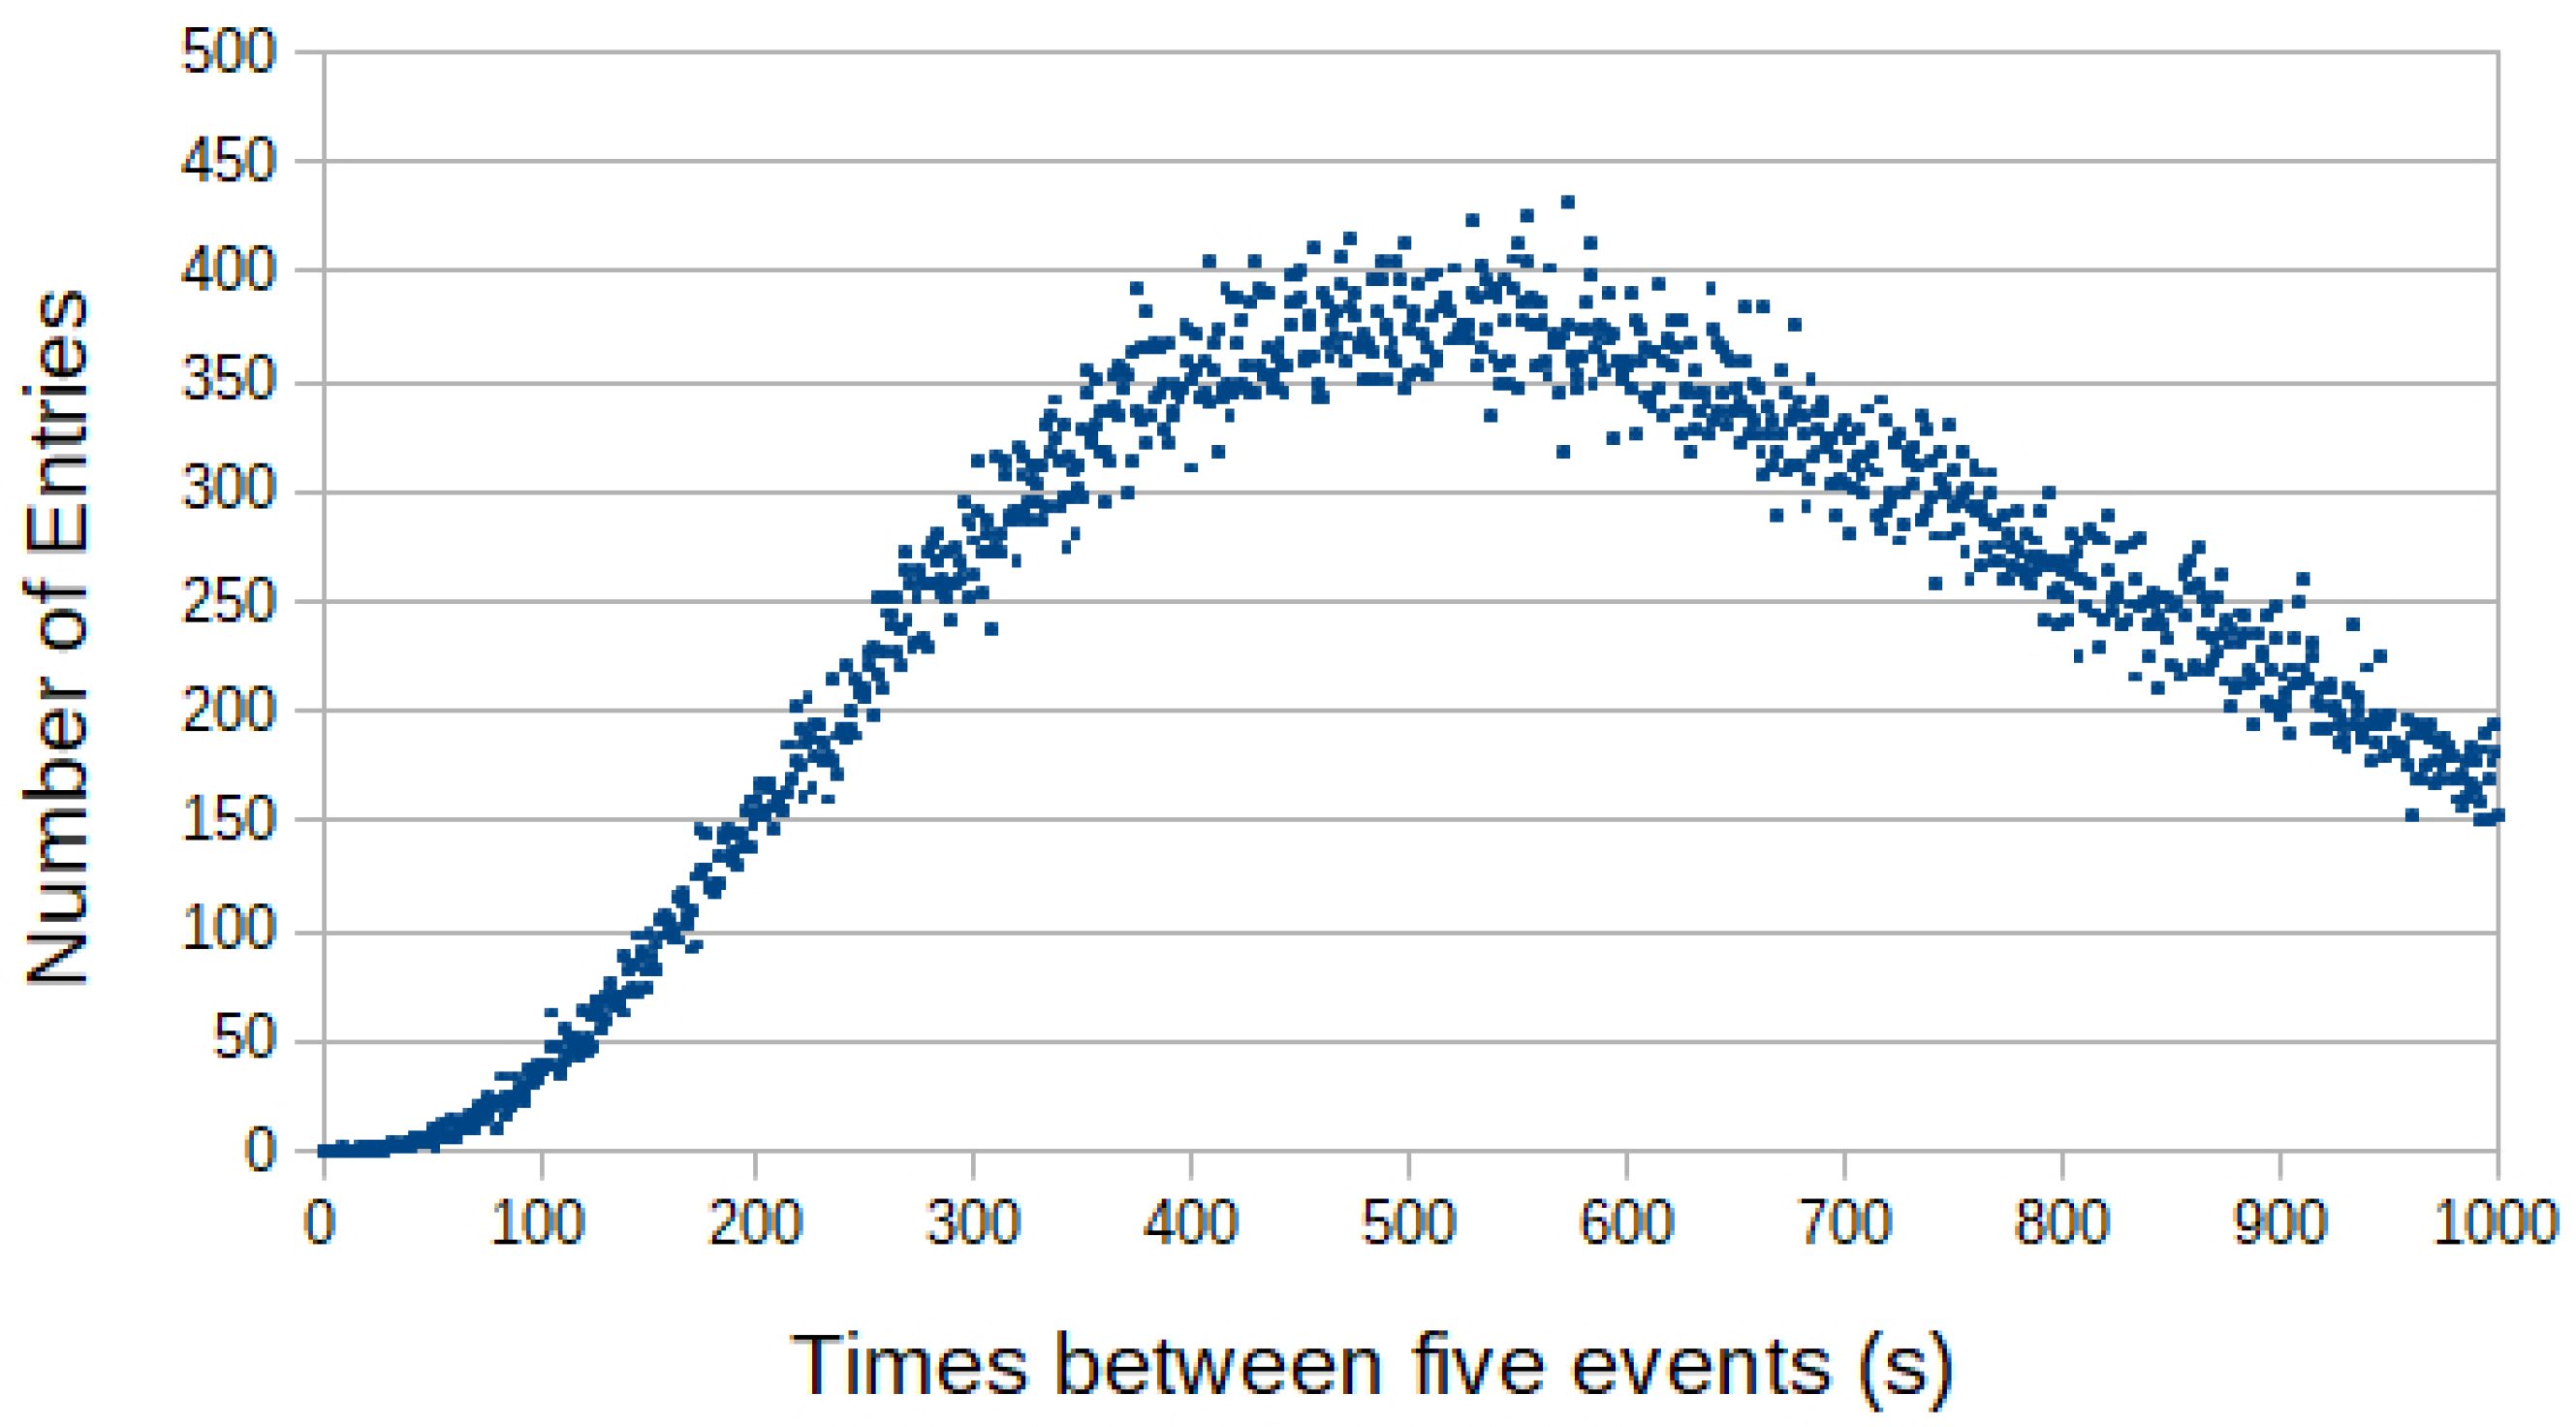
3.1. Event Spacing Distributions

We have examined our ~300 k event dataset to study the distributions of time intervals between groups of events. The intervals between individual events should have an exponential distribution, with the exponent being related to the mean event time spacing. This exponential is shown in red in Figure 2, and the exponential fit provides the mean event spacing.
The distributions for times covering multiple events can be derived, and a measured distribution for times covering five events is shown in Figure 3.

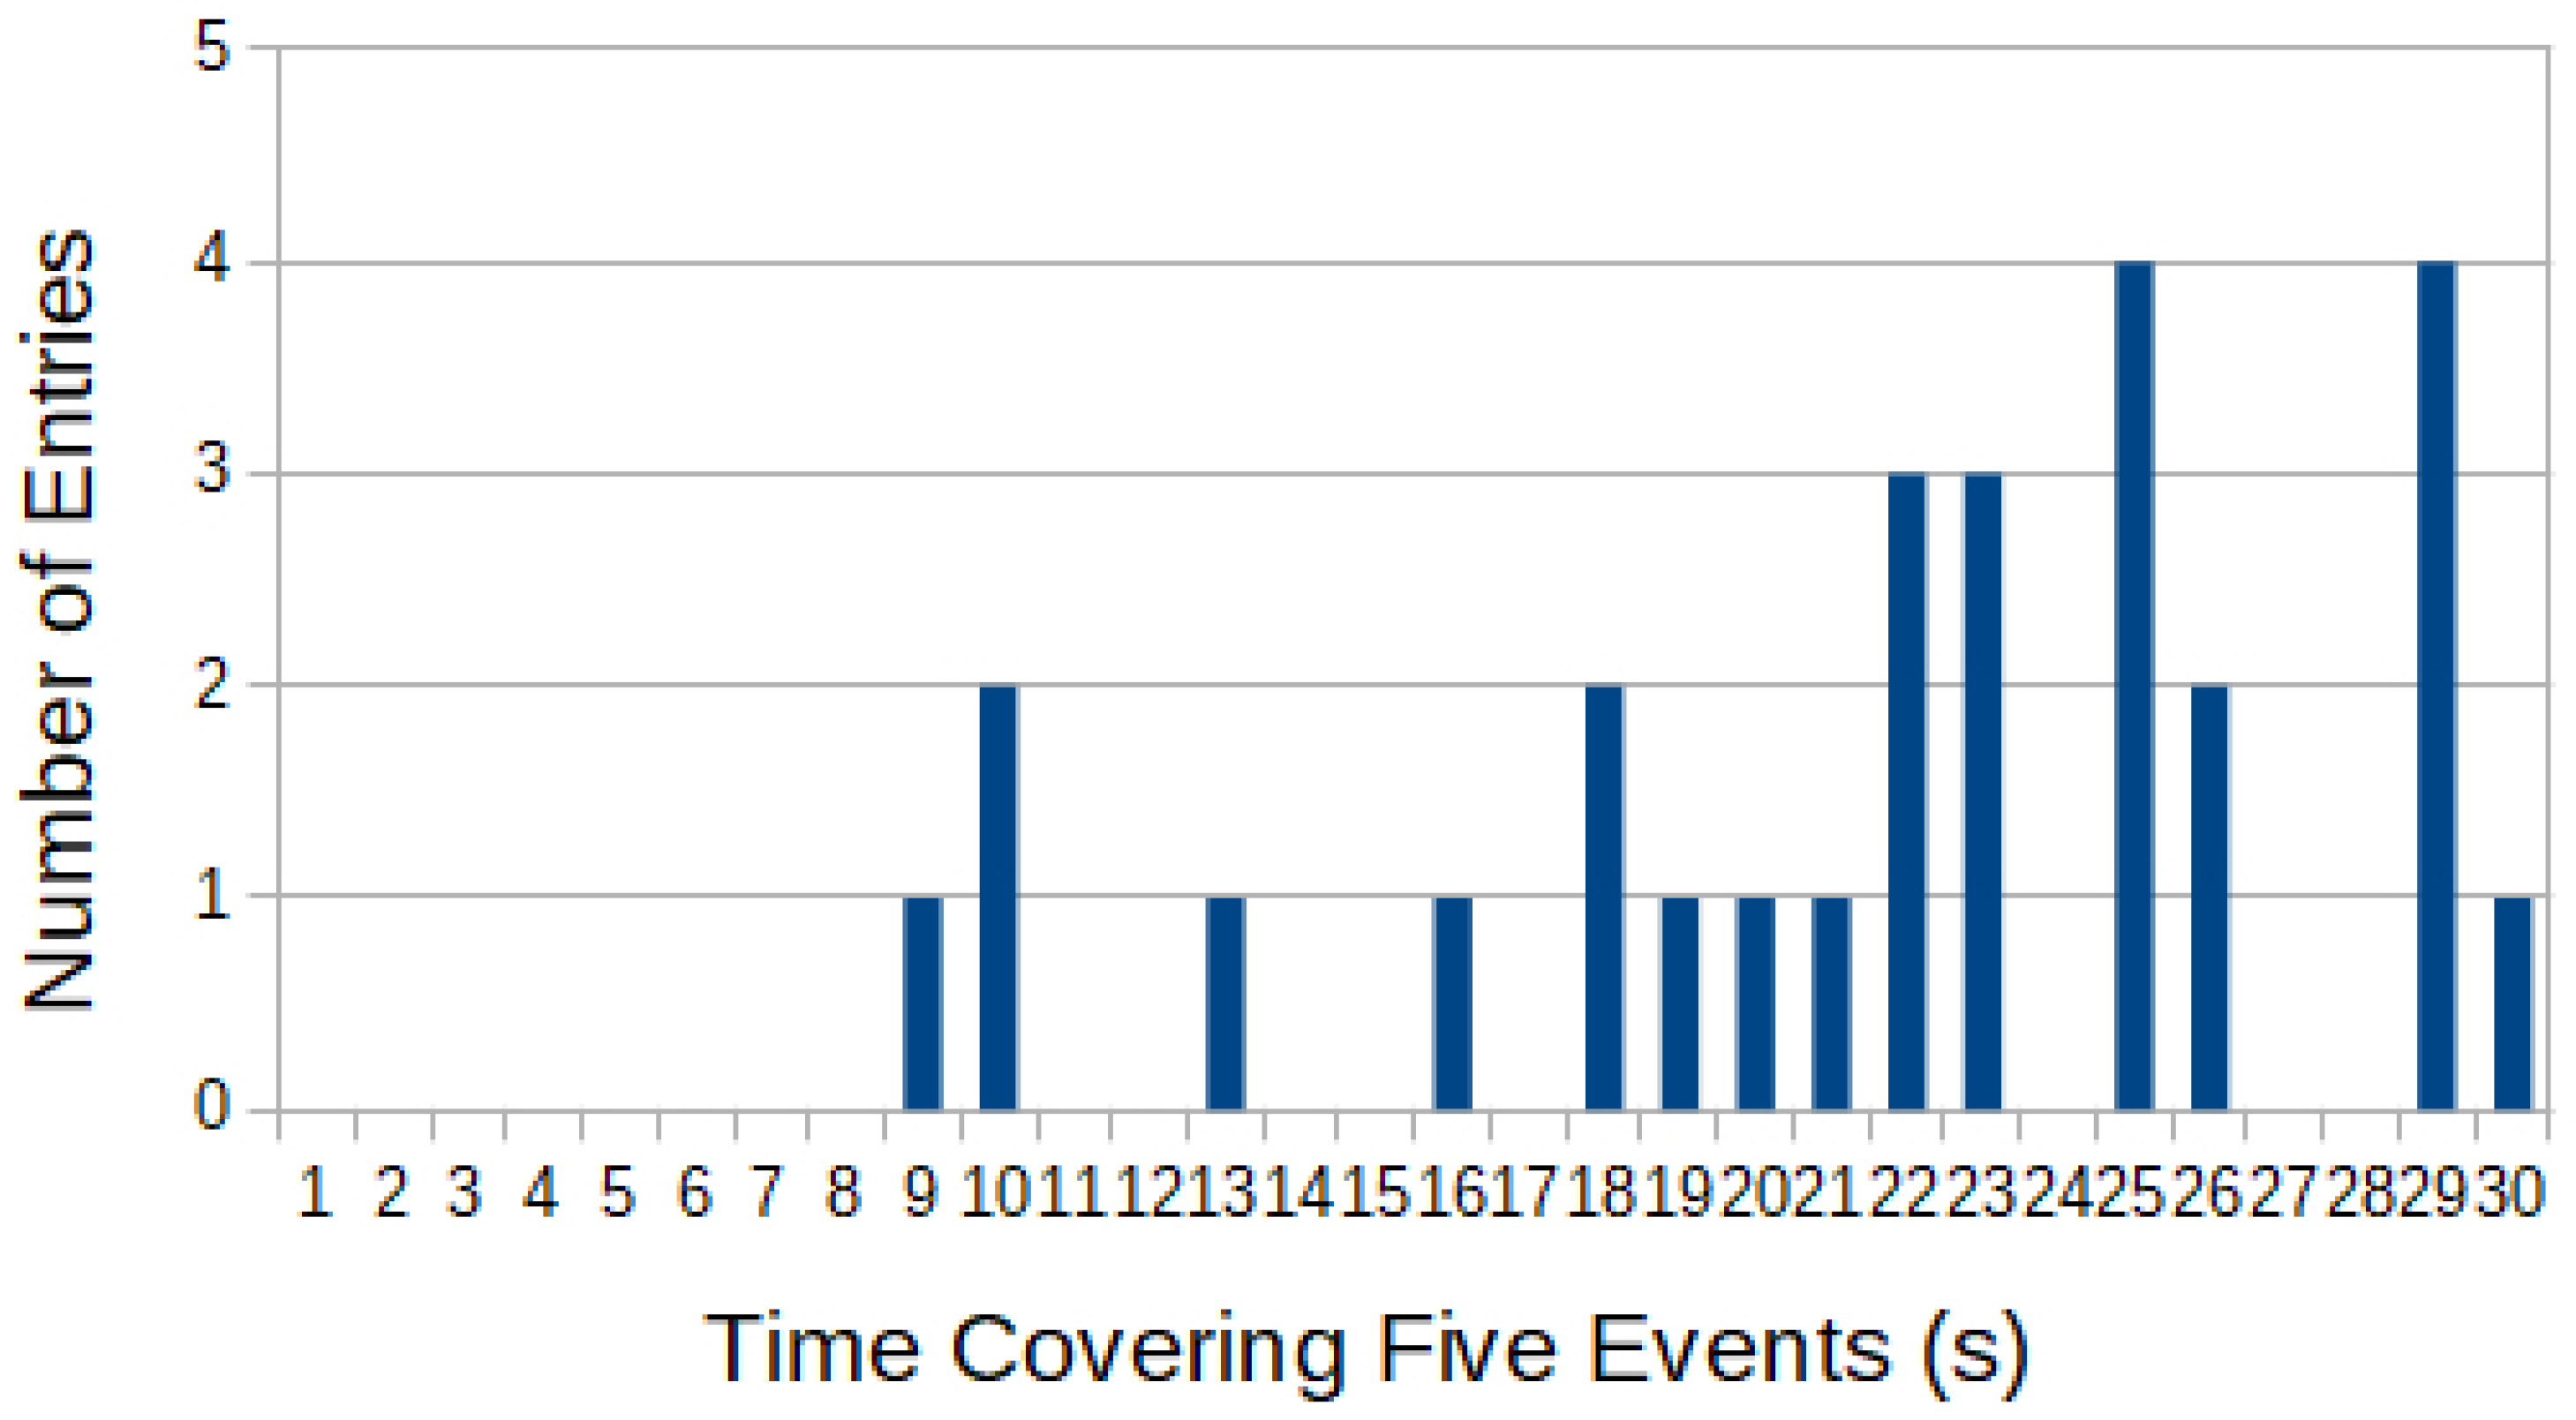
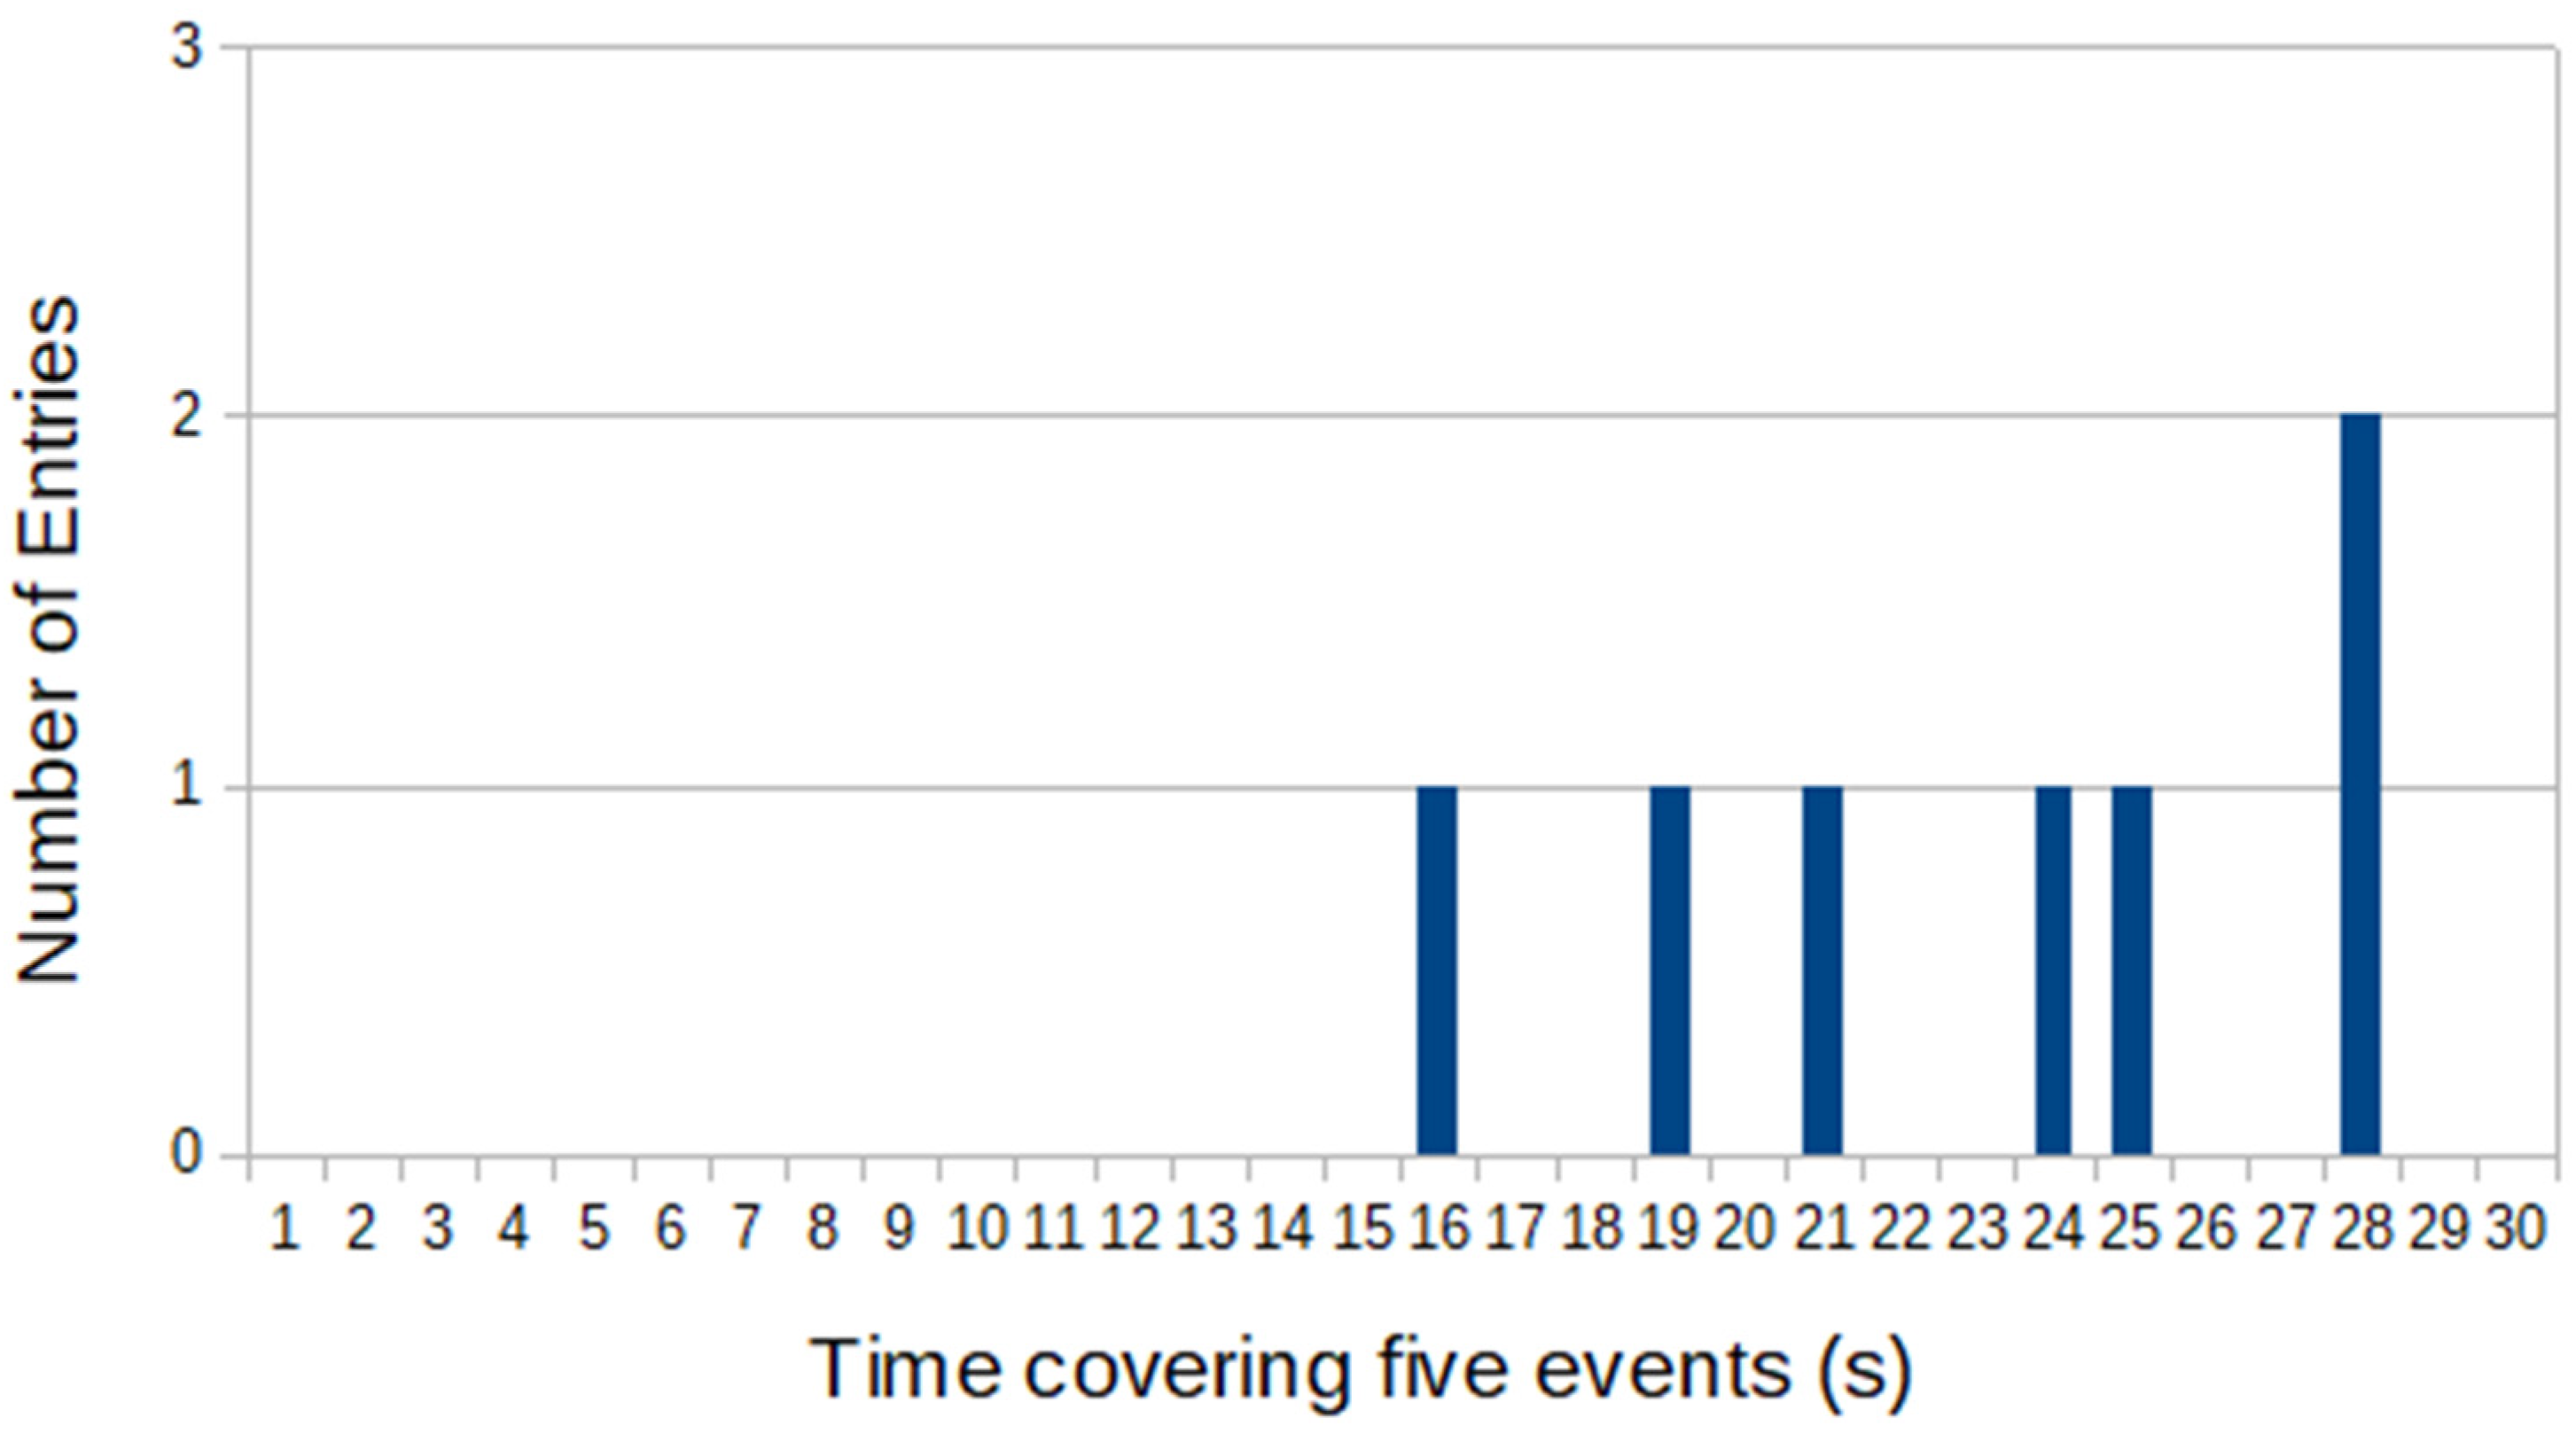
3.2. Examining Five Event Time Spacings at Small Intervals

There are two datasets under consideration. They were recorded with differing deadtimes, and the time periods covering groups of five events will have different distributions. These differences are most clear at the small time periods that are of interest when searching for bursts. We have modelled the expected number of bursts (event groups covering a particular time period) as a function of total time spacing (covering five successive events) through an analytic calculation for events with zero deadtime (this calculation is equivalently described and derived by Smith et al. [7]). We have also extended these calculations through toy Monte Carlo calculations using the measured (fixed or variable) deadtimes. The latter calculations successively sample possible event spacings from exponential distributions, as in Figure 2, to find the total time spacings for the required numbers of events. Those total time spacings are recorded as in the real experiment. Deadtimes are incorporated for each individual arrival either by ignoring potential following events, which arrive before a previously fixed deadtime is complete, or before a sampled variable deadtime is complete. The Monte Carlo calculations correctly describe the spacing distributions between successive groups of five events for a very small dead time (0.05 s) when compared to the analytic calculation and depart from this at small spacings when real deadtimes are applied.
For events with 0.5 s deadtime, 4 × 10⁶ Monte Carlo events failed to produce any bursts that had a total spacing of 10 s or fewer for five successive events. That is, no burst events were expected on a random basis for the real 300 k database. The analytic calculation (0 deadtime) expected 0.08 bursts with those selection criteria. We note here that a zero deadtime will inevitably give a larger number of bursts than in reality, and, if the Monte Carlo calculation is repeated for a much smaller deadtime (0.05 s), as noted above, its result will be compatible with the analytical value. Compared to an expectation of <0.08 bursts, two bursts were found, Figure 4 (Poisson probability for two or more ~0.003).
For the 100 k events with GPS timing (deadtime 1.0 + (0–1.0) s), no five-event bursts were expected in the interval 0–10 s, and none were found (Figure 5). Based on 8 million Monte Carlo events, 0.125 bursts would have been found in the interval 0–20 s. Two events were found to fit the relevant criteria; see Figure 5. The Poisson probability for two or more events is ~0.007. These two events occurred on 25 March 2021 04:05:16 UTC and 1 September 2021 14:30:49 UTC.

4. Discussion

4.1. Interpreting the Bursts

The two bursts fitting the 10 s (without GPS) a priori criterion occurred on 18 June 2019 05:15 UTC (six events in total from 05:15:53 to 05:16:03) (atmospheric pressure 1022 mb) and 19 July 2019 18:47 UTC (8 events in total from 18:47:42 to 18:48:30 with recorded between-event spacings 6, 18, 14, 3, 0, 6, 1 s) (atmospheric pressure 1012.5 mb). A spacing of 0 s results from two events arriving within the same UTC second. This is possible with 0.5 s dead time. The corresponding array local sidereal times were 9.36 h and 0.97 h, being the right ascensions of the array zenith at those times.
The events in the 19 July burst seem to be broadly as expected. All have good timing data, and all have some signal in a small nearby particle calorimeter. On the other hand, the June 18 events mainly have good (but small) particle density signals, in many cases only just satisfying the event trigger requirements for the timing channels. There were generally no free parameters in event direction fitting for this burst. From the sparse timing data available, it appears that at least three of those events arrived from a direction close to the zenith (zenith angle below 20°). As a result, it appears that the consistent events within the burst probably had arrival direction right ascensions that were close to the local sidereal time (9.36 h).
We are confident in the timing data for the 19 July burst. We note that this 19 July burst could be regarded as having significantly exceeded the a priori criterion since it probably contained more than five events in total, that is, eight events in a period of 48 s within a dataset having a mean single event time spacing of ~160 s. In fact, our selection criteria originally classed it as two bursts.
For the dataset with GPS timing, the 25 March 2021 burst consisted of five events, each with good timing data (atmospheric pressure 1009.3 mb), and the 1 September 2021 burst had five out of five events with good event timing data (atmospheric pressure 1012.7 mb).

4.2. Detector Timing Data

If a burst is observed, in addition to events being observed within some a priori time period, one might expect that the arrival directions of individual events in the burst would be similar. In achieving a certain number of events in a particular time period, the burst may have been identified because underlying burst events arrived together with one or more true random events. In this case, only some of the events would demonstrate a similarity in arrival direction. With our array, as we noted, arrival direction uncertainties from fast timing of the shower front are substantial due to the small size of the array and the intrinsic thickness of the shower front. We have therefore examined the lower-level timing data of the burst events to study any timing discrepancies between triggered detectors in events that make up a burst.
Most of the events recorded in the four bursts are clearly ‘good’ events (apart from the 2019 June 18 burst, which contained mainly small events without sufficient redundant timing information) in the sense that correct correlation is found between inter-detector times within an event, as expected. Figure 1 shows a schematic of the array. The top-row detectors are labelled 0, 1, 2 and the bottom-row 4, 5, 6 (left to right). A plane shower front would be expected to have similar time differences between the triggering of successive detectors (evenly spaced) in the upper row and in the corresponding successive detectors of the lower row. A similar result would apply between corresponding detectors in the upper and lower rows, although with a smaller physical separation and thus greater relative uncertainty. For instance, when triggered, similar time differences should be recorded between detectors 2 and 0 as for 6 and 4 and similarly for detectors 0 and 4, 1 and 5, plus 2 and 6. (See Figure 1). ‘Good’ events exhibit consistency in these times when allowance is made for hardware timing uncertainties. Timing is made relative to the triggering of detector 3, which is a necessary detector in the trigger requirements.
When looking for agreement in timing differences between events in a burst, such as for events from a common direction, we considered timing to be in agreement if corresponding detector times relative to detector 3 were within 9 ns (differences in time between 1 and 3, 2 and 3, etc. being similar between events). Each detector trigger time was measured from the trigger of detector 3 so that ‘between-event timing’ for each detector now depended on the uncertainty of detector 3 trigger time combined with the uncertainty in the other detector trigger. We found that each potential burst contains some uncorrelated events, some of which appear correlated as expected. In the recorded bursts, 19 July 2019 had five out of eight events (plus one that is uncertain), which have correlated timing data between events (three plus one uncertain out of the original five events which arrived within 10 s); 25 March 2021 had four out of five events with correlated timing; and 1 September 2021 had four out of five events. On the basis of randomly selected events in groups of five for the whole dataset, we found that about 40% had two events that would be regarded as correlated using the above criteria, 20% would have three, and 3% would have four. Events in the bursts clearly exceed these values.

4.3. Burst Directions

In total, three possible bursts were found that fit a priori acceptance requirements. A fourth burst was identified at local sidereal time of 9.36 h; however, it contained mainly small events that failed a criterion that the between-events data could be used to identify any possible timing inconsistencies. The events within the three bursts that had correlated times (see previous section) had arrival directions that the array could determine, although with an angular resolution, which was poorer than ~20° and not uniform in azimuth. Those directions were derived from fast-timing fits to detector trigger times, assuming a plane shower front. This resulted in a measured mode for the zenith angle distribution of 19°, which is compatible with expectations for an array sensitive to the electromagnetic component of cosmic ray showers. The directional limitations were due to the small size of the array, the timing thickness of the shower front, and the non-symmetric dimensions of the array. If the directions of the correlated events within the bursts are examined, the following mean directions are derived (the uncertainty is the standard deviation of the measurements) (see Table 1).

4.4. Event Times within the Bursts

In the four possible bursts, one can derive the time of the events relative to the first event of the burst. Figure 6 shows those times for the four bursts. The two 2019 bursts have timing to 1 s (yellow, green); the 2021 bursts have timing to 1 ms (blue, red).

4.5. Interpretation

As noted above (e.g., references [6,7]), there have been a number of apparent observations of correlated cosmic ray events. These have mainly been at energies similar to those studied in this paper, although that could merely be a result of small air shower arrays necessarily being sensitive there. This work has attempted to define burst selection criteria a priori in order to eliminate the possibility of there being many underlying and unknown statistical trials. This air shower array suffers from a lack of temperature control, and the data are not compensated for atmospheric pressure variations. Our burst events were recorded in cooler times of the year: one at night (early morning local time) and three in the afternoon. The array does not have a large temperature variation in its trigger rate, but the distribution with time of day needs to be considered if further bursts are found. Those effects should be considered, and we have examined the latter variations in toy Monte Carlos. On the basis of recording four bursts with 400 k events, given the two periods with different deadtimes but with the mean event rate, the probability of that result is ~10−8. However, the event rate was not constant over the 2.5 years due to temperature changes and atmospheric pressure changes. If the mean event rate at the time of each burst (the average over five days before and after the event) is considered, an individual Monte Carlo calculation for each burst results in a combined probability of 2 × 10⁻⁵ for those four bursts to be found. This is because the likelihood of a burst depends strongly on the underlying event rate. With a nominal mean rate of ~6 mHz, few events are found in any given day, and the true underlying rate at the precise time of each burst is not known. Additionally, there is a continuous atmospheric pressure variation which, again, affects the underlying event rate [11]. If one takes the variation in the daily rate over the five days before and after each burst and makes an allowance for the uncertainty in the pressure variation of the rate (which varies in magnitude by up to −1% mb−1), the probability of finding those four bursts by chance rises towards ~10−4.
Spatially or time correlated cosmic ray events are not expected, but those parameter spaces have not been exhaustively searched. If such (time correlated) bursts or CREDO-like spatial correlations are found, then a neutral particle origin or a local cosmic ray interaction would seem to be necessary. Photons at PeV energies interact in the pervasive cosmic microwave background or other photon fields in the cosmos, limiting their range. This limits the possibility of the bursts being gamma-ray bursts. It is possible that local interactions could result in bursts. They might be in local magnetic fields [13], but that proximity would make it unlikely that generated bursts would have durations as long at tens of seconds.
The energies studied in this work are close to the knee of the cosmic ray spectrum, and events with such energies are generally assumed to have galactic origins, with the knee possibly representing a galactic energy limit. Recently, there have been reports of galactic gamma-ray sources with particle energies approaching those studied here [14,15]. Those source discoveries by HAWC and LHASSO relate to northern hemisphere galactic directions but the southern galaxy, which is viewed here, includes particularly interesting regions, such as the galactic centre and the inner galaxy. High-energy gamma-ray sources are known to vary episodically and could produce burst-like episodes. Southern hemisphere studies of high-energy gamma-ray sources and their variability have great discovery potential. Thus, extensions of studies such as this will be particularly interesting.

5. Conclusions

A search has been made for bursts in two time series of southern hemisphere cosmic ray events with an energy threshold of about 0.1 PeV. The criterion selected for a burst in the first time series was that there should be five events (four spacings) within a period of 10 s with an event rate ~6 mHz and an event deadtime of 0.5 s. Two bursts were recorded in 300 k events. The criterion for a burst in the second time series was that there should be five events (four spacings) within a period of 20 s with an event rate ~6 mHz and an event deadtime of (1.0 + (0–1.0)) s. Two bursts were recorded in 100 k events. Monte Carlo modelling indicates that the probability of any single one of these events is ~1%. Taking the estimated event rates at the time of each burst, the combined chance probability rises to <10−4.

Author Contributions

Conceptualisation, R.C. and P.H.; Formal analysis, R.C.; Investigation, R.C., J.S. (Jassimar Singh), P.H., O.B., D.B., A.B., G.B., Ł.B., N.B., D.E.A.-C., N.D., A.R.D., D.G., A.C.G., B.Ł., J.M. (Justyna Medrala), M.N., M.P., K.R., J.Z.-S., K.S. (Katarzyna Smelcerz), K.S. (Karel Smolek), T.S., J.S. (Jaroslaw Stasielak), S.S., O.S. and A.T.; Methodology, R.C., P.H., M.V.M. and J.S. (Justinya Miszczyk); Project administration, R.C.; Resources, R.C. and M.N.; Software, R.C., J.S. (Jassimar Singh) and M.N.; Validation, R.C., J.S. (Jassimar Singh) and P.H.; Writing—original draft, R.C. and P.H.; Writing—review & editing, R.C., J.S. (Jassimar Singh), P.H., O.B., D.B., A.B., G.B., Ł.B., N.B., D.E.A.-C., N.D., A.R.D., D.G., A.C.G., B.Ł., M.F., M.V.M., J.S. (Justyna Medrala), J.M. (Justyna Miszczyk), M.N., M.P., K.R., J.Z.-S., K.S. (Katarzyna Smelcerz), K.S. (Karel Smolek), T.S., J.S. (Jaroslaw Stasielak), S.S., O.S., A.T. and T.W. All authors have read and agreed to the published version of the manuscript.

Funding

This research received no external funding.

Data Availability Statement

The data presented in this study are available on request from the corresponding author. The data are not publicly available due to being teaching material belonging to the University of Adelaide.

Acknowledgments

We thank Neville Wild for his major contributions to the development of the roof array system.

Conflicts of Interest

The authors declare no conflict of interest.

References

  1. Homola, P.; Beznosko, D.; Bhatta, G.; Bibrzycki, Ł.; Borczyńska, M.; Bratek, Ł.; Budnev, N.; Burakowski, D.; Alvarez-Castillo, D.; Cheminant, K.A.; et al. Cosmic-Ray Extremely Distributed Observatory. Symmetry 2020, 12, 1835. [Google Scholar] [CrossRef]
  2. Auger, P.; Ehrenfest, P.; Maze, R.; Daudin, J.; Fréon, R.A. Extensive Cosmic-Ray Showers. Rev. Mod. Phys. 1939, 11, 288–291. [Google Scholar] [CrossRef]
  3. The Pierre Auger Collaboration. The Pierre Auger Cosmic Ray Observatory. Nucl. Instrum. Meth. A 2015, 798, 172. [Google Scholar] [CrossRef]
  4. Klebesadel, R.W.; Strong, I.B.; Olson, R.A. Observations of Gamma-Ray Bursts of Cosmic Origin. Astrophys. J. Lett. 1973, 182, L85. [Google Scholar] [CrossRef]
  5. Hawking, S.W. Black hole explosions? Nature 1974, 248, 30–31. [Google Scholar] [CrossRef]
  6. Fegan, D.J.; McBreen, B.; O’Sullivan, C. Observation of a burst of cosmic rays at energies above 7 × 10¹³ eV. Phys. Rev. Lett. 1983, 51, 2341. [Google Scholar] [CrossRef]
  7. Smith, G.R.; Ogmen, M.; Buller, E.; Standil, S. Possible Observation of a Burst of Cosmic-Ray Events in the Form of Extensive Air Showers. Phys. Rev. Lett. 1983, 50, 2110–2111. [Google Scholar] [CrossRef]
  8. Carrel, O.; Martin, M. Observation of time correlations in cosmic rays. Phys. Lett. B 1994, 325, 526. [Google Scholar] [CrossRef] [Green Version]
  9. Aglietta, M.; Alessandro, B.; Antonioli, P.; Arneodo, F.; Bergamasco, L.; Bertaina, M.E.; Castagnoli, C.; Castellina, A.; Chiavassa, A.; Cini, G.; et al. Search for chaotic features in the arrival times of air showers. Eur. Lett. 1996, 34, 231–2361. [Google Scholar] [CrossRef]
  10. Kitamura, T.; Ohara, S.; Konishi, T.; Tsuji, K.; Chikawa, M.; Unno, W.; Masaki, I.; Urata, K.; Kato, Y. Chaos in cosmic air showers. Astropart. Phys. 1997, 6, 279. [Google Scholar] [CrossRef]
  11. Clay, R.W.; Dawson, B.R. A Southern Hemisphere Search for a Nonrandom Component of Cosmic Rays. Aust. J. Phys. 1981, 34, 591. [Google Scholar] [CrossRef] [Green Version]
  12. Clay, R.; Singh, J. A Search for Bursts at 0.1 PeV with a small air shower array. In Proceedings of the 37th International Cosmic Ray Conference (ICRC2021), Berlin, Germany, 12–23 July 2021; Volume 298. [Google Scholar]
  13. McBreen, B.; Lambert, C.J. Interactions of high-energy (E > 5 × 10¹⁹ eV) photons in the Earth’s magnetic field. Phys. Rev. D 1981, 24, 2536. [Google Scholar] [CrossRef]
  14. Albert, A.; Alfaro, R.; Alvarez, C.; Camacho, J.R.A.; Arteaga-Velázquez, J.C.; Arunbabu, K.P.; Rojas, D.A.; Solares, H.A.A.; Baghmanyan, V.; Belmont-Moreno, E.; et al. Evidence of 200 TeV Photons from HAWC J1825-134. Astrophys. J. Lett. 2021, 907, L30. [Google Scholar] [CrossRef]
  15. Cao, Z.; Aharonian, F.; An, Q.; Bai, L.X.; Bai, Y.X.; Bao, Y.W.; Bastieri, D.; Bi, X.J.; Bi, Y.J.; Cai, H.; et al. Discovery of the Ultra-high energy gamma-ray source LHASSO J2108+5157. Astrophys. J. Lett. 2021, 919, L22. [Google Scholar] [CrossRef]
Figure 1. Plan view of the array. The scintillators are one metre squared, as indicated to scale on the diagram. For later reference, these detectors are labelled (red) as follows: top row, left to right, 0, 1, 2; middle detector, 3; bottom row, left to right, 4, 5, 6.
Symmetry 14 00501 g001
Figure 2. The distribution of times between successive events. The solid red line is the fitted exponential distribution (beginning after a spacing of 2 s to avoid dead time effects). The red line fit is f(t) = 1763 × exp(−0.00599 t) (t in seconds).
Symmetry 14 00501 g002
Figure 3. The distribution of times (seconds) covering five events (300 k events, 0.5 s deadtime).
Symmetry 14 00501 g003
Figure 4. The observed distribution of burst durations in a total dataset of 300,238 cosmic ray showers. Here, a burst is a succession of five events recorded by a system with 0.5 s deadtime.
Symmetry 14 00501 g004
Figure 5. The observed distribution of burst durations in a total dataset of 100 k cosmic ray showers. Here, a burst is a succession of five events recorded by a system with a deadtime of (1.0 + (0–1.0)) s. The bursts at 16 and 19 covered times of 15.553 s and 19.242 s (the burst marked 21 covered 20.931 s and did not pass our a priori burst length criterion).
Symmetry 14 00501 g005
Figure 6. The times of events (milliseconds) within four bursts, relative to the arrival of the first burst event. Bursts: June 2019, yellow; July 2019, green; March 2021, blue; September 2021, red.
Symmetry 14 00501 g006
Table 1. Directions of three bursts.
Date and Time (UTC)Mean RA (deg)Mean Dec. (deg)
19 July 2019 18:48:0625.8 ± 16−37 ± 12
25 March 2021 04:05:1616.5 ± 16−55 ± 4
1 September 2021 14:30:49173.7 ± 17−29 ± 11
Publisher’s Note: MDPI stays neutral with regard to jurisdictional claims in published maps and institutional affiliations.

