1. Introduction
Numerous studies have tried to detect the degree of symmetry existing in animal structures in such a way as to relate it to some factors and variables in which these structures have developed. These factors can be of diverse scope: some internal factors, such as the evolutionary degree and inherent genetics [
1,
2,
3,
4,
5,
6,
7]; and other external ones related to the environment in which they have developed, such as their environmental conditions, feeding levels, available resources and relationships with other animals [
8,
9,
10,
11,
12].
Some authors [
2,
13,
14,
15,
16] distinguish between two types of asymmetry: Directional Asymmetry (DA) and Fluctuating Asymmetry (FA). In Directional Asymmetry, there are significant geometric differences in the structure of each of the two sides of the parts of the animal under study. On the other hand, Fluctuating Asymmetry (FA) considers the two parts as a whole without exaggerated differences between the right and left side of the animal, taking the two parts as one structure with common features but distinguishing significant deviations between the elements on one side and their counterparts on the other. Some authors declare this type of asymmetry as the most common, and both internal and genetic conditions, as well as environmental ones, are those that influence its appearance to a greater extent [
6,
8,
17,
18].
There are numerous studies on the degree of asymmetry in different animal species in the literature. The first group of them analyze the factors and possible causes of asymmetry in all types of species of the animal kingdom, from vertebrates and invertebrates to unicellular species, as an adaptation to the prevailing environmental conditions at that time. Blum & Ott [
19] focus on the study of ‘cilia,’ cellular structures of short tab-like appendages, and evolutionary factors.
Jawad & Abed [
20] studied species of aquatic vertebrates, specifically the great lizard fish (
Saurida tumbil). They concluded that asymmetries are accentuated by the size of the specimen, as well as by the state of health of the animal and its population in a given location and period. They also related it to the degree of chemical contaminants in the water. Klingenberg [
21] conducted an exhaustive study of asymmetry in animal species; he related the degree of asymmetry to well-being, health, resistance to stress and functional performance capacity. He related FA to the genetic components of the animal and questioned some factors defended by other authors. He carried out experiments in order to correlate the causes, internal or external factors, with the degree of asymmetry. Palmer [
22] studies physical asymmetry traits based on geometric and morphological factors in different animal species, both invertebrates and vertebrates. He tries to quantify these values and provide causes of asymmetry based on their behavior and evolution.
Other authors focused on mammals and humans. Manning & Ockenden [
23] concluded that racehorses with symmetrical features in the head and forelegs have more performance capacity than those with more asymmetrical features. Knierim et al. [
24] studied Fluctuating Asymmetry FA as an indicator of animal welfare, studying mammals, captive birds and humans. He created a variable DI that measured the degree of developmental stability of the animal and related it to the degree of asymmetry. DI depends on multiple factors mainly related to the environment, such as exposure to pollution, pathogens, external temperatures and genetic factors. He questions the studies carried out to date, considering them inconsistent due to the inadequate methodologies applied. To improve the reliability of studies that relate asymmetry to animal welfare, he proposes the application of the techniques and statistical aspects of FA analysis. Queen et al. [
25] study asymmetry traits in humans and other animals aimed at evaluating locomotor mechanics. In numerous trials and variables, they relate the risk of injury to the level of asymmetry detected. Vilensky et al. [
26] try to quantify symmetry equations, carrying out tests with cats, monkeys and humans based on body and limb movements. Guo et al. [
27] study bilateral asymmetry in cows and pigs using 3D techniques: scanners, artificial vision, videos and digital images; relating it to its genetic quality based on its better growth and conditions for reproduction. Møller et al. [
28] relate breast symmetry to the number of children, relating it to fertility and physical attractiveness for men. Manning & Pickup [
29] state that symmetrical features in young middle-distance runners, in nostrils and ears, are related to performance.
In the case of the study of cervids, numerous authors have tried to relate the degree of geometric divergence between the right and left sides of the antler to the degree of health of the animal [
30,
31,
32], its good reproductive genetics [
33,
34], its appearance to attract females for reproduction [
35,
36], its morphogeometric disposition to emerge victorious in struggles related to territorial dominance and mating [
18,
37,
38], its prime mature age [
31], its hunting quality [
7,
9,
32] and the degree of development of the geometric attributes of its antlers [
10]. All of these factors relate, ultimately, the symmetrical degree of the antlers of the right and left sides to cervids’ degree of health and dominance in their environment and their possibilities for reproduction.
The antler is considered a good structure for the study of asymmetry since it is renewed every year and provides a good indicator for detecting the ups and downs suffered by the animal [
9,
10]. Carranza [
9] establishes relations of the degree of asymmetry with the years in which the climatic conditions were more unfavorable and, therefore, with the worst availability of food. Azorit et al. [
11] establish the relationship between the age and conditions of the environment where the animal develops with the features of its antlers. The age of the specimens was determined through the cementum of the molars according to standardized procedures for the study area, Azorit et al. [
39].
Other authors studied the existence of asymmetry in the antlers of deer, previously defining its concept and typology. Leamy [
14] defined the two types of asymmetry: Fluctuating (FA) and Directional (DA). Valen [
13], Palmer & Strobeck [
2] and Pélabon & van Breukelen [
15] studied Fluctuating Asymmetry, stating that it occurs when quantifiable and random differences appear between the right and left sides. Klingenberg et al. [
16] indicated that Directional Asymmetry (DA) reflects significant differences between the right and left sides of the body. Palmer [
40] also concludes that it tends to highlight the greater development on one side of the body than the other.
Graham et al. [
4] and Møller [
31] suggest a change from FA to DA within a few generations. Palmer [
2,
3] affirms that DA is due to genetics and is sometimes related to a differential adaptive activity of the genome of each part of the antler. Møller [
31] relates DA to the factors of health and well-being, and stability in the development of the specimen. Other authors deny this [
3,
4], citing genetics as the cause of developmental stability and individual quality. Møller & Swaddle [
41] conclude that the increase in FA is related to a series of stress factors such as suboptimal temperature, lack of nutrition, chemicals in the environment, high population density, noise, and others. Pélabon & Joly [
7] study FA in fallow deer. They relate asymmetry to secondary sexual characteristics based on the selection of females or male rivals for mating. They affirm the existence of DA with the antlers, finding the right part to be the most developed based on the fact that the animal initially attacks that side in a fight with other males and moreover, that side is more pronounced with the age of the specimen.
Parsons [
42] and Møller [
30] suggest that FA is an epigenetic measure of stress and that deviations from bilateral symmetry are due to the sensitivity of antler development. Bateman [
43] and Mateos et al. [
18] indicate that the level of FA is given by the abilities of males to fight, obtain food, and deal with diseases and parasitism. Kruuk et al. [
17] and Ditchkoff & Defreese [
32] conclude that the degree of FA is not related to individual quality. Moller [
30] and Ditchkoff & Defreese [
32] affirm that FA decreases with the size of the antlers and with the age of the specimen since it is assumed that only those specimens of higher quality are capable of producing large antlers throughout their life.
Bateman [
43] and Mateos et al. [
18] indicate that the level of FA is given by the abilities of males to fight, obtain food, and deal with diseases and parasitism. Kruuk et al. [
17] and Ditchkoff & Defreese [
32] conclude that the degree of FA is not related to individual quality. Moller [
30] and Ditchkoff & Defreese [
32] affirm that FA decreases with the size of the antlers and with the age of the specimen since it is assumed that only those specimens of higher quality are capable of producing large antlers throughout their life. Mateos et al. [
18] question whether the degree of asymmetry is related to individual quality and the degree of animal stress. They highlight the inconsistency of previous studies and the importance of efficient statistical techniques and large sample sizes to obtain reliable variable relationships. They affirm that symmetrical and good-sized antlers represent a relevant factor in sexual selection during the best reproductive age.
Some authors have created methods and tools for quantifying symmetry, like [
5,
18,
30,
44], who estimated the asymmetry of different structures using classical linear measurement tools. Bartoš et al. [
1] estimate FA by analyzing three characteristics of the deer antler: its weight, the length of the shaft and the number of points. They used samples of 51 specimens aged between 3 and 8 years. By means of statistical techniques, it is verified if the differences for each part of the antler in each one of its parameters are adjusted significantly from a normal distribution with a mean value of zero.
Due to the complexity of the deer antler structure, Ditchkoff & Defreese [
32] used three-dimensional methodologies to estimate asymmetry. The asymmetry measurements of several features of the antler were calculated by measuring the distances of significant parameters of the antler on two planes, vertical and horizontal, obtained through points of the 3D model belonging to the geometry of the antler itself: the starting points of the central rod (burrs) and the middle point between the eyes. They initially used a series of between 9 and 12 photographs of the antler where relevant points had been marked with target stickers: the starting and ending points of tines and points on the central rod. Subsequently, the 3D model of the antler was obtained using multi-image photogrammetry software. The distances between the points with respect to the horizontal and vertical planes are estimated together with the angle of the segments on these planes. Statistical techniques were used to verify the degree of correlation between the measurements obtained.
The present study proposes a new methodology whose objective is to evaluate the degree of asymmetry in the structure of deer antlers by quantifying it through a new variable called AI (asymmetry index), whose values will range from 0 to 1 and which will be used in subsequent studies to evaluate the degree of symmetry of deer populations that have developed under certain environmental conditions. It is based on a 3D model obtained from a photogrammetric method that uses only two photographs, similar to the one developed by Rubio–Paramio et al. [
45]. From the 3D model, a vertical symmetry plane obtained by means of points located on the animal’s skull will be considered as a reference so that the right and left sides of the antler can be easily compared. Homologous points of the antler will be compared with each other: the starts and ends of the tines on one side with respect to the corresponding points on the other side, using the symmetry plane described as a reference. The distances between points and the angles of incidence that they form on the reference plane will also be analyzed.
This methodology is perfectly usable for the study of other types of biological structures: from microorganisms, where it is relevant to know geometric data of the volume and surface trajectories to estimate changes of state due to interactions with others, Alsaffar & Jarallah [
46] to other animal species, vertebrates or invertebrates. The photogrammetric process allows for obtaining geometric data of numerous animals in a short time because it does not require a large number of photographs, and their subsequent treatment is carried out with a versatile and accurate tool.
2. Materials and Methods
For the proposal of the asymmetry evaluation methodology, a sample of 48 specimens of (Cervus elaphus hispanicus) from different hunting reserves was used. The data were obtained in the south of Spain, in Andújar (Jaén). Twenty-one of them came from official homologation processes of hunting quality, such as hunting trophies and from taxidermy rooms; the rest came directly from hunting days, whose starting data was taken through photographs in situ.
2.1. Equipment Used
The data on the deer antlers were obtained from photographs of each specimen, the starting point for obtaining the 3D structure of the antlers. They were taken with a Nikon 300D reflex camera with a resolution of 4288 × 2848 pixels. In the process of photogrammetric restitution of the 3D model from the photographs, it was found that the deformation of the photos, especially in their periphery and corners, was lesser with this type of camera. According to Rubio-Paramio [
46], the deformations in the photos mean that the spatial restitution, when obtaining the three-dimensional structure of the antler, is imprecise. In the present study, the photographs were taken with a commercial SLR camera, Nikon 300D, with an 18–55 mm lens and a 23.6 × 15.8 mm CCD image sensor; therefore, the perimeter deformations of the photographs are not very significant compared to those taken with compact cameras.
To obtain the 3D model of the antlers and the subsequent measurement of their significant points, the 3D modeling CAD software SolidWorks v.2019 from Dassault Systèmes was used. No great requirements are needed for the hardware. An HP Pavilion PC, with a Core i7 processor and 16 Mb of RAM is sufficient. However, it is advisable to use a graphics card with enough memory for image processing. In our study, an Nvidia GeForce RTX with 6 Gb of memory was used.
2.2. Object of Study
In order to begin the study of the symmetry of the antler, the 3D model of its structure must be obtained. This 3D model consists of the central line (spine) of each of its parts: central rod, eye tines, trez tines and the tines of the crown. To obtain this 3D model, we applied the methodology described in [
45], which spatially restores the three-dimensional model from two photographs.
The method described by Rubio-Paramio [
45] is used to restore three-dimensionally the structure of the antler, in which from two photographs taken from different angles on the real object to be restored in 3D together with the determination of the exact position of the point of taking each photograph, and with the help of a metric reference that appears in each photograph, the point to be restored represented in both photographs is positioned in space by crossing rays from the points of taking the photographs to the same point represented in them. Taking into account that the 3D stereoscopy technique restores a spatial point represented in two photographs, the method described by Rubio-Paramio [
46] shares similarities with this technique.
The method described by Rubio-Paramio [
45] details the description of the photogrammetric method that allows the restitution of objects in space represented in two photographs taken from two different points of view. The 3D spatial restitution of points represented in both photographs is achieved by applying the fundamentals of photography, initially obtaining the spatial point from which each of the photographs was taken, all implemented within a 3D scenario created by commercial CAD-3D software. Subsequently, by crossing the projective rays launched from each of these two positions to the same point that you want to restore spatially represented in both photographs, the spatial position of that point is achieved. Only two photographs are necessary to obtain the spatial restitution of the required point. Taking a third photograph could be useful to obtain some more precision in its spatial location in order to dissipate the possible deformations in the photographs.
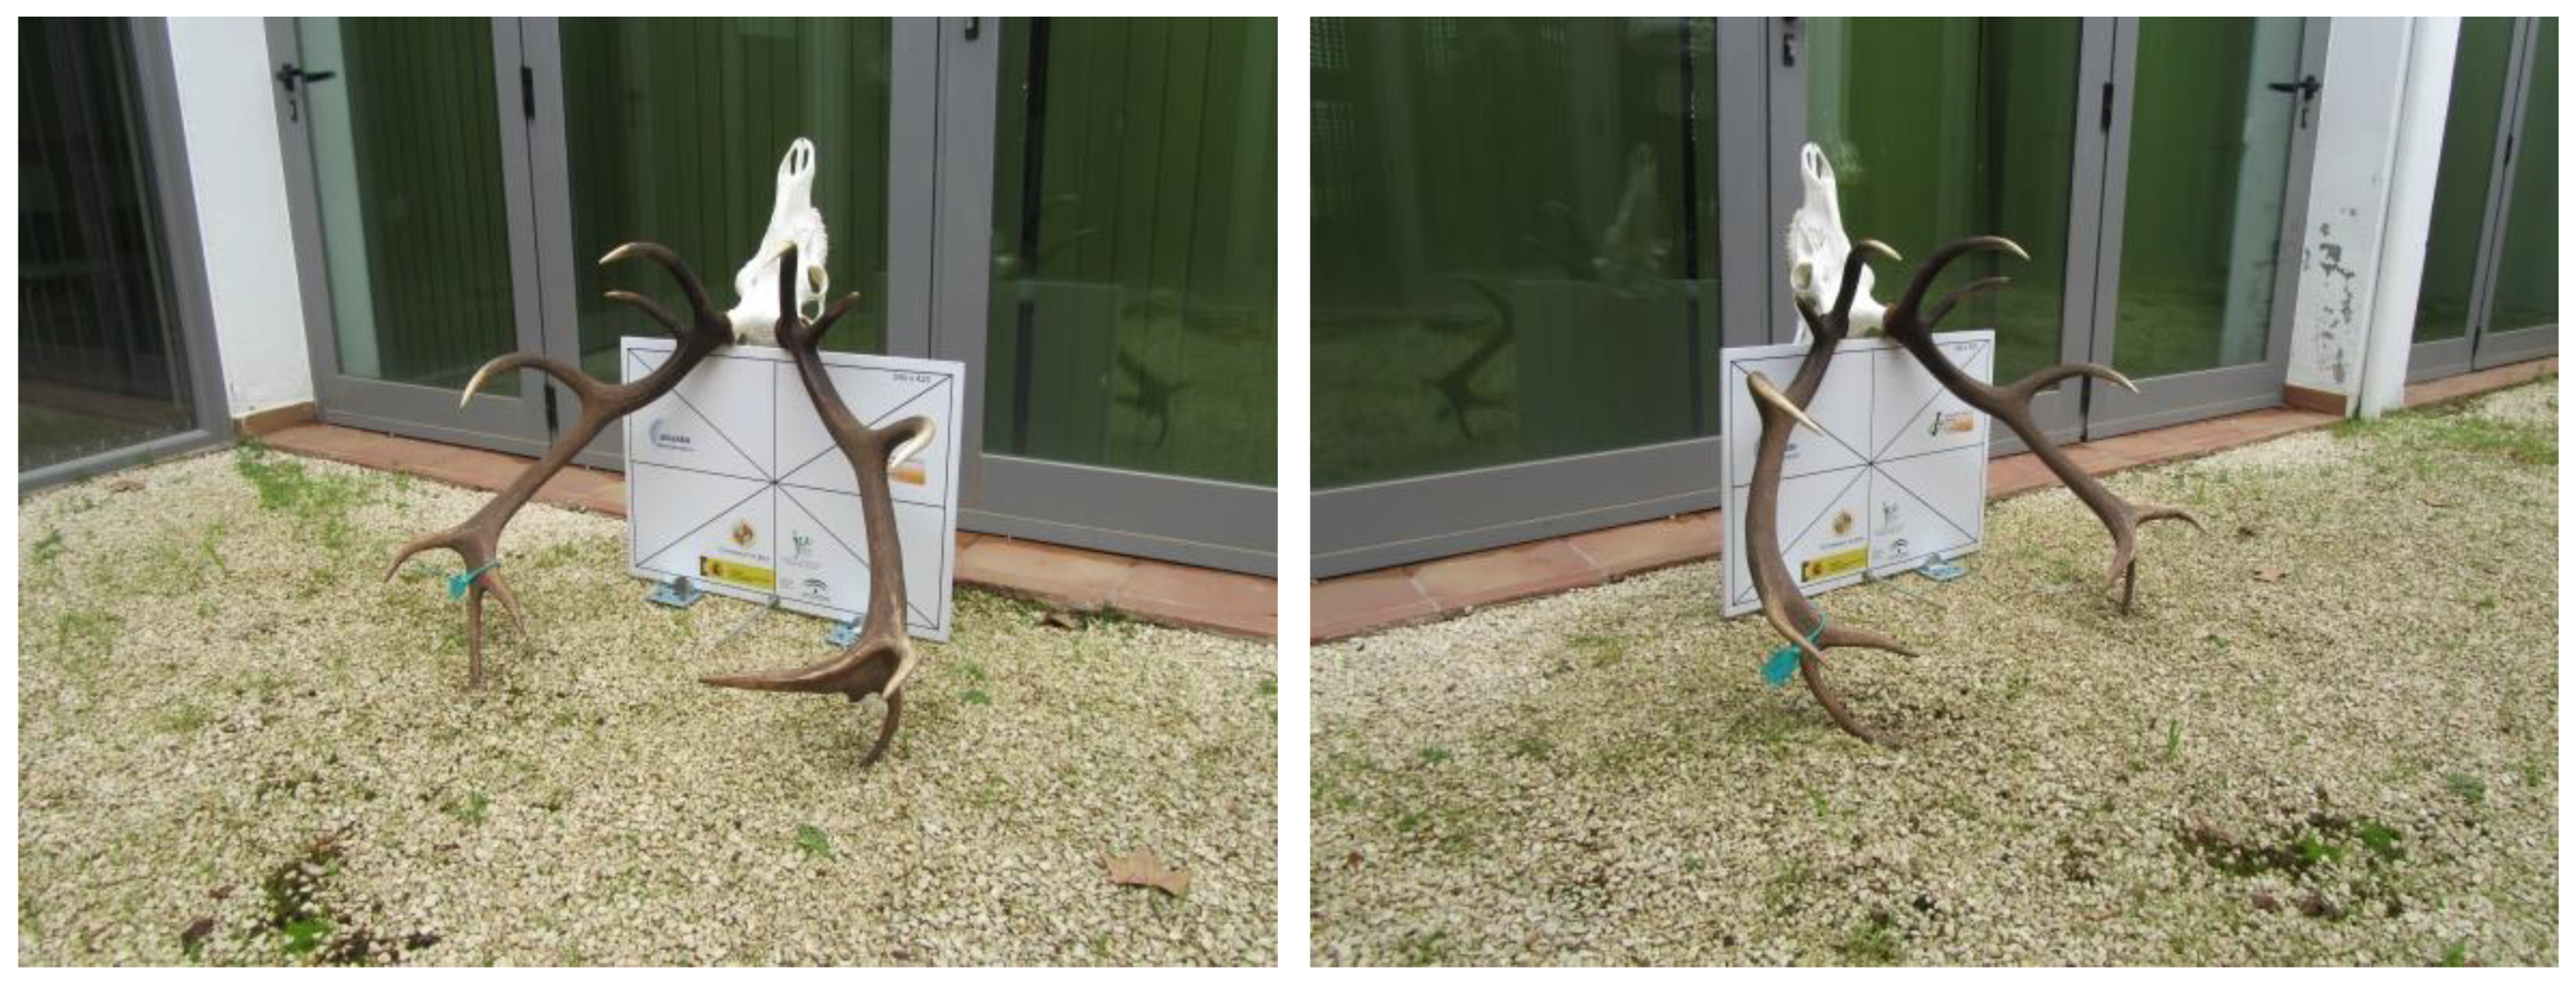
The result obtained after the photogrammetric restitution process from two photographs is shown in
Figure 1.
2.3. Geometric Data of the Deer Antler
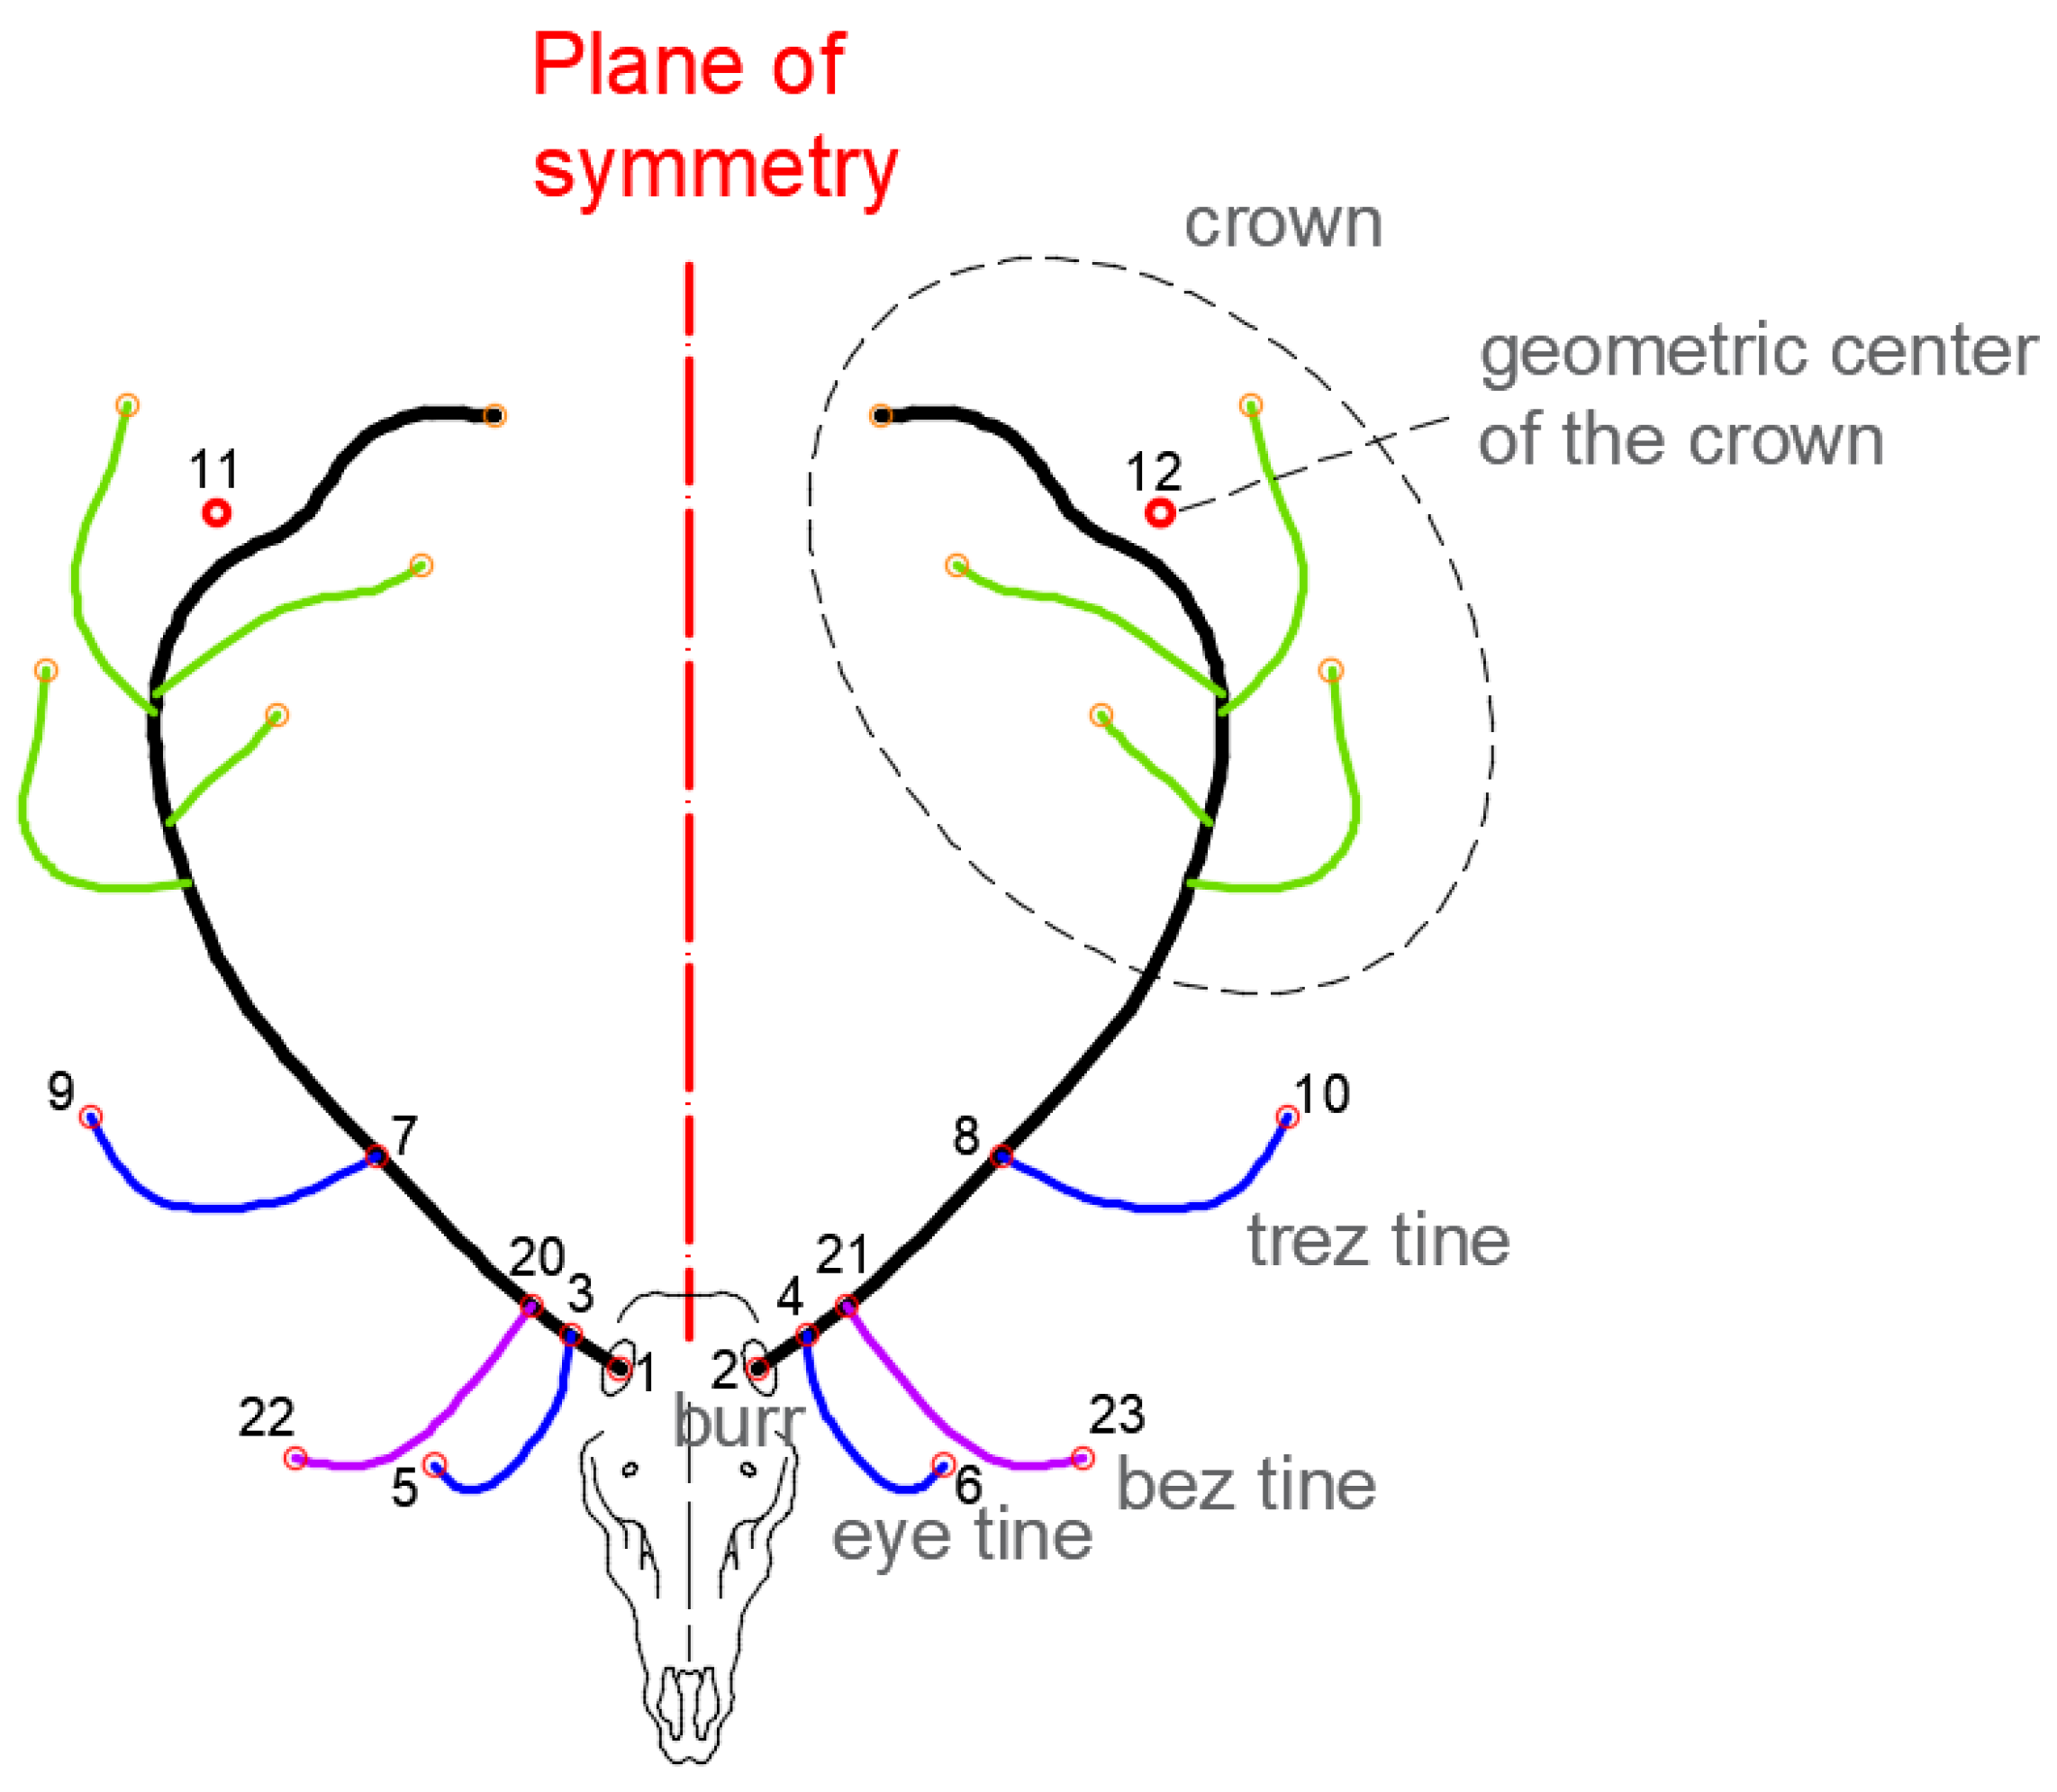
The proposed methodology considers the set of measurements taken on the points located in the most relevant parts of the antler. These are the ones that correspond to the significant points of the starting and ending points of the tines of the antlers (
Figure 2): the center of the burrs (1–2), the starting point of the eye tines (3–4), the ending point of the eye tines (5–6), the starting point of the trez tines (7–8) and the ending point (9–10), the set of extreme points of the crown tines (11–12) and, if the bez tines exist, their starting (20–21) and ending (22–23) points.
From the 3D wire structure of the antler, represented by its axis, the relevant points, such as the starting points of the eye tines and of the trez tines, are located by the contact of the intersection of the axis of these tips with that of the axis of the central shaft of the antler.
In the upper part of the deer antlers, starting from the trez tine, all the upper tips are considered to belong to the crown of the antlers. These tips present many irregularities in terms of number and geometric arrangement on both sides of the antler. Because of this, in order to study the degree of asymmetry in this part of the antler, the geometric midpoint of the ends of the tines of the crown on each side of the antler is considered, and the asymmetry value of both points is subsequently estimated on the plane of symmetry, thus allowing us to evaluate the degree of symmetry in the entire structure of the crown.
2.4. Method for Obtaining the Asymmetry Index (AI)
The proposed methodology will allow estimating and numerically quantifying a variable called the “Asymmetry” Index (AI), which represents the degree of global divergence between significant points of the antler structure as a whole with respect to a symmetry plane taken as a reference. This index will show the deviations or imperfections of the relevant points of the antler in its spatial location.
The type of asymmetry to be evaluated will be of the fluctuating type (FA), according to the typology described above, whereby the deviation of certain pairs of significant points of the antlers will be highlighted, using a central plane as a symmetry reference. The aim is to determine, for each point belonging to one part of the antler and its related point to the other, the deviations in length and perpendicularity with respect to the plane of symmetry, so that the degree of symmetrical divergence is represented by a single value.
Two asymmetry variables that have been considered in the method are defined below:
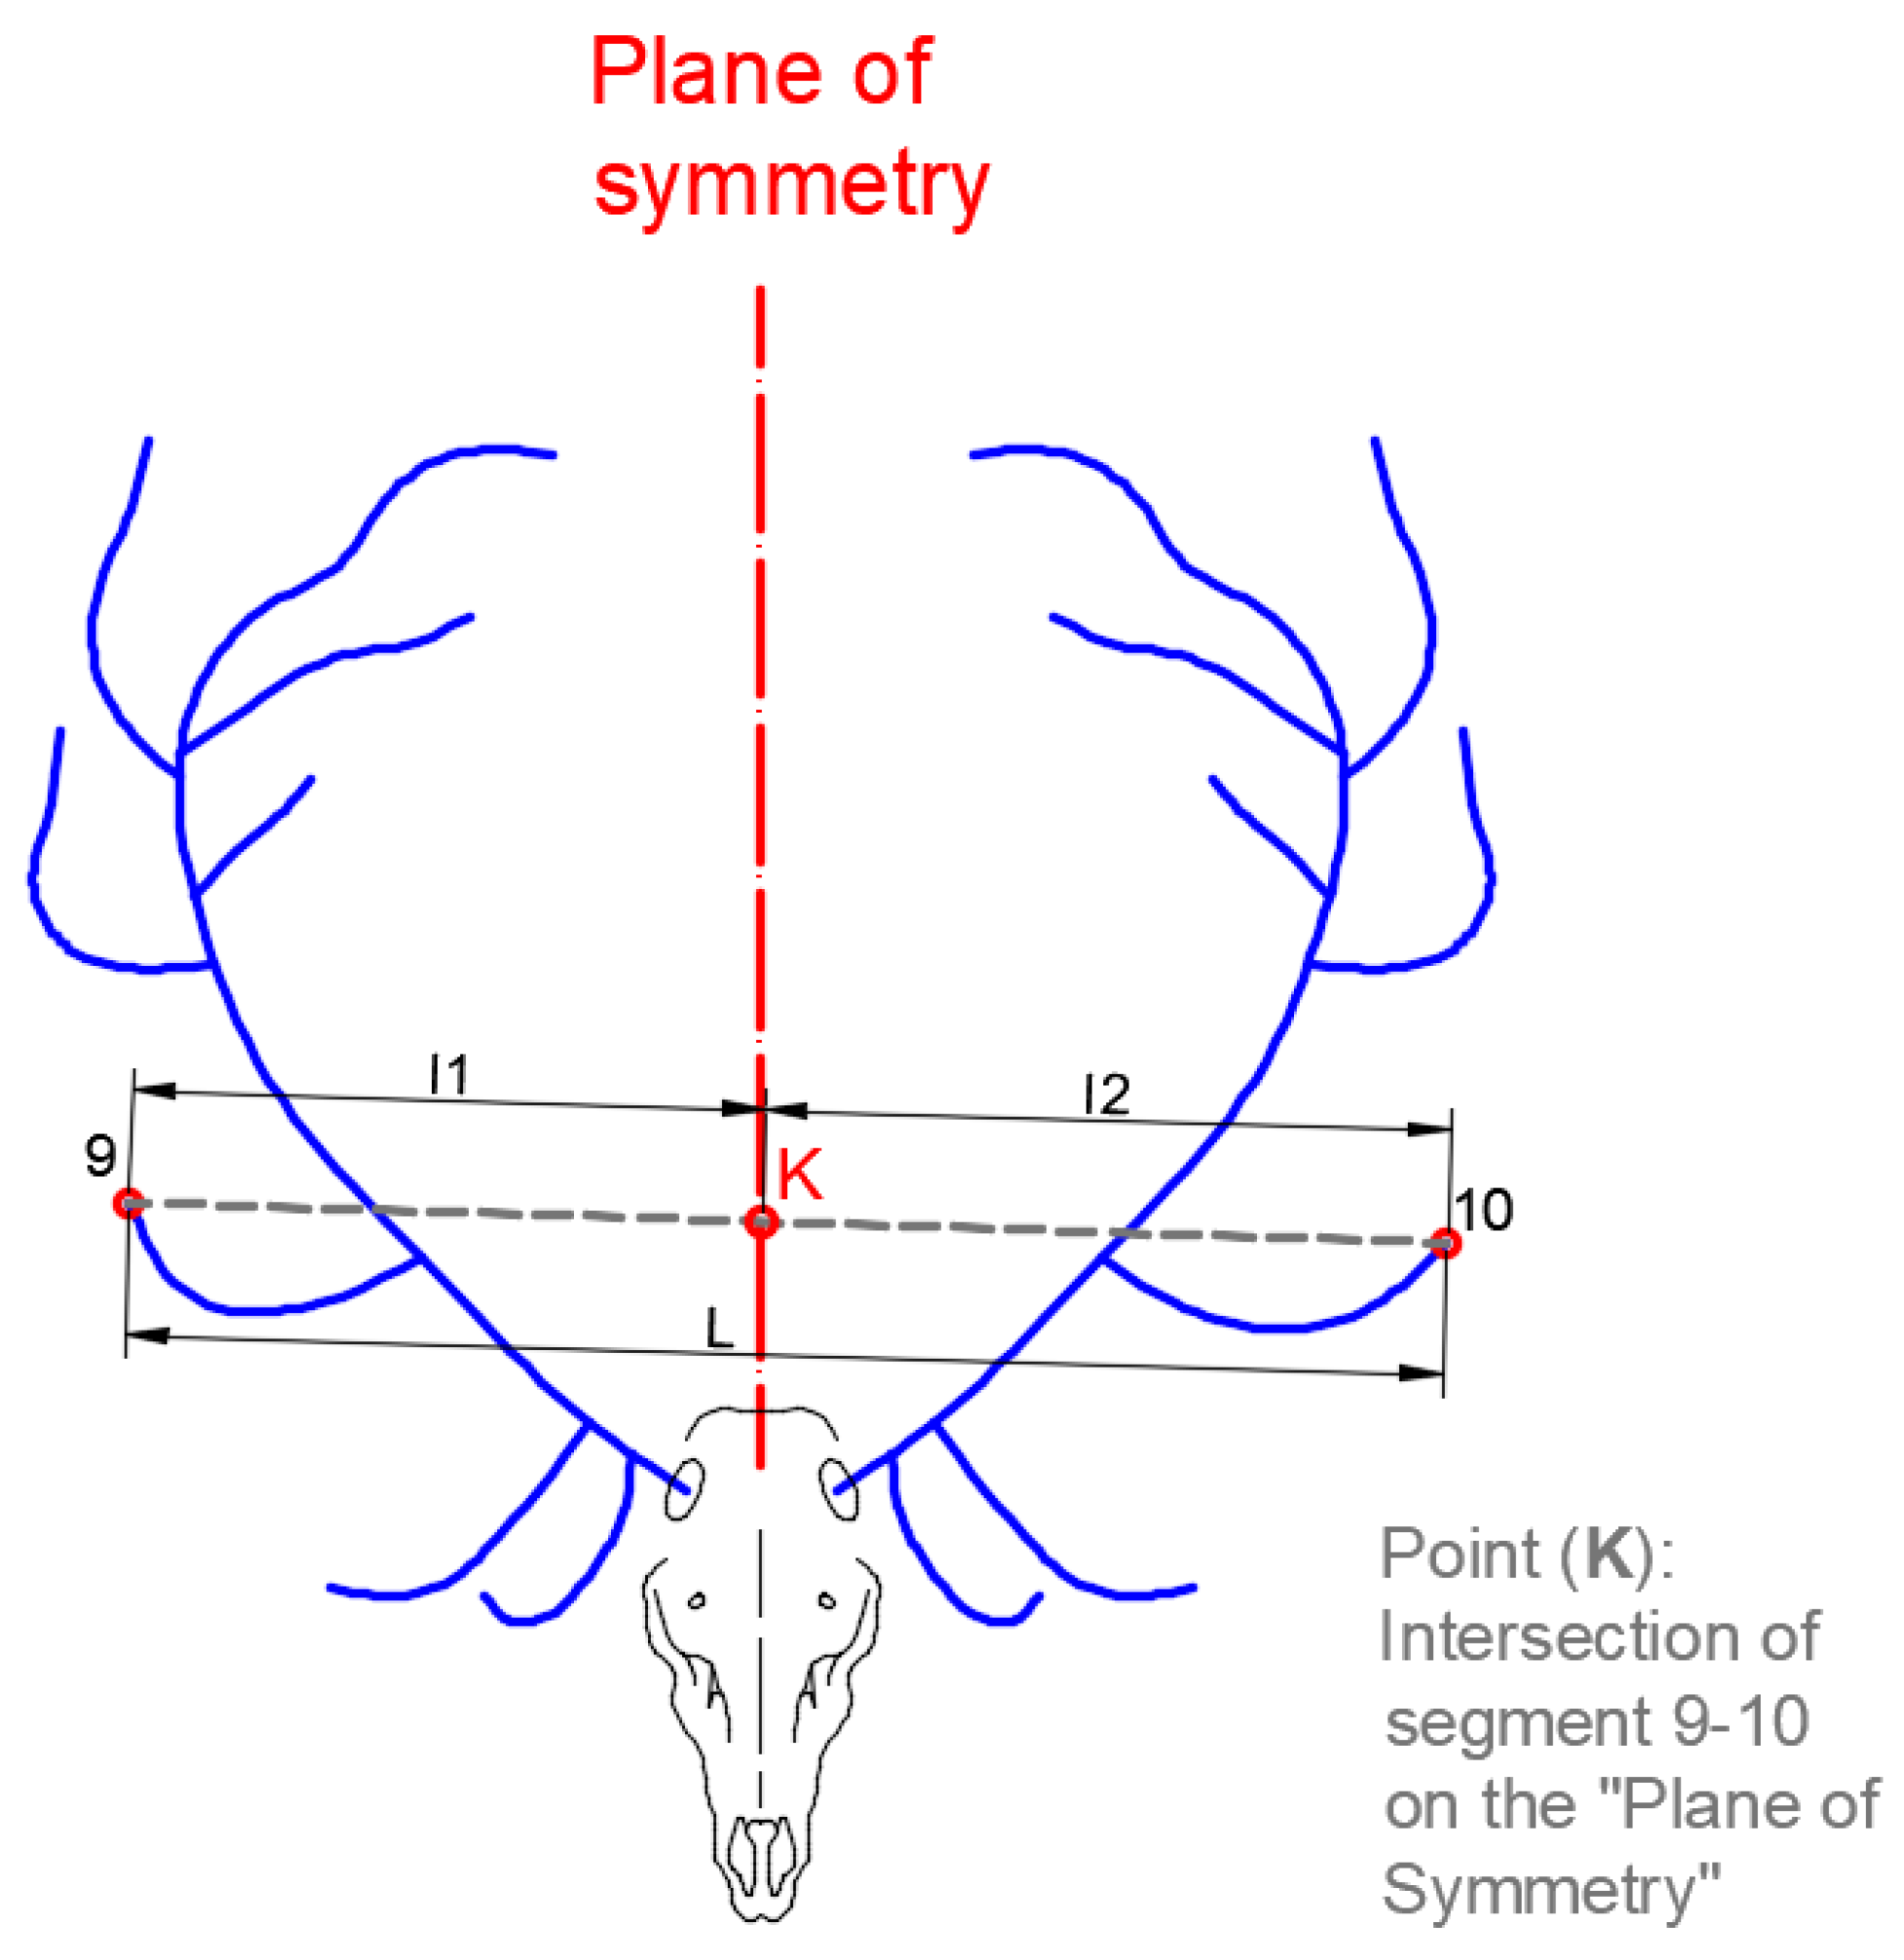
The ‘Asymmetry Index by Length’
describes the difference between the lengths between each point and the plane of symmetry (
Figure 3). The value of
is determined by Equation (1), where
L is the length of the segment that joins both points and
l1 and
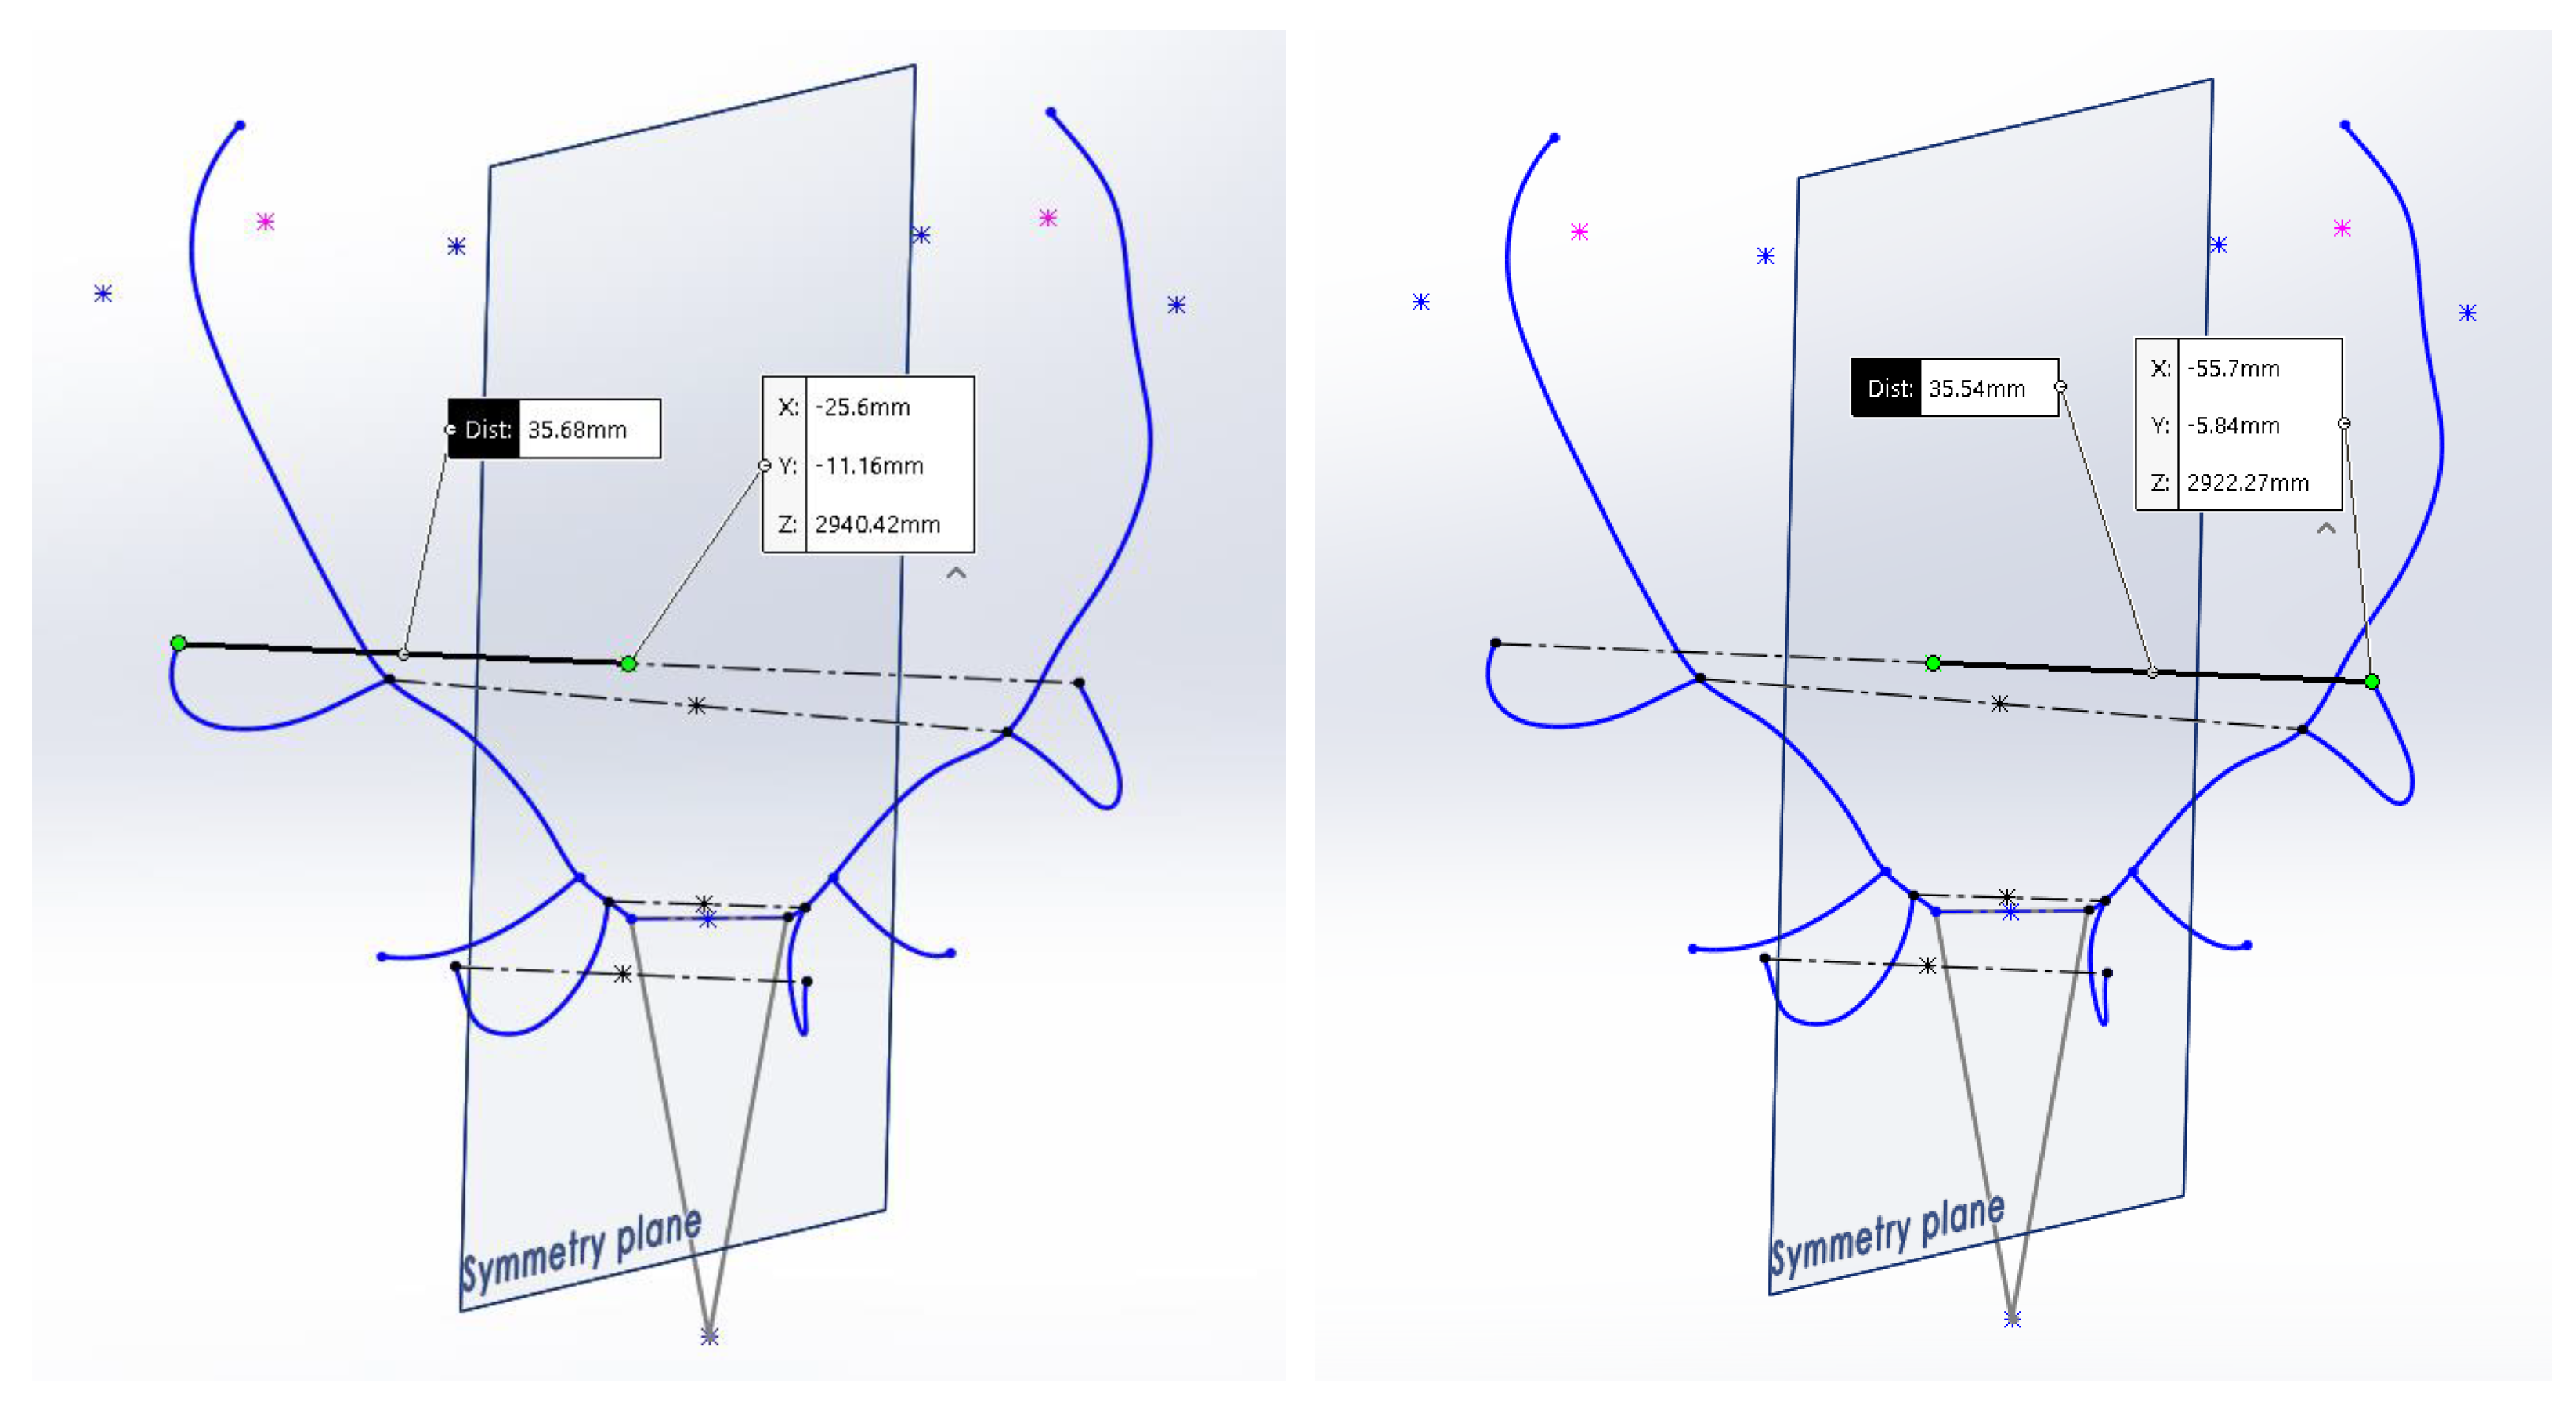
l2 are the lengths between each point and the plane of symmetry throughout that segment. The method used to perform the measurement using the CAD system is shown in
Figure 4.
The ‘Asymmetry Index by Perpendicularity’
describes the degree of alignment (geometric perpendicularity) of the segment that joins the 2 points under consideration on both sides (
Figure 5). The value of
is determined by Equation (2), where
L is the length of the segment joining both points again, and Δ
y is the sum of the distances between the projection of the points on the plane of symmetry and the point of intersection of the segment that joins them and the plane of symmetry, or what is the same, the length of the projection of the segment that joins the two points on the plane of symmetry. The way to perform the measurement using the CAD system is shown in
Figure 6.
The sum of the arithmetic mean
of the values of
‘Asymmetry by Length’ (Equation (3)) and the arithmetic mean
of the values of
‘Asymmetry by perpendicularity’ (Equation (4)) will represent the final value of the ‘Asymmetry Index’
for the antler (Equation (5)). This final index
has a weight proportional to the number of pairs of points evaluated in each of the 2 asymmetry variables: in the ‘Asymmetry by Length’ 1 pair of points less is considered than in the ‘Asymmetry by Perpendicularity’ since, as will be described later, the plane of symmetry taken passes through the midpoint of the segment that joins the centers of the burrs. In this way, 15 pairs of points will be evaluated in the worst case, 7 for the estimation of
and 8 for
; in the event that the antler has the bez tines.
The Asymmetry Index AI is dimensionless and has a range between 0 and 1. Through this definition of the Asymmetry Index AI, the higher the index values, the greater the asymmetry of the part. The most symmetrical antlers will have low values, close to 0.
The execution time for obtaining the AI value for each specimen involves initially obtaining the axial structure of the antler; this is achieved by applying the methodology proposed by Rubio-Paramio [
45]; this task is the one that involves a greater investment of time. Once the axial structure of the antler has been obtained, the application of the methodology proposed for the quantification of the AI value takes less time than that of the previous task. It is estimated that for both tasks, once the application of the methodology is automated, approximately 2 hours will be invested in the quantification of the AI value for each specimen evaluated.
The study of the degree of antler asymmetry (AI) is estimated by evaluating pairs of relevant points of the antler: the centers of the burrs and the starts and ends of the tines (eye tines, bez tines, and trez tines) together with the geometric center of the ends of the crown tines.
It is estimated that the degree of asymmetry of the antler is determined by the symmetrical convergence of these significant points (homologs) of each of the sides of the antler on the estimated plane of symmetry. In these study points, the authors consider that the degree of symmetry in the geometric convergence of both sides of the antler is described with the necessary precision and level of detail. All of this without neglecting the great usefulness of the work that analyzes the antlers in 3D using 3D geometric morphometry. In fact, the research group has previously developed studies of this type, such as Martínez Salmerón [
47].
With respect to measurement error, this can occur in many experiments; on the one hand, in the initial data obtained previously and considered as a reference to perform the different measurements on, and on the other hand, during the tasks involved in taking measurements on that data element.
In the present study, the starting data is the axial structure of the antler; this is defined by means of the method described by Rubio-Paramio [
45] in which, starting from the initial data of considering two photographs, the 3D model of the antler is obtained by means of spatial restitution. The same author has already demonstrated that the measurements taken to evaluate the hunting quality of the specimen, evaluating trajectories and relevant geometric distances of the antler structure, were very close and statistically correlated with the physical measurements taken on the real model of the antler by officially approved personnel. Another element of the starting data is the considered symmetry plane used to reference the measurements of the estimated relevant points; this refers to the plane of the skull of the specimen, and in the same way, as with the structure of the antler, it is spatially restored from three significant fixed points of the skull: the center of the two burrs and the extreme point of the skull that represents the muzzle of the specimen. Regarding the measurement error of the measurements taken on the previously obtained data element, for the case in question, these measurements consist of obtaining the distances of the segments of the relevant points considered, the start and end points of the antler tines and the projection of these on the symmetry plane. These points have a fixed position located in the axial structure of the antler represented in the 3D model, where there is no degree of error when considered. The results obtained are the lengths of the extreme points up to the symmetry plane and of the projection of the segment that joins each pair of points considered on that plane; results provided by the CAD software SolidWorks, where the measurement process is implemented. The methodologies applied in FA studies usually measure specific parts of each side of the element to be evaluated, such as the variation of distances and angles between relevant points of the studied feature of the element to be evaluated; in this case, it is relevant to perform repeated measurements to estimate the measurement error obtained along with its subsequent statistical analysis and in turn to estimate the influence of this on the FA result obtained.
2.5. Influence of the Determination of the Symmetry Plane on the Results of the Asymmetry Index
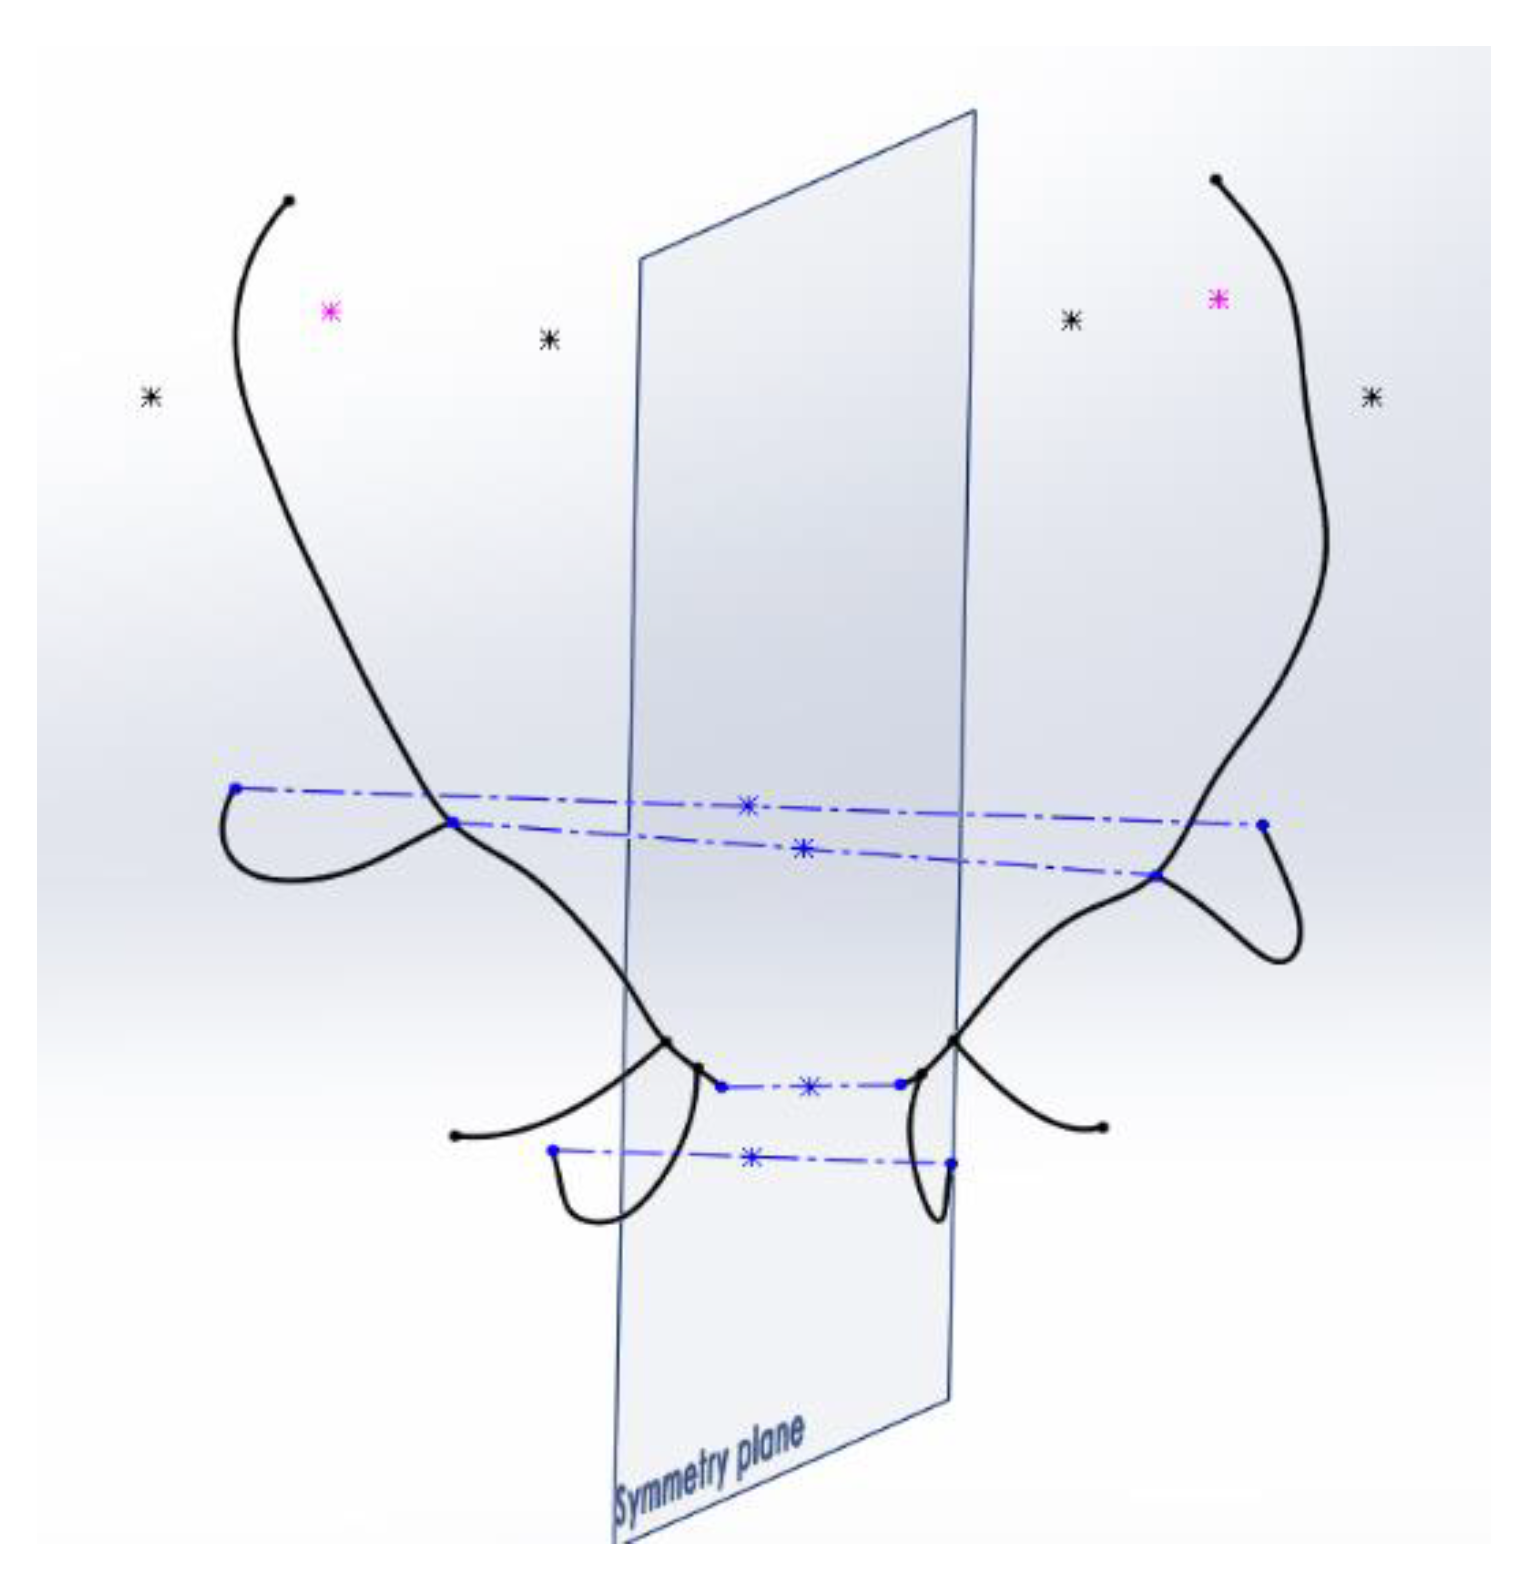
The determination of the plane of symmetry is one of the most determinant processes of the method. In order to find a reliable and robust solution for its conditions and location, several solutions were defined, estimating the spatial mean value occupied by the 2 parts of the antler in all of them.
The first alternative was to establish as the plane of symmetry the plane that was located in the middle of the antler, using as a reference the most notable elements of the antler on both sides, right and left. In order to obtain the plane, 4 segments were considered, which join similar significant points on the 2 sides of the antler: the segment that joins the centers of the burrs, the one that joins the ends of the 2 eye tines, and those that join the starts and ends of the trez tines. The midpoint of each of the segments was obtained, and from this set of midpoints, the plane that fits all of them was determined by interpolation using CAD graphic techniques. The fastest and most efficient result for this task was obtained with the help of the 3D modeling software Catia, v5.
Figure 7 shows the segments used for adjustment and the position obtained for this symmetry plane.
Asymmetry Index AI measurements were performed on the antlers using this plane of symmetry, and the results were very low for all the antlers, so no notable differences were detected between the asymmetries of the various antlers. The reason for this fact is that this plane is subject to the shape of the antler itself. A clearly asymmetrical antler transmits that asymmetry to the symmetry plane of reference itself. Using this plane of symmetry, the deviations and lateralities of the antler are not adequately detected.
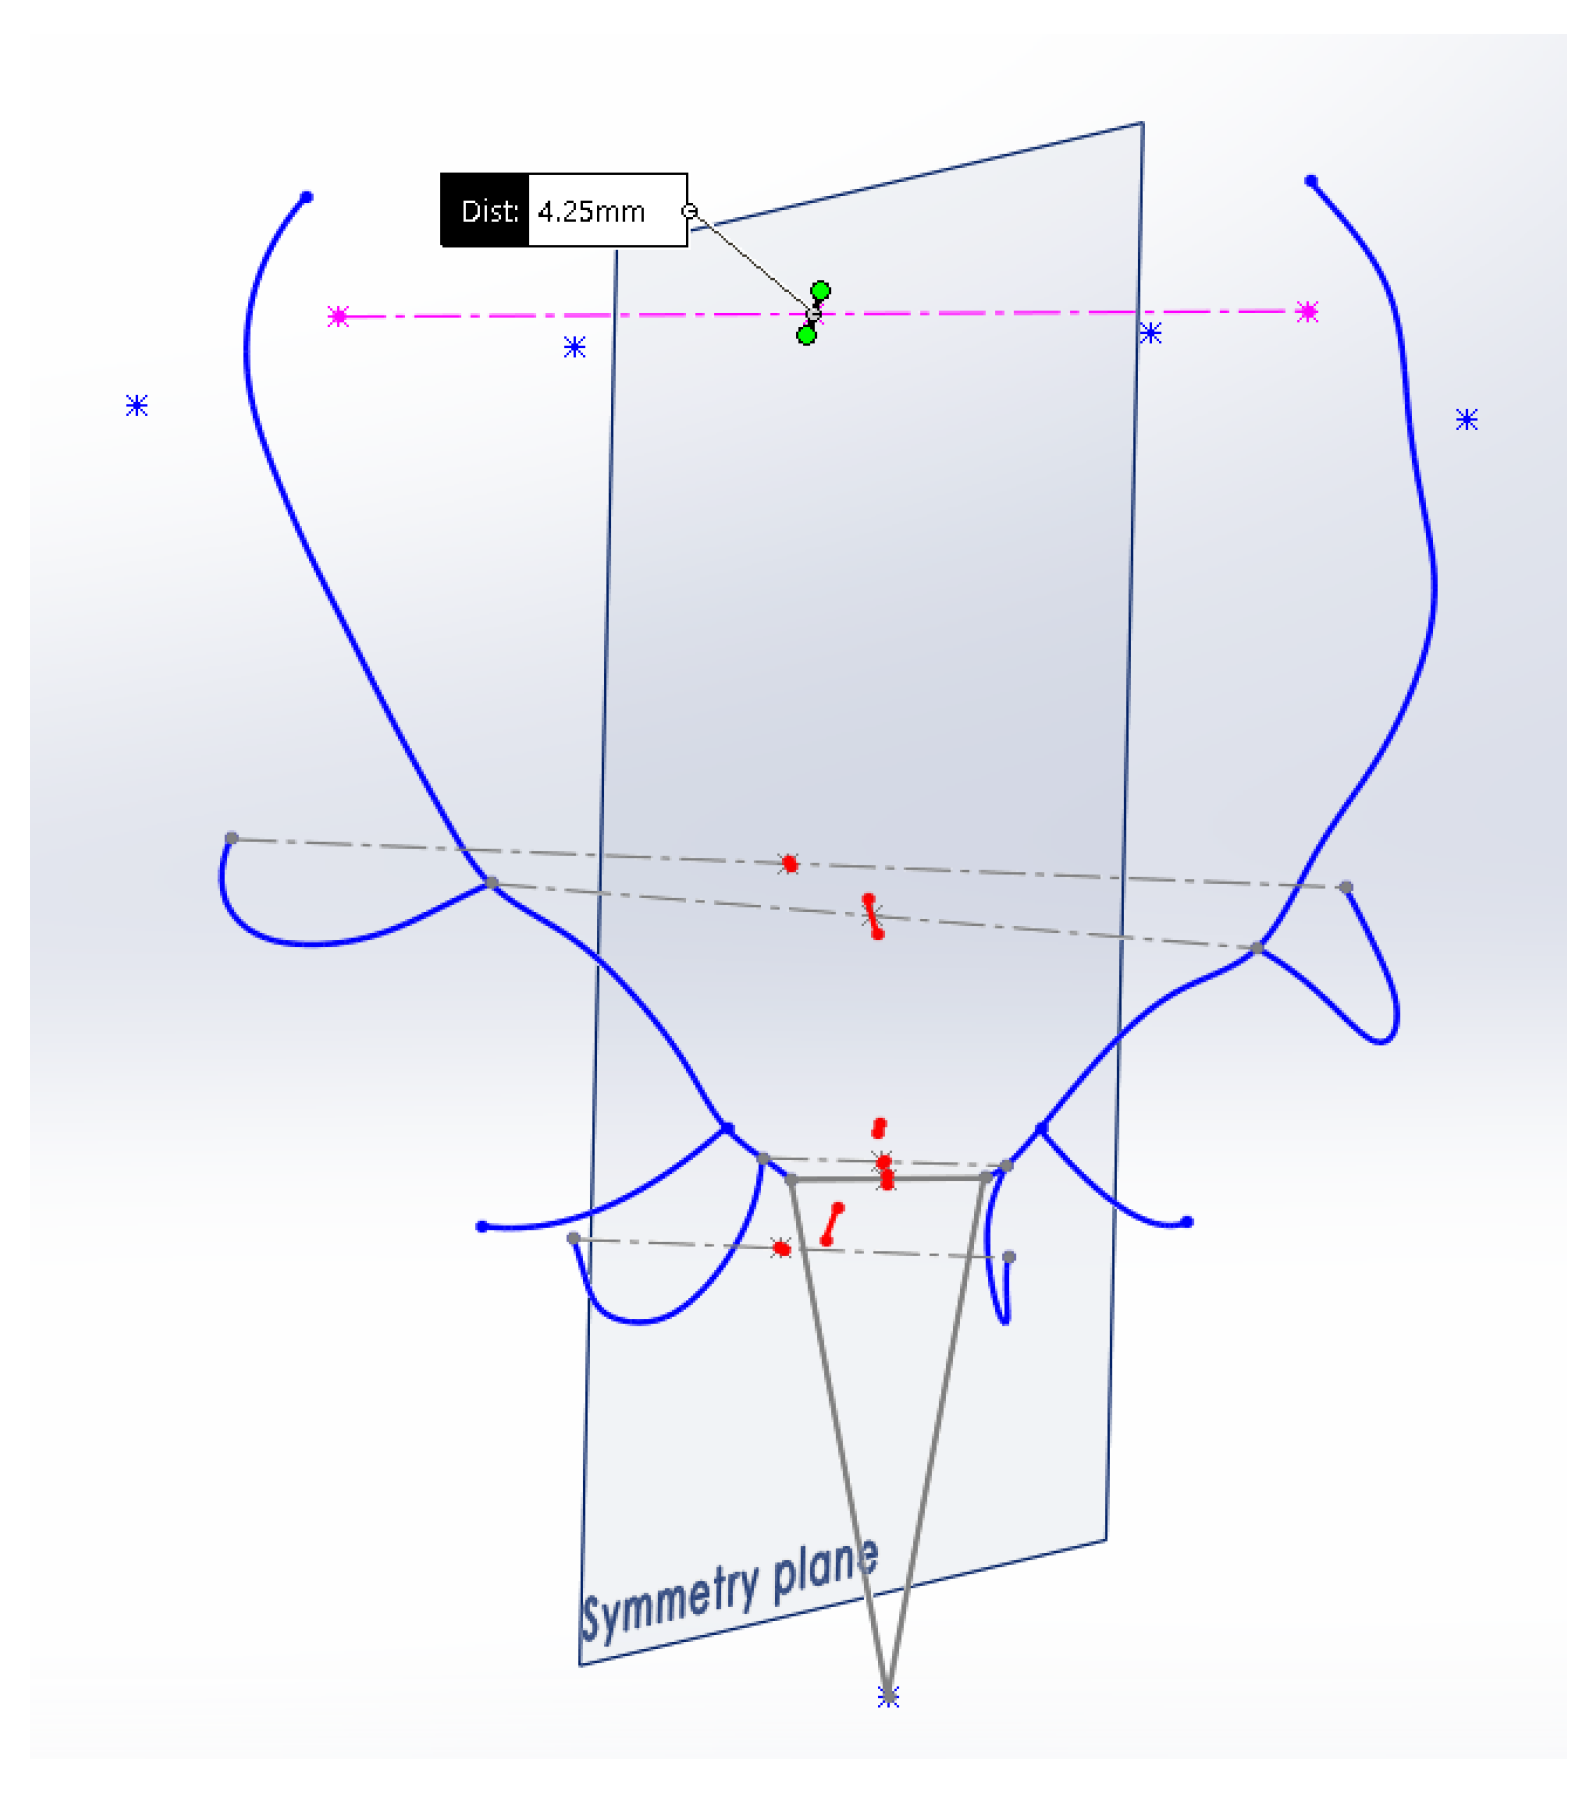
A second option for establishing the plane of symmetry was to consider the plane perpendicular to the segment that joins the centers of the burrs, which passes through the midpoint of this segment (
Figure 8).
The values obtained for AI for the antlers measured with this second method were higher than in the previous one, offering more evidence of the asymmetries of the antler. Taking distant points of the antler, such as the ends of the trez tines, the reference symmetry plane has been considered in the first proposal. The AI (asymmetry index) values obtained under this assumption were high because there was little symmetrical definition for those points of the ends of the trez tines due to the low level of symmetry they have; then, the symmetry plane that relies on these points presents little consistency as a reference for the study.
The reason for this is that this plane is not subject to the global shape of the antlers but only to 2 more elements linked to the skull of the animal, such as the burrs. With this second method, the lateral deviations of the sides of the antler and the asymmetries that it presents are detected.
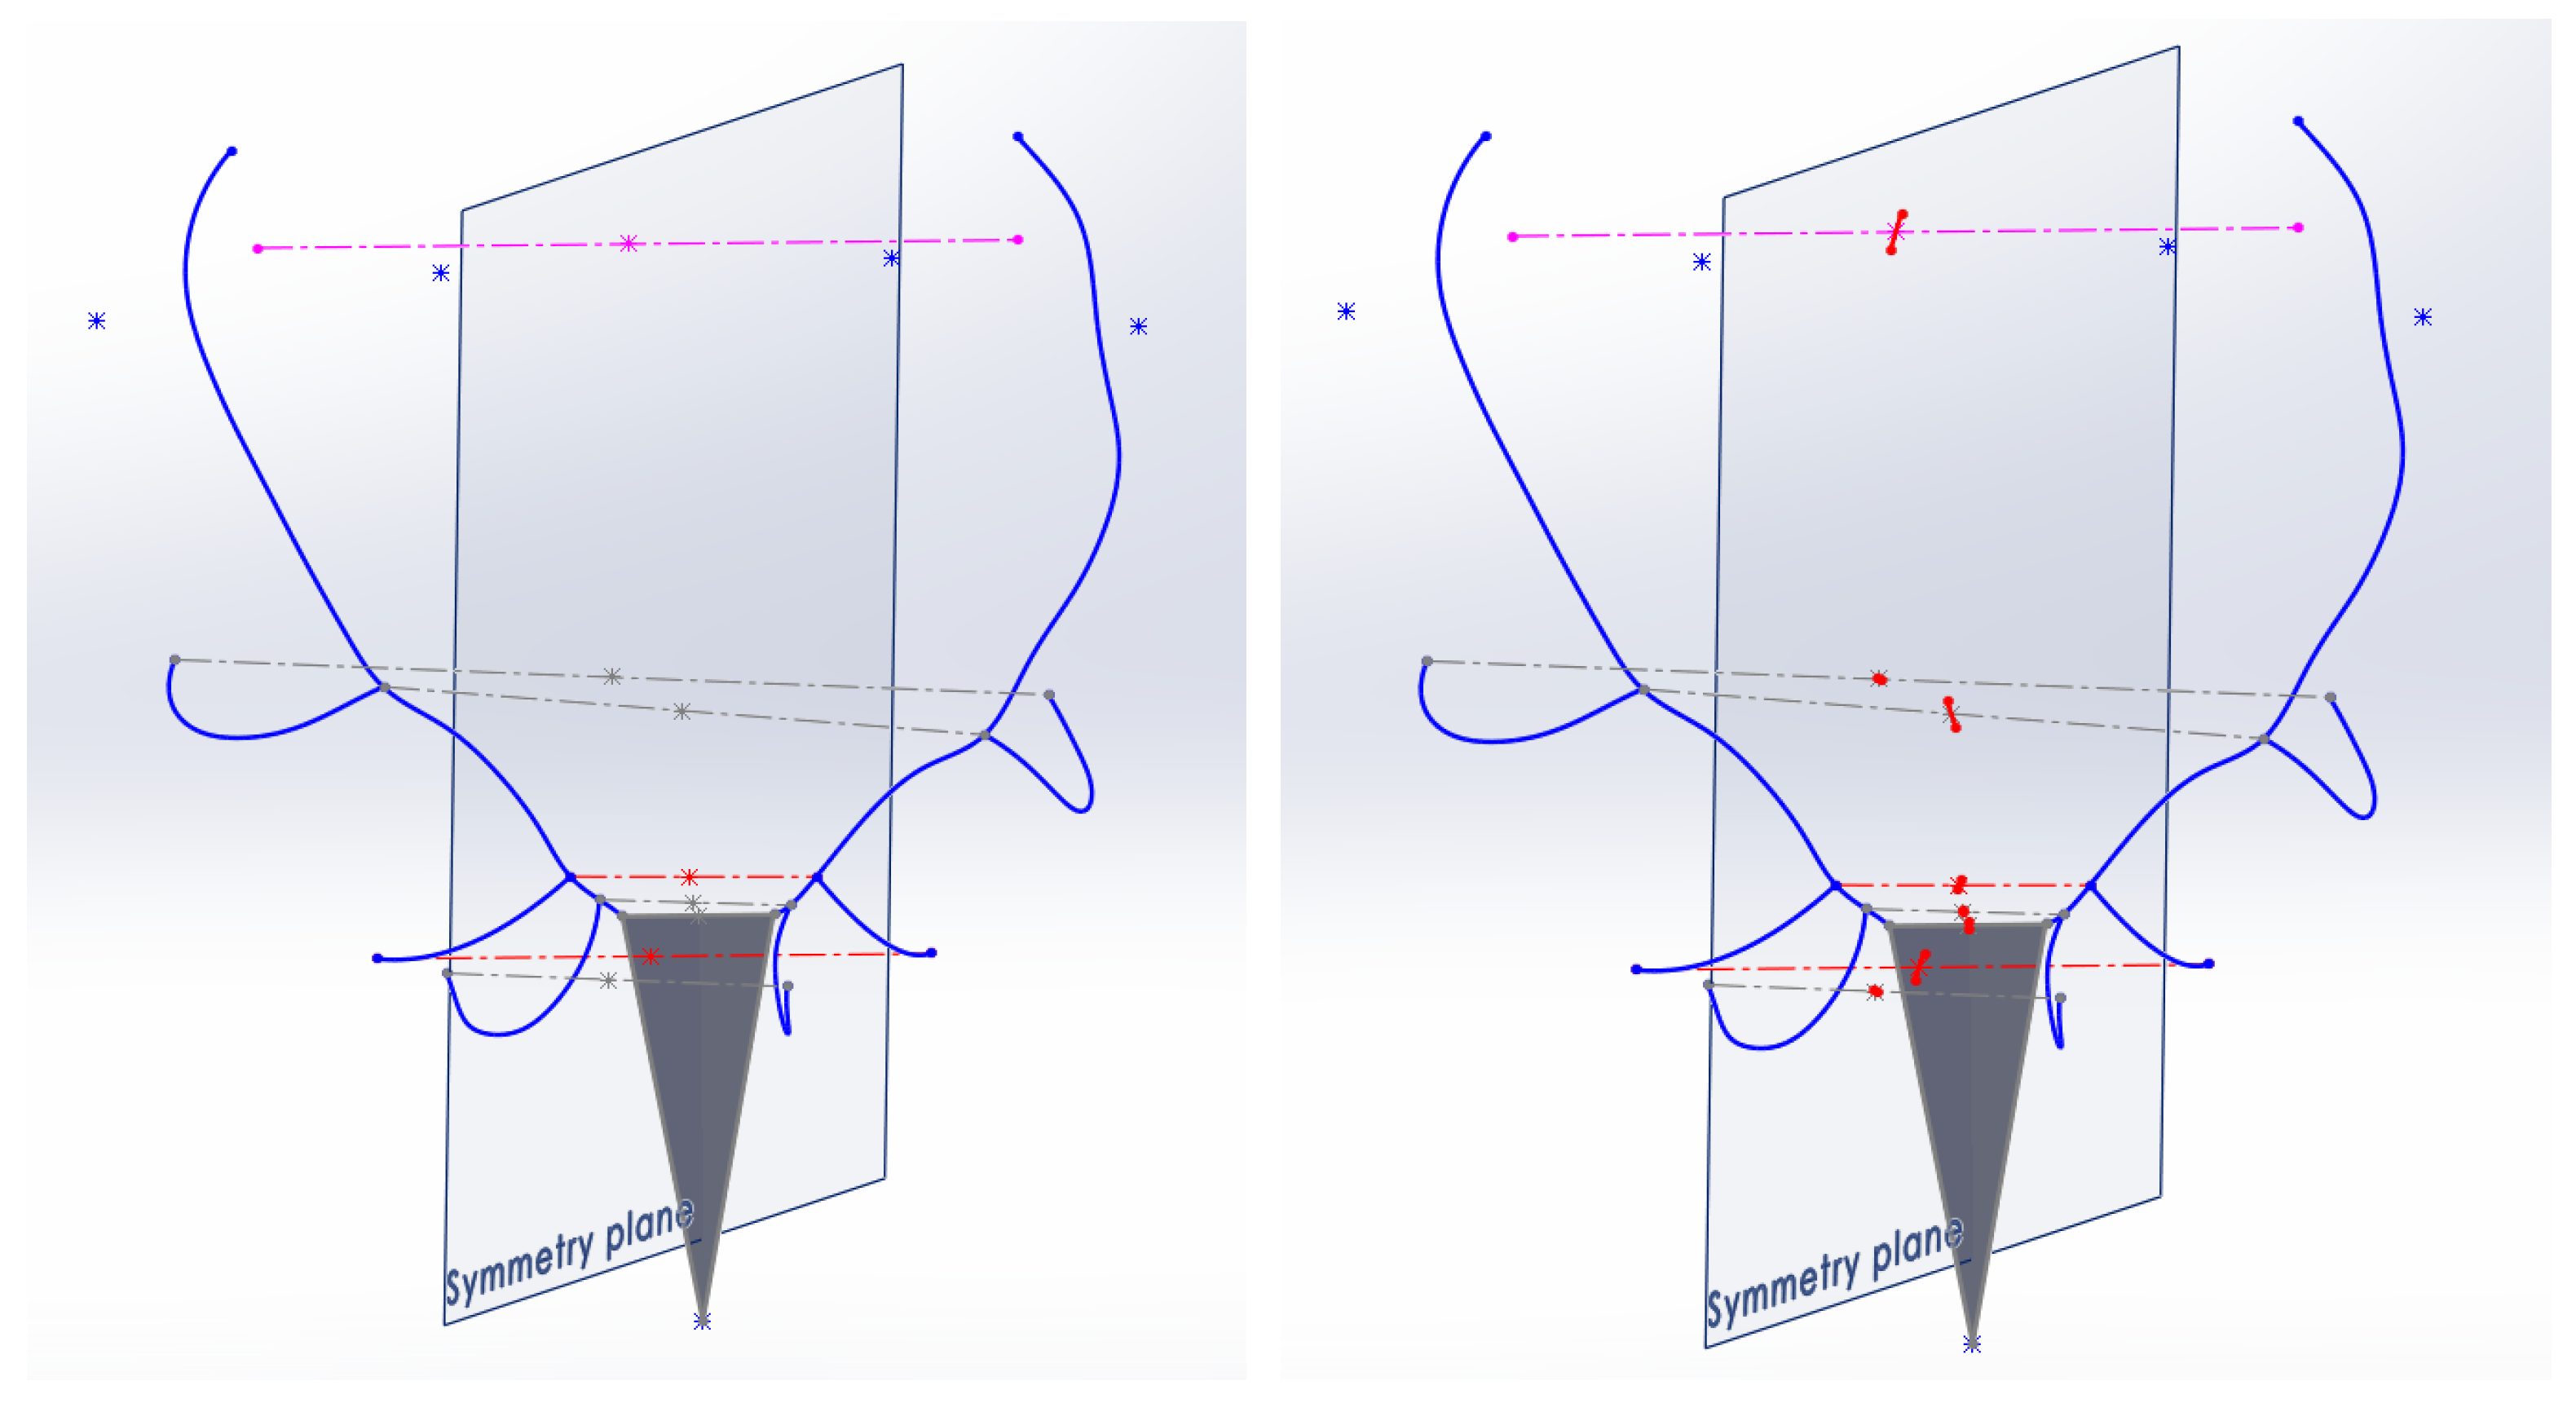
The third and definitive alternative for establishing the symmetry plane considers the two points of the previous method (centers of the two burrs) but also includes a significant point of the animal’s skull, the latter point not linked to the antlers but rather to its head.
Considering that the photographs of the antlers are available either with the skull or with the bust of the animal, with the help of the Photogrammetric CAD method, the 3 points considered for the definition of the symmetry reference plane were spatially restored: the centers of the burrs on both sides and as the third point the end of the nasal bone of the animal’s snout.
Once the triangular surface formed by the three points had been defined, the plane of symmetry was adjusted so that it satisfied three spatial conditions: (1) It is perpendicular to this triangular surface; (2) It contains the third extreme point of the snout; and (3) It contains the midpoint of the segment that joins the two centers of the burrs (
Figure 9).
The values obtained for AI using this third method were even higher than those of the previous method for the cases of antlers that presented asymmetries. With this method, deviations and lateralities of the considered pairs of antler points are better detected. The results of the measurements to evaluate the value of the AI asymmetry index in the specimens of the sample considered, taking as reference the plane of symmetry referenced on the plane of the skull, show more uniformity and fewer divergences than in the case of being estimated with the other two options proposed for the reference plane.
Finally, this third solution has been chosen to establish the plane of symmetry. The geometry of the animal’s head presents greater consistency and invariability, in addition to not experiencing considerable changes with the age of the animal. It has been considered that these two points are the most appropriate to be used as a reference for the determination of the plane of symmetry, and this third criterion shows better results for the calculation of the Asymmetry Index.
3. Results
As an example, the results of the measurements carried out for a case study on one specific specimen are detailed below. The values of
,
, and
have been obtained (
Table 1 and
Table 2).
Figure 10 graphically represents the geometric parameters taken into account for the estimation of both types of asymmetries.
A specimen was taken from a homologation session as a hunting trophy, selected for its probable high quality. This antler obtained the best score among all of those evaluated. It had the lowest value, 36 thousandths of a point, thus presenting the best degree of symmetry between the two sides of its antler with respect to the plane of symmetry of reference. The table includes the values considering the tines of the crown and the values without considering these tines.
The results obtained for the value of
on a more extensive sample of deer belonging to different hunting reserves and from different hunting days and homologations are shown in
Table 3. The value of
is included considering the tines of the crown and without considering these tines. The last column of the table shows the average hunting rating given to each sample. The assessment of the hunting quality was carried out according to the scale of the “Manual of Measurement and Homologation of Hunting Trophies” [
48] on the deer considered for the study.
means (*) (without crown) correspond to the arithmetic mean of the values of of the set of the sample, without considering the extreme points of the tines of the specimen’s crown. Only the significant points (homologs) of the antler up to the trez tine are considered. It is the part of the antler that, at first glance, appears to have a greater degree of symmetry.
means (*; with crown) correspond to the arithmetic mean of the values of the sample as a whole that does consider the extreme points of the tines of the crown of the specimen through the geometric mean point of all of them. In this case, all of the significant points (homologs) of the complete antler are considered.
4. Discussion
Many studies claim that FA could be a reliable indicator of quality in cervid populations, but this has not yet been demonstrated due to the difficulty of developing a methodology for investigating FA in cervids that ensures such a correlation. In cervids, it is more difficult to estimate this relationship by taking their antlers as a study element since these, unlike other species, are not maintained over time but are renewed annually and, therefore, their degree of development depends on the environmental conditions of the period in which the antlers have grown in a few months.
Relating the degree of FA to the quality of the specimen is inconsistent and cannot be stated with certainty. Most researchers on FA have tried to relate FA with respect to some geometric and physical features of the antler with age and with relationships of reproductive success and health of the specimen. Thus, Ref. [
49] relates cervid antler symmetry to reproductive success. Ref. [
50] relates the degree of FA to age but not to the environmental conditions in which the animal has developed, such as the level of rainfall in a given period and, therefore, the amount of pasture available for feeding. Refs. [
50,
51] state that FA in cervids is not an indicator of environmental stress and that each population has a specific density in which FA is manifested. Other authors [
52,
53] state that FA decreases in physically fit individuals. Krapinec et al. [
50] relate FA to some geometric and physical traits: antler mass and volume together with the upper circumference of the crown, with the age of the specimen.
The latter author also points out that the studies carried out to date are of doubtful validity because of the lack of rigor in the planning of the experiments due to the fundamental fact that the measurements are not performed on repeated samples; the studies on dismogues for the same specimen, due to the difficulty of obtaining them and that these are not deteriorated, apart from working on experiments with small sample sizes of less than 40 specimens. He also affirms that few investigations are based on samples of specimens of natural mortality and that the different studies are based on samples of pairs of antlers without skull and jaw. He also points out the historical problem of correlating FA with several traits; some authors relate FA to a single trait: [
52,
53] to the physical condition and body mass of the specimen, Ref. [
54] relates it to the renal mass index and [
1,
5,
15,
55] to age. For all these reasons, Krapinec et al. [
50] indicate that the research methodology of FA in cervids should be improved in terms of defining traits in which FA represents an objective indicator of instability in the specimen’s development.
Another point to consider is that so far, research on FA in red deer has been conducted in several subspecies, from Scottish [
17] and Iberian [
47] to Central European deer [
1]. However, these subspecies differ in their antler morphology, so conclusions derived from different studies on FA in red deer should not be uniform.
In the case of our research, the objective is to globally evaluate the geometric deviations of significant points of the antler on a plane of symmetry in order to quantify numerically the global value of these defects. It is not intended to associate, in the specimens of the estimated sample, an FA value to relate it to any geometric or physical feature of the antler, only to propose a methodology that can be used for future studies of FA estimation.
From the results obtained in the evaluation of AI in the 48 deer specimens evaluated, it is observed that the AI values are between 36 and 209 thousandths of a point. It can be assumed that low values of the AI value, lower than 90, indicate great symmetry in the antler, taking into account the visual symmetrical convergence perceived in the antler when both factors are compared.
The AI values shown in
Table 3 considering the complete antler, including the crown, represented as the geometric midpoint of the cloud of extreme points of its tines, are somewhat lower, in most cases, than those obtained considering only the part of the antler up to the trez tines. This is possible because, by adding this new pair of points to the study and going from 14 to 15 pairs of significant points, the assessment becomes more consistent, resulting in a more significant and reliable overall AI value.
The value of the hunting quality score in relation to the global AI value obtained for each specimen does not represent one of the objectives of this study. The value of hunting quality is known in the specimens evaluated according to other previous studies, and as future lines of research, the authors highlight the existing correlation between both variables, as described in
Table 3; the best AI values obtained correspond to those specimens that present better values of hunting quality, but the authors do not intend to categorically affirm this degree of correlation; this should be demonstrated in more exhaustive studies and with larger sample sizes.
5. Conclusions
This paper proposes a methodology that is easy to implement using a parametric Computer Aided Design system to quantify the degree of symmetry of deer antlers, obtaining a numerical index as a result.
The degree of symmetry is defined by a single dimensionless numerical value ‘Asymmetry Index’ AI, which numerically quantifies this characteristic for each part. Consequently, comparisons can be made quickly and easily between parts from a large number of samples.
This new estimation method facilitates the use of the degree of symmetry as a biomarker that can easily be added to other morphogeometric variables characteristic of the specimen so that new interrelationships can be established with these other variables, both internal (genetic, stress, etc.) and external (related to the conditions of the environment in which the animal has developed).
The proposed methodology presents other advantages in its implementation, such as the use of only two geometric variables in the process, length and perpendicularity. It is also fast in its implementation since there are few pairs of relevant points to be evaluated, also allowing large samples of numerous specimens to be measured in a short time in a way that provides statistically significant and reliable results.
Since the method is implemented through a 3D Computer Aided Design application to obtain the photogrammetric restitution of the antler structure and the pairs of points to be measured, the time invested and the skills required in its use must be taken into account in order to obtain this 3D model as the starting data for the measurement process.
Finally, it should be noted that this symmetry quantification methodology can be applied to the study of other biological elements of any animal or plant species due to the simplicity of its algorithm and the process of obtaining data graphically.

 ,
, 


