1. Introduction
The mid-20th century could be used as a starting point for the systematic development of quality indicators for the wild animal population. At that time, Riney [
1] compared and critically examined certain condition indices exemplified by red deer (
Cervus elaphus). In doing so, he stated that the antlers represented a dubious population quality index because they are generally worn by the stags and are incompletely developed even in stags for part of the year. Nonetheless, a series of studies was conducted up to the end of the 20th century emphasizing the significance of this sexual ornament as follows: social behaviour determinants of an individual [
2], sexual selection example ([
3,
4]), environmental condition indicators [
5,
6,
7], and potential consequences of anthropogenic selection [
8,
9,
10,
11].
Although fluctuation asymmetry (FA) was initially studied in invertebrates, lower vertebrates, and birds [
12,
13,
14], it rapidly became a subject of research in wild ruminants. Antlers and horns are one of the most obvious examples of sexual selection since they develop as a result of intense competition between stags when mating [
3,
15]. Thereby, these excrescencies do not merely serve as a weapon but are simultaneously a signal, i.e., a sign of readiness, and as such represent a relatively expensive excrescence. Consequently, they should be a relatively reliable quality indicator of an individual, more so as the antlers and horns are subject to variabilities in environmental conditions.
Over the last 50 years, FA research has also encompassed the cervids of different climate zones of the northern hemisphere of Europe and North America, with varying husbandry intensities, from entirely liberal to controlled. However, all results of FA research in cervical carcinomas to date have not provided a consolidated response in terms of the reliability of FA application as an individual quality index [
16]. However, it is true that various traits were used in the analyses, the number of which fluctuates from one (e.g., the number of sprockets [
17,
18] or the beam length in [
18,
19]), more of them individually [
16,
20,
21,
22,
23] or cumulatively. The latter are the trophy values [
24,
25]. Although they were proposed more than 20 years ago [
26], composite FA indices were applied extremely rarely [
27,
28].
It seems as if FA could be a realizable indicator of cervid population quality, but the methodology is still unstandardized. In bovids, FA research is far easier. The horn represents an individual’s lifelong growth (with the exception of the pronghorn antelope,
Antilocarpa americana), so a comparison of certain traits or of a group of proximal horn section traits provides a more than one-year-old “document” of successive growing. Contrarily, the antlers are a “momentary” sexual trait in terms of periodicity, i.e., in terms of cyclic nature of its emergence. To this day, methodology has not been standardized when researching FA in cervids. Most scientists used antler traits of various individuals, in which each individual in a sample was represented by a beam pair only or by the beams and cranium without the mandible. Very few articles utilized a series of shed antler beams of several deer in which an individual in the sample was represented by several pairs of beams [
16,
23]. In addition, the majority of the samples were acquired by hunt, while very little research was based on natural mortality samples [
29]. Thus, each of the sample sources bears its own error level. In the first case, the antlers might measure above the average values for at least one trait [
30], and in the second case the antlers might be worn by individuals of poorer physical condition. It seems, however, that even this does not have to be the rule, because hunters may also shoot sub-trophy individuals, especially in the case of younger and insufficiently cautious deer [
31], similarly to bovid kills [
32].
Therefore, the FA research methodology in cervids needs to be improved in terms of defining the traits for which FA represents an objective indicator of developmental instability.
2. Materials and Methods
The research was carried out at the Red Deer Breeding Station “Šeprešhat”. The cultivation site is located in the central part of the Pannonian lowlands, 1.6 kilometres west of the Danube, at an elevation of 82 m. According to the Köppen division, the broader area belongs to the Cfwb“x” climate type [
33]. The cultivation site’s surface area amounts to 74 hectares. It comprises a manipulation area and 16 fields and corridors, separated by a conjoining fence. The separation size fluctuates between 1.34 ha and 13.96 ha. The game nutrition is based on clover grass pasture mixtures (in a total amount of 20 hectares) and forage exposure in the following percentages: pelleted forage—56.5%, hay—29%, fresh feed—7%, silage 4%, concentrate forage—3%, and mineral feed—0.5%. According to the cadastral cultures, the structure is as follows: grasslands—75%, black locust forest stands 40%, white willow plantations—1%, Euramerican poplar plantations—8%, and reed beds—3%. On the cultivation site, only red deer is bred, and all individuals originate from the autochthonous (Baranja-based) population hunted in the immediate vicinity of the cultivation site, which is noted for the high trophy values of antlers in the European framework [
34]. The number of animals (of all sexual and age categories) during the shed beam collection period ranged from 150 to 160.
In cervine animal production, calves are weighed toward the end of the first year of life. The calves that have a higher weight are grouped as prospective, tagged for individuality, and isolated in a special separation. The prospective male individuals are kept in the separation up to the age of four to five years, when they are singled out again in an area to mate with the hinds. Thus, in the calves, offspring, and yearlings, it is possible for individuals to be exposed to competition, which provokes a cohort effect.
The antler traits were measured in the shed beams of ten individuals of red deer. The deer were of a known age, but they were affiliated with different cohorts (i.e., that of 2002–2004, 2006, and 2010). Throughout life (i.e., from yearling up to eleven years of age), all shed beams were collected, but only the undamaged beams (tines), i.e., those in which values were measurable bilaterally, were used for the trait analysis.
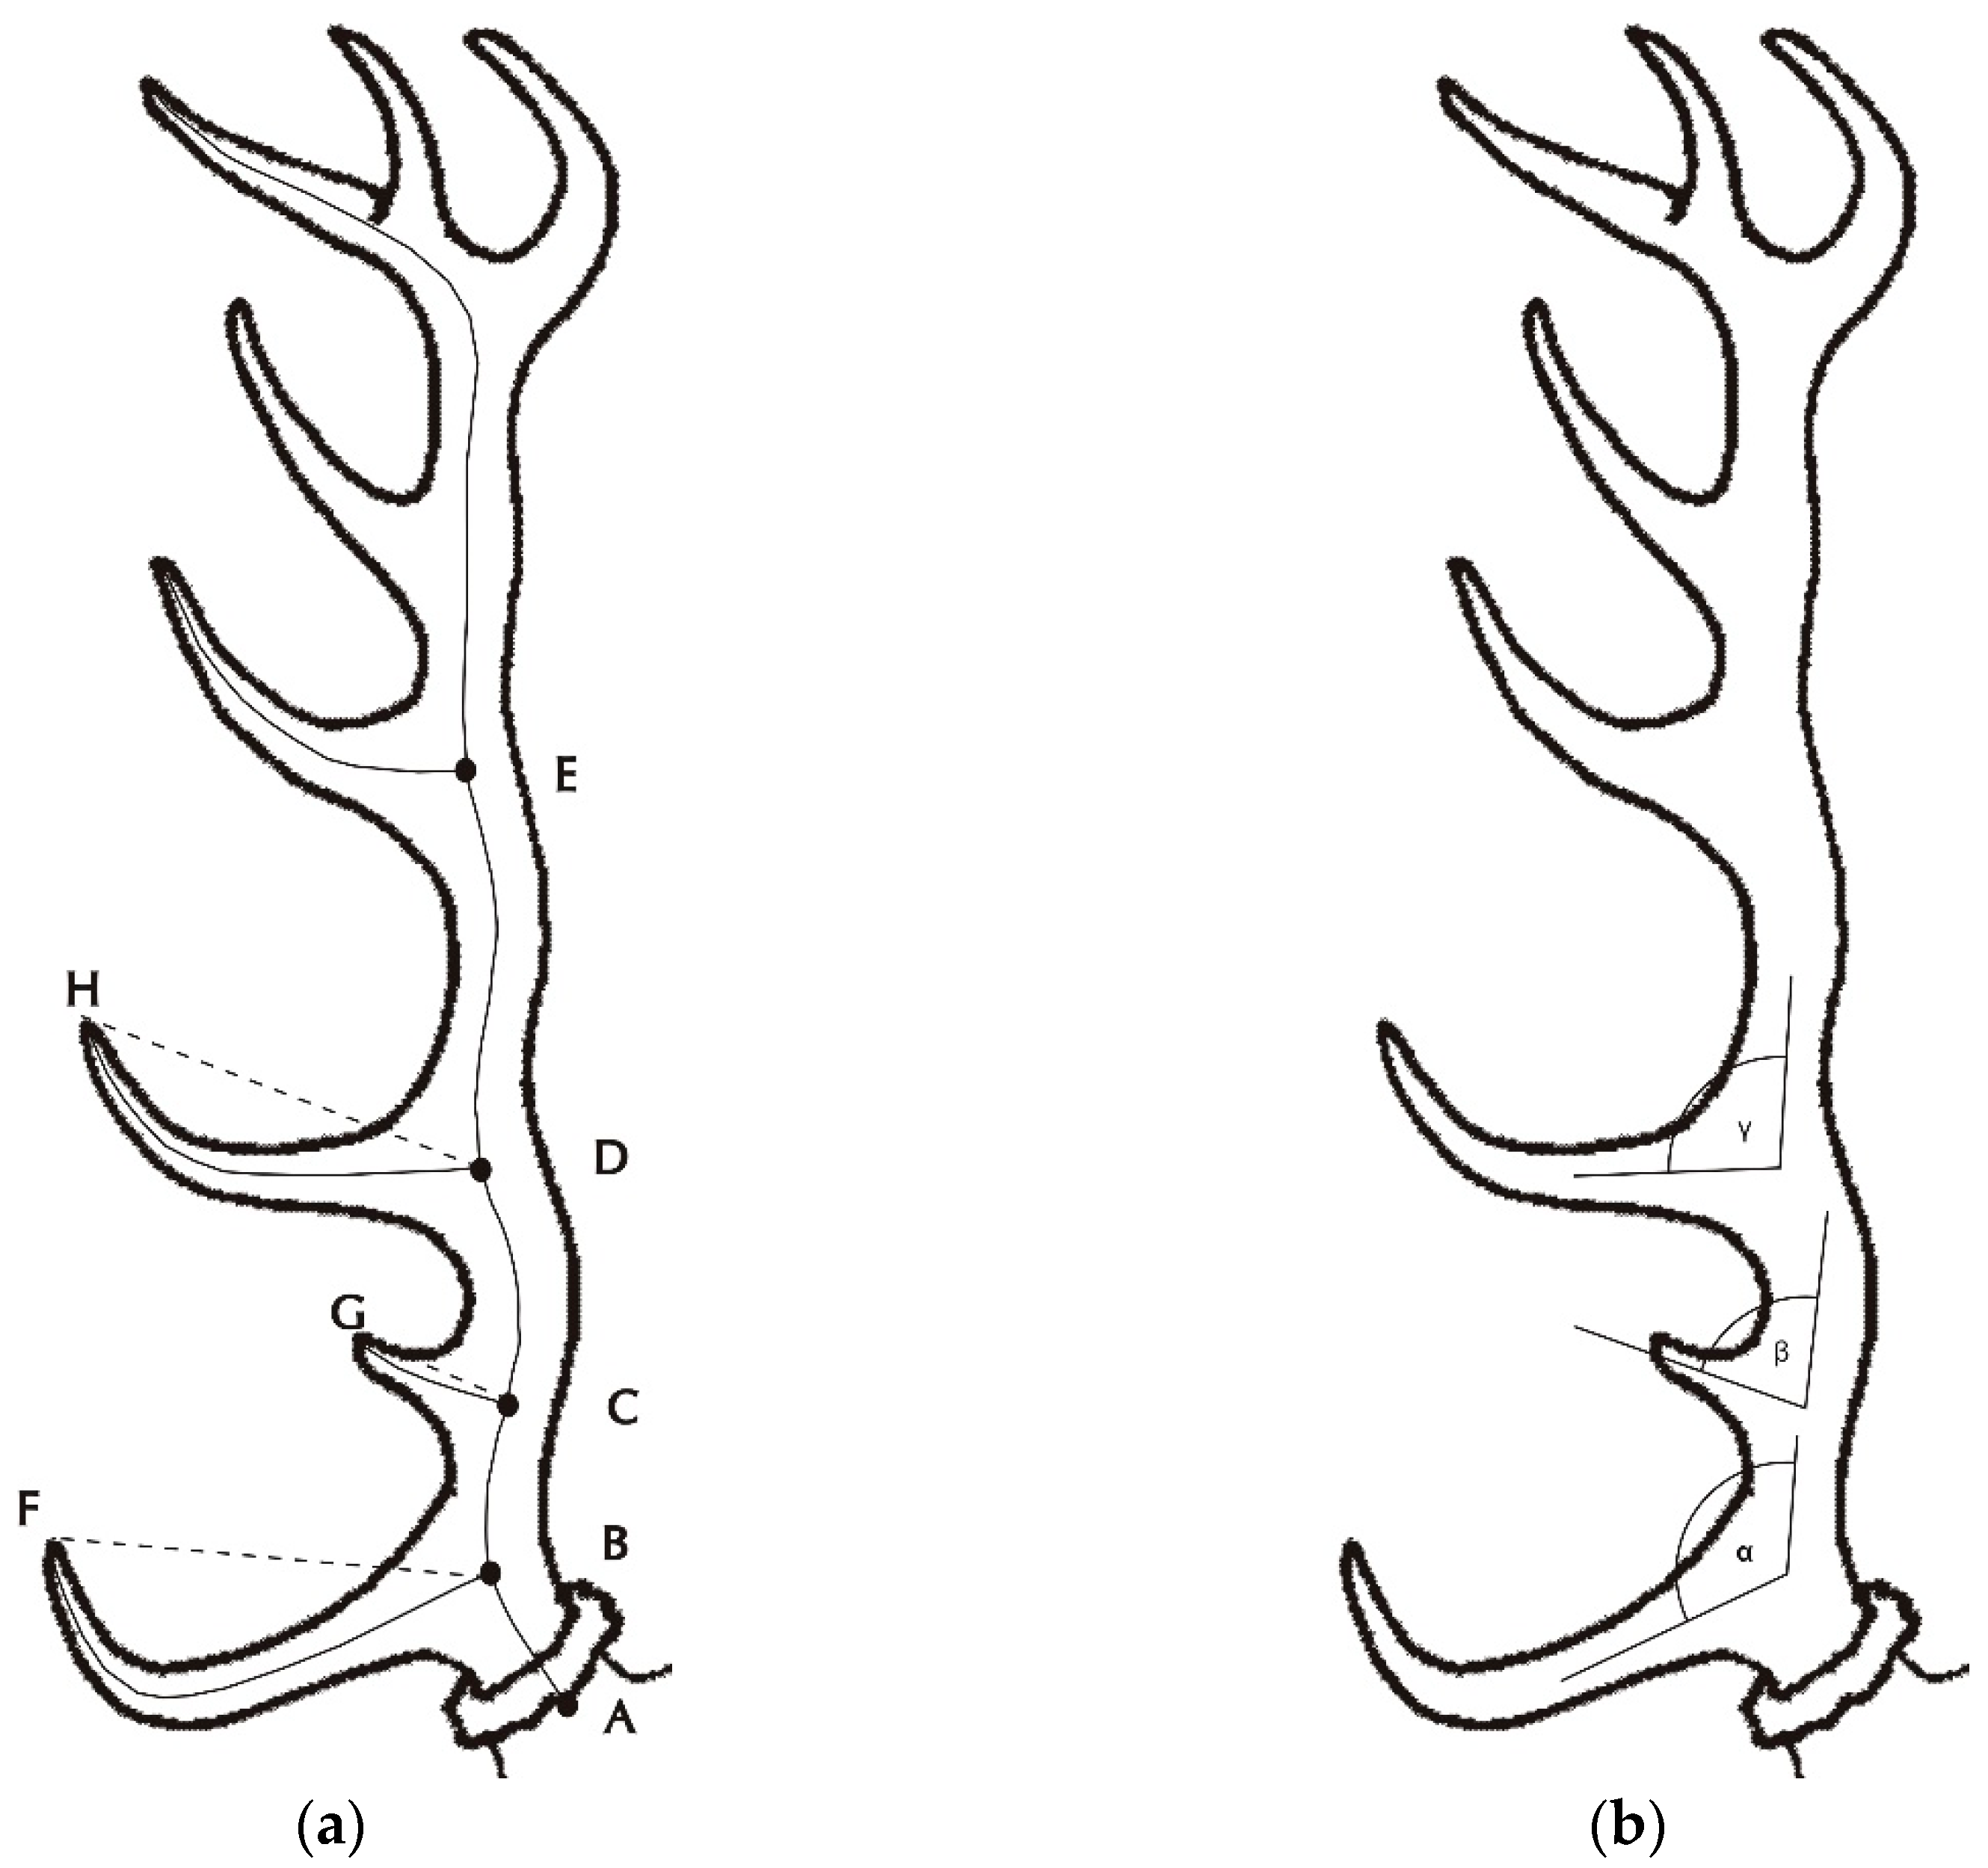
Two indicator categories were measured with respect to the shed antler beams. The first category is linked to the indicator measurements pursuant to the CIC propositions (
Figure 1) [
35], which include the following parameters: beam length (mm), antler beam mass (dag), coronet circumference (mm), beam circumference between the brow and tray tines (mm), beam circumference between the tray tine and antler crown (mm; in yearlings, this trait was measured in the middle of beams), brow tine length (mm), bay tine length (mm), tray tine length (mm), tine number, crown tine number, and crown tine length (mm). Based on these parameters, the trophy value of the antler was calculated according to the CIC formula. No antler spreads, deductions, or supplements were calculated.
In addition to these traits, the following characteristics were also measured on each beam:
Whether pertaining to the parameters measured according to the CIC propositions or to the additional parameters, the lengths were measured with a tape measure in centimetres within an accuracy of one millimetre, while the angles were measured with a carpenter’s protractor with movable arms. Volume was also used for the calculation of beam density, which was calculated as a quotient of mass and beam volume (kg/L). Tine curvature was computed from the tendon length, representing a quotient of tine tendon length and tine length.
Prior to the measurement itself, measurement directions, as well as the key points, were demarcated with chalk on the beams and tines, with the consent of a measurer (V. J., M. B., N. L., R. P., T. F., and I. B.). Each parameter was measured in three successive measurements. Measurement error amounted to ±1.5 mm (length and height), ±1 degree (angle), and ±3 mL (volume). In the mass and circumference measurements, there was no weighting difference. Successive weightings of each beam were performed prior to volume measurement.
Only the measurable traits on both beams (one antler pair) were analysed, so the sample size amounted to 60 beams.
On the basis of the values obtained, a pair difference of the left and right beam traits was calculated. A distribution of difference in the trait value of the left and the right beam was tested with regard to the kurtosis. In case of distribution platykurtosis, it was considered that it was antisymmetric [
26,
36]. The existence of directional symmetry was measured with the one-sample test. Antisymmetry was detected in the number of tines, while directional symmetry was detected in traits such as the brow tine length and the bay tine deflection angle. Subsequently, these characteristics were removed from further analysis.
In the follow-up analyses, the absolute fluctuating asymmetry (AFA) and the relative fluctuating asymmetry (RFA) were utilized, as was the type 2 composite index (CFA 2, [
26]). A relative FA represents a quotient of the AFA and the arithmetic mean of the measured parameter of an individual. CFA 2 was calculated for each beam pair, according to the following formula:
where
AFA = absolute fluctuating asymmetry,
j = trait(s), where
j = 1 to
k.
For the purpose of cross-referencing, the FA individuals were divided into age classes: yearlings, young (i.e., individuals aged two to four years), middle-aged individuals (i.e., individuals aged five to seven years), and mature stags (i.e., individuals aged eight to eleven years). As the trophy values (i.e., the CIC points) represent the sum values of certain traits, they were used as a criterion for the individuals’ grouping into the age classes. The spread of the antlers was not considered in the calculation of the total trophy value, and the mass of the antlers included only that of the beams without the cranium. The trophy value dependence on a known age is equalized with the quadratic function, and the growth intensity limits and traits were estimated thereafter. The yearlings were separated due to a pronounced difference in trophy values by comparison with other age classes, and a difference in trophy value growth intensity between other age classes was tested with linear regression (i.e., the homogeneity-of-slopes model). In terms of growth intensity, the trophy values of young stags developed significantly more rapidly than those of the middle-aged (F =12.426; p < 0.01) and mature individuals (F = 32.65; p < 0.05). The trophy values increased in middle-aged stags and decreased in mature individuals (F = 4.489; p < 0.05).
In most cases, the yearlings’ antlers did not exhibit developed tines. Therefore, the following traits were used in that age class: antler mass, antler volume, antler density, beam length, coronet circumference (i.e., circumference of the proximal beam part), and yet another circumference, measured at the middle of a beam and classified in the upper circumference category. According to the CIC rules, the antler crown is made up of a maximum of three tines. Accordingly, most of the juvenile deer did not have a completely developed crown, but the distal beam part can be forked. In such an antler type, the crown point of origin was an intersection of the centre lines of each fork tine, while the crown point of origin was obtained by an intersection of the beam centre line and the first crown tine in the case of a ‘real’ crown, measured on the external (i.e., lateral) beam side. As the number of traits measured in yearlings differed from other categories, two CFA 2 indices were computed. The first CFA 2 index was computed on the base of twenty parameters, wherein the yearlings were not incorporated. The second CFA 2 index was calculated for all age groups, and this CFA 2 was based on only six traits that were also measured in yearlings since it incorporated yearlings as well.
To examine the dependence of asymmetry on age, the deer in which a minimally three-year-old set of successive beams was collected, from the first antlers on, were singled out.
The normality of distribution was tested using the Shapiro–Wilk test. Because sets of antlers were dependent at the level of stags, correlation analysis between age and FA (AFA, RFA, and CFA 2) was performed using Kendall’s tau correlation coefficient. Stags showing significant correlation between age and some traits were excluded from analysis for the trait. Except for calculating correlation at individual level, Kendall’s tau was also used for calculating correlations between FA and magnitudes of traits at the level of age class.
The homogeneity of variances across samples was tested using Levene’s test. Comparing of traits among age classes was made using ANOVA with Tukey–Kramer and median tests.
The data analyses were performed using the Statistica 14.0.0.15 package [
37].
3. Results
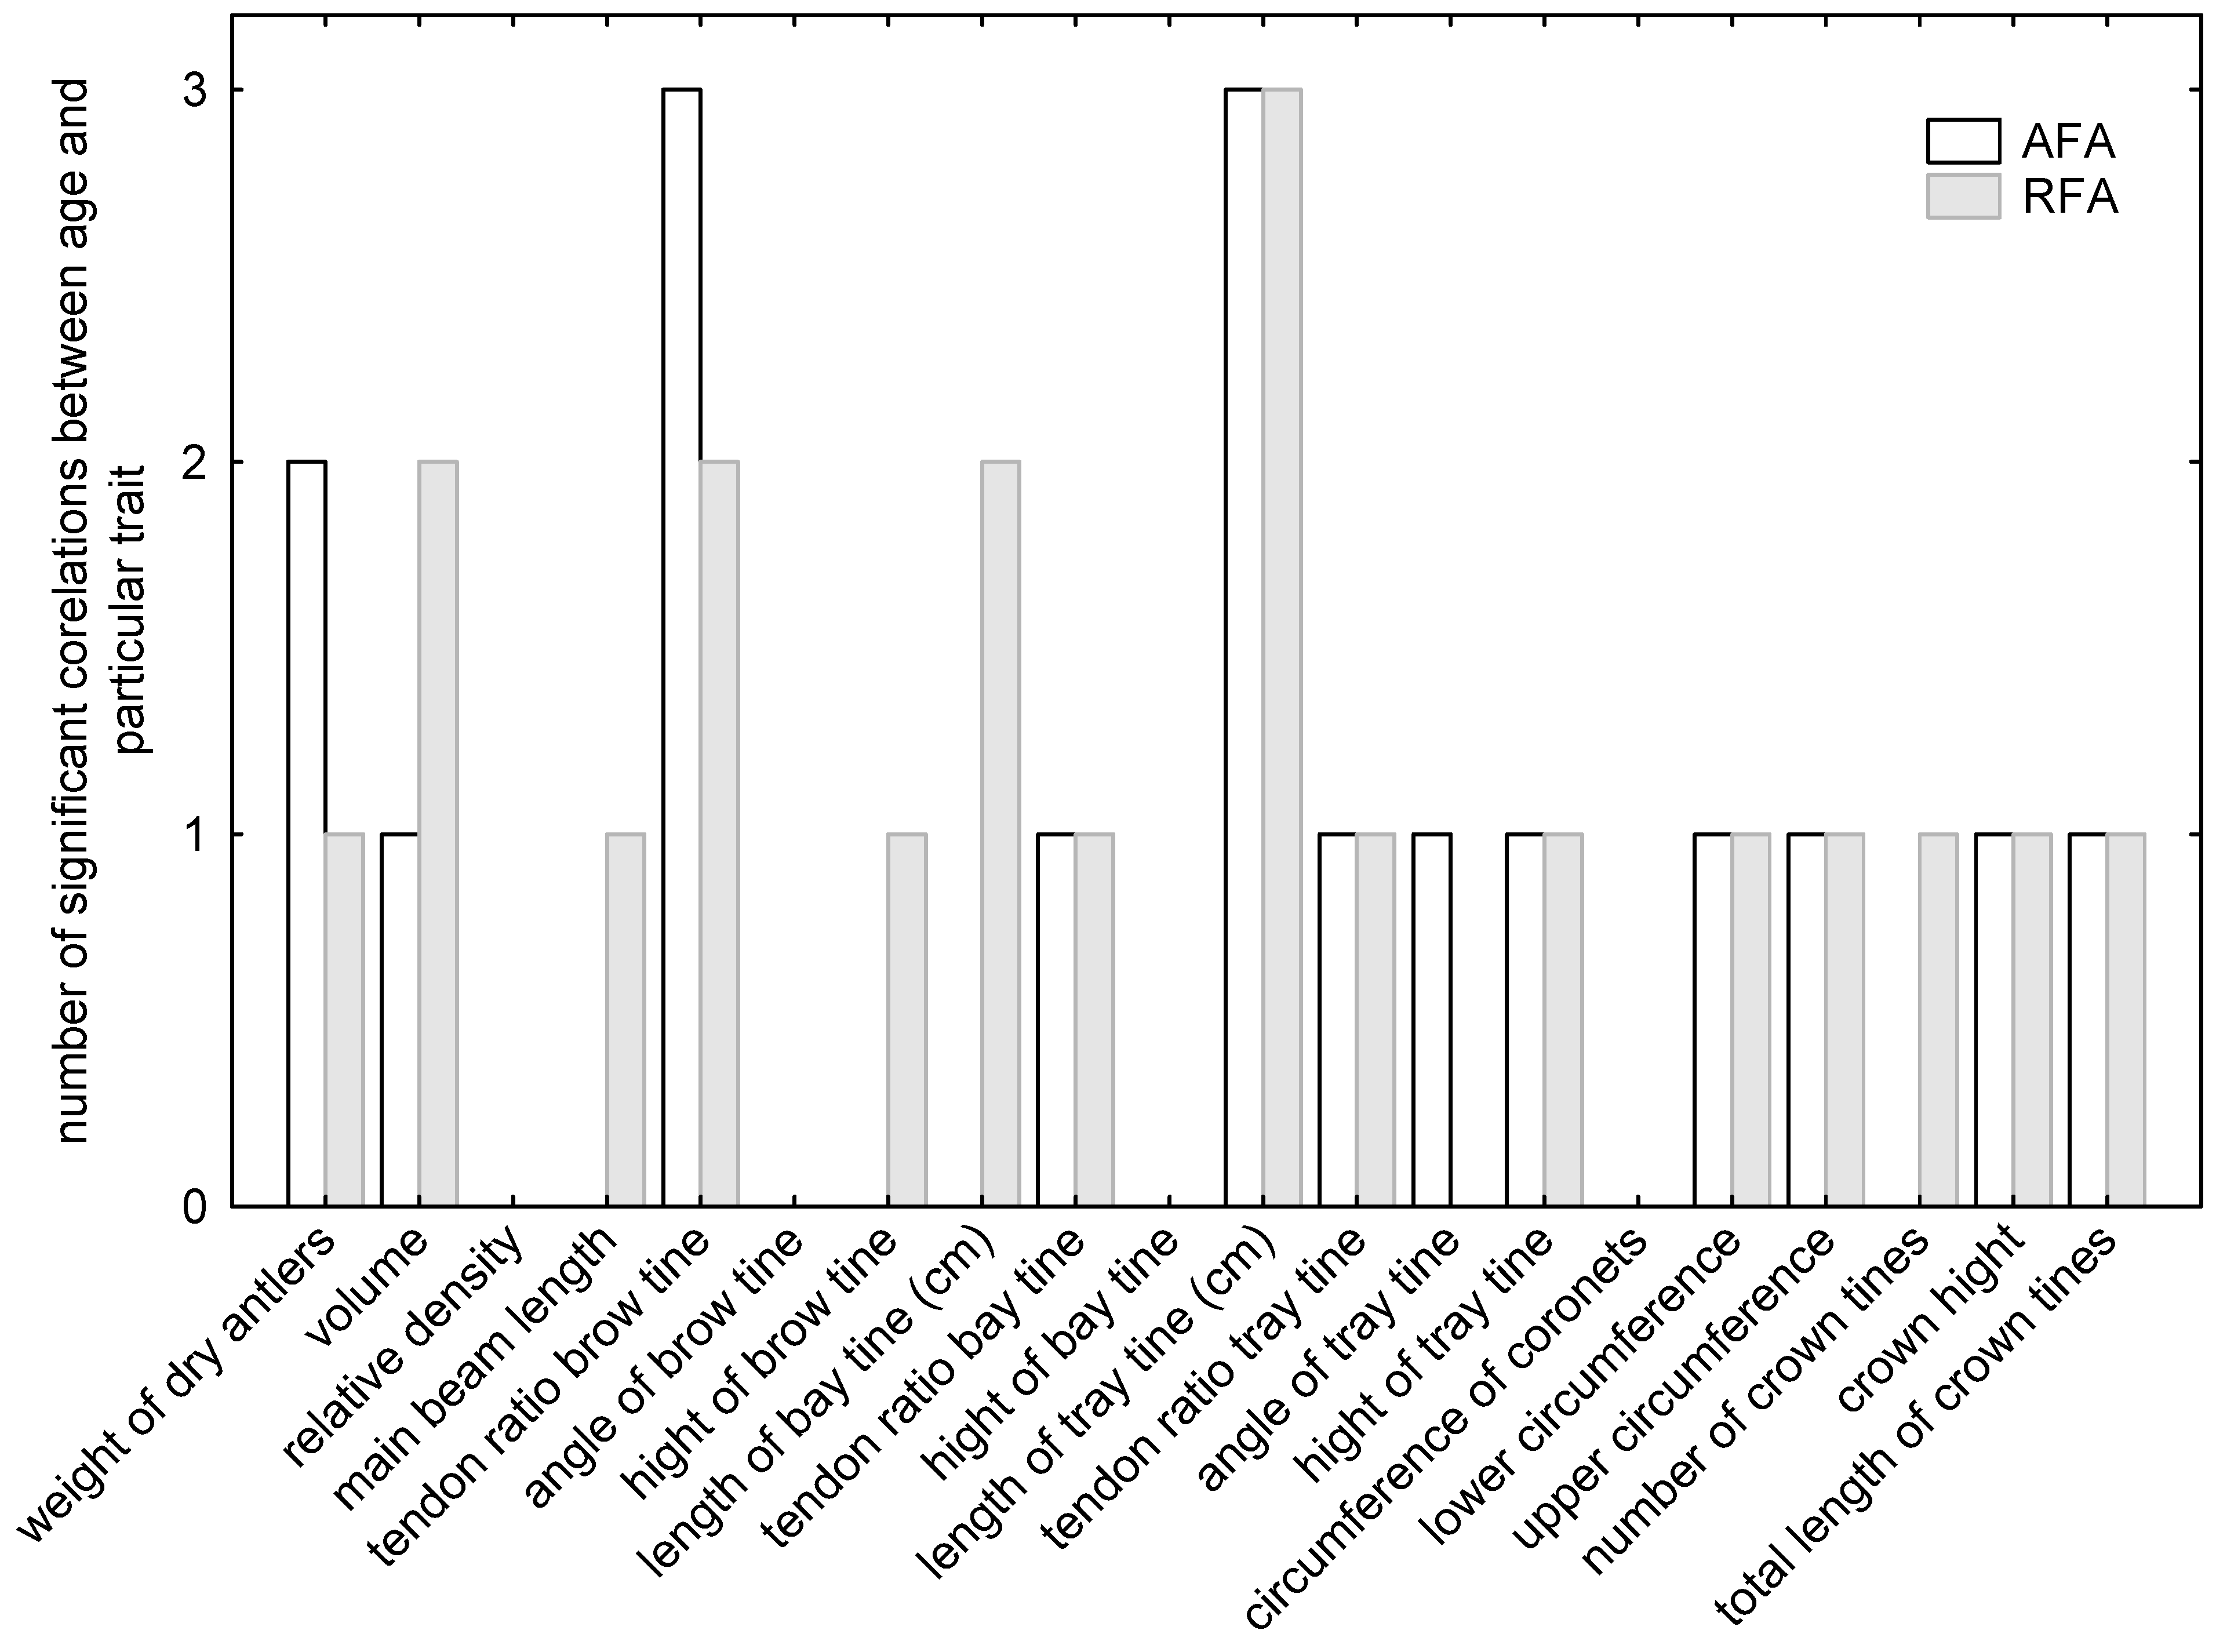
Generally, it was difficult to collect all successive pairs of undamaged red deer beams even in controlled breeding during an entire individual’s lifespan. Thus, the age range (i.e., the beam age) of the deer used for the sake of an individual asymmetry dependence and age analysis was unequal in our case, fluctuating from four (deer no. 2) to eleven (deer no. 1) years of age. A correlation analysis demonstrated that individual asymmetry (AFA and RFA) and age dependence were statistically significant in only four traits (relative density, angle of brow tine, high of bay tine, and circumference of coronets,
Figure 2). For the other 16 traits, the number of significant correlations varied from 1 to 3).
3.1. An Interconnection between the Trait Value and the Trait’s FA
The statistical relevance of an interconnection between trait values (i.e., a greater value in a trait pair) and FA was distinguished according to age classes (
Table 1). Although it was possible to measure only six traits in the yearling age class, none of them was significantly correlated with FA. In other age groups, there were no significant connections between the FA and the following six parameters: brow tine deflection angle, bay tine length, tray tine deflection angle, tray tine height, upper circumference, and crown height.
The tray tine tendon ratio was a trait that was positively connected with AFA and almost RFA (exception was RFA of middle aged stags) in all age groups, from the young males up. The lower circumference was significantly related to the AFA and the RFA of the mature and middle-aged males. Other traits that demonstrated a connection with AFA and RFA were the brow tine tendon ratio in juvenile deer (AFA: τ = 0.500, p < 0.05; RFA: τ = 0.457, p < 0.05), antler volume (AFA: τ = 0.475, p < 0.05; RFA: τ = 0.418, p < 0.05), brow tine height (AFA: τ = 0.423, p < 0.05; RFA: τ = 0.341, p < 0.05) and tray tine length (AFA: τ = 0.371, p < 0.05; RFA: τ = 0.310, p < 0.05) in the middle-aged stags and the antler mass in the mature stags (AFA: τ = −0.571, p < 0.05; RFA: τ = −0.571, p < 0.05). Some cases showed relatively high correlations but they were not significant (AFA of relative density in yearlings—τ = 0.467, p < 0.05; AFA and RFA of main beam length in ripe stags—τ = 0.500, p < 0.05; AFA of bay tine height in ripe stags—τ = 0.519, p < 0.05; and AFA and RFA of crown height in ripe stags—τ = 0.546, p < 0.05 and τ = 0.500, p < 0.05, respectively). The reason for the lacking statistical significance is the relatively small sample size.
In addition to the aforementioned traits that were significantly connected with AFA and RFA, there were also traits that related to only one asymmetry index (i.e., either with AFA or with RFA) within each age class of deer, ultimately denoting that a significant connection of a trait and AFA was recorded in 18 cases, while a correlation with RFA was recorded in 12 cases.
With an exemption of cases in which traits were correlated with both the AFA and the RFA, the juvenile deer manifested the greatest differences in the numbers of significant connections between a trait and the AFA, in which the AFA was significantly correlated with six traits (i.e., the antler mass, relative antler density, brow tine height, bay tine height, number of crown tines, and overall crown tine length), while the RFA was significantly correlated with only one trait (the beam length). In the age class of middle-aged and mature deer, a significant connection was observed with a single index in two cases: the tray tine tendon ratio and the overall crown tine length (the latter was also the case in the juvenile deer), whereas the RFA was significantly correlated with the coronet circumference. The mature deer showed significant connections between the bay tine tendon ratio and the AFA and between the number of crown tines and the RFA. With exception of yearlings, it can be concluded that in each age class, most of the traits will show higher FA with trait magnitude. However, this is not universal because in the age class of ripe stags, stags with below average weight of antlers or number of crown tines will show higher FA in their traits. The same applies to beam length in young stags.
3.2. Differences in the FA of the Traits between Age Classes
Based on the Levene test, the AFA values of eight traits demonstrated great variability, i.e., significant differences in the variance values between the age classes. These characteristics were as follows: antler mass (F = 3.921; p < 0.05), antler volume (F = 4.394; p < 0.01), beam length (F = 7.539; p < 0.001), tray tine height (F = 5.440; p < 0.01), lower circumference (F = 11.301; p < 0.0001), upper circumference (F = 3.929; p < 0.05), crown height (F = 16.518; p < 0.00001), and overall length of the crown (F = 3.704; p < 0.05).
According to the results of the comparison between 20 tested traits of a significant difference in the AFA values among the age classes, only 4 of them were detected (
Table 2). These were the dry weight, volume, upper circumference of the antler, and total length of crown tines. Regarding other age groups, the yearlings manifested minimal differences in beam masses (χ
2 = 19.055;
p < 0.001), amounting to merely 0.02 kg. Although no significant differences in the beam mass AFA were detected between other age groups, it seems that they grew with an age increase. What is more, the mature deer manifested an almost doubled difference in the beam mass AFA than that of the juvenile deer.
The significantly highest values of beam volume AFA were recorded in middle-aged deer (348.64 cm3; χ2 = 20.410; p < 0.0001), while the lowest beam volume AFA values were recorded in yearlings (16.67 cm3). However, these values were lower only than those of the middle-aged and mature deer, not than those of the young stags (p = 0.08). The AFA value of the upper circumference also did not manifest age dependence. The highest AFA was repeatedly shown in the middle-aged stags (0.57 cm) but only with regard to the young individuals (0.24 cm; χ2 = 8.770; p < 0.05). Finally, ripe stags showed the highest AFA of total length of crown tines (36.74 cm) compared with young individuals (14.11 cm; χ2 = 7.341; p < 0.05).
Unlike the AFA values, significant differences in variance values between the age classes were detected in the following five characteristics in the RFA values: beam length (F = 5.328;
p < 0.01), tray tine height (F = 6.208;
p < 0.01), lower circumference (F = 5.713;
p < 0.01), and crown height (F = 11.936;
p < 0.0001). Despite the obtainment of a lower value dissipation than that of the RFA value of 20 traits achieved by an AFA-to-RFA value translation in three parameters (antler mass, antler volume, and overall crown tine length), a significant value difference was detected only for upper circumference (
Table 3). The RFA value of the trait was significantly higher in yearlings than in the young stags (F = 4.544;
p < 0.01). Summarizing the results of ANOVA, it can be concluded that the distal parts of antlers show higher level of developmental instability in comparison to distal parts.
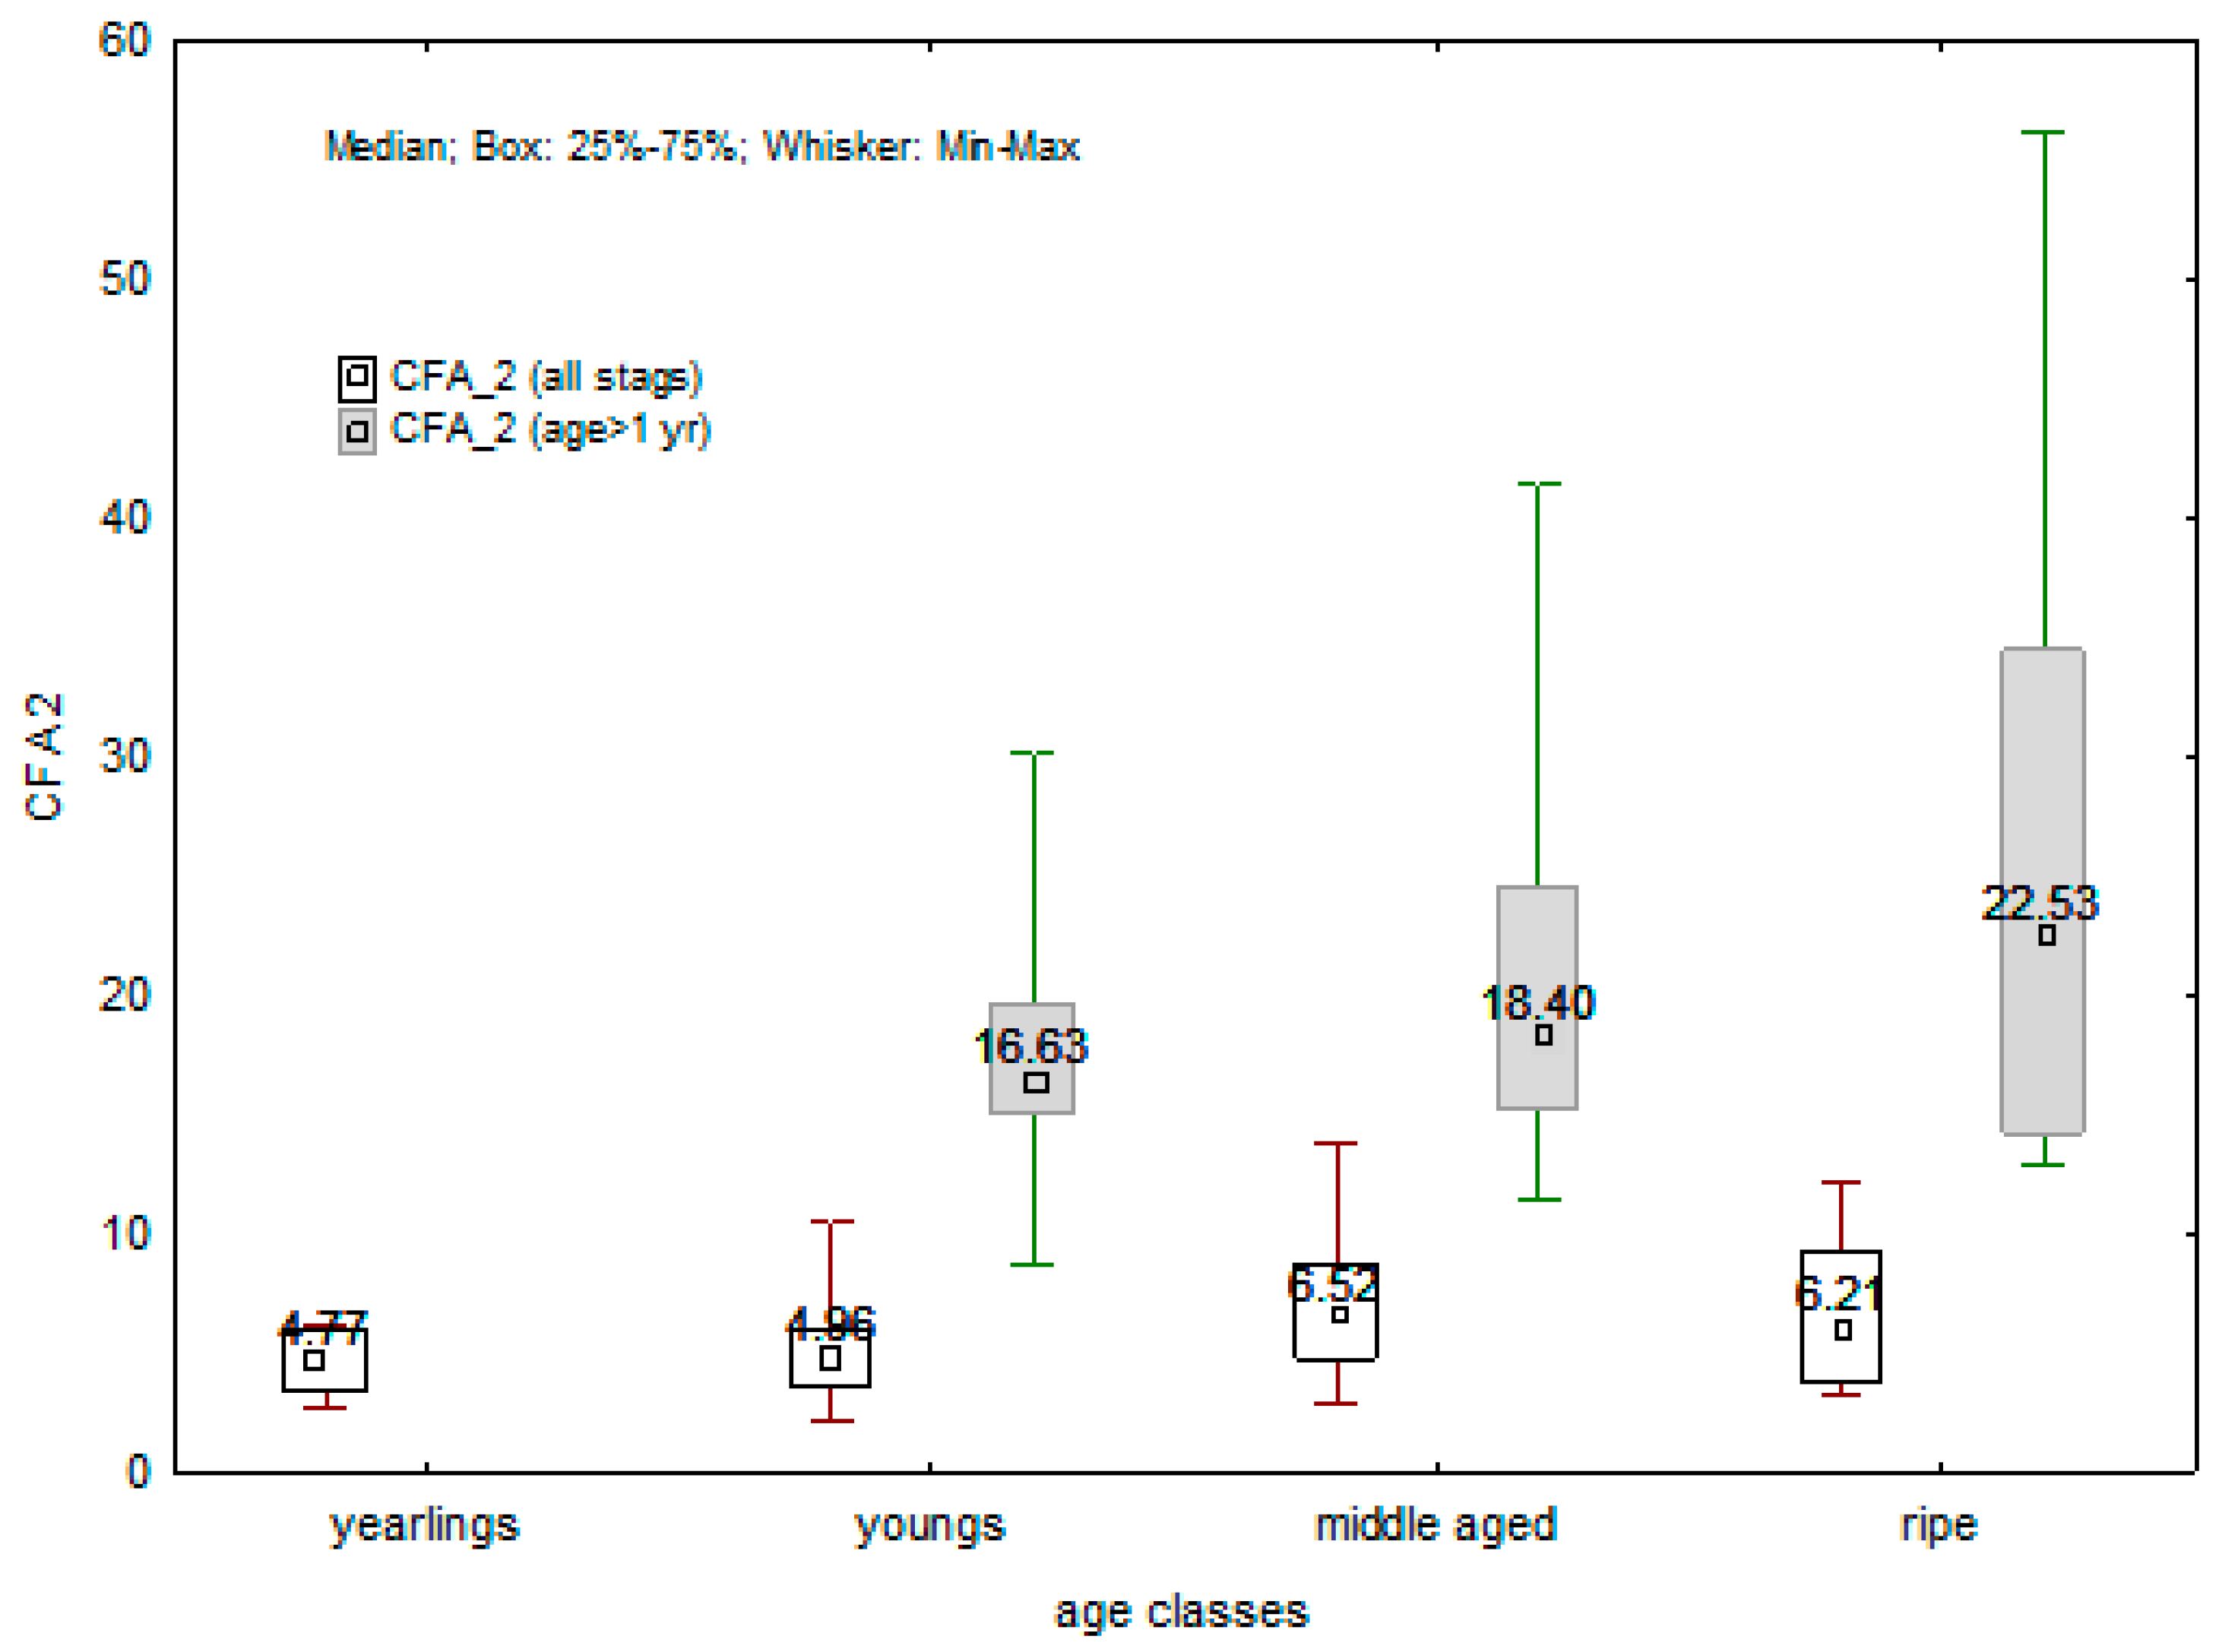
The CFA 2 values for all stags were based on a six-trait FA present in yearlings. Namely antlers of yearlings generally have mass, volume, density, beam length, circumference of coronets, and one (upper) circumference. Because of significant correlation between age and FA, three individuals were excluded from the analysis. The CFA 2 values were relatively uniform among all age classes, varying from 4.77 in yearling to 6.52 in middle-aged stags (
Figure 3). In contrast, the CFA 2 values for stags older than 1 year were calculated from all 20 traits (2 individuals were excluded from the analysis because significant age vs. FA correlation). Although these CFA 2 values showed differences among all three age classes (from 16.63 in young stag to 22.53 in ripe stags), the differences were not significant (χ
2 = 2.683;
p = 0.261;
Figure 3). Furthermore, they also showed a great variability (F = 8.389;
p < 0.001) due to a relatively large number of traits incorporated in the calculation, even within each of the age classes. On the other hand, the composite CFA 2 index, the calculation of which was based on a six-trait FA, did not manifest such variability differences despite the fact that it also encompassed the yearlings: the variability difference was on the edge of significance (F = 2.693;
p = 0.055). Moreover, ANOVA showed significant difference among groups (F = 3.062;
p < 0.05), but the post hoc test did not reveal any particular differences.
Since a significant increase or decrease trend in asymmetry was not detected in most cases, a hypothesis was proposed that a trend’s significance may relate to a critical asymmetry value during adolescence.
Table 4 provides the CFA 2 and RFA values of yearling traits. Unlike the AFA, the CFA 2 in particular represented a sort of a cumulative asymmetry value of all six yearling traits, whereas the RFA represented a trait asymmetry with regard to its average. For CFA 2, the stags (no. 3 an no. 5) that scored lower CFA 2 values as yearlings showed significant trends (correlation between age and particular trait). In antler mass (weight of dry antlers), significant correlations between the RFA and age were manifested in stags (no. 1 an no. 5) that scored higher RFA values as yearlings than their counterparts. In volume, deer no. 2 demonstrated a significant correlation of RFA and age, and recorded a higher RFA score as a yearling than other deer (9.52); however, deer no. 5 also recorded a high antler volume RFA as a yearling but did not record a significant age-related increase or decrease trend in RFA. In the same way, deer no. 6 did not score a high upper circumference RFA value at the yearling age but had recorded a significant age-related increase in the RFA of that trait.
4. Discussion
Occasionally, fluctuating asymmetry (FA) may be used as an individual’s quality indicator. However, its application cannot be considered general because dubieties still exist depending on the organism. In that respect, FA research results have mostly focused on three directions: the examination of dependence between a trait magnitude and its FA, the FA fluctuation in certain traits with regard to an individual’s age, and FA’s influence on an individual’s pest resilience and reproduction success. Most cervids (predominantly red deer) have a relatively complex antler morphology, which is fully formed only in early-aged individuals. Thus, it was possible to measure only six traits out of twenty final ones in the yearlings’ age class, three of which (the beam mass, beam volume, and upper circumference) manifested a connection with a lifelong asymmetry in certain deer.
In cervids, the existence of negative dependence between FA and reproductive success was proven [
16]. Additionally, the antler trait FA may demonstrate a connection with age but not with habitat quality, i.e., available fodder quantity [
38]. Consequently, FA in cervids is not a reliable environmental stress indicator: each population is likely to have a density threshold where it begins to manifest FA [
16,
38]. Therefore, it can still only be said that the FA is the lowest in an individual in good physical condition [
39,
40].
A dubiety concerning FA reliability as a condition index may be a consequence of experiment planning differences, most frequently due to the fact that measurements were not performed with respect to the repeated samples. Furthermore, a problem is also construed by the connection of the FA with various traits, even an attempt to place the different FAs into correlation. Thus, the authors tried to correlate the FA with a trait magnitude (cf. [
27]), physical condition (i.e., corporeal mass [
32,
41], kidney fat index [
20], parasite intensities [
20,
21,
42], age [
17,
19,
23,
43], and heterozygosity level [
16]. The results, however, were occasionally controversial.
Heretofore, the FA research in red deer was conducted in various subspecies, from Scottish [
16] and Iberian [
44] to Central European [
23] deer. However, the aforementioned subspecies differ in their antler morphology. Most often, Scottish red deer lack the bay tine, and the tine can also be absent in Central European red deer, while it is generally present in Eastern European red deer (in the Baranja territory, discussed in this research; cf. [
45]). In Iberian red deer, the presence of bay tines is not a rule [
46]. Additionally, statistical tests demonstrated that no FA was detected with respect to that tine and the form measures based thereupon. On the other hand, the two remaining (major) tines may be the significant symmetry indicators, primarily the tray tine, which manifests a connection of the FA and its trait magnitude with all age classes wherein it is present. A positive correlation between the tray tine tendon ratio and the FA denotes that the tray tine manifesting a lesser curvature signifies this trait’s high FA, i.e., the deer in poorer physical condition have more elongated tray tines. What is puzzling, however, is a positive correlation between the tray tine length and this trait’s FA in middle-aged stags. That dependence ensures that the middle-aged deer also have a higher trait FA, i.e., the middle-aged deer in poorer physical condition have longer tray tines than those of the deer in good physical condition. In hunting operations, a tray tine–brow tine ratio may be used as a criterion in the selection of breeding-valuable stags, whereby the juvenile deer with a pronouncedly short tray tine with regard to the brow tine length are considered to be breeding-invaluable [
45], being contrary to our research. This criterion of cervine animal selection, however, is more related to the fact that that a pronouncedly longer brow tine with respect to the tray tine signifies that the deer will not develop a sufficiently strong crown (if the phenomenon was observed in the juvenile individuals’ age class) or that the antler barycentre will be transferred to the beams’ proximal part. Therefore, the brow tine–tray tine ratio does not have to be correlated with the physical condition, while the asymmetric tray tine lengths may be the physical condition standards, as well as the even tray tines manifesting major length differences within a pair.
If the AFA is used in research, an estimation error can be made since larger antlers may also manifest a higher AFA than the smaller ones. Therefore, Bowyer et al. [
24] recommend the use of the RFA. Even though the RFA was used in the FA antler analysis in most papers, this measure was not standardized either. Certain scientists calculated the RFA as a quotient of absolute symmetry (AFA) and the mean of a pair trait [
16,
20,
21,
22,
23,
32,
42,
47,
48]. Others calculated the RFA as a quotient of the AFA and a larger dimension of a trait pair [
17,
18,
24,
25,
29,
38,
43]. Consequently, in our research, we avoided an influence of antler magnitude on FA by separating the deer into age groups. It is impossible to avoid this influence in young stags because the antlers manifest the highest increment at that age. Nonetheless, in young stags, the AFA recorded a higher number of significant correlations with the size trait in respect to the RFA and the older age classes. Furthermore, AFA demonstrated significant positive correlations with antler mass and density and crown tine number and length, indicating that individuals with higher values of the aforementioned traits also demonstrated higher FA of these traits than their population counterparts. Despite this, neither the AFA nor the RFA manifested significant differences between age classes in most traits. An exemption was only the antler mass, which manifested the significantly highest AFA in mature deer, and the upper circumference, which manifested the highest AFA in middle-aged deer.
According to the research conducted by Bartoš et al. [
23] and Solberg and Sæther [
17], FA rose with increasing age, while research conducted by Putman et al. [
18], Pélabon and van Breukelen [
19] and Ditchkoff et al. [
43] testified to the opposite. On the basis of our research, however, the dependence between FA and the age of an individual cannot be determined, as it was non-existent in most traits.
The second significant dependence between the trait magnitude and both asymmetry measures (AFA and RFA) was detected in case of the lower circumference. This dependence was a positive one, manifested by the middle-aged and mature deer. In most articles, the FA was in a negative correlation with the magnitude of the trait [
19,
24,
25,
27,
29], being in agreement with a theoretical hypothesis of the FA as a developmental stability index. Following Møller [
49], only the high-quality individuals may support the expenses of an over-dimensioned sexual selection trait dependent on the physical condition, so a negative dependence between the FA and that trait’s magnitude should exist. Therefore, the antler size may be taken as a population quality indicator because a very low instability level is expected for the individuals capable of developing such an antler size [
19], i.e., the individuals demonstrating a weaker physical condition (quality) have higher maintenance costs than the individuals in better physical condition. Therefore, it is assumed that the FA would be more pronounced in the individuals in poorer physical condition for they are more susceptible to the developmental stresses. The fact is that the middle-aged deer manifested a significant positive FA correlation and the values of five traits. This points to the fact that even trophy deer of that age class intensively participate in mating activity [
43], having large expanses of antler trait development as a consequence.
In that respect, provided that the deer are separated by age classes, the AFA may be a reliable FA indicator because it does not take into account deviations from the average but frequently an asymmetry that may be observed with the naked eye. From the other side, RFA is more standardised in sense of magnitude of FA. Thus, in the future, RFA can be more applicable because of its “relative value”. Namely, future investigations should be directed toward determining the critical (threshold) values of RFA, indicating good or bad condition of a local population. The composite indices carry in themselves a deviation of the trait values of certain individuals from the average of the entire population. Theoretically, they may be objective, but their application requires a relatively substantial sample, the size of which depends on the variability of FA at the general population level. Summing up the results of our research with the exception of the yearling age class, the tray beam form was a reliable indicator of asymmetry (in breeding valuable stags), while mass, volume, and upper beam circumference were reliable traits for the sake of an early diagnosis of lifelong asymmetry. They may be diagnosed as early as in the yearling class.
The problems manifested in the FA research are frequently of a methodological nature. A sample should be adequately replicated, and the sample size should encompass more than 40 individuals in a population, using a mixture of continued, meristic, and formative characteristics [
50]. In our research, we have used the combination of deer traits mentioned above. Meristic traits are the number of tines (total number and in the crown), while form traits were represented by the tine tendons, beam tine heights, and tine declension angles. Replication was obtained by using successive sequences. However, only 10 prospective trophy deer were used in the research. Although it is true that they resided in a relatively small area, they grew up under approximately identical and favourable trophic conditions.
In controlled breeding, the ancestral impact on the mass of the velvet antlers and the mass of the calves when weaning is significant and explains 30% of the variability in the mass of the antlers [
51]. Since a breeding head control is far easier in a feedlot, the offspring within an identical origin should assume more uniform dimensions. Thus, research in the antler development dynamics in controlled conditions should be burdened with far less variability. In the case of control-bred deer, it should be expected that FA does not manifest because individuals live in relatively “ideal” environmental (trophic) conditions. However, despite this, significant correlations were detected between FA (i.e., the AFA and RFA), three traits (the antler mass, antler volume, and upper circumference), and the composite FA index in our research. This proposes two hypotheses for further research: competition may be manifested even under controlled conditions, which might jeopardize the developmental stability of certain individuals (1) or some traits will show developmental instability regardless of relatively good environmental conditions (2).

 ,
, 


