1. Introduction
Machine learning algorithms for computer vision are widely used in various industries. A distinctive feature of such algorithms is the need for large arrays of labeled data on which to train them. The quality of a machine-learning-based automation system largely depends on the quality of the initial training sample. It should maximally reliably reflect the nature of the process under study, in other words, be representative [
1]. Obtaining such a sample is very laborious; it is necessary to capture as many different variants of the object states under investigation as possible [
2]. For example, if you want to classify an object, you have to include as many unique instances of each class in the sample as possible. However, this may cause difficulties because of the intraclass variation of the object, i.e., objects belonging to the same class may have a different representation (color, shape, size, etc.) [
3].
In most cases, developers of industrial automation systems do not have at their disposal the necessary amount of production data sufficient to implement machine learning algorithms. This is due to the company not recording the necessary parameters beforehand nor doing it properly; automatic markup of production data being difficult, and manual markup requiring a high level of specialist competence; data collection must be performed in long time intervals (months and years) [
4,
5]. As a consequence, these limitations, taken together, significantly complicate the implementation of machine learning algorithms in automated control systems for technological processes [
6].
One of these tasks is to control the surface condition of steel blanks and identify defects. Currently, machine learning methods applied as part of steel slab surface inspection systems require a large number of defect images for training. This in turn increases the time required to collect and markup the training dataset [
7,
8].
The use of synthesized datasets will solve these problems by accelerating the collection and partitioning of training data. The use of synthesized data for training machine learning algorithms has been gaining popularity recently. Artificial datasets based on computer graphics are already used for self-driving vehicles [
9] and for cancer diagnostics [
10]. This study considers the possibility of applying synthesized data for semantic segmentation and classification of defects in steel products. The developed approach is supposed to be used in automatic control systems of steel rolling production. These systems include vision-based quality control systems.
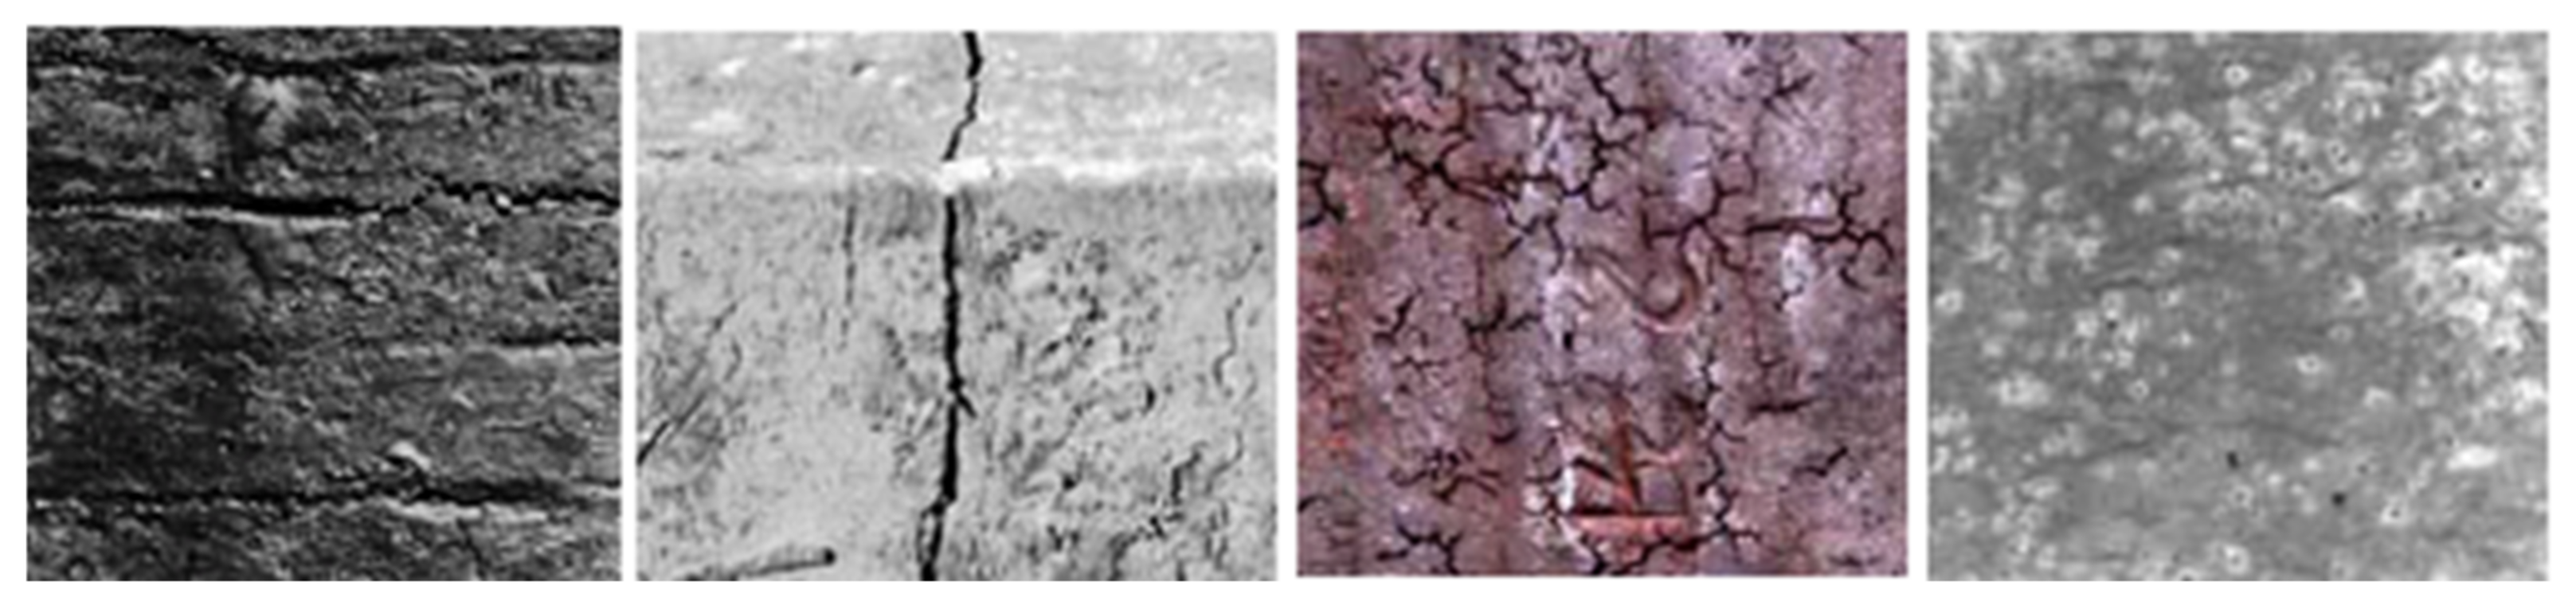
The task of determining defects on the workpiece surface is complex; it combines several independent vision tasks. First of all, it is necessary to determine the presence of surface defects in the image [
11]. It is necessary to have a clear idea about the permissible visual deviations, which can lead to false positive recognitions. For example, grease residues, water drops, or fragments of slab markings can be such deviations (
Figure 1).
The next stage of slab surface analysis is the semantic classification of defects. The complexity of this task is due to the wide intraclass diversity of defects [
12,
13,
14]. Most slab surface defects are cracks of various shapes, lengths, depths, and localization. An important problem is the technical side of defect detection. Current methods of metal surface scanning are based on optical systems: video imaging, laser triangulation, and their combination. Depth cameras have also recently begun to be used. The choice of the technical means of scanning the workpiece surface largely determines the further architecture of the system, the type of the classification algorithm, and the physical possibility of determining certain types of surface defects [
15].
This publication presents the results of generating a synthetic dataset of steel defects for training a machine learning model. On the data generated during the work, neural networks of two types were trained—a classifier and a semantic segmentation network. Both models were also trained and evaluated on the dataset. The resulting models can be used in industrial quality control systems for rolled steel. Methods for evaluating neural networks are in
Section 2. The dataset generation methodology and model training results are in
Section 3.
2. Materials and Methods
To solve the issue described in the Introduction, a technique was developed that allows for generating training datasets for training neural networks. The implementation of the proposed methodology consists of the following stages. The process of building the above-described hardware and software complex can be divided into several sequential stages:
Collecting data and forming training samples. At this stage, the collection, systematization, and marking of data on surface defects of steel workpiece are carried out in a unified form [
16].
Building a defect classifier model. A classifier model is built and trained based on the obtained ideas about the types of defects on the surfaces of rolled steel and variations in their manifestation [
17].
Evaluating the quality of the classifier’s work. The chosen classifier model is tested on a specially selected sample, and its samples were not part of the training one. Additionally, distortions can be introduced into the test sample images to test the robustness of the algorithm as a whole [
18].
The freeware 3D editor Blender was used to generate the training sample. It is also equipped with built-in shader writing tools necessary for software generation of random slab defect textures.
To test the proposed methodology, two neural networks were trained on the synthesized data: Unet [
19]—for segmentation of defects in the image and the Xception classifier [
20]. Trained neural networks were tested on a real dataset Severstal: Steel Defect Detection [
21] as a validation sample.
Metrics such as precision, recall, and Dice coefficient were used to evaluate the quality of the models [
22,
23,
24].
Algorithm accuracy within one class or intraclass accuracy is a metric that characterizes the number of all records that really belong to a certain class, to the sum of all exemplars that were assigned to that class by the algorithm. The metric is calculated using the following Formula (1):
where
—number of true positive answers, and
—number of false positives.
Recall is another important metric that is defined as the proportion of samples from a class that are correctly predicted by the model. This metric is the proportion of class instances recognized by the algorithm as related to the total number of instances of the class in the sample [
25]. Recall is calculated using Formula (2):
where
—number of true positive answers,
—number of false-negative responses.
Dice’s coefficient [
26] is used to compare the pixel match between the predicted segmentation and the corresponding ground truth [
27]. The Dice coefficient is determined by Formula (3):
where
—predicted pixel set,
—true meaning.
The Dice coefficient is primarily a statistical measure used to assess the similarity of two samples: the similarity coefficient [
25].
The training and evaluating of the neural network model was carried out using the Keras framework and the Python programming language. To assess the model quality metrics, validation samples were fed to the input of the model, which the neural network had not previously processed during training. We compared the neural network’s responses to the ground truth values according to the chosen metric. To automate the evaluation of the quality of the work of models, the function “evaluate”, built into the Keras framework, was used.
The artificial training dataset was generated in the Blender 3 editor using the built-in shader tool; the program texture generation was done in the Blender API. This software product is widely used for generating artificial data for object detection using state-of-the-art deep learning models [
26].
The process of generating an artificial dataset of defects includes the following steps:
To generate synthetic data containing surface defects of steel workpieces, a scene simulating the shooting of a steel by a camera was assembled in the Blender 3D graphical editor.
The slab model is a parallelepiped onto which the shader material is superimposed. Depending on the input parameters passed to the shader, the texture displayed on the surface of the parallelepiped changes. Thus, a unique combination of defects of the same kind can be reproduced with each new set of parameters. The disadvantage of this approach is the need to create a new shader for each type of defect. Therefore, in this work, the choice was limited to three basic types of defects: cracks, bubbles, foreign inclusions, and surface irregularities.
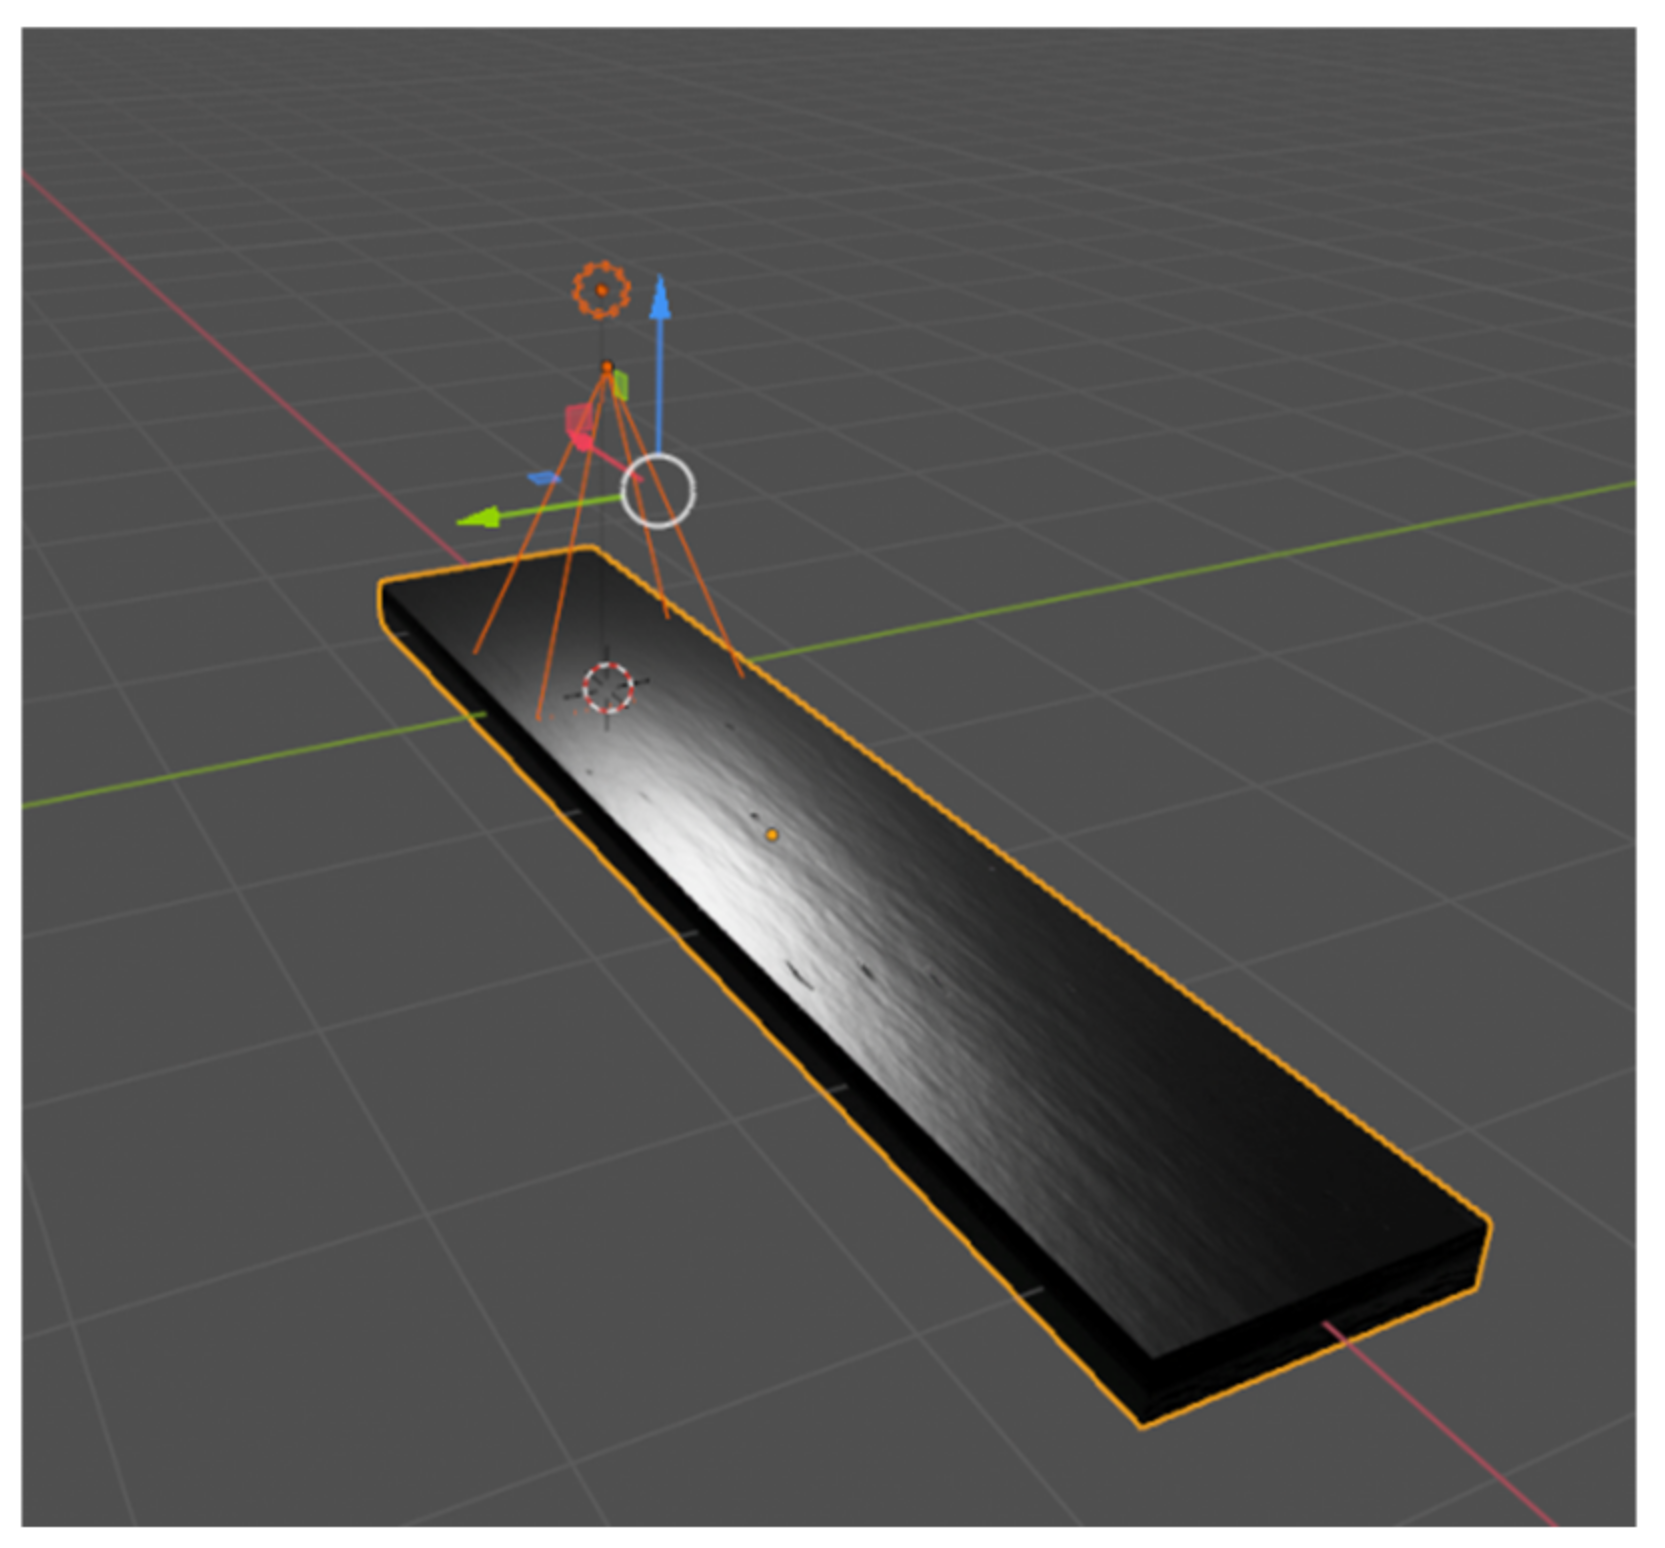
The conditions of shooting the slab surface in the 3D scene mimic real industrial conditions with cameras mounted vertically above the slab surface. The light source in the scene was placed slightly above the camera, thus simulating the illumination provided by the computer vision cameras (
Figure 2).
The surface texture of the workpiece, the type, and frequency of appearance of defects on it were set through the shader of the material assigned to the workpiece model. Thus, we were able to determine in advance, even before generation, the composition (by defects) of our artificial dataset. Image generation for the dataset was performed automatically by sequentially shifting the slab model in the scene relative to the camera, thus simulating the movement of the workpiece along the roller conveyor. Shader parameters were also changed with each iteration to create a greater variety of defect shapes and locations. Thus, the effect of random distribution of surface defects was created, after which the image of the surface was rendered.
The main algorithm for creating a synthetic dataset is the procedural generation of a surface defect. It is a shader—a program that sequentially transforms the original noise texture. A separate shader was written for each of the four defect types. The variety of shapes of the generated defects was adjusted using the detorsion and noise parameter. For example, such a defect as a crack is based on a procedural texture—a spherical gradient. It, like the cracks themselves, has the shape of an ellipse, subjected in advance to numerous deformations through changes in its UV coordinates and the symmetry of the original figure. The fracture boundaries are subject to displacements along the normal. The textures for chipping generation were created by transforming the Perlin noise. An overall scheme of the procedural dataset generation algorithm is shown in
Figure 3.
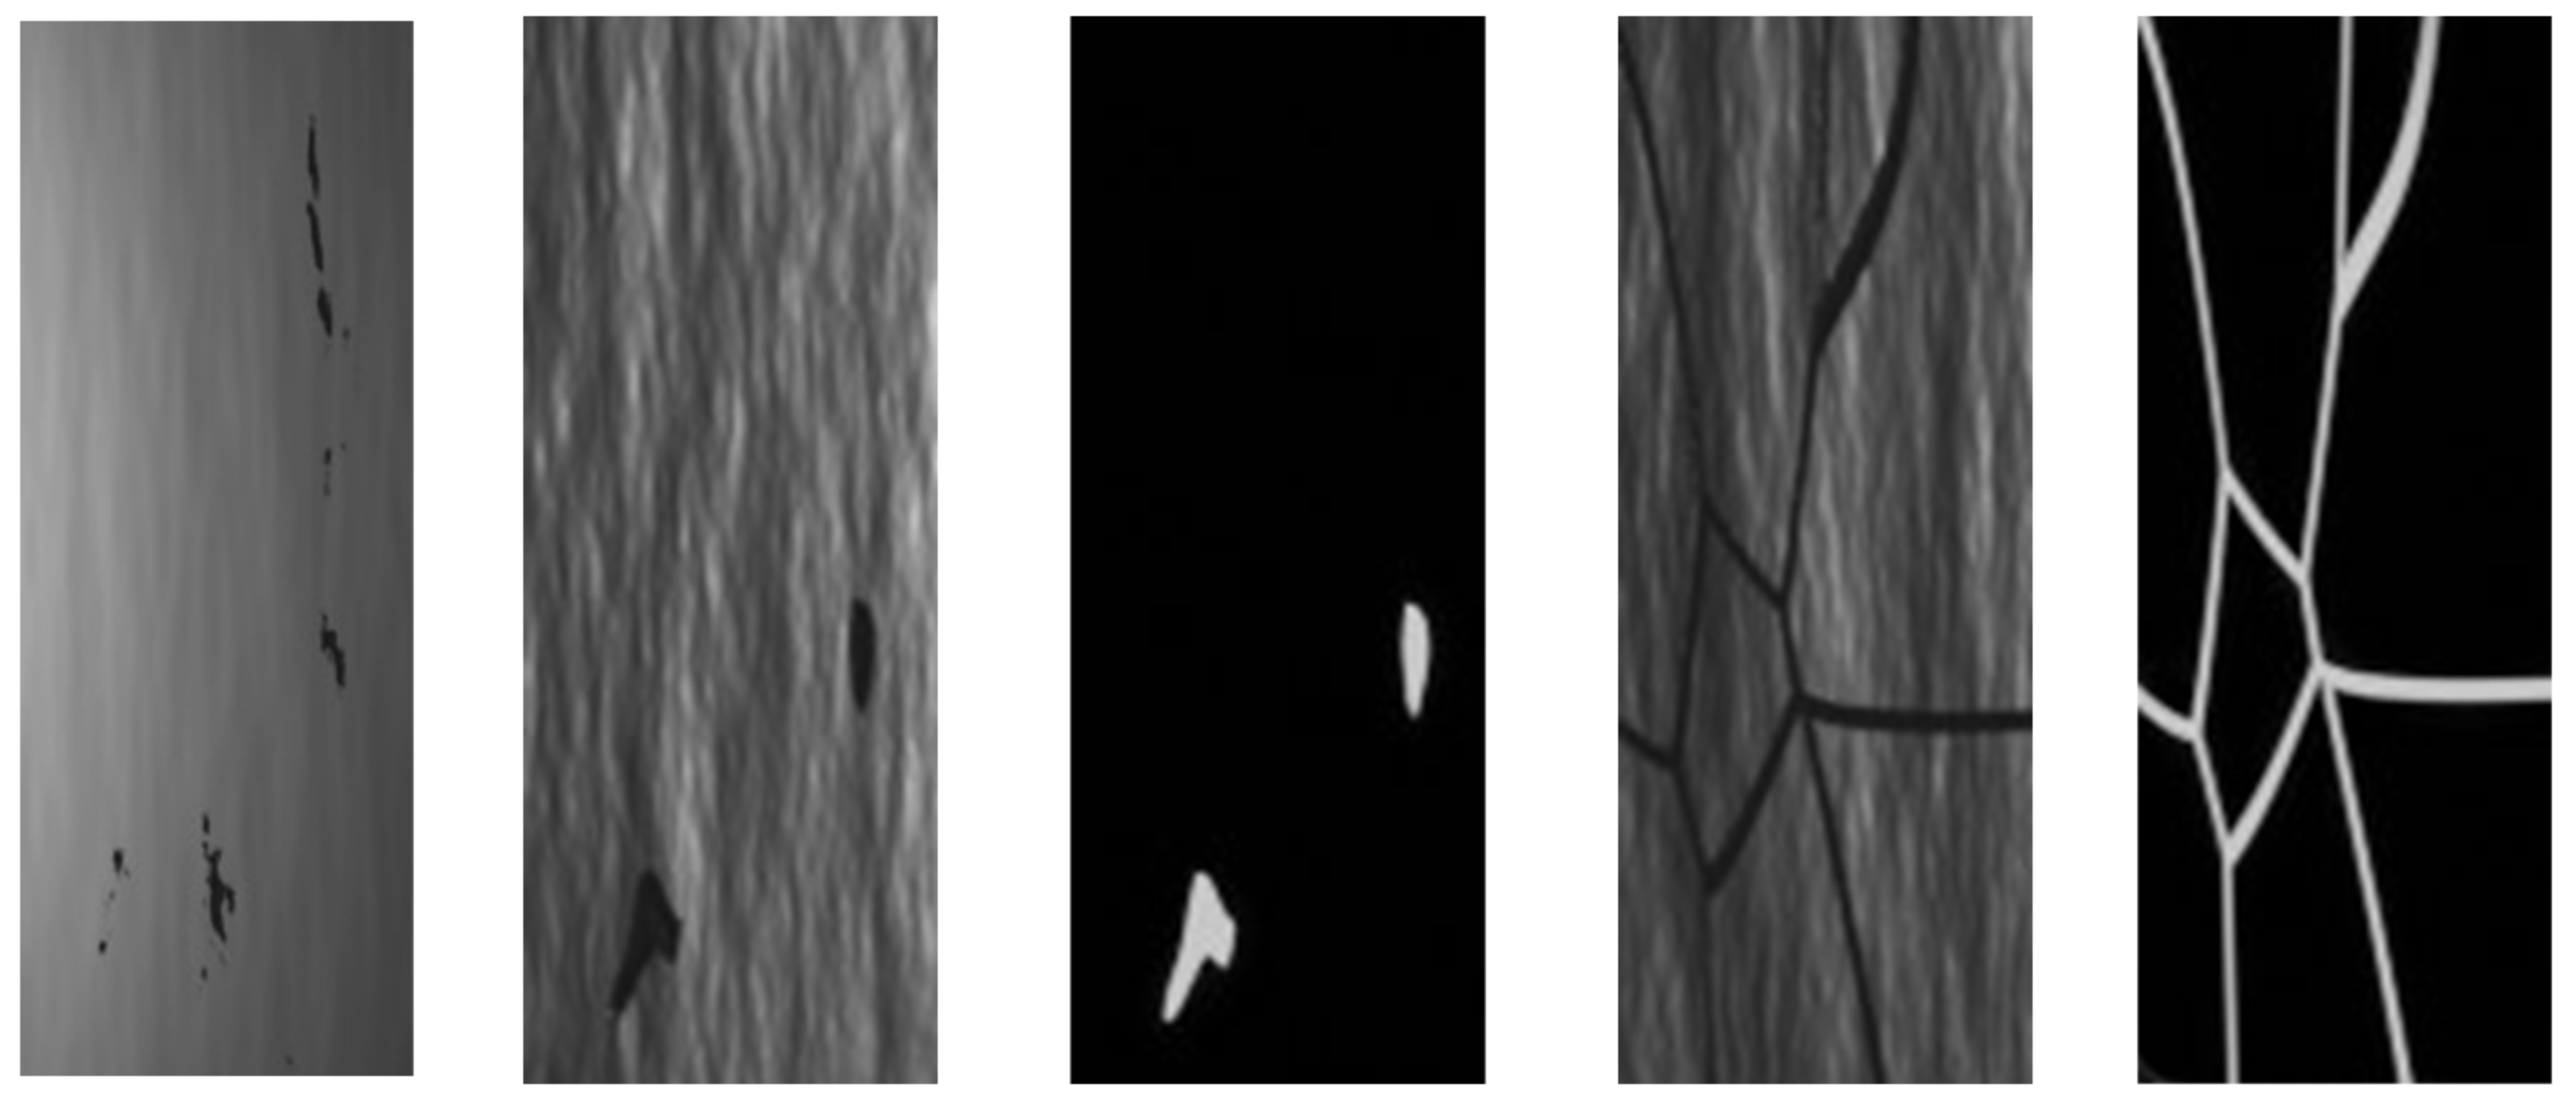
Parallel to the photorealistic images, their black and white masks are also created. The pixels containing the defects of the slab surface are highlighted in white. The masks are one of the variants of training data markup for segmenting architectures. They also can be used to automate the markup of classifiers. Thus, one of the main difficulties encountered in the preparation of real data—markup—was solved. In this approach, the partitioning was done automatically, in parallel with the generation of the images themselves.
Since the data generation process for the dataset is fully controllable, we can predetermine the distribution of surface defect classes within the sample. In this case, it is necessary to ensure the most equal distribution between the classes of different defects. It is necessary to normalize the distribution of instances in the dataset. This will increase the accuracy of defect classification and reduce the influence of the predominant number of instances of individual classes in the sample on the classification result as a whole. Synthetic data have been tested over two artificial neural networks: U-Net and Xception.
U-Net is one of the standard CNN architectures for image segmentation tasks when you need to segment its areas by class and create a mask that will divide the image into several classes. The architecture consists of a contraction path for capturing context and an asymmetrical expanding path that allows precise object localization. U-Net achieves high results in various real-world problems using a small amount of data to achieve high segmentation accuracy [
27].
The Xception is a compact modification of the Inception classifier architecture based on depthwise separable convolution. We used this architecture to classify defect types on original image areas with steel defects that previously were recognized with the U-Net model. This mode was chosen among many other classifiers because it requires less data for correct object classification.
As the result of combining both of these models, the semantic segmentation problem on steel defects models was solved.
3. Results
An artificial dataset consisting of 6000 defect images and including four defect classes was generated during the experiment. A total of 1500 images were generated for each type of defect to ensure an even distribution of samples in the sample.
Below, there are the results of generating synthetic data for different types of defects.
Figure 4 shows examples of defects and their masks in the generated dataset.
Two neural network architectures were trained: Unet—for defect segmentation in the original image and Xception—for classification. Both neural networks were trained on a synthesized dataset and tested on real data.
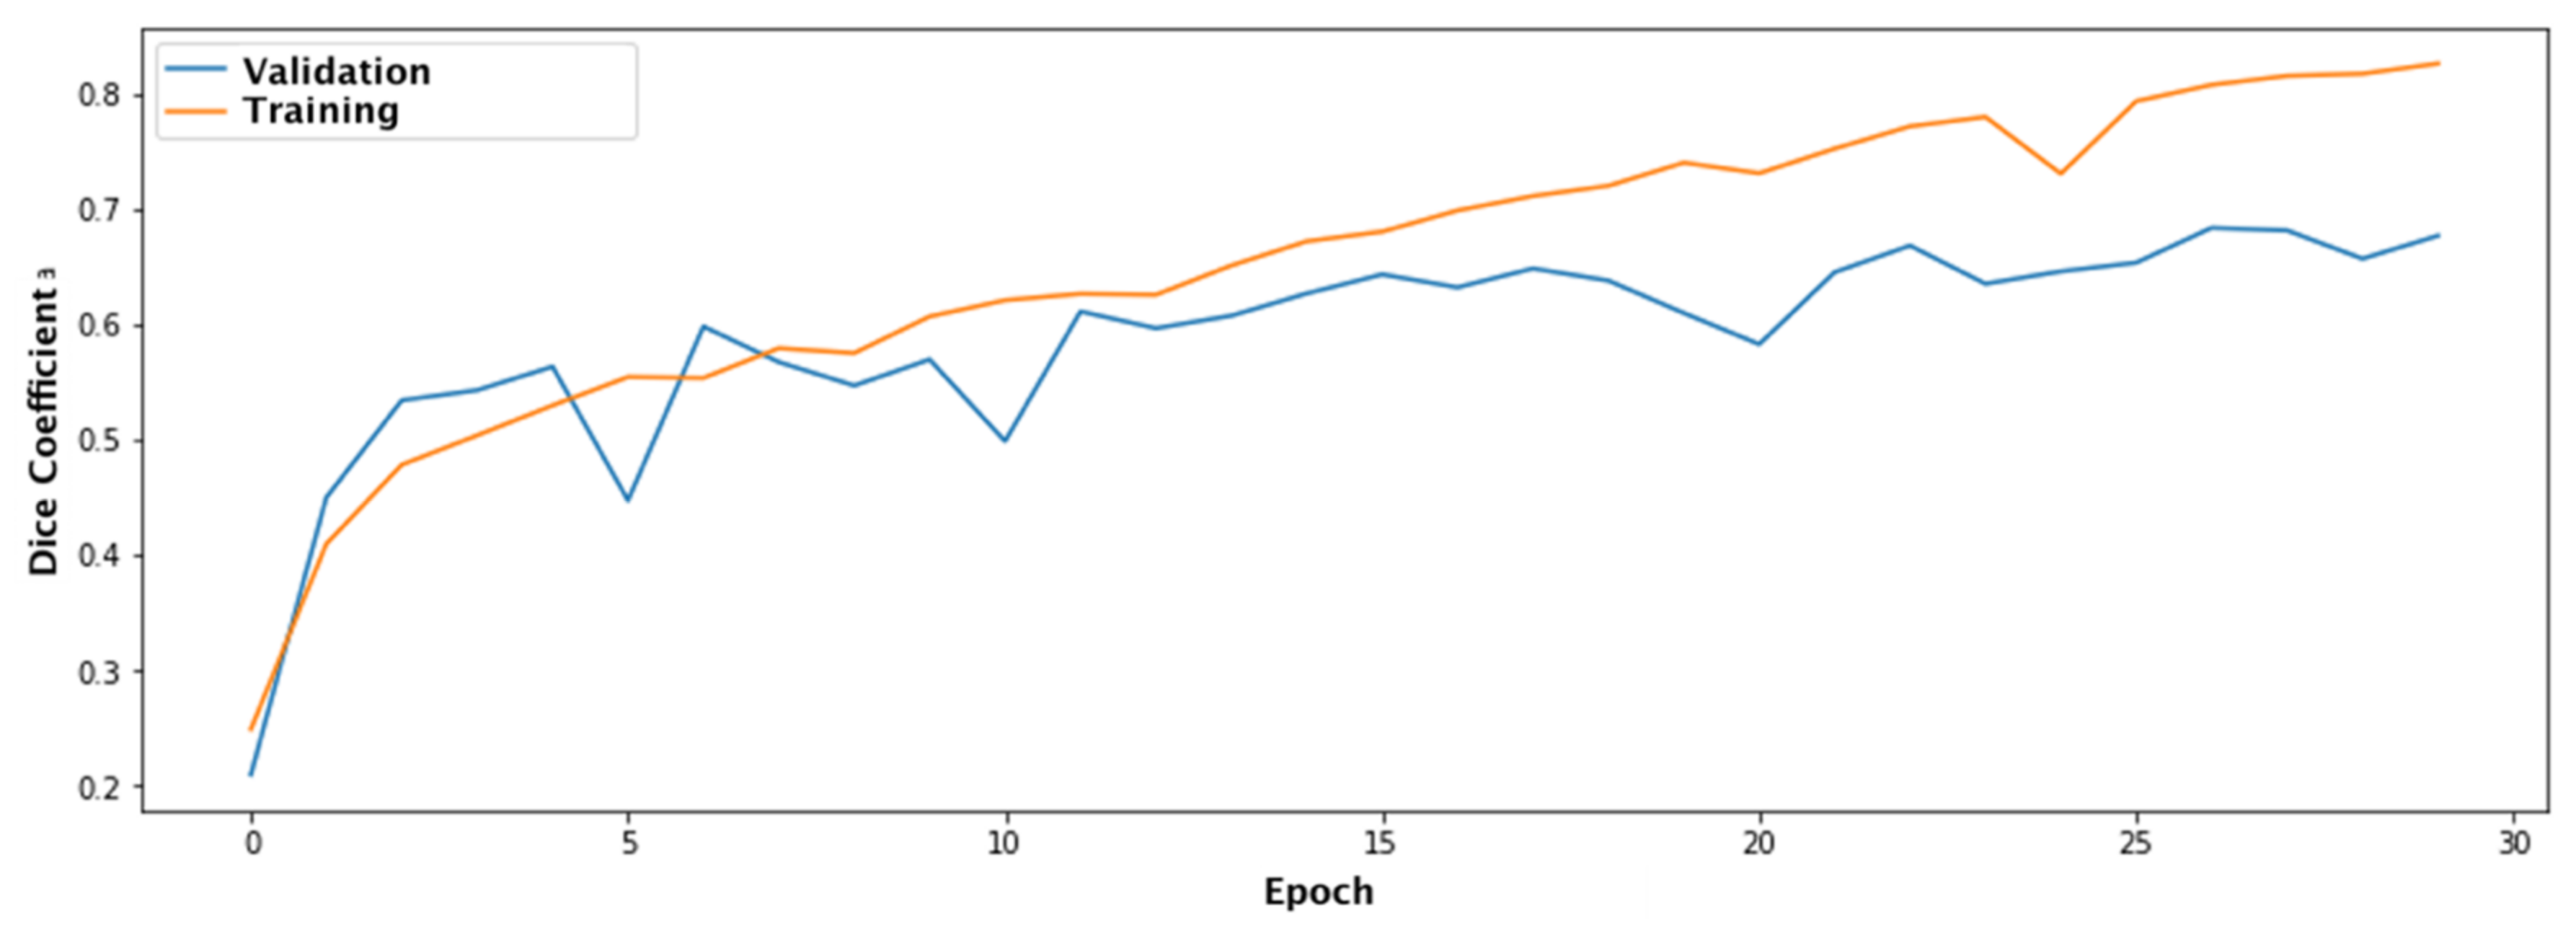
Below are the results of training the Unet neural network on synthetic data with validation on real data. The neural network was trained entirely on a synthetic dataset for 30 epochs.
Figure 5 shows charts of the change in the Dice coefficient for epochs for the test and validation samples.
As can be seen from the graph, the Dice coefficient for the training sample reaches 0.815 and 0.632 for the validation sample, represented by real defect images.
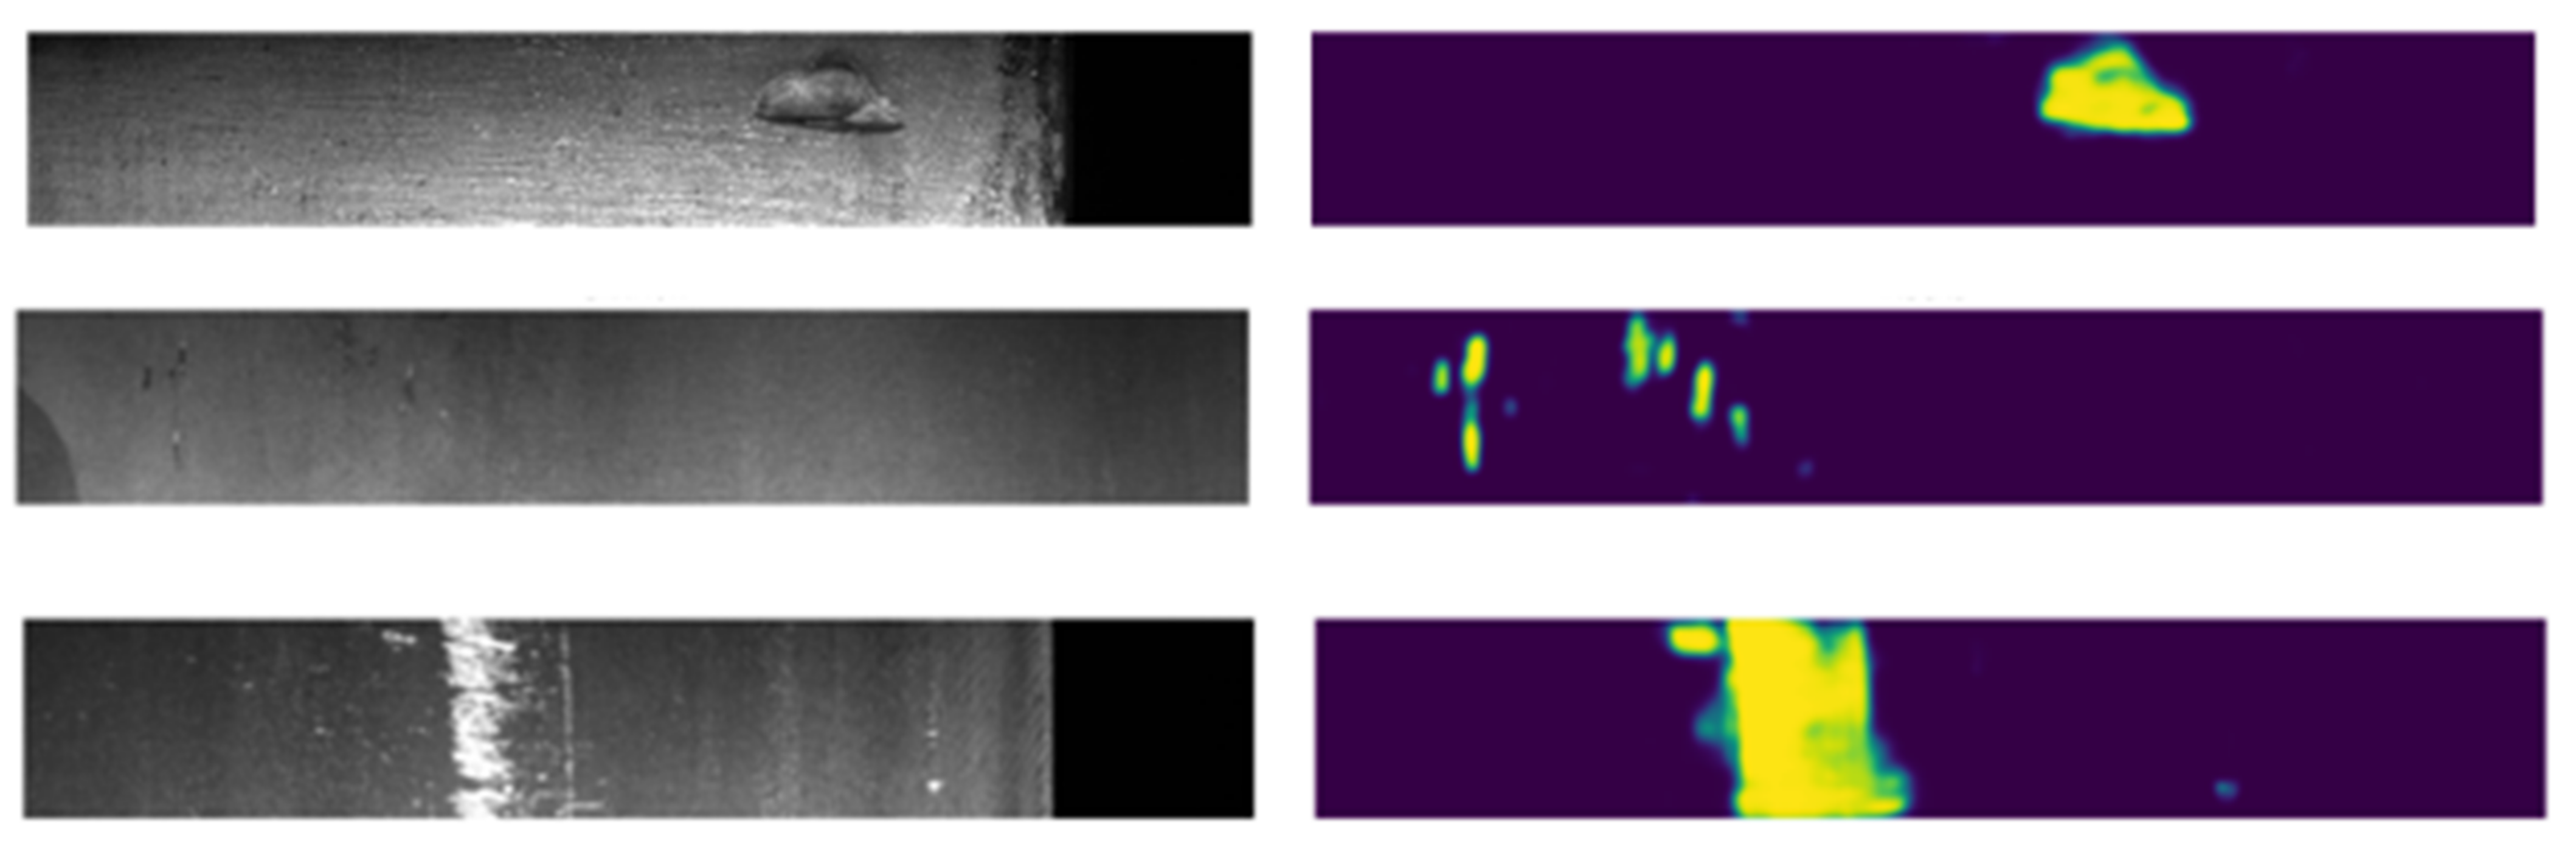
Figure 6 shows examples of segmentation of defects in an image from a real dataset by the Unet neural network trained on synthetic data.
As can be seen from the above images, the neural network with the Unet architecture quite accurately and clearly identifies defects in the original image of real defects in rolled steel.
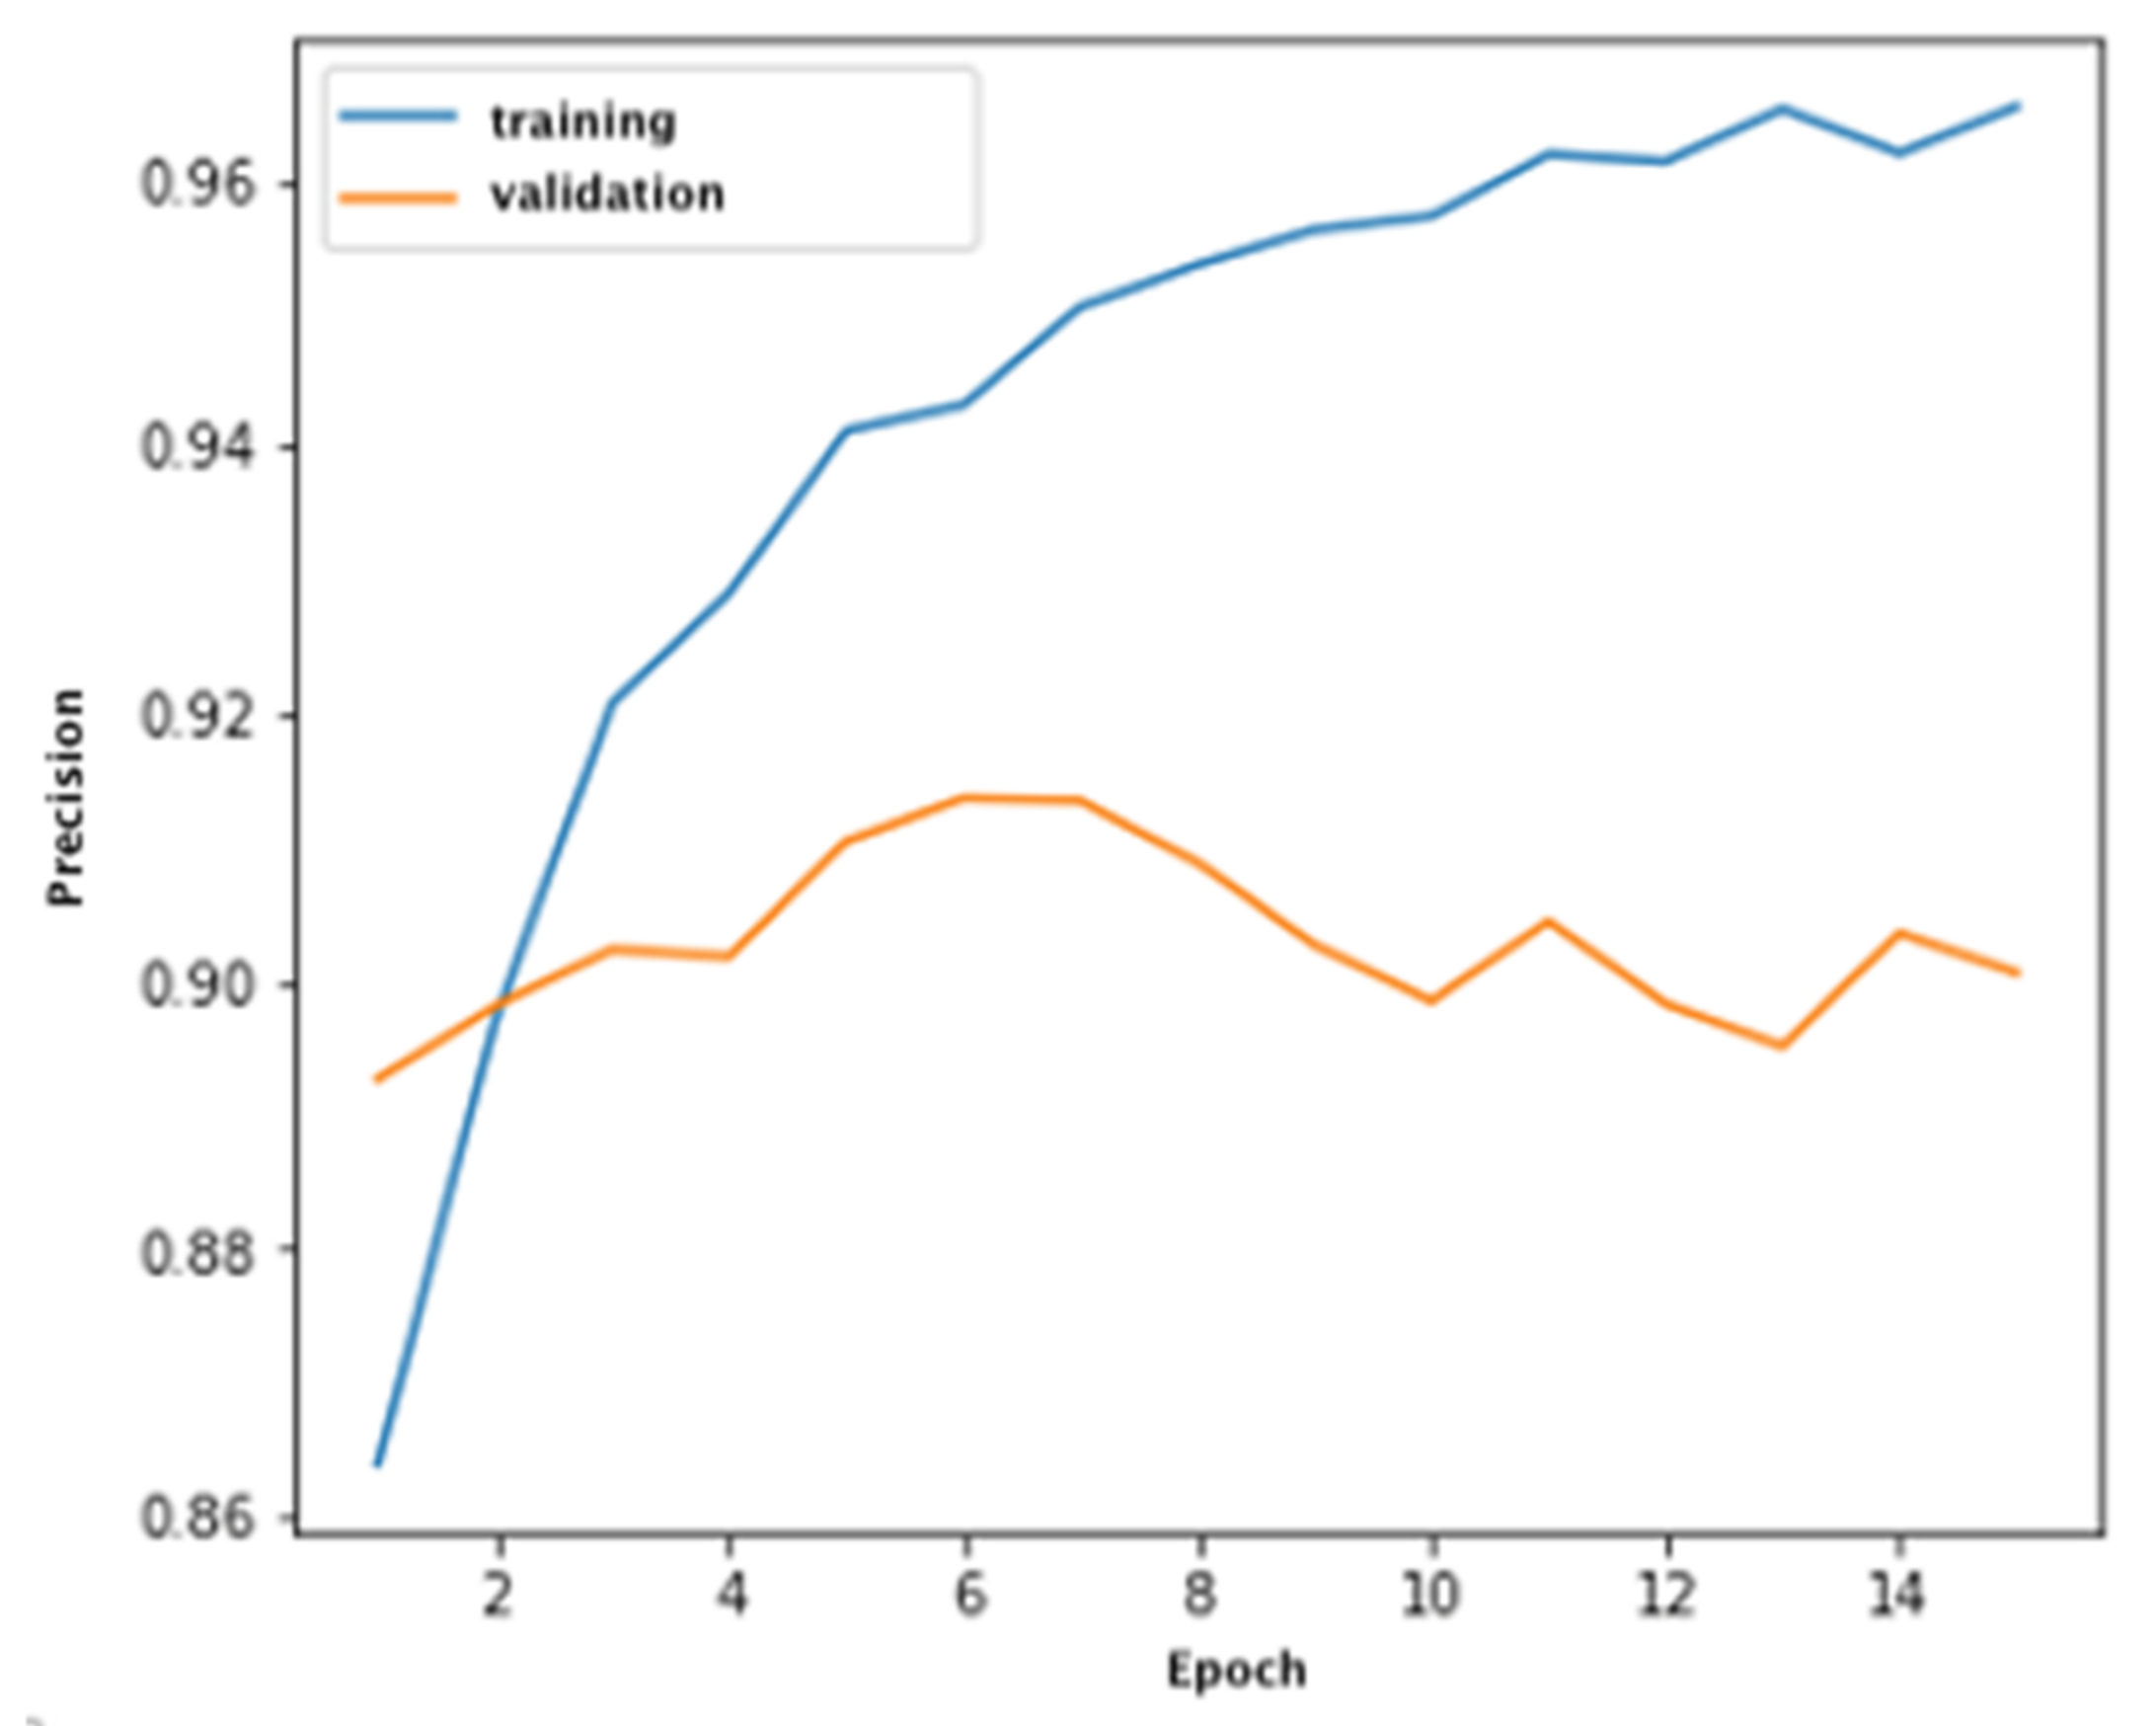
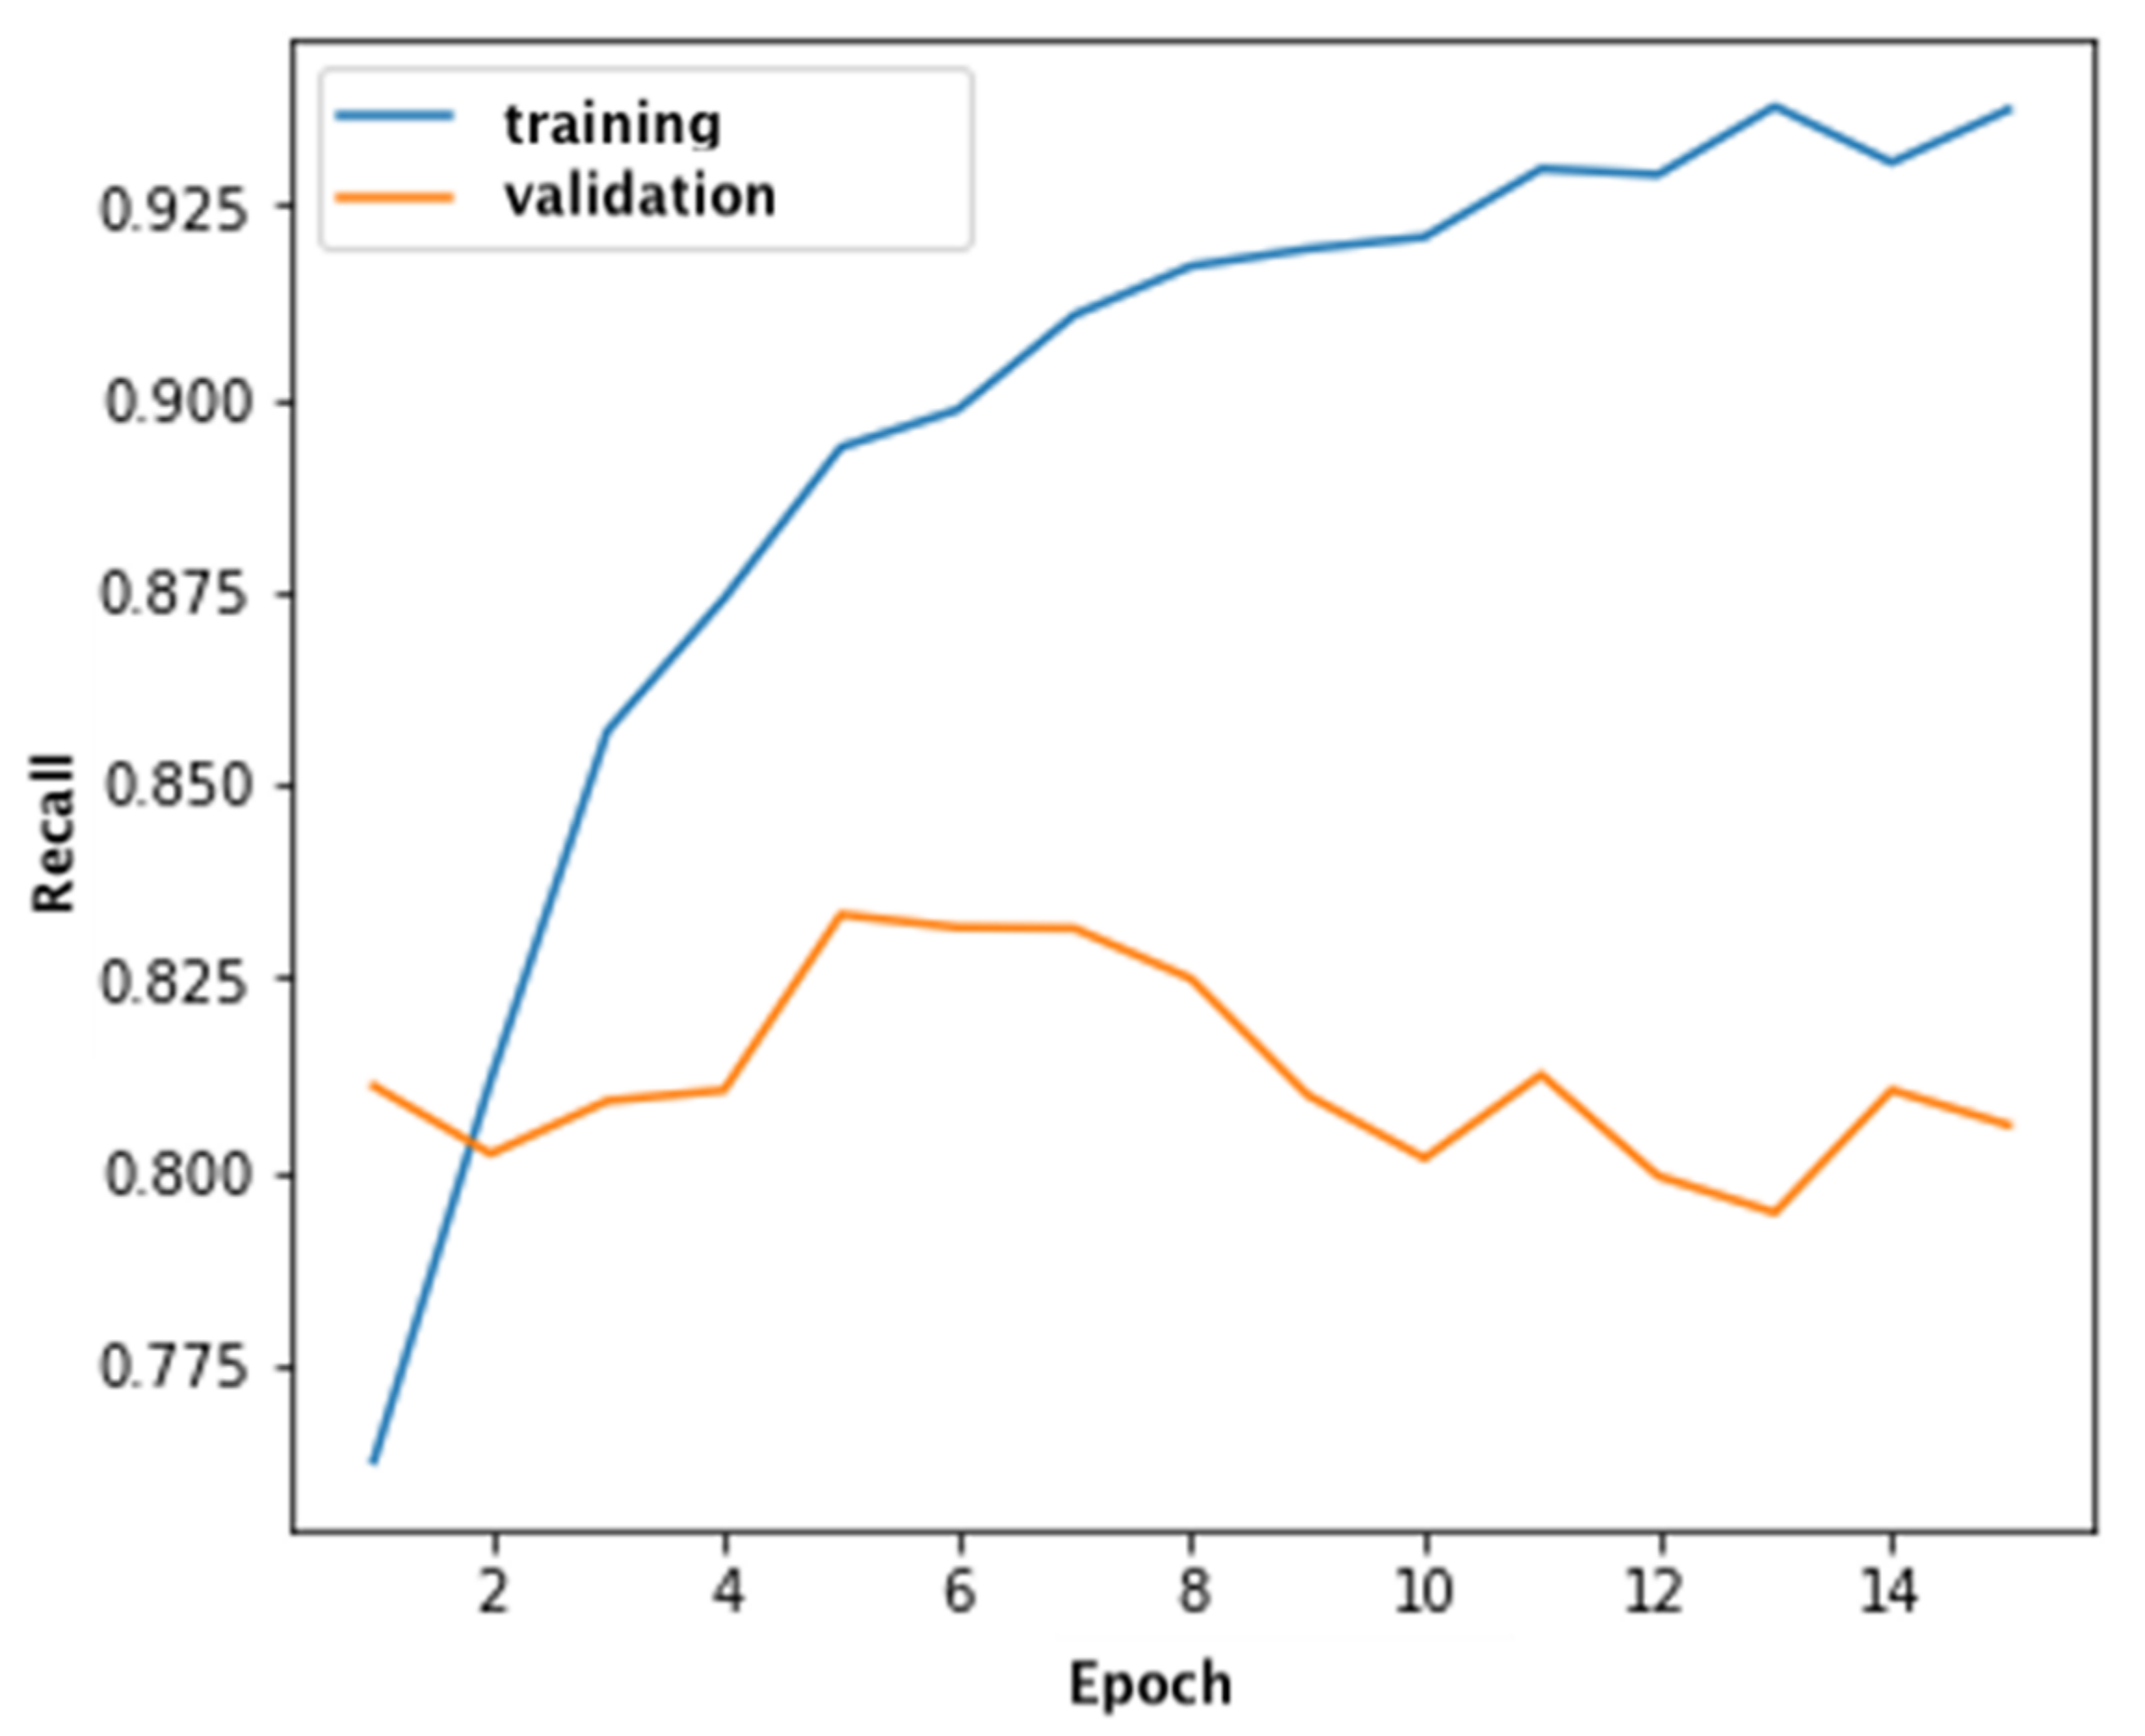
The Xception architecture was used to classify defects. This neural network was also trained on synthetic data. The training was carried out in 15 epochs. As mentioned earlier, the main metrics for assessing the quality of classification are accuracy and recall.
Figure 7 and
Figure 8 show graphs of the accuracy of defect recognition on synthetic (training) data and on real data.
As can be seen from the graphs, Xception classifies defects in training and validation samples with a sufficiently high accuracy. At the same time, the recall of the classification is somewhat lower and on the validation sample does not exceed 0.81, which indicates a large number of false positive recognitions (
Figure 8).
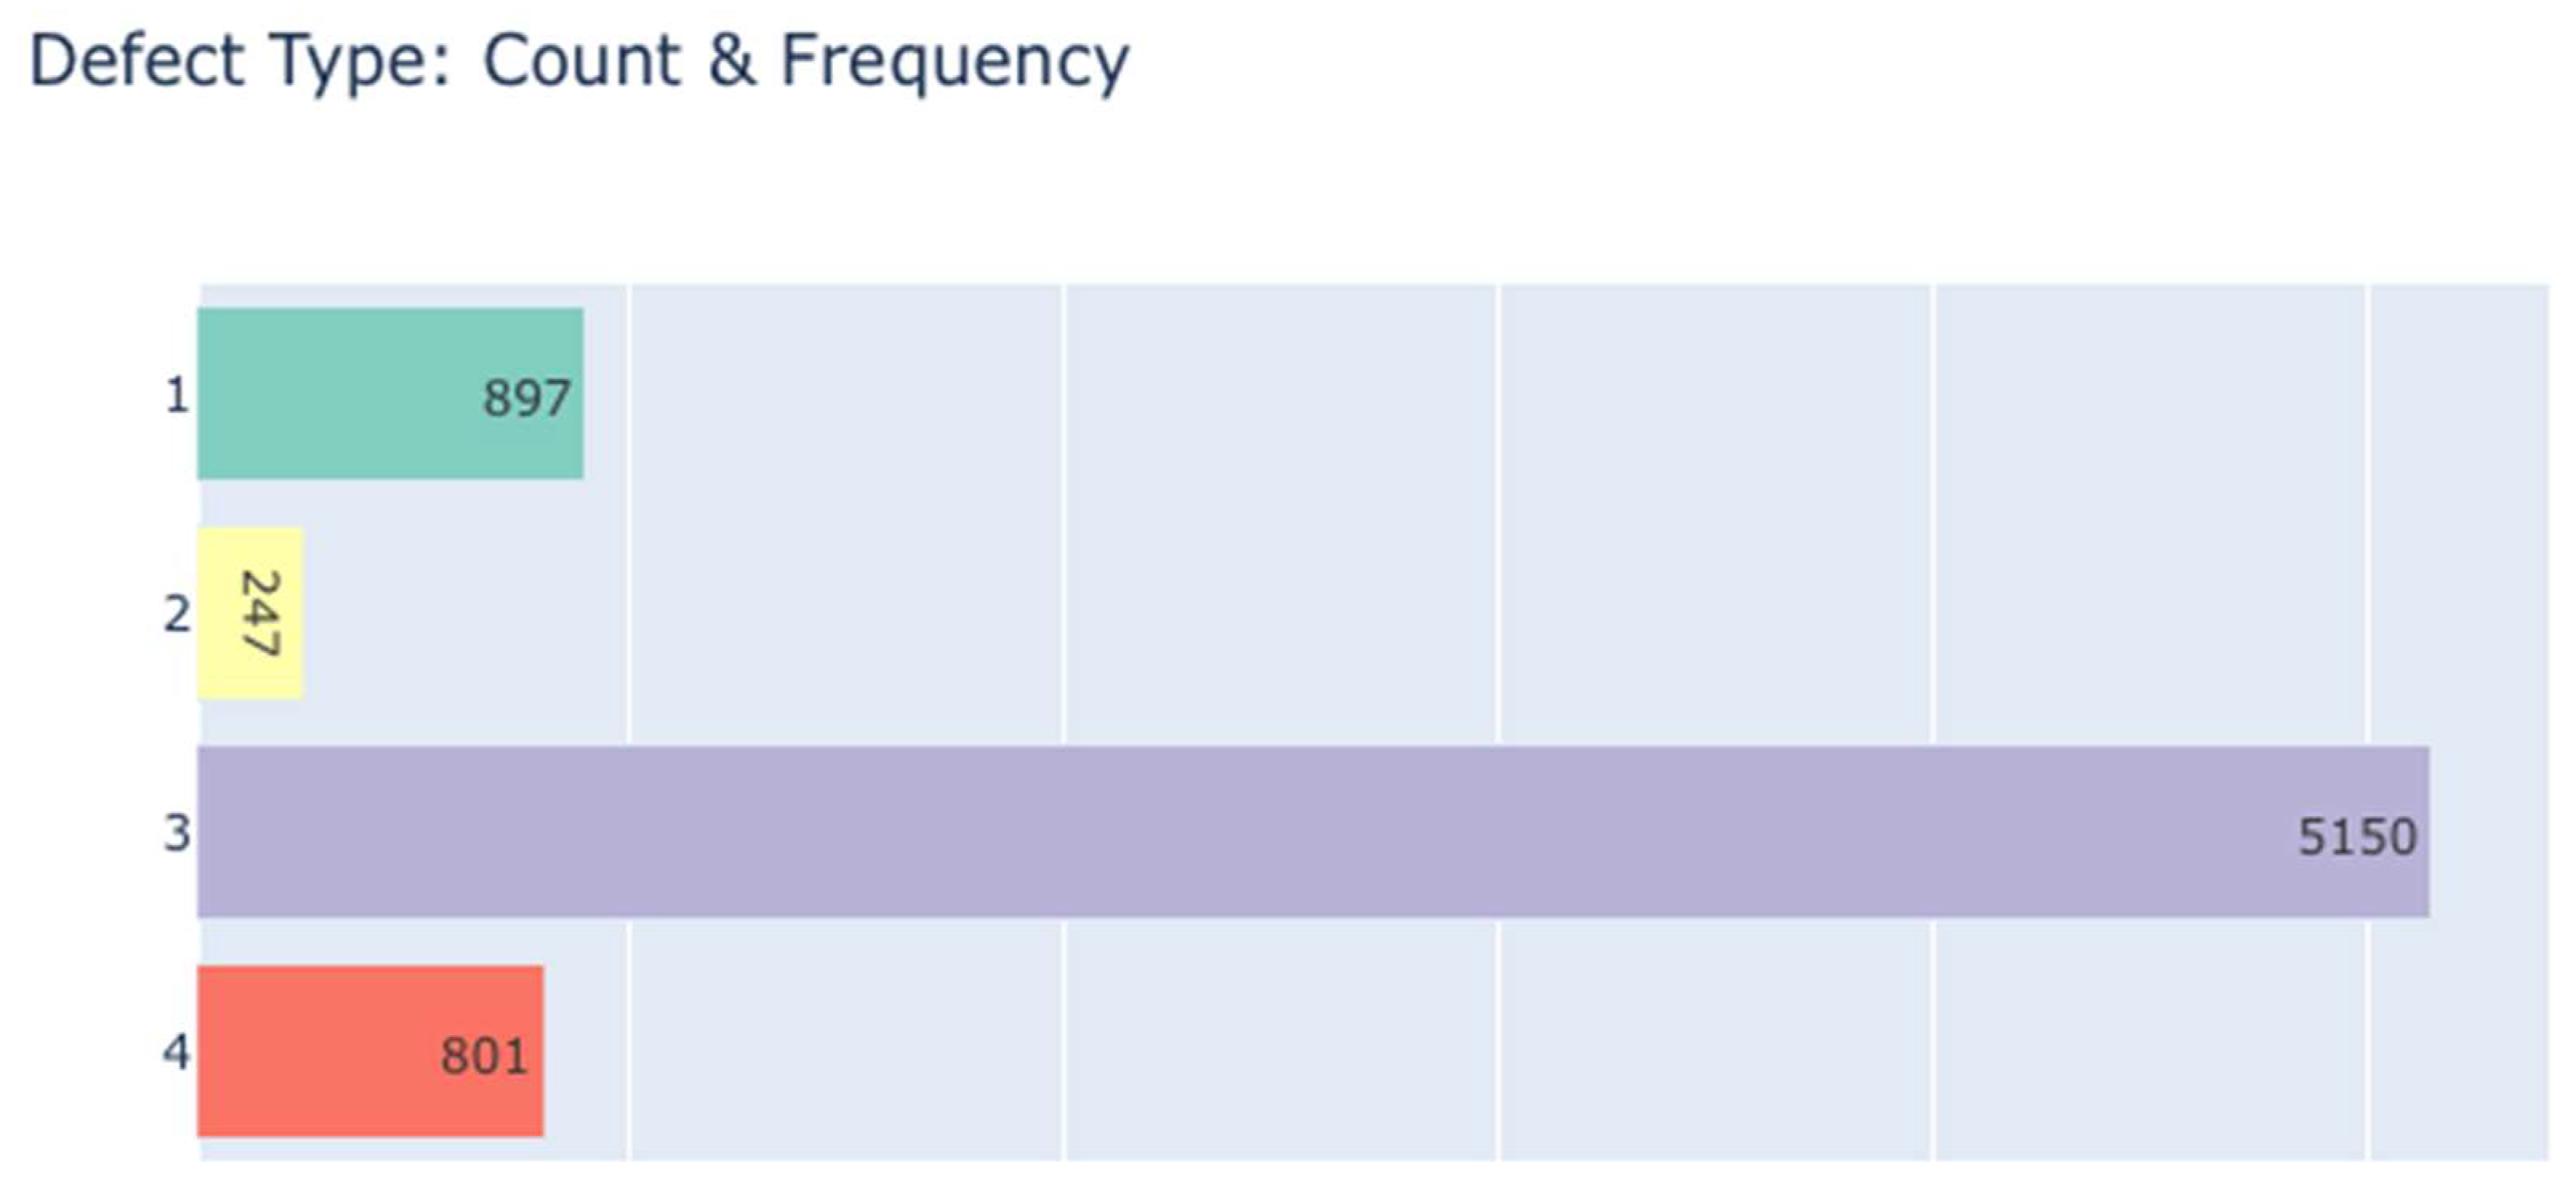
Let us compare the performance of architectures trained on synthetic data and on real data. To do this, we train the presented Xception and Unet models on the real Severstal: Steel Defect Detection dataset, which includes 7095 samples and four classes of defects.
Figure 9 shows the distribution of defects by type in the real dataset.
Similar to the artificial dataset, the real data was divided into training and test dataset in the ratio of 80% for training and 20% for test dataset. Neural network training was also performed with the same settings as on synthetic data, i.e., 30 epochs for Unet and 15 epochs for Xception. Thus, the only different condition in this experiment was dataset.
Table 1 shows the comparison of neural network quality metrics on real and synthesized data.
4. Discussion
The proposed approach makes it possible to develop and debug computer vision algorithms without having access to the real object of research, as well as to automate the process of marking up training data for segmentation and classification tasks. The results of neural networks validation trained on artificial data were promising. This confirms the viability of the proposed methodology for working with different types of vision algorithms and the application of techniques for the development of industrial quality control and defectoscopy systems.
The variety of scenes that can be rendered using 3D graphics does not limit the scope of synthetic data to the steel industry. The proposed approach can be applied in other areas, for example, in medicine, analysis of satellite images, and autonomous vehicles.
Synthetic data made it possible to correctly train neural networks for such basic tasks of computer vision as image segmentation and image classification. During the variation of neural networks on real data, the accuracy of recognition and segmentation of defects noticeably decreased. This is primarily due to the fact that procedurally generated images of defects are not realistic enough in comparison with their real counterparts, which, of course, introduces certain distortions in the operation of the algorithm. In general, it should be noted that the quality of defect classification is lower than segmentation. This proves that the images of defects on artificial data are not realistic enough. This disadvantage can be compensated by combining synthetic and real data as part of one dataset, whenever possible, or by increasing the realism of generated images using computer graphics.


