
Partitioning Pattern of Natural Products Based on Molecular Properties Descriptors Representing Drug-Likeness


1
Department of Inorganic Chemistry, Faculty of Chemistry and Pharmacy, University of Sofia, 1 James Bourchier Blvd., 1164 Sofia, Bulgaria
2
Department of Analytical Chemistry, Faculty of Chemistry and Pharmacy, University of Sofia, 1 James Bourchier Blvd., 1164 Sofia, Bulgaria
*
Author to whom correspondence should be addressed.
Symmetry 2021, 13(4), 546; https://doi.org/10.3390/sym13040546
Submission received: 7 March 2021
/
Revised: 23 March 2021
/
Accepted: 24 March 2021
/
Published: 26 March 2021
(This article belongs to the Collection Feature Papers in Chemistry)
Abstract
:A cheminformatics procedure for a partitioning model based on 135 natural compounds including Flavonoids, Saponins, Alkaloids, Terpenes and Triterpenes with drug-like features based on a descriptors pool was developed. The knowledge about the applicability of natural products as a unique source for the development of new candidates towards deadly infectious disease is a contemporary challenge for drug discovery. We propose a partitioning scheme for unveiling drug-likeness candidates with properties that are important for a prompt and efficient drug discovery process. In the present study, the vantage point is about the matching of descriptors to build the partitioning model applied to natural compounds with diversity in structures and complexity of action towards the severe diseases, as the actual SARS-CoV-2 virus. In the times of the de novo design techniques, such tools based on a chemometric and symmetrical effect by the implied descriptors represent another noticeable sign for the power and level of the descriptors applicability in drug discovery in establishing activity and target prediction pipeline for unknown drugs properties.
1. Introduction
Chemometric methods assigned to the new drug design paths and discovery are sufficient to support the computer-aided drug design using the advantage of representation of natural compounds variety from diverse classes by descriptors that capture their structural similarity faces and drug-like properties [1,2,3,4]. Piles of molecular descriptors produced and assessed by different methods and approaches [5,6,7,8] have been described in the literature for the drugability and drug-likeness properties of small molecules [9,10,11,12,13,14,15,16]. Targeting drug-like properties as proposed by Lipinsky [17] and relies on a well-known rule-of-five which is described on five simple physicochemical parameters (molecular weight ≤ 500, log P ≤ 5, H-bond donors ≤ 5, H-bond acceptors ≤ 10, Topological Polar Surface Area < 140 A2 good intestinal absorption).
The progress in multivariate statistics has opened new answers for the questions about the proper interpretation and classification in the proper choice for the cross-cutting descriptors which are a main part of the computer-aided molecular design. Application of the latter mentioned data exploratory methods towards a range of natural compounds candidates uses a robust and coherent approach for the selection of not only suitable natural chemical compounds but also accessible descriptors. They are responsible for their pharmacophores and drug-like properties. The application of some physicochemical parameters becomes the meaningful criteria that make the studies object from candidate to drug. All the in silico methods are a comprehensive way to do and to evaluate new targets against the SARS-CoV-2 or any new threat.
Sesquiterpenes, alkaloids, curcuminoids, phenolics and terpenoids are natural-product drugs of plant origin that are pharmacologically active compounds and have been approved by the US Food and Drug Administration (FDA) for curing various illnesses. The fact that the drug discovery from medicinal plants continues to attend to handle a source for new drug leads, and rise in the last years.
The deliberate targeting of natural products has been fruitful for developing new clinical drugs for a long time. In many studies [17,18,19,20,21,22,23], different natural products have been explored as the most important compounds for natural compounds drugs for developing and more data to come about the frameworks for new clinical trends and the challenge of recommending the new drugs from the medicinal plants. Additionally, the effectiveness of these candidates in a global pandemic with anti-coronavirus activity is proven. For example, in the article of Rivero-Segura et al. [24], they share the knowledge of the applicability of Mexican natural products against the SARS-CoV-2 virus in the frame of an in silico screening. The authors stated ten compounds that are perfect matches with a drug-likeness criterion. The specific pattern and understanding of the therapeutic effect of plant flavonoids have been well documented for decades [25,26,27,28]. Their main health benefits are related to comforting pain and inflammatory conditions and according to clinical research, these benefits are functions of the chemical structure of the flavonoid compounds (presence of three rings and specific position of the hydroxyl group −OH in one of the rings). It is worth noting that flavonoids are carefully studied with respect to possible antimicrobial, anti-inflammatory and anti-viral perspectives. There is evidence that worldwide more than 80% of the world population rely on medical plants as therapeutic prescriptions [18,19,20].
Since the group of the chemically identified flavonoids exceeds several thousand compounds and, additionally, the revived attention to them was triggered by the coronavirus pandemic appearance, any effort for specific partitioning or classification with respect to flavonoids is worth trying from any point of view (finding, for instance, discriminant pharmacophoric or molecular indices to reveal patterns of similarity between flavonoids and other medicinal plant remedies or between the different classes of flavonoids).
The same objectives are true for the largest group of natural compounds known as safe and effective therapeutic items—the terpenoids. Studies on mono-, di- and triterpenes indicate that these compounds possess flavonoid-like properties which could be of serious support to the solution of the problems of curing not only cancer problems but also the covid virus infection symptoms. Again, all attempts to find proper partitioning by the use of suitable descriptors between different medical plants are notable.
The opportunities offered by chemometric and machine learning procedures make it possible to solve many of the problems of reliable, simple and effective partitioning of the medical plants with respect to their specific fingerprint descriptors (related either to their medical effects and drugability, drug-likeness or to structural specificity). It is the aim of the present study to offer a simple option for such partitioning.
To facilitate the discovery process and to overcome the issues in the process of novel drug development, the rational methods in the drug design in combination with the plethora of all the in silico methods represent a pivotal role. The discovery and screening of the natural drugs with the potential of a new perspective treating agents is the intention in the present study. It combines some chemometric methods (multivariate statistics) for partitioning a group (135 natural compounds) of natural compounds by the use of descriptors related to pharmacophores and drug-likeness indications. It makes it possible to design and facilitate an accountable partitioning network for the next level of treating and exploring the data. If a suitable partitioning with respect to the different chemical classes could be achieved, then a next step might be performed allowing a more specific separation of some natural compounds using available descriptors. Finally, the specific partitioning could be used for the prediction of important properties of the natural compounds studied.
2. Materials and Methods
2.1. Natural Molecules Dataset
A pool of 135 natural compounds divided is used for the partitioning procedure (Supporting Information Figure S1. For the aims of the partitioning procedure, the sets of descriptors (i.e., drug-like indices, molecular properties and pharmacophore descriptors) were calculated by the AlvaDesc v.2 software (Milano, Italy) (https://www.alvascience.com/alvadesc/, access on 15 October 2020) [29]. All obtained descriptor values (after variable reduction procedure using principal components analysis) were included in the next step of the partitioning with two sets of variables: 45 for the first run (all described in Table 1) and 17 for the second one (all CATS2D, all SHED, all TPSA, all MLOGP and Ro5 and cRo5). In Table 1 the whole list with the used molecular descriptors for this study was presented. The pool of molecular descriptors was extended with a Pharmacophore descriptor block, which includes two different types of descriptors: CATS2D descriptors and SHED descriptors. A novel set of molecular descriptors called SHED (Shannon Entropy Descriptors) is presented in [30]. SHED are derived from the distributions of potential pharmacophore points (PPP) in the molecular structure, then the Shannon entropy is applied to quantify the variability in a feature-pair distribution.
The CATS 2D (Chemically Advanced Template Search) descriptors are a particular case of autocorrelation descriptors, where the atom-type definition is related to the concept of potential pharmacophore points (PPP). CATS2D descriptors have been widely used for similarity search [31].
Both CATS2D and SHED descriptors were used for clustering along with drug-like indices (Table 1) for clustering performed separately with 47 and with 17 variables. The effect of additional partitioning within the obtained similarity groups on descriptor bases checks the possible differences in clustering patterns if different sets of descriptors are used. We obtained the same groups of similarity for both sets of descriptors The evaluation of which combinations or symmetry effects are the best gives the maximum covariant between the related objects/features.
2.2. Multivariate Statistical Methods
The multivariate statistical methods used are frequently used in chemometrics: cluster analysis, namely hierarchical and nonhierarchical (K-means) clustering. The hierarchical mode of clustering studies the data for the existence of groups of similarity (clusters) between the objects (natural compounds) or between the variables (descriptors). This method is using an unsupervised pattern recognition algorithm (the patterns of similarity are formed spontaneously by calculating similarity distances and linkage options to identify the clusters). It is important to mention that the initial data are normalized in order to avoid the impact of data dimensionality on the clustering procedure. Usually, the representation of the clusters obtained is on a planar plot called dendrogram. The statistical significance of the clusters formed depends on a preliminary chosen cut-off distance and it makes the interpretation of the clusters dependent to some extent on the selection of the cut-off. In the present study, the goal of the hierarchical clustering was to identify patterns of similarity between the natural compounds (objects). Similarity patterns between variables (descriptors) are not the subject of this study.
K-means clustering method is representative of the supervised pattern recognition methods. The main characteristic of this approach is that the cluster formation is not spontaneous but predetermined according to some preliminary hypotheses. This hypothesis corresponds to theoretical or experimental evidence and very often is related to the validation of preliminary obtained results (e.g., hierarchical clustering). The algorithm is based on calculation distances between each object and preliminarily formed group centroids.
The combination of descriptors based on pharmacokinetic and physicochemical properties of compounds in measured or judged drug-likeness arises in the initial phases of assignment of the drug discovery. Physicochemical properties which are the pillar in the assessment of the drug-likeness are the features such as molecular mass, polarity (polar surface area (PSA) and (TPSA) topical surface area), number of aromatic rings, number of heavy atoms, logP, logS, number of hydrogen bond donors and acceptors, and number of rotatable bonds. The plethora of all these properties is remarkable and allows blind scanning for completely new drug candidates. Our concepts about the partitioning was based on these molecular primer labels properties for predicting drug-likeness. In the obtained dataset with the descriptors, the Lipinski’s rule of five for the prediction of drug-likeness within the data was as well tracked beside the ability of obtained partitioning pattern.
We can briefly write down the main points in Lipinski’s rule of five: molecular weight not than 500 Da, logP up to 5, hydrogen-bond donor not more than 5 and hydrogen bond acceptor up to 10.
3. Results and Discussion
Hierarchical Cluster Analysis
Hierarchical Cluster Analysis
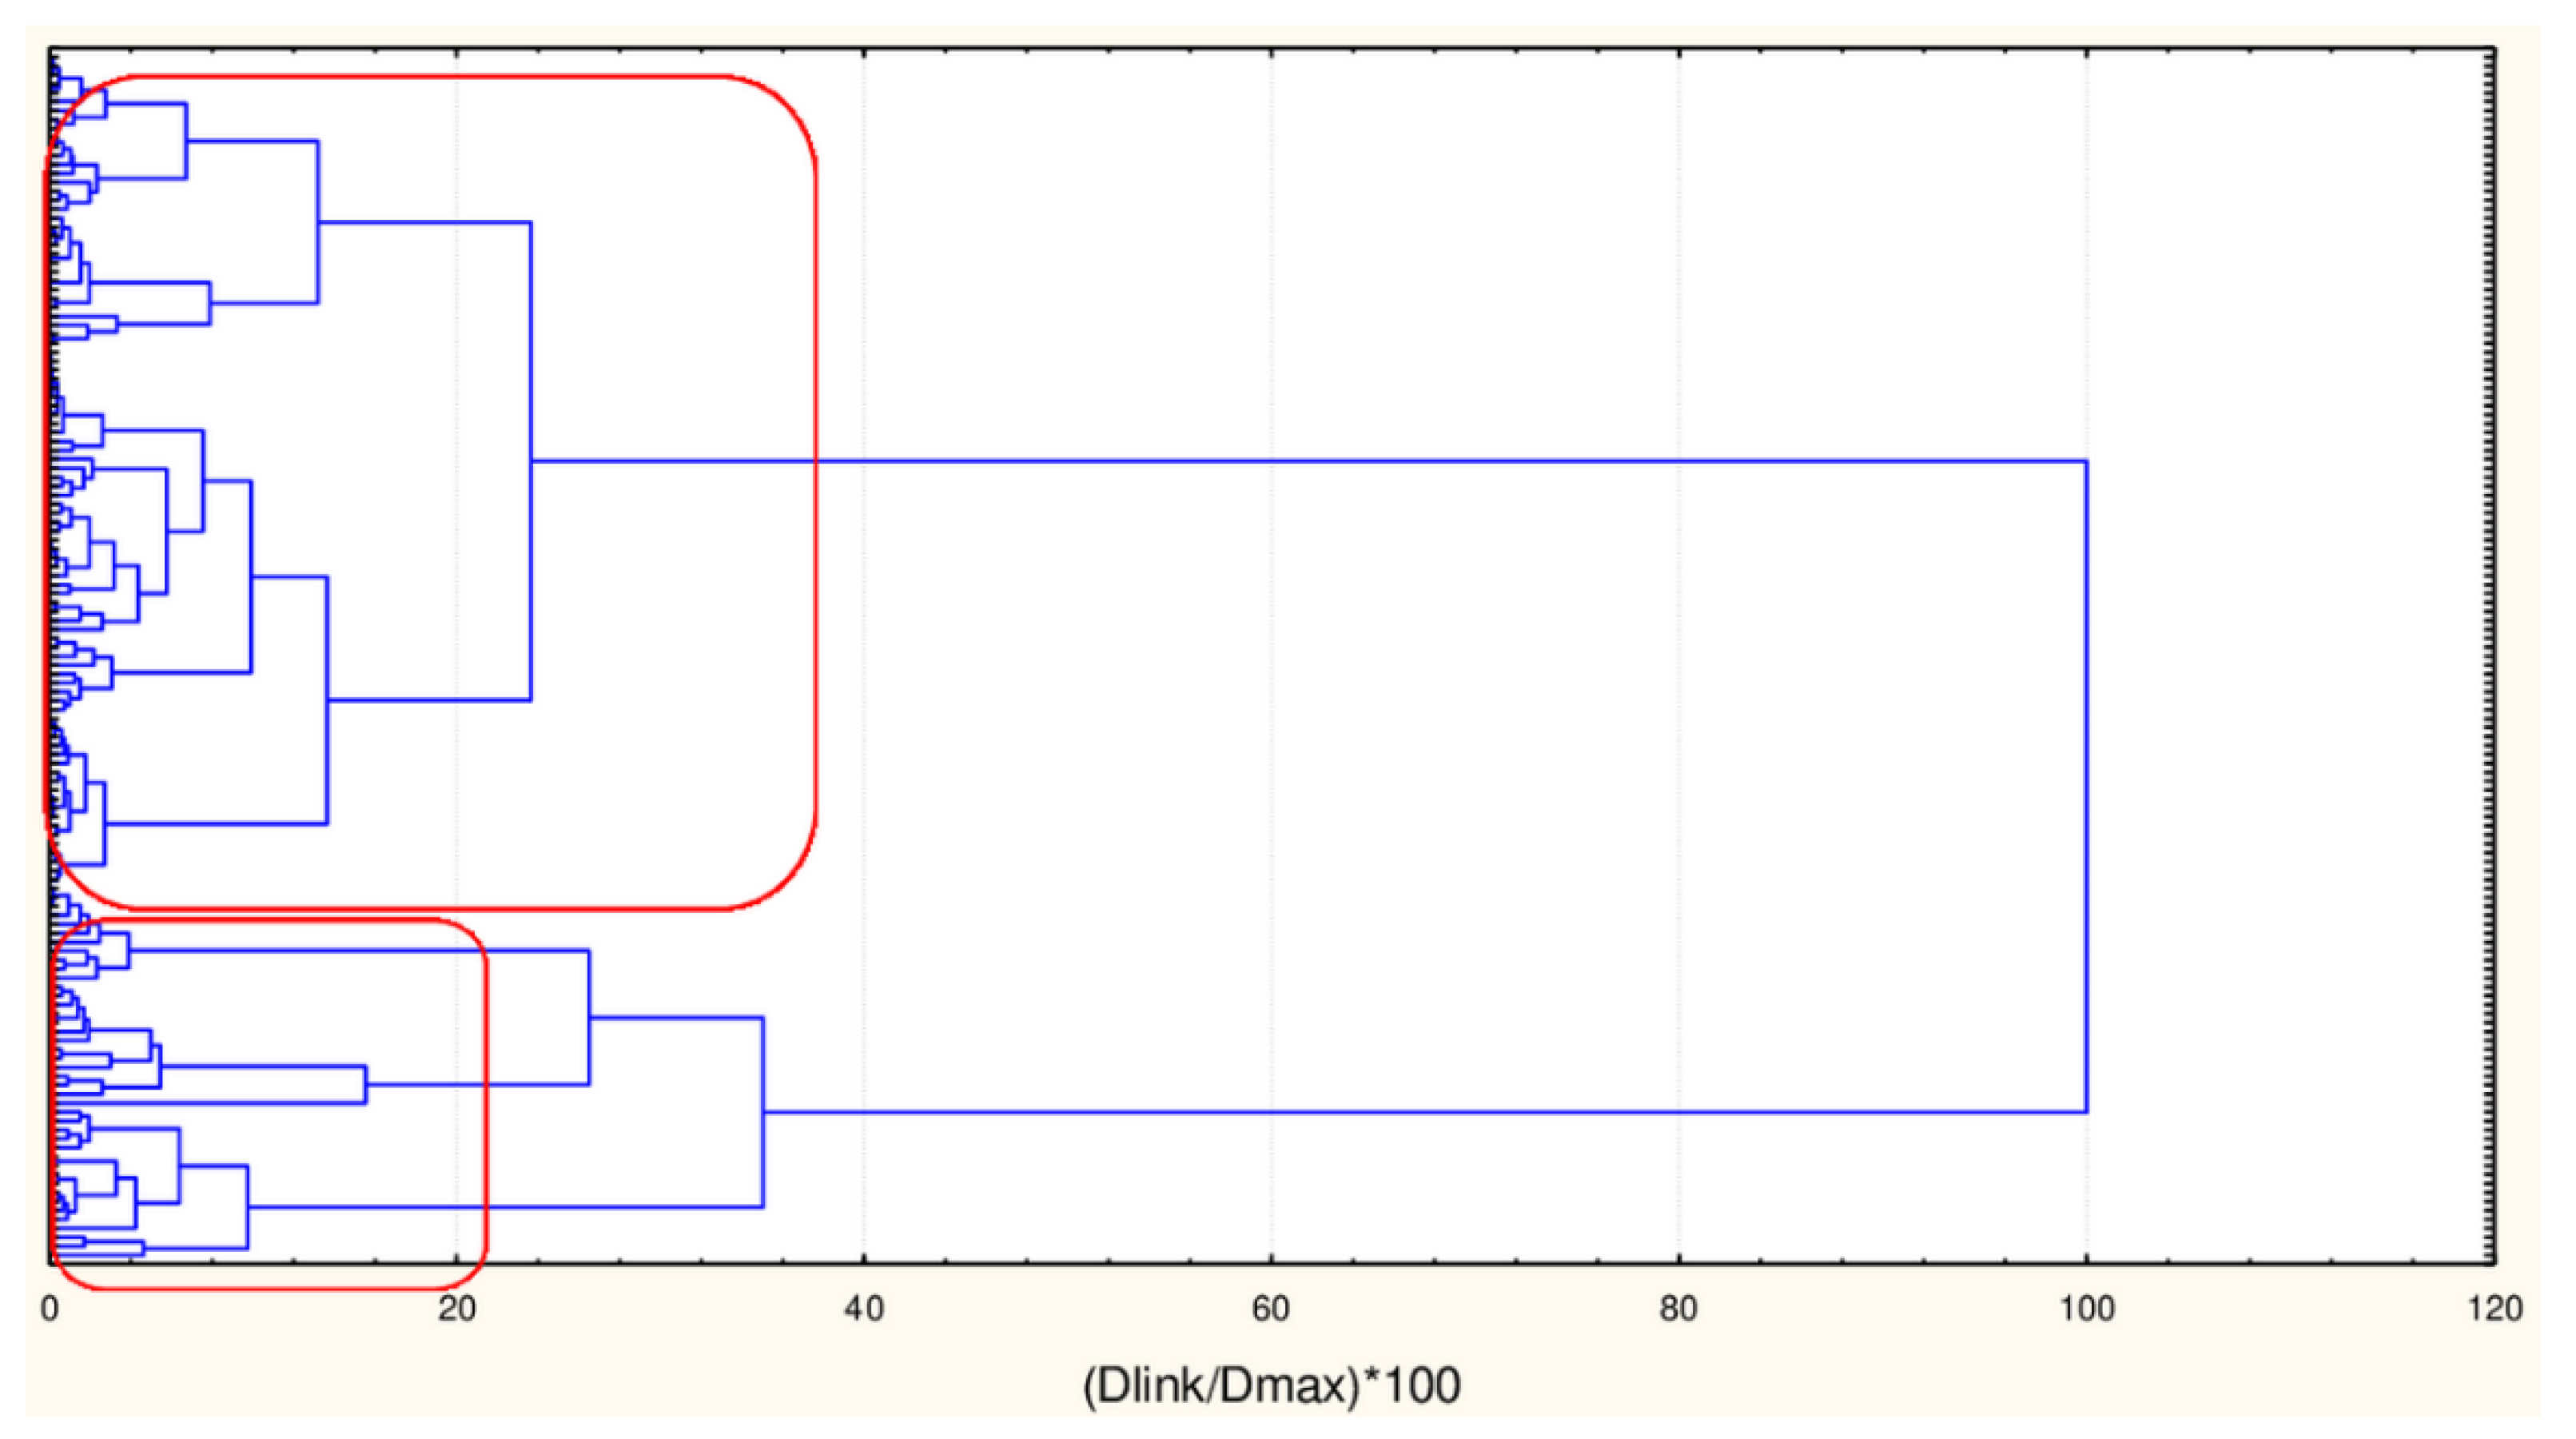
As already mentioned, the chemometric analysis was initially performed on two dataset matrices having dimensions [135 × 45] and [135 × 17]. In both cases, two major clusters of natural compounds were identified. The members belonging to each cluster are one and the same for both modes of matrices. Below the hierarchical dendrogram is presented as well as the members of each cluster as confirmed by K-means clustering (Figure 1, Figure 2 and Figure 3).
Next, Table 2 summarized the distribution of contribution of each descriptor (simply by assigned as “high” and “low” levels of the descriptors for the partitioning (with respect to “0”). In the Supplementary Information, the complete list of all members according to the distance between objects in the clusters driving the separation pattern inside the formed groups for both clusters are listed (Supplementary Information—Tables S1 and S2).
In Table 3, the partitioning of the natural compounds into both identified cluster is summarized. The chemical structures of the a135 natural molecules are presented in the Supplementary Information.
The partitioning reveals the following separation:
Small cluster (41 members) for both 45 and 17 descriptors:
- Flavonoids—41.4 %
- Triterpens—26.8%
- Saponins—21.2%
- Alkaloids—7.3%
- Tanin—2.4%
Therefore, the small cluster consists mainly (90%) of three classes of natural compounds: flavonoids, triterpenes and saponins and isolated presence of alkaloids and tannic acid.
Big cluster (94 members) for both 45 and 17 descriptors:
- Flavonoides—26.3%
- Sesquiterpenes—15.1%
- Monoterpenes—13.8%
- Curcuminoides—4.2%
- Alkaloids—2.0%
- Xanton—single case
- With—single case
- Chalkones—single case
- Diterpenes—single case
- Anthr—single case
- Stilben—single case
- Isoflavones—single case
- Lecitin—single case
- Vinil chlo—single case
- Leicyclo—single case
- Alkohol-ester—single case
- Pen acid—single case
- Prenolip—single case
The big cluster has many more members and a variety of ligand classes. However, over 50% of all objects are flavonoids, monoterpenes and sesquiterpenes, a few percent for alkaloids and curcuminoides and single cases of many other natural compounds like esters, lecithin, etc.
The general conclusion in this simple but effective partitioning procedure is that both groups of descriptors act very similarly and achieve partitioning for the natural compounds except for the class of flavonoids which is distributed between both clusters. Thus, if most of the natural compounds included in the study-specific descriptors could be found on the basis of their values, the big group of very important compounds as that of flavonoids is not entirely partitioned.
In the next step of the study, an effort is made to assess by chemometric procedure the option for partitioning the flavonoids. For this purpose, only the group of flavonoids was subject to partitioning. The procedure includes cluster analysis of all flavonoids, the flavonoids in the big cluster only and flavonoids in the small cluster only. Both sets of descriptors (45 and 17) were used.
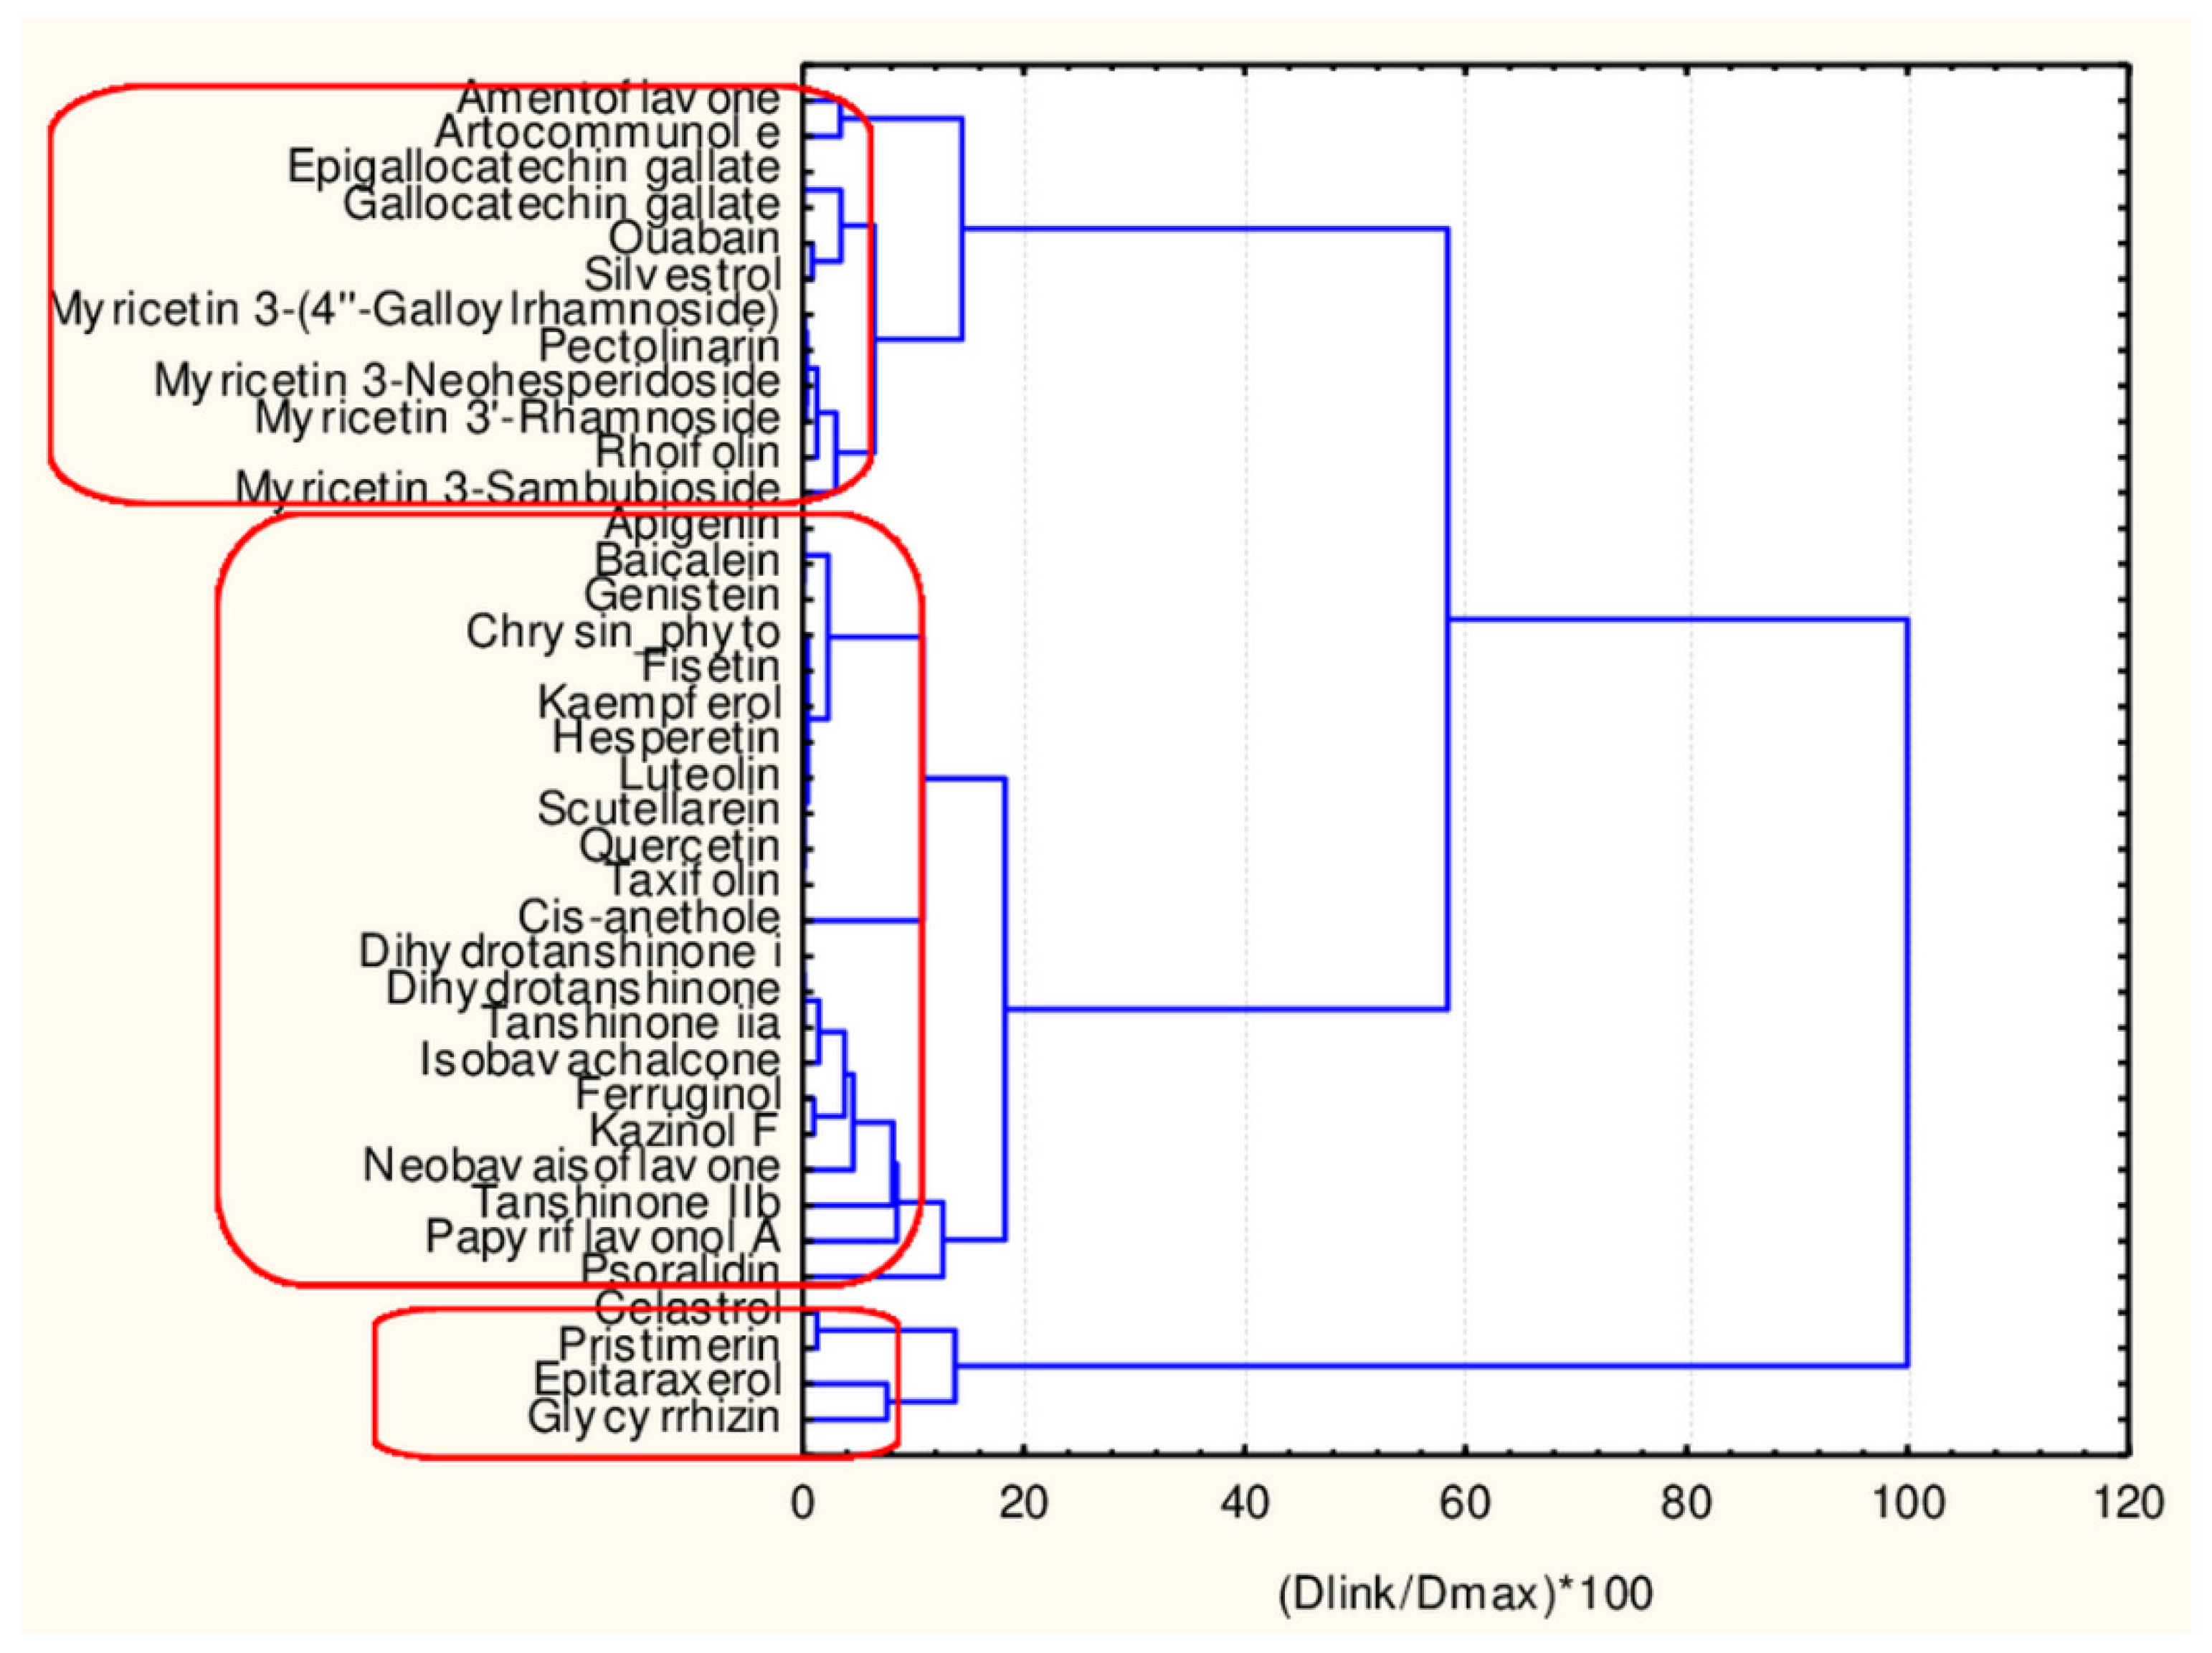
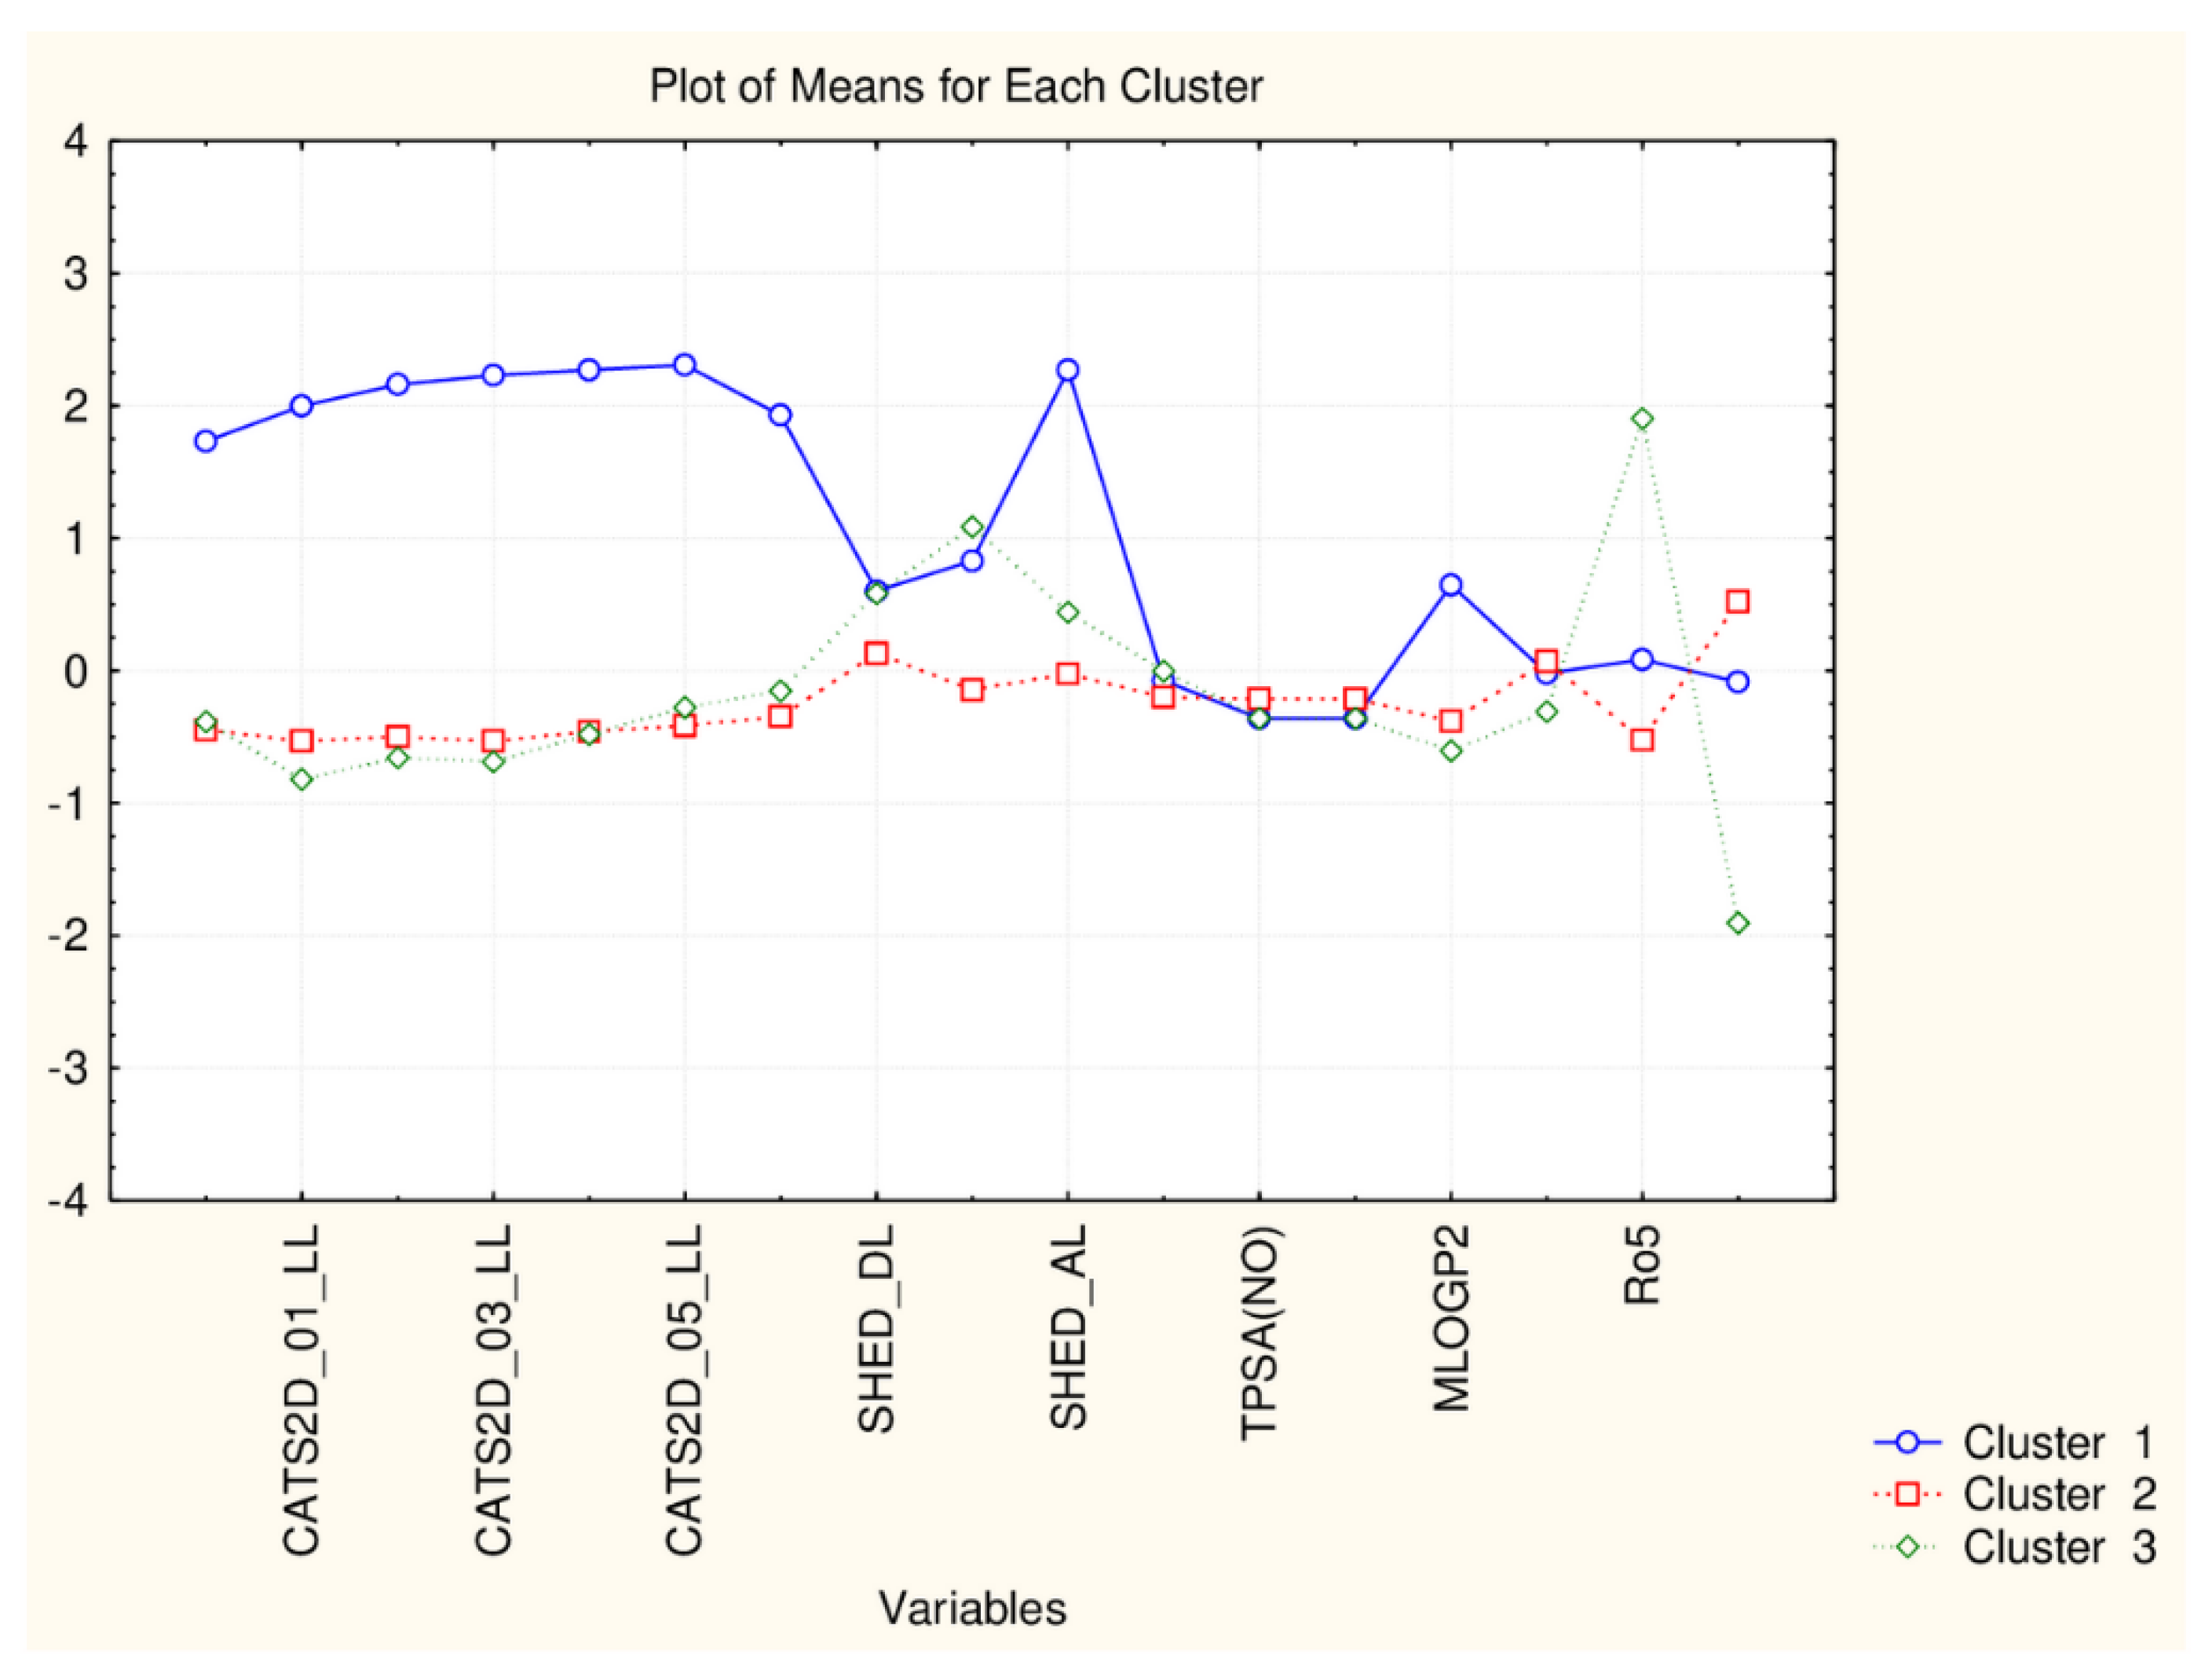
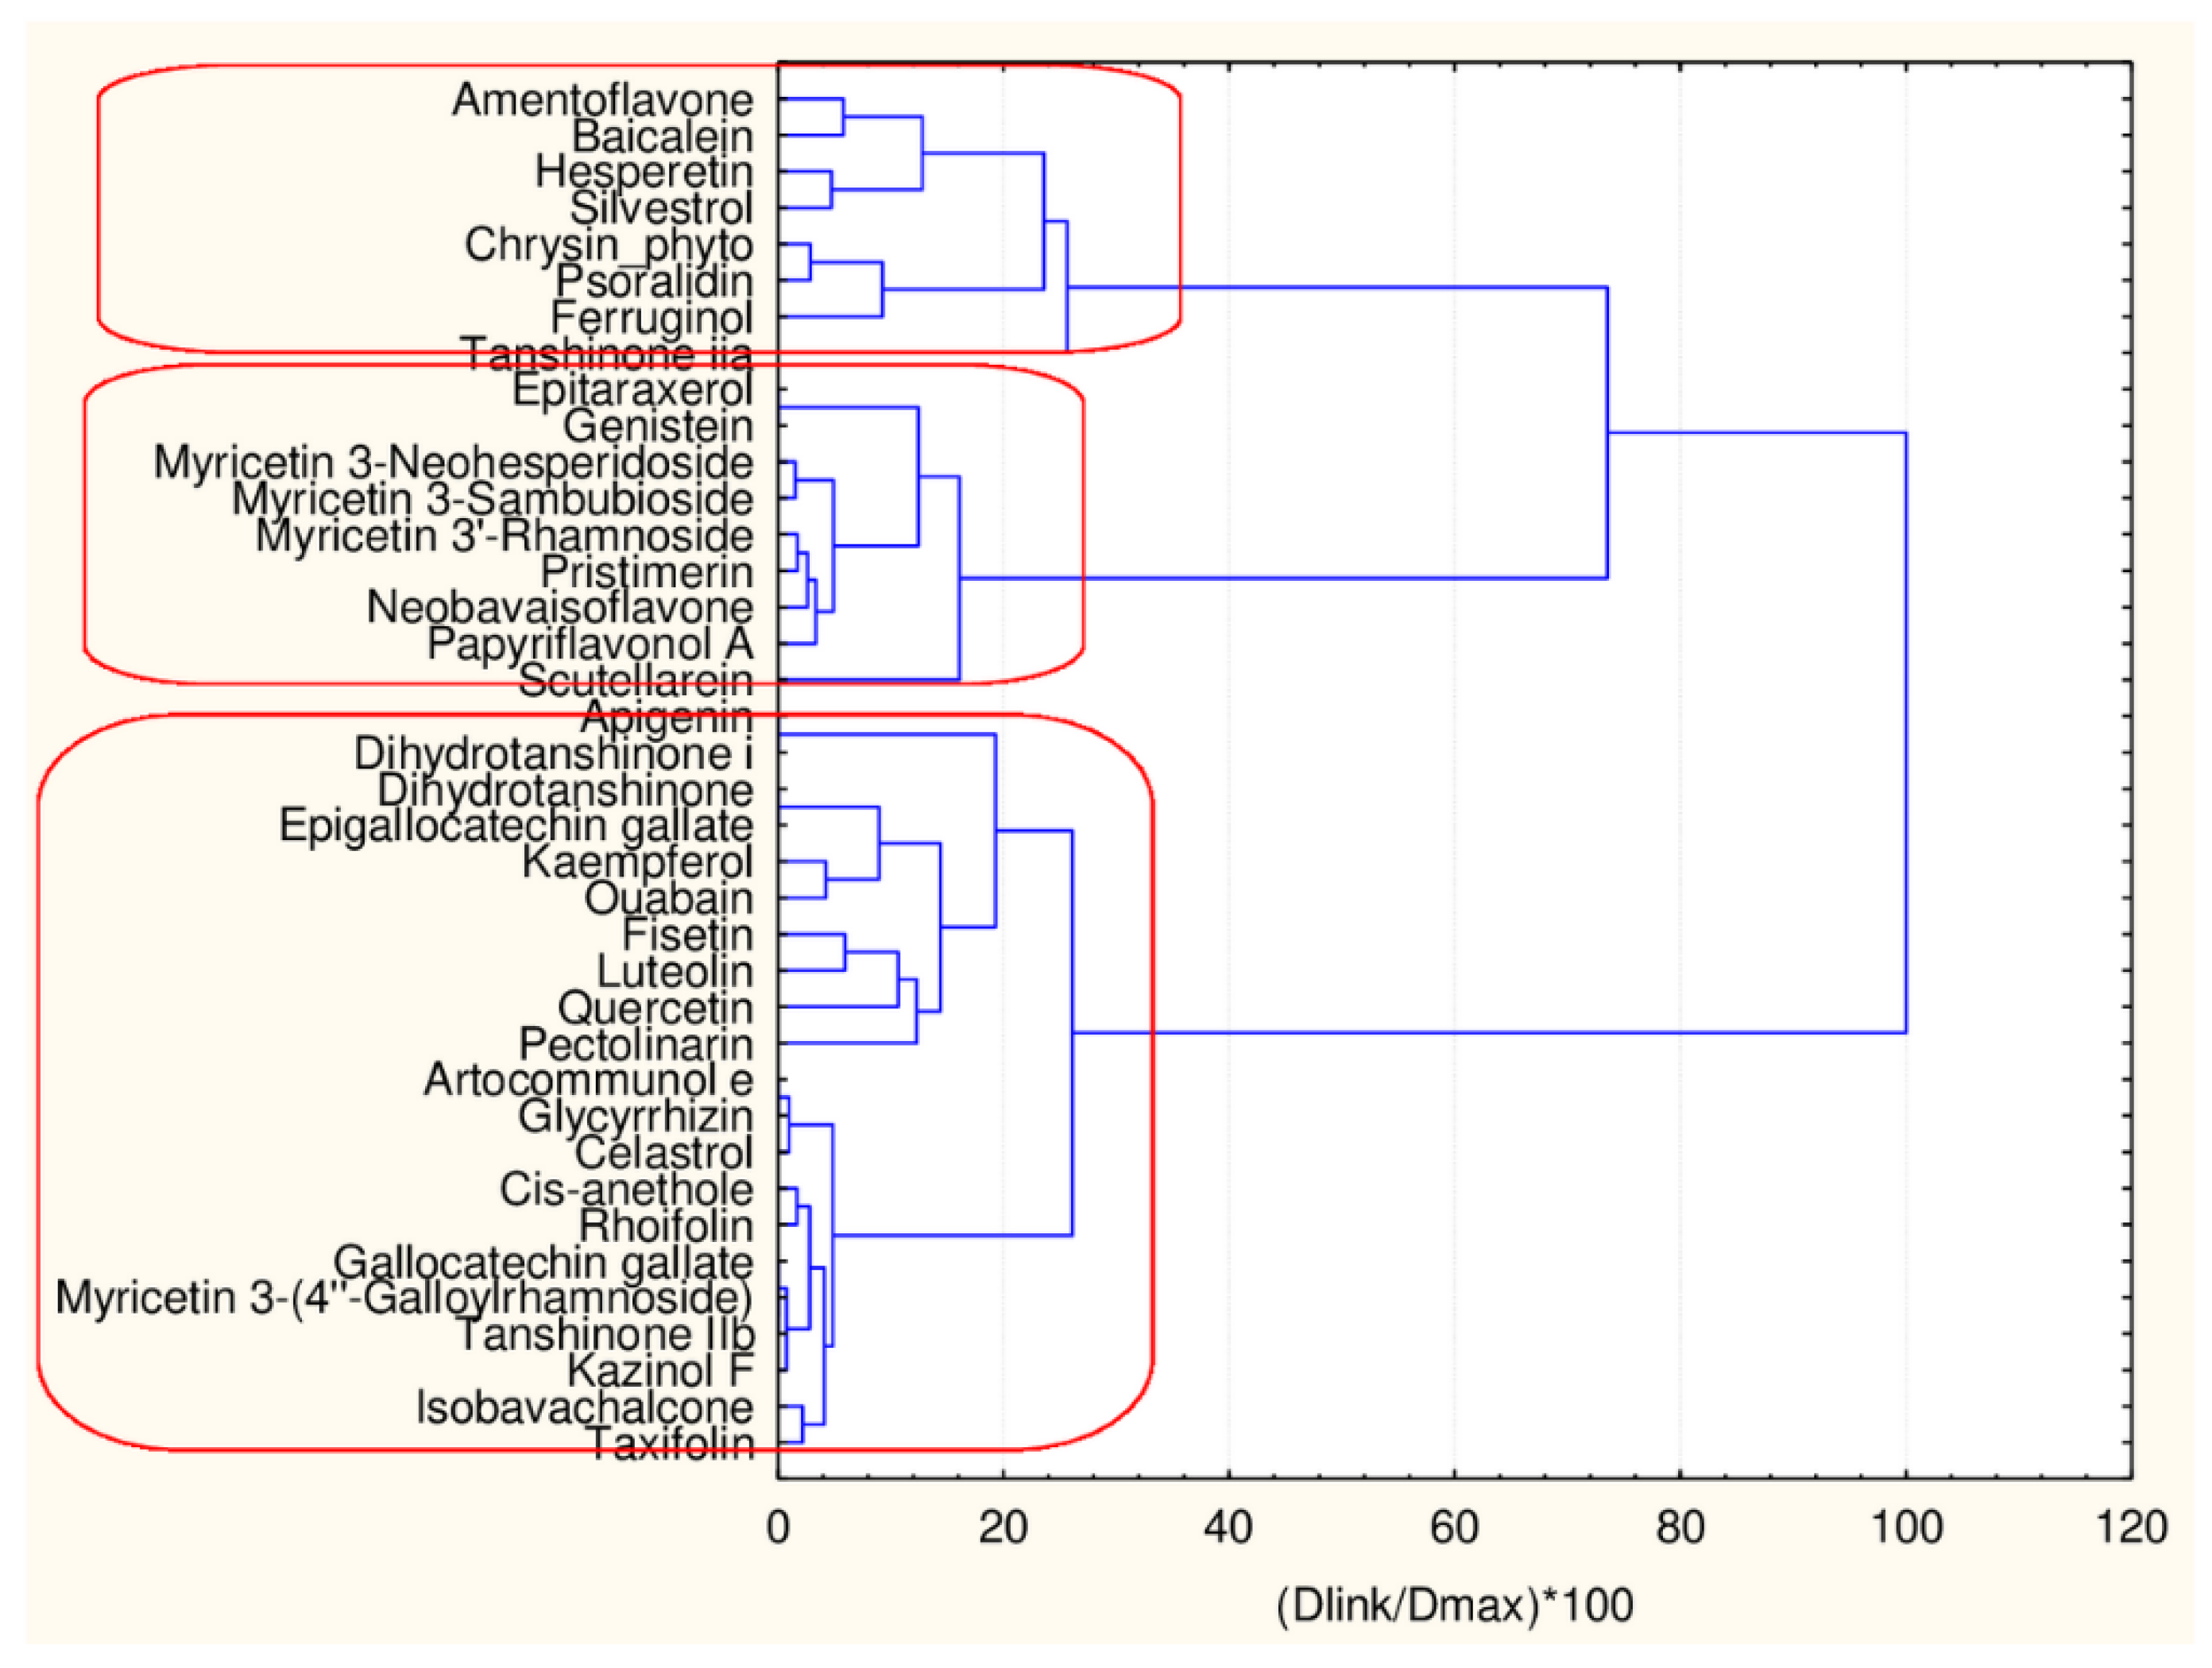
In Figure 4, the hierarchical dendrogram for clustering of all flavonoids (38 objects) by 17 descriptors is presented.
Three clusters (Sneath’s cluster significance test—1/3Dmax) could be identified based on the upper clustering:
C1—the smallest cluster consists of four members which are part of the flavonoid natural compounds included in the small cluster from the overall partitioning procedure. The rest of the flavonoids of the small cluster are included in C3 (another 12 members). The biggest cluster C2 (22 members) corresponds entirely to the flavonoid class members included in the big cluster result of the overall partitioning procedure.
The present plot (Figure 5) illustrates the relationship between the descriptors and the clusters formed. The four members of C1 (celastrol, epitaraxerol, glycyrrhizin and pristemerin) form a specific subgroup of flavonoids which differ significantly from all other flavonoids (highest levels for all CATS2D and Shed descriptors as well as for MLOGP2 descriptor). The other two patterns of flavonoids are very similar with respect to almost all descriptor values except for Ro5 (high for C3) and cRo5 values (high for C2).
If to the same group of flavonoids 45 descriptors are used for partitioning, one gets the following separation (Figure 6).
The use of molecular properties descriptors causes another partitioning scheme, again, three clusters are identified but the members of each cluster are mixed (with respect to the partitioning achieved with all classes of natural compounds). It could be said that C1 is the biggest cluster (dominantly flavonoid members of the big cluster of the overall partitioning of 135 objects), C2 and C3 are the intermediate and the smallest cluster (dominantly flavonoid members of the small cluster of the overall partitioning of 135 objects). (Figure 7).
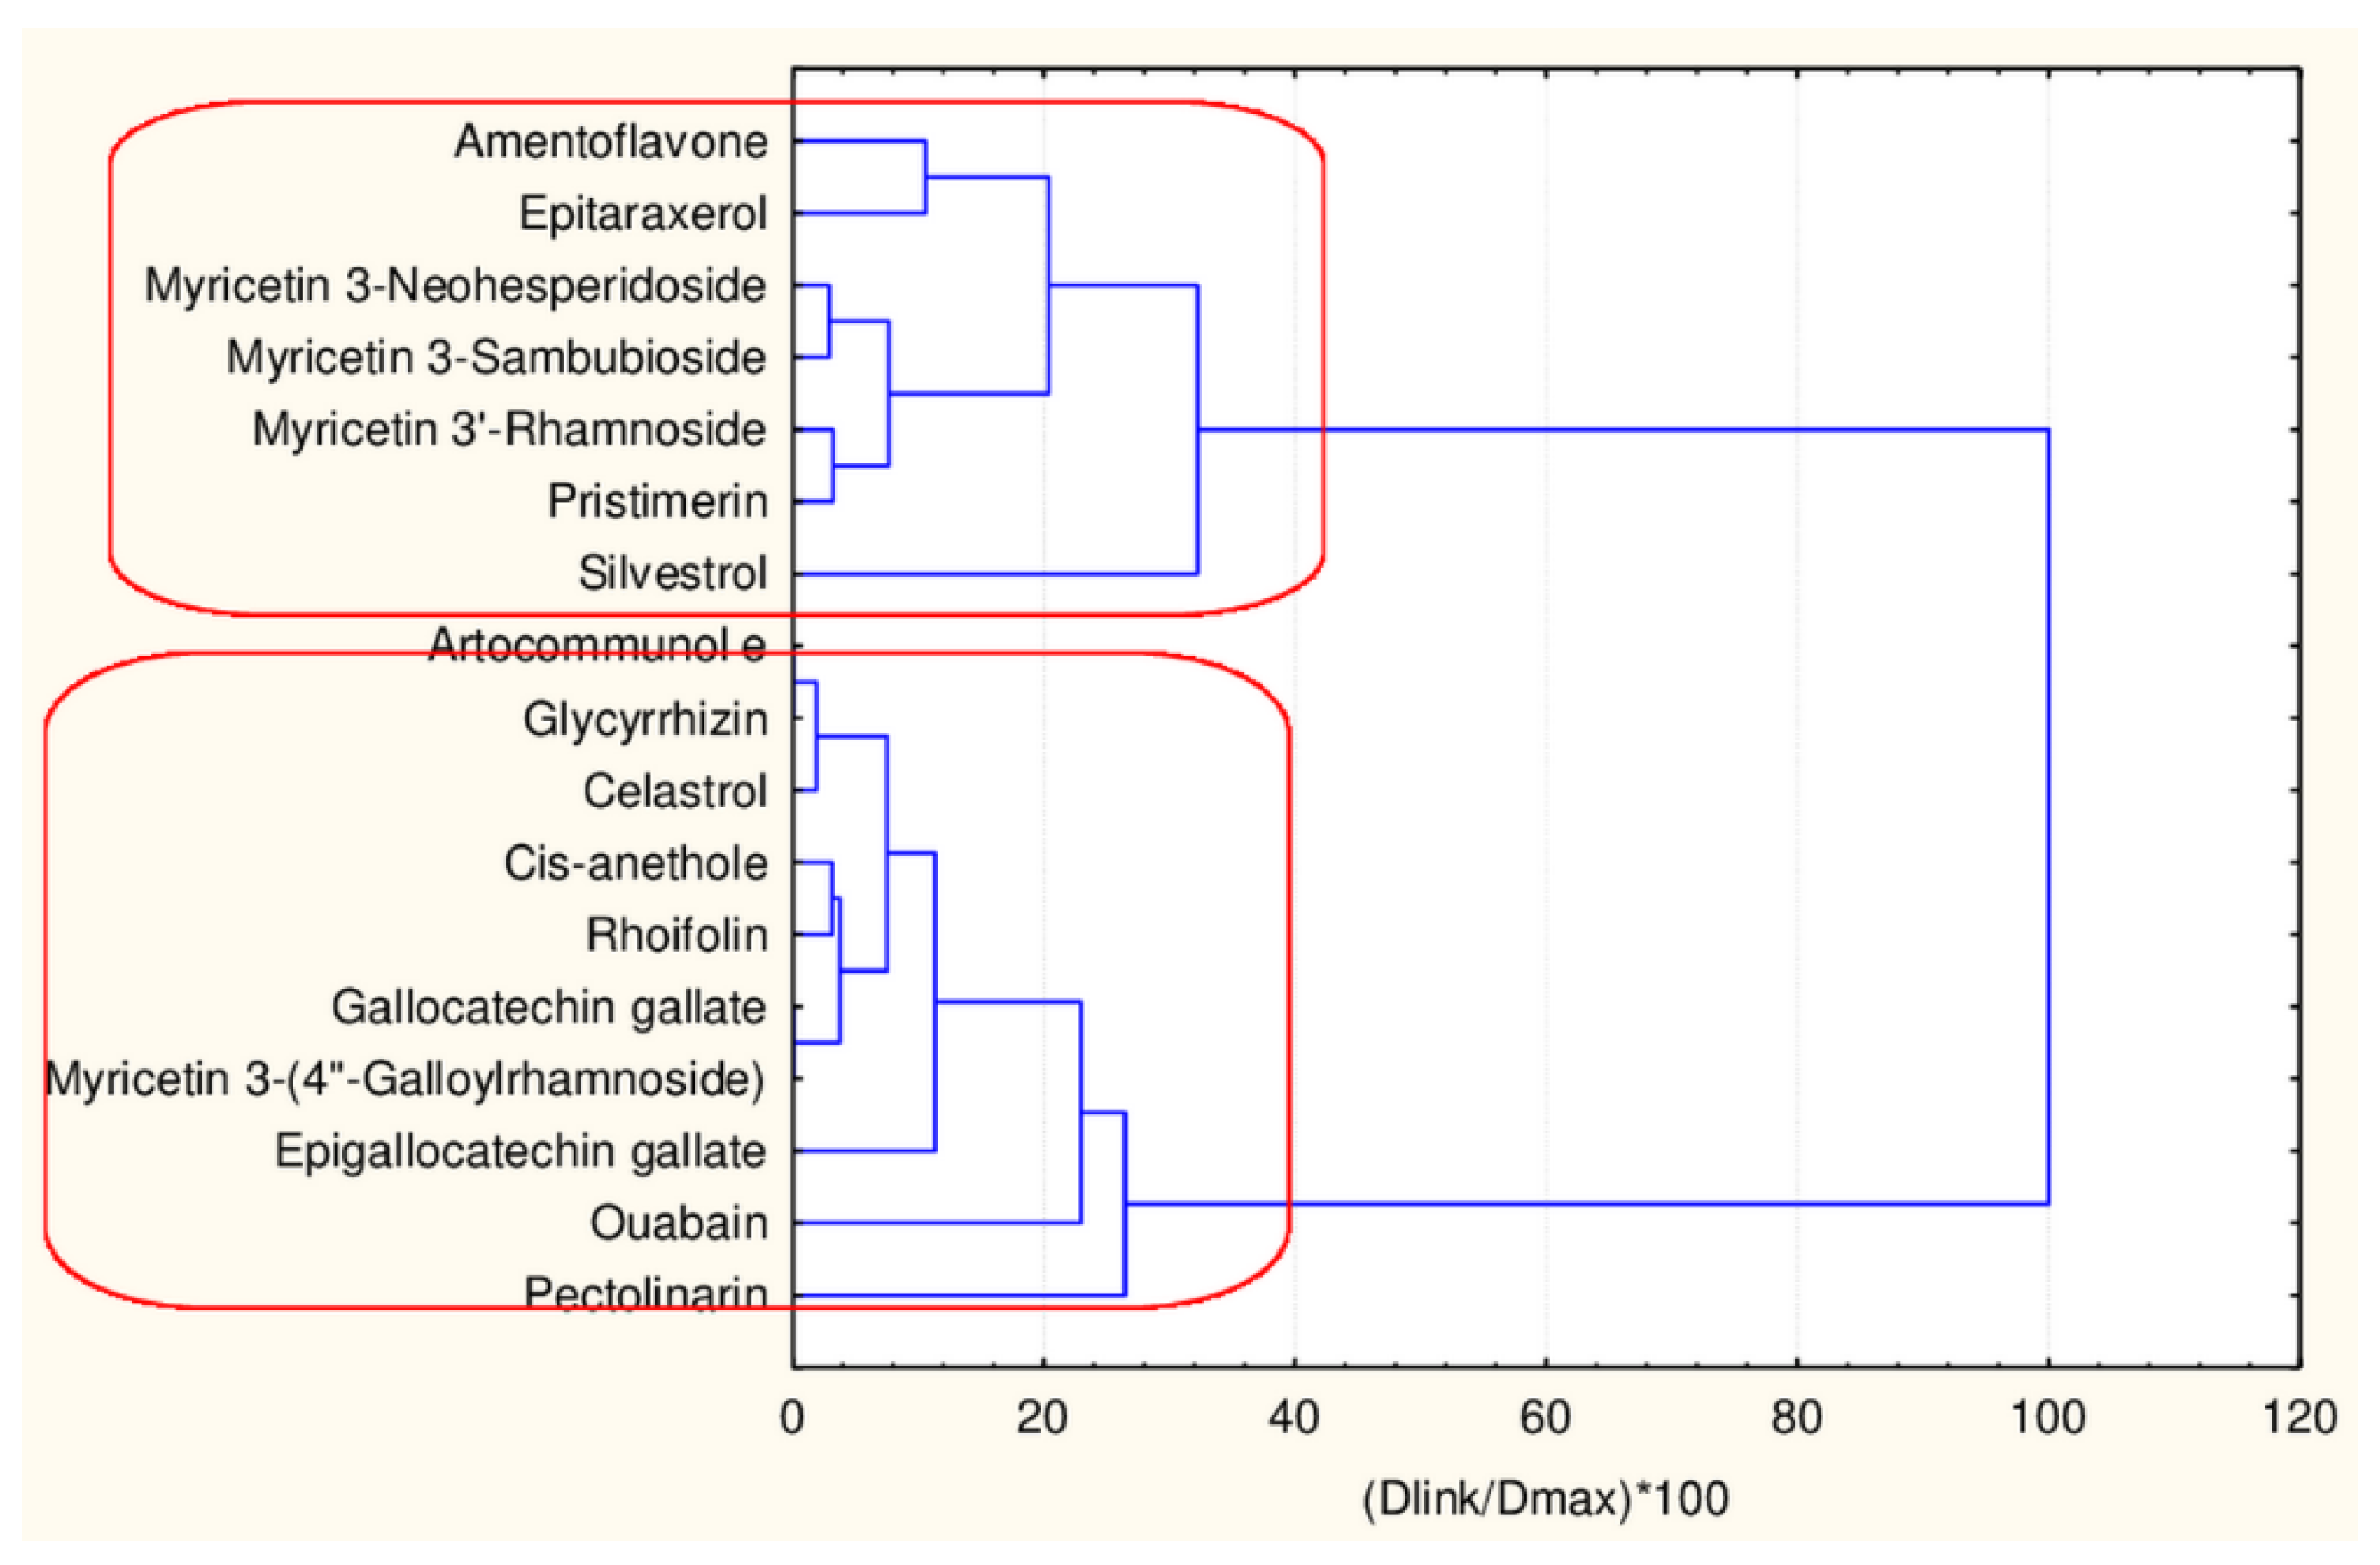
In the next step of the partitioning scheme, an effort was made to understand if the two separate clusters of flavonoids (big one and small) could be additionally partitioned to deliver more specific information. Both groups were partitioned with 45 and 17 descriptors.
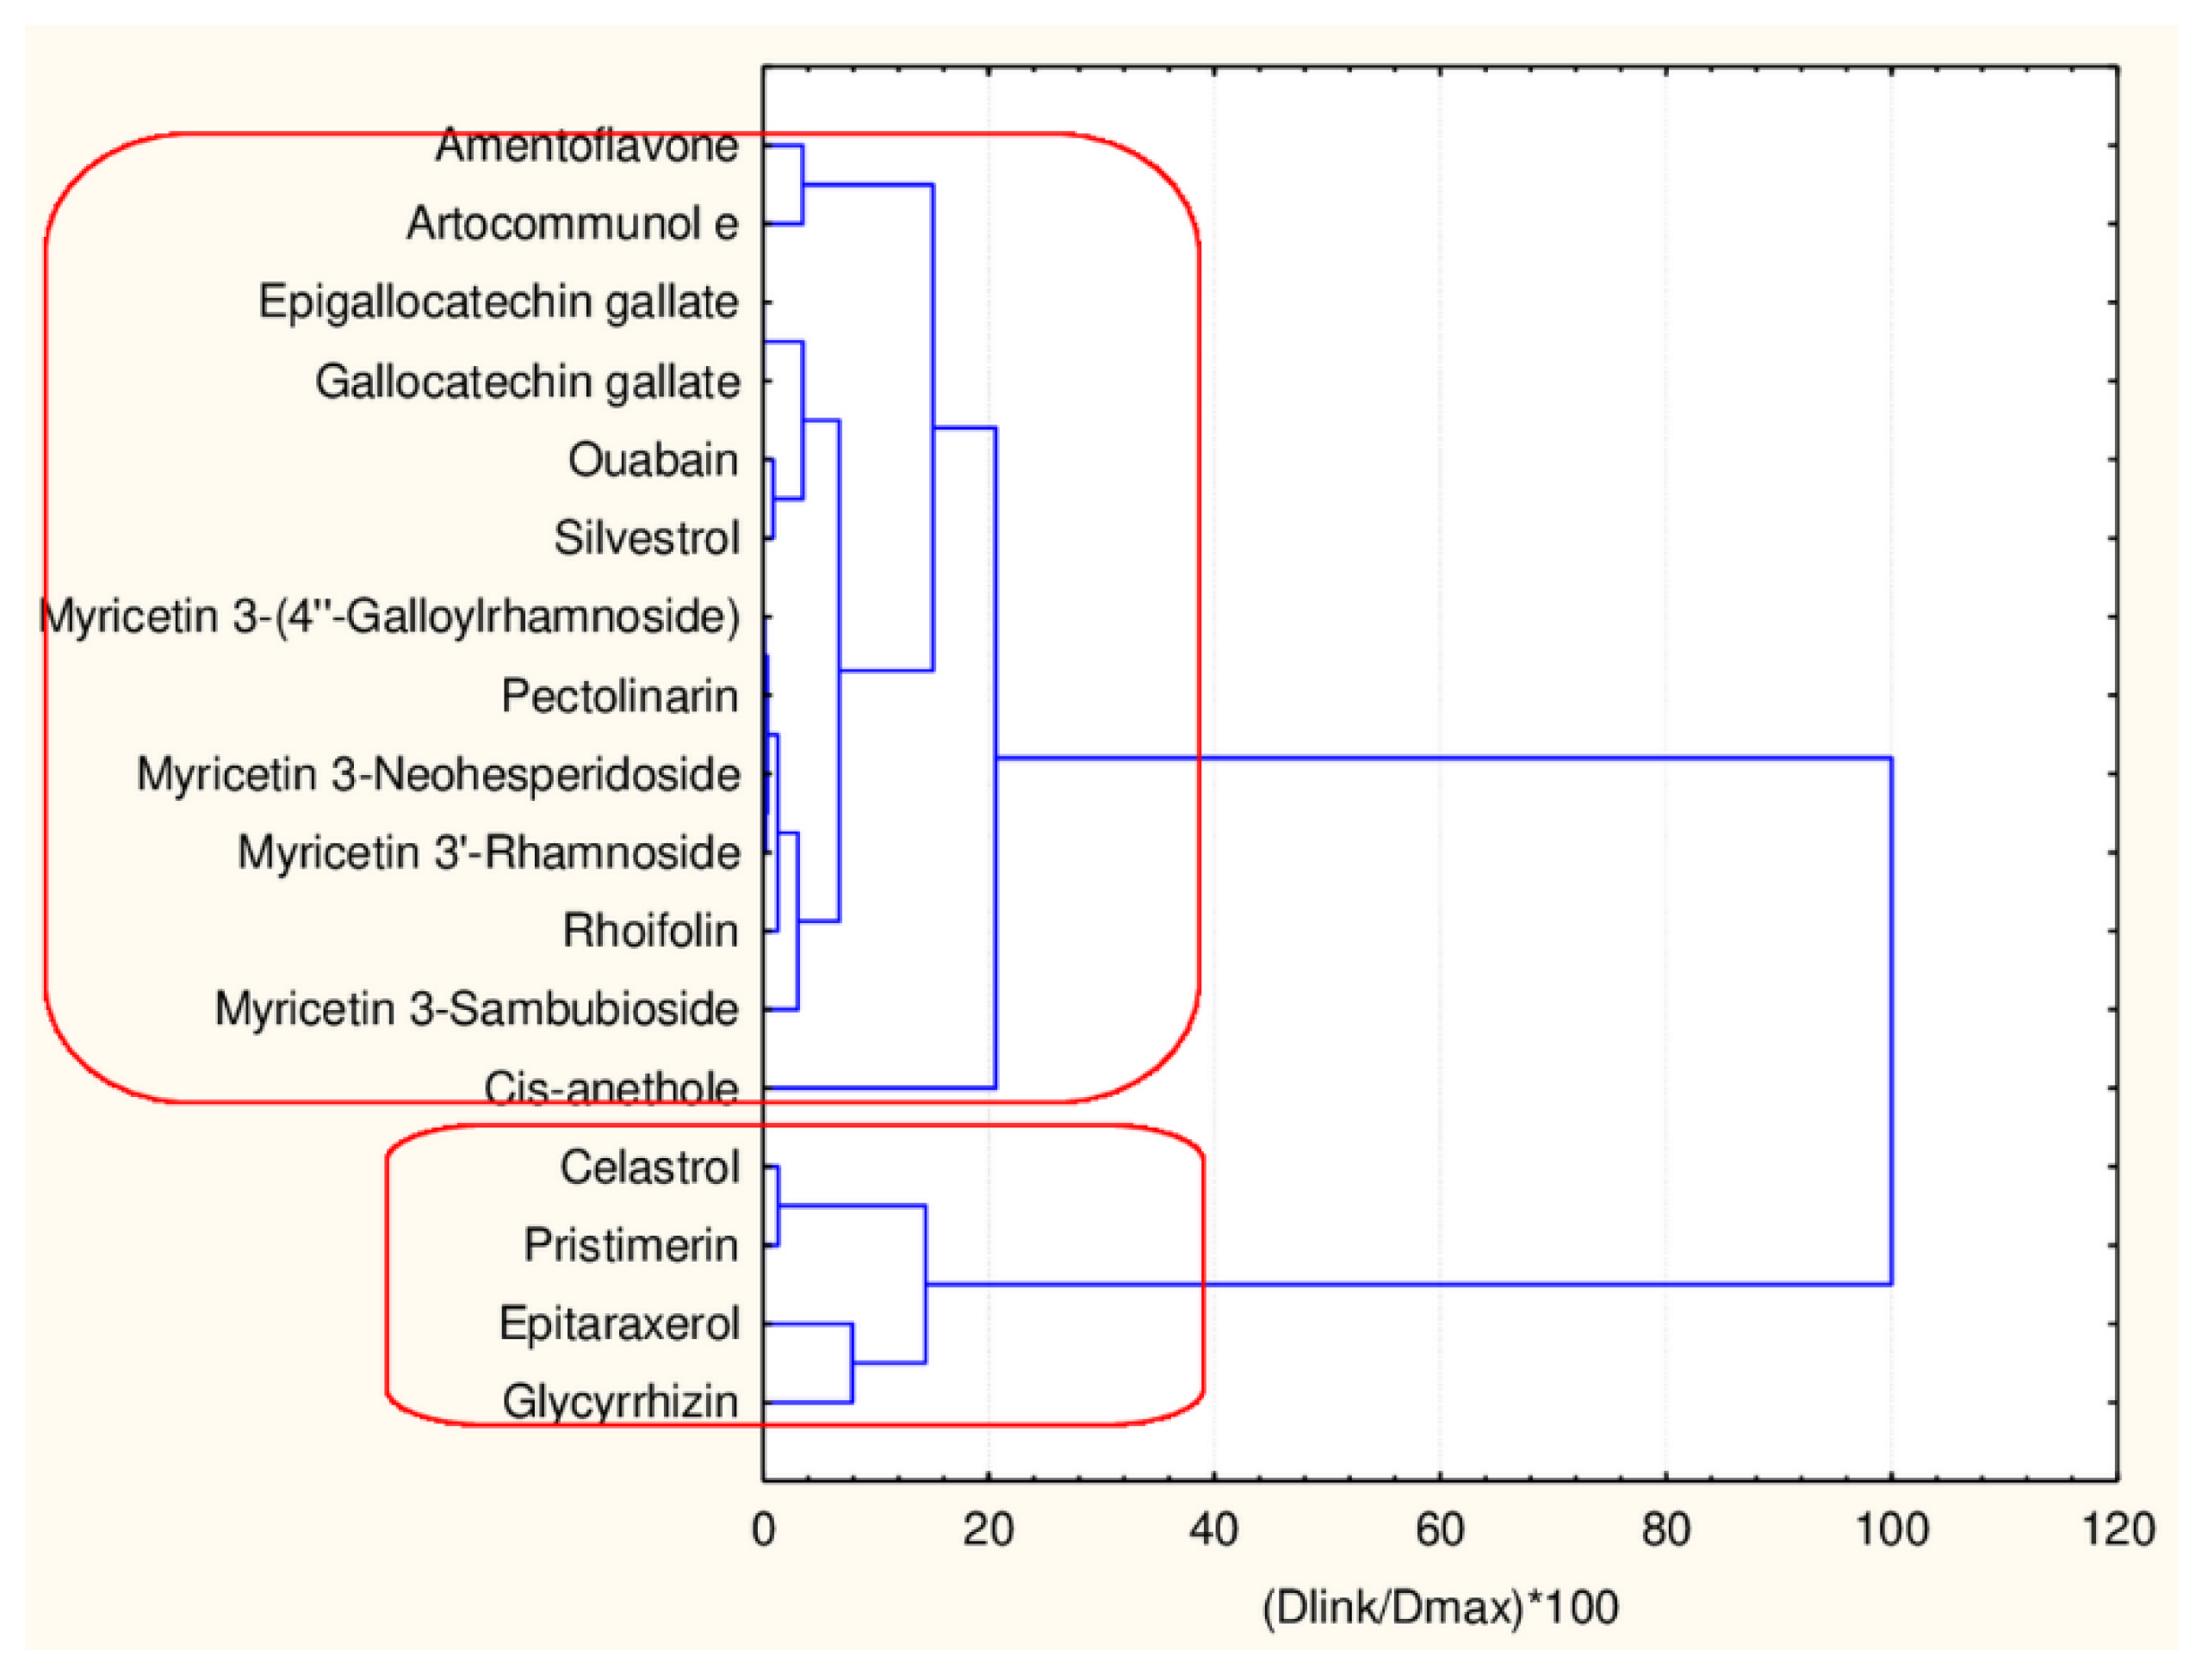
The results of this clustering (Figure 8) indicate the formation of two clusters that are well separated.
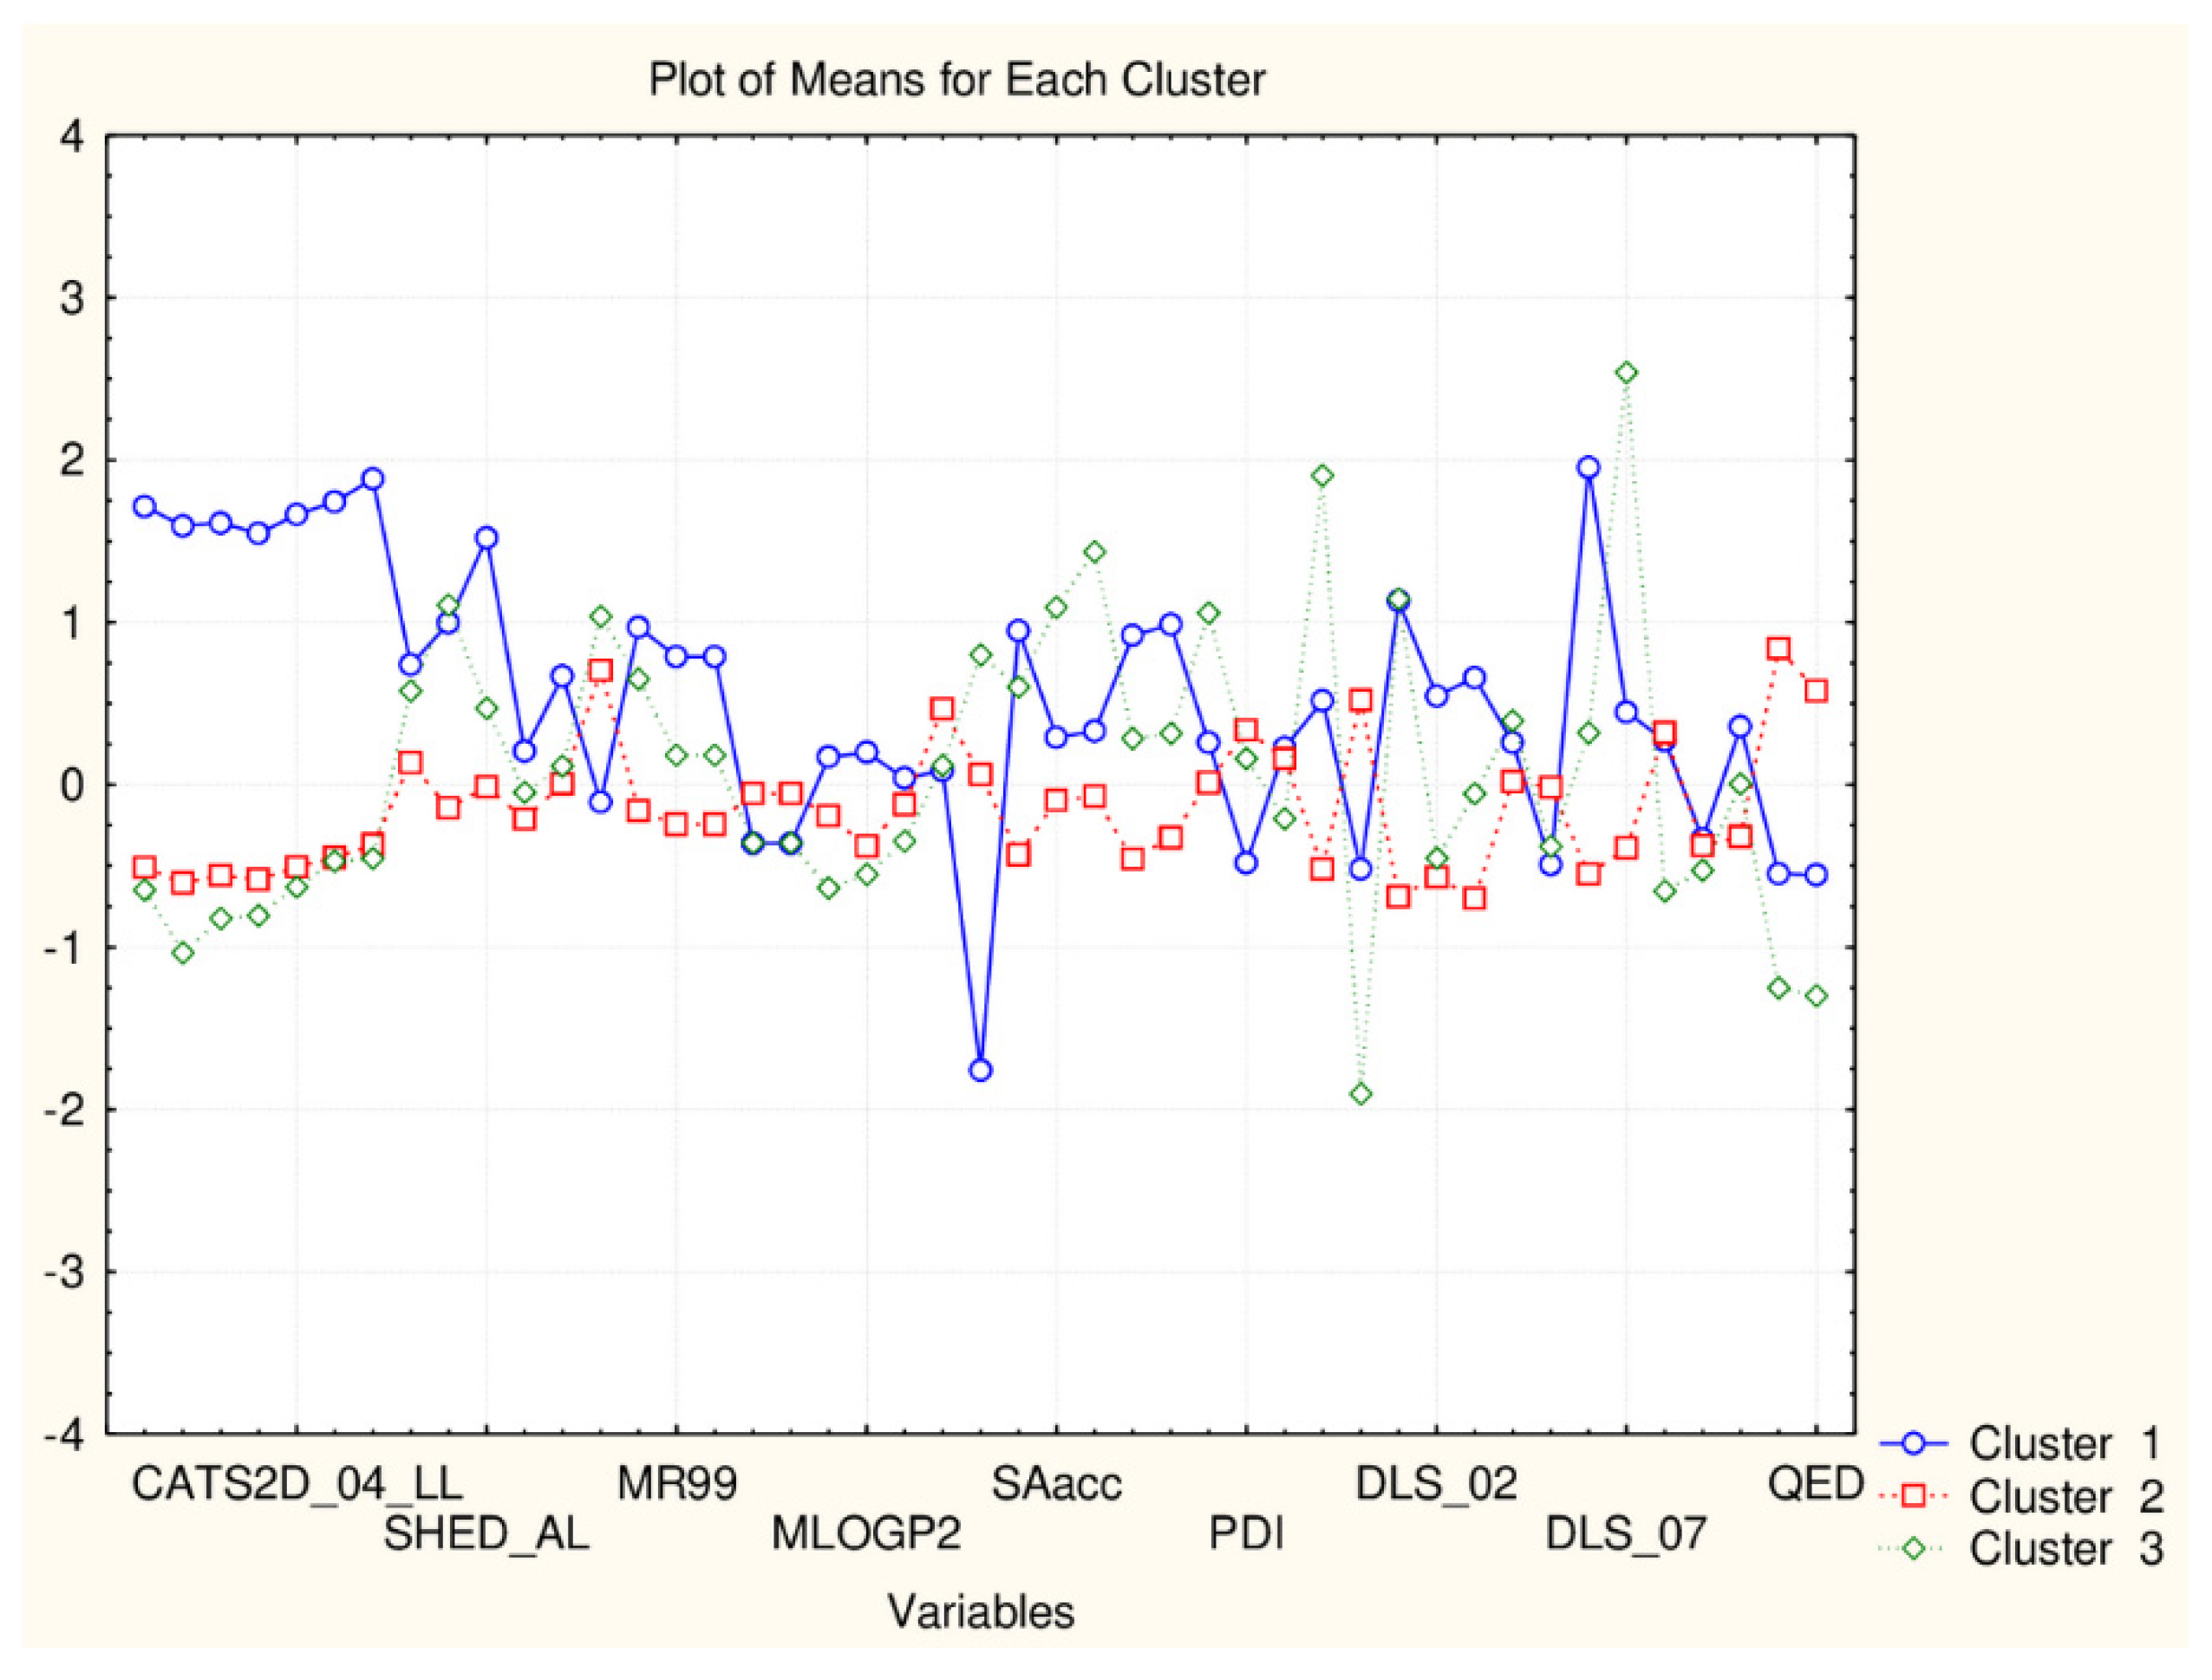
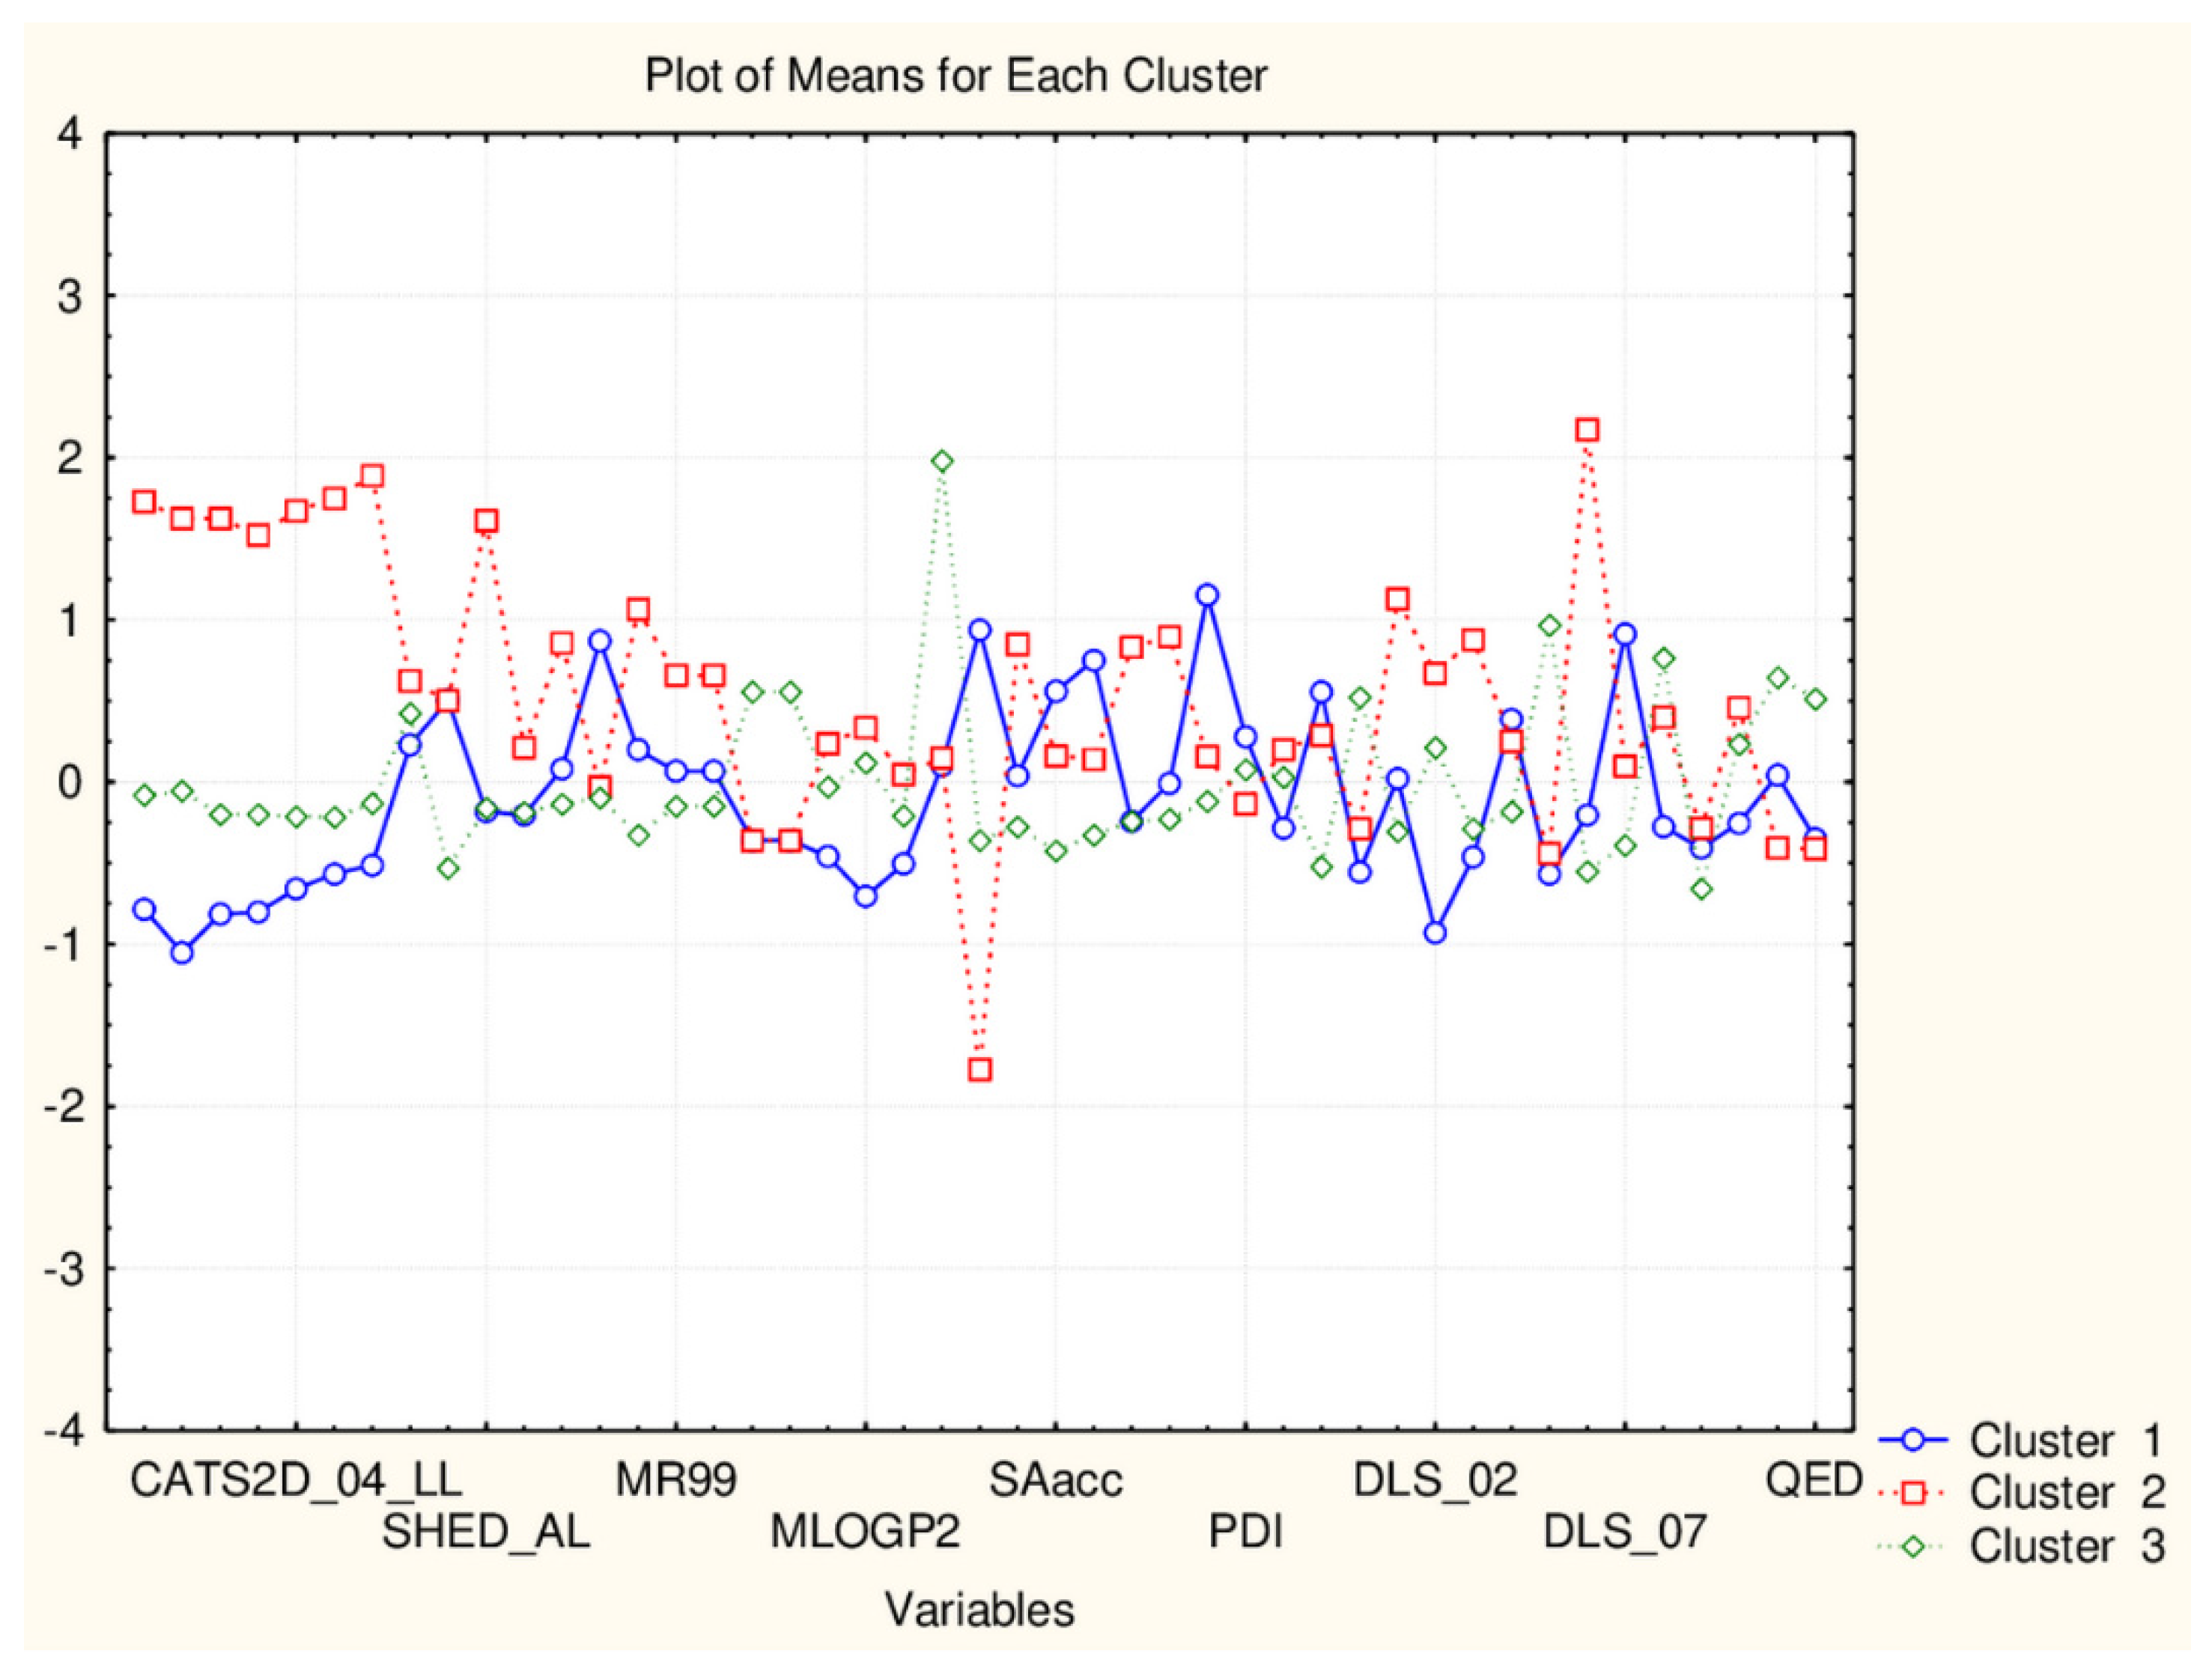
In Figure 9, the plot of average values of each descriptor for each identified cluster is presented.
The partitioning in the group of 17 flavonoids is based on the significantly different levels of the following descriptors: SHED_DL, SHED_AA, SHED_AL, Hy, MR99, MRcons, SAacc, SAtot, SAdon, SAscore, Vx, VvdwMG, Ro5, cRo5, DLS_01, DLS_02, DLS_06, DLS_07, DLS_cons, QEDu, QED (the groups of descriptors are well defined).
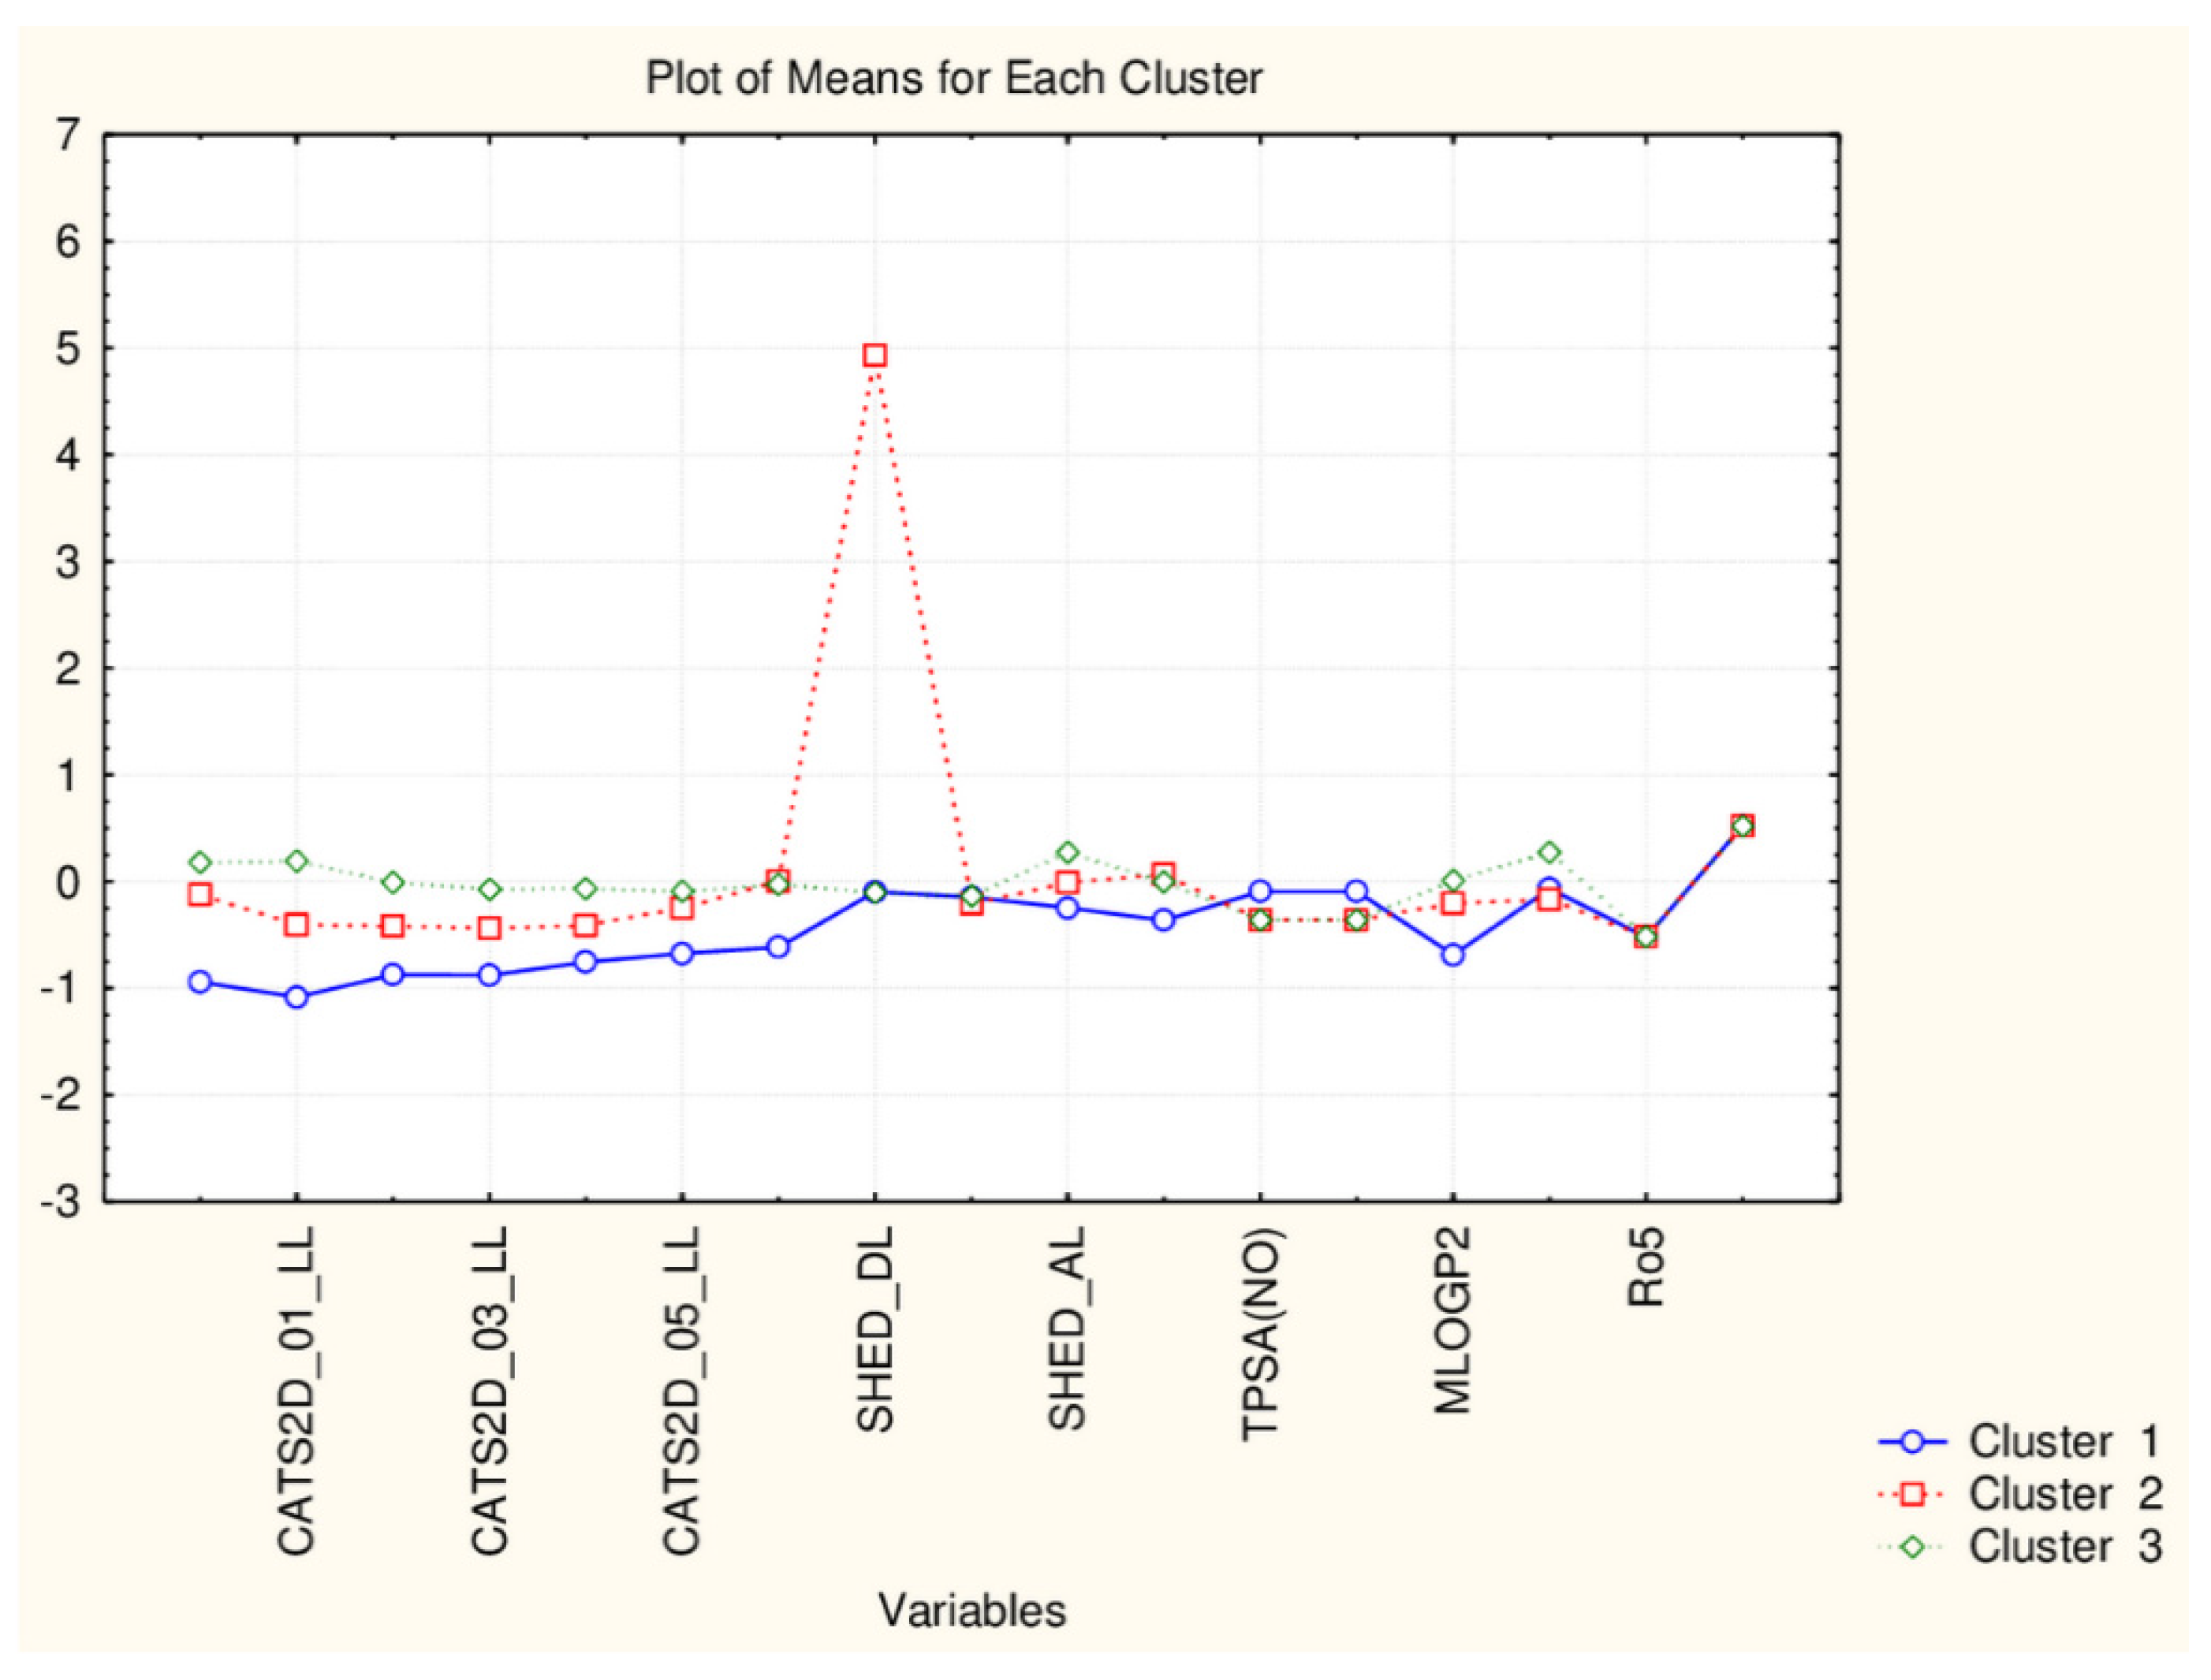
If the same group of 17 flavonoids is clustered by 17 descriptors the compounds are partitioned again into two major clusters. However, they differ in membership—from the big group (obviously having equal levels of descriptors) a small group of four members (celastrol, pristimerin, epitaraxerol and glycyrrhizin) is partitioned.
As seen in Figure 10 the difference between two patterns of similarity is due to the difference in the levels of all CATS2D descriptors, SHED_AL descriptor, MLOGP2 descriptor and Ro5 and cRo5 descriptors.
Therefore, the reduction of the number of descriptors could lead to minor changes in the partitioning scheme on one hand but, on the other, to underline some additional options to distinguish different flavonoids by the differences of their structural and drugability properties.
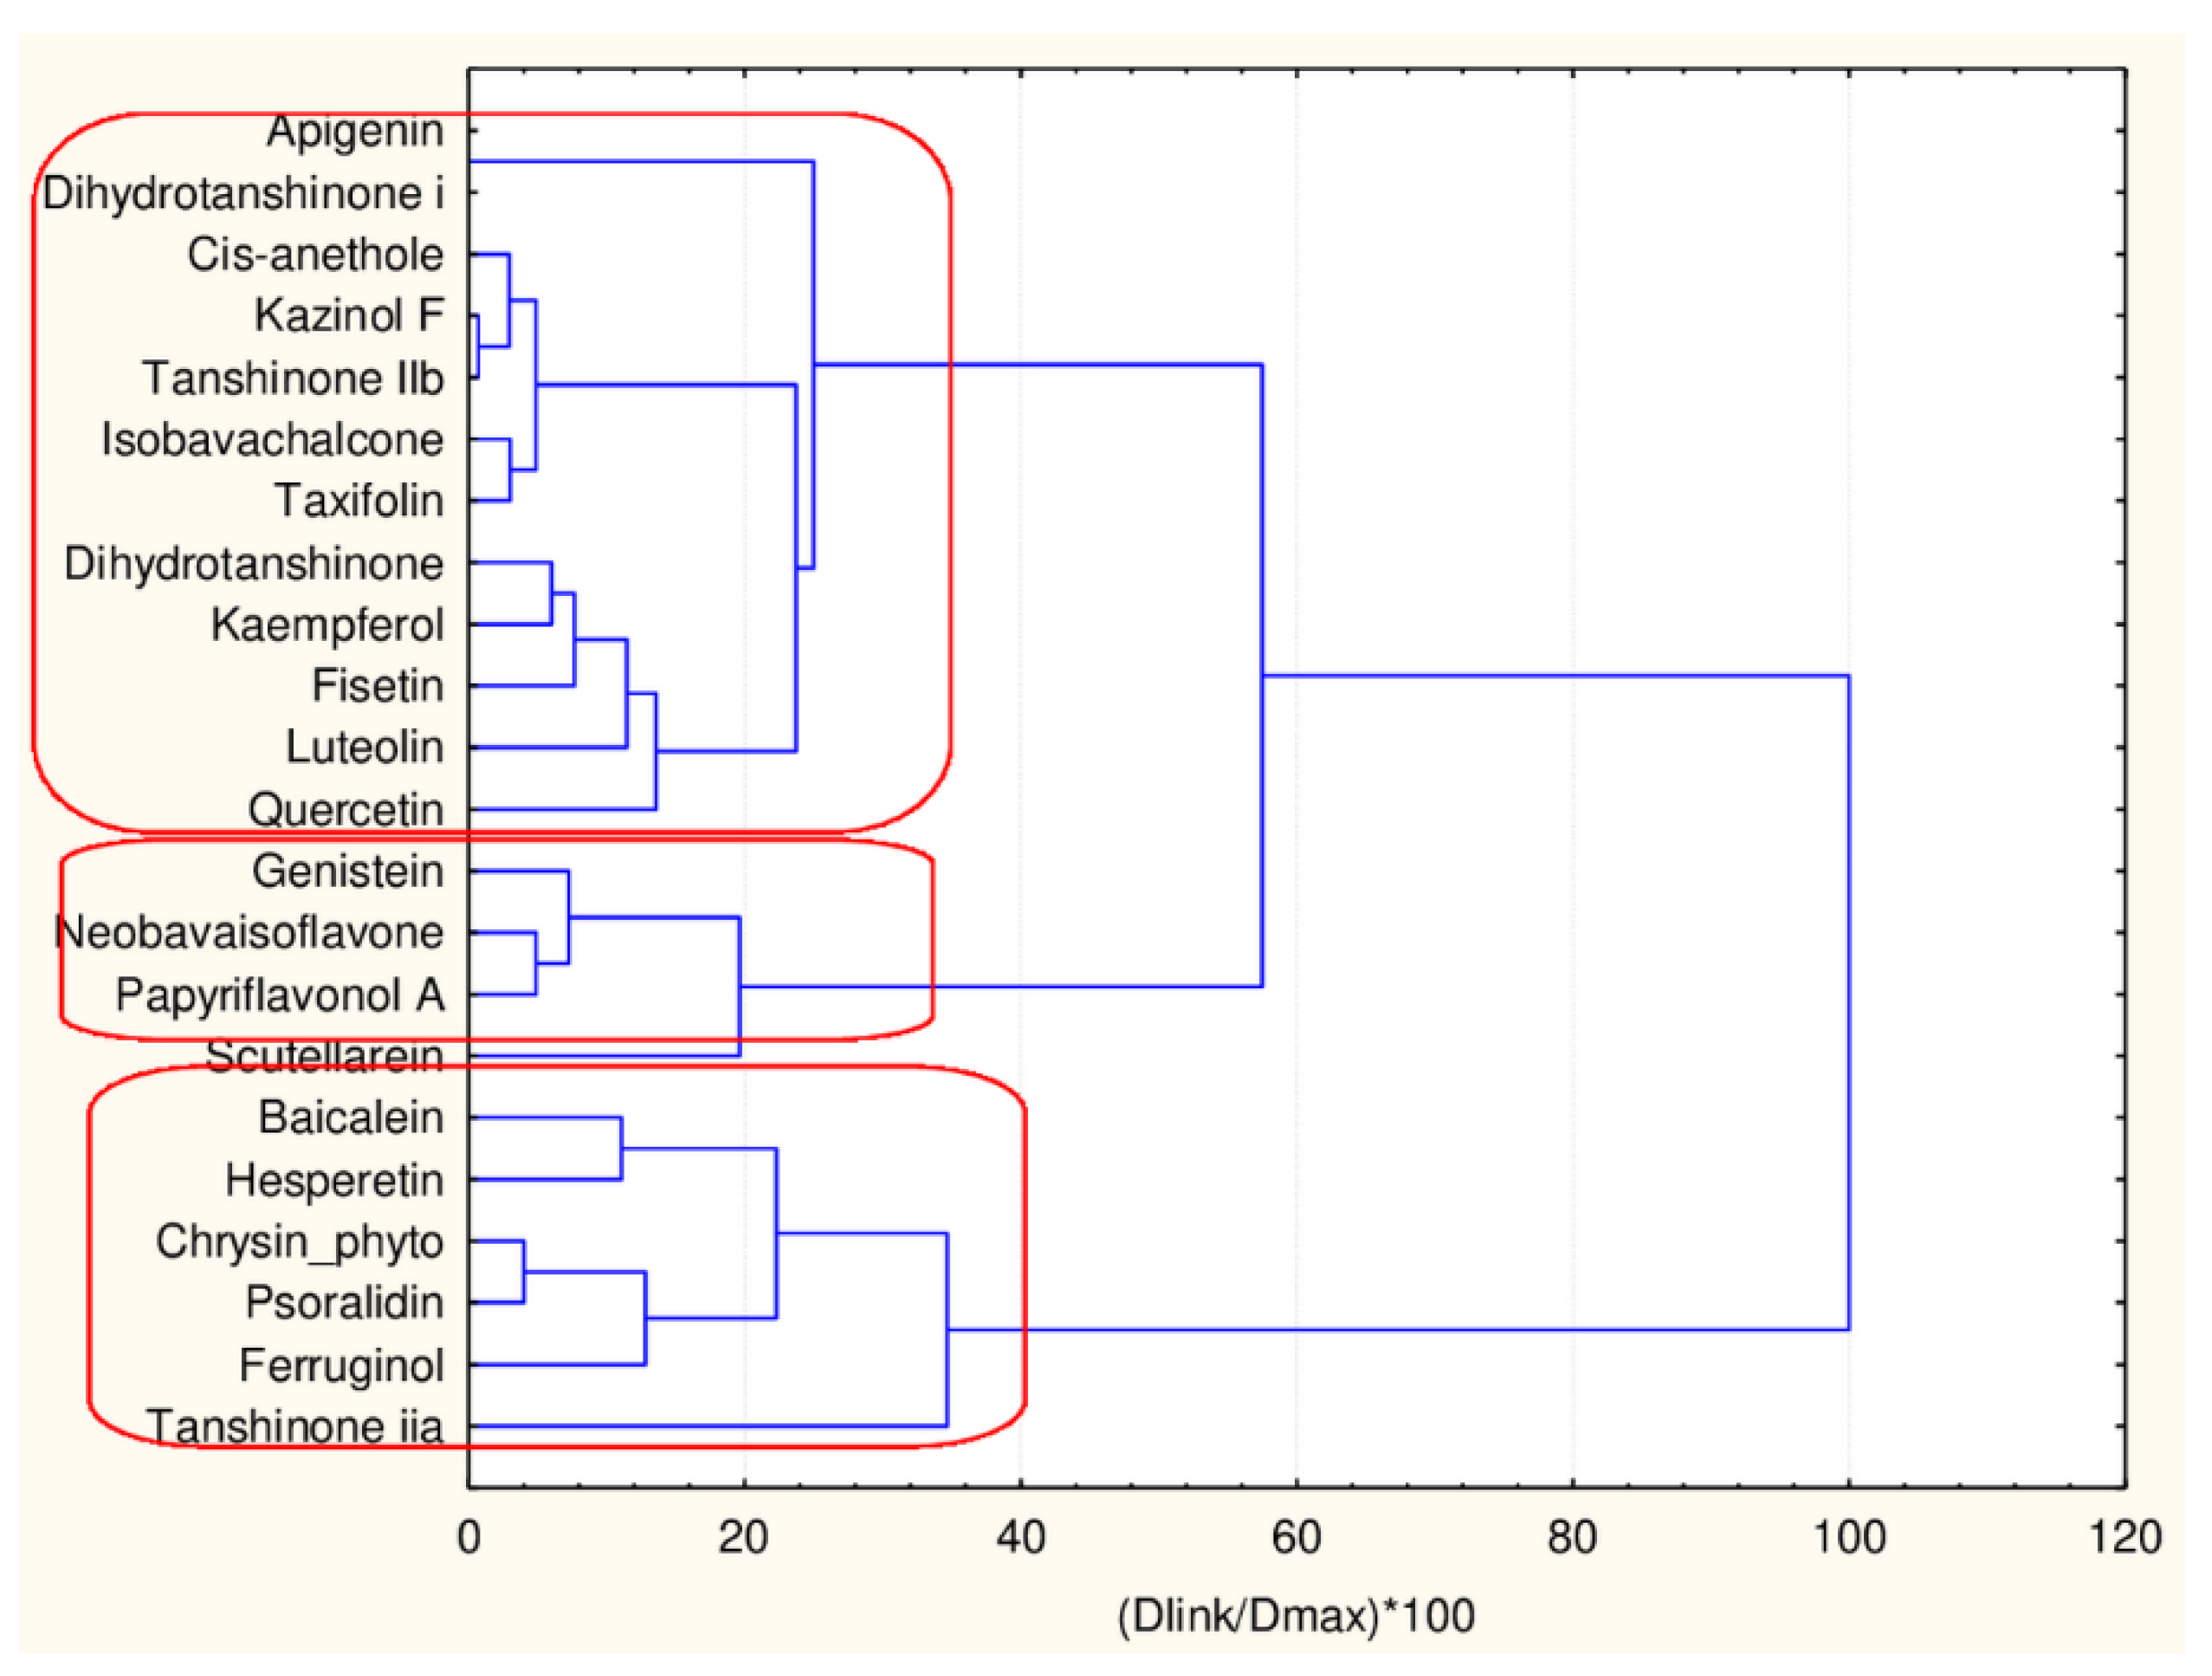
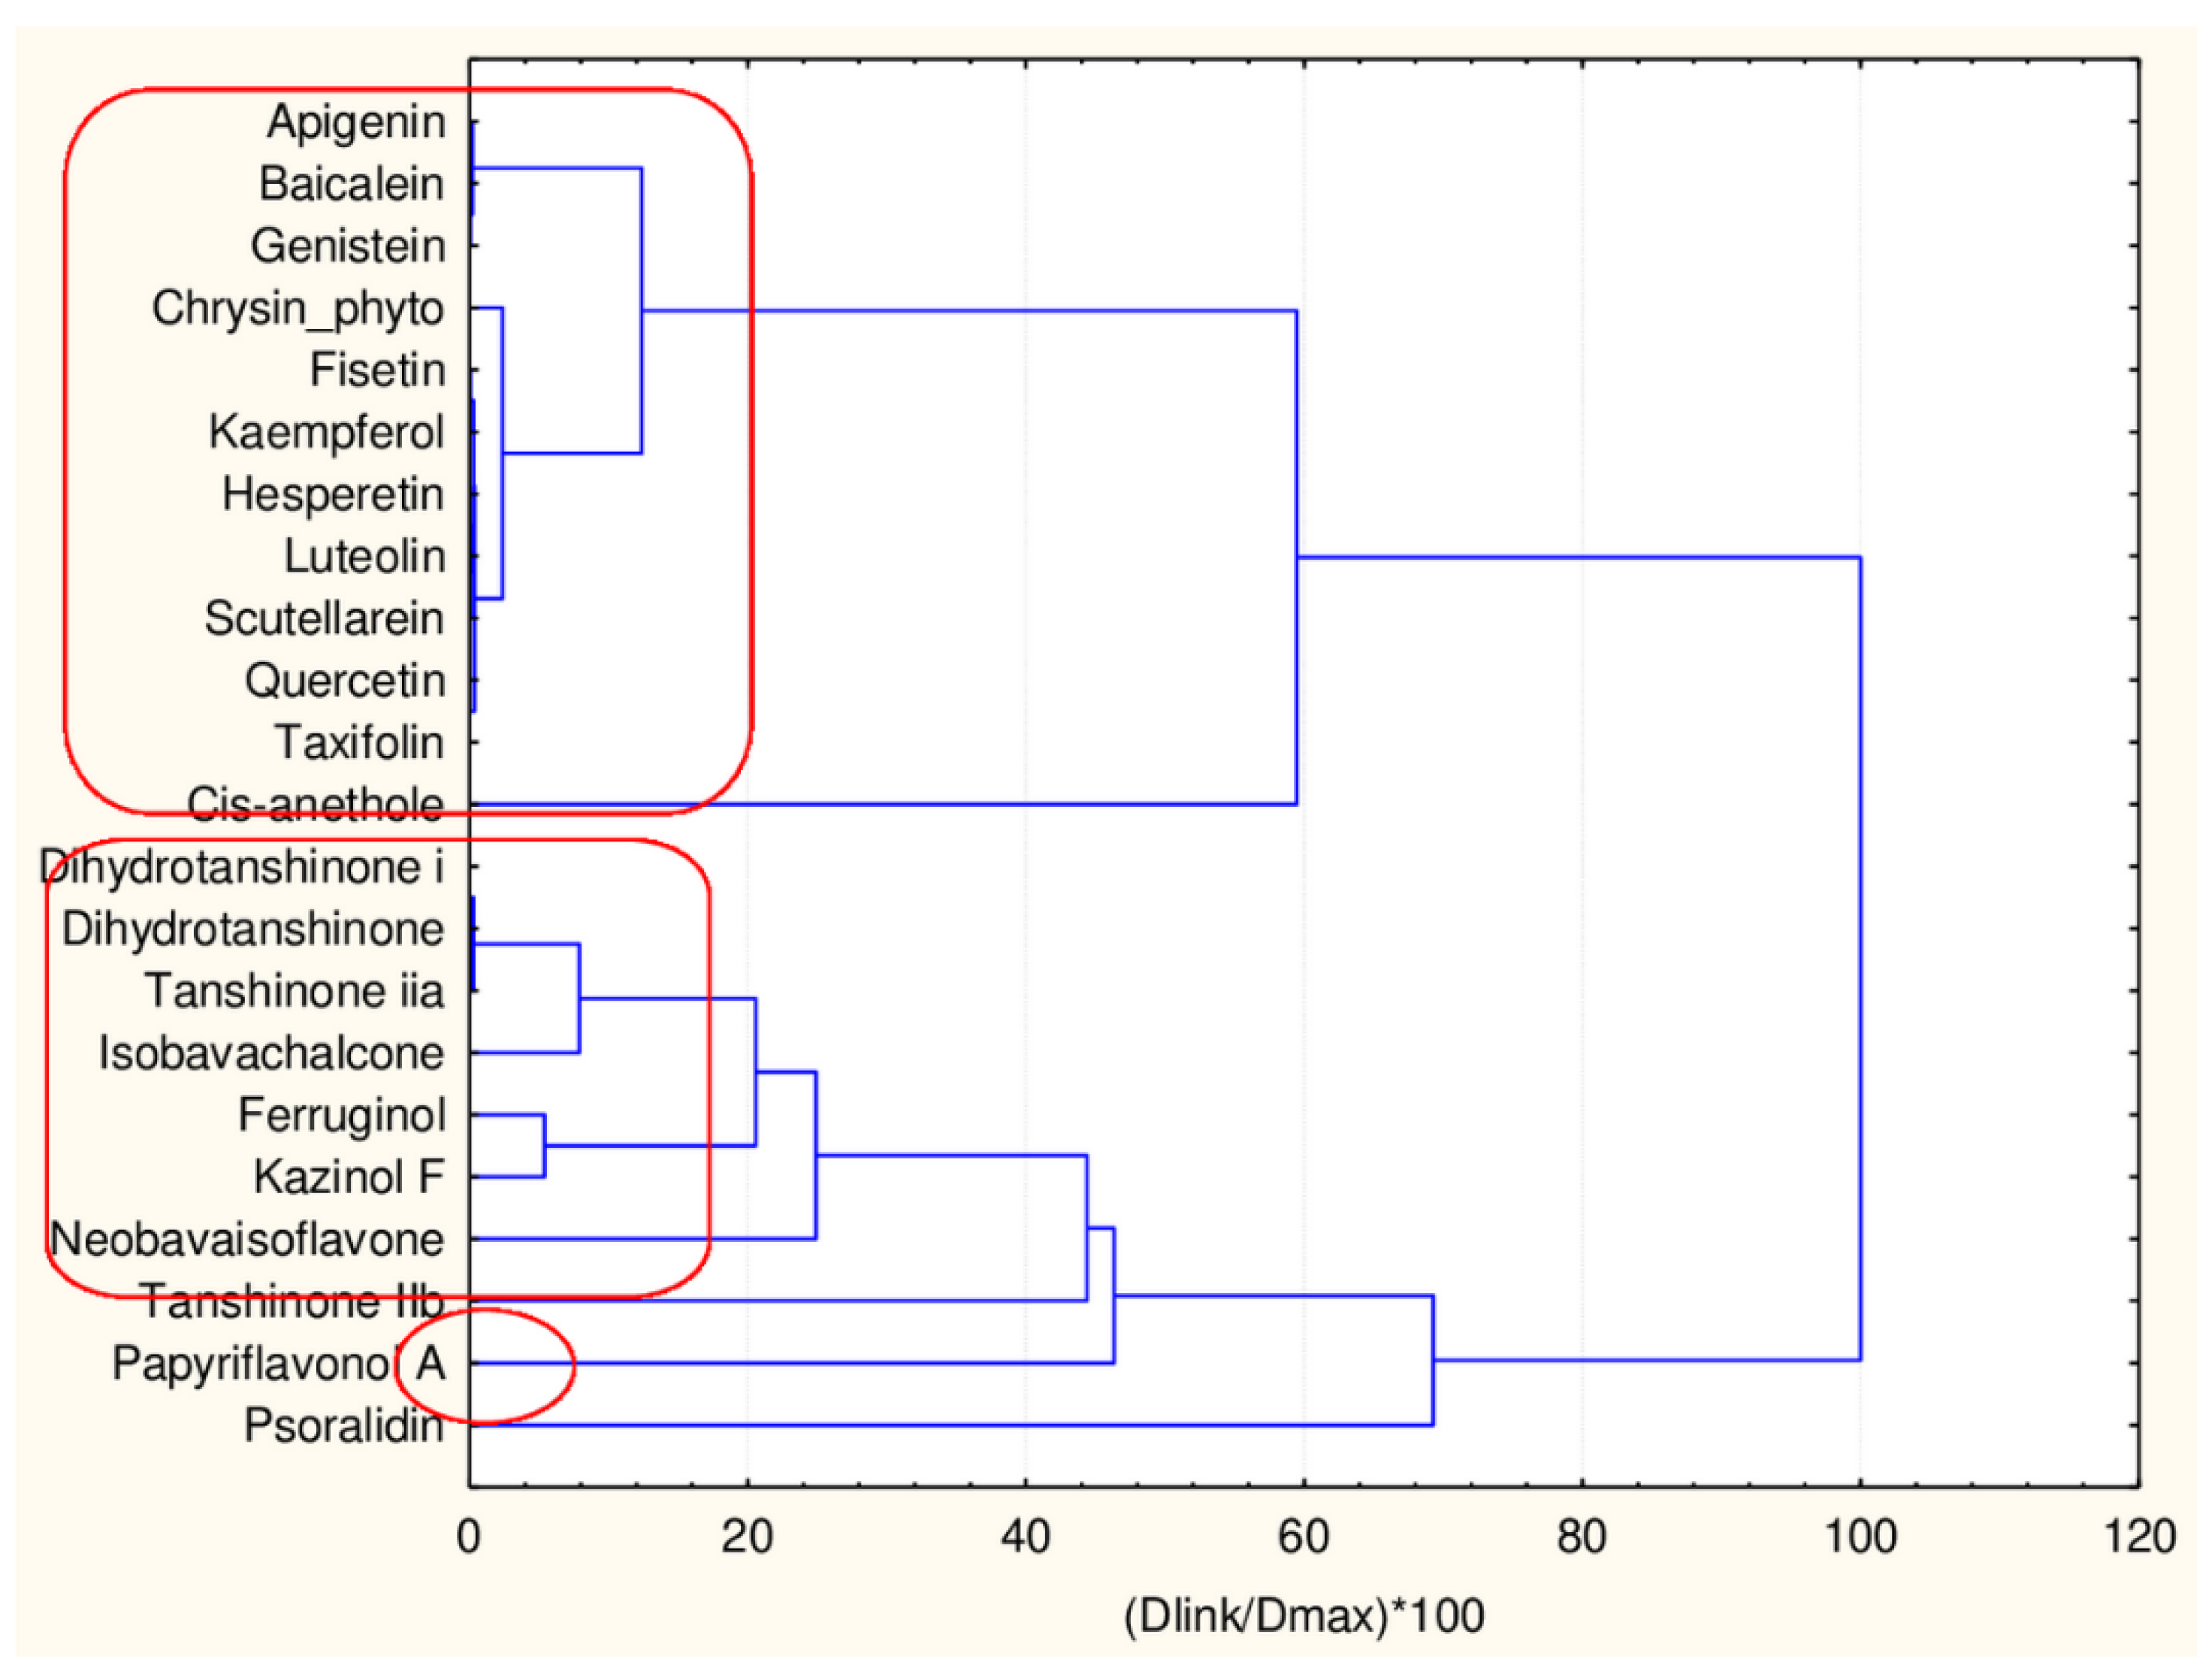
In this case, 22 flavonoids belonging to the bigger group of flavonoid partitioning are clustered with respect to 45 descriptors. In Figure 11 the hierarchical dendrogram for their separation is shown.
Three major clusters are formed with, respectively, 6, 4 and 12 members. The three clusters are very similar with respect to the levels of the mean values of the 45 descriptors. The significant differences are in CATSD2 descriptors, LOGPcons descriptor, (difference to the case with the smaller cluster of flavonoids), DLS_06 descriptors and QEDu and QED descriptors. It might be concluded that the additional flavonoids only partitioning reveals some specific properties of the compounds related to molecular differences as depicted in Figure 12 and was proven by the presented plot of means in Figure 13.
The hierarchical clustering revealed two significant clusters and two separate flavonoids (forming one small cluster or two outliers—papyriflavonol and psoralidin). The cluster significance is determined by Sneath’s index—1/3 Dmax or 2/3Dmax. (Figure 14).
The differences in the average values of the descriptors for the partitioned groups are negligible (Figure 15). Some slight differences in CATS2D are observed and the only significant difference is in the descriptor SHED_DL which makes the difference between the outliers and the rest of the flavonoids.
It could be concluded that the treatment of the flavonoids as a separate group of objects indicates that:
- The application of larger number of descriptors gives more opportunities to explain the partitioning;
- The use of a smaller number of descriptors elucidates some more specific properties of some flavonoids.
4. Conclusions
When discussing the drug-likeness for a particular class of natural compounds with an expected capability as drugs against anti-inflammatory viruses, the problem will require a combination of prediction methods and approaches of different levels of complexity.
The simple procedure of a partitioning approach towards drug-likeness to the drug discovery process of different natural medicine compounds seems effective to separate the selected large group of natural compounds into specific patterns depending on the descriptors used (dominantly sesquiterpenes, monoterpenes, curcuminoids as well as flavonoids as members of one of the identified pattern) and (dominantly flavonoids, triterpenes, saponines, alkaloids as members of the second pattern).
One important conclusion of the study carried out is that no specificity of the descriptors is found since testing a larger group of descriptors (45) and a selection of only 17 out of all 45 descriptors lead to one and the same partitioning model.
Another interesting conclusion can be assumed in the frame in two groups. The big group of flavonoids, however, does not belong selectively to one of these patterns but is mingled with the members of the first and second pattern. We are aware of the fact that the group of flavonoids is quite big and complex both as chemical structures and chemical properties or medical impacts to be specifically partitioned. Our additional chemometric analysis of only the group of flavonoids confirms this complexity.
An effort will be needed to select descriptors allowing to better impact and understand the reason for the mixing of flavonoids into the small and the big cluster identified by this partitioning procedure.
Supplementary Materials
The following are available online at https://www.mdpi.com/article/10.3390/sym13040546/s1, Figure S1—Chemical formulas for all the compound: Tables S1 and S2: Members of Cluster Number 1 and 2 with Distances from Respective Cluster Center Cluster contains.
Author Contributions
Conceptualization, M.N.; methodology, M.N.; software, M.N. and V.S.; validation, M.N., V.S.; formal analysis, M.N., V.S.; investigation, M.N., V.S.; resources, M.N.; data curation, M.N.; writing—original draft preparation, M.N., V.S.; writing—review and editing, M.N., V.S.; visualization, M.N.; project administration, M.N.; funding acquisition, M.N. All authors have read and agreed to the published version of the manuscript.
Funding
This research was funded by EOSCsecretariat.eu has received funding from the European Union’s Horizon Programme call H2020-INFRAEOSC-05-2018-2019, grant agreement number 831644.
Institutional Review Board Statement
Not applicable.
Informed Consent Statement
Not applicable.
Data Availability Statement
Not applicable.
Acknowledgments
EOSCsecretariat.eu has received funding from the European Union’s Horizon Programme call H2020-INFRAEOSC-05-2018-2019, grant Agreement number 831644.
Conflicts of Interest
The authors declare no conflict of interest.
References
- Searls, D.B. Data integration: Challenges for drug discovery. Nat. Rev. Drug Discov. 2005, 4, 45–58. [Google Scholar] [CrossRef]
- Lo, Y.-C.; Rensi, S.E.; Torng, W.; Altman, R.B. Machine learning in chemoinformatics and drug discovery. Drug Discov. Today 2018, 23, 1538–1546. [Google Scholar] [CrossRef]
- Atanasov, A.G.; The International Natural Product Sciences Taskforce; Zotchev, S.B.; Dirsch, V.M.; Supuran, C.T. Natural products in drug discovery: Advances and opportunities. Nat. Rev. Drug Discov. 2021, 20, 200–216. [Google Scholar] [CrossRef]
- Zin, P.P.K.; Williams, G.J.; Ekins, S. Cheminformatics Analysis and Modeling with MacrolactoneDB. Sci. Rep. 2020, 10, 6284. [Google Scholar] [CrossRef] [Green Version]
- Sandoval-Lira, J.; Mondragón-Solórzano, G.; Lugo-Fuentes, L.I.; Barroso-Flores, J. Accurate Estimation of pKb Values for Amino Groups from Surface Electrostatic Potential (VS,min) Calculations: The Isoelectric Points of Amino Acids as a Case Study. J. Chem. Inf. Model. 2020, 60, 1445–1452. [Google Scholar] [CrossRef]
- Caballero-García, G.; Mondragón-Solórzano, G.; Torres-Cadena, R.; Díaz-García, M.; Sandoval-Lira, J.; Barroso-Flores, J. Calculation of VS,max and Its Use as a Descriptor for the Theoretical Calculation of pKa Values for Carboxylic Acids. Molecules 2019, 24, 79. [Google Scholar] [CrossRef] [PubMed] [Green Version]
- Sabbah, D.A.; Haroon, R.A.; Bardaweel, S.K.; Hajjo, R.; Sweidan, K. N-phenyl-6-chloro-4-hydroxy-2-quinolone-3-carboxamides: Molecular Docking, Synthesis, and Biological Investigation as Anticancer Agents. Molecules 2021, 26, 73. [Google Scholar] [CrossRef] [PubMed]
- Ancuceanu, R.; Hovanet, M.V.; Anghel, A.I.; Furtunescu, F.; Neagu, M.; Constantin, C.; Dinu, M. Computational Models Using Multiple Machine Learning Algorithms for Predicting Drug Hepatotoxicity with the DILIrank Dataset. Int. J. Mol. Sci. 2020, 21, 2114. [Google Scholar] [CrossRef] [PubMed] [Green Version]
- Agoni, C.; Olotu, F.A.; Ramharack, P.; Soliman, M.E. Druggability and drug-likeness concepts in drug design: Are biomodelling and predictive tools having their say? J. Mol. Model. 2020, 26, 120. [Google Scholar] [CrossRef]
- Cheng, A.C.; Coleman, R.G.; Smyth, K.T.; Cao, Q.; Soulard, P.; Caffrey, D.R.; Salzberg, A.C.; Huang, E.S. Structure-based maximal affinity model predicts small-molecule druggability. Nat. Biotechnol. 2007, 25, 71–75. [Google Scholar] [CrossRef] [PubMed]
- Barril, X. Druggability predictions: Methods, limitations, and applications. Wiley Interdiscip. Rev. Comput. Mol. Sci. 2013, 3, 327–338. [Google Scholar] [CrossRef]
- Kozakov, D.; Hall, D.R.; Napoleon, R.L.; Yueh, C.; Whitty, A.; Vajda, S. New Frontiers in Druggability. J. Med. Chem. 2015, 58, 9063–9088. [Google Scholar] [CrossRef] [PubMed]
- Danishuddin; Khan, A.U. Descriptors and their selection methods in QSAR analysis: Paradigm for drug design. Drug Discov. Today 2016, 21, 1291–1302. [Google Scholar] [CrossRef] [PubMed]
- Nedyalkova, M.; Simeonov, V. Multivariate Chemometrics as a Strategy to Predict the Allergenic Nature of Food Proteins. Symmetry 2020, 12, 1616. [Google Scholar] [CrossRef]
- Szefler, B.; Czeleń, P. Docking of Platinum Compounds on Cube Rhombellane Functionalized Homeomorphs. Symmetry 2020, 12, 749. [Google Scholar] [CrossRef]
- Halder, A.K.; Cordeiro, M.N.D.S. Development of Multi-Target Chemometric Models for the Inhibition of Class I PI3K Enzyme Isoforms: A Case Study Using QSAR-Co Tool. Int. J. Mol. Sci. 2019, 20, 4191. [Google Scholar] [CrossRef] [PubMed] [Green Version]
- Lipinski, C.A. Lead and drug-like compounds: The rule-of-five revolution. Drug Discov. Today: Technol. 2004, 1, 337–341. [Google Scholar] [CrossRef]
- Mishra, B.B.; Tiwari, V.K. Natural products: An evolving role in future drug discovery. Eur. J. Med. Chem. 2011, 46, 4769–4807. [Google Scholar] [CrossRef] [PubMed]
- Cragg, G.M.; Newman, D.J. Natural products: A continuing source of novel drug leads. Biochim. Biophys. Acta (BBA) Gen. Subj. 2013, 1830, 3670–3695. [Google Scholar] [CrossRef] [Green Version]
- Newman, D.J.; Cragg, G.M. Natural Products as Sources of New Drugs over the Nearly Four Decades from 01/1981 to 09/2019. J. Nat. Prod. 2020, 83, 770–803. [Google Scholar] [CrossRef] [PubMed]
- Calixto, J.B. The role of natural products in modern drug discovery. An. Acad. Bras. Ciências 2019, 91, e20190105. [Google Scholar] [CrossRef] [PubMed]
- Chiang, L.-C.; Ng, L.-T.; Cheng, P.-W.; Chiang, W.; Lin, C.-C. Antiviral activities of extracts and selected pure constituents of Ocimum basilicum. Clin. Exp. Pharmacol. Physiol. 2005, 32, 811–816. [Google Scholar] [CrossRef] [PubMed]
- Cheng, P.-W.; Ng, L.-T.; Chiang, L.-C.; Lin, C.-C. Antiviral effects of saikosaponins on human Coronavirus 229e In Vitro. Clin. Exp. Pharmacol. Physiol. 2006, 33, 612–616. [Google Scholar] [CrossRef]
- Li, S.-I.; Chen, G.; Zhang, H.-Q.; Guo, H.-Y.; Wang, H.; Wang, L.; Zhang, X.; Hua, S.-N.; Yu, J.; Xiao, P.-g.; et al. Identification of natural compounds with antiviral activities against SARS-associated coronavirus. Antivir. Res. 2005, 67, 18–23. [Google Scholar] [CrossRef]
- Rivero-Segura, N.A.; Gomez-Verjan, J.C. In Silico Screening of Natural Products Isolated from Mexican Herbal Medicines against COVID-19. Biomolecules 2021, 11, 216. [Google Scholar] [CrossRef]
- Gil, B.; Sanz, M.J.; Terencio, M.C.; Ferrandiz, M.L.; Paya, M.; Gunasegaran, R.; Alcaraz, M.J. Effects of flavonoids on Naja naja and human recombinant synovial phospholipase A2 and inflammatory responses in mice. Life Sci. 1994, 54, PL333–PL338. [Google Scholar] [CrossRef]
- Chang, H.; Baek, S.; Chung, K.; Son, K.; Kim, H.; Kang, S. Inactivation of Phospholipase A2 by Naturally Occurring Biflavonoid, Ochnaflavone. Biochem. Biophys. Res. Commun. 1994, 205, 843–849. [Google Scholar] [CrossRef]
- Cheon, B.S.; Kim, Y.H.; Son, K.S.; Chang, H.W.; Kang, S.S.; Kim, H.P. Effects of Prenylated Flavonoids and Biflavonoids on Lipopolysaccharide-Induced Nitric Oxide Production from the Mouse Macrophage Cell Line RAW 264.7. Planta Med. 2000, 66, 596–600. [Google Scholar] [CrossRef] [PubMed]
- Yao, W.; Li, Z.; Liu, Q.; Gao, Y.; Dai, J.; Bao, B.; Zhang, L.; Ding, A. Cellular Metabolomics Revealed the Cytoprotection of Amentoflavone, a Natural Compound, in Lipopolysaccharide-Induced Injury of Human Umbilical Vein Endothelial Cells. Int. J. Mol. Sci. 2016, 17, 1514. [Google Scholar] [CrossRef] [Green Version]
- Mauri, A. alvaDesc: A tool to calculate and analyze molecular descriptors and fingerprints. In Ecotoxicological QSARs. Methods in Pharmacology and Toxicology; Roy, K., Ed.; Humana: New York, NY, USA, 2020. [Google Scholar]
- Elisabet, G.; Mestres, J. SHED: Shannon Entropy Descriptors from Topological Feature Distributions. J. Chem. Inf. Modeling 2006, 46, 1615–1622. [Google Scholar]
Figure 1.
Hierarchical dendrogram for clustering of 135 natural compounds by 45 or 17 descriptors.

Figure 2.
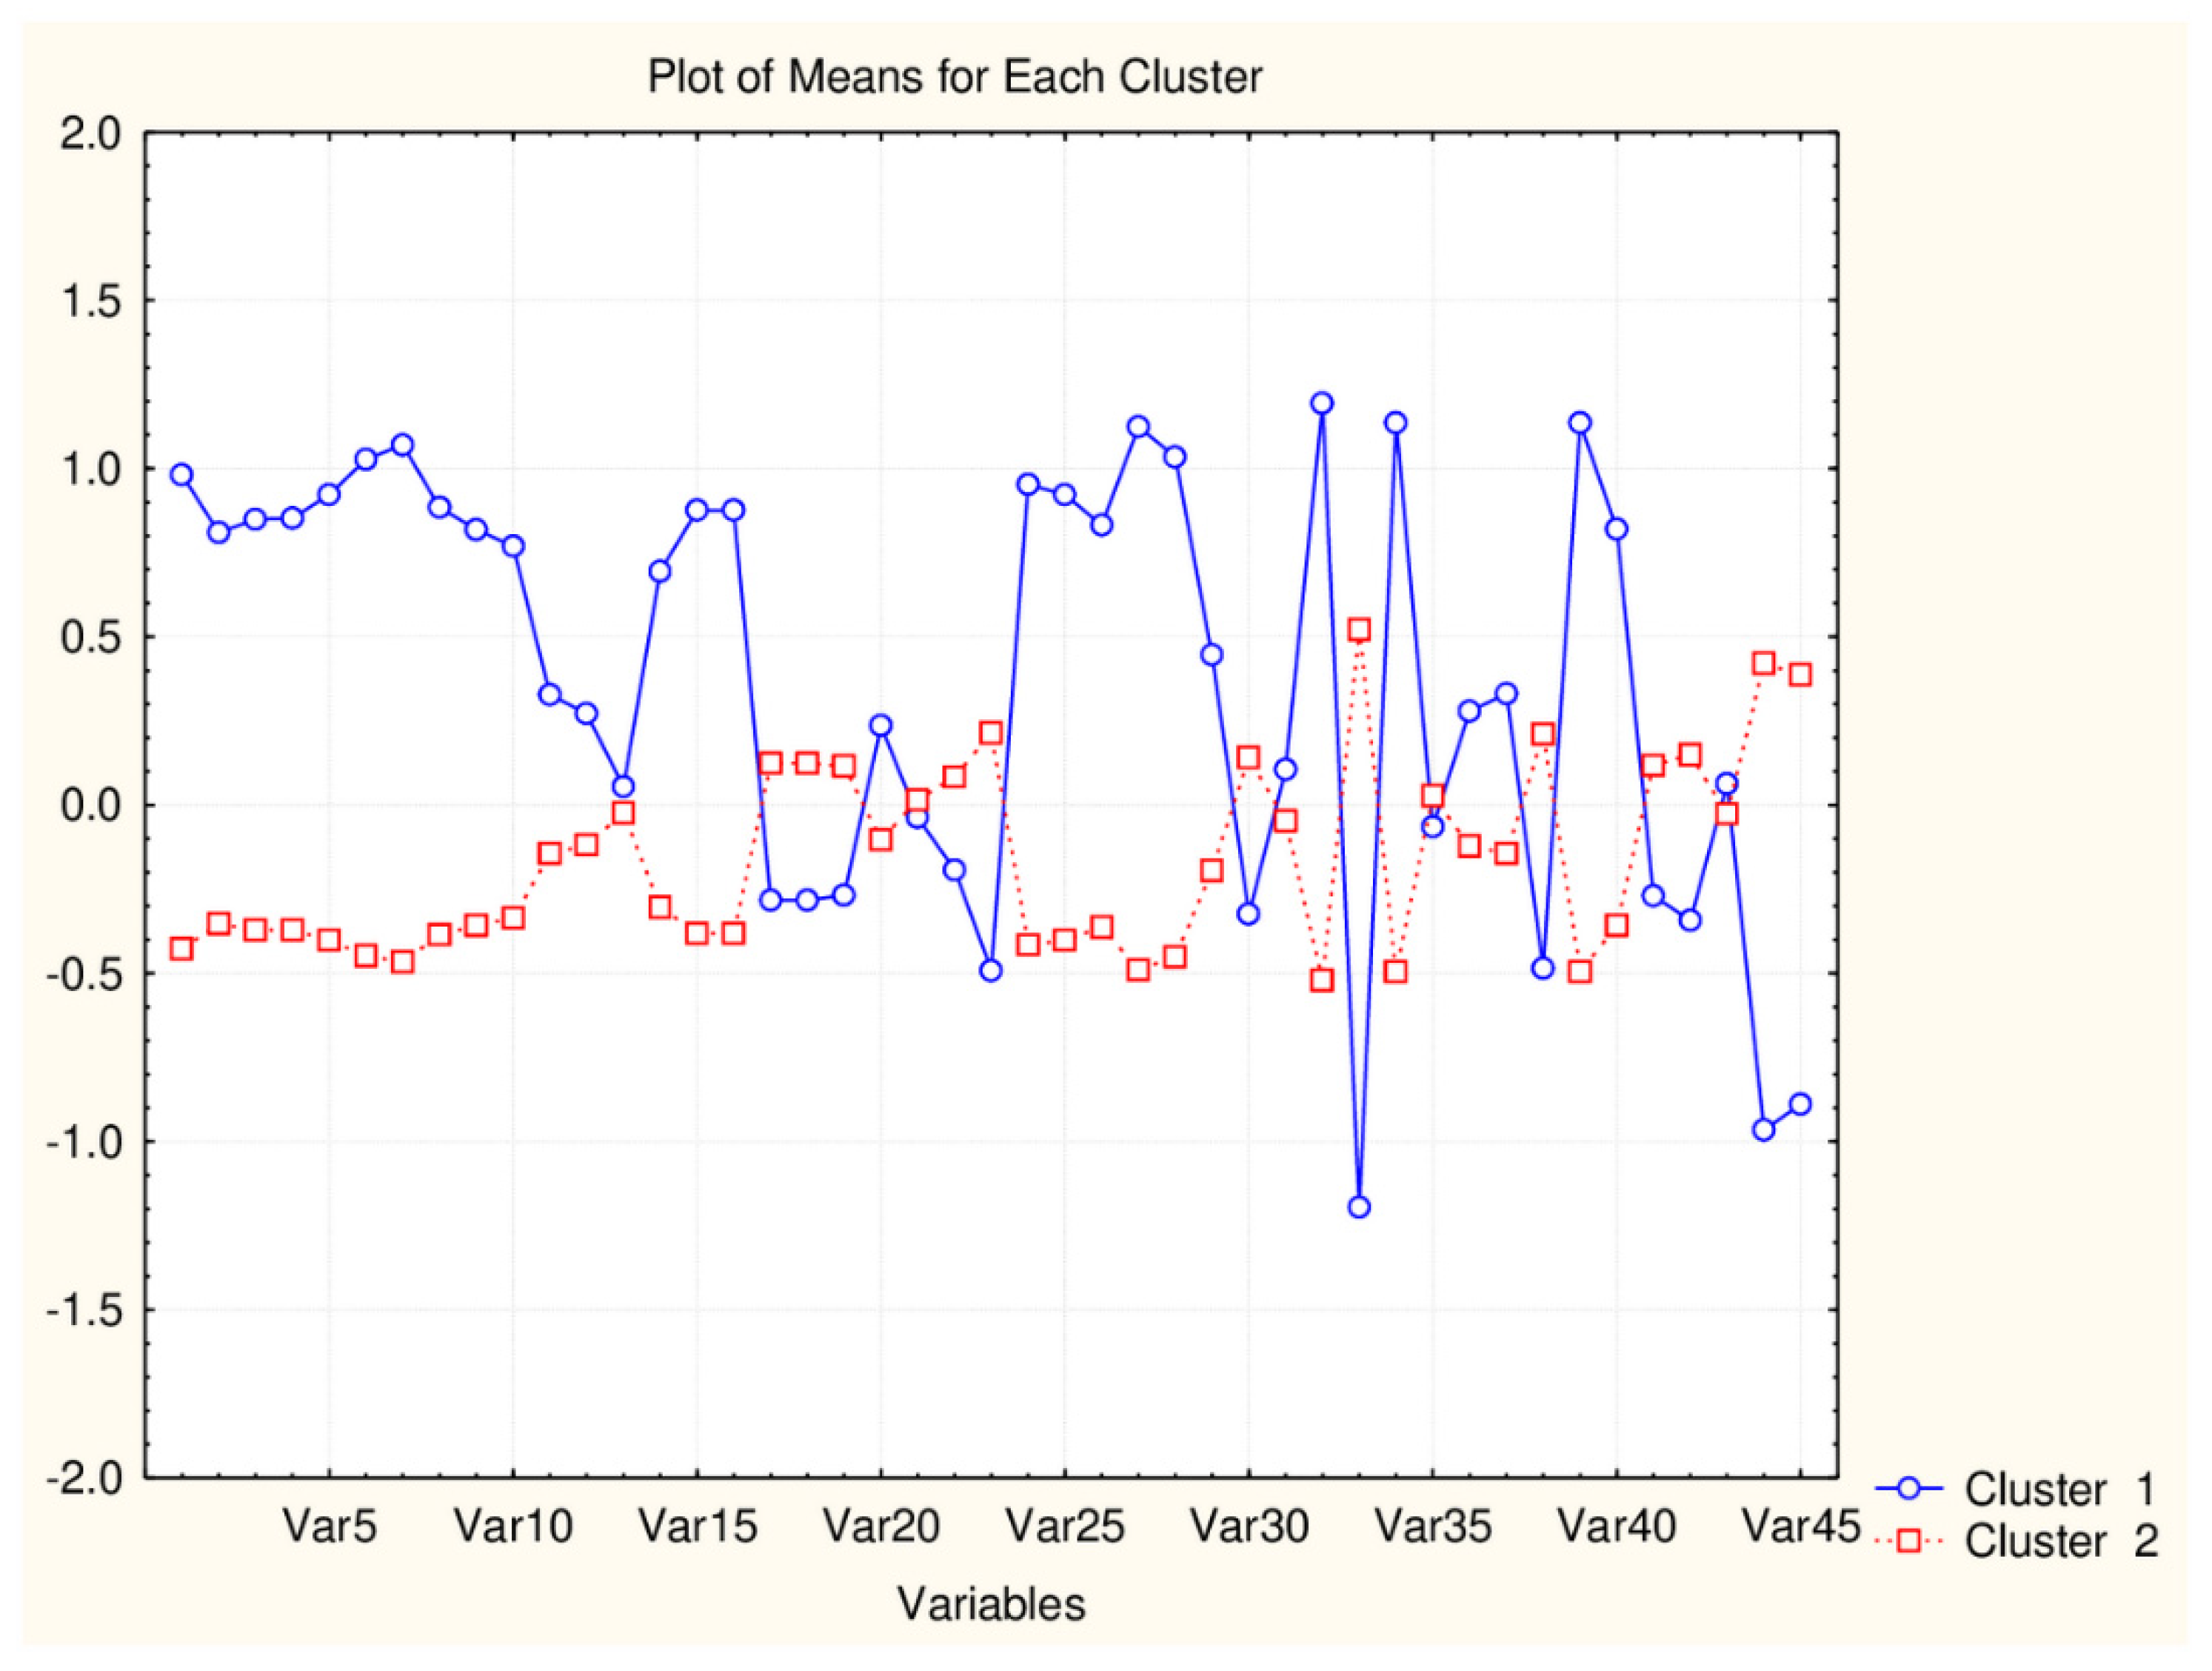
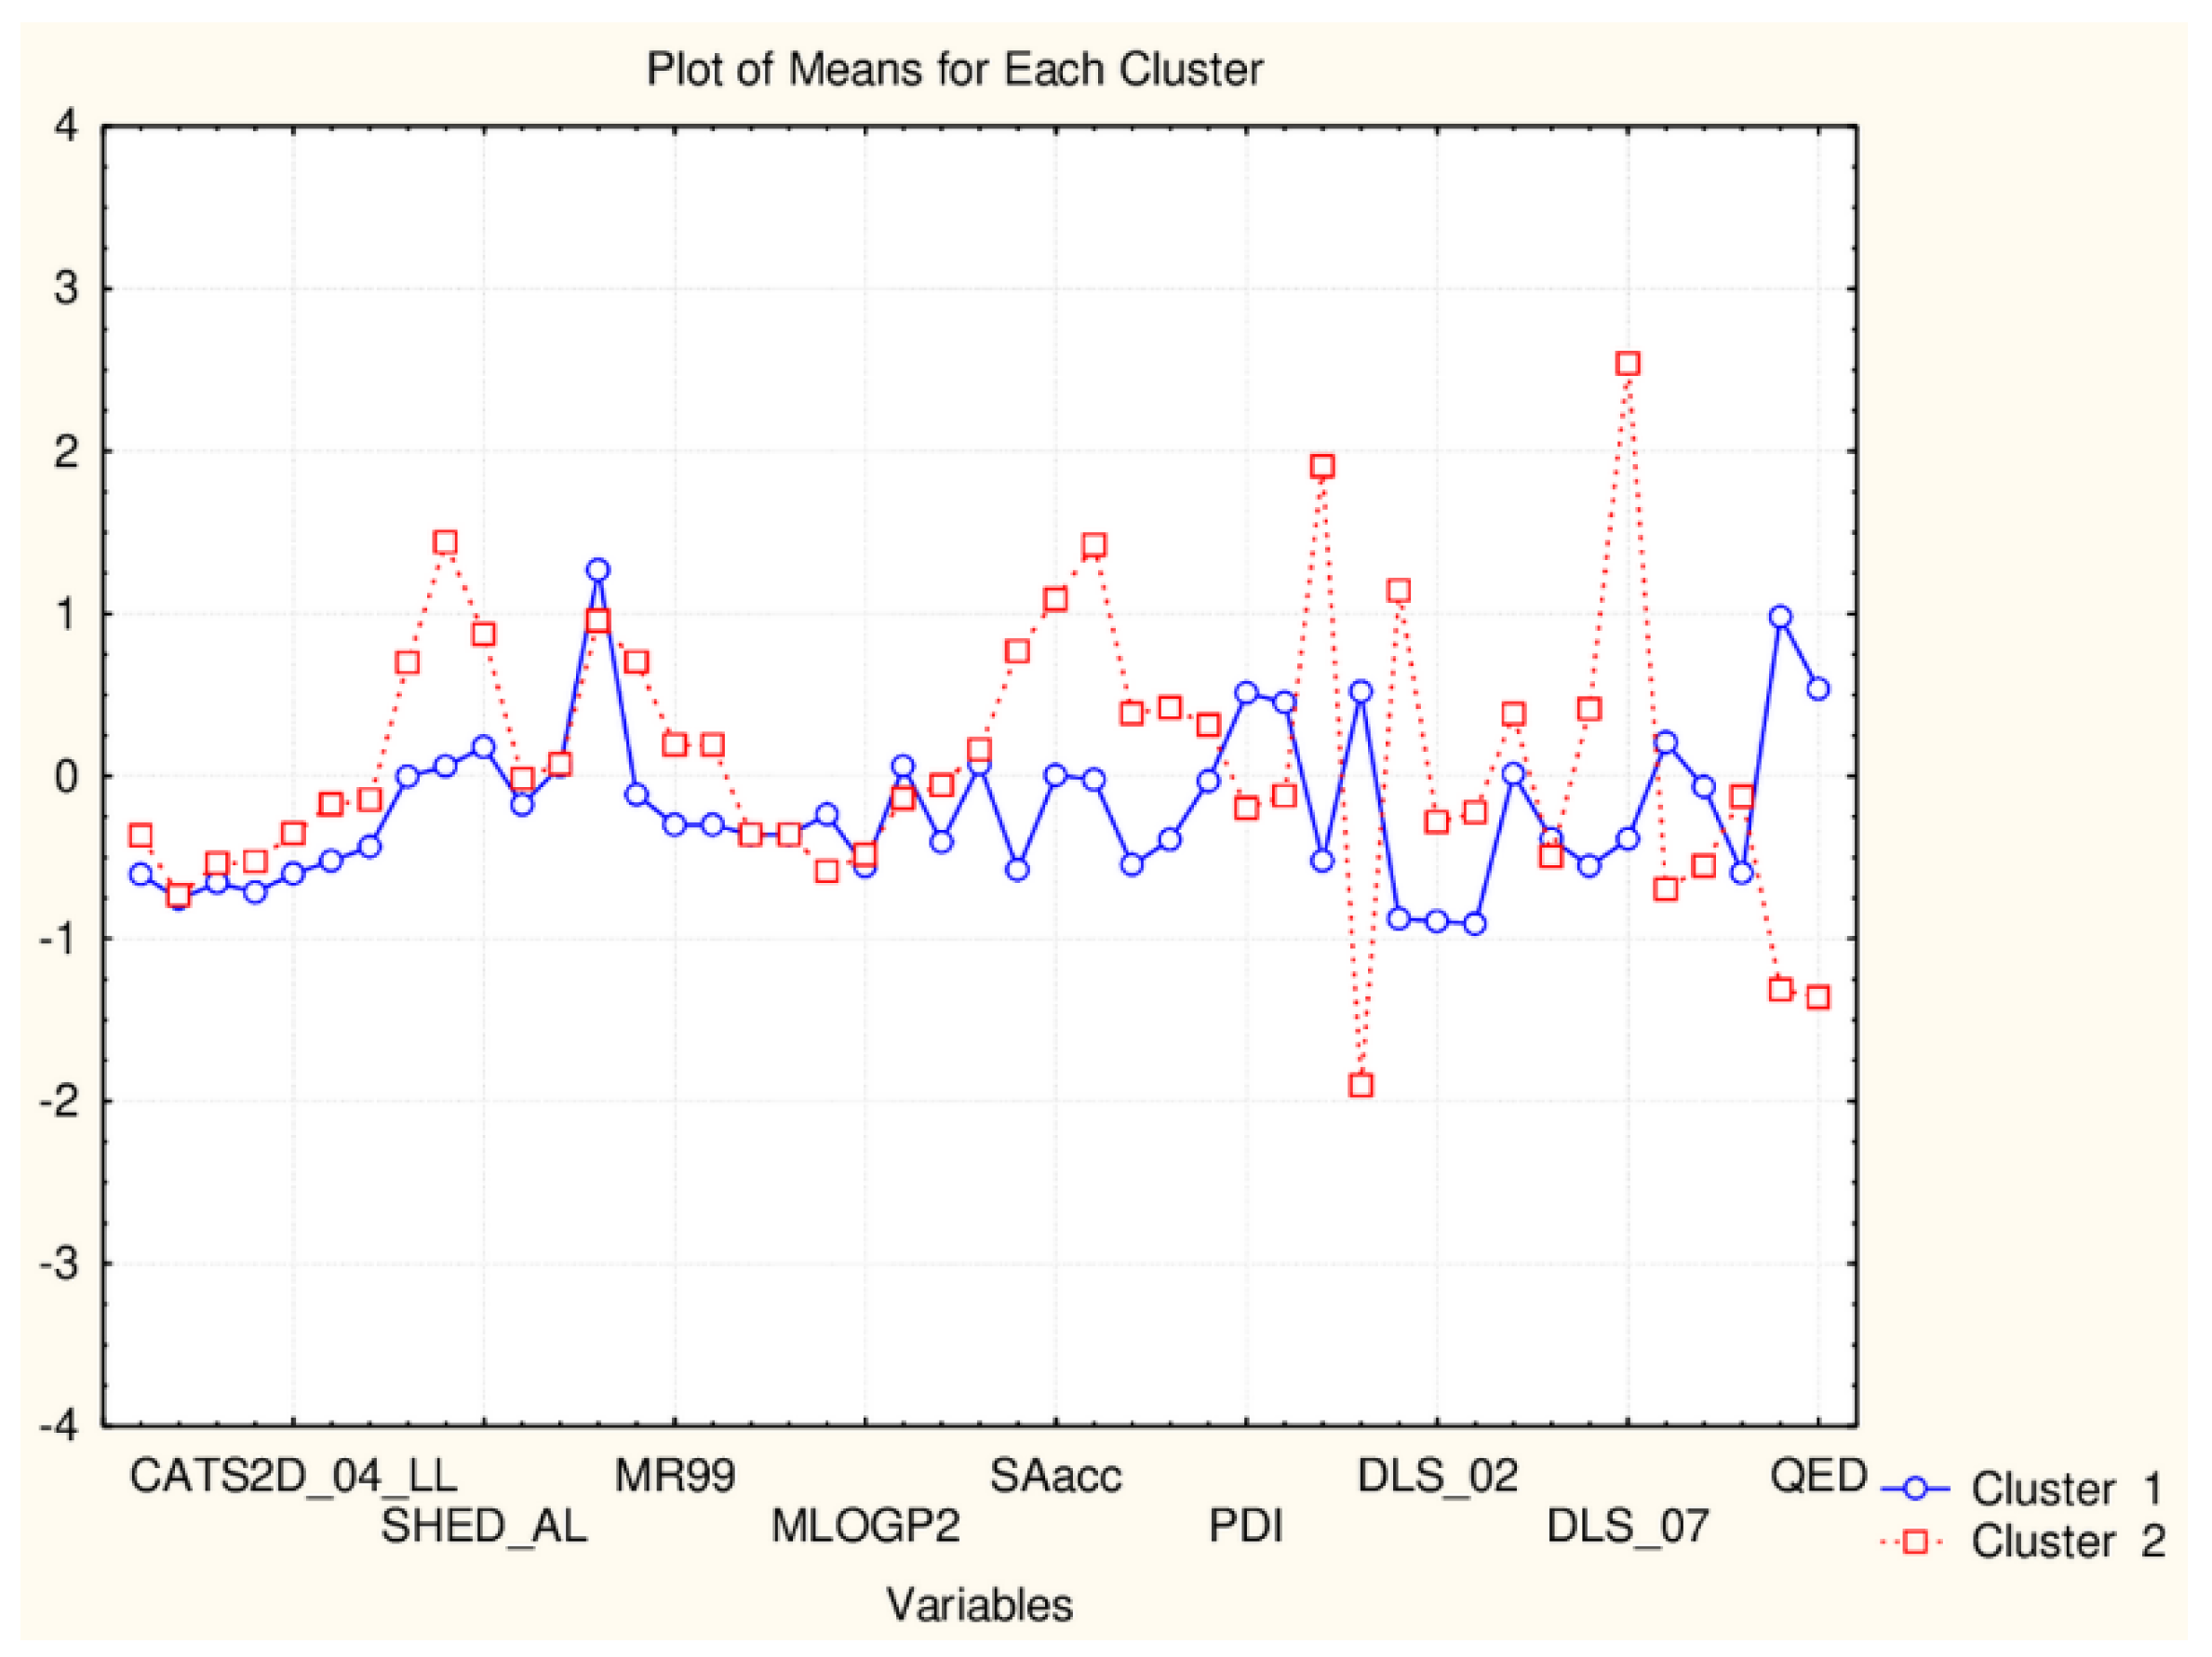
Plot of mean values (normalized) of 45 descriptors for each identified cluster of objects (blue—small cluster; red—big cluster) VAR5—CATSD2_04_LL; VAR10—SHED_ALL; VAR15—MR99; VAR20- MLPGP2; VAR25—SAacc; VAR30—PDI; VAR35—DLS_02; VAR40—DLS_07; VAR45—QED).
Figure 2.
Plot of mean values (normalized) of 45 descriptors for each identified cluster of objects (blue—small cluster; red—big cluster) VAR5—CATSD2_04_LL; VAR10—SHED_ALL; VAR15—MR99; VAR20- MLPGP2; VAR25—SAacc; VAR30—PDI; VAR35—DLS_02; VAR40—DLS_07; VAR45—QED).

Figure 3.
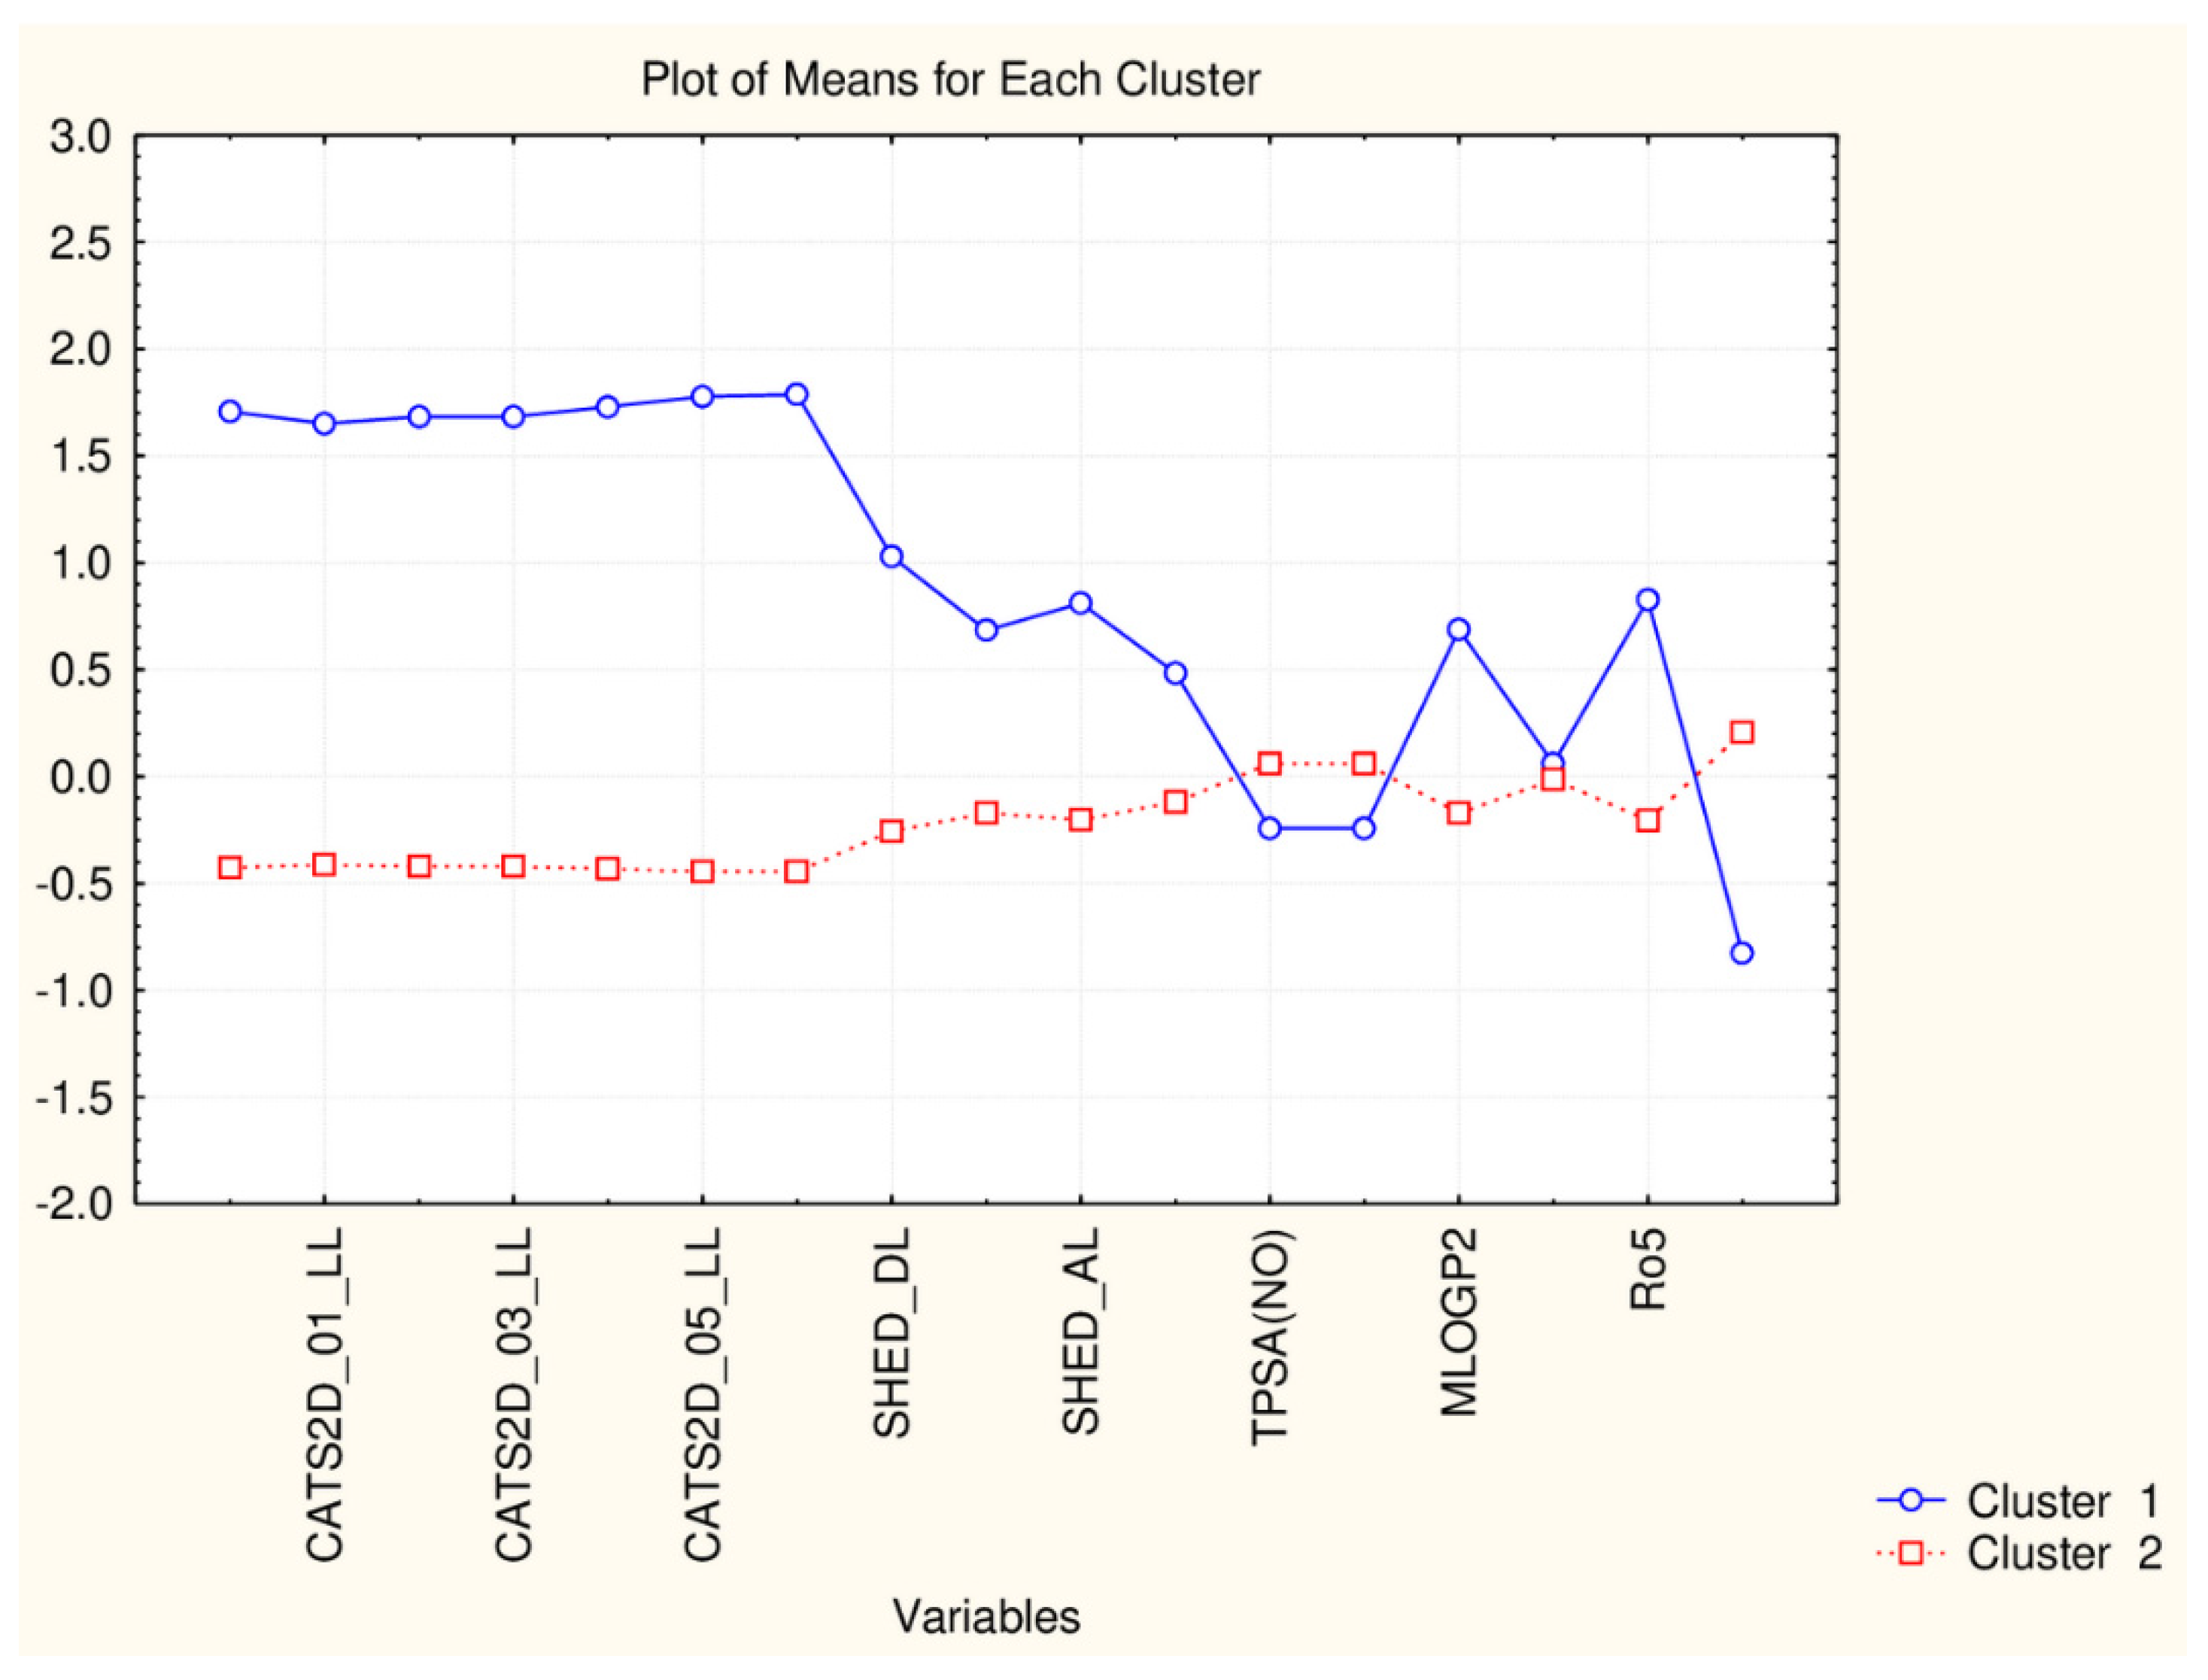
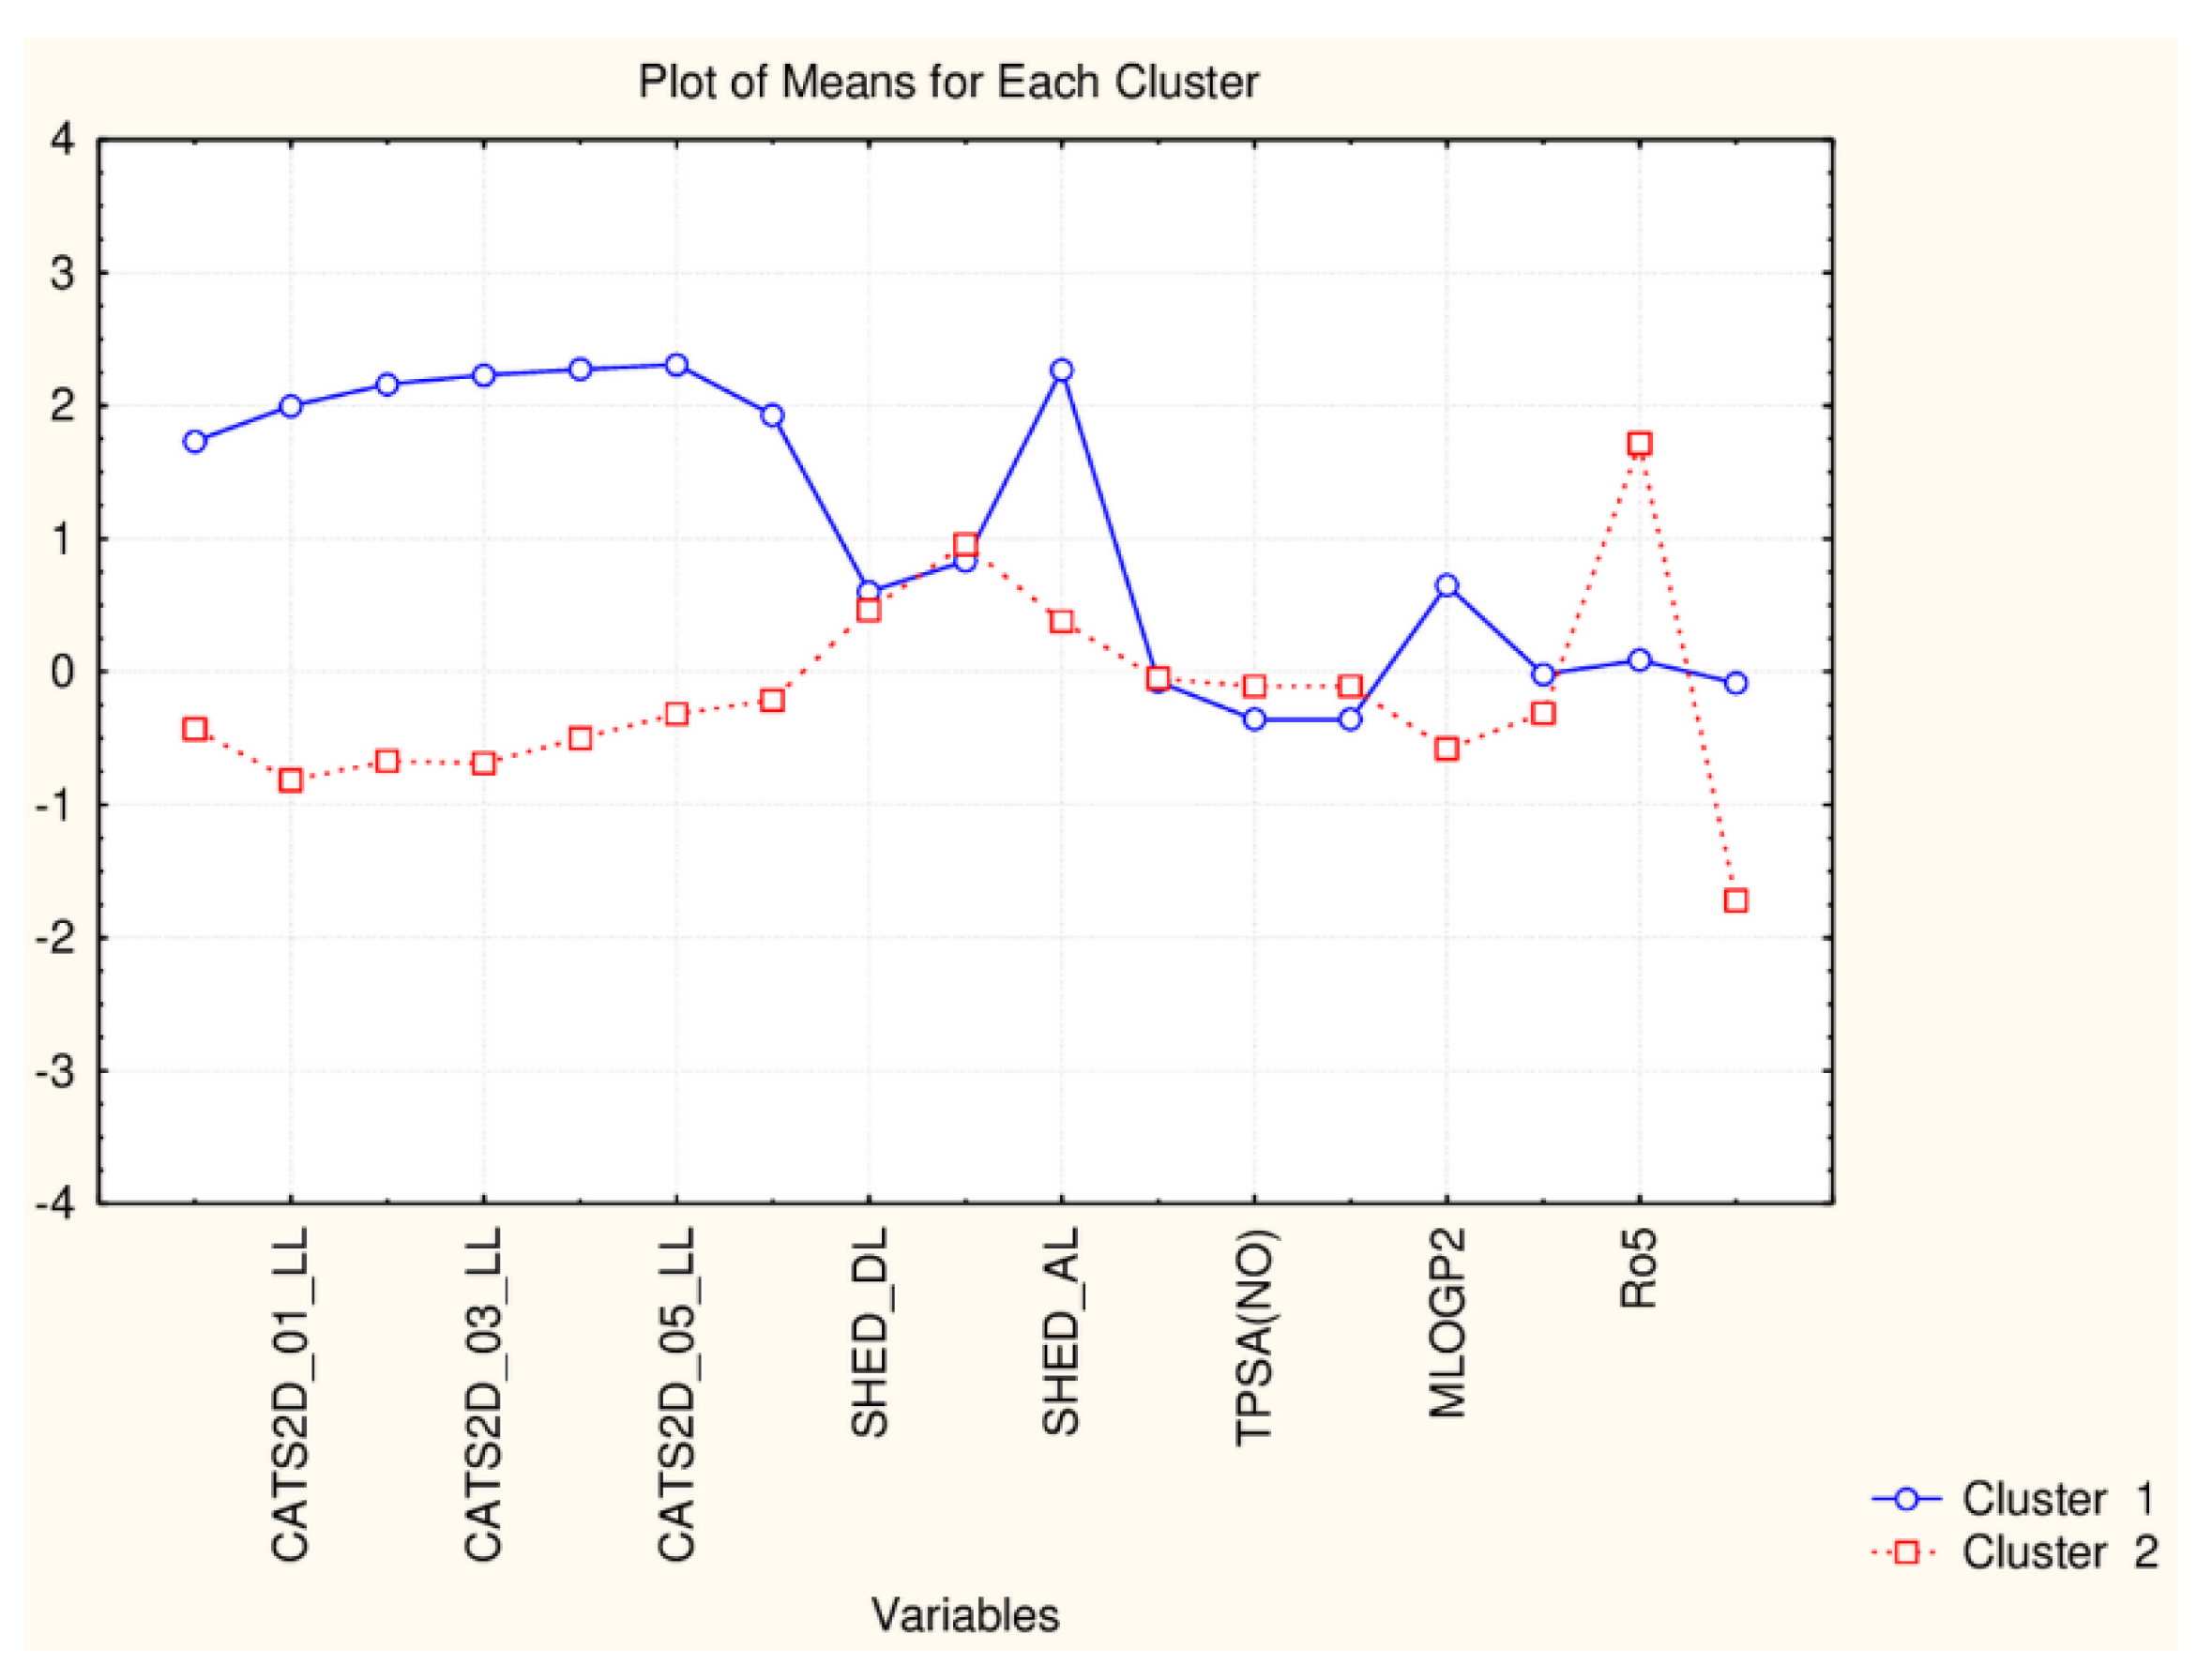
Plot of mean values (normalized) of 17 descriptors for each identified cluster of objects (blue—small cluster; red—big cluster).
Figure 3.
Plot of mean values (normalized) of 17 descriptors for each identified cluster of objects (blue—small cluster; red—big cluster).

Figure 4.
Hierarchical dendrogram for 38 flavonoids by 17 descriptors.

Figure 5.
Plot of mean values (normalized) of 17 descriptors for each identified cluster of objects (blue—C1; red—C2; green—C3).
Figure 5.
Plot of mean values (normalized) of 17 descriptors for each identified cluster of objects (blue—C1; red—C2; green—C3).

Figure 6.
Hierarchical dendrogram for 38 flavonoids by 45 descriptors.

Figure 7.
Plot of mean values (normalized) of 45 descriptors for each identified cluster of objects (blue—C1; red—C2; green—C3).
Figure 7.
Plot of mean values (normalized) of 45 descriptors for each identified cluster of objects (blue—C1; red—C2; green—C3).

Figure 8.
Hierarchical dendrogram for 17 flavonoids (45 descriptors).

Figure 9.
Plot of means of 45 descriptors (standardized values) for each of the two identified clusters of flavonoids.
Figure 9.
Plot of means of 45 descriptors (standardized values) for each of the two identified clusters of flavonoids.

Figure 10.
Plot of means of 17 descriptors (standardized values) for each of the two identified clusters of flavonoids.
Figure 10.
Plot of means of 17 descriptors (standardized values) for each of the two identified clusters of flavonoids.

Figure 11.
Hierarchical dendrogram for 17 flavonoids (17 descriptors).

Figure 12.
Hierarchical dendrogram for 22 flavonoids (45 descriptors).

Figure 13.
Plot of means of 45 descriptors (standardized values) for each of the three identified clusters of flavonoids.
Figure 13.
Plot of means of 45 descriptors (standardized values) for each of the three identified clusters of flavonoids.

Figure 14.
Hierarchical dendrogram for 22 flavonoids (17 descriptors).

Figure 15.
Plot of means of 17 descriptors (standardized values) for each of the three identified clusters of flavonoids.
Figure 15.
Plot of means of 17 descriptors (standardized values) for each of the three identified clusters of flavonoids.


Table 1.
Molecular descriptors [alvaDesc. Available online: https://chm.kode-solutions.net/products_alvadesc.php (accessed on 15 October 2020)].
Table 1.
Molecular descriptors [alvaDesc. Available online: https://chm.kode-solutions.net/products_alvadesc.php (accessed on 15 October 2020)].
| Code | Decriptors Categories | |
|---|---|---|
| CATS2D_00_LL Var 1 | Pharmacophore descriptors—Chemically Advanced Template Search—Dono-Donor at lag 00 to lag 06 (number of H bond donor atoms) | |
| CATS2D_01_LL Var 2 | ||
| CATS2D_02_LL Var 3 | ||
| CATS2D_03_LL Var 4 | ||
| CATS2D_04_LL Var 5 | ||
| CATS2D_05_LL Var 6 | ||
| CATS2D_06_LL Var 7 | ||
| SHED_DL Var 8 | Pharmacophore descriptors—Shannon Entropy Descriptors DL (donor-lipophilic; AA—(acceptor-acceptor) AL (acceptor-lipophilic) LL (lipophiloc-lipophilic) | |
| SHED_AA Var 9 | ||
| SHED_AL Var 10 | ||
| SHED_LL Var 11 | ||
| Uc Var 12 | Unsaturation count; unsaturation index; hydrophiloic factor; Wildman-Grippen molar refractivity; molar refractivity (consensus); topological polar surface area using N,O polar contributions; topological polar surface area using N,O, S, N polar contributions; Moriguchi octanol-water partition coeff. (logP); Moriguchi octanol-water partition coeff. (logP2); Wildman–Gripen octanol-water partition coeff. (logP); octanol-water partition coeff. (logP consensus); estimated solubility(LogS) for aqueous solubility; total surface area from P_VCA like descriptors; surface area of acceptor atoms from P_VCA like descriptors; surface area of donor atoms from P_VCA like descriptors; McGowan volume; Van der Waals volume from McGowan volume; Van der Waals volume from Zhao–Abraham Zissimos equation; packing density index; Synthetic accessability score | Molecular properties |
| Ui Var 13 | ||
| Hy Var 14 | ||
| MR99 Var 15 | ||
| MRcons Var 16 | ||
| TPSA(NO) Var 17 | ||
| TPSA(Tot) Var 18 | ||
| MLOGP Var 19 | ||
| MLOGP2 Var 20 | ||
| LOGP99 Var 21 | ||
| LOGPcons Var22 | ||
| ESOL Var 23 | ||
| SAtot Var 24 | ||
| SAacc Var 25 | ||
| SAdon Var 26 | ||
| Vx Var 27 | ||
| VvdwMG Var 28 | ||
| VvdwZAZ Var 29 | ||
| PDI Var 30 | ||
| SAscore Var 31 | ||
| Ro5 Var 32 | Lipinski rule of 5; Complementary Lipinski alert index; modified drug-like score from Lipinski (4 rules); modified drug-like score from Oprea (6 rules); modified drug-like score from Walters(6 rules); modified drug-like score from Chen (4 rules); modified drug-like score from Zheng (2 rules); modified drug-like score from Rishton (6 rules); modified drug-like score from Veber (2 rules); DRAGON consensus drug-like score; modified lead-like score from Congreve et al.(6 rules); modified lead-like score from Mongue et al.(8 rules); Quantitative estimation of drug-likeness (unweighted); Quantitative estimation of drug-likeness | Drug-like indices |
| cRo5 Var 33 | ||
| DLS_01 Var 34 | ||
| DLS_02 Var35 | ||
| DLS_03 Var 36 | ||
| DLS_04 Var 37 | ||
| DLS_05 Var 38 | ||
| DLS_06 Var 39 | ||
| DLS_07 Var 40 | ||
| DLS_cons Var 41 | ||
| LLS_01 Var 42 | ||
| LLS_02 Var 43 | ||
| QEDu Var 44 | ||
| QED Var 45 |
Table 2.
Contribution Descriptor Distribution for Each Cluster.
| Clusters Modes | Descriptors with Highest Levels | Descriptors with Lowest Levels |
|---|---|---|
| C2_135_45 (94) | TPSA(NO), TPSA(Tot), MLOGP, MLOGP2, LOGP99, LOGPcons, ESOL, PDI), cRo5, DLS_02, DLS_05, DLS_cons, LLS_01, LLS_02, QEDu, QED | All CATS2D and SHED, Uc, Ui, Hy. MR99, MRcons, SAtot, SAacc, Vx, Vvdw, MG, VvdwZAZ, Sascore, Ro5, DLS_01), DLS_03, DLS_04, DLS_06, DLS_07. |
| Big cluster | ||
| Sesquiterpenes | ||
| Monoterpenes | ||
| Curcuminoids | ||
| Flavonoids | ||
| C1_135_45 (41) | All CATS2D and SHED, Uc, Ui, Hy. MR99, MRcons, SAtot, SAacc, Vx, Vvdw, MG, VvdwZAZ, Sascore, Ro5, DLS_01), DLS_03, DLS_04, DLS_06, DLS_07. | TPSA(NO), TPSA(Tot), MLOGP, MLOGP2, LOGP99, LOGPcons, ESOL, PDI, cRo5, DLS_02, DLS_05, DLS_cons, LLS_01, LLS_02, QEDu, QED |
| Small cluster | ||
| Flavonoids | ||
| Triterpenes | ||
| Saponines | ||
| C2_135_17 (94) | All TPSA (2), LOPGP99, cR05 | All CATS2D (7), all SHED (4), Ro5, MLOGP |
| Big cluster | ||
| Sesquiterpenes | ||
| Monoterpenes | ||
| Curcuminoids | ||
| Flavonoids | ||
| C1_135_17 (41) | All CATS2D (7), all SHED (4), Ro5, MLOGP | All TPSA (2), LOGPGP99, cR05 |
| Small cluster | ||
| Flavonoids | ||
| Triterpenes | ||
| Saponines |
Table 3.
Partitioning of the Natural Compounds in the Formed Clusters. 1 Is for the Bigger (More Members) Cluster; 2—for the Smaller Cluster (Less Members).
Table 3.
Partitioning of the Natural Compounds in the Formed Clusters. 1 Is for the Bigger (More Members) Cluster; 2—for the Smaller Cluster (Less Members).
| Natural Compound | Classes | 45 Descriptors Clustering | 17 Descriptors Clustering |
|---|---|---|---|
| Smilagenin | saponin | 2 | 2 |
| 10′hydroxyusambarensine | alkaloid | 1 | 1 |
| Saikosaponin B2 | saponin | 2 | 2 |
| Celastrol | flavonoid | 2 | 2 |
| Amentoflavone | flavonoid | 2 | 2 |
| Epitaraxerol | flavonoid | 2 | 2 |
| Baicalein | flavonoid | 1 | 1 |
| Glycyrrhizin | flavonoid | 2 | 2 |
| Pristimerin | flavonoid | 2 | 2 |
| Chrysin | flavonoid | 1 | 1 |
| Myricetinetin_3′-Rhamnoside | flavonoid | 2 | 2 |
| Ardisia Saponin | saponin | 2 | 2 |
| Friedelin | triterpen | 2 | 2 |
| Rhoifolin | flavonoid | 2 | 2 |
| Psoralidin | flavones | 1 | 1 |
| Dihydrotanshinone | flavonoid | 1 | 1 |
| Epigallocatechin_gallate | flavonoid | 2 | 2 |
| Akebia_saponin_c | saponin | 2 | 2 |
| Gallocatechin | flavonoid | 2 | 2 |
| Myricetin_3-(4′′-Galloylrhamnoside) | flavonoid | 2 | 2 |
| Pectolinarin | flavonoid | 2 | 2 |
| Dihydrotanshinone i | flavonoid | 1 | 1 |
| Isobavachalcone | flavonoid | 1 | 1 |
| Pyranojacareubin | xanthone | 1 | 1 |
| Withanone | withanolides | 1 | 1 |
| Papyriflavonol A | flavonoid | 1 | 1 |
| Scutellarein | flavonoid | 1 | 1 |
| Quercetin | flavonoid | 1 | 1 |
| Ouabain | flavonoid | 2 | 2 |
| Ursane | Triterpenes | 2 | 2 |
| Demethoxycurcumin | curcuminoid | 1 | 1 |
| Luteolin | flavonoid | 1 | 1 |
| Monodemethylcurcumin | curcuminoid | 1 | 1 |
| Xanthoangelol | chalcone | 1 | 1 |
| Fisetin | flavonoid | 1 | 1 |
| Neobavaisoflavone | flavonoid | 1 | 1 |
| Biochanin a | phytoestrogen | 1 | 1 |
| Broussochalcone b | chalcone | 1 | 1 |
| Schimperinone | triterpene | 2 | 2 |
| Tanshinone i | diterpene | 1 | 1 |
| Tau-Cadinol | sesquiterpenoid | 1 | 1 |
| Quadrangularic acid | triterpenoid | 2 | 2 |
| 6-Oxoisoiguesterin | terpenoid | 2 | 2 |
| Isoliquiritigenin | chalcone | 1 | 1 |
| Beta-Sitosterol | phytosterol | 2 | 2 |
| Rhein | anthraquinone derivative | 1 | 1 |
| Nummularine B | alkaloid | 2 | 2 |
| Jubanine G | alkaloid | 2 | 2 |
| Genistein | flavonoid | 1 | 1 |
| Betulinic acid | triterpene | 2 | 2 |
| Tetrahydrocurcumin | curcuminoid | 1 | 1 |
| Hesperetin | flavonoid | 1 | 1 |
| Dehydroabieta-7-one | terpene | 1 | 1 |
| Iguesterin | triterpene | 2 | 2 |
| 7-Methoxycryptopleurine | alkaloid | 1 | 1 |
| Artocommunol e | flavonoids | 2 | 2 |
| Ferruginol | flavonoids | 1 | 1 |
| Tanshinone | flavonoids | 1 | 1 |
| Kaempferol | flavonoid | 1 | 1 |
| Apigenin | flavonoid | 1 | 1 |
| Tanshinone IIb | flavonoid | 1 | 1 |
| Myricetin—3- Sambubioside | flavonoid | 2 | 2 |
| Gamma-Gurjunene | terpenes | 1 | 1 |
| Ampelopsin | Stilbene | 1 | 1 |
| Allo-Aromadendrene | sesquiterpenoid | 1 | 1 |
| Sanggenol E | flavonoid | 2 | 2 |
| Ledene | sesquiterpenoid | 1 | 1 |
| Jubanine H | alkaloid | 2 | 2 |
| Formononetin | flavonoid | 1 | 1 |
| Camazulene | sesquiterpene | 1 | 1 |
| Germacrene b | sesquiterpenoid | 1 | 1 |
| Myricetin_3-Neohesperidoside | flavonoid | 2 | 2 |
| 6,7-dehydroroyleanone | terpenoid | 1 | 1 |
| Alpha-Cubebene | sesquiterpenoid | 1 | 1 |
| Kazinol F | flavonoid | 1 | 1 |
| Taxifolin | flavonoid | 1 | 1 |
| Silvestrol | flavonoid | 2 | 2 |
| Muurolene | sesquiterpenoid | 1 | 1 |
| Caryophyllene oxide | terpenoid | 1 | 1 |
| Methyl tanshinonate | tanshinone | 1 | 1 |
| Spathulenol | sesquiterpenoid | 1 | 1 |
| Guaiol | sesquiterpenoid | 1 | 1 |
| Emodin | hydroxyanthraquinone | 1 | 1 |
| Alpha-selinene | sesquiterpenoid | 1 | 1 |
| Alpha-Bisabolol | sesquiterpenoid | 1 | 1 |
| Terpinen-4-ol | monoterpenoid | 1 | 1 |
| 4-Terpinyl acetate | monoterpenoid | 1 | 1 |
| Curcumin | curcuminoid | 1 | 1 |
| Eugenol | methoxyphenol | 1 | 1 |
| Isoledene | sesquiterpene | 1 | 1 |
| APA | lectin | 1 | 1 |
| Carvacrol | monoterpene | 1 | 1 |
| Viridiflorol | sesquiterpenoid | 1 | 1 |
| Cryptojaponol | terpene | 1 | 1 |
| Blancoxanthone | pyranoxanthone | 1 | 1 |
| Limonene | monoterpene | 1 | 1 |
| Sappanchalcone | chalcones | 1 | 1 |
| Pinocarvone | prenol lipids | 1 | 1 |
| (E)-caryophyllene | terpenoids | 1 | 1 |
| Longifolen | sesquiterpene | 1 | 1 |
| 1-Cyclopentyl-2-propen-1-ol- | vinyl chloride | 1 | 1 |
| Beta-Thujone | monoterpene | 1 | 1 |
| Sabinene | monoterpene | 1 | 1 |
| Myrcene | monoterpene | 1 | 1 |
| Bicyclogermacrene | bicyclogermacrane | 1 | 1 |
| Citronellyl acetate | alcohol ester | 1 | 1 |
| Gallic acid | phenolic acid | 1 | 1 |
| Artemisia alcohol | carboxylic acid ester | 1 | 1 |
| Cis-anethole | flavonoid | 1 | 1 |
| Isopinocamphone | terpenoid | 1 | 1 |
| L-Thujone | terpene | 1 | 1 |
| Alpha-pinene | terpene | 1 | 1 |
| Anethole | flavonoid | 1 | 1 |
| (+)-artemisinic_alcohol | carboxylic acid ester | 1 | 1 |
| Artemisia_ketone | enone | 1 | 1 |
| Ascaridole | monoterpene | 1 | 1 |
| 1,8-Cineole | monoterpene | 1 | 1 |
| Piperitone | monoterpene | 1 | 1 |
| Thujene | monoterpene | 1 | 1 |
| Beta-pinene | monoterpene | 1 | 1 |
| 3-beta-Friedelanol | terpenes | 1 | 1 |
| Linalool | monoterpenoid | 1 | 1 |
| Trans-anethole | anisoles (essential oils) | 1 | 1 |
| Camphor | terpenoid ketones | 1 | 1 |
| Camphene | monoterpene | 1 | 1 |
| 12-Deoxy-6,7-Dehydroroyleanone | tricyclic diterpenoid | 1 | 1 |
| Cyclamine | saponin | 2 | 2 |
| Ginsenoside | triterpenoids | 2 | 2 |
| Ginsenoside | triterpenoids | 2 | 2 |
| Ginsenoside rb1 | triterpenoids | 2 | 2 |
| Mi-saponin A | saponin | 2 | 2 |
| Saikosaponin C | saponin | 2 | 2 |
| Saikosaponin D | saponin | 2 | 2 |
| Saponin Pk | saponin | 2 | 2 |
| Tannic acid | tannin | 2 | 2 |
Note: 1—big cluster; 2—small cluster.
Publisher’s Note: MDPI stays neutral with regard to jurisdictional claims in published maps and institutional affiliations. |
© 2021 by the authors. Licensee MDPI, Basel, Switzerland. This article is an open access article distributed under the terms and conditions of the Creative Commons Attribution (CC BY) license (http://creativecommons.org/licenses/by/4.0/).
Share and Cite
MDPI and ACS Style
Nedyalkova, M.; Simeonov, V. Partitioning Pattern of Natural Products Based on Molecular Properties Descriptors Representing Drug-Likeness. Symmetry 2021, 13, 546. https://doi.org/10.3390/sym13040546
AMA Style
Nedyalkova M, Simeonov V. Partitioning Pattern of Natural Products Based on Molecular Properties Descriptors Representing Drug-Likeness. Symmetry. 2021; 13(4):546. https://doi.org/10.3390/sym13040546
Chicago/Turabian StyleNedyalkova, Miroslava, and Vasil Simeonov. 2021. "Partitioning Pattern of Natural Products Based on Molecular Properties Descriptors Representing Drug-Likeness" Symmetry 13, no. 4: 546. https://doi.org/10.3390/sym13040546
Note that from the first issue of 2016, this journal uses article numbers instead of page numbers. See further details here.