Performance Evaluation of Machine Learning Methods for Forest Fire Modeling and Prediction

 ,
,  ,
,  ,
,  ,
,  ,
,  ,
,
Abstract
:1. Introduction
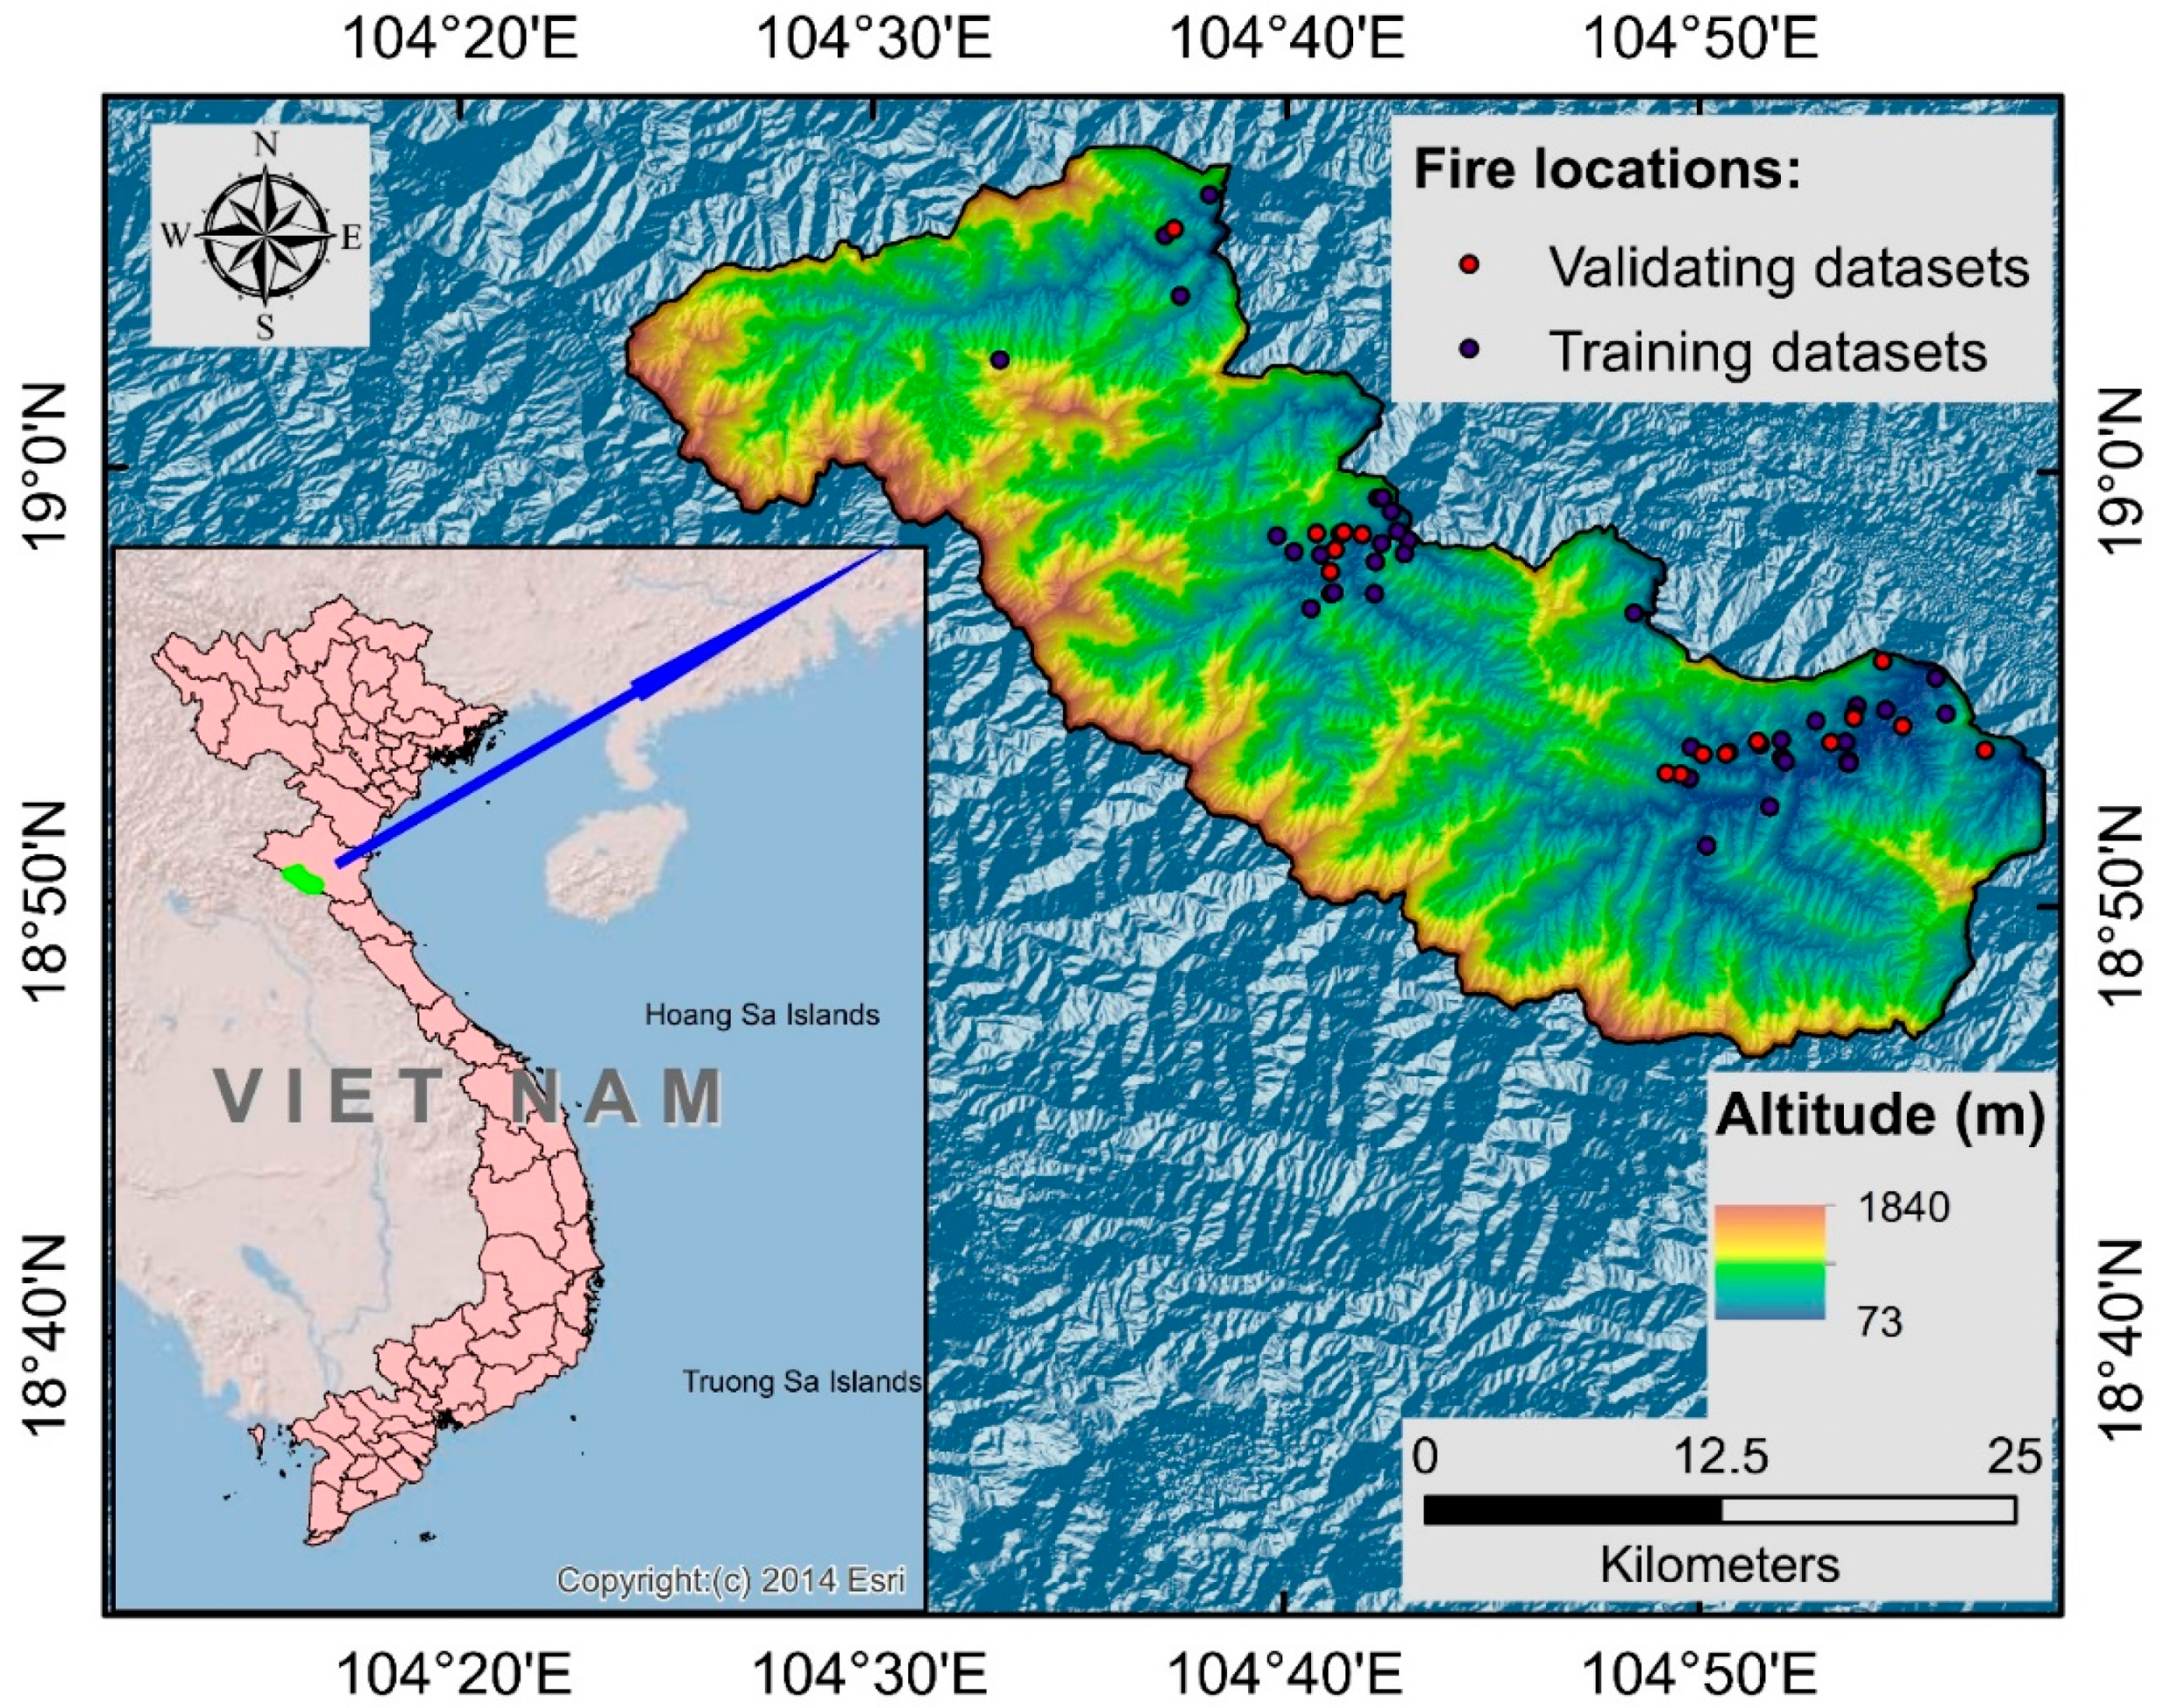
2. Study Area
3. Data Preparation
3.1. Fire Inventory Map
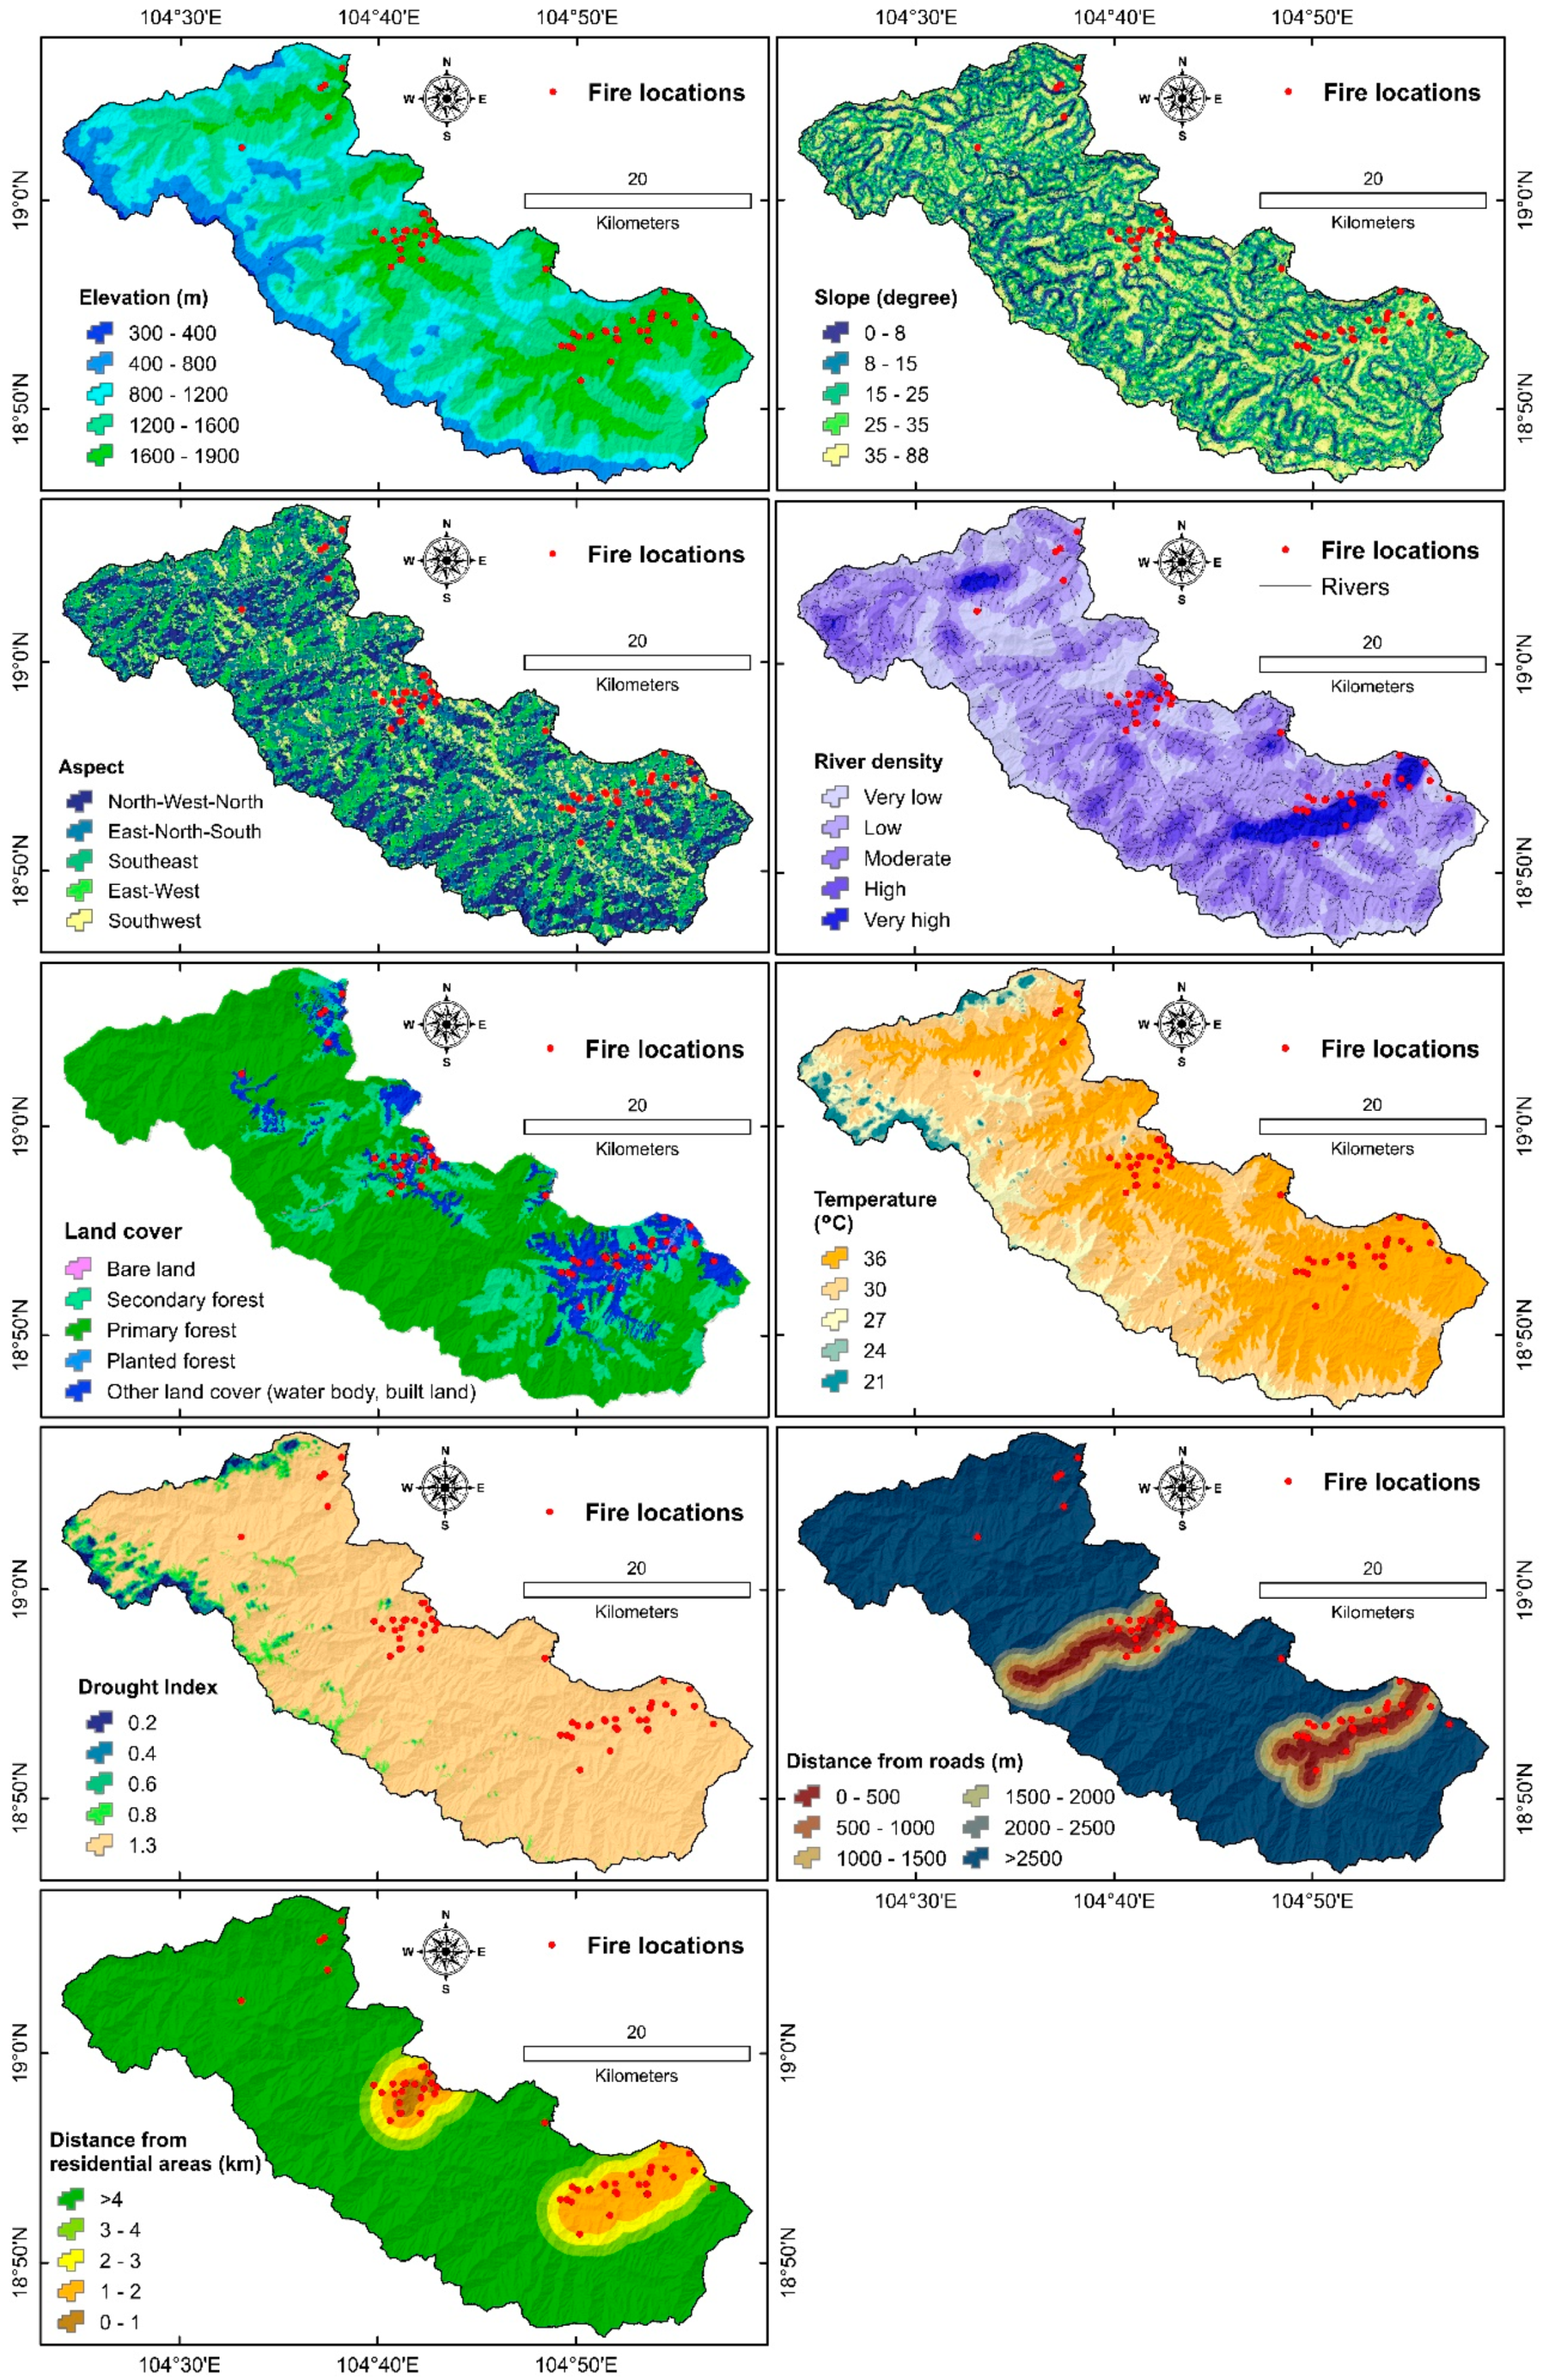
3.2. Explanatory Variables
4. Methods
4.1. Relief-F Feature Selection Method
4.2. Bayes Network (BN)
4.3. Naïve Bayes (NB)
4.4. Decision Tree (DT)
4.5. Multivariate Logistic Regression (MLR)
4.6. Validation Metrics
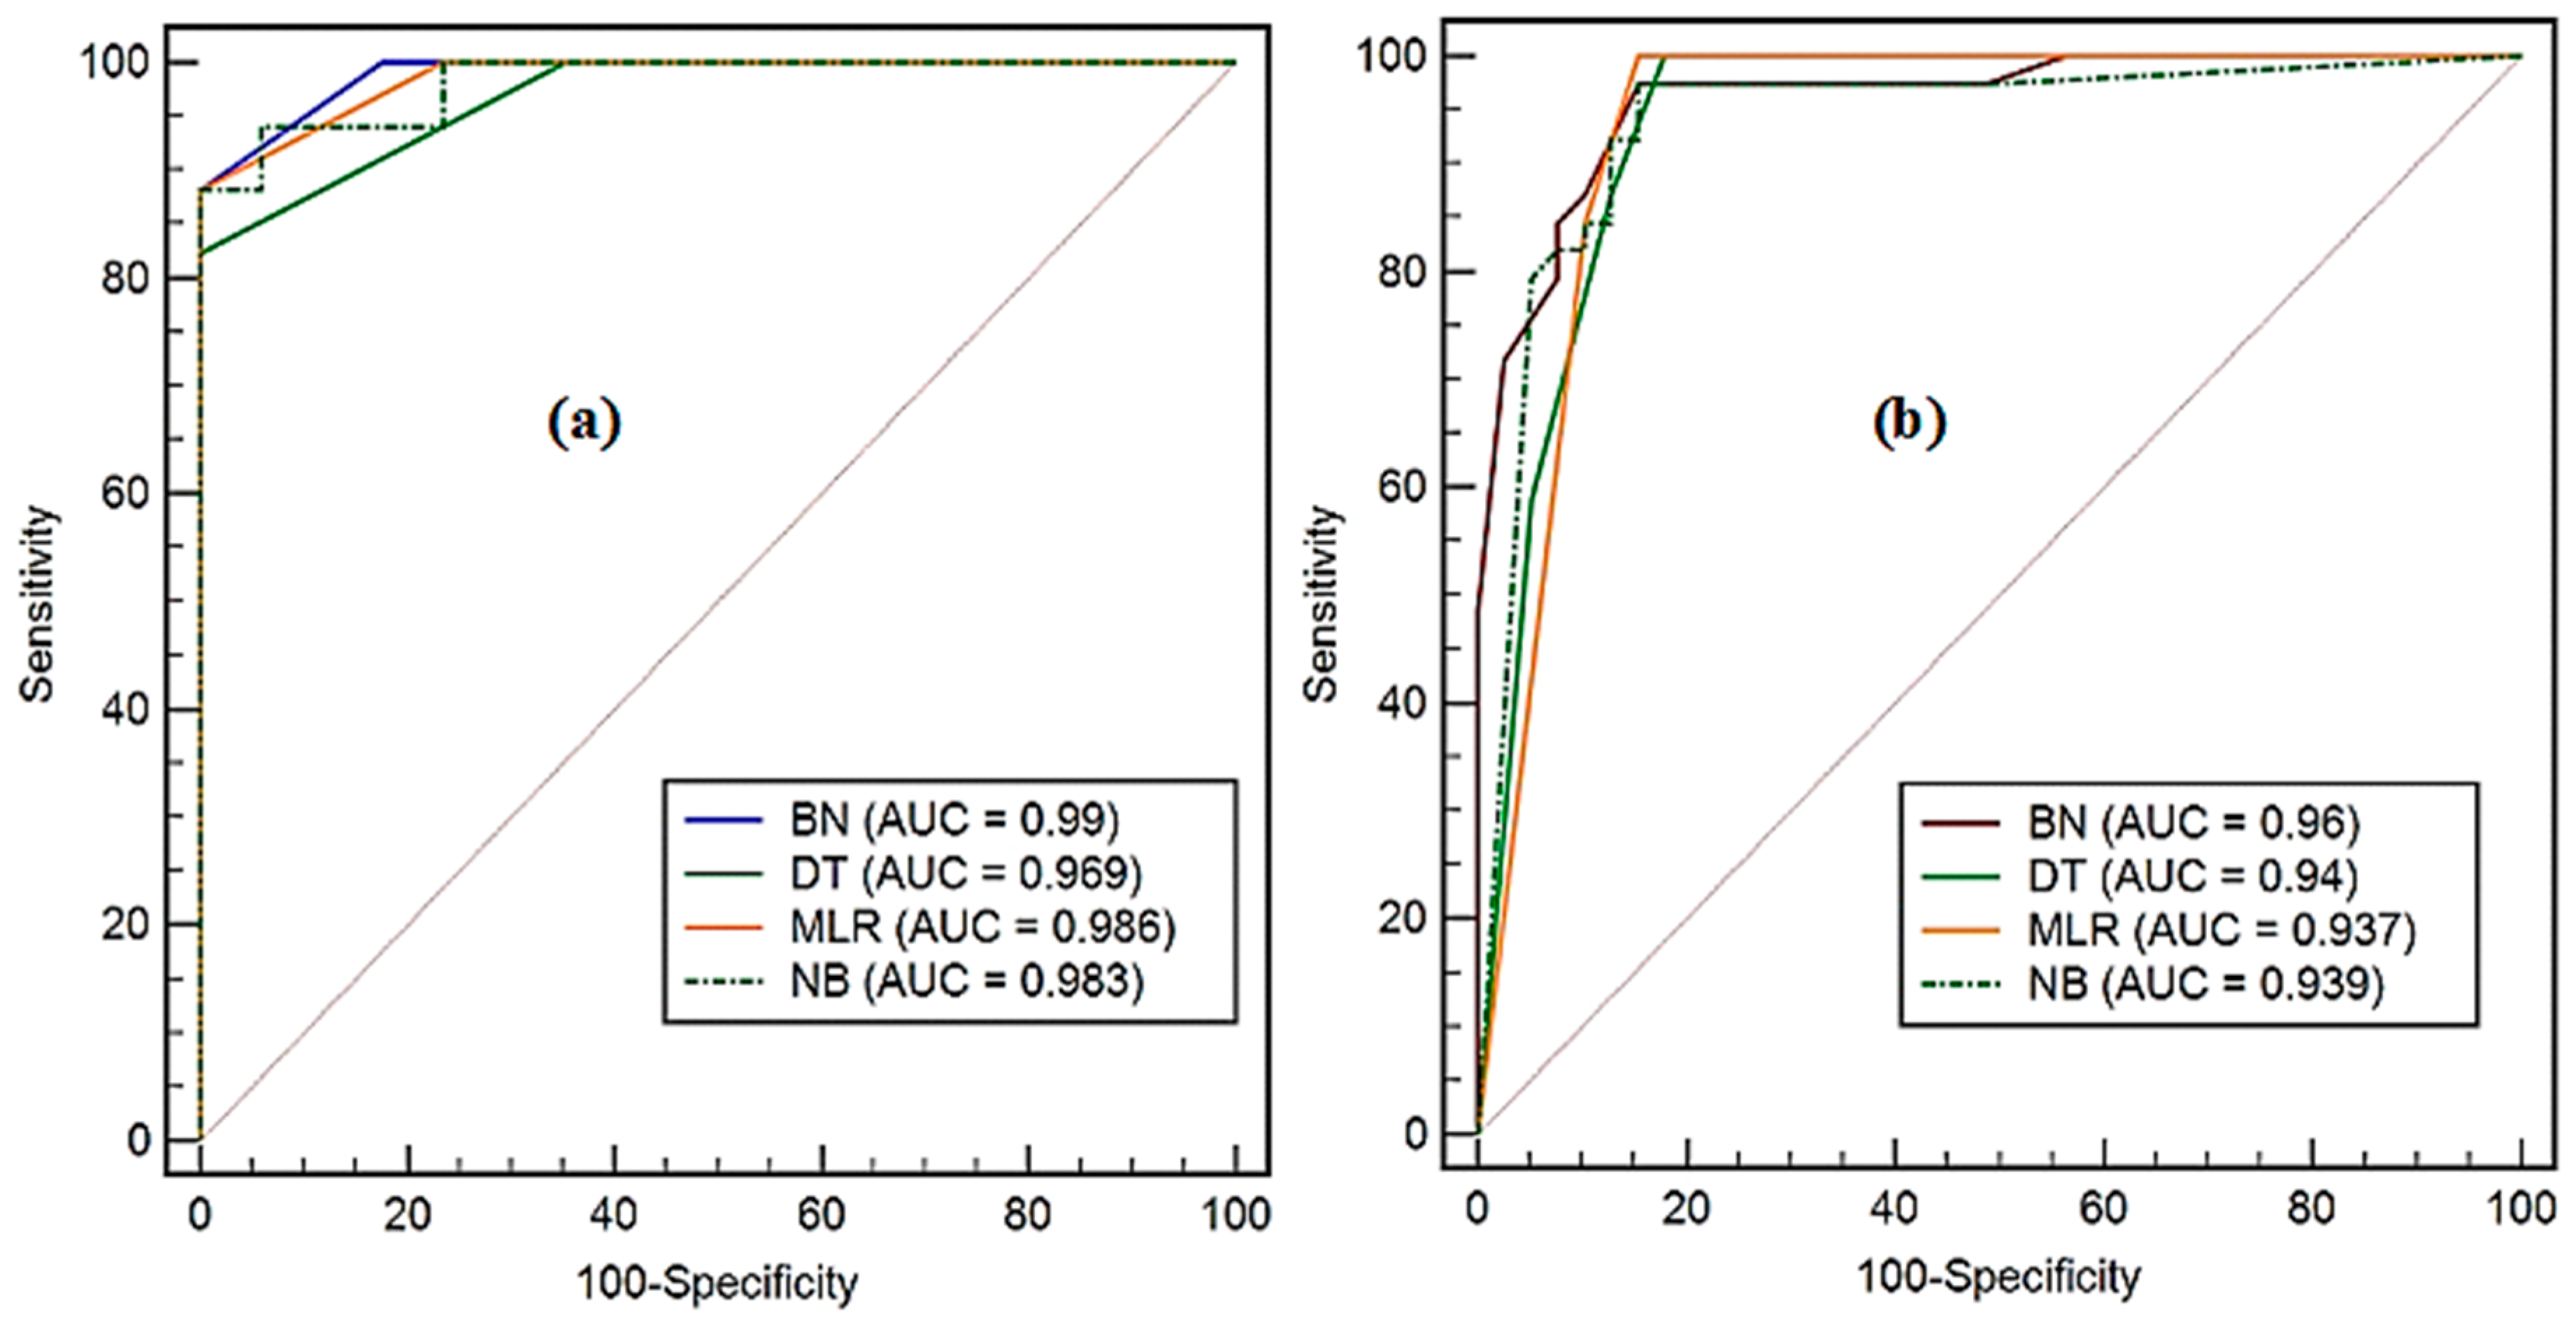
4.6.1. Receiver Operating Characteristics (ROC)
4.6.2. Statistical Metrics
5. Modeling Methodology
6. Results and Discussions
6.1. Variable Importance
6.2. Model Validation and Comparison
6.3. Robustness Analysis
6.4. Forest Fire Susceptibility Maps
7. Conclusions
Author Contributions
Funding
Acknowledgments
Conflicts of Interest
References
- Bowman, D.M.; Balch, J.K.; Artaxo, P.; Bond, W.J.; Carlson, J.M.; Cochrane, M.A.; D’Antonio, C.M.; DeFries, R.S.; Doyle, J.C.; Harrison, S.P. Fire in the Earth system. Science 2009, 324, 481–484. [Google Scholar] [CrossRef]
- Boer, M.M.; de Dios, V.R.; Bradstock, R.A. Unprecedented burn area of Australian mega forest fires. Nat. Clim. Chang. 2020, 10, 171–172. [Google Scholar] [CrossRef]
- Meng, Y.; Deng, Y.; Shi, P. Mapping forest wildfire risk of the world. In World Atlas of Natural Disaster Risk; Springer: Berlin/Heidelberg, Germany, 2015; pp. 261–275. [Google Scholar]
- Stephens, S.L.; Burrows, N.; Buyantuyev, A.; Gray, R.W.; Keane, R.E.; Kubian, R.; Liu, S.; Seijo, F.; Shu, L.; Tolhurst, K.G. Temperate and boreal forest mega-fires: Characteristics and challenges. Front. Ecol. Environ. 2014, 12, 115–122. [Google Scholar] [CrossRef] [Green Version]
- Bo, M.; Mercalli, L.; Pognant, F.; Berro, D.C.; Clerico, M. Urban air pollution, climate change and wildfires: The case study of an extended forest fire episode in northern Italy favoured by drought and warm weather conditions. Energy Rep. 2020, 6, 781–786. [Google Scholar] [CrossRef]
- Adab, H.; Atabati, A.; Oliveira, S.; Gheshlagh, A.M. Assessing fire hazard potential and its main drivers in Mazandaran province, Iran: A data-driven approach. Environ. Monit. Assess. 2018, 190, 670. [Google Scholar] [CrossRef] [PubMed]
- Rodrigues, M.; de la Riva, J. An insight into machine-learning algorithms to model human-caused wildfire occurrence. Environ. Model. Softw. 2014, 57, 192–201. [Google Scholar] [CrossRef]
- Satir, O.; Berberoglu, S.; Donmez, C. Mapping regional forest fire probability using artificial neural network model in a Mediterranean forest ecosystem. Geomat. Nat. Hazards Risk 2016, 7, 1645–1658. [Google Scholar] [CrossRef] [Green Version]
- Syphard, A.D.; Radeloff, V.C.; Keuler, N.S.; Taylor, R.S.; Hawbaker, T.J.; Stewart, S.I.; Clayton, M.K. Predicting spatial patterns of fire on a southern California landscape. Int. J. Wildland Fire 2008, 17, 602–613. [Google Scholar] [CrossRef]
- Tien Bui, D.; Le, H.V.; Hoang, N.D. GIS-based spatial prediction of tropical forest fire danger using a new hybrid machine learning method. Ecol. Inform. 2018, 48, 104–116. [Google Scholar] [CrossRef]
- Viedma, O.; Urbieta, I.; Moreno, J. Wildfires and the role of their drivers are changing over time in a large rural area of west-central Spain. Sci. Rep. 2018, 8, 17797. [Google Scholar] [CrossRef] [Green Version]
- Zhang, G.; Wang, M.; Liu, K. Forest Fire Susceptibility Modeling Using a Convolutional Neural Network for Yunnan Province of China. Int. J. Disaster Risk Sci. 2019, 10, 386–403. [Google Scholar] [CrossRef] [Green Version]
- Mendoza-Ponce, A.; Corona-Núnez, R.O.; Galicia, L.; Kraxner, F. Identifying hotspots of land use cover change under socioeconomic and climate change scenarios in Mexico. Ambio 2019, 48, 336–349. [Google Scholar] [CrossRef] [PubMed] [Green Version]
- Martinho, V.J.P.D. Socioeconomic Impacts of Forest Fires upon Portugal: An Analysis for the Agricultural and Forestry Sectors. Sustainability 2019, 11, 374. [Google Scholar] [CrossRef] [Green Version]
- Mafi-Gholami, D.; Zenner, E.K.; Jaafari, A. Mangrove regional feedback to sea level rise and drought intensity at the end of the 21st century. Ecol. Indic. 2020, 110, 105972. [Google Scholar] [CrossRef]
- Mafi-Gholami, D.; Zenner, E.K.; Jaafari, A.; Ward, R.D. Modeling multi-decadal mangrove leaf area index in response to drought along the semi-arid southern coasts of Iran. Sci. Total Environ. 2019, 656, 1326–1336. [Google Scholar] [CrossRef]
- Mafi-Gholami, D.; Zenner, E.K.; Jaafari, A.; Bakhtiari, H.R.; Tien Bui, D. Multi-hazards vulnerability assessment of southern coasts of Iran. J. Environ. Manag. 2019, 252, 109628. [Google Scholar] [CrossRef]
- Mafi-Gholami, D.; Zenner, E.K.; Jaafari, A.; Bui, D.T. Spatially explicit predictions of changes in the extent of mangroves of Iran at the end of the 21st century. Estuar. Coast. Shelf Sci. 2020, 237, 106644. [Google Scholar] [CrossRef]
- Parente, J.; Amraoui, M.; Menezes, I.; Pereira, M. Drought in Portugal: Current regime, comparison of indices and impacts on extreme wildfires. Sci. Total Environ. 2019, 685, 150–173. [Google Scholar] [CrossRef]
- Jaafari, A.; Gholami, D.M.; Zenner, E.K. A Bayesian modeling of wildfire probability in the Zagros Mountains, Iran. Ecol. Inform. 2017, 39, 32–44. [Google Scholar] [CrossRef]
- Sakellariou, S.; Tampekis, S.; Samara, F.; Flannigan, M.; Jaeger, D.; Christopoulou, O.; Sfougaris, A. Determination of fire risk to assist fire management for insular areas: The case of a small Greek island. J. For. Res. 2019, 30, 589–601. [Google Scholar] [CrossRef]
- Dennison, P.E.; Brewer, S.C.; Arnold, J.D.; Moritz, M.A. Large wildfire trends in the western United States, 1984–2011. Geophys. Res. Lett. 2014, 41, 2928–2933. [Google Scholar] [CrossRef]
- Goleiji, E.; Hosseini, S.M.; Khorasani, N.; Monavari, S.M. Forest fire risk assessment-an integrated approach based on multicriteria evaluation. Environ. Monit. Assess. 2017, 189, 612. [Google Scholar] [CrossRef] [PubMed]
- Jaafari, A.; Mafi-Gholami, D.; Pham, B.T.; Tien Bui, D. Wildfire probability mapping: Bivariate vs. multivariate statistics. Remote Sens. 2019, 11, 618. [Google Scholar] [CrossRef] [Green Version]
- Le, T.H.; Nguyen, T.N.T.; Lasko, K.; Ilavajhala, S.; Vadrevu, K.P.; Justice, C. Vegetation fires and air pollution in Vietnam. Environ. Pollut. 2014, 195, 267–275. [Google Scholar] [CrossRef] [PubMed]
- Oliveira, S.; Oehler, F.; San-Miguel-Ayanz, J.; Camia, A.; Pereira, J.M. Modeling spatial patterns of fire occurrence in Mediterranean Europe using Multiple Regression and Random Forest. For. Ecol. Manag. 2012, 275, 117–129. [Google Scholar] [CrossRef]
- Tien Bui, D.; Bui, Q.T.; Nguyen, Q.P.; Pradhan, B.; Nampak, H.; Trinh, P.T. A hybrid artificial intelligence approach using GIS-based neural-fuzzy inference system and particle swarm optimization for forest fire susceptibility modeling at a tropical area. Agric. For. Meteorol. 2017, 233, 32–44. [Google Scholar] [CrossRef]
- Tien Bui, D.; Hoang, N.D.; Samui, P. Spatial pattern analysis and prediction of forest fire using new machine learning approach of Multivariate Adaptive Regression Splines and Differential Flower Pollination optimization: A case study at Lao Cai province (Viet Nam). J. Environ. Manag. 2019, 237, 476–487. [Google Scholar] [CrossRef]
- Sevinc, V.; Kucuk, O.; Goltas, M. A Bayesian network model for prediction and analysis of possible forest fire causes. For. Ecol. Manag. 2020, 457, 117723. [Google Scholar] [CrossRef]
- Mhawej, M.; Faour, G.; Adjizian-Gerard, J. A novel method to identify likely causes of wildfire. Clim. Risk Manag. 2017, 16, 120–132. [Google Scholar] [CrossRef]
- Jaafari, A.; Zenner, E.K.; Pham, B.T. Wildfire spatial pattern analysis in the Zagros Mountains, Iran: A comparative study of decision tree based classifiers. Ecol. Inform. 2018, 43, 200–211. [Google Scholar] [CrossRef]
- Gholamnia, K.; Gudiyangada Nachappa, T.; Ghorbanzadeh, O.; Blaschke, T. Comparisons of Diverse Machine Learning Approaches for Wildfire Susceptibility Mapping. Symmetry 2020, 12, 604. [Google Scholar] [CrossRef] [Green Version]
- Thach, N.N.; Ngo, D.B.-T.; Xuan-Canh, P.; Hong-Thi, N.; Thi, B.H.; Nhat-Duc, H.; Dieu, T.B. Spatial pattern assessment of tropical forest fire danger at Thuan Chau area (Vietnam) using GIS-based advanced machine learning algorithms: A comparative study. Ecol. Inform. 2018, 46, 74–85. [Google Scholar] [CrossRef]
- Goldarag, Y.J.; Mohammadzadeh, A.; Ardakani, A. Fire risk assessment using neural network and logistic regression. J. Indian Soc. Remote Sens. 2016, 44, 885–894. [Google Scholar] [CrossRef]
- Jaafari, A.; Razavi Termeh, S.V.; Bui, D.T. Genetic and firefly metaheuristic algorithms for an optimized neuro-fuzzy prediction modeling of wildfire probability. J. Environ. Manag. 2019, 243, 358–369. [Google Scholar] [CrossRef]
- Jaafari, A.; Zenner, E.K.; Panahi, M.; Shahabi, H. Hybrid artificial intelligence models based on a neuro-fuzzy system and metaheuristic optimization algorithms for spatial prediction of wildfire probability. Agric. For. Meteorol. 2019, 266–267, 198–207. [Google Scholar] [CrossRef]
- Moayedi, H.; Mehrabi, M.; Bui, D.T.; Pradhan, B.; Foong, L.K. Fuzzy-metaheuristic ensembles for spatial assessment of forest fire susceptibility. J. Environ. Manag. 2020, 260, 109867. [Google Scholar] [CrossRef]
- Jaafari, A.; Pourghasemi, H.R. Factors Influencing Regional-Scale Wildfire Probability in Iran: An Application of Random Forest and Support Vector Machine. In Spatial Modeling in GIS and R for Earth and Environmental Sciences; Elsevier: Amsterdam, The Netherlands, 2019; pp. 607–619. [Google Scholar]
- Vilar, L.; Woolford, D.G.; Martell, D.L.; Martín, M.P. A model for predicting human-caused wildfire occurrence in the region of Madrid, Spain. Int. J. Wildland Fire 2010, 19, 325–337. [Google Scholar] [CrossRef]
- Tehrany, M.S.; Jones, S.; Shabani, F.; Martínez-Álvarez, F.; Tien Bui, D. A novel ensemble modeling approach for the spatial prediction of tropical forest fire susceptibility using LogitBoost machine learning classifier and multi-source geospatial data. Theor. Appl. Climatol. 2019, 137, 637–653. [Google Scholar] [CrossRef]
- Pham, B.T.; Prakash, I.; Khosravi, K.; Chapi, K.; Trinh, P.T.; Ngo, T.Q.; Hosseini, S.V.; Bui, D.T. A comparison of Support Vector Machines and Bayesian algorithms for landslide susceptibility modelling. Geocarto Int. 2018. [Google Scholar] [CrossRef]
- Pham, B.T.; Bui, D.; Prakash, I.; Dholakia, M.B. Evaluation of predictive ability of support vector machines and naive Bayes trees methods for spatial prediction of landslides in Uttarakhand state (India) using GIS. J. Geomat. 2016, 10, 71–79. [Google Scholar]
- Taheri, K.; Shahabi, H.; Chapi, K.; Shirzadi, A.; Gutiérrez, F.; Khosravi, K. Sinkhole susceptibility mapping: A comparison between Bayes-based machine learning algorithms. Land Degrad. Dev. 2019, 30, 730–745. [Google Scholar] [CrossRef]
- Chen, W.; Zhang, S.; Li, R.; Shahabi, H. Performance evaluation of the GIS-based data mining techniques of best-first decision tree, random forest, and naïve Bayes tree for landslide susceptibility modeling. Sci. Total Environ. 2018, 644, 1006–1018. [Google Scholar] [CrossRef] [PubMed]
- Wu, Z.; Shen, Y.; Wang, H.; Wu, M. Assessing urban flood disaster risk using Bayesian network model and GIS applications. Geomat. Nat. Hazards Risk 2019, 10, 2163–2184. [Google Scholar] [CrossRef] [Green Version]
- Vetrita, Y.; Cochrane, M.A. Fire Frequency and Related Land-Use and Land-Cover Changes in Indonesia’s Peatlands. Remote Sens. 2020, 12, 5. [Google Scholar] [CrossRef] [Green Version]
- Hong, H.; Jaafari, A.; Zenner, E.K. Predicting spatial patterns of wildfire susceptibility in the Huichang County, China: An integrated model to analysis of landscape indicators. Ecol. Indic. 2019, 101, 878–891. [Google Scholar] [CrossRef]
- Nami, M.H.; Jaafari, A.; Fallah, M.; Nabiuni, S. Spatial prediction of wildfire probability in the Hyrcanian ecoregion using evidential belief function model and GIS. Int. J. Environ. Sci. Technol. 2018, 15, 373–384. [Google Scholar] [CrossRef]
- Chuvieco, E.; Cocero, D.; Riaño, D.; Martin, P.; Martínez-Vega, J.; de la Riva, J.; Pérez, F. Combining NDVI and surface temperature for the estimation of live fuel moisture content in forest fire danger rating. Remote Sens. Environ. 2004, 92, 322–331. [Google Scholar] [CrossRef]
- Dimitrakopoulos, A.; Papaioannou, K.K. Flammability assessment of Mediterranean forest fuels. Fire Technol. 2001, 37, 143–152. [Google Scholar] [CrossRef]
- Aragão, L.E.; Anderson, L.O.; Fonseca, M.G.; Rosan, T.M.; Vedovato, L.B.; Wagner, F.H.; Silva, C.V.; Junior, C.H.S.; Arai, E.; Aguiar, A.P. 21st Century drought-related fires counteract the decline of Amazon deforestation carbon emissions. Nat. Commun. 2018, 9, 1–12. [Google Scholar] [CrossRef]
- Karnieli, A.; Agam, N.; Pinker, R.T.; Anderson, M.; Imhoff, M.L.; Gutman, G.G.; Panov, N.; Goldberg, A. Use of NDVI and land surface temperature for drought assessment: Merits and limitations. J. Clim. 2010, 23, 618–633. [Google Scholar] [CrossRef]
- Rodrigues, M.; Jiménez-Ruano, A.; Peña-Angulo, D.; de la Riva, J. A comprehensive spatial-temporal analysis of driving factors of human-caused wildfires in Spain using geographically weighted logistic regression. J. Environ. Manag. 2018, 225, 177–192. [Google Scholar] [CrossRef] [PubMed] [Green Version]
- Parisien, M.-A.; Miller, C.; Parks, S.A.; DeLancey, E.R.; Robinne, F.-N.; Flannigan, M.D. The spatially varying influence of humans on fire probability in North America. Environ. Res. Lett. 2016, 11, 075005. [Google Scholar] [CrossRef] [Green Version]
- Ricotta, C.; Di Vito, S. Modeling the landscape drivers of fire recurrence in Sardinia (Italy). Environ. Manag. 2014, 53, 1077–1084. [Google Scholar] [CrossRef] [PubMed]
- Elia, M.; Giannico, V.; Spano, G.; Lafortezza, R.; Sanesi, G. Likelihood and frequency of recurrent fire ignitions in highly urbanised Mediterranean landscapes. Int. J. Wildland Fire 2020, 29, 120–131. [Google Scholar] [CrossRef]
- Kira, K.; Rendell, L.A. A practical approach to feature selection. In Machine Learning Proceedings 1992; Elsevier: Amsterdam, The Netherlands, 1992; pp. 249–256. [Google Scholar]
- Kononenko, I. Estimating attributes: Analysis and extensions of RELIEF. In Proceedings of the European Conference on Machine Learning, Catania, Italy, 25–27 April 1995; pp. 171–182. [Google Scholar]
- Dao, D.V.; Jaafari, A.; Bayat, M.; Mafi-Gholami, D.; Qi, C.; Moayedi, H.; Phong, T.V.; Ly, H.-B.; Le, T.-T.; Trinh, P.T.; et al. A spatially explicit deep learning neural network model for the prediction of landslide susceptibility. CATENA 2020, 188, 104451. [Google Scholar] [CrossRef]
- Friedman, N.; Geiger, D.; Goldszmidt, M. Bayesian network classifiers. Mach. Learn. 1997, 29, 131–163. [Google Scholar] [CrossRef] [Green Version]
- Cheng, J.; Greiner, R. Comparing Bayesian network classifiers. In Proceedings of the Fifteenth Conference on Uncertainty in Artificial Intelligence, San Francisco, CA, USA, 30 July–1 August 1999; pp. 101–108. [Google Scholar]
- Davies, P. Bayesian Decision Networks for Management of High Conservation Assets (National Water Initiative–Australian Government Water Fund; Report 6/6 Report to the Conservation of Freshwater Ecosystem Values Project; Water Resources Division, Department of Primary Industries and Water: Hobart, Australia, 2007.
- Pham, B.T.; Pradhan, B.; Tien Bui, D.; Prakash, I.; Dholakia, M.B. A comparative study of different machine learning methods for landslide susceptibility assessment: A case study of Uttarakhand area (India). Environ. Model. Softw. 2016, 84, 240–250. [Google Scholar] [CrossRef]
- Pham, B.T.; Prakash, I.; Jaafari, A.; Bui, D.T. Spatial Prediction of Rainfall-Induced Landslides Using Aggregating One-Dependence Estimators Classifier. J. Indian Soc. Remote Sens. 2018, 46, 1457–1470. [Google Scholar] [CrossRef]
- Debeljak, M.; Džeroski, S. Decision trees in ecological modelling. In Modelling Complex Ecological Dynamics; Springer: Berlin/Heidelberg, Germany, 2011; pp. 197–209. [Google Scholar]
- Wang, Y.; Witten, I.; van Someren, M.; Widmer, G. Inducing models trees for continuous classes. In Proceedings of the Poster Papers of the European Conference on Machine Learning, Department of Computer Science, University of Waikato, Hamilton, New Zealand, 1997. [Google Scholar]
- Nguyen, P.T.; Ha, D.H.; Jaafari, A.; Nguyen, H.D.; Van Phong, T.; Al-Ansari, N.; Prakash, I.; Le, H.V.; Pham, B.T. Groundwater Potential Mapping Combining Artificial Neural Network and Real AdaBoost Ensemble Technique: The DakNong Province Case-study, Vietnam. Int. J. Environ. Res. Public Health 2020, 17, 2473. [Google Scholar] [CrossRef] [Green Version]
- Nguyen, P.T.; Ha, D.H.; Avand, M.; Jaafari, A.; Nguyen, H.D.; Al-Ansari, N.; Phong, T.V.; Sharma, R.; Kumar, R.; Le, H.V.; et al. Soft Computing Ensemble Models Based on Logistic Regression for Groundwater Potential Mapping. Appl. Sci. 2020, 10, 2469. [Google Scholar] [CrossRef] [Green Version]
- Jaafari, A. LiDAR-supported prediction of slope failures using an integrated ensemble weights-of-evidence and analytical hierarchy process. Environ. Earth Sci. 2018, 77, 42. [Google Scholar] [CrossRef]
- Janizadeh, S.; Avand, M.; Jaafari, A.; Phong, T.V.; Bayat, M.; Ahmadisharaf, E.; Prakash, I.; Pham, B.T.; Lee, S. Prediction Success of Machine Learning Methods for Flash Flood Susceptibility Mapping in the Tafresh Watershed, Iran. Sustainability 2019, 11, 5426. [Google Scholar] [CrossRef] [Green Version]
- Chen, W.; Hong, H.; Panahi, M.; Shahabi, H.; Wang, Y.; Shirzadi, A.; Pirasteh, S.; Alesheikh, A.A.; Khosravi, K.; Panahi, S.; et al. Spatial Prediction of Landslide Susceptibility Using GIS-Based Data Mining Techniques of ANFIS with Whale Optimization Algorithm (WOA) and Grey Wolf Optimizer (GWO). Appl. Sci. 2019, 9, 3755. [Google Scholar] [CrossRef] [Green Version]
- Avand, M.; Janizadeh, S.; Tien Bui, D.; Pham, V.H.; Ngo, P.T.T.; Nhu, V.-H. A tree-based intelligence ensemble approach for spatial prediction of potential groundwater. Int. J. Digit. Earth 2020, 1–22. [Google Scholar] [CrossRef]
- Hosmer, D.W., Jr.; Lemeshow, S.; Sturdivant, R.X. Applied Logistic Regression; John Wiley & Sons: Hoboken, NJ, USA, 2013; Volume 398. [Google Scholar]
- Caruana, R.; Niculescu-Mizil, A. Data mining in metric space: An empirical analysis of supervised learning performance criteria. In Proceedings of the Tenth ACM SIGKDD International Conference on Knowledge Discovery and Data Mining, Seattle, WC, USA, 22–25 August 2004; pp. 69–78. [Google Scholar]
- Lavesson, N.; Davidsson, P. Generic methods for multi-criteria evaluation. In Proceedings of the 2008 SIAM International Conference on Data Mining, Atlanta, GA, USA, 24–26 April 2008; pp. 541–546. [Google Scholar]
- Nhu, V.-H.; Shirzadi, A.; Shahabi, H.; Chen, W.; Clague, J.J.; Geertsema, M.; Jaafari, A.; Avand, M.; Miraki, S.; Asl, D.T. Shallow Landslide Susceptibility Mapping by Random Forest Base Classifier and its Ensembles in a Semi-Arid Region of Iran. Forests 2020, 11, 421. [Google Scholar] [CrossRef] [Green Version]
- Nhu, V.-H.; Janizadeh, S.; Avand, M.; Chen, W.; Farzin, M.; Omidvar, E.; Shirzadi, A.; Shahabi, H.; Clague, J.J.; Jaafari, A.; et al. GIS-Based Gully Erosion Susceptibility Mapping: A Comparison of Computational Ensemble Data Mining Models. Appl. Sci. 2020, 10, 2039. [Google Scholar] [CrossRef] [Green Version]
- Bui, D.T.; Moayedi, H.; Gör, M.; Jaafari, A.; Foong, L.K. Predicting slope stability failure through machine learning paradigms. Isprs Int. J. Geo Inf. 2019, 8, 395. [Google Scholar] [CrossRef] [Green Version]
- Rahmati, O.; Panahi, M.; Ghiasi, S.S.; Deo, R.C.; Tiefenbacher, J.P.; Pradhan, B.; Jahani, A.; Goshtasb, H.; Kornejady, A.; Shahabi, H.; et al. Hybridized neural fuzzy ensembles for dust source modeling and prediction. Atmos. Environ. 2020, 224, 117320. [Google Scholar] [CrossRef]
- Falah, F.; Ghorbani Nejad, S.; Rahmati, O.; Daneshfar, M.; Zeinivand, H. Applicability of generalized additive model in groundwater potential modelling and comparison its performance by bivariate statistical methods. Geocarto Int. 2017, 32, 1069–1089. [Google Scholar] [CrossRef]
- Rahmati, O.; Melesse, A.M. Application of Dempster–Shafer theory, spatial analysis and remote sensing for groundwater potentiality and nitrate pollution analysis in the semi-arid region of Khuzestan, Iran. Sci. Total Environ. 2016, 568, 1110–1123. [Google Scholar] [CrossRef]
- Rahmati, O.; Haghizadeh, A.; Stefanidis, S. Assessing the Accuracy of GIS-Based Analytical Hierarchy Process for Watershed Prioritization; Gorganrood River Basin, Iran. Water Resour. Manag. 2016, 30, 1131–1150. [Google Scholar] [CrossRef]
- Pham, B.T.; Jaafari, A.; Prakash, I.; Singh, S.K.; Quoc, N.K.; Bui, D.T. Hybrid computational intelligence models for groundwater potential mapping. Catena 2019, 182. [Google Scholar] [CrossRef]
- Bui, D.T.; Khosravi, K.; Tiefenbacher, J.; Nguyen, H.; Kazakis, N. Improving prediction of water quality indices using novel hybrid machine-learning algorithms. Sci. Total Environ. 2020, 721, 137612. [Google Scholar] [CrossRef] [PubMed]
- Rahmati, O.; Panahi, M.; Kalantari, Z.; Soltani, E.; Falah, F.; Dayal, K.S.; Mohammadi, F.; Deo, R.C.; Tiefenbacher, J.; Tien Bui, D. Capability and robustness of novel hybridized models used for drought hazard modeling in southeast Queensland, Australia. Sci. Total Environ. 2019. [Google Scholar] [CrossRef] [PubMed]
- Tien Bui, D.; Le, K.-T.T.; Nguyen, V.C.; Le, H.D.; Revhaug, I. Tropical forest fire susceptibility mapping at the Cat Ba National Park Area, Hai Phong City, Vietnam, using GIS-based kernel logistic regression. Remote Sens. 2016, 8, 347. [Google Scholar] [CrossRef] [Green Version]
- Massada, A.B.; Syphard, A.D.; Stewart, S.I.; Radeloff, V.C. Wildfire ignition-distribution modelling: A comparative study in the Huron–Manistee National Forest, Michigan, USA. Int. J. Wildland Fire 2013, 22, 174–183. [Google Scholar] [CrossRef]
- Gralewicz, N.J.; Nelson, T.A.; Wulder, M.A. Factors influencing national scale wildfire susceptibility in Canada. For. Ecol. Manag. 2012, 265, 20–29. [Google Scholar] [CrossRef]
- Kocher, S.D.; Butsic, V. Governance of land use planning to reduce fire risk to homes Mediterranean France and California. Land 2017, 6, 24. [Google Scholar] [CrossRef] [Green Version]
- Baeza, M.; De Luıs, M.; Raventós, J.; Escarré, A. Factors influencing fire behaviour in shrublands of different stand ages and the implications for using prescribed burning to reduce wildfire risk. J. Environ. Manag. 2002, 65, 199–208. [Google Scholar] [CrossRef] [PubMed]
- Nunes, M.C.; Vasconcelos, M.J.; Pereira, J.M.; Dasgupta, N.; Alldredge, R.J.; Rego, F.C. Land cover type and fire in Portugal: Do fires burn land cover selectively? Landsc. Ecol. 2005, 20, 661–673. [Google Scholar] [CrossRef]
- Bayat, M.; Ghorbanpour, M.; Zare, R.; Jaafari, A.; Thai Pham, B. Application of artificial neural networks for predicting tree survival and mortality in the Hyrcanian forest of Iran. Comput. Electron. Agric. 2019, 164. [Google Scholar] [CrossRef]
- McCune, B.; Grace, J.B.; Urban, D.L. Analysis of Ecological Communities; MjM Software Design: Gleneden Beach, OR, USA, 2002; Volume 28. [Google Scholar]
- De Vasconcelos, M.P.; Silva, S.; Tome, M.; Alvim, M.; Pereira, J.C. Spatial prediction of fire ignition probabilities: Comparing logistic regression and neural networks. Photogramm. Eng. Remote Sens. 2001, 67, 73–81. [Google Scholar]
- Jaafari, A.; Panahi, M.; Pham, B.T.; Shahabi, H.; Bui, D.T.; Rezaie, F.; Lee, S. Meta optimization of an adaptive neuro-fuzzy inference system with grey wolf optimizer and biogeography-based optimization algorithms for spatial prediction of landslide susceptibility. Catena 2019, 175, 430–445. [Google Scholar] [CrossRef]
- Zhao, X.; Gong, M.; Zuo, X.; Pan, L. Guest Editorial: Advances in Bio-inspired Heuristics for Computing. Caai Trans. Intell. Technol. 2019, 4, 127–128. [Google Scholar] [CrossRef]
- Sakai, H.; Nakata, M.; Wu, W.-Z.; Miao, D.; Wang, G. Guest Editorial: Rough Sets and Data Mining. Caai Trans. Intell. Technol. 2019, 4, 201–202. [Google Scholar] [CrossRef]
- Wei, X.; Larsen, C.P.S. Methods to Detect Edge Effected Reductions in Fire Frequency in Simulated Forest Landscapes. ISPRS Int. J. Geo Inf. 2019, 8, 277. [Google Scholar] [CrossRef] [Green Version]
- Parkins, K.; York, A.; Di Stefano, J. Edge effects in fire-prone landscapes: Ecological importance and implications for fauna. Ecol. Evol. 2018, 8, 5937–5948. [Google Scholar] [CrossRef]


| Variable | Source | Scale | Access Date |
|---|---|---|---|
| Slope degree | USGS DEM | 30 × 30 m | 2015 |
| Elevation (m) | USGS DEM | 30 × 30 m | 2015 |
| Aspect | USGS DEM | 30 × 30 m | 2015 |
| River density | USGS DEM | 30 × 30 m | 2015 |
| Land cover | Landsat ETM+ | 30 × 30 m | 2016 |
| Annual temperature (°C) | VMO | - | 2016 |
| Drought index | NDVI and LST | 30 × 30 m | 2016 |
| Distance from roads (m) | NCGFV and GEI | 1:100,000 | 2015 |
| Distance from residential areas (m) | NCGFV and GEI | 1:100,000 | 2015 |
| Rank | Variable | AM |
|---|---|---|
| 1 | Distance from roads | 85.9 |
| 2 | Distance from residential areas | 83.4 |
| 3 | Land cover | 79.5 |
| 4 | Elevation | 74.4 |
| 5 | Annual temperature | 71.8 |
| 6 | Aspect | 56.5 |
| 7 | River density | 55.1 |
| 8 | Slope degree | 53.8 |
| 9 | Drought index | 48.7 |
| Metric | Training Dataset | Validation Dataset | ||||||
|---|---|---|---|---|---|---|---|---|
| BN | DT | MLR | NB | BN | DT | MLR | NB | |
| PPV (%) | 89.74 | 82.05 | 84.62 | 87.18 | 100.00 | 64.71 | 76.47 | 94.12 |
| NPV (%) | 87.18 | 100.00 | 100.00 | 87.18 | 88.24 | 100.00 | 100.00 | 94.12 |
| SST (%) | 87.50 | 100.00 | 100.00 | 87.18 | 89.47 | 100.00 | 100.00 | 94.12 |
| SPF (%) | 89.47 | 84.78 | 86.67 | 87.18 | 100.00 | 73.91 | 80.95 | 94.12 |
| ACC (%) | 88.46 | 91.03 | 92.31 | 87.18 | 94.12 | 82.35 | 88.24 | 94.12 |
| Kappa | 0.769 | 0.821 | 0.846 | 0.744 | 0.884 | 0.647 | 0.765 | 0.882 |
| Model | Phase | Metric | Fold | Mean | SD | ||||
|---|---|---|---|---|---|---|---|---|---|
| 1 | 2 | 3 | 4 | 5 | |||||
| BN | Training | ACC | 88.46 | 87.18 | 87.18 | 87.18 | 87.18 | 87.44 | 0.57 |
| RMSE | 0.279 | 0.287 | 0.285 | 0.299 | 0.301 | 0.29 | 0.01 | ||
| AUC | 0.99 | 0.984 | 0.98 | 0.98 | 0.98 | 0.98 | 0.00 | ||
| Validation | ACC | 100 | 99.88 | 99.88 | 99.88 | 99.85 | 99.90 | 0.06 | |
| RMSE | 0.192 | 0.31 | 0.291 | 0.296 | 0.286 | 0.28 | 0.05 | ||
| AUC | 0.96 | 0.954 | 0.965 | 0.941 | 0.956 | 0.96 | 0.01 | ||
| DT | Training | ACC | 91.03 | 89.99 | 90.87 | 89.62 | 89.9 | 90.28 | 0.63 |
| RMSE | 0.272 | 0.306 | 0.267 | 0.325 | 0.321 | 0.30 | 0.03 | ||
| AUC | 0.969 | 0.953 | 0.958 | 0.947 | 0.949 | 0.96 | 0.01 | ||
| Validation | ACC | 94.12 | 94.12 | 93.18 | 93.01 | 93.18 | 93.52 | 0.55 | |
| RMSE | 0.306 | 0.307 | 0.296 | 0.302 | 0.298 | 0.30 | 0.00 | ||
| AUC | 0.94 | 0.94 | 0.94 | 0.934 | 0.94 | 0.94 | 0.00 | ||
| MLR | Training | ACC | 92.31 | 91.9 | 92.9 | 89.9 | 89.18 | 91.24 | 1.61 |
| RMSE | 0.255 | 0.35 | 0.344 | 0.352 | 0.34 | 0.33 | 0.04 | ||
| AUC | 0.986 | 0.96 | 0.97 | 0.974 | 0.959 | 0.97 | 0.01 | ||
| Validation | ACC | 88.24 | 87.06 | 90.18 | 88.14 | 88.14 | 88.35 | 1.13 | |
| RMSE | 0.274 | 0.203 | 0.295 | 0.306 | 0.299 | 0.28 | 0.04 | ||
| AUC | 0.937 | 0.935 | 0.93 | 0.933 | 0.938 | 0.93 | 0.00 | ||
| NB | Training | ACC | 87.18 | 87.18 | 87.18 | 87.18 | 87.18 | 87.18 | 0.00 |
| RMSE | 0.339 | 0.339 | 0.335 | 0.351 | 0.347 | 0.34 | 0.01 | ||
| AUC | 0.983 | 0.983 | 0.979 | 0.979 | 0.979 | 0.98 | 0.00 | ||
| Validation | ACC | 94.12 | 93.18 | 93.24 | 93.18 | 93.18 | 93.38 | 0.41 | |
| RMSE | 0.274 | 0.299 | 0.315 | 0.297 | 0.256 | 0.29 | 0.02 | ||
| AUC | 0.939 | 0.937 | 0.932 | 0.933 | 0.932 | 0.93 | 0.00 | ||
© 2020 by the authors. Licensee MDPI, Basel, Switzerland. This article is an open access article distributed under the terms and conditions of the Creative Commons Attribution (CC BY) license (http://creativecommons.org/licenses/by/4.0/).
Share and Cite
Pham, B.T.; Jaafari, A.; Avand, M.; Al-Ansari, N.; Dinh Du, T.; Yen, H.P.H.; Phong, T.V.; Nguyen, D.H.; Le, H.V.; Mafi-Gholami, D.; et al. Performance Evaluation of Machine Learning Methods for Forest Fire Modeling and Prediction. Symmetry 2020, 12, 1022. https://doi.org/10.3390/sym12061022
Pham BT, Jaafari A, Avand M, Al-Ansari N, Dinh Du T, Yen HPH, Phong TV, Nguyen DH, Le HV, Mafi-Gholami D, et al. Performance Evaluation of Machine Learning Methods for Forest Fire Modeling and Prediction. Symmetry. 2020; 12(6):1022. https://doi.org/10.3390/sym12061022
Chicago/Turabian StylePham, Binh Thai, Abolfazl Jaafari, Mohammadtaghi Avand, Nadhir Al-Ansari, Tran Dinh Du, Hoang Phan Hai Yen, Tran Van Phong, Duy Huu Nguyen, Hiep Van Le, Davood Mafi-Gholami, and et al. 2020. "Performance Evaluation of Machine Learning Methods for Forest Fire Modeling and Prediction" Symmetry 12, no. 6: 1022. https://doi.org/10.3390/sym12061022