Fundus Image Classification Using VGG-19 Architecture with PCA and SVD

Abstract
:1. Introduction
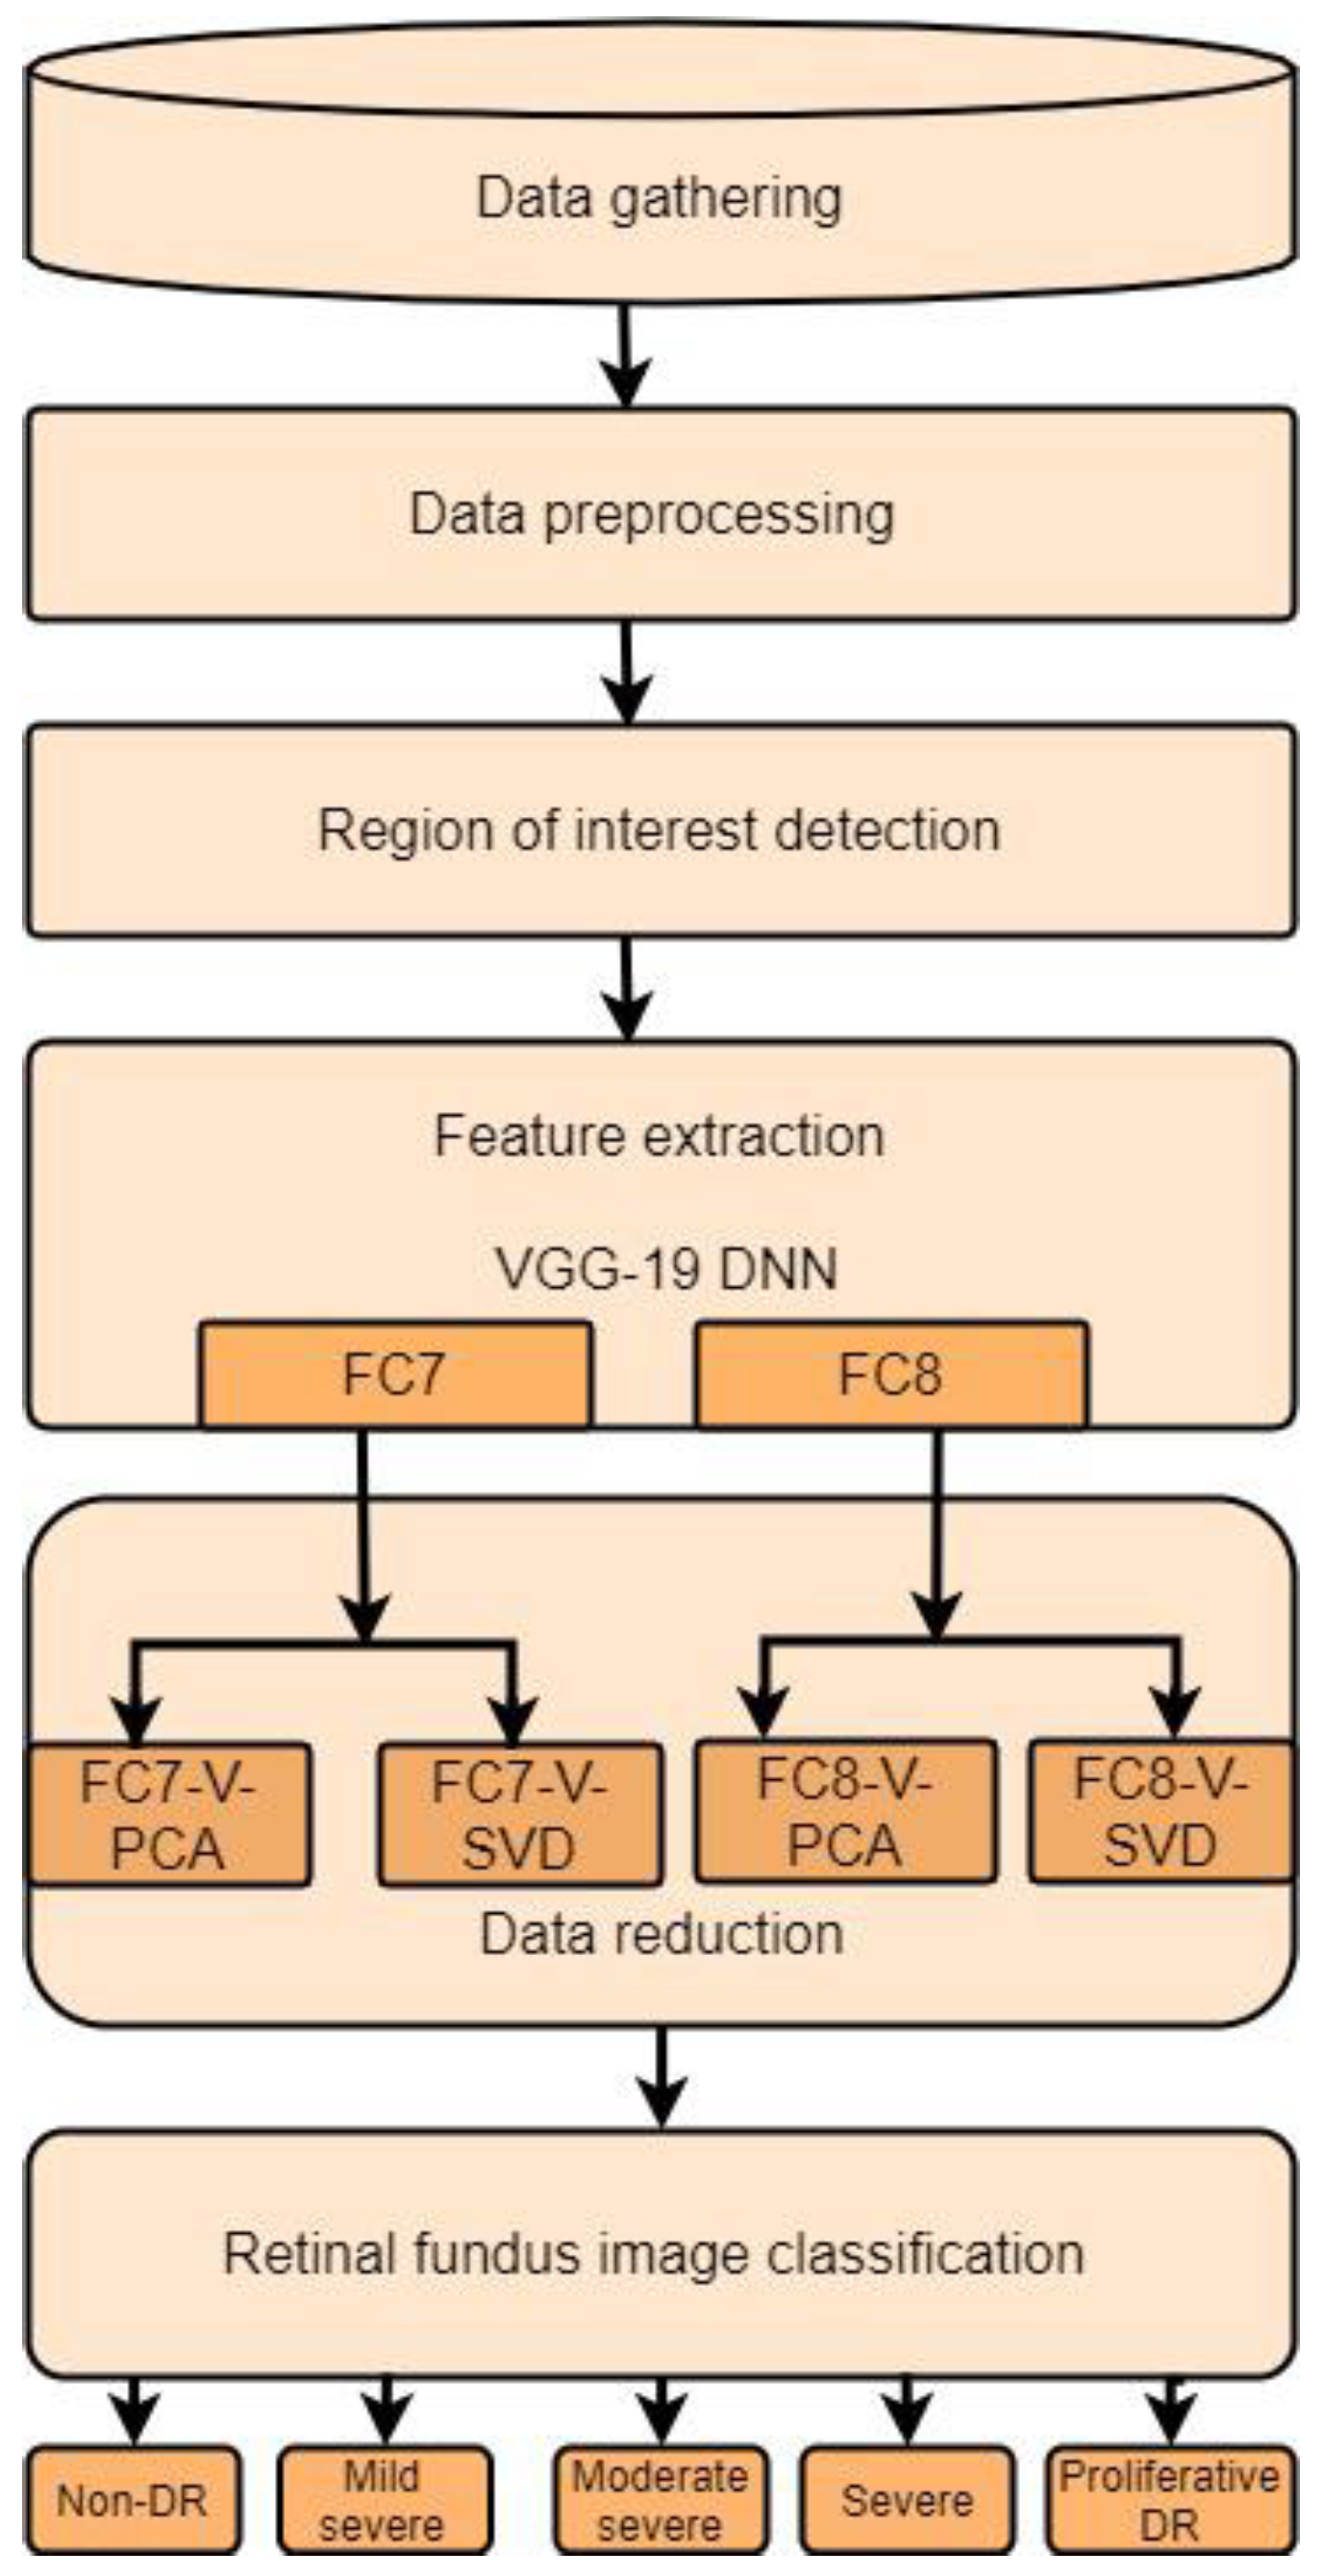
2. Proposed Method
2.1. Data Gathering
2.2. Data Preprocessing
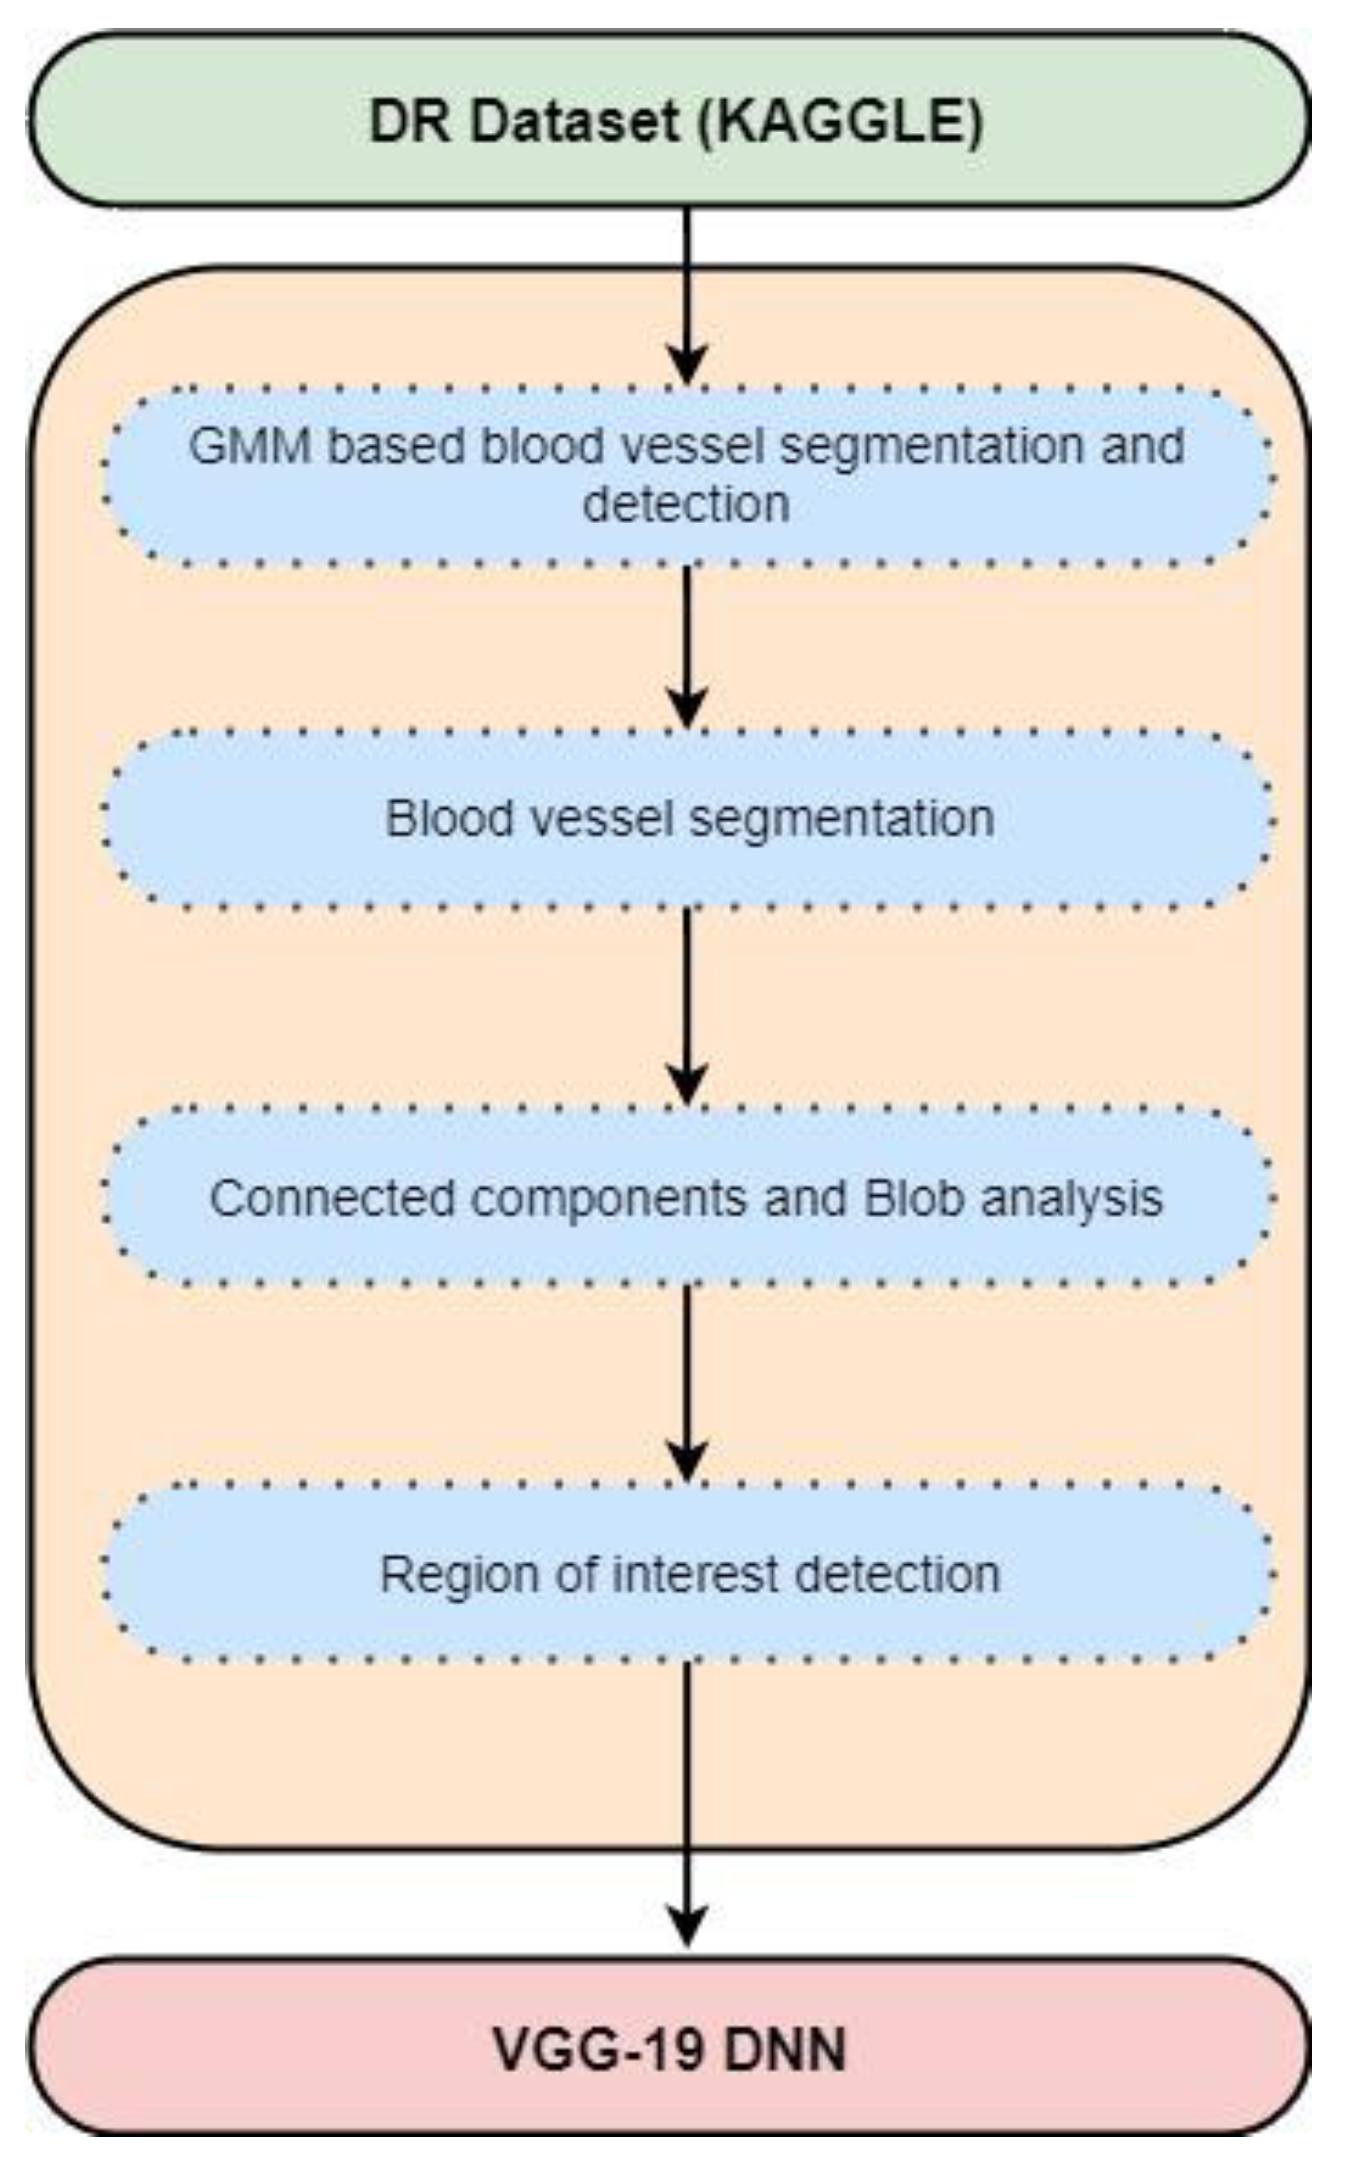
2.3. Region of Interest Detection
2.4. Feature Extraction
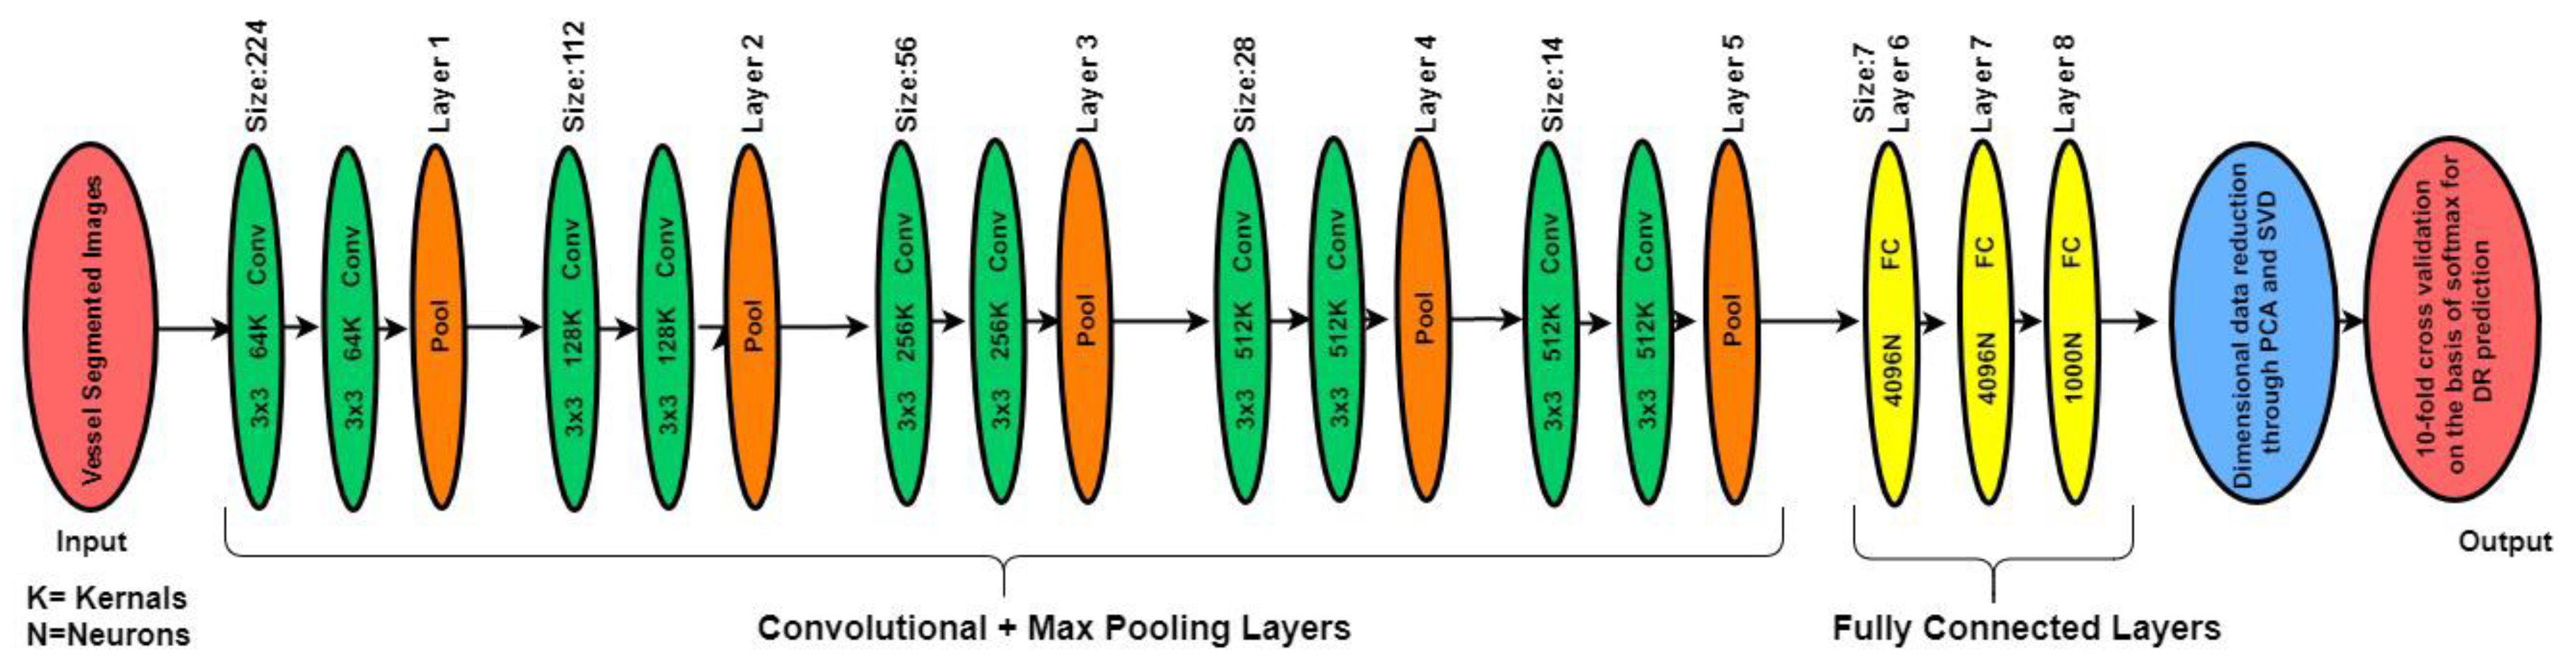
2.4.1. VGG-19 DNN
2.5. Data Reduction
2.5.1. Principle Component Analysis
2.5.2. Singular Value Decomposition
2.6. Retinal Fundus Image Classification
3. Experimental Results and Discussion
4. Conclusions
Author Contributions
Acknowledgments
Conflicts of Interest
References
- Gulshan, V.; Peng, L.; Coram, M.; Stumpe, M.C.; Wu, D.; Narayanaswamy, A.; Venugopalan, S.; Widner, K.; Madams, T.; Cuadros, J. Development and validation of a deep learning algorithm for detection of diabetic retinopathy in retinal fundus photographs. JAMA 2016, 316, 2402–2410. [Google Scholar] [CrossRef] [PubMed]
- Haloi, M.; Dandapat, S.; Sinha, R. A Gaussian scale space approach for exudates detection, classification and severity prediction. arXiv, 2015; arXiv:1505.00737. [Google Scholar]
- Haloi, M. Improved microaneurysm detection using deep neural networks. arXiv, 2015; arXiv:1505.04424. [Google Scholar]
- van Grinsven, M.J.; van Ginneken, B.; Hoyng, C.B.; Theelen, T.; Sánchez, C.I. Fast convolutional neural network training using selective data sampling: Application to hemorrhage detection in color fundus images. IEEE Trans. Med. Imaging 2016, 35, 1273–1284. [Google Scholar] [CrossRef] [PubMed]
- Srivastava, R.; Duan, L.; Wong, D.W.; Liu, J.; Wong, T.Y. Detecting retinal microaneurysms and hemorrhages with robustness to the presence of blood vessels. Comput. Methods Programs Biomed. 2017, 138, 83–91. [Google Scholar] [CrossRef] [PubMed]
- Seoud, L.; Chelbi, J.; Cheriet, F. Automatic grading of diabetic retinopathy on a public database. In Proceedings of the Ophthalmic Medical Image Analysis Second International Workshop, Munich, Germany, 9 October 2015. [Google Scholar]
- Barandiaran, I. The random subspace method for constructing decision forests. IEEE Trans. Pattern Anal. Mach. Intell. 1998, 20, 832–844. [Google Scholar]
- Gu, J.; Wang, Z.; Kuen, J.; Ma, L.; Shahroudy, A.; Shuai, B.; Liu, T.; Wang, X.; Wang, L.; Wang, G. Recent advances in convolutional neural networks. arXiv, 2015; arXiv:1512.07108. [Google Scholar] [CrossRef]
- Sankar, M.; Batri, K.; Parvathi, R. Earliest diabetic retinopathy classification using deep convolution neural networks. Int. J. Adv. Eng. Technol. 2016. [Google Scholar] [CrossRef]
- Pratt, H.; Coenen, F.; Broadbent, D.M.; Harding, S.P.; Zheng, Y. Convolutional neural networks for diabetic retinopathy. Procedia Comput. Sci. 2016, 90, 200–205. [Google Scholar] [CrossRef]
- Haneda, S.; Yamashita, H. International clinical diabetic retinopathy disease severity scale. Nihon Rinsho. Jpn. J. Clin. Med. 2010, 68, 228–235. [Google Scholar]
- Somasundaram, S.; Alli, P. A Machine Learning Ensemble Classifier for Early Prediction of Diabetic Retinopathy. J. Med. Syst. 2017, 41, 201. [Google Scholar]
- Nanni, L.; Ghidoni, S.; Brahnam, S. Ensemble of Convolutional Neural Networks for Bioimage Classification. Appl. Comput. Inform. 2018. [Google Scholar] [CrossRef]
- Abbas, Q.; Fondon, I.; Sarmiento, A.; Jiménez, S.; Alemany, P. Automatic recognition of severity level for diagnosis of diabetic retinopathy using deep visual features. Med. Boil. Eng. Comput. 2017, 55, 1959–1974. [Google Scholar] [CrossRef]
- Orlando, J.I.; Prokofyeva, E.; del Fresno, M.; Blaschko, M.B. An ensemble deep learning based approach for red lesion detection in fundus images. Comput. Methods Programs Biomed. 2018, 153, 115–127. [Google Scholar] [CrossRef] [PubMed] [Green Version]
- Prentašić, P.; Lončarić, S. Detection of exudates in fundus photographs using convolutional neural networks. In Proceedings of the 9th International Symposium on Image and Signal Processing and Analysis (ISPA), Zagreb, Croatia, 7–9 September 2015; pp. 188–192. [Google Scholar]
- Wang, Z.; Yang, J. Diabetic Retinopathy Detection via Deep Convolutional Networks for Discriminative Localization and Visual Explanation. arXiv, 2017; arXiv:1703.10757. [Google Scholar]
- Kälviäinen, R.; Uusitalo, H. The DIARETDB1 diabetic retinopathy database and evaluation protocol. Med. Image Underst. Anal. 2007, 2007, 61. [Google Scholar]
- Sadek, I.; Elawady, M.; Shabayek, A.E.R. Automatic Classification of Bright Retinal Lesions via Deep Network Features. arXiv, 2017; arXiv:1707.02022. [Google Scholar]
- Yu, F.; Sun, J.; Li, A.; Cheng, J.; Wan, C.; Liu, J. Image quality classification for DR screening using deep learning. In Proceedings of the 2017 39th Annual International Conference of the IEEE Engineering in Medicine and Biology Society (EMBC), Seogwipo, South Korea, 11–15 July 2017; pp. 664–667. [Google Scholar]
- Choi, J.Y.; Yoo, T.K.; Seo, J.G.; Kwak, J.; Um, T.T.; Rim, T.H. Multi-categorical deep learning neural network to classify retinal images: A pilot study employing small database. PLoS ONE 2017, 12, e0187336. [Google Scholar] [CrossRef]
- Prasad, D.K.; Vibha, L.; Venugopal, K. Early detection of diabetic retinopathy from digital retinal fundus images. In Proceedings of the 2015 IEEE Recent Advances in Intelligent Computational Systems (RAICS), Trivandrum, India, 10–12 December 2015; pp. 240–245. [Google Scholar]
- Bhatkar, A.P.; Kharat, G. Detection of diabetic retinopathy in retinal images using MLP classifier. In Proceedings of the IEEE International Symposium on Nanoelectronic and Information Systems (iNIS), Indore, India, 21–23 December 2015; pp. 331–335. [Google Scholar]
- Elbalaoui, A.; Boutaounte, M.; Faouzi, H.; Fakir, M.; Merbouha, A. Segmentation and detection of diabetic retinopathy exudates. In Proceedings of the 2014 International Conference on Multimedia Computing and Systems (ICMCS), Marrakech, Morocco, 14–16 April 2014; pp. 171–178. [Google Scholar]
- Raman, V.; Then, P.; Sumari, P. Proposed retinal abnormality detection and classification approach: Computer aided detection for diabetic retinopathy by machine learning approaches. In Proceedings of the 2016 8th IEEE International Conference on Communication Software and Networks (ICCSN), Beijing, China, 4–6 June 2016; pp. 636–641. [Google Scholar]
- Kaur, A.; Kaur, P. An integrated approach for diabetic retinopathy exudate segmentation by using genetic algorithm and switching median filter. In Proceedings of the International Conference on Image, Vision and Computing (ICIVC), Portsmouth, UK, 3–5 August 2016; pp. 119–123. [Google Scholar]
- ManojKumar, S.; Manjunath, R.; Sheshadri, H. Feature extraction from the fundus images for the diagnosis of diabetic retinopathy. In Proceedings of the International Conference on Emerging Research in Electronics, Computer Science and Technology (ICERECT), Mandya, India, 17–19 December 2015; pp. 240–245. [Google Scholar]
- Mansour, R.F. Deep-learning-based automatic computer-aided diagnosis system for diabetic retinopathy. Biomed. Eng. Lett. 2018, 8, 41–57. [Google Scholar] [CrossRef]
- Wijesinghe, A.; Kodikara, N.; Sandaruwan, D. Autogenous diabetic retinopathy censor for ophthalmologists-AKSHI. In Proceedings of the 2016 IEEE International Conference on Control and Robotics Engineering (ICCRE), Singapore, 2–4 April 2016; pp. 1–10. [Google Scholar]
- Seoud, L.; Hurtut, T.; Chelbi, J.; Cheriet, F.; Langlois, J.P. Red lesion detection using dynamic shape features for diabetic retinopathy screening. IEEE Trans. Med. Imaging 2016, 35, 1116–1126. [Google Scholar] [CrossRef]
- Gandhi, M.; Dhanasekaran, R. Investigation of severity of diabetic retinopathy by detecting exudates with respect to macula. In Proceedings of the 2015 International Conference on Communications and Signal Processing (ICCSP), Melmaruvathur, India, 2–4 April 2015; pp. 724–729. [Google Scholar]
- Quellec, G.; Charrière, K.; Boudi, Y.; Cochener, B.; Lamard, M. Deep image mining for diabetic retinopathy screening. Med. Image Anal. 2017, 39, 178–193. [Google Scholar] [CrossRef] [PubMed] [Green Version]
- Du, N.; Li, Y. Automated identification of diabetic retinopathy stages using support vector machine. In Proceedings of the 2013 32nd Chinese Control Conference (CCC), Xi’an, China, 26–28 July 2013; pp. 3882–3886. [Google Scholar]
- Yang, Y.; Li, T.; Li, W.; Wu, H.; Fan, W.; Zhang, W. Lesion detection and grading of diabetic retinopathy via two-stages deep convolutional neural networks. In Proceedings of the International Conference on Medical Image Computing and Computer-Assisted Intervention, Honolulu, HI, USA, 21–26 July 2017; pp. 533–540. [Google Scholar]
- Gurudath, N.; Celenk, M.; Riley, H.B. Machine learning identification of diabetic retinopathy from fundus images. In Proceedings of the 2014 IEEE Signal Processing in Medicine and Biology Symposium (SPMB), Philadelphia, PA, USA, 13 December 2014; pp. 1–7. [Google Scholar]
- Cao, W.; Shan, J.; Czarnek, N.; Li, L. Microaneurysm detection in fundus images using small image patches and machine learning methods. In Proceedings of the IEEE International Conference on Bioinformatics and Biomedicine (BIBM), Kansas City, MO, USA, 13–16 November 2017; pp. 325–331. [Google Scholar]
- Nanni, L.; Ghidoni, S.; Brahnam, S. Handcrafted vs. non-handcrafted features for computer vision classification. Pattern Recognit. 2017, 71, 158–172. [Google Scholar] [CrossRef]
- Hagiwara, Y.; Koh, J.E.W.; Tan, J.H.; Bhandary, S.V.; Laude, A.; Ciaccio, E.J.; Tong, L.; Acharya, U.R. Computer-Aided Diagnosis of Glaucoma Using Fundus Images: A Review. Comput. Methods Programs Biomed. 2018, 165, 1–12. [Google Scholar] [CrossRef] [PubMed]
- Litjens, G.; Kooi, T.; Bejnordi, B.E.; Setio, A.A.A.; Ciompi, F.; Ghafoorian, M.; van der Laak, J.A.; Van Ginneken, B.; Sánchez, C.I. A survey on deep learning in medical image analysis. Med Image Anal. 2017, 42, 60–88. [Google Scholar] [CrossRef] [PubMed] [Green Version]
- Alban, M.; Gilligan, T. Automated Detection of Diabetic Retinopathy Using Fluorescein Angiography Photographs. Report of standford education. 2016. Available online: https://www.semanticscholar.org/paper/Automated-Detection-of-Diabetic-Retinopathy-using-Stanford/e8155e4b2f163c8ef1dea36a6a902c744641eb5d (accessed on 21 December 2018).
- Rahim, S.S.; Jayne, C.; Palade, V.; Shuttleworth, J. Automatic detection of microaneurysms in colour fundus images for diabetic retinopathy screening. Neural Comput. Appl. 2016, 27, 1149–1164. [Google Scholar] [CrossRef]
- Available online: https://www.kaggle.com/c/diabetic-retinopathy-detection/data (accessed on 18 December 2018).
- Antal, B.; Hajdu, A. An ensemble-based system for microaneurysm detection and diabetic retinopathy grading. IEEE Trans. Biomed. Eng. 2012, 59, 1720. [Google Scholar] [CrossRef]
- Stauffer, C.; Grimson, W.E.L. Adaptive background mixture models for real-time tracking. In Proceedings of the 1999 IEEE Computer Society Conference on Computer Vision and Pattern Recognition (Cat. No PR00149), Fort Collins, CO, USA, 23–25 June 1999; p. 2246. [Google Scholar]
- Lachure, J.; Deorankar, A.; Lachure, S.; Gupta, S.; Jadhav, R. Diabetic Retinopathy using morphological operations and machine learning. In Proceedings of the 2015 IEEE International Advance Computing Conference (IACC), Banglore, India, 12–13 June 2015; pp. 617–622. [Google Scholar]
- Priya, R.; Aruna, P. SVM and neural network based diagnosis of diabetic retinopathy. Int. J. Comput. Appl. 2012, 41, 6–12. [Google Scholar]
- Singh, N.; Tripathi, R.C. Automated early detection of diabetic retinopathy using image analysis techniques. Int. J. Comput. Appl. 2010, 8, 18–23. [Google Scholar] [CrossRef]
- Rao, M.A.; Lamani, D.; Bhandarkar, R.; Manjunath, T. Automated detection of diabetic retinopathy through image feature extraction. In Proceedings of the 2014 International Conference on Advances in Electronics, Computers and Communications (ICAECC), Bangalore, India, 10–11 October 2014; pp. 1–6. [Google Scholar]


| Classes | Diabetic Retinopathy Classification | Diabetic Retinopathy Images | Percentage of classification (%) |
|---|---|---|---|
| 0 | Non-DR | 25,810 | 73.48 |
| 1 | Mild severe | 2443 | 6.96 |
| 2 | Moderate severe | 5292 | 15.07 |
| 3 | Severe | 873 | 2.48 |
| 4 | Proliferative DR | 708 | 2.01 |
| Methods | Features | Classification Accuracy (%) |
|---|---|---|
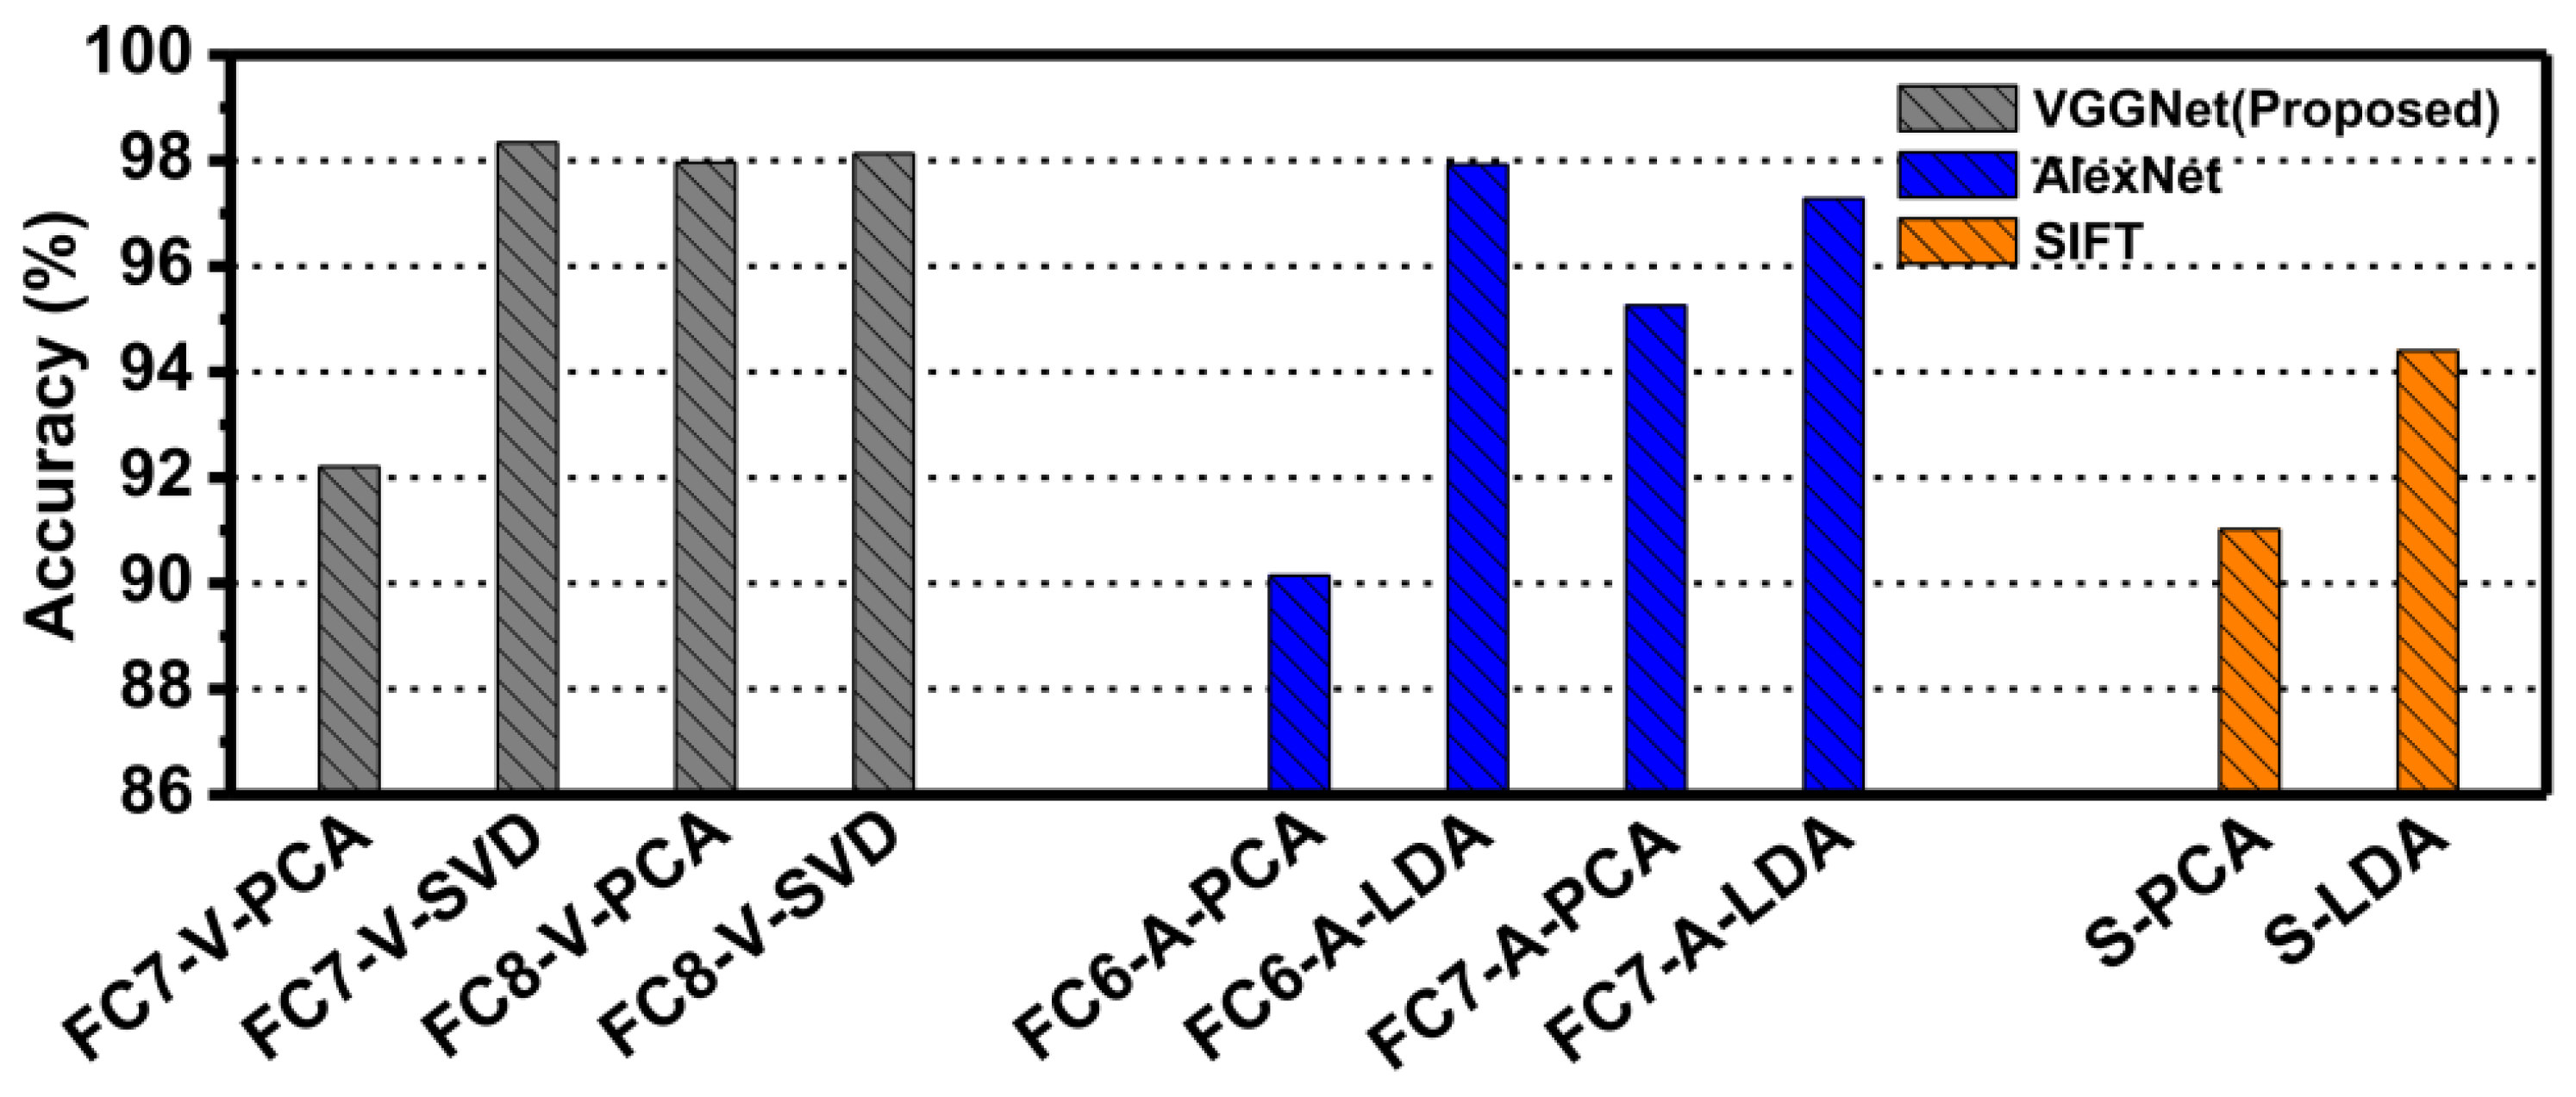
| VGGNet (Proposed) | FC7-V-PCA | 92.21 |
| FC7-V-SVD | 98.34 | |
| FC8-V-PCA | 97.96 | |
| FC8-V-SVD | 98.13 | |
| AlexNet | FC6-A-PCA | 90.15 |
| FC6-A-LDA | 97.93 | |
| FC7-A-PCA | 95.26 | |
| FC7-A-LDA | 97.28 | |
| Scale-Invariant Feature Transform (SIFT) | S-PCA | 91.03 |
| S-LDA | 94.40 |
| Techniques with Features | Classification Accuracy (%) |
|---|---|
| GLCM + SVM [45] | 82.00 |
| SVM + NN [46] | 89.60 |
| FCM, NN, shape [47] | 93.00 |
| HEDFD [48] | 94.60 |
| DWT + PCA [28] | 95.00 |
| DNN [3] | 96.00 |
| FC7-V-PCA * | 92.21 |
| FC7-V-SVD * | 98.34 |
| FC8-V-PCA * | 97.96 |
| FC8-V-SVD * | 98.13 |
© 2018 by the authors. Licensee MDPI, Basel, Switzerland. This article is an open access article distributed under the terms and conditions of the Creative Commons Attribution (CC BY) license (http://creativecommons.org/licenses/by/4.0/).
Share and Cite
Mateen, M.; Wen, J.; Nasrullah; Song, S.; Huang, Z. Fundus Image Classification Using VGG-19 Architecture with PCA and SVD. Symmetry 2019, 11, 1. https://doi.org/10.3390/sym11010001
Mateen M, Wen J, Nasrullah, Song S, Huang Z. Fundus Image Classification Using VGG-19 Architecture with PCA and SVD. Symmetry. 2019; 11(1):1. https://doi.org/10.3390/sym11010001
Chicago/Turabian StyleMateen, Muhammad, Junhao Wen, Nasrullah, Sun Song, and Zhouping Huang. 2019. "Fundus Image Classification Using VGG-19 Architecture with PCA and SVD" Symmetry 11, no. 1: 1. https://doi.org/10.3390/sym11010001