
Non-Affinity Purification of Antibodies
Abstract
:1. Introduction
2. Problems Associated with Protein A Chromatography
2.1. Cost
2.2. Low pH Elution
2.3. Protein A Leaching and Toxicity
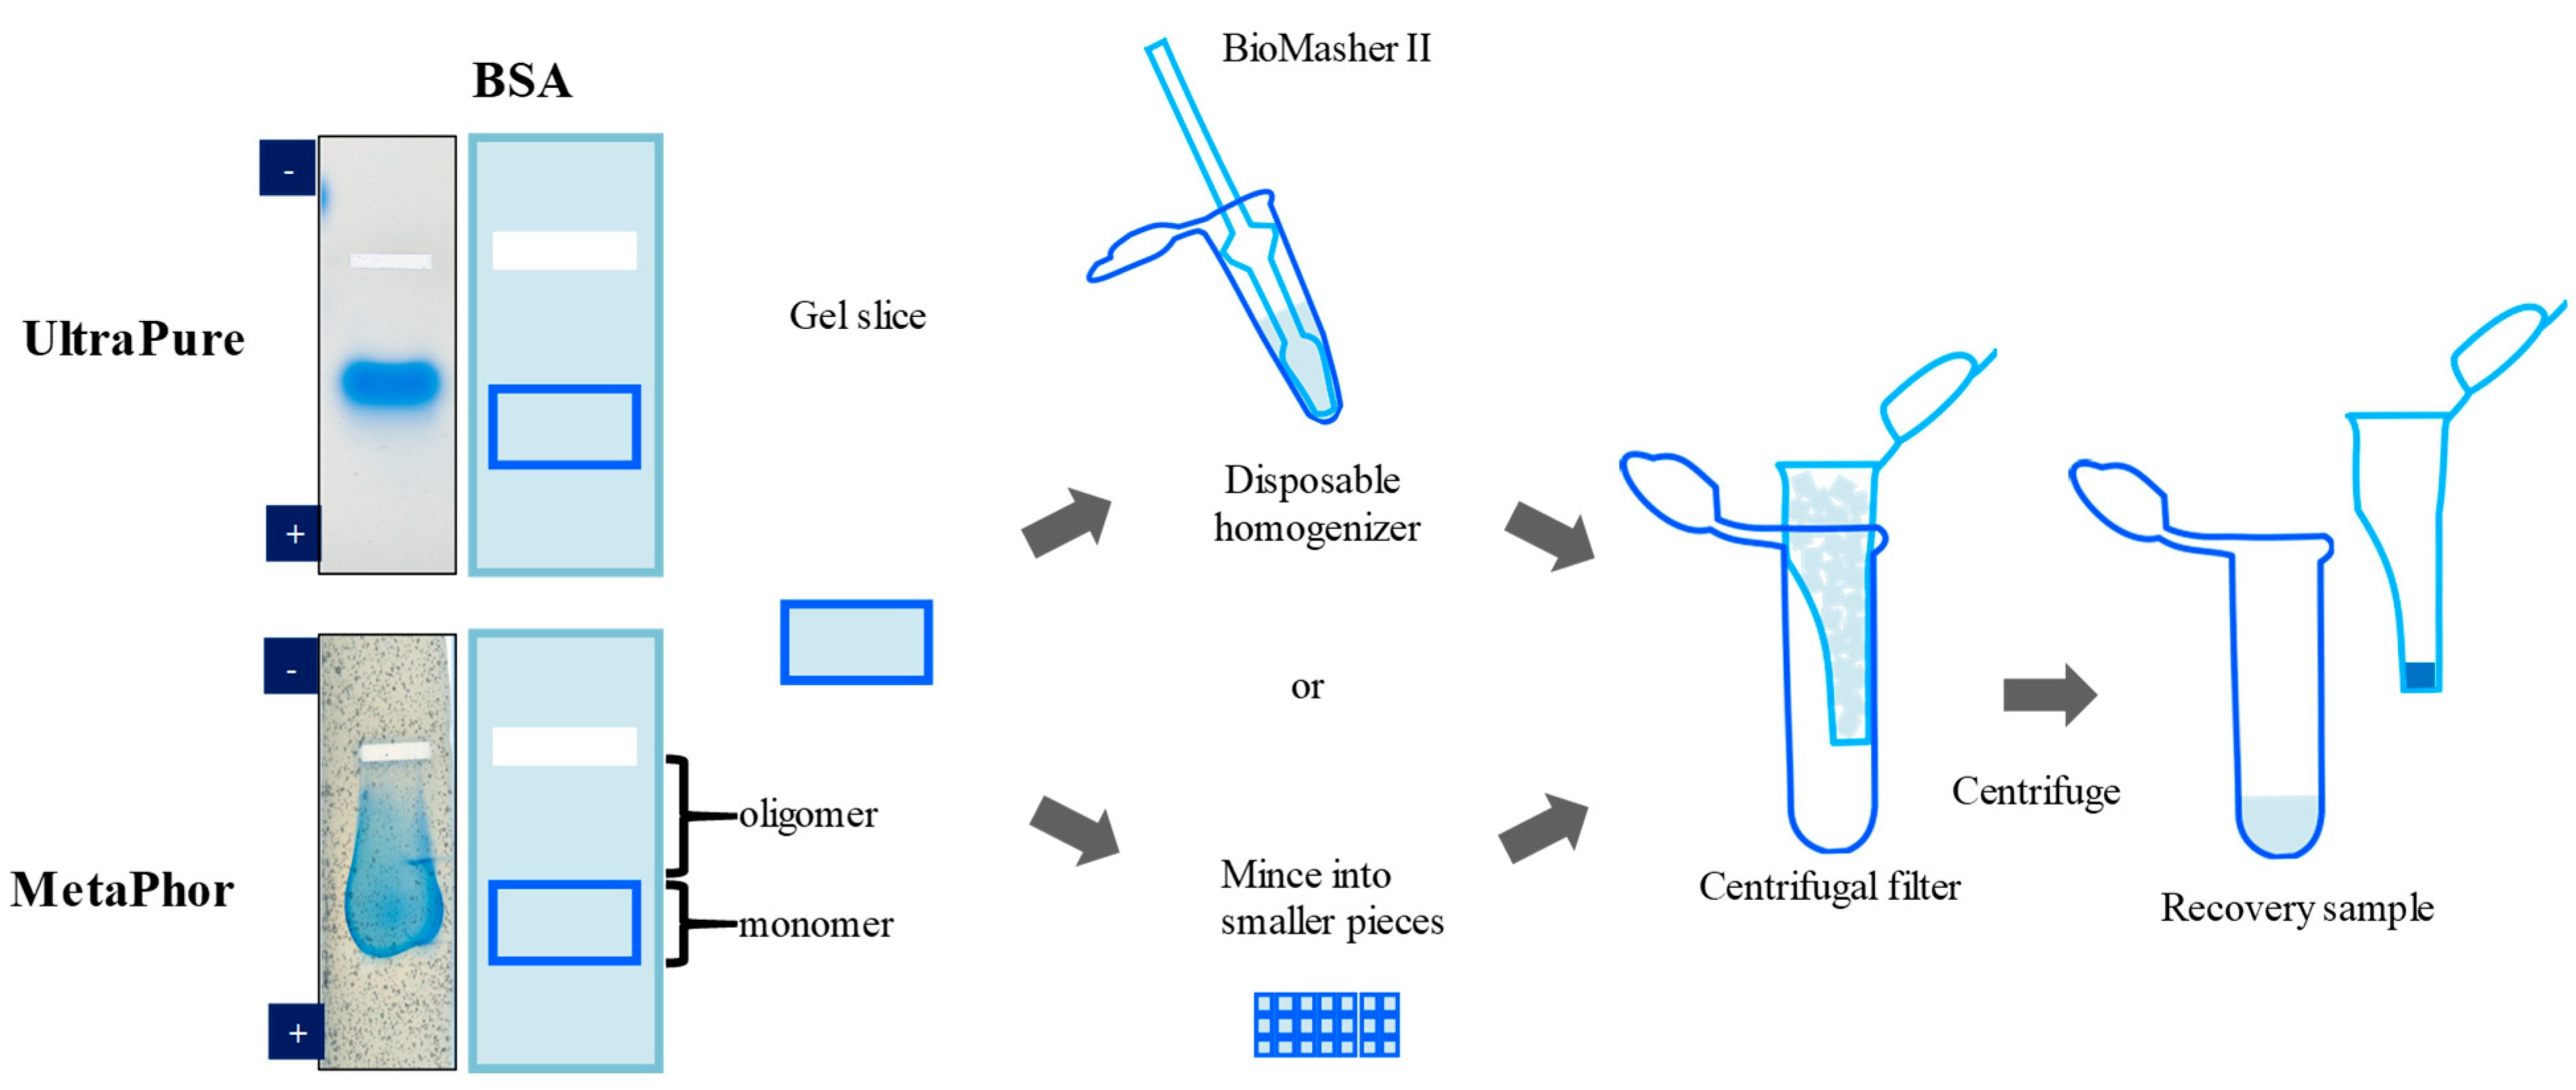
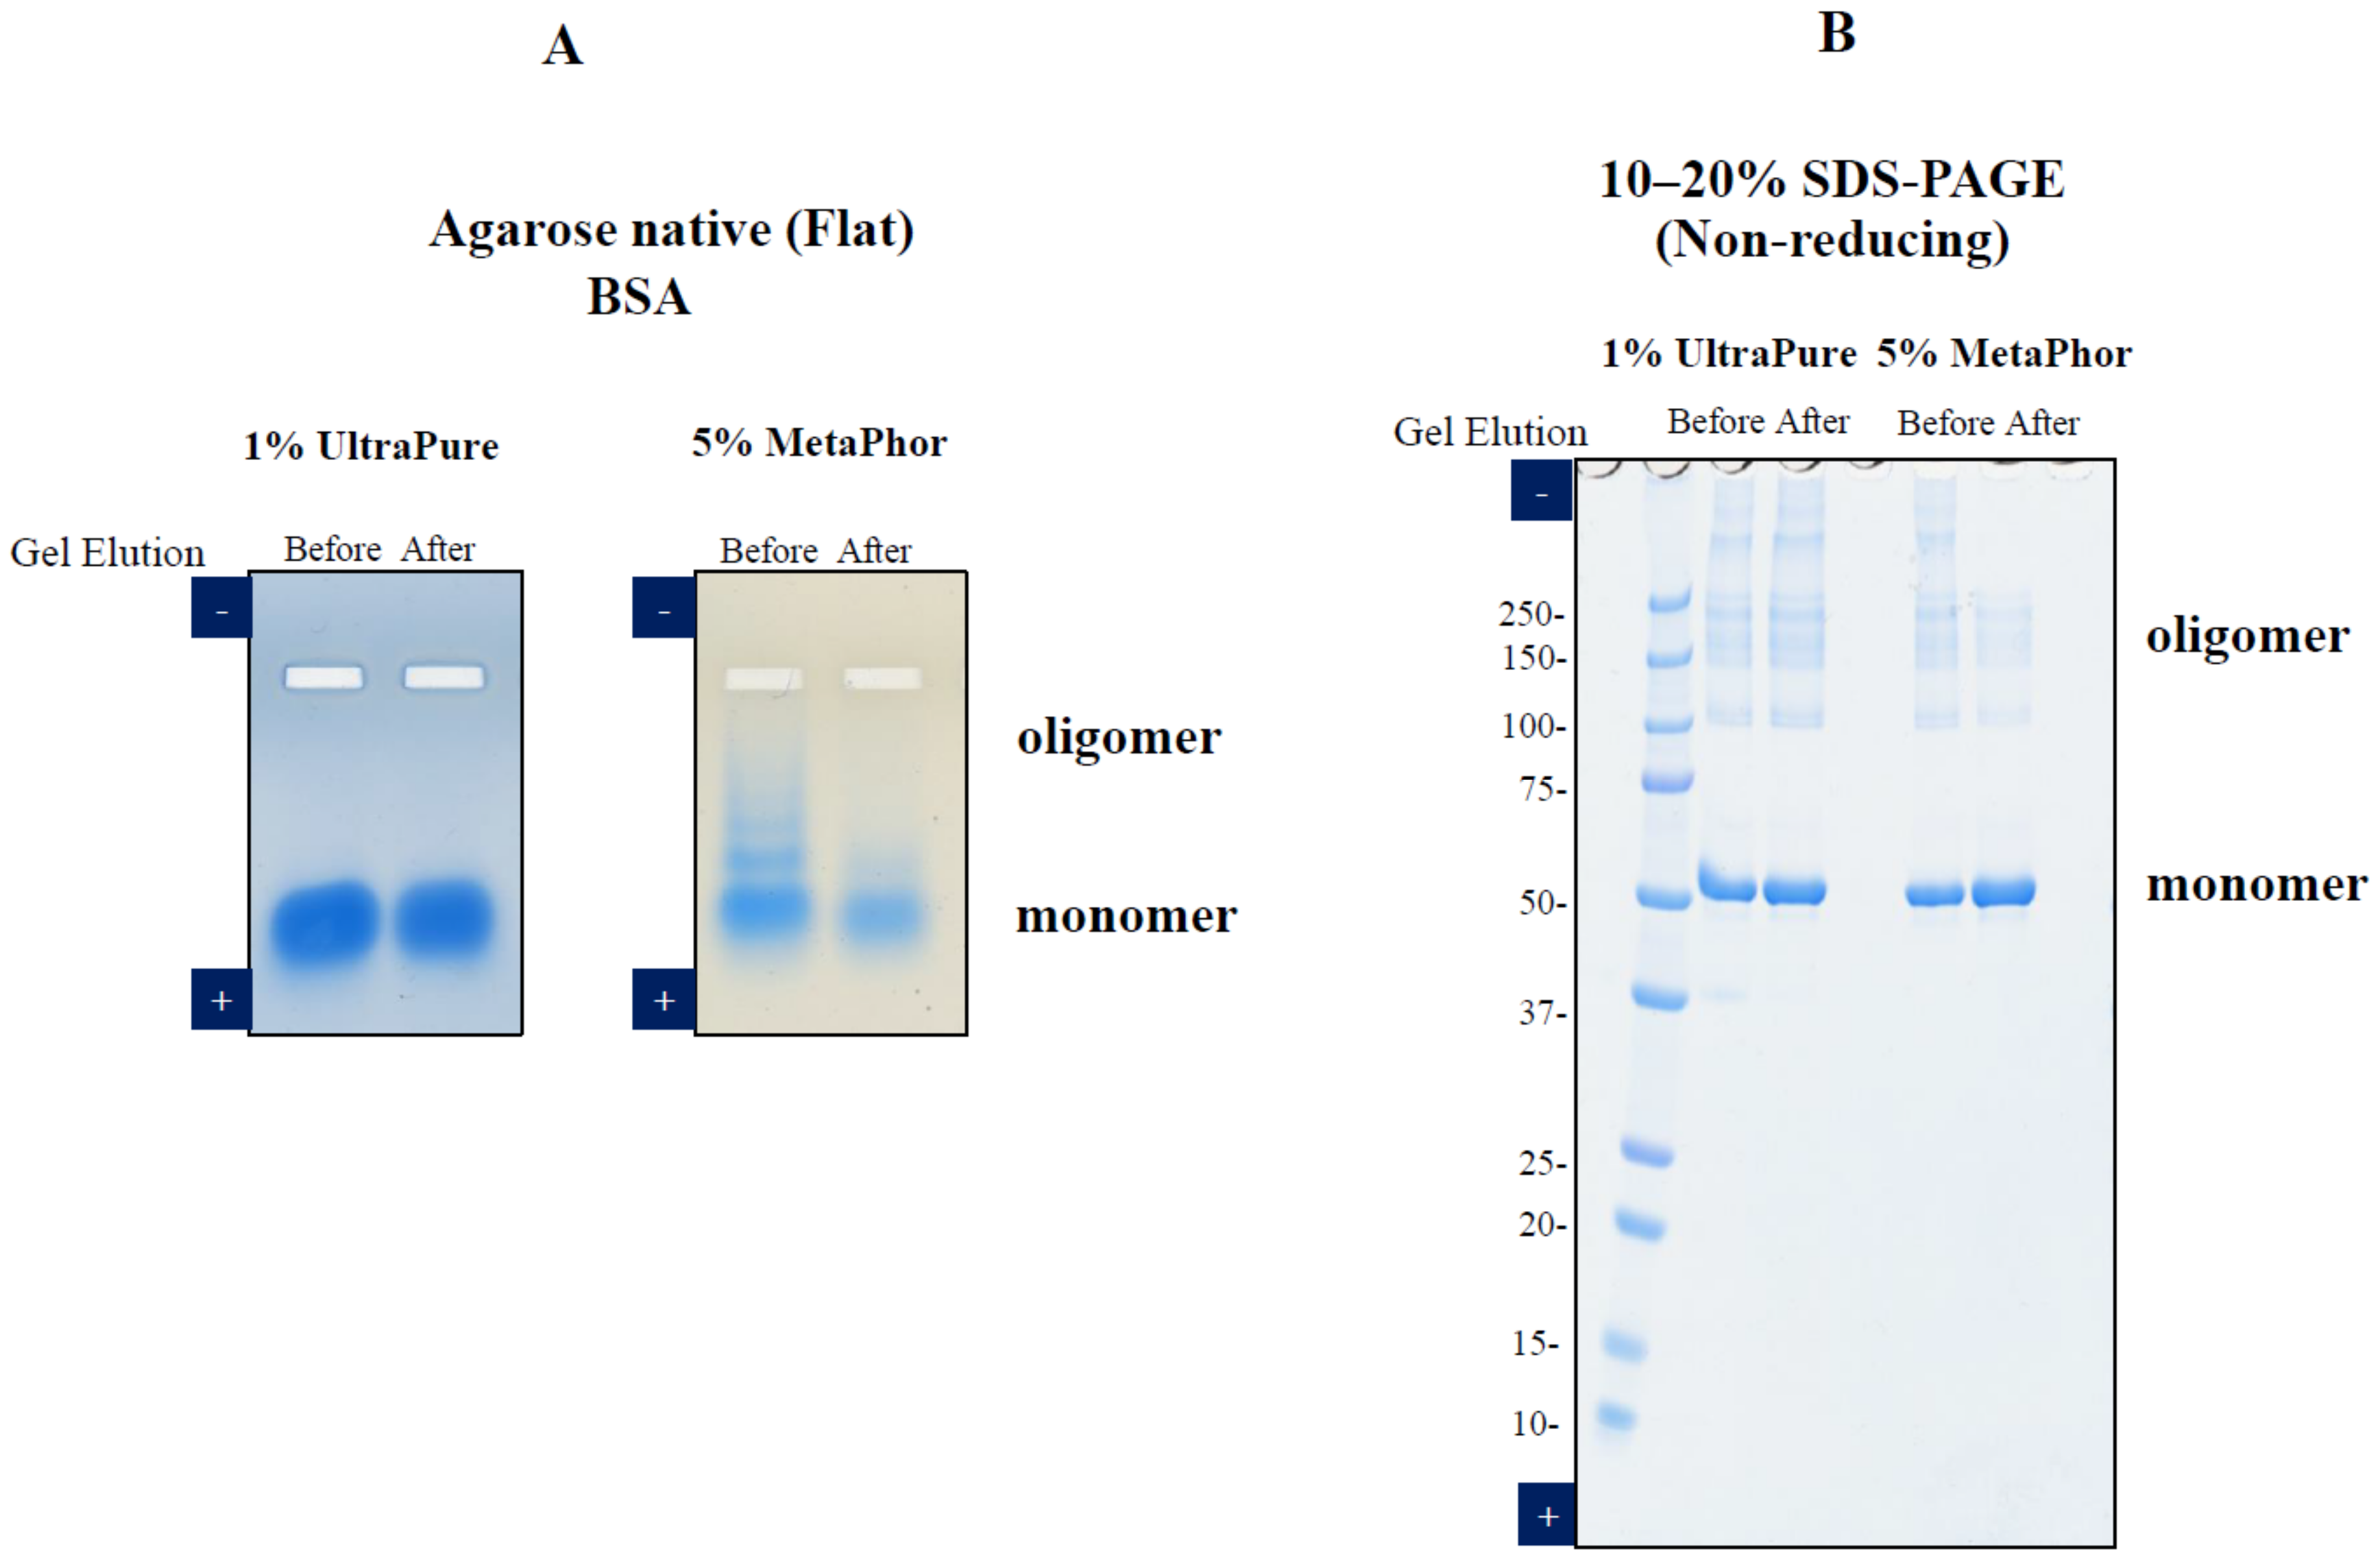
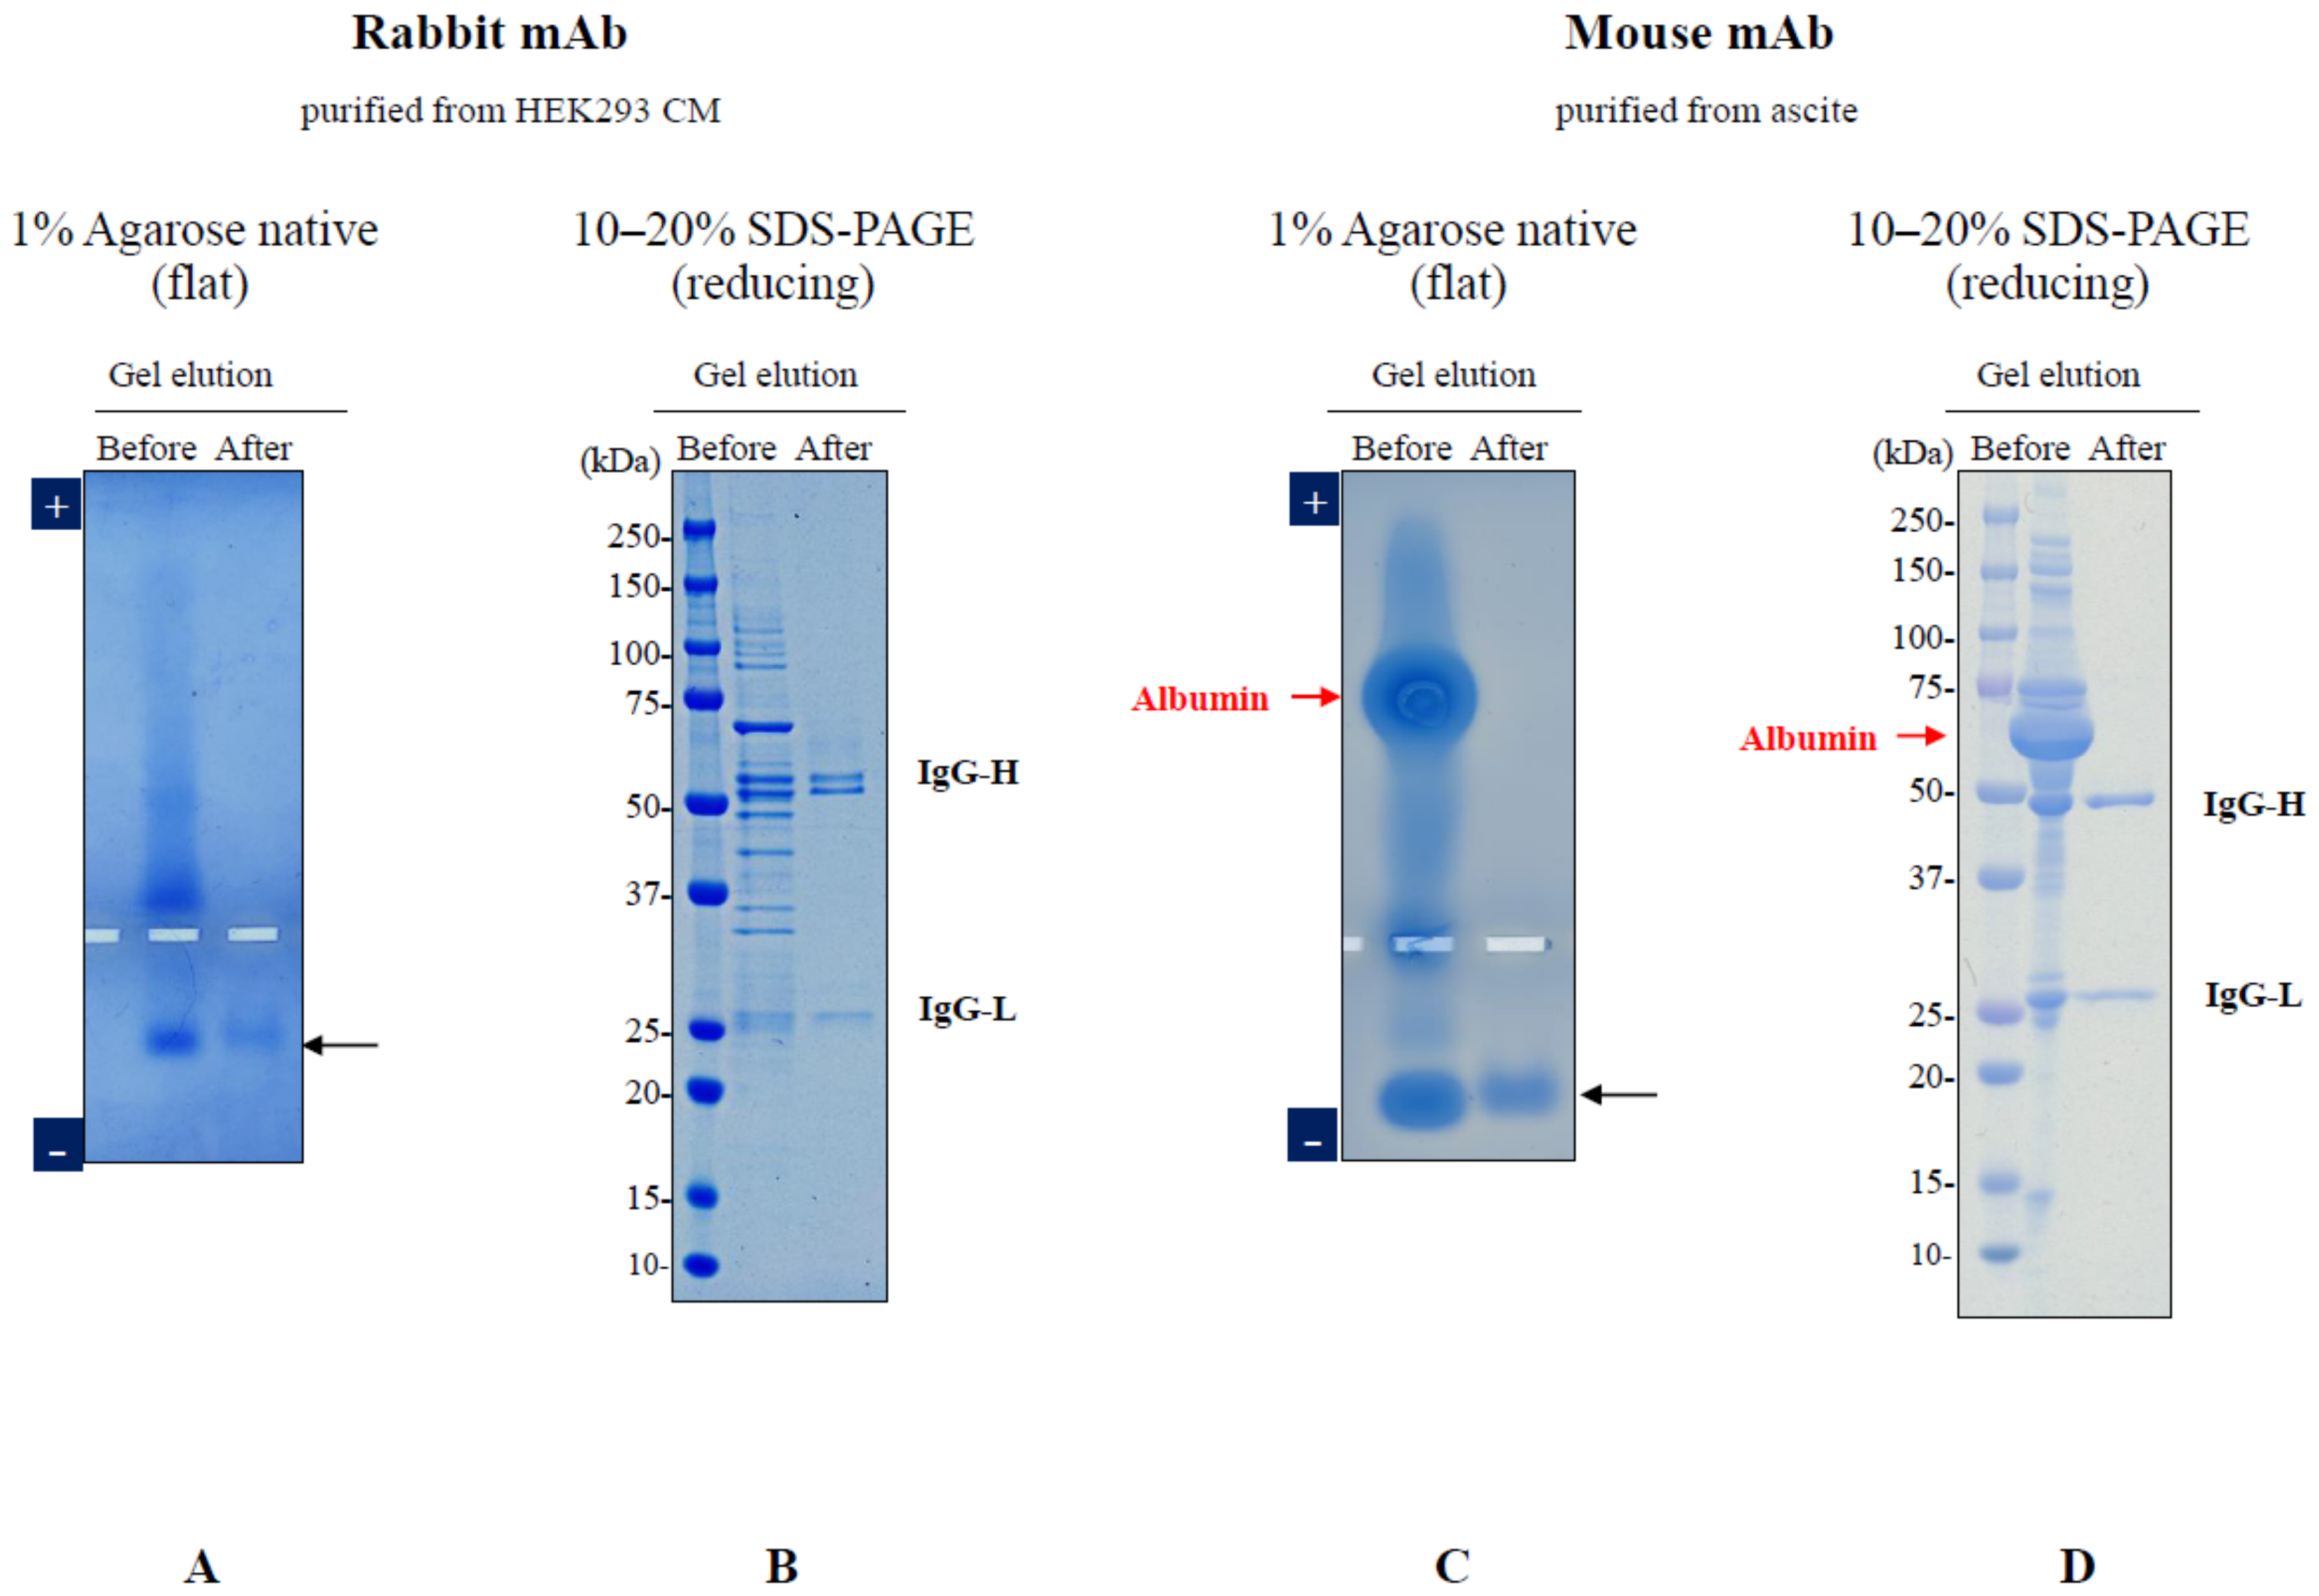
3. Elution of Proteins from Agarose Gel Electrophoresis
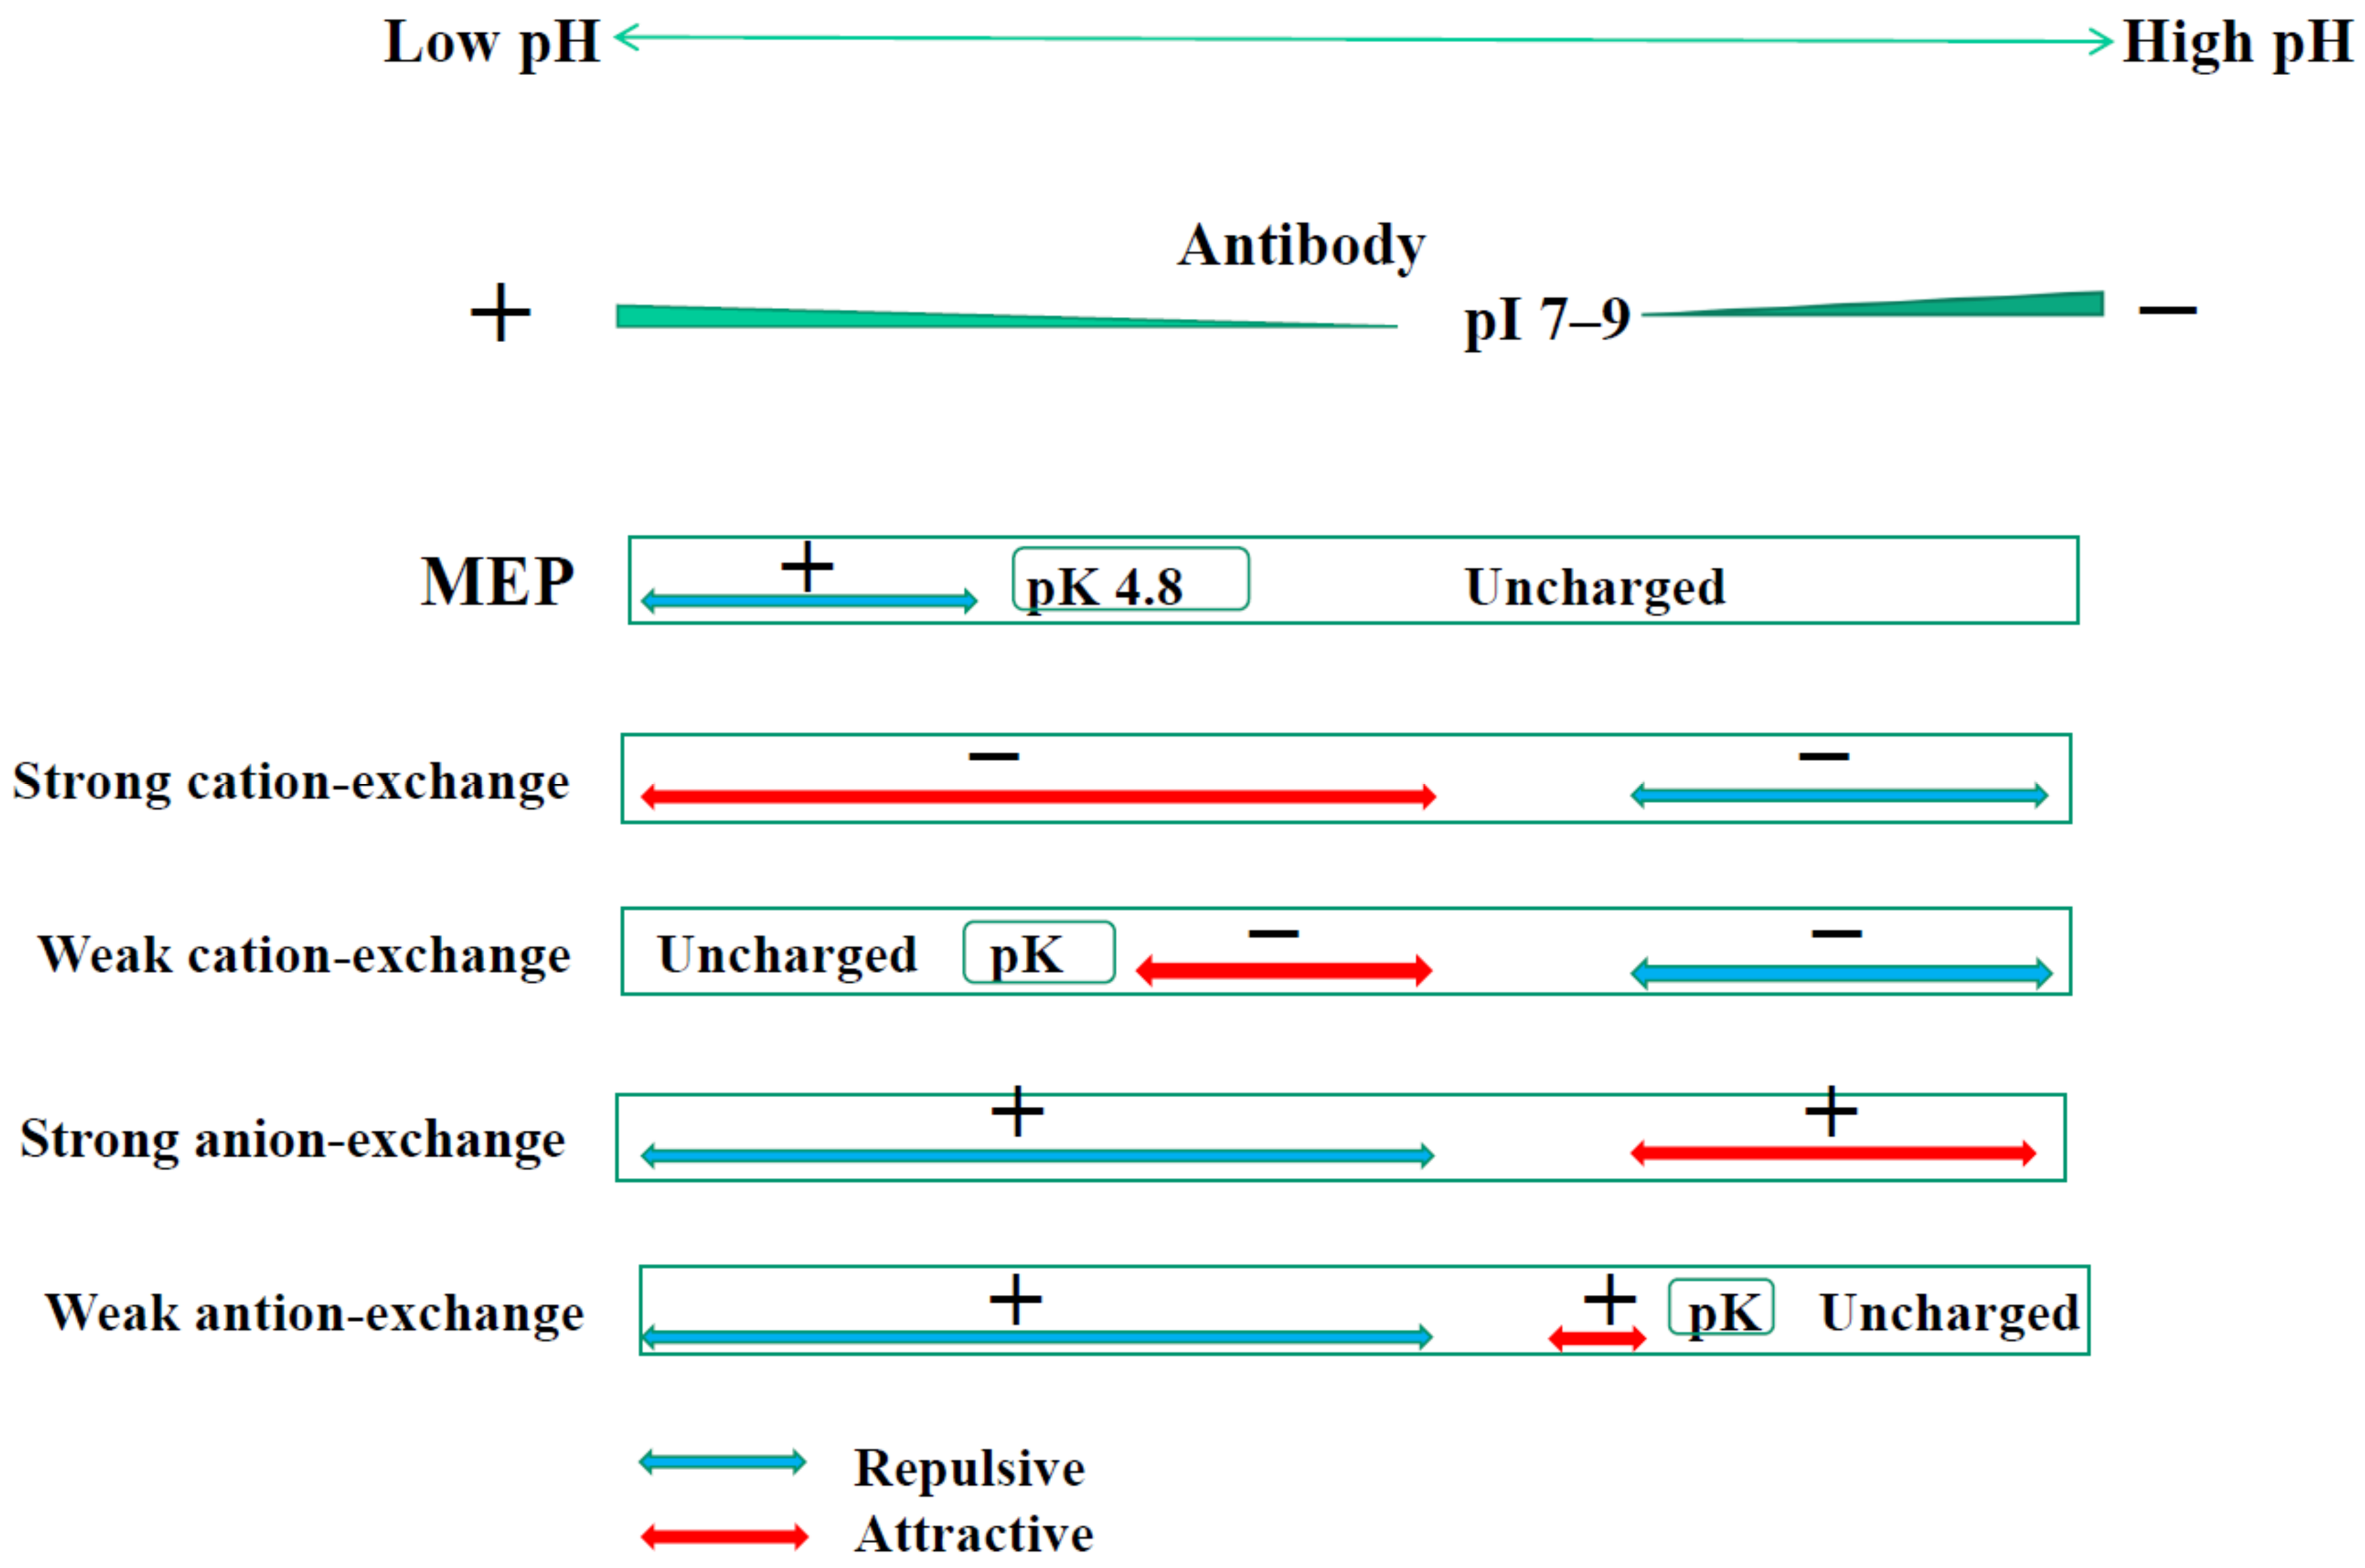
4. Mixed-Mode Chromatography
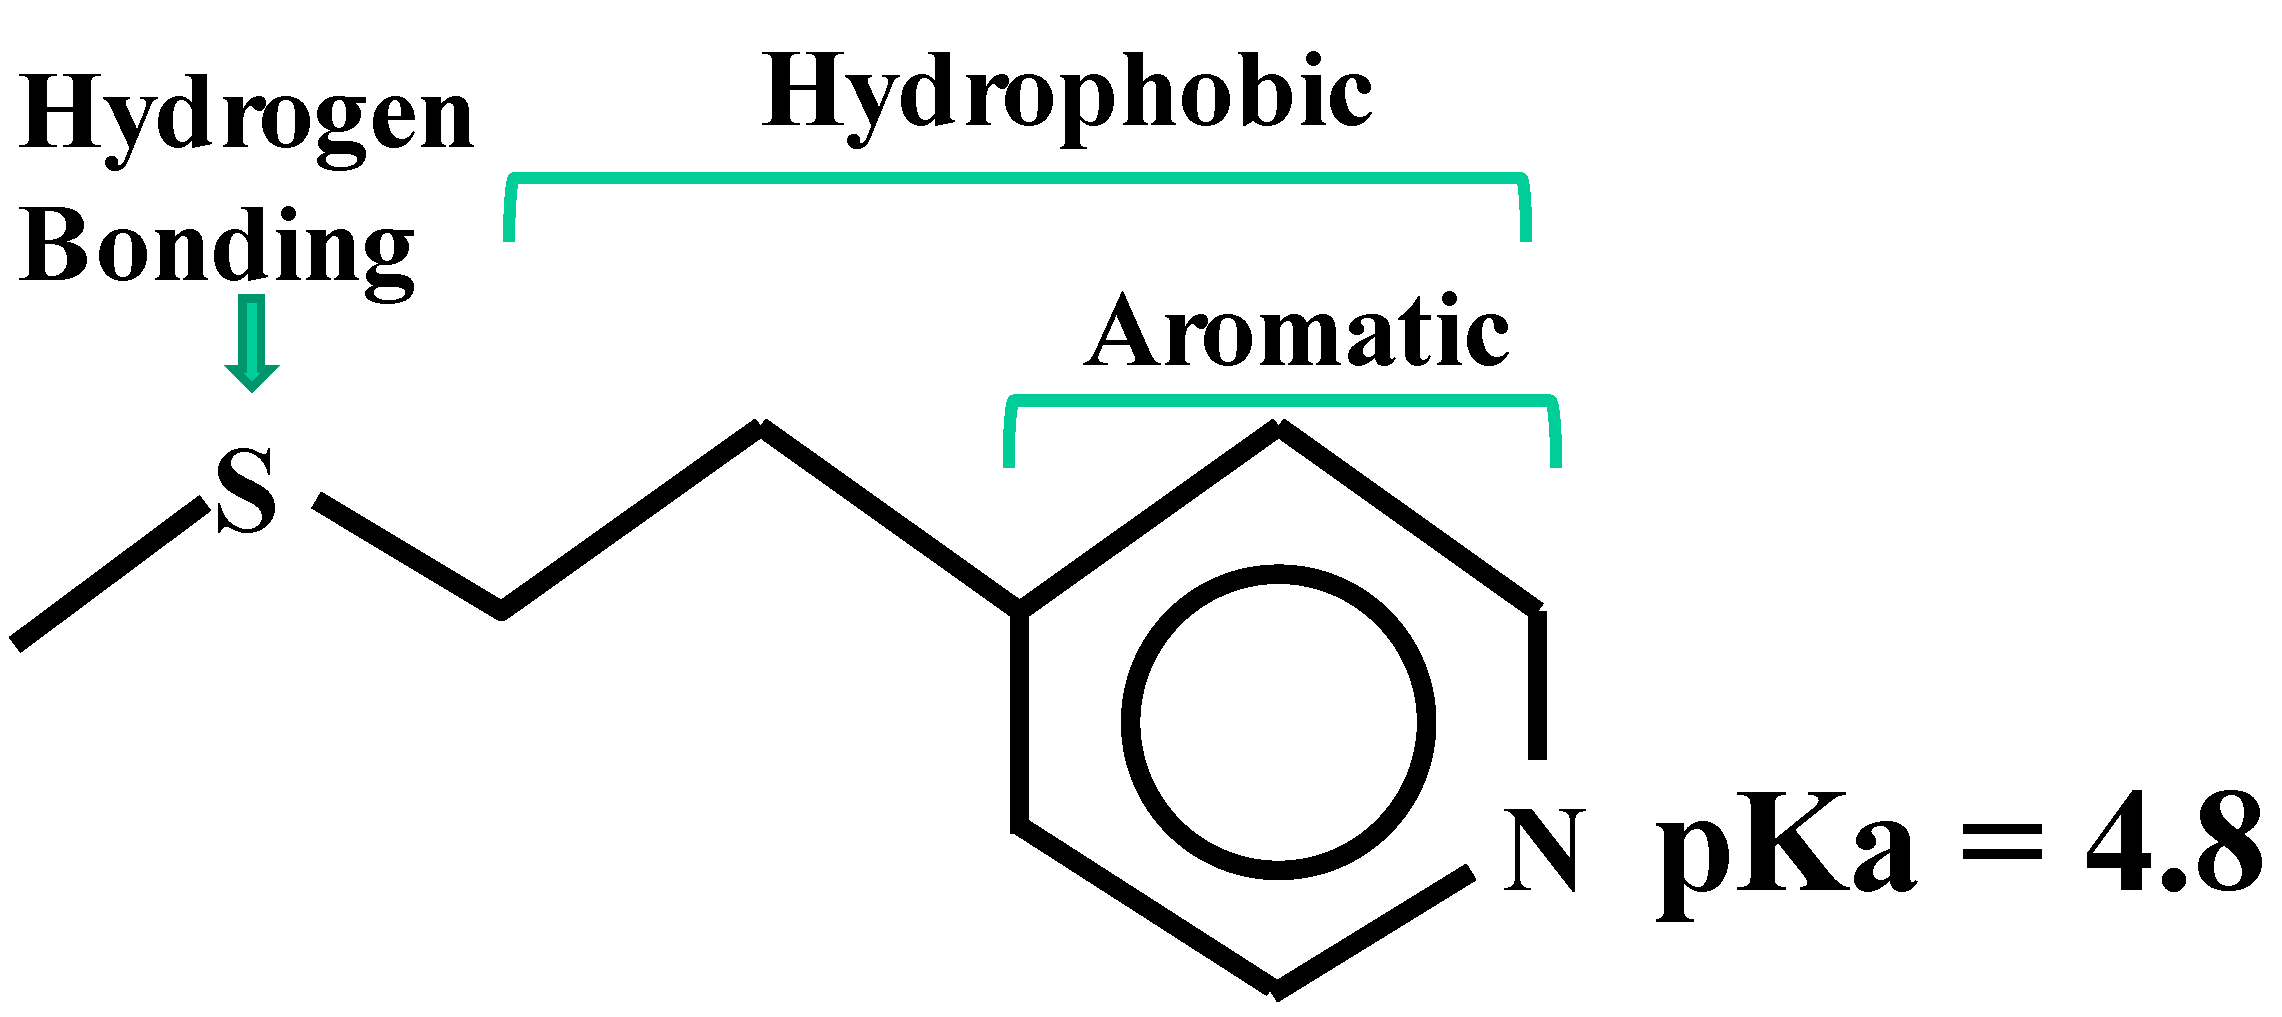
4.1. MEP
4.2. Hydrophobic-Ion Exchange Multimodal Chromatography
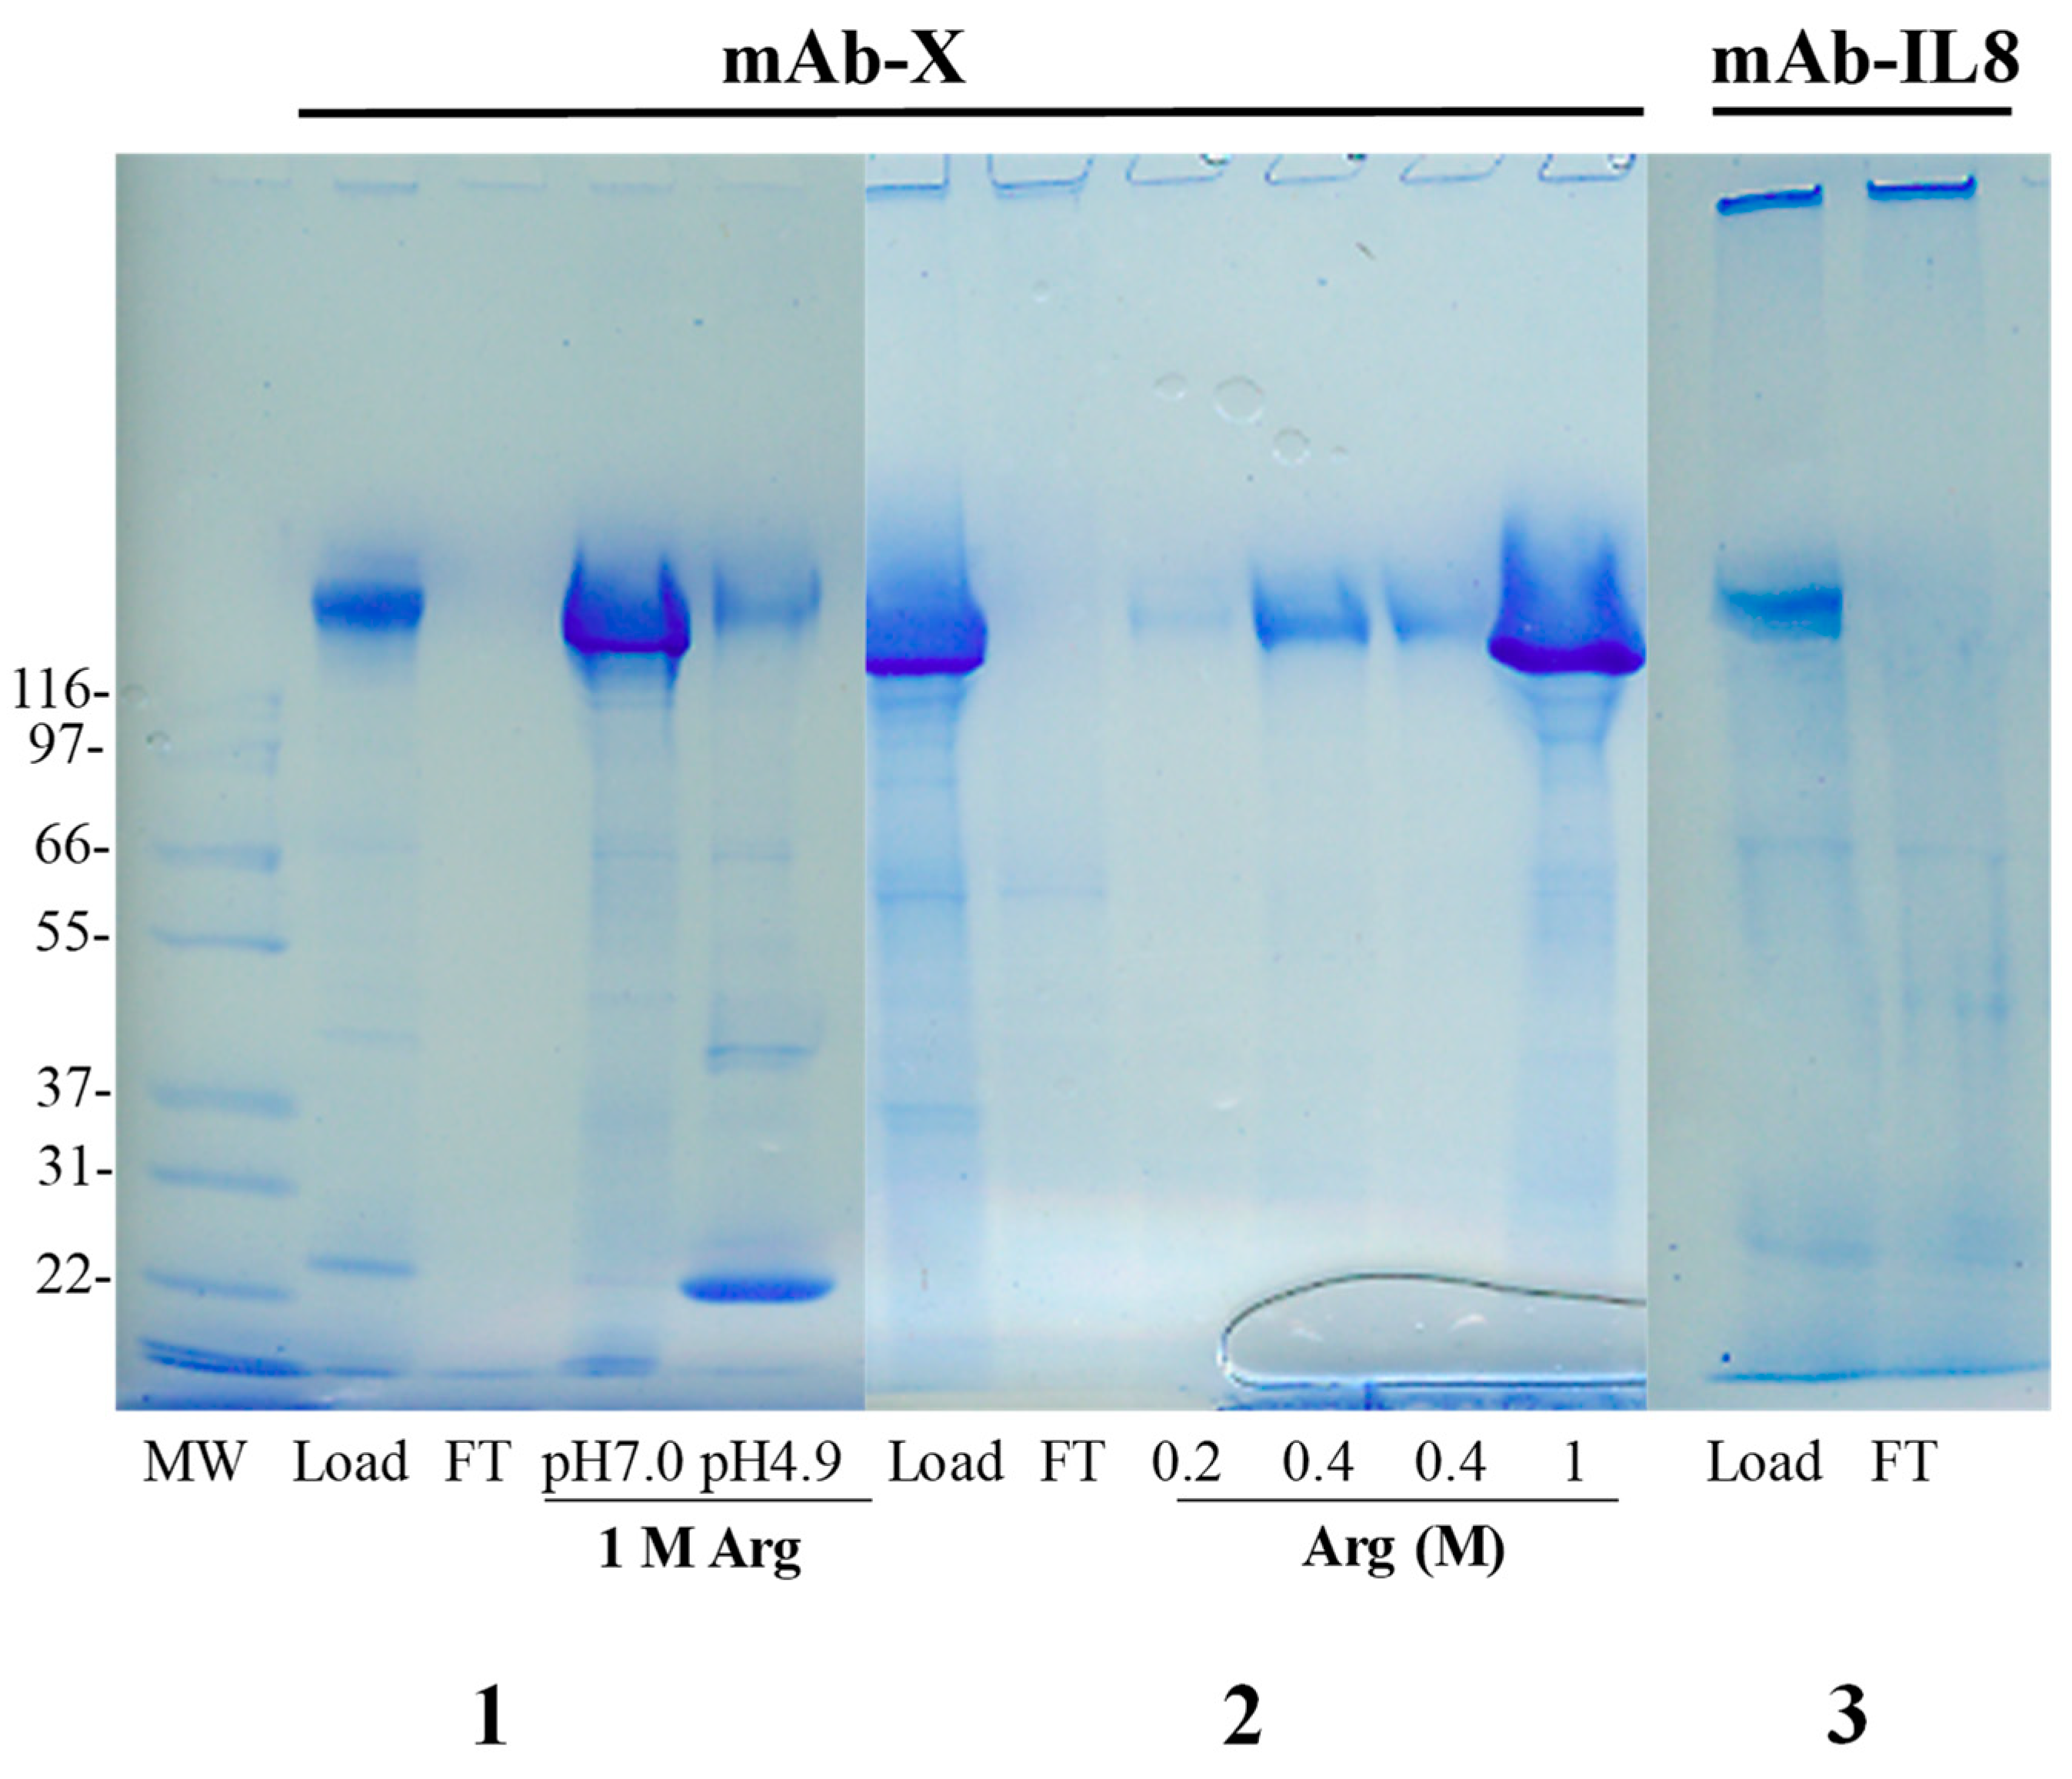
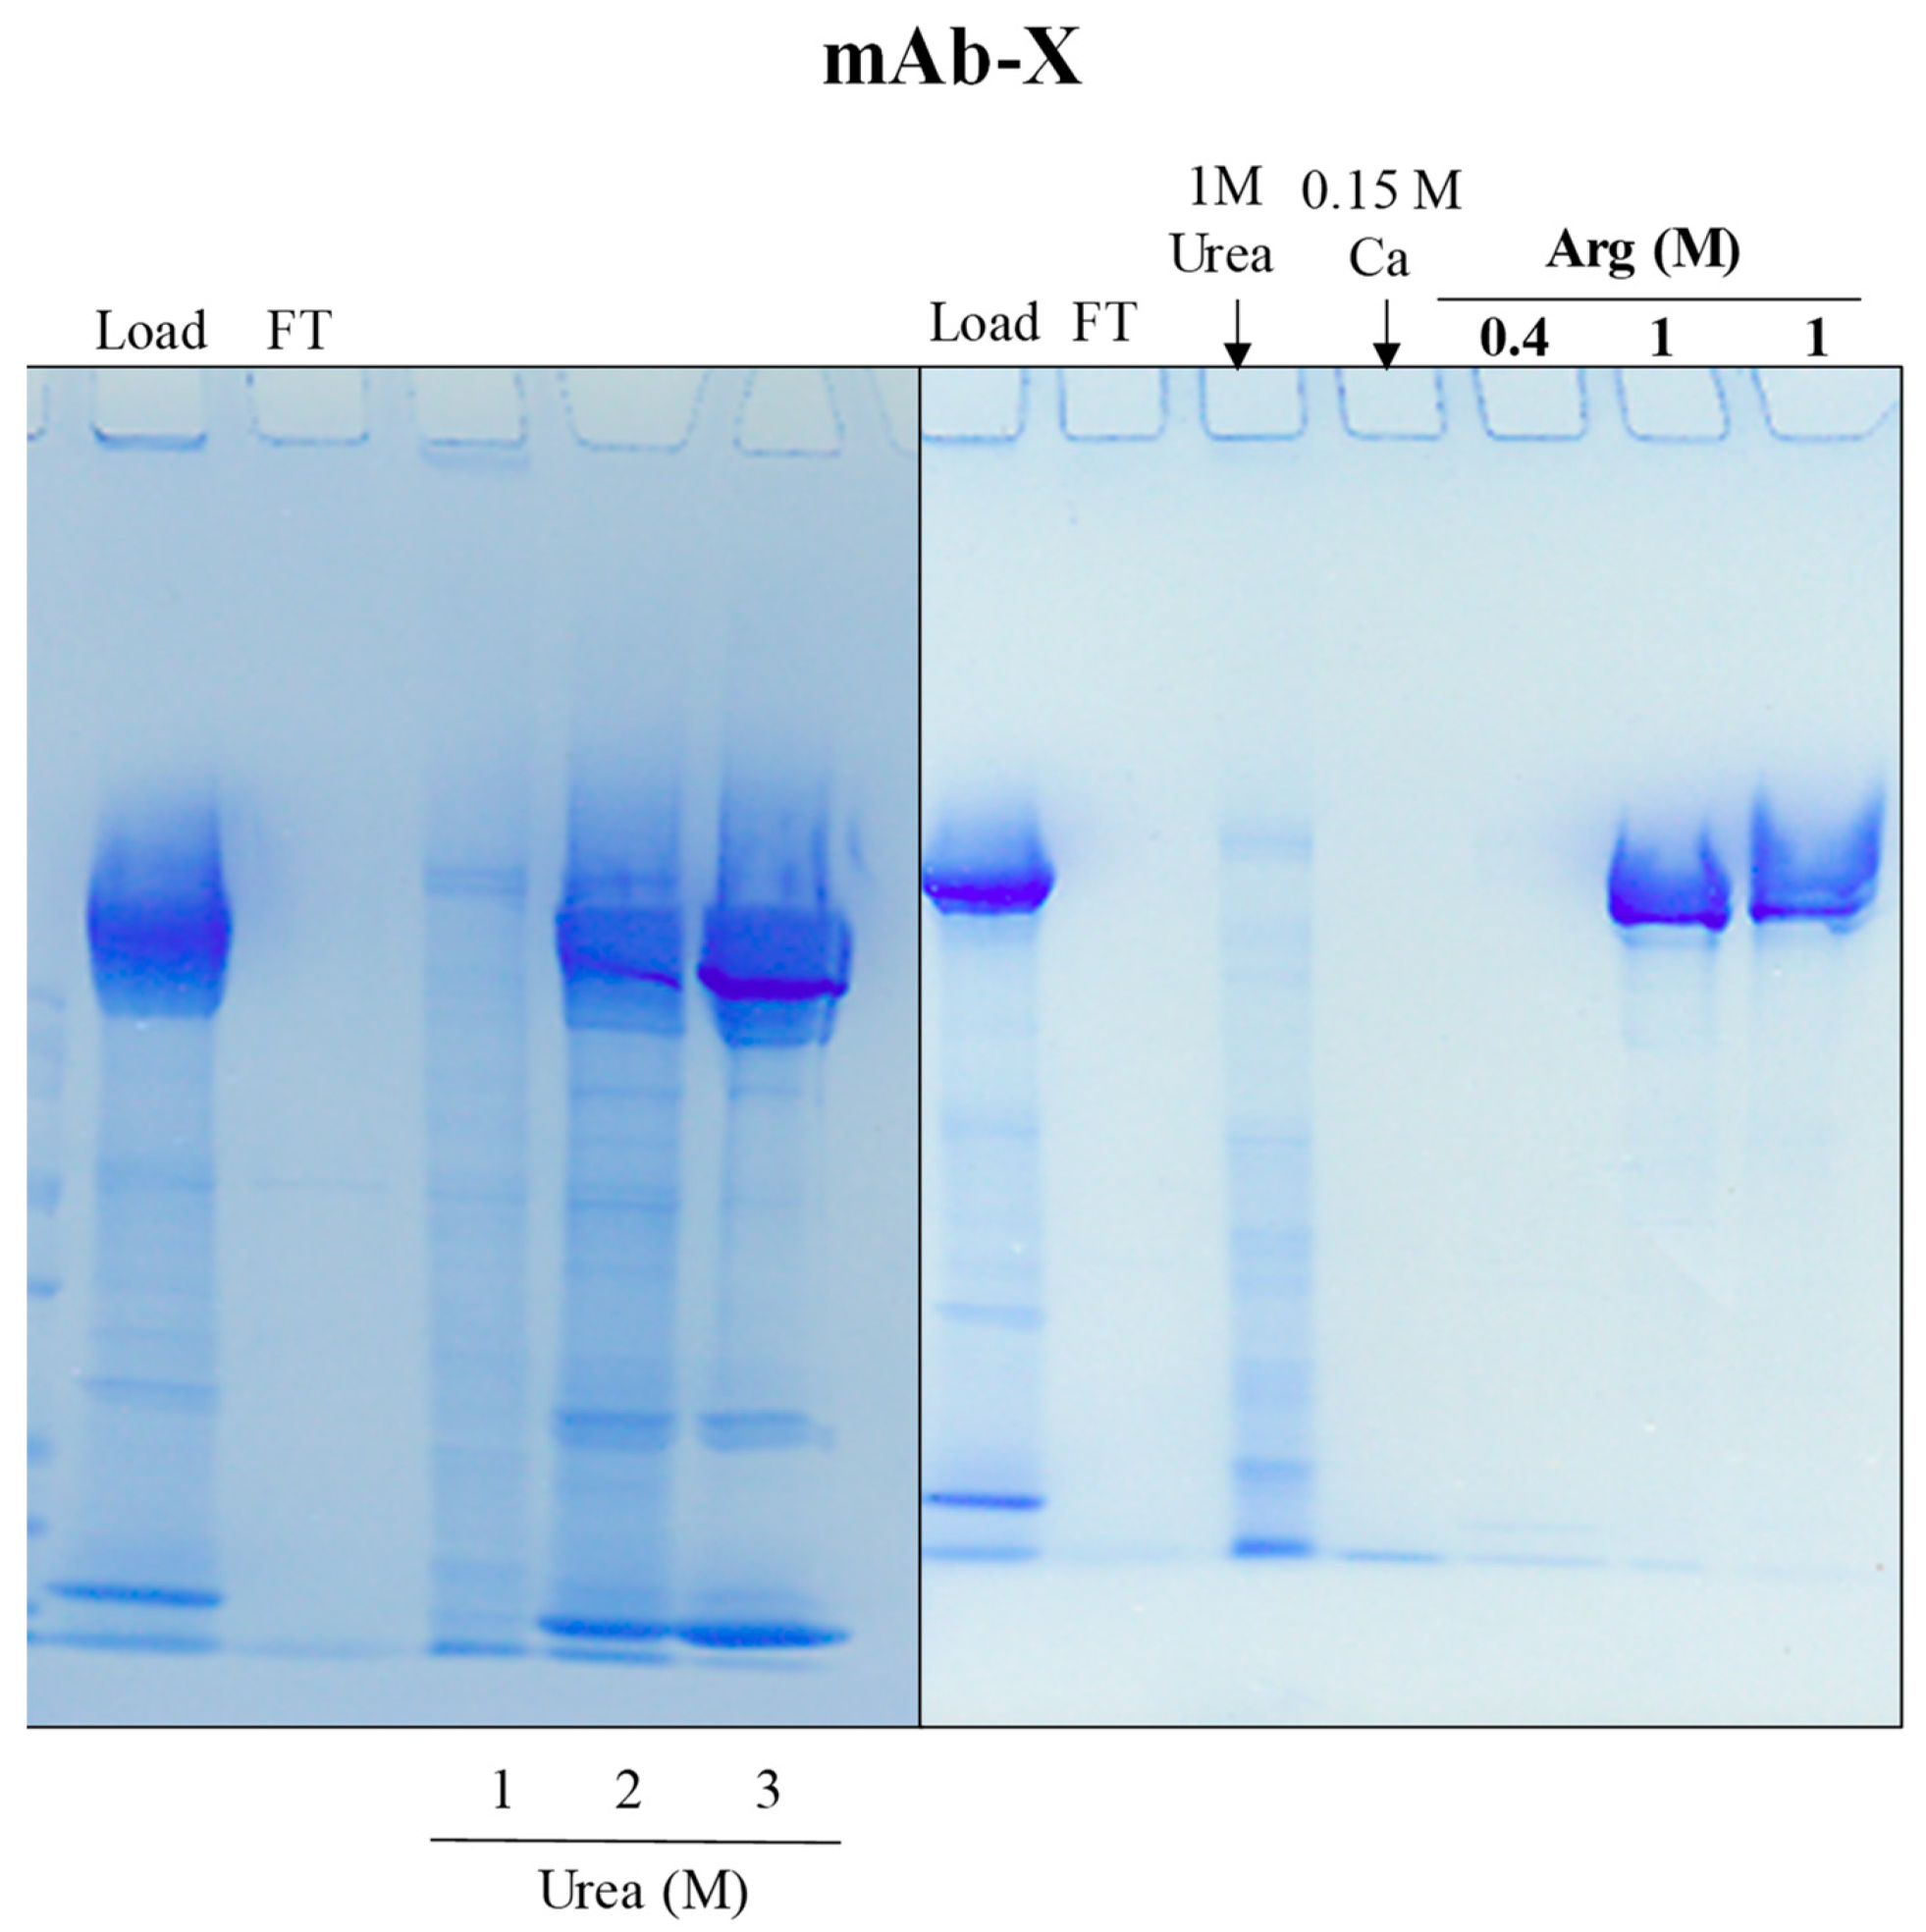
4.3. Hydroxyapatite Chromatography
4.4. Salting-Out Chromatography
5. Conclusions
Author Contributions
Funding
Data Availability Statement
Acknowledgments
Conflicts of Interest
References
- Fishman, J.B.; Berg, E.A. Antibody purification and storage. Cold Spring Harb. Protoc. 2019. [Google Scholar] [CrossRef] [PubMed]
- Liu, H.F.; Ma, J.; Winter, C.; Bayer, R. Recovery and purification process development for monoclonal antibody production. mAbs 2010, 2, 480–499. [Google Scholar] [CrossRef] [PubMed]
- Arakawa, T.; Philo, J.S.; Tsumoto, K.; Yumioka, R.; Ejima, D. Elution of antibodies from a protein-A column by aqueous arginine solutions. Protein Expr. Purif. 2004, 36, 244–248. [Google Scholar] [CrossRef] [PubMed]
- Martsev, S.P.; Kravchuk, Z.I.; Vlasov, A.P. Large increase in thermal stability of the CH2 domain of rabbit IgG after acid treatment as evidence by differential scanning calorimetry. Immunol. Lett. 1994, 43, 149–152. [Google Scholar] [CrossRef] [PubMed]
- Ejima, D.; Tsumoto, K.; Fukada, H.; Yumioka, R.; Nagase, K.; Arakawa, A.; Philo, J.S. Effects of acid exposure on the conformation, stability, and aggregation of monoclonal antibodies. Proteins 2007, 66, 954–962. [Google Scholar] [CrossRef] [PubMed]
- Imamura, H.; Honda, S. pH-shift stress on antibodies. Methods Enzymol. 2019, 622, 329–345. [Google Scholar] [CrossRef]
- Carter-Franklin, J.N.; Victa, C.; McDonald, P.; Fahrner, R. Fragments of protein A eluted during affinity chromatography. J. Chormatogra. A 2007, 1163, 105–111. [Google Scholar] [CrossRef]
- Li, Y.; Stern, D.; Lock, L.L.; Mills, J.; Ou, S.H.; Morrow, M.; Xu, X.; Ghose, S.; Li, Z.J.; Cui, H. Emerging biomaterials for downstream manufacturing of therapeutic proteins. Acta Biomater. 2019, 95, 73–90. [Google Scholar] [CrossRef]
- Li, C.; Arakawa, T. Agarose native gel electrophoresis of proteins. Int. J. Biol. Macromol. 2019, 140, 668–671. [Google Scholar] [CrossRef]
- Li, C.; Akuta, T.; Nakagawa, M.; Sato, R.; Shibata, T.; Maruyama, T.; Okumura, C.J.; Kurosawa, Y.; Arakawa, T. Agarose native gel electrophoresis for characterization of antibodies. Int. J. Biol. Macromol. 2021, 172, 589–596. [Google Scholar] [CrossRef]
- Arakawa, T.; Nakagawa, M.; Tomioka, Y.; Sakuma, C.; Li, C.; Sato, T.; Sato, R.; Shibata, T.; Kurosawa, Y.; Akuta, T. Gel-electrophoresis based method for biomolecular interaction. Methods Cell Biol. 2022, 169, 67–95. [Google Scholar] [CrossRef]
- Fishman, J.B.; Berg, E.A. Ammonium sulfate fractionation of antibodies. Cold Spring Harb. Protoc. 2018, 2018, 472–474. [Google Scholar] [CrossRef]
- Fallman, D.; Fahrner, R. Factorial screening of antibody purification process using three chromatography steps without protein A. J. Chromatogr. A 2004, 1024, 79–85. [Google Scholar] [CrossRef]
- Guerrier, G.P.; Schwartz, W.; Boschetti, E. New method for the selective capture of antibodies under physiological conditions. Bioseparation 2000, 9, 211–221. [Google Scholar] [CrossRef]
- Vagenende, V.; Ching, T.; Chua, R.J.; Gagnon, P. Allantoin as a solid phase adsorbent for removing endotoxins. J. Chromatogr. A 2013, 1310, 15–20. [Google Scholar] [CrossRef]
- Vagenende, V.; Ching, T.J.; Chua, R.J.; Jiang, Q.Z.; Gagnon, P. Self-assembly of lipopolysaccharide layers on allantoin crystals. Colloid Surf. B. Biointerfaces 2014, 120, 8–14. [Google Scholar] [CrossRef]
- Nian, R.; Zhang, W.; Tan, L.; Lee, J.; Bi, X.; Yang, Y.; Gan, H.T.; Gagnon, P. Advance chromatin extraction improves capture performance of protein A affinity chromatography. J. Chromatogr. A 2016, 143, 1–7. [Google Scholar] [CrossRef]
- Shukla, A.A.; Hinckley, P.J.; Gupta, P.; Yigzaw, Y.; Hubbard, B. Strategies to address aggregation during protein A chromatography. Bioprocess Int. 2005, 3, 36–44. Available online: https://bioprocessintl.com/downstream-processing/chromatography/strategies-to-address-aggregation-during-protein-a-chromatography-5120055/ (accessed on 8 February 2023).
- McMahon, M.J.; O’Kennedy, R. Polyreactivity as an acquired artefact, rather than a physiologic property, of antibodies: Evidence that monoreactive antibodies may gain the ability to bind to multiple antigens after exposure to low pH. J. Immunol. Methods. 2000, 241, 1–10. [Google Scholar] [CrossRef]
- Bouvet, J.P.; Stahl, D.; Rose, S.; Quan, C.P.; Kazatchkine, M.D.; Kaveri, S.V. Induction of natural autoantibody activity following treatment of human immunoglobulin with dissociating agents. J. Autoimmunity 2001, 16, 163–172. [Google Scholar] [CrossRef]
- Djoumerska-Alexieva, I.K.; Dimitrov, J.D.; Nacheva, J.; Kaveri, S.V.; Vassilev, T.L. Protein destabilizinmg agents induce polyreactivity and enhanced immunomodulatory activity in IVIg prepration. Autoimmunity 2009, 42, 365–367. [Google Scholar] [CrossRef] [PubMed]
- Djoumerska-Alexieva, I.K.; Dimitrov, J.D.; Voynova, E.N.; Lacroix-Desnazes, S.; Kaveri, S.V.; Vassilev, T.L. Exposure of IgG to an acidic environment results in molecular modifications and in enhanced protective activity in sepsis. FEBS J. 2010, 277, 3039–3050. [Google Scholar] [CrossRef] [PubMed]
- Fox, P.G.; Schiavetti, F.; Rappuoli, R.; McLoughlin, R.M.; Bagnoli, F. Staphylococcal protein A induces leukocyte necrosis by complexing with human immunoglobulin. mBio 2021, 12, e0089921. [Google Scholar] [CrossRef] [PubMed]
- Sakuma, C.; Sato, T.; Shibata, T.; Nakagawa, M.; Kurosawa, Y.; Okumura, C.J.; Maruyama, T.; Arakawa, T.; Akuta, T. Western blotting analysis of proteins separated by agarose native gel electrophoresis. Int. J. Biol. Macromol. 2021, 166, 1106–1110. [Google Scholar] [CrossRef] [PubMed]
- Tomioka, Y.; Nakagawa, M.; Sakuma, C.; Nagatoishi, S.; Tsumoto, K.; Arakawa, T.; Akuta, T. Ladder observation of bovine serum albumin by high resolution agarose native gel electrophoresis. Int. J. Biol. Macromol. 2022, 215, 512–520. [Google Scholar] [CrossRef]
- Burton, S.; Harding, D. Hydrophobic charge induction chromatography: Salt independent protein adsorption and facile elution with aqueous buffers. J. Chromatogr. A 1998, 814, 71–81. [Google Scholar] [CrossRef]
- Bak, H.; Thomas, O.R. Evaluation of commercial adsorbents for the direct capture of polyclonal rabbit antibodies from clarified antiserum. J. Chromatogr. B Analyt. Technol. Biomed. Life Sci. 2007, 848, 116–130. [Google Scholar] [CrossRef]
- Schwart, W.; Judd, D.; Wysocki, M.; Guerrier, L.; Birck-Wilson, E.; Boschetti, E. Comparison of hydrophobic charge induction chromatography with affinity chromatography on protein A for harvest and purification of antibodies. J. Chromatogr. A 2001, 908, 251–263. [Google Scholar] [CrossRef]
- Arakawa, T.; Kita, Y.; Sato, H.; Ejima, D. MEP chromatography of antibody and Gc-fusion protein using aqueous arginine solution. Protein Expr. Purif. 2009, 63, 158–163. [Google Scholar] [CrossRef]
- Arakawa, T.; Futatsumori-Sugai, M.; Tsumoto, K.; Kita, Y.; Sato, H.; Ejima, D. MEP hyperCel chromatography II: Binding, washing and elution. Protein Expr. Purif. 2010, 71, 168–173. [Google Scholar] [CrossRef]
- Arakawa, T.; Tsumoto, K. The effects of arginine on refolding of aggregated proteins: Not facilitate refolding, but suppress aggregation. Biochem. Biophys. Res. Commun. 2003, 304, 148–152. [Google Scholar] [CrossRef]
- Arakawa, T.; Ejima, D.; Tsumoto, K.; Obeyama, N.; Tanaka, Y.; Kita, Y.; Timasheff, S.N. Suppression of protein interactions by arginine: A proposed mechanism of the arginine effects. Biophys. Chem. 2007, 127, 1–8. [Google Scholar] [CrossRef]
- Tsumoto, K.; Ejima, D.; Kita, Y.; Arakawa, T. Review: Why is arginine effective in suppressing aggregation? Protein Pept. Lett. 2005, 12, 613–619. [Google Scholar] [CrossRef]
- Kita, Y.; Arakawa, T.; Lin, T.-Y.; Timasheff, S.N. Contribution of the surface free energy perturbation to protein-solvent interactions. Biochemistry 1994, 33, 15178–15189. [Google Scholar] [CrossRef]
- Arakawa, T.; Ejima, D.; Tsumoto, K.; Ishibashi, M.; Tokunaga, M. Improved performance of column chromatography by arginine: Dye-affinity chromatography. Protein Expr. Purif. 2007, 52, 410–414. [Google Scholar] [CrossRef]
- Ejima, D.; Yumioka, R.; Tsumoto, K.; Arakawa, T. Effective elution of antibodies by arginine and arginine derivatives in affinity column chromatography. Anal. Biochem. 2005, 345, 250–257. [Google Scholar] [CrossRef]
- Nozaki, Y.; Tanford, C. The solubility of amino acids and related compounds in aqueous urea solutions. J. Biol. Chem. 1963, 238, 4074–4081. [Google Scholar] [CrossRef]
- Nozaki, Y.; Tanford, C. The solubility of amino acids and two glycine peptides in aqueous ethanol and dioxane solutions. Establishment of a hydrophobicity scale. J. Biol. Chem. 1971, 246, 2211–2217. Available online: https://www.jbc.org/article/S0021-9258(19)77210-X/pdf (accessed on 8 February 2023). [CrossRef]
- Klotz, A.M. Equilibrium constants and free energies in unfolding of proteins in urea solutions. Proc. Natl. Acad. Sci. USA 1996, 93, 14411–14415. [Google Scholar] [CrossRef]
- Sakhninim, L.I.; Pedersen, A.K.; León, I.R.; Greisen, P.J.; Hansen, J.J.; Vester-Christensen, M.B.; Bülow, L.; Dainiak, M.B. Optimization selectivity of anion hydrophobic multimodal chromatography for purification of a single-chain variable fragment. Eng. Life Sci. 2019, 19, 490–501. [Google Scholar] [CrossRef]
- Wu, M.; Zhang, F.; Liang, Y.; Wang, R.R.; Chen, Z.; Lin, J.; Yang, L. Isolation and purification of immunoglobulin G from bovine colostrums by hydrophobic charge-induction chromatography. J. Dairy Sci. 2015, 98, 2973–2981. [Google Scholar] [CrossRef] [PubMed] [Green Version]
- Heidebrecht, H.J.; Kainz, B.; Schopf, R.; Godl, K.; Karcier, Z.; Kulozik, U.; Förster, B. Data concerning the chromatographic isolation of bovine IgG from milk- and colostral whey. Data Brief 2018, 21, 527–539. [Google Scholar] [CrossRef] [PubMed]
- Wang, Y.; Chen, Q.; Xian, M.; Nian, R.; Xu, F. Application of enhanced electronegative multimodal chromatography as the primary capture step for immunoglobulin G purification. AMB Expr. 2018, 9, 93–99. [Google Scholar] [CrossRef] [PubMed]
- Arakawa, T.; Kurosawa, Y.; Storms, M.; Maruyama, T.; Okumura, C.J.; Kita, Y. Capto MMC mixed-mode chromatography of murine and rabbit antibodies. Protein Expr. Purif. 2016, 127, 105–110. [Google Scholar] [CrossRef]
- Kawasaki, T.; Takahashi, S.; Ikeda, K. Hydroxyapatite high-performance liquid chromatography: Column performance for proteins. Eur. J. Biochem. 1985, 152, 361–371. [Google Scholar] [CrossRef]
- Gorbunoff, M. The interaction of proteins with hydroxyapatite. I. Role of protein charge and structure. Anal. Biochem. 1984, 136, 425–432. [Google Scholar] [CrossRef]
- Gagnon, P. Monoclonal antibody purification with hydroxyapatite. New Biotechnol. 2009, 25, 287–293. [Google Scholar] [CrossRef]
- Gagnon, P.; Hensel, F.; Richieri, R. Purification of IgM monoclonal antibodies. BioPharm Int. 2008, 2008, 26–35. Available online: https://www.biopharminternational.com/view/purification-igm-monoclonal-antibodies (accessed on 8 February 2023).
- Gagnon, P.; Ng, P.K. New opportunities for managing DNA with ceramic hydroxyapatite and ceramic fluorapatite. Bioprocess Int. 2005, 3, 52–54. Available online: https://www.bio-rad.com/webroot/web/pdf/ps/literature/Bulletin_RP0033.pdf (accessed on 8 February 2023).
- Lee, J.; Gan, H.T.; Latiff, S.M.; Chuah, C.; Lee, W.Y.; Yang, Y.S.; Loo, B.; Ng, S.K.; Gagnon, P. Principles and applications of steric exclusion chromatography. J. Chromatogr. A 2012, 1270, 162–170. [Google Scholar] [CrossRef]
- Boem, H.P. Surface oxides on carbon and their analysis: A critical assessment. Carbon 2002, 40, 145–149. [Google Scholar] [CrossRef]
- Abe, T. Fundamentals of activated carbon. Seikatsu Eisei 1993, 37, 163–170. [Google Scholar] [CrossRef]
- Ishihara, T.; Miyahara, M.; Yamada, T.; Yamamoto, K. Innovative next-generation monoclonal antibody purification using activated carbon: A challenge for flow-through and column-free processes. J. Chromatogr. B Analyt. Technol. Biomed. Life Sci. 2019, 1121, 72–81. [Google Scholar] [CrossRef]
- Kikuchi, S.; Ishihara, T.; Yamamoto, K.; Hosono, M. Virus clearance by activated carbon for therapeutic monoclonal antibody purification. J. Chromatogr. B Analyt. Technol. Biomed. Life Sci. 2022, 1195, 123163. [Google Scholar] [CrossRef]
- Cunningham, O.; Scott, M.; Zhou, Z.S.; Finlay, W.J.J. Polyreactivity in therapeutic antibody development: Risk factors for failure in preclinical and clinical development companies. MABS 2021, 13, e1999195. [Google Scholar] [CrossRef]


| Method | Merit | Demerit | Remark | Providers |
|---|---|---|---|---|
| Gel elution | No binding to solid support. | Small scale Recovery. | Separation dependent on pI of Ab. | Ultrapure agarose (Thermo Fisher Scientific) Metaphor agarose (Lonza) |
| MEP | Direct loading from harvest Simple elution. | Low DBC. No Ab specificity. | Critical column wash. | MEP HyperCel (Sartorius, etc.) |
| Ion-exchange mixed-mode | Direct loading from harvest Robust binding. | Difficult elution. | Avoid harsh elution condition. | Capto MMC (Cytiva) Nuvia aPrime 4A (Bio-Rad Laboratories) |
| Hydroxyapatite | Binding with high salt or arginine. | Unpredictable binding and elution. | Choice of pH above neutral. Elution by NaCl followed by phosphate. | Hydroxyapatite (Bio-Rad Laboratories) |
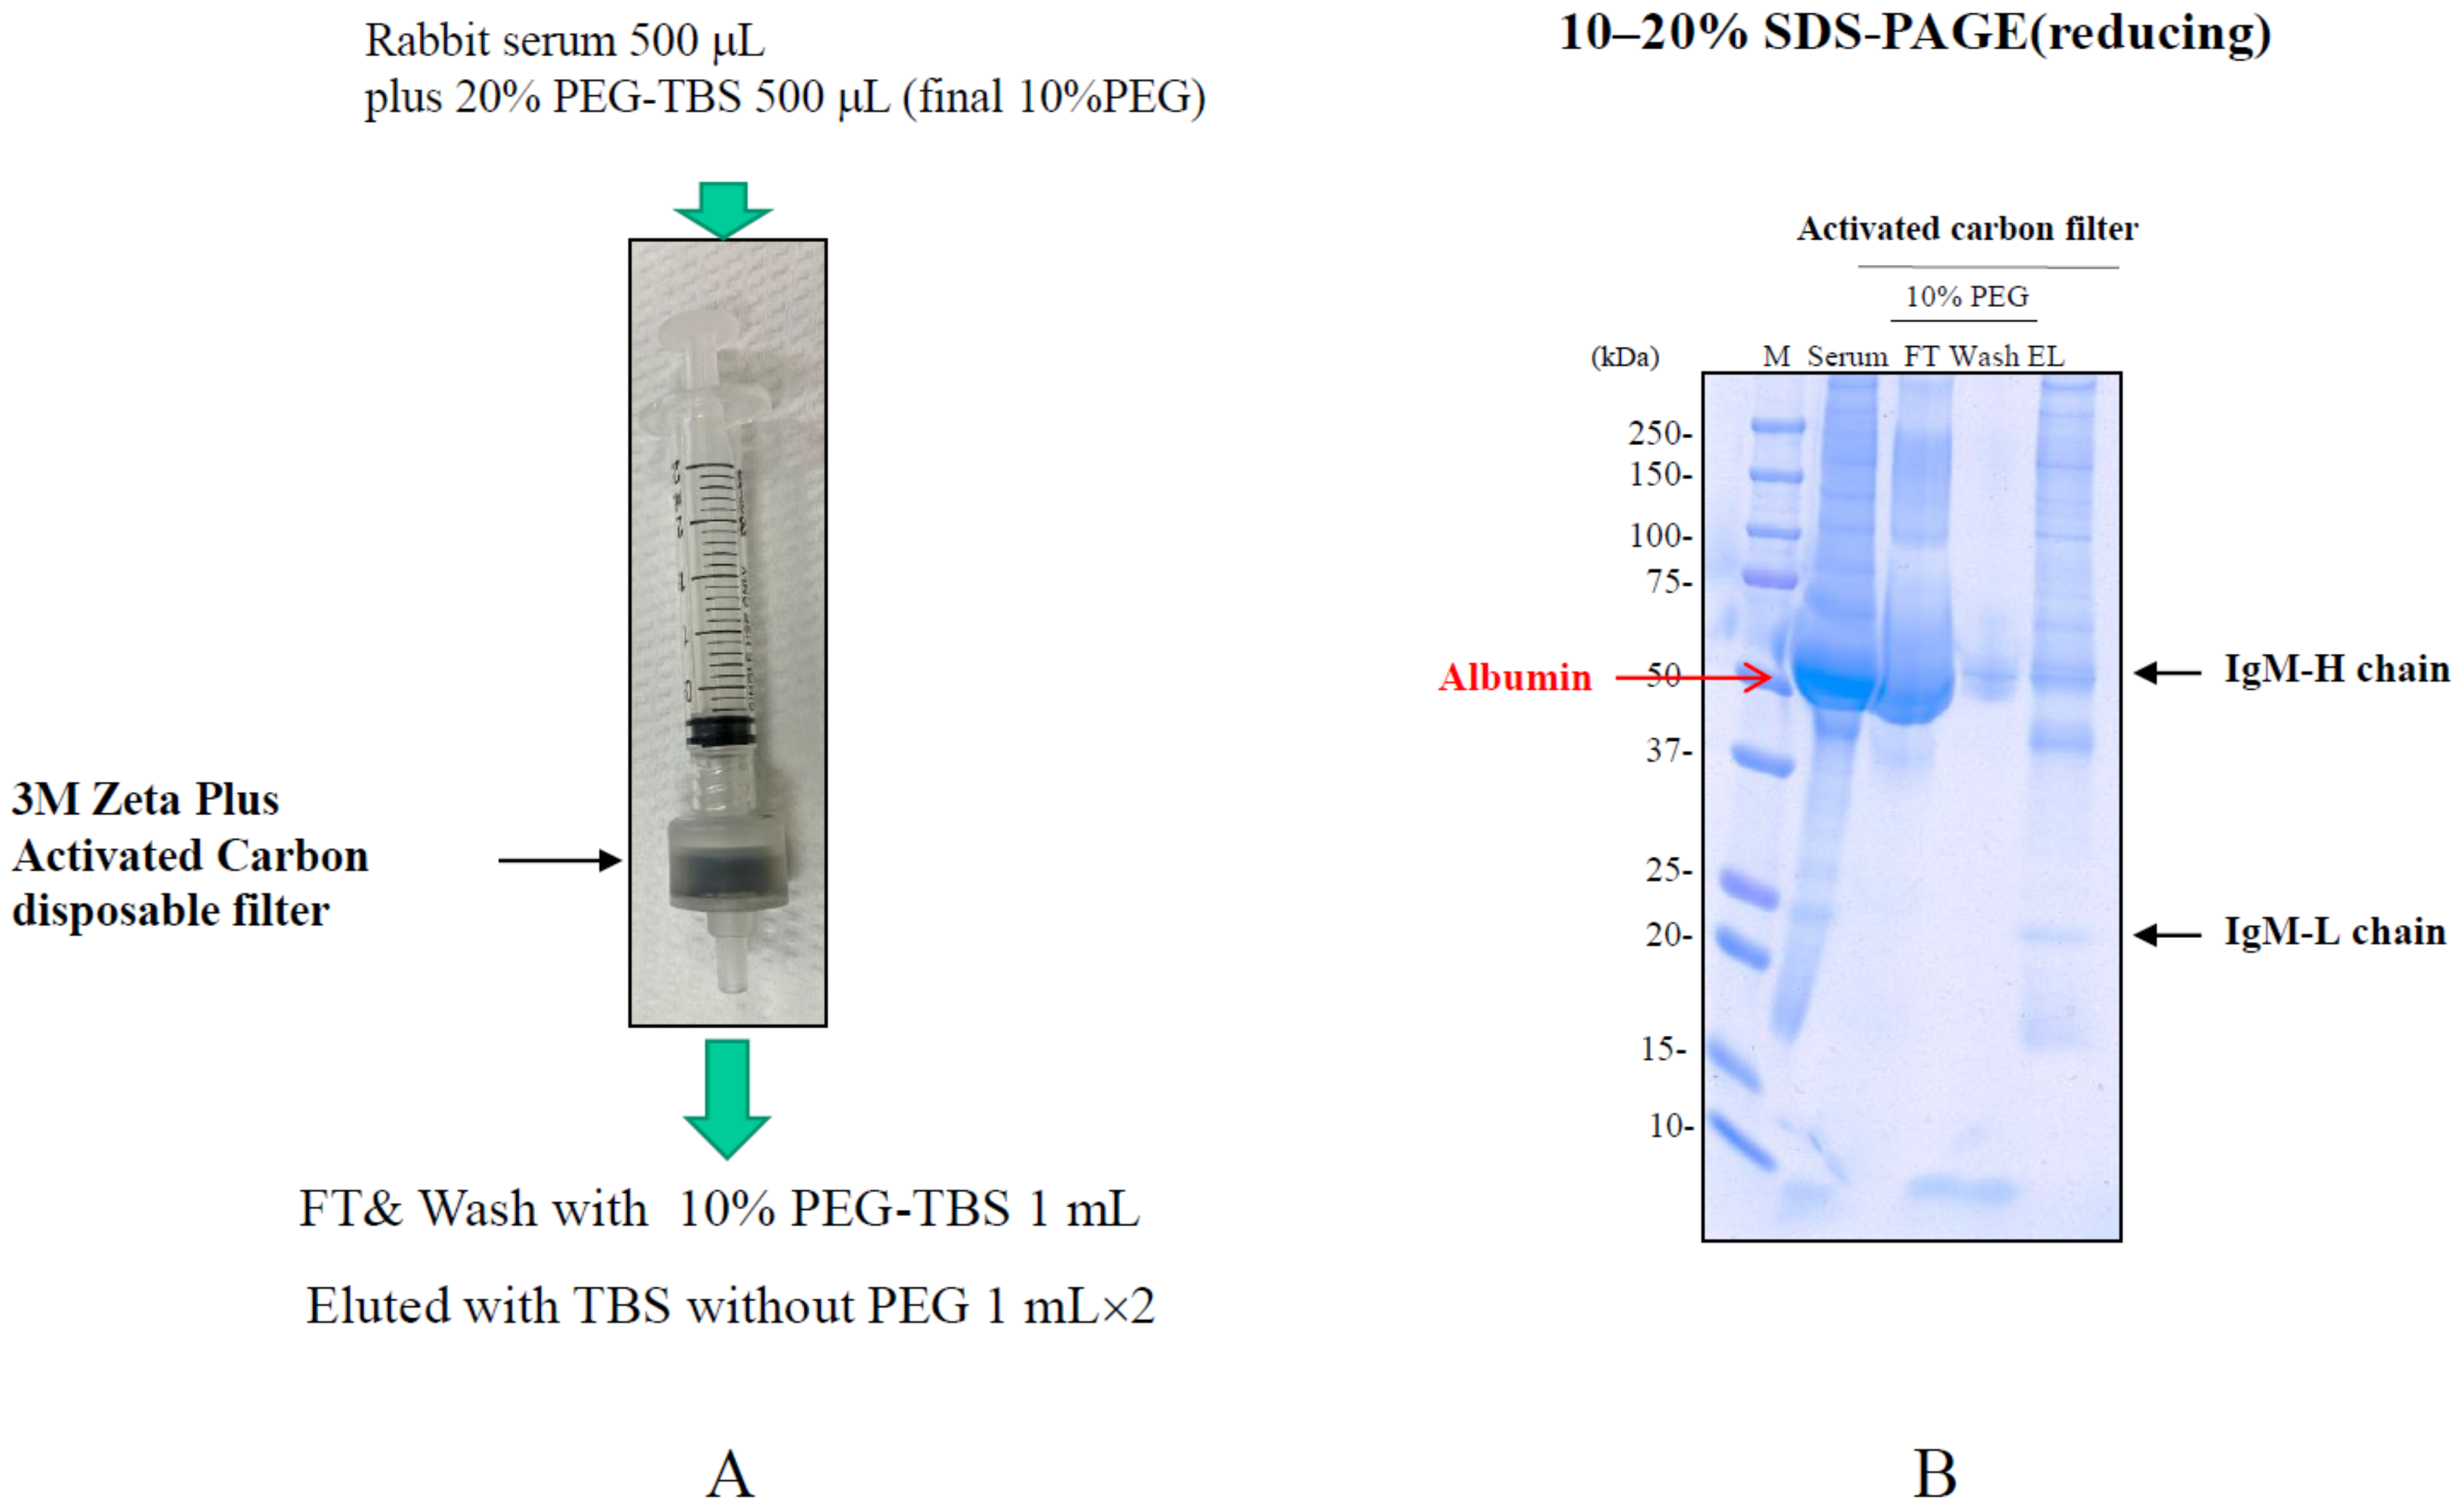
| Salting-out | High DBC. | Requirement of salting-out condition. | Differential elution of contaminants and Ab. | 3M Zeta Plus Activated Carbon disposable filter (3M) |
Disclaimer/Publisher’s Note: The statements, opinions and data contained in all publications are solely those of the individual author(s) and contributor(s) and not of MDPI and/or the editor(s). MDPI and/or the editor(s) disclaim responsibility for any injury to people or property resulting from any ideas, methods, instructions or products referred to in the content. |
© 2023 by the authors. Licensee MDPI, Basel, Switzerland. This article is an open access article distributed under the terms and conditions of the Creative Commons Attribution (CC BY) license (https://creativecommons.org/licenses/by/4.0/).
Share and Cite
Arakawa, T.; Tomioka, Y.; Nakagawa, M.; Sakuma, C.; Kurosawa, Y.; Ejima, D.; Tsumoto, K.; Akuta, T. Non-Affinity Purification of Antibodies. Antibodies 2023, 12, 15. https://doi.org/10.3390/antib12010015
Arakawa T, Tomioka Y, Nakagawa M, Sakuma C, Kurosawa Y, Ejima D, Tsumoto K, Akuta T. Non-Affinity Purification of Antibodies. Antibodies. 2023; 12(1):15. https://doi.org/10.3390/antib12010015
Chicago/Turabian StyleArakawa, Tsutomu, Yui Tomioka, Masataka Nakagawa, Chiaki Sakuma, Yasunori Kurosawa, Daisuke Ejima, Kouhei Tsumoto, and Teruo Akuta. 2023. "Non-Affinity Purification of Antibodies" Antibodies 12, no. 1: 15. https://doi.org/10.3390/antib12010015