Article

Agricultural Drought Risk Assessment Based on a Comprehensive Model Using Geospatial Techniques in Songnen Plain, China

1
School of Public Administration and Law, Northeast Agricultural University, Harbin 150036, China
2
School of Resources and Environment, Northeast Agricultural University, Harbin 150036, China
*
Author to whom correspondence should be addressed.
Land 2023, 12(6), 1184; https://doi.org/10.3390/land12061184
Submission received: 10 May 2023 / Revised: 28 May 2023 / Accepted: 2 June 2023 / Published: 5 June 2023
(This article belongs to the Topic Natural Hazards and Disaster Risks Reduction)

Abstract

:
Drought is a damaging and costly natural disaster that will become more serious in the context of global climate change in the future. Constructing a reliable drought risk assessment model and presenting its spatial pattern could be significant for agricultural production. However, agricultural drought risk mapping scientifically still needs more effort. Considering the whole process of drought occurrence, this study developed a comprehensive agricultural drought risk assessment model that involved all risk components (exposure, hazard, vulnerability and mitigation capacity) and their associated criteria using geospatial techniques and fuzzy logic. The comprehensive model was applied in Songnen Plain to justify its applicability. ROC and AUC techniques were applied to evaluate its efficiency, and the prediction rate was 88.6%. The similar spatial distribution of water resources further verified the model’s reliability. The southwestern Songnen Plain is a very-high-risk (14.44%) region, determined by a high vulnerability, very high hazardousness and very low mitigation capacity, and is the region that should be paid the most attention to; the central part is a cross-risk region of high risk (24.68%) and moderate risk (27.28%) with a serious disturbance of human agricultural activities; the northeastern part is a dry grain production base with a relatively optimal agricultural production condition of very low risk (22.12%) and low risk (11.48%). Different drought mitigation strategies should be adopted in different regions due to different drought causes. The findings suggest that the proposed model is highly effective in mapping comprehensive drought risk for formulating strong drought mitigation strategies and could be used in other drought-prone areas.

1. Introduction

Drought is a recurring natural disaster that can destroy agricultural production, economic development, water resource utilization and the ecological environment, causing higher financial losses in the long run than any other meteorological disaster [1,2,3,4]. Droughts can negatively affect agricultural production and sustainable development by exacerbating water scarcity through surface water and groundwater resource depletion [5,6]. The direct economic losses caused by drought-related disasters in China were approximately CNY 90.971 billion in 2014 [7], and the frequency and intensity of droughts are constantly rising due to human activities and the variability of hydro-meteorological variables caused by climate change [8,9,10]. Therefore, understanding the spatial pattern of agricultural drought risk (ADR) is essential for alleviating the adverse consequences of agricultural drought and guaranteeing regional food security.
The formulation and implementation of effective agricultural drought mitigation measures are the prerequisites for reducing their negative consequences, and drought risk mapping is an effective tool for this issue [11,12]. To the best of our knowledge, drought risk mapping has received extensive academic attention mainly from four aspects: meteorology, hydrology, agriculture and socio-economy [13,14,15]. Most previous research developed various drought indexes from the concept model accepted by the Intergovernmental Panel on Climate Change (IPCC) and the United Nations Office for Disaster Risk Reduction (UNDRR) [16], including the Palmer Drought Severity Index (PDSI) [17], the Standardized Precipitation Index (SPI) [18], the Standardized Precipitation Evapotranspiration Index (SPEI) [19], the Standardized Runoff Index (SRI) [20] and so on. For example, Ionita et al. used the meteorological drought index, including SPI and the Reconnaissance Drought Index (RDI), to monitor drought conditions in Australia [21]. Sein et al. used SPEI to explore the spatial and temporal changes of drought in Myanmar [22]. Along with the development of remote sensing and spatial analysis, new physical factors such as temperature, topography and vegetation and socioeconomic factors such as irrigation were involved in the evaluation to improve the mapping accuracy [12,23,24]. These findings stressed the process and physical mechanisms of ADR and preliminarily revealed the complex drought–climate relationship [25,26,27]. However, most of the previous studies focused on either the drought hazards intensity and the vulnerability of farming areas to drought events from the meteorological or hydrological aspect [28,29] or their combination with limited criteria [12,23]. They emphasized the long-term risk trend and ignored the spatial heterogeneity of natural factors and the alleviation capacity of social measures [25,27], and were insufficient in supporting a reliable ADR assessment. In fact, the risk of drought results from interactions between exposure, hazard, vulnerability and the mitigation capacity, and its spatial pattern needs to consider the whole process of drought occurrence. However, few research studies have paid enough attention to this point, and the construction of a robust and comprehensive drought risk assessment method requires an in-depth study.
It is a systematic project to address such a comprehensive ADR assessment model, inseparable from the support of a large number of spatial and non-spatial datasets [30]. Thus, how to effectively organize and process these multi-source data is another crucial matter in drought risk mapping. A multi-criteria mapping approach using geospatial techniques is considered to be highly useful in coping with this detailed information [16,31], and several relevant assessment methods have been used to map various natural disasters, e.g., machine learning (ML) [32,33,34], statistical models (SMs) [35,36,37] and multiple-criteria decision analysis (MCDM) (AHP, FAHP, fuzzy logic, etc.) [38,39,40]. The ML method is viable for analyzing the complex relationships between topo-hydrological factors and historical drought events [41] and has advanced the drought assessment process to some extent in recent decades. However, it has never been used for spatially explicit ADR assessment due to its high dependence on weather station data and it largely ignoring the spatial heterogeneity of the predictor variables [42]. Statistical models perform well in assessing the drought risk probability of different intensities, but it is difficult to apply them to a large scale-evaluation because they extract information from a large number of sample data with complex operations [43,44]. Meanwhile, they are defective in considering the complexity of hazard factors and the influence of mitigation capacity on drought risk mapping [45,46]. MCDM (AHP, FAHP, fuzzy logic, etc.) techniques have been proven to be the best assessment tools among all other risk assessment models [47]. Nonetheless, it is most prudent to use fuzzy logic to minimize subjectivity and inaccuracy in multi-criteria decision making. Integrating fuzzy logic into spatial techniques for hazard susceptibility mapping may provide more realistic spatial information for drought management strategies [48,49].
Songnen Plain, lying in the easternmost part of Asia’s arid and semi-arid zone, is a region sensitive to climate warming and prone to drought disasters [6]. As an essential national commercial grain base, the water resources in Songnen Plain are scarce in some regions, with uneven spatial distribution, making it a highly rain-fed region and badly restricting the agricultural production there. Extreme drought events may lead to crop reduction or even no harvest and seriously threaten regional or national food security [50]. Therefore, clarifying regional water resources and ADR could be significant for agricultural drought management. This study aimed to develop a comprehensive ADR mapping method incorporating all drought risk components with their relevant criteria using geospatial techniques and to verify its rationality and accuracy in Songnen Plain. The spatial pattern of ADR was analyzed to stress more applicable drought management strategies. Taking Songnen Plain as the study area, the objectives of this paper were to: (1) develop a comprehensive drought risk assessment approach integrating all components of risk with their relevant criteria; (2) weight the criteria using fuzzy logic and generate the spatial pattern of ADR using geospatial techniques; and (3) spatially overlay the ADR map with water resources to identify actual problems and to set countermeasures.

2. Materials and Methodology

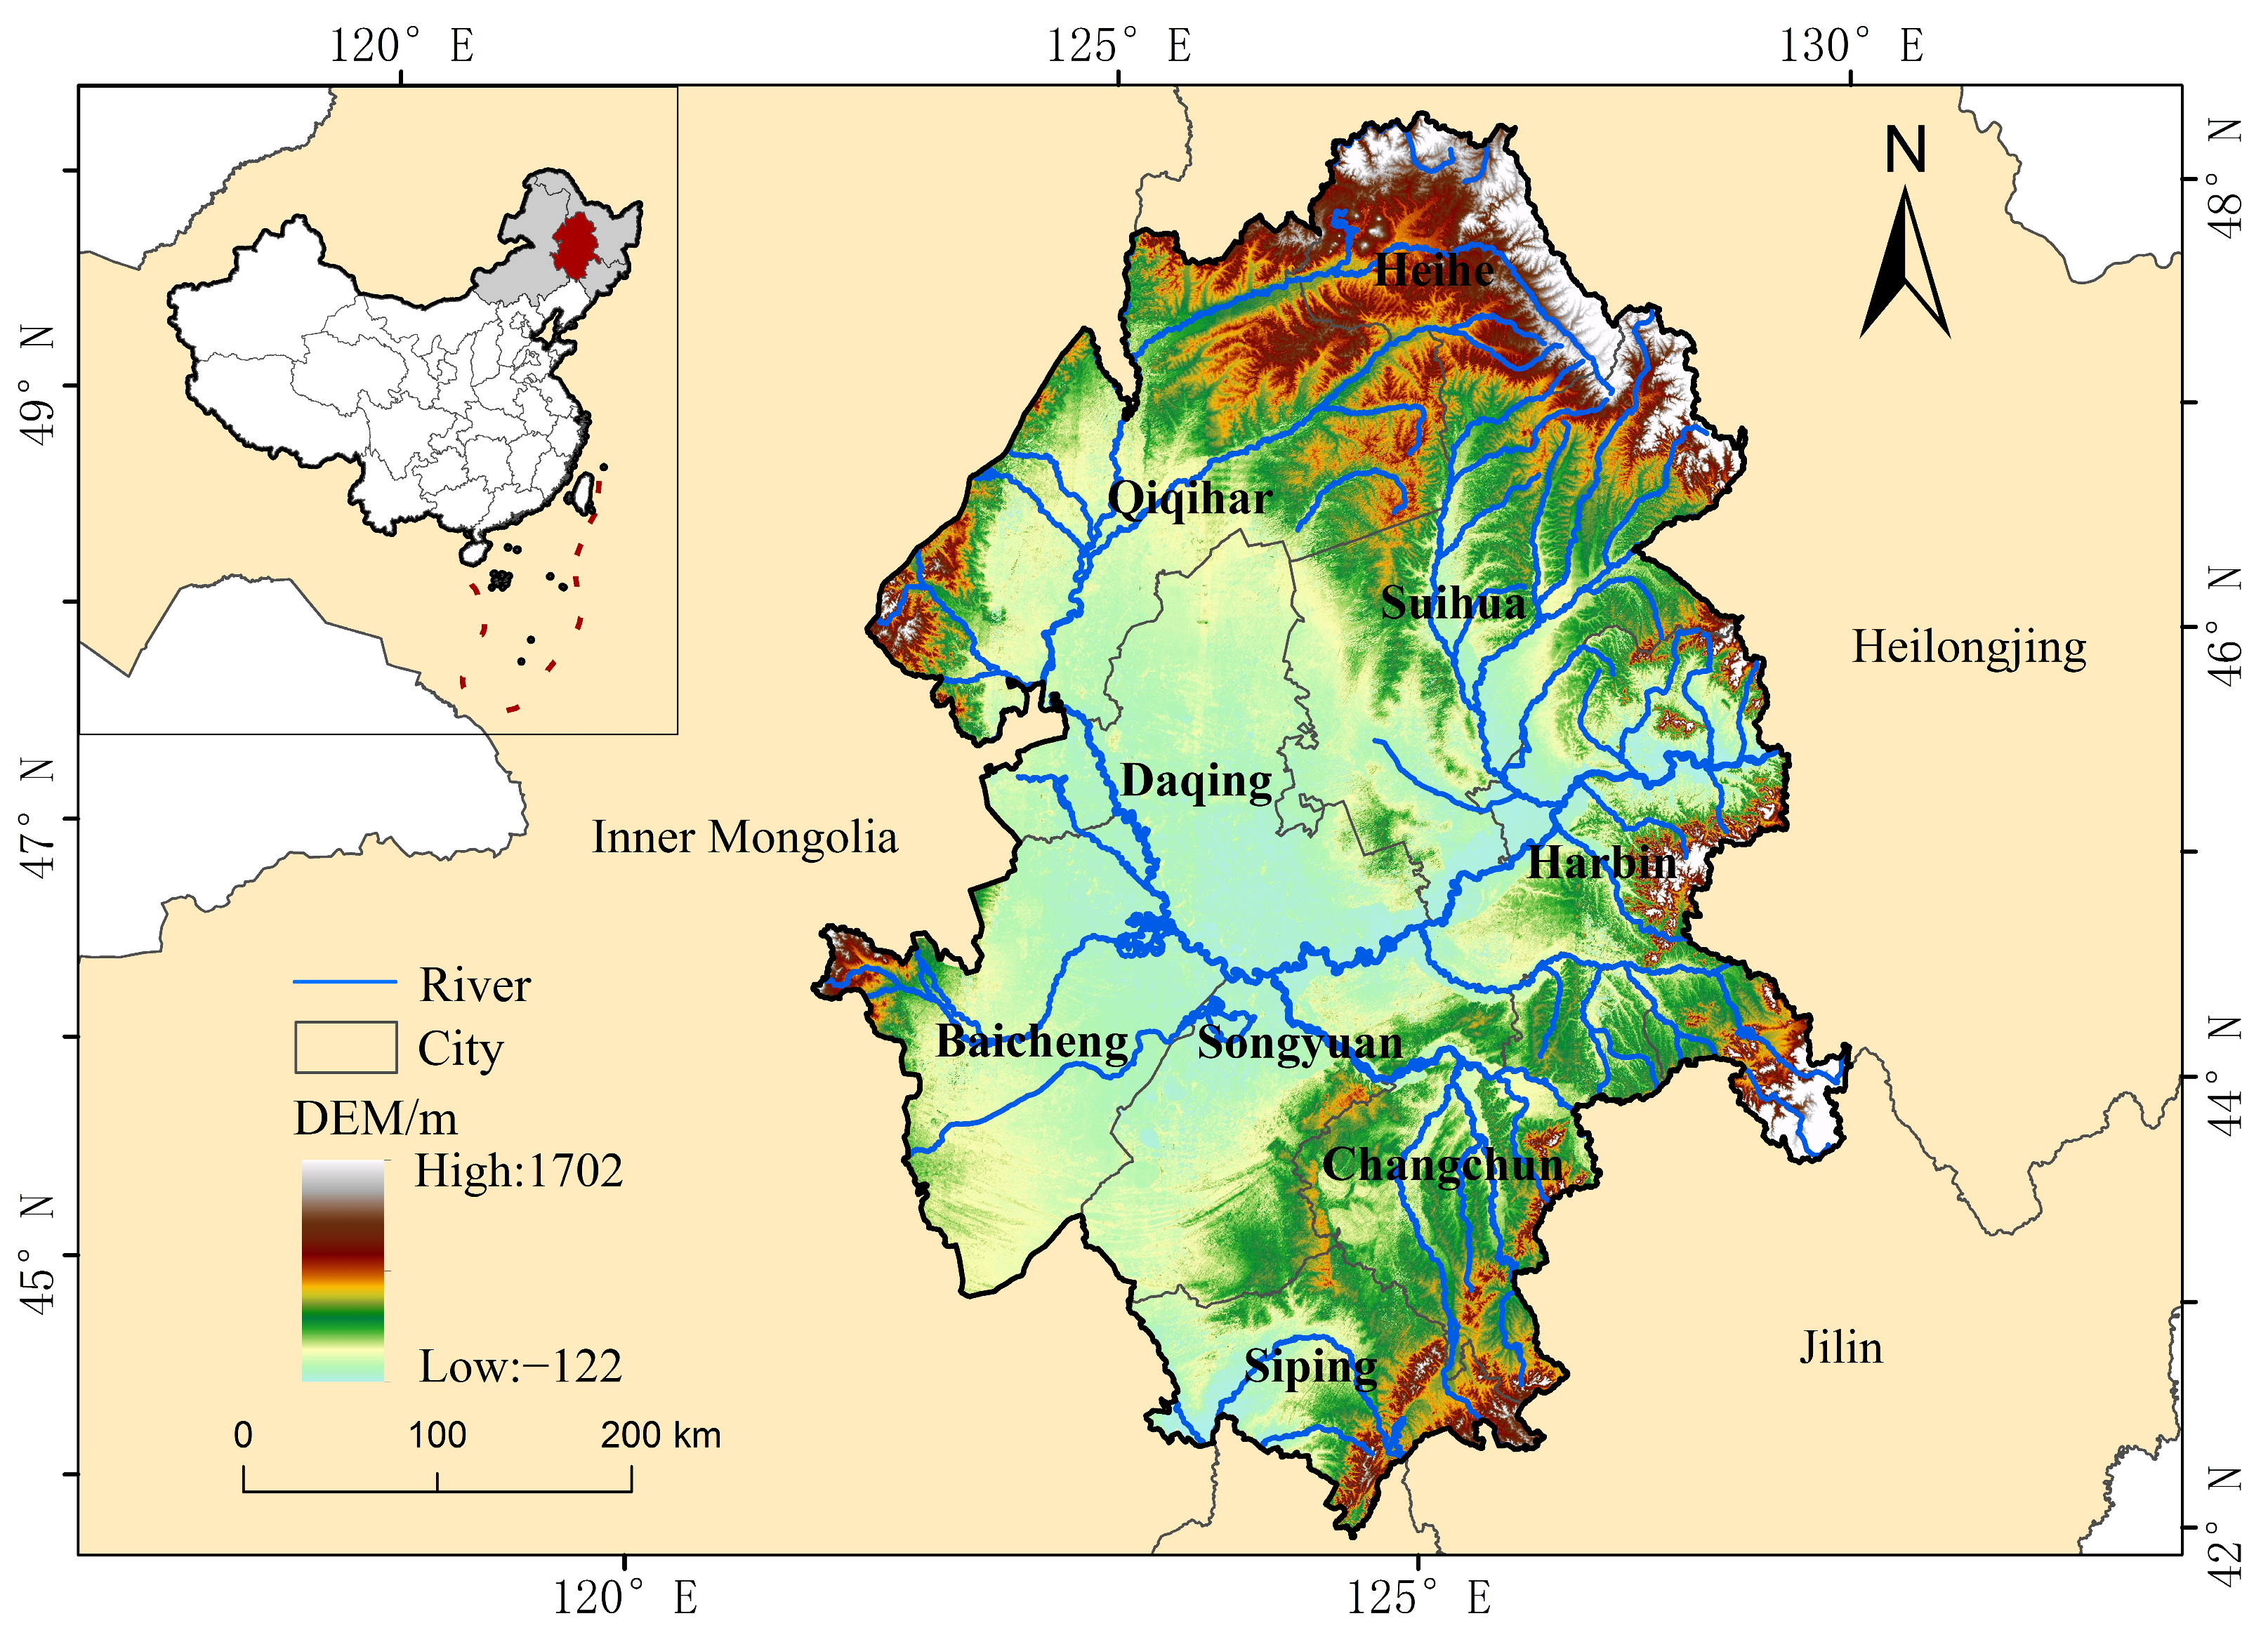
2.1. Study Area and Data Source
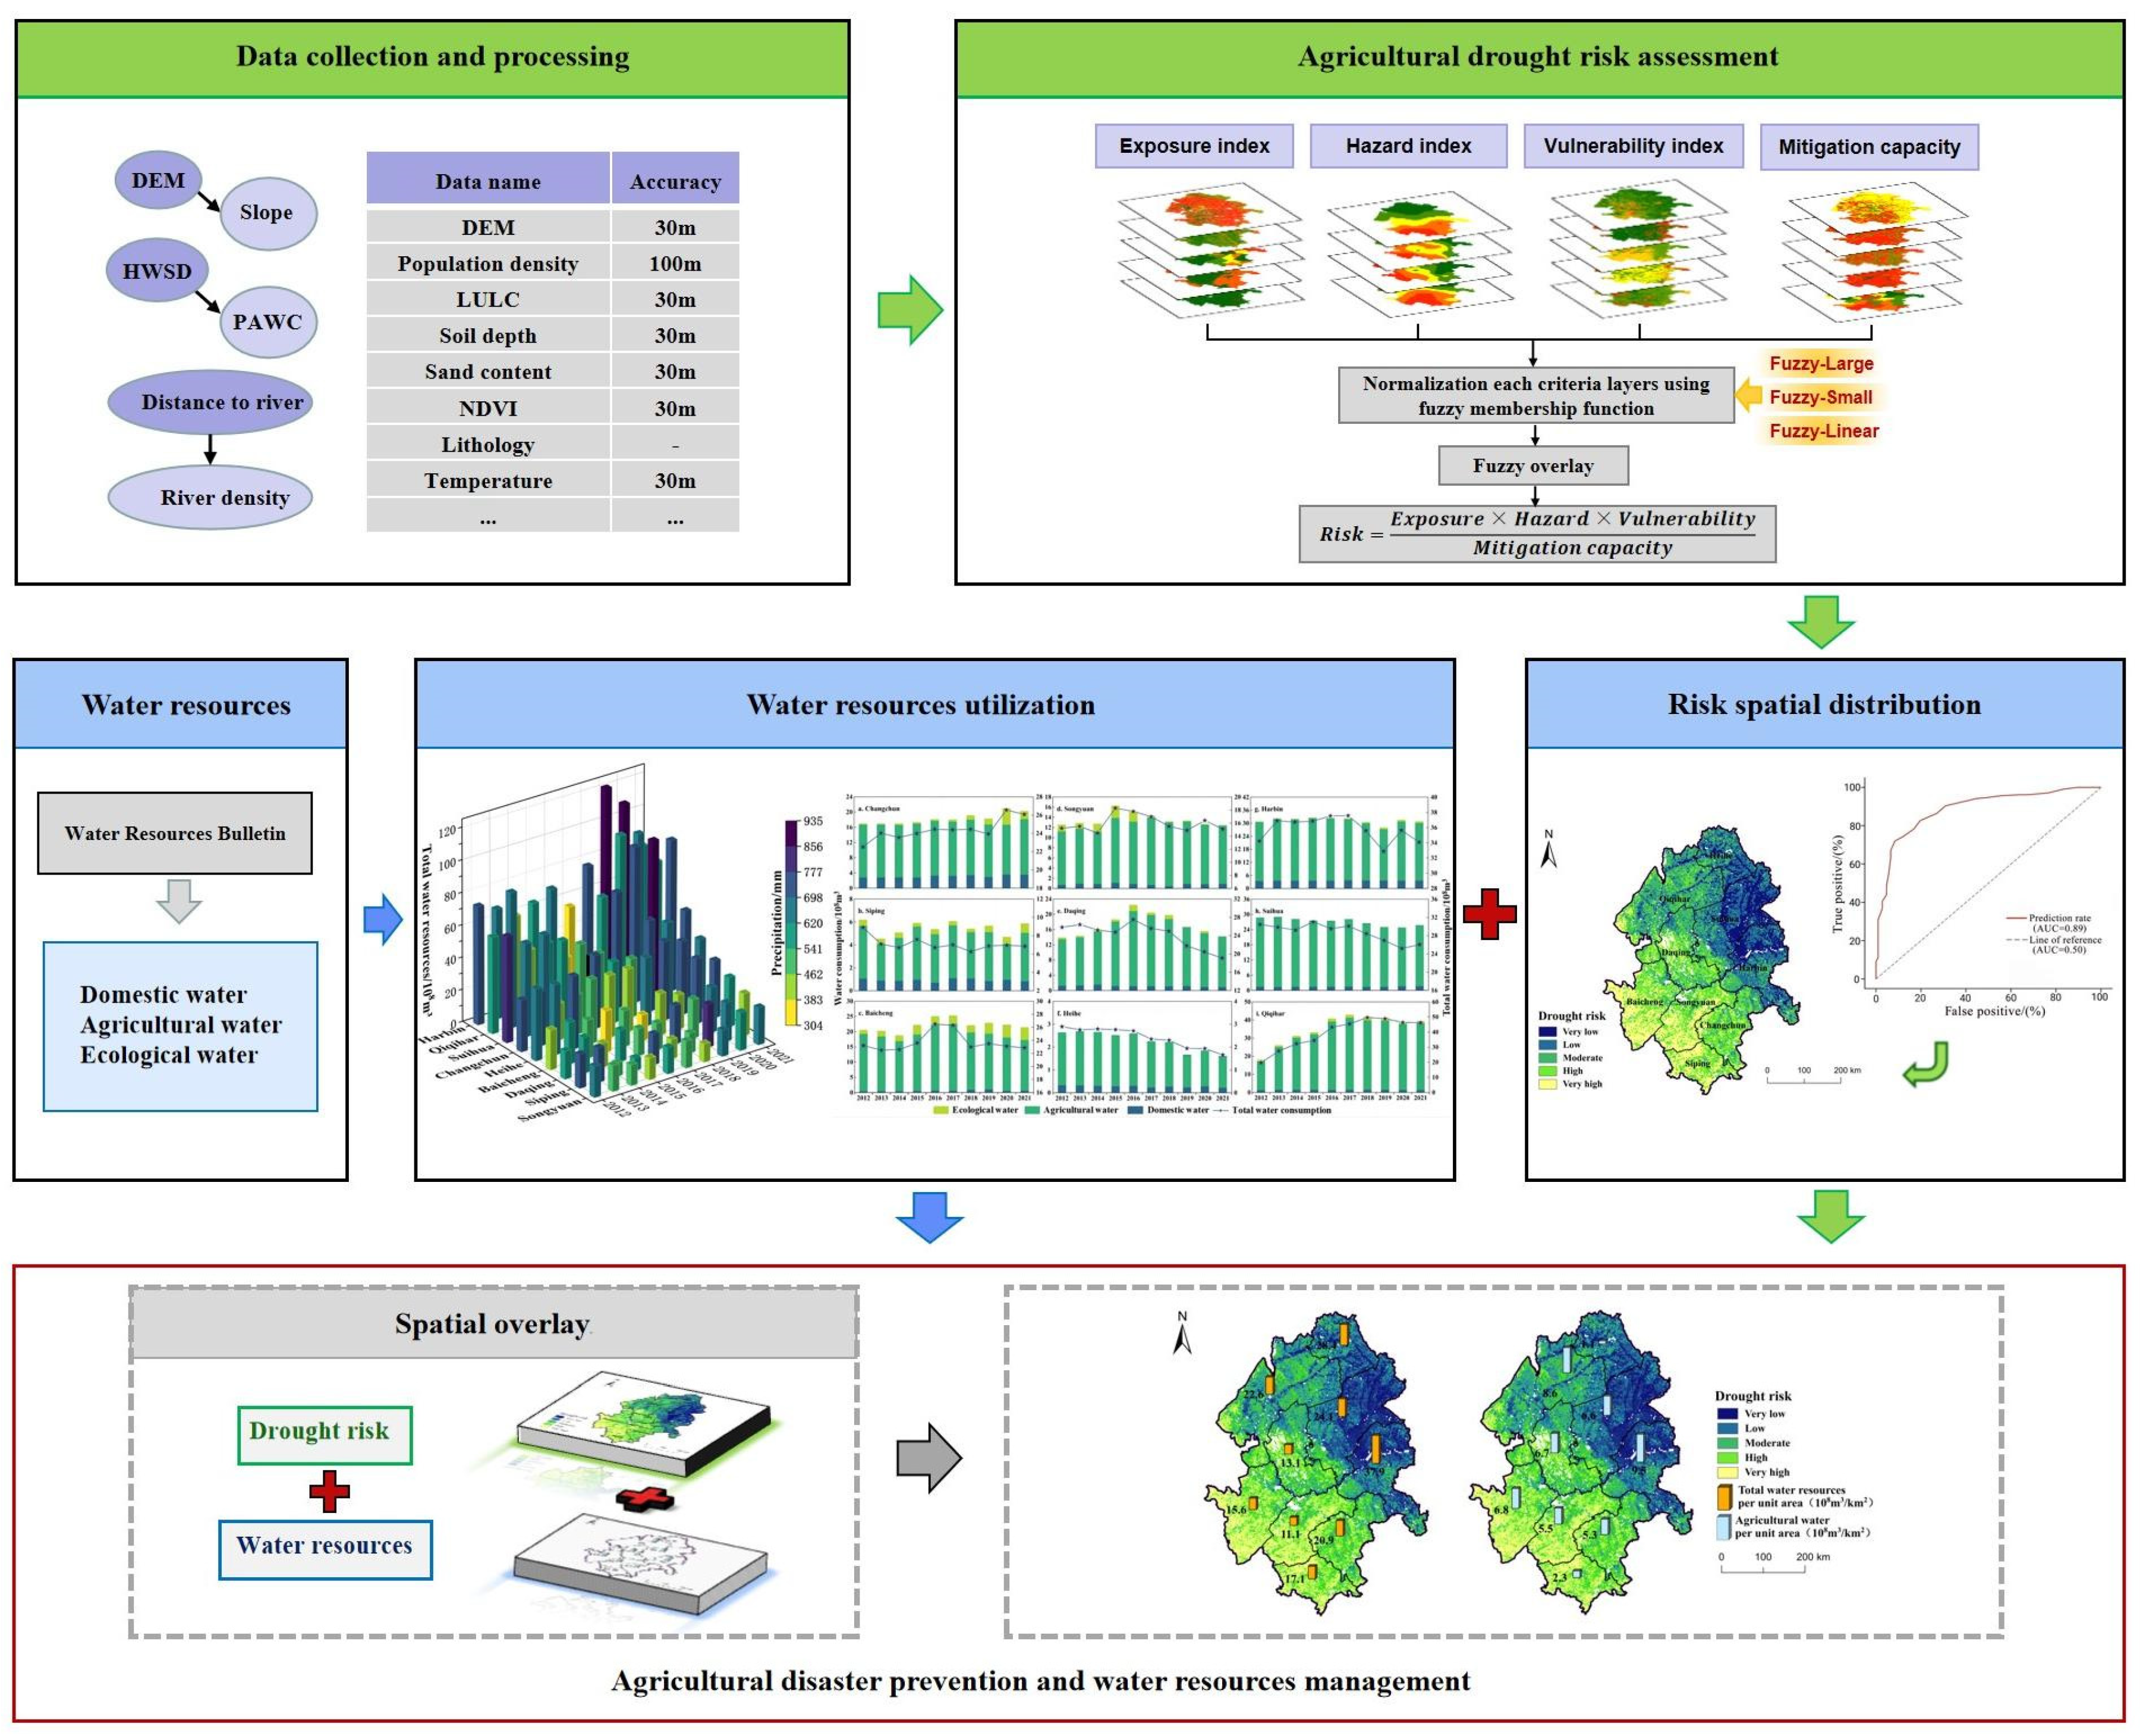
As one of the three significant plains in Northeast China, Songnen Plain is located between the Great Khingan Mountains, Lesser Khingan Mountains, Changbai Mountains and Songliao River basins. It is formed by alluvial deposits of the Songhua and Nenjiang Rivers. The geographical coordinates are 121°38′~128°33′ E and 42°49′~49°12′ N (Figure 1). It covers the western part of Heilongjiang Province (Harbin, Qiqihar, Daqing, Heihe and Suihua) and the northwestern part of Jilin Province (Changchun, Siping, Songyuan and Baicheng), with a total area of 225,000 km2. Belonging to the temperate monsoon climate, the average annual precipitation is approximately 406–689 mm, with an uneven spatiotemporal distribution, gradually decreasing from east to west. The evaporation from May to September is approximately 446–732 mm, which is much more than the precipitation, so it is prone to drought disasters. Affected by climate, the soil in Songnen Plain is diverse and fertile. The western part is the agro-pasture ecotone, whereas the central and eastern parts are typical agricultural cultivation areas, forming an important national key commodity grain base in China.
The data used in this study are summarized in Table 1. Considering the interaction between exposure, hazard, vulnerability and mitigation capacity, and the whole process of drought occurrence, we selected 18 dynamic factors to construct the comprehensive ADR model and to exhibit the spatial pattern of risk explicitly. They were: exposure (elevation, slope, population density, LULC), hazard (rainfall, humidity, temperature, evaporation), vulnerability (soil depth, soil moisture, NDVI, sand content, lithology) and mitigation capacity (distance to river, river density, distance to road, plant available water capacity (PAWC), irrigation index). Each index was unified into Krasovsky_1940_ Albers Projected Coordinate System and re-sampled into 30 m × 30 m raster data. Note that water resources utilization data include total water resource, total water consumption, domestic water, ecological water and agricultural water.

2.2. Methodologies

As shown in Figure 2, the research framework consisted of three parts. Firstly, a comprehensive ADR assessment, including all risk components of exposure, hazard, vulnerability and mitigation capacity, was calculated using the fuzzy-logic-based geospatial technique; secondly, water resource utilization was analyzed to verify the accuracy of the model applied in Songnen Plain; finally, the spatial distributions of drought risk and water resources utilization were overlaid to identify actual very-high-risk area and formulate regional drought management strategies.

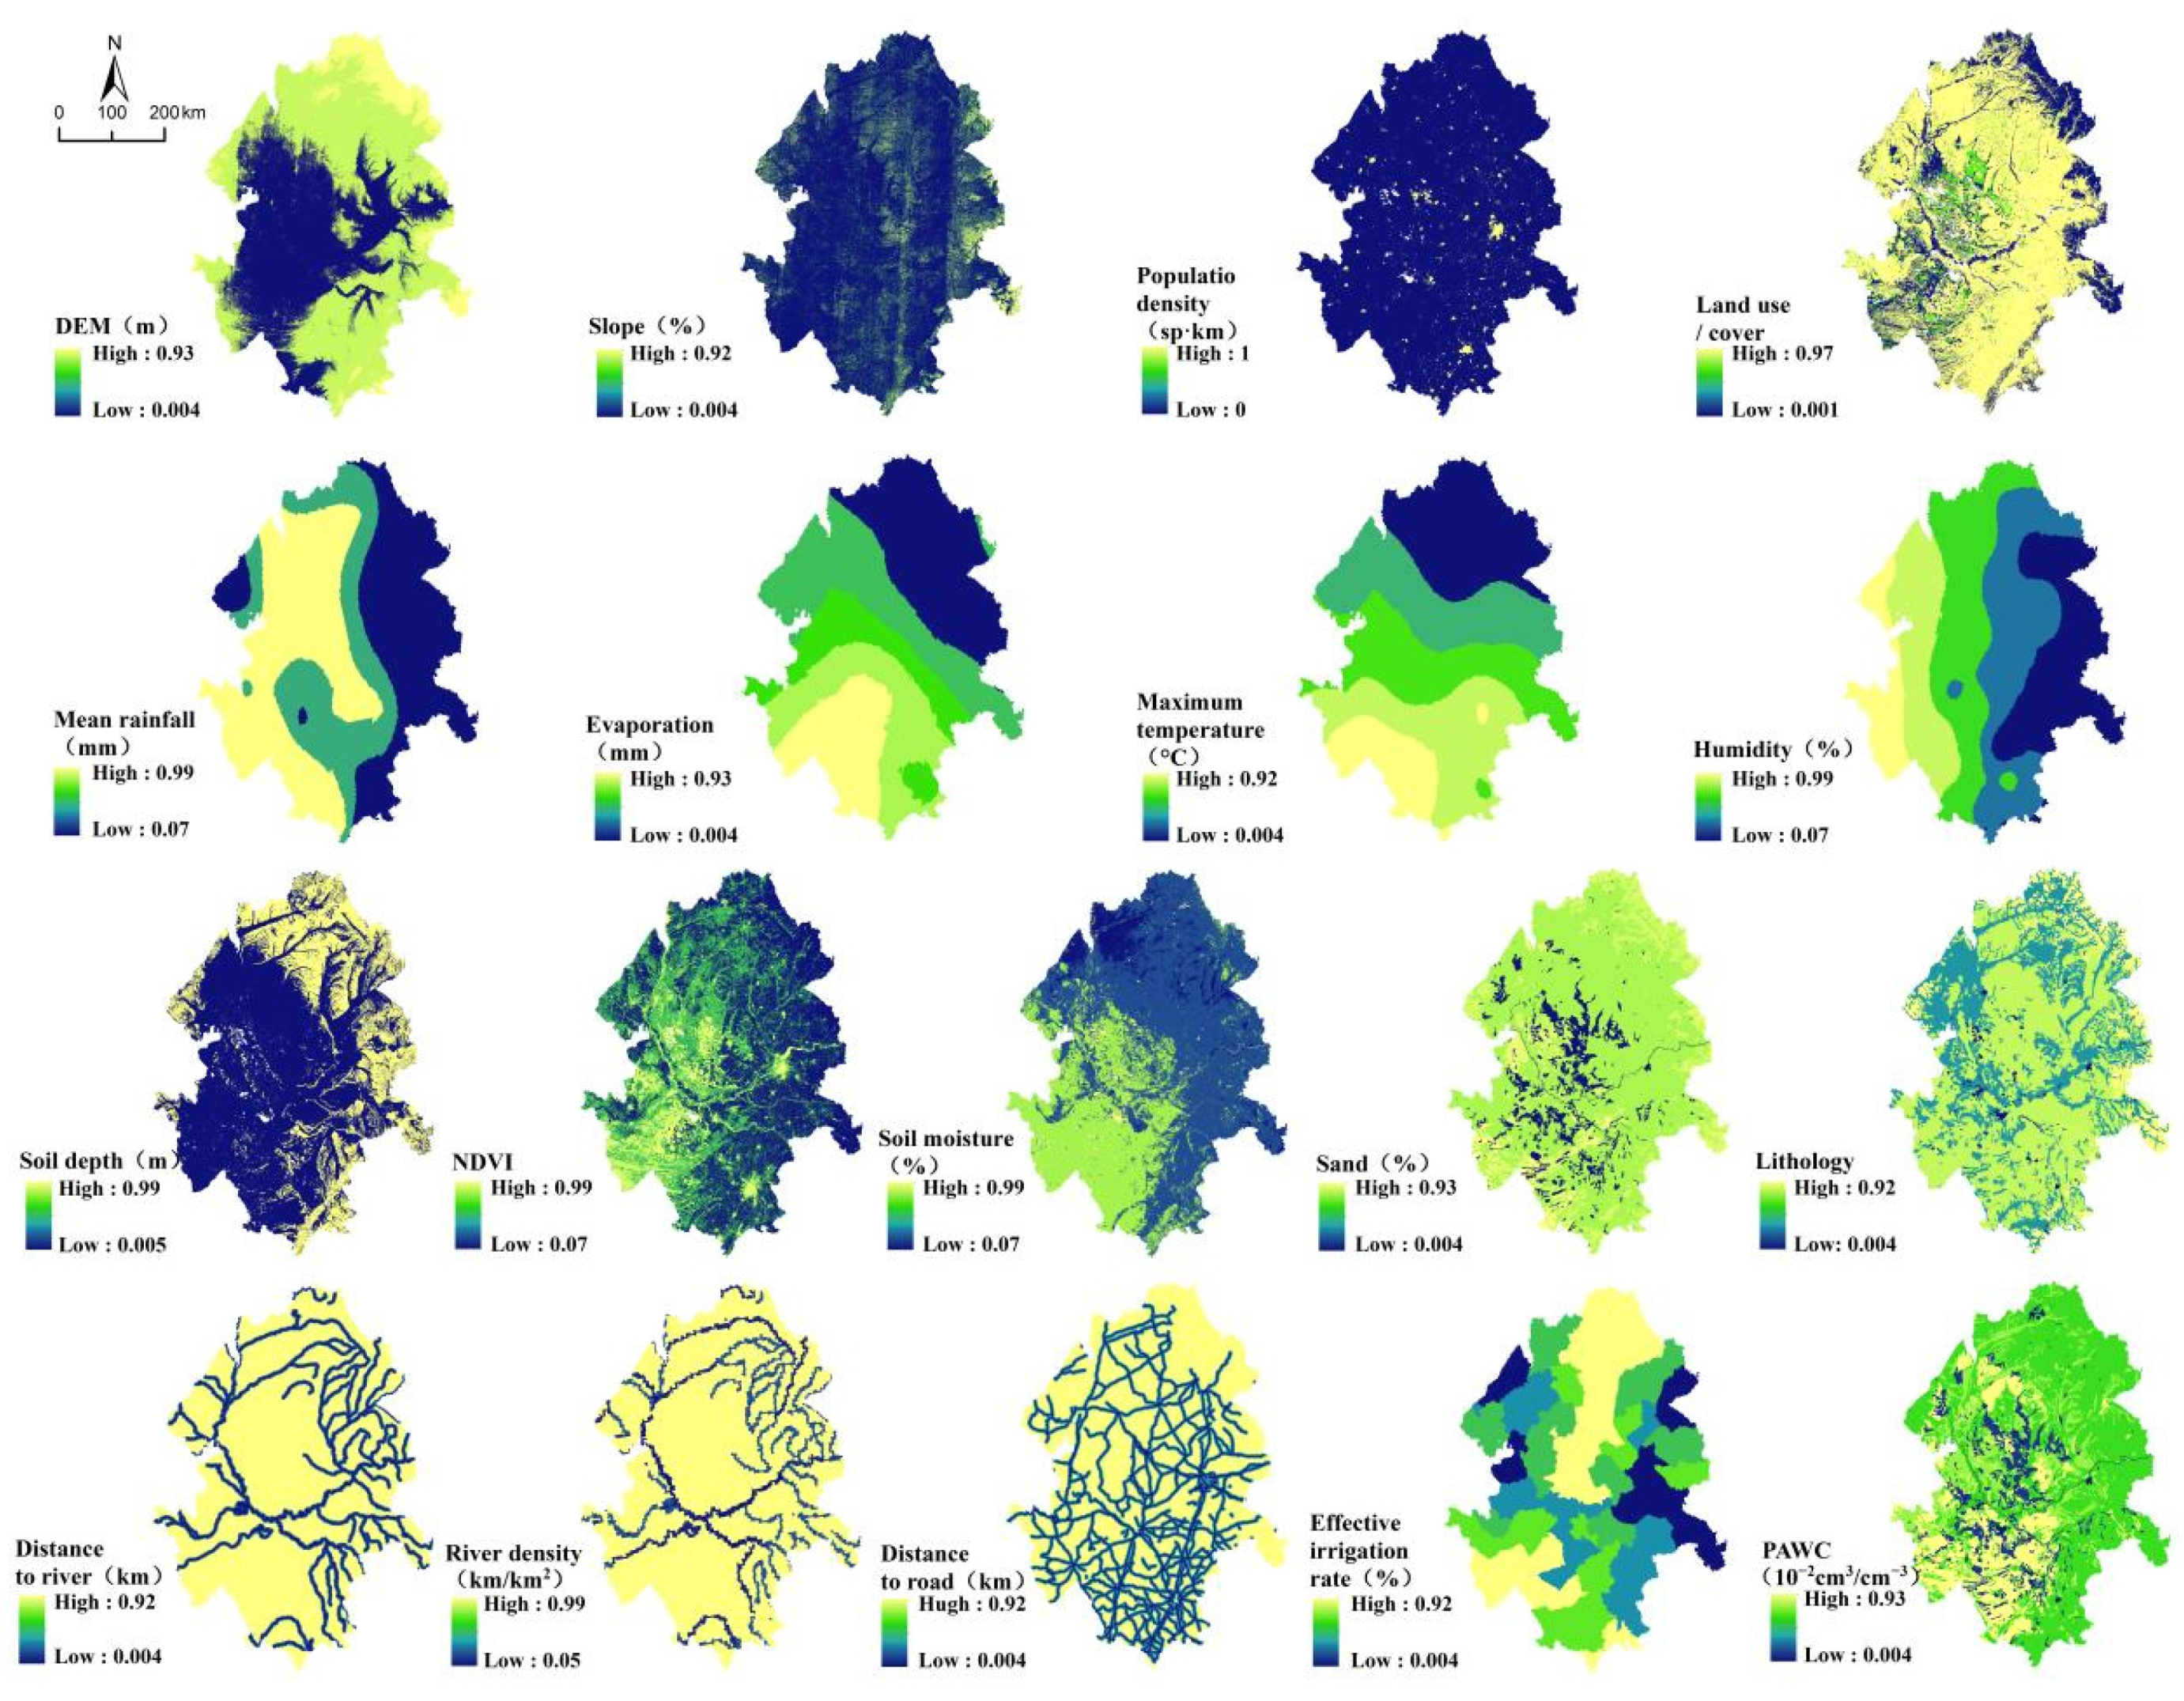
2.2.1. Criteria for Risk Components Mapping

(1)
Exposure
Exposure risk involves the contact surface between disaster-bearing bodies and disasters, usually represented by social, economic, natural and other environmental elements that are in close contact with or significantly affected by drought hazards [52]. The greater the environmental exposure, the higher the risk of drought disaster. Agricultural resources in high-altitude or steep slope areas are more susceptible to drought disasters because of their low water-holding capacity [16]. Areas with high population density are more vulnerable to agricultural droughts, food shortages and famine [53]. The larger the cultivated land area, the higher the exposure degree to ADR. The elevation and slope were extracted from 30 m DEM by ArcGIS and the LULC was obtained based on the GEE platform (Landsat 8 OLI of 2021 using the Land Use Classification System of the CAS with overall accuracy > 90% and kappa > 0.85) (Figure 3).
(2)
Hazard
Hazard refers to the direct cause of disasters and typically represents climatic factors that induce agricultural droughts [54]. According to the meteorological drought grade [55], precipitation and humidity are the main drought-monitoring indicators. Regions with higher temperatures and evaporation are more prone to droughts [56]. Therefore, precipitation, humidity, temperature and evaporation were selected as hazard indicators. All meteorological data were obtained from the National Meteorological Science Data Center. Based on 54 meteorological stations in and around the study area, relevant rasters of 30 m spatial resolution were generated by Kriging interpolation and resampling in ArcGIS. Precipitation, humidity and evaporation were the average value from 2000 to 2021, evaporation was averaged from May to September each year to eliminate the effects of lack of data during the winter freezing period and temperature was the annual average maximum value.
(3)
Vulnerability
Vulnerability describes the degree or state to which a system is sensitive to external interference [57]. Areas with deeper soils and lower sand content have better water retention capacity, which can provide sufficient water for the growth of crops with lower drought vulnerability [58]. Therefore, five influencing factors, namely soil depth, NDVI, soil moisture, sand content and lithology, were selected as drought vulnerability indicators. NDVI was the average value of 30 m LandSat from May to September 2021 extracted by GEE, and others were completed in ArcGIS. Lithology was classified according to mineral properties.
(4)
Mitigation Capacity
Mitigation capacity represents the ability of crops to recover from drought disasters, which is the result of the joint action of crop resistance and human participation in disaster prevention [59]. The evaluation indicators include distance to the river, river density, distance to road, plant available water capacity (PAWC) and irrigation index. Areas close to rivers or with dense river networks are less susceptible to agricultural drought [9]. Major roads and irrigation facilities are conducive to preventing and mitigating agricultural disasters. PAWC means the amount of water stored at a certain depth in soil that plants can absorb and use. The higher the PAWC, the stronger the drought resistance of the area [47]. The distance to rivers and roads was generated by creating buffer zones and fishnets in ArcGIS, and the irrigation index was the ratio of effective irrigated area to cultivated area in the study area, identified by integrating Landsat 8 OLI and Sentinel 2 remote sensing data in GEE.

2.2.2. Assigning Weight Using Fuzzy Membership Function

Fuzzy logic is a method of computing “truth” that improves on the absolute “true or false” concept of Boolean logic [60]. Fuzzy logic improves the weighting method by using different fuzzy membership functions to convert the value 0 or 1 (Boolean logic) into a range of numbers between 0 and 1 (fuzzy logic), and includes extreme values of 0 and 1 as truth and various values between 0 and 1. In this study, LINEAR, LARGE and SMALL membership functions were used to select appropriate membership function to eliminate the influence of each indicator measure. LINEAR is a linear function applied between a user-specified minimum and maximum value, with membership 0 specified at the minimum and 1 specified at the maximum. In LARGE function (Equation (1)), the larger the value in the input data, the higher the membership in the fuzzy set. SMALL fuzzy membership (Equation (2)) is the opposite of LARGE: the larger the value in the input data, the lower the membership in the fuzzy set.
μ 1 ( x ) = 1 1 + ( x f 2 ) f 1
μ 2 ( x ) = 1 1 + ( x f 2 ) f 1
where x is the input data, μ1(x) and μ2(x) represent Fuzzy-LARGE and Fuzzy-SMALL membership functions and f1 and f2 are the midpoint and range values, respectively.
Among the 18 factors selected in this study, the higher the positive index value, the higher the drought risk, and the Fuzzy-LARGE membership function was used in this situation. These positive indicators included elevation, slope, LULC, mean maximum temperature, mean evaporation, sand content, lithology, distance to river and distance to roads. In contrast, the lower the negative index value, the higher the drought risk, and the Fuzzy-SMALL membership function was applied in this case. The negative indicators were average annual rainfall, mean humidity, NDVI, soil depth, soil moisture, river density, irrigation index and PAWC. The Fuzzy-LINEAR function was used for population density [53]. The details are shown in Table 2.

2.2.3. Risk Assessment

The essence of fuzzy superposition is to analyze the intersection and relationship of comprehensive effects of multiple criteria and factors in uncertain events [61]. There are five main models of fuzzy superposition [62]: Fuzzy And, Fuzzy Or, Fuzzy Product, Fuzzy Sum and Fuzzy Gamma, defined as:
F:[0,1]n→[0,1]
Fuzzy And is the minimum membership combination in each grid; Fuzzy Or is the maximum membership combination in each grid; Fuzzy Product is the product of the membership of each grid and its result is usually less than the membership of a single grid layer; Fuzzy Sum is not the sum of the membership of each grid and its result is usually greater than or equal to the membership of a single grid layer; Fuzzy Gamma usually integrates multiple-layer membership so that the integrated result is at a more appropriate value between the maximum and minimum membership. In this study, we chose Fuzzy Gamma for the superposition calculation. The formula was as follows:
μ g a m m a = [ 1 i = 1 n ( 1 μ i ) ] γ × [ 1 i = 1 n ( μ i ) ] 1 γ
where μgamma is the formula output value; γ is a parameter chosen between 0 and 1 (it was 0.9 in this paper); n is the number of input layers; μi is the fuzzy membership value of the input layer.
Firstly, a fuzzy overlay operation was performed for each risk component following the weight-assigned value in Table 2. Once all risk components were prepared, the final risk map was generated by a raster calculator in ArcGIS according to Equation (5). The drought risk was classified into five levels using the natural breakpoint method.
Risk = exposure×hazard × vulnerability/mitigation capacity

2.2.4. Efficiency Test

Operating characteristics curve (ROC) and area under curve (AUC) are widely used to test the accuracy and sensitivity of risk models, and are suitable techniques for assessing certainty and probabilistic rationality [63]. Soil moisture is an important indicator of agricultural drought and can be used to plot ROC curves to validate risk maps [64]. The soil moisture data from 2000 to 2021 were obtained from the Geographic Remote Sensing Ecological Network Platform (http://www.gisrs.cn/, accessed on 28 October 2022). The comprehensive drought inventory map was established according to Equation (6) and the relative deviation of soil moisture (RDSM) was calculated [65].
R D M S = S i S _ j S j _ × 100
where Si is mean annual soil moisture for 2012 (one of the drought years in the Songnen Plain); S ¯ j is mean annual soil moisture between 2000 and 2021.
The RDSM was normalized from the original value to a range of 0 to 1 using fuzzy logic and a threshold value of 0.5 (RDSM > 0.5) was set to identify the agricultural drought locations. A total of 343 drought points were randomly selected and divided into two groups: 70% RDSM drought points (n = 240) used as the training data, and a set of 30% RDSM drought points (n = 103) used as validation data to verify the finally generated drought risk map.

3. Results

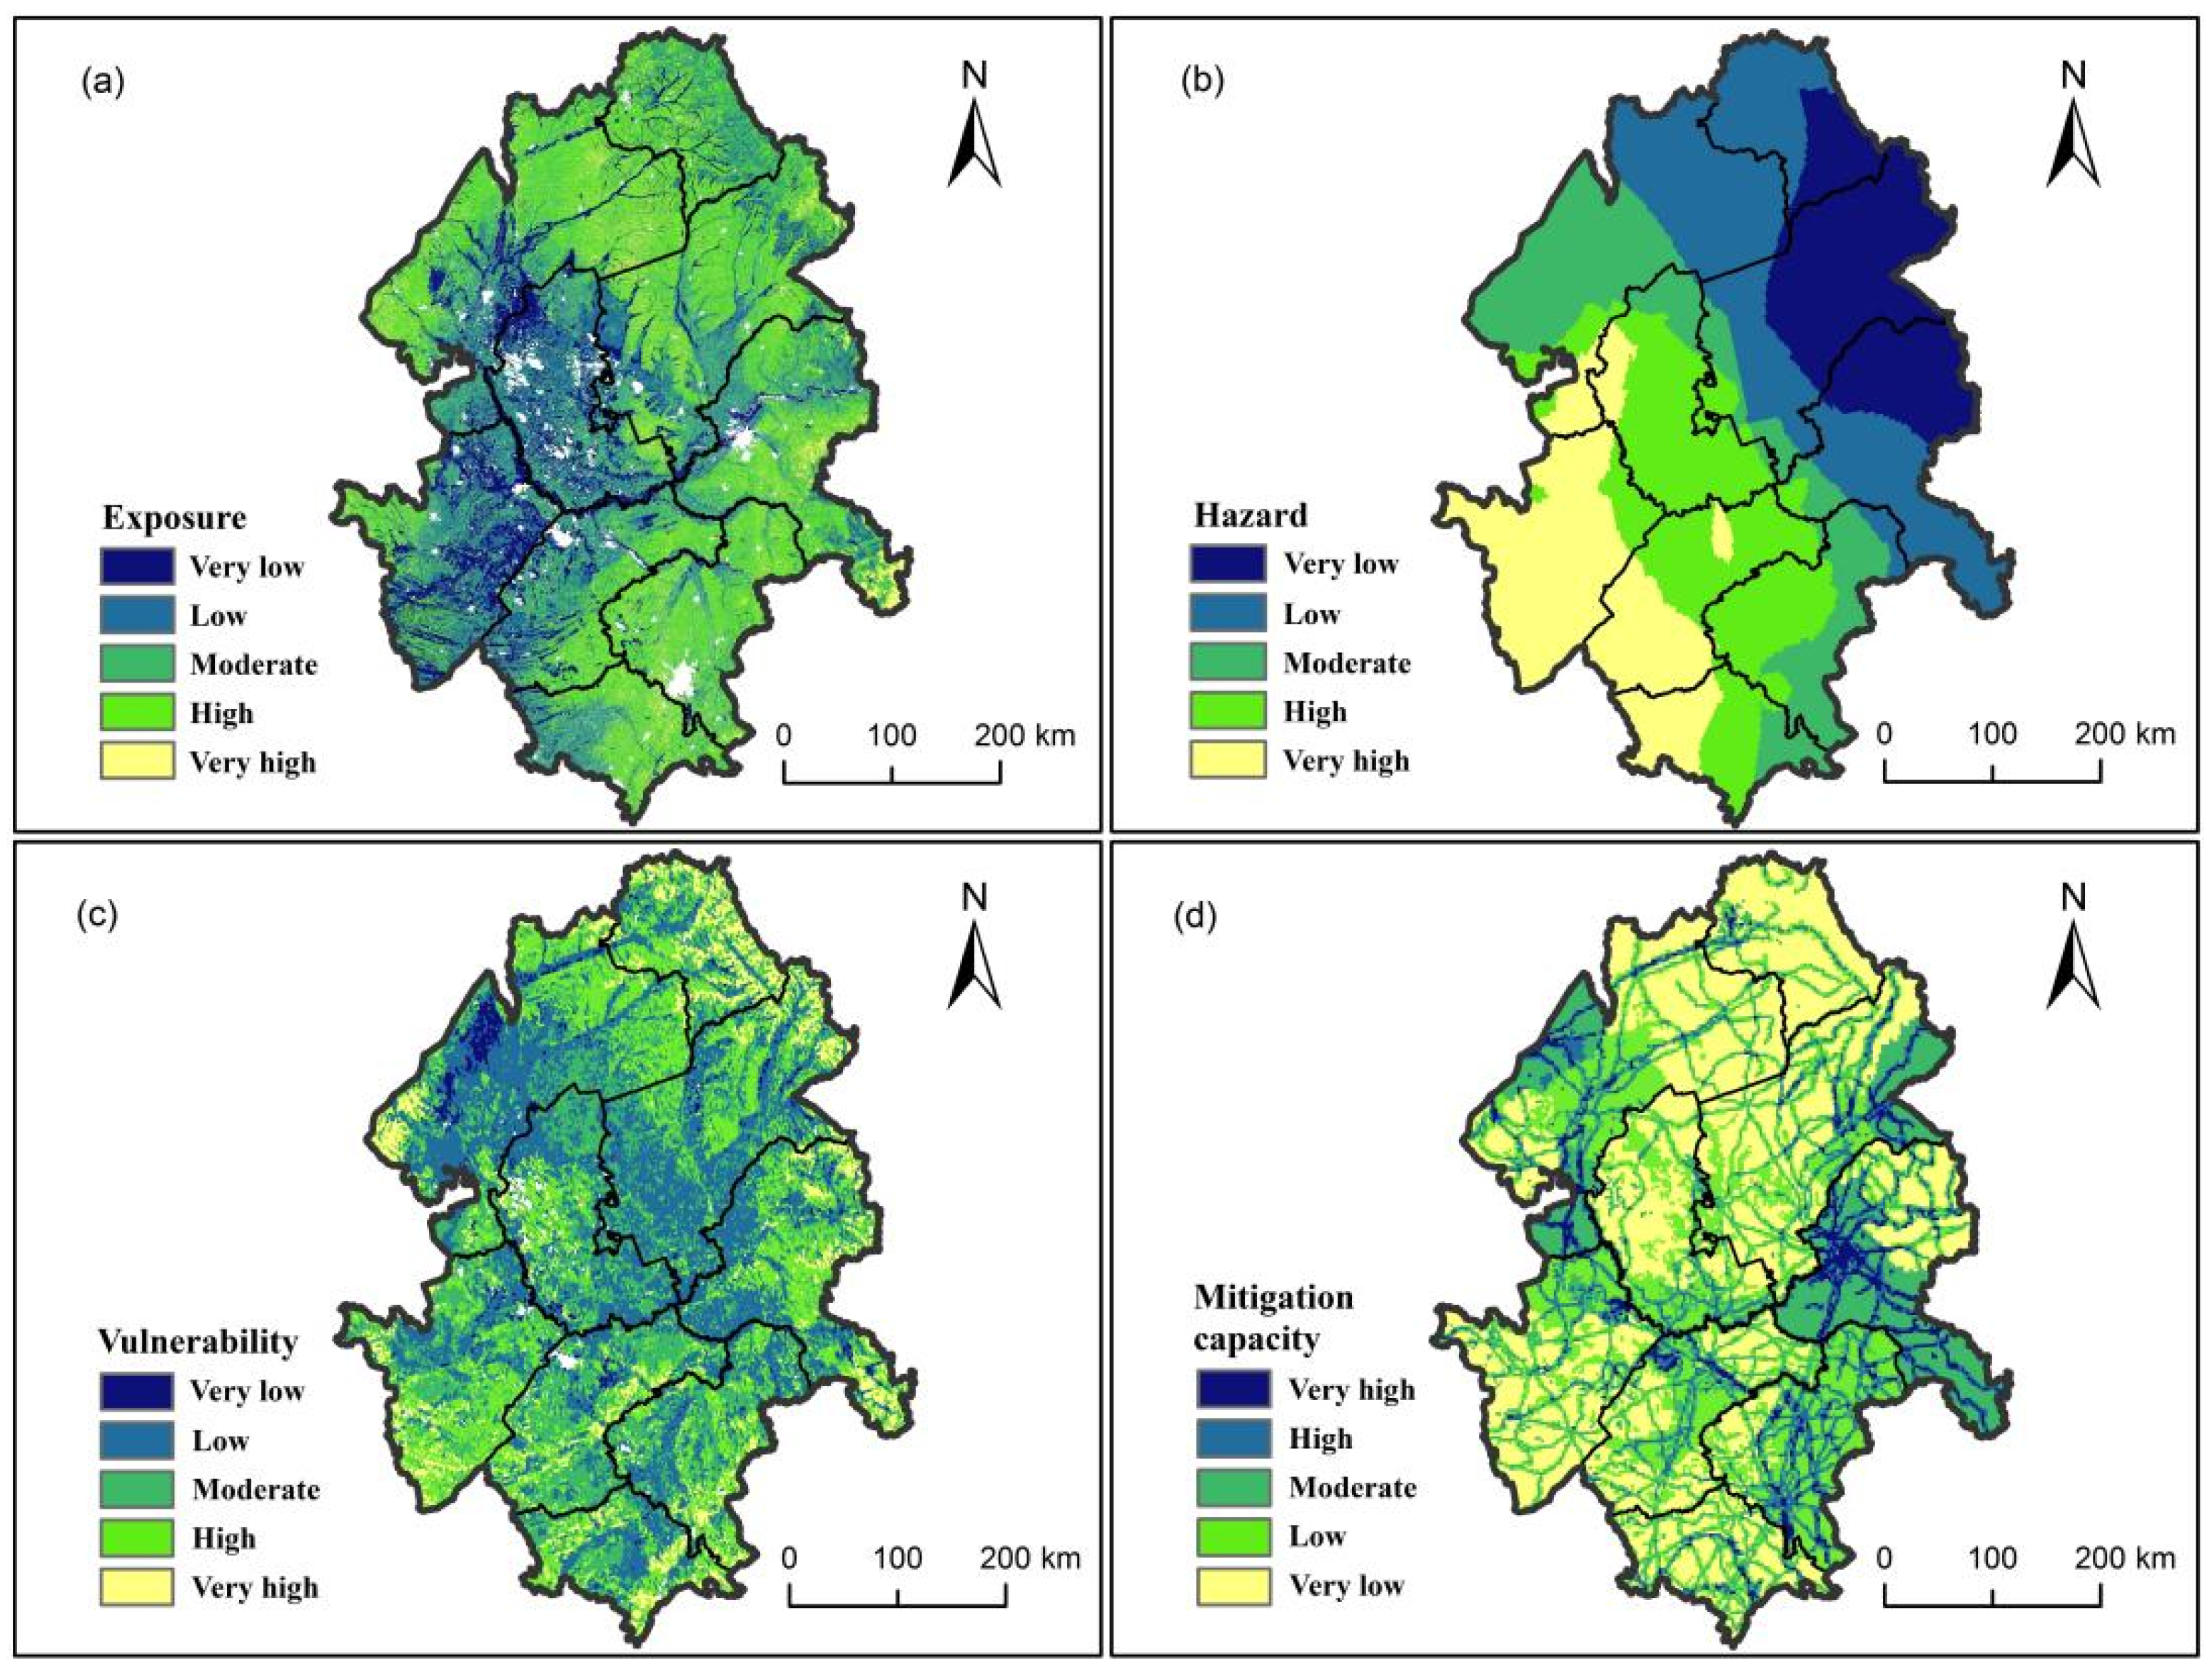
3.1. Risk Components Mapping

The standardized spatial pattern of 18 factors is shown in Figure 4, and the map of exposure, hazard, vulnerability and mitigation capacity is shown in Figure 5.
(1)
Exposure mapping
As shown in Figure 5a, the exposure in Songnen Plain showed a trend of being higher in the east and lower in the west. The areas of the very-low-exposure level and low-exposure level were 25,215.77 km2 and 44,154.08 km2, respectively, accounting for 11.21% and 19.62% of the total area. They were concentrated in Baicheng, Daqing, southern Qiqihar and western Songyuan. The moderate exposure level covered an area of 74,180.76 km2, accounting for 32.97% of the total area, which was the highest and was distributed evenly in the study area. The areas of the high-exposure level and very-high-exposure level were 71,552.73 km2 and 9896.66 km2, accounting for 31.80% and 4.40% of the total area, and were mainly located in Heihe, Suihua, northern Qiqihar, southwestern Harbin, Changchun and western Siping.
(2)
Hazard mapping
The hazard increased in a gradient from northeast to southwest (Figure 5b). The very low and low hazard covered 50,457.45 km2 and 40,961.32 km2, accounting for 22.43% and 18.21% of the total area, and were distributed in Heihe, eastern Qiqihar, most of Suihua and Harbin, and northeastern Yushu. The moderate hazard covered 53,860.74 km2, accounting for 23.94% of the total area, and was concentrated in the west of Qiqihar, the northeast of Daqing, the southwest of Harbin and most of Anda, Zhaodong and Changchun. The high and very-high-hazard areas covered 46,958.41 km2 and 32,762.09 km2, accounting for 20.87% and 14.56% of the total area, and were distributed in Baicheng, Songyuan, southwestern Daqing, western Siping and parts of Qiqihar and Changchun.
(3)
Vulnerability mapping
The drought vulnerability of the study area was low, lowest in the middle and gradually increasing to the north and south ends (Figure 5c). The area of moderate and lower-vulnerability levels was 170,149.31 km2, accounting for 75.62% of the total area. The area of the high-vulnerability level was 47,497.43 km2, accounting for 21.11%, and was mainly distributed in Heihe, northern Suihua, eastern Harbin and eastern Changchun, Siping and southern Baicheng, with a small amount of distribution in Qiqihar, Daqing and Songyuan. The area of the very-high-vulnerability level was 7353.26 km2, accounting for 3.27% of the total area, and was scattered in Heihe, Siping, western Baicheng, eastern Songyuan, Changchun, Longjiang County and Dulbert Mongolian Autonomous County.
(4)
Mitigation capacity mapping
Overall, the levels of the mitigation capacity of Songnen Plain were mostly very low and low (Figure 5d). The area of very low mitigation capacity was 84,756.42 km2, accounting for 37.67% of the total area, and was distributed in the southwest, central and north of Songnen Plain. The area of low mitigation capacity was 47,732.88 km2, accounting for 24.02%, and was mainly located in the south of Suihua and Daqing, the north of Baicheng and Changchun and the middle of Songyuan, Qiqihar and Fuyu County. The area with a moderate and above mitigation capacity was 86,208.03 km2, accounting for 38.31% of the total area, and was concentrated in Gannan County, Tailai County, Qing’an County and Wuchang County.

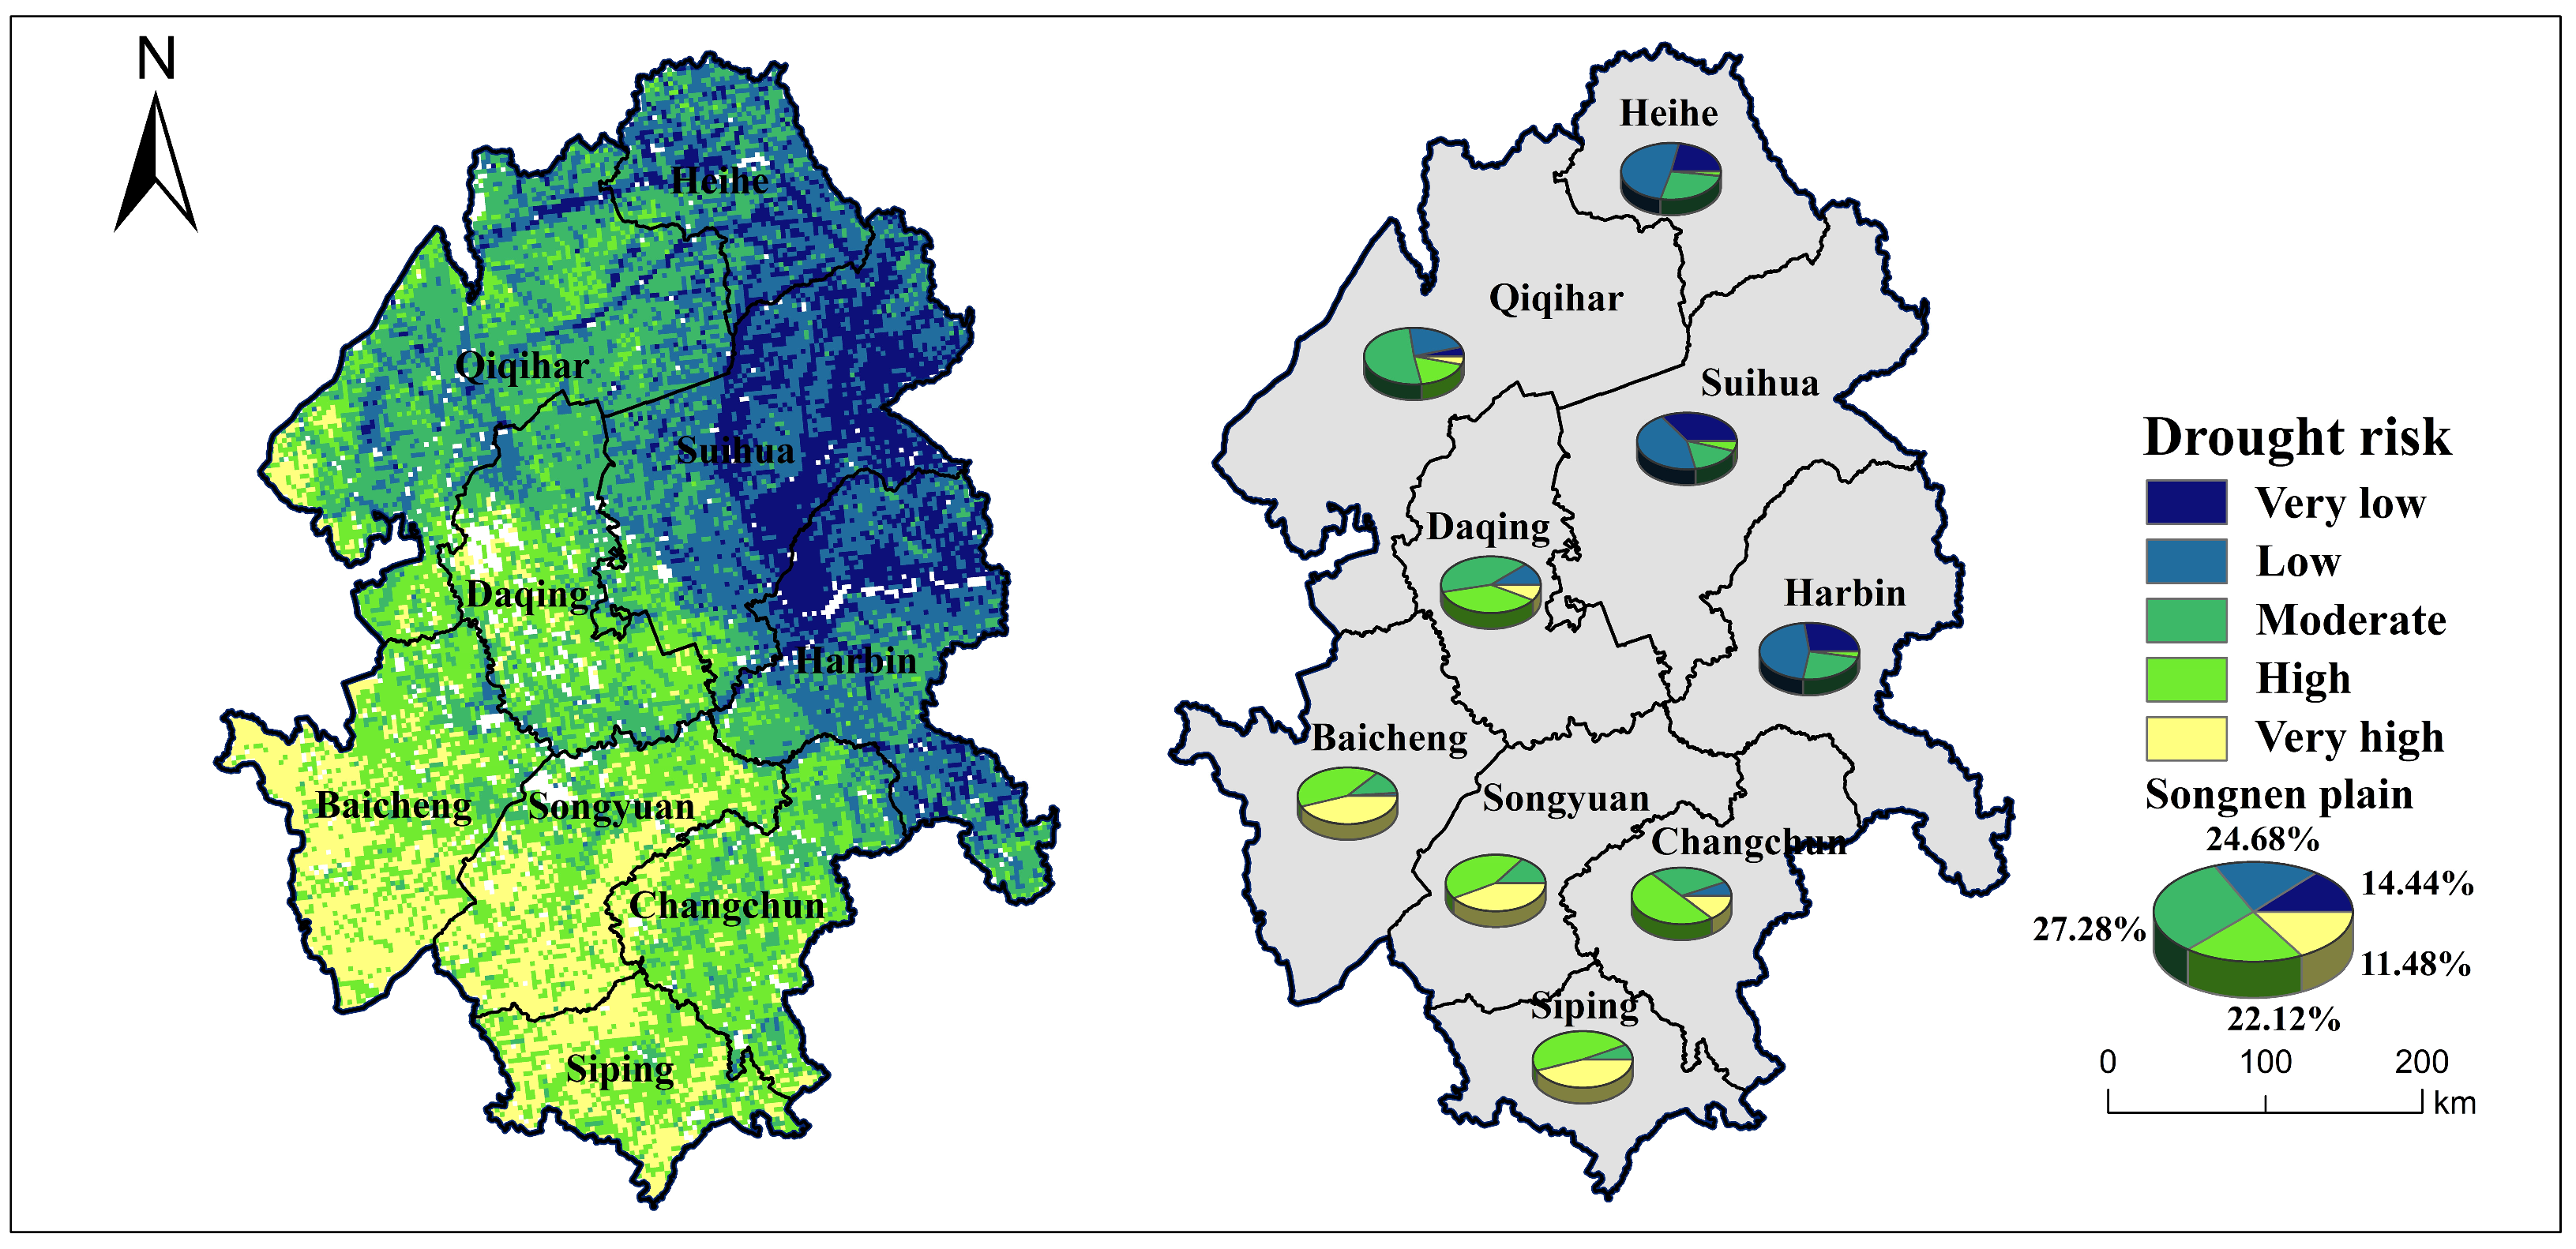
3.2. Comprehensive Drought Risk Mapping

According to Equation (5), the comprehensive drought risk of Songnen Plain was obtained. It was divided into five levels using the natural breakpoint method: very low risk (0.097~0.327), low risk (0.327~0.429), moderate risk (0.429~0.523), high risk (0.523~0.622) and very high risk (0.622~0.822). The proportion of risk levels in each city was calculated statistically and is encapsulated in Figure 6.
The drought risk level of Songnen Plain decreased gradually from southwest to northeast, and the proportion from high to low was moderate risk (27.28%) > high risk (24.68%) > low risk (22.12%) > very low risk (14.44%) > very high risk (11.48%). The area of very high risk was 32,491.01 km2, and was mainly distributed in Siping, Baicheng and Songyuan, accounting for 48.24%, 45.29% and 42.65% of the city risk level, with a small distribution in Longjiang County and Dulbert Mongolian Autonomous County. The high risk and moderate risk crossed over from south to north, higher in the south, with a very high risk and high risk proportion of more than 85%. The high level proportion in these southern cities was 49.89%, 45.10% and 42.92% for Changchun, Siping and Songyuan, respectively. These regions with very high and high ADR should be paid more attention to. The northern region was integrated with low risk and moderate risk, but the moderate risk accounted for a large proportion. It concentrated in Qiqihar (51.33%), Daqing (42.77%) and Changchun (31.50%), where the drought risk cannot be ignored. The very-low-risk area was 25,819.67 km2, and was mainly concentrated in the Heihe, Harbin and Suihua areas, which are the main dry grain production areas of Heilongjiang Province.

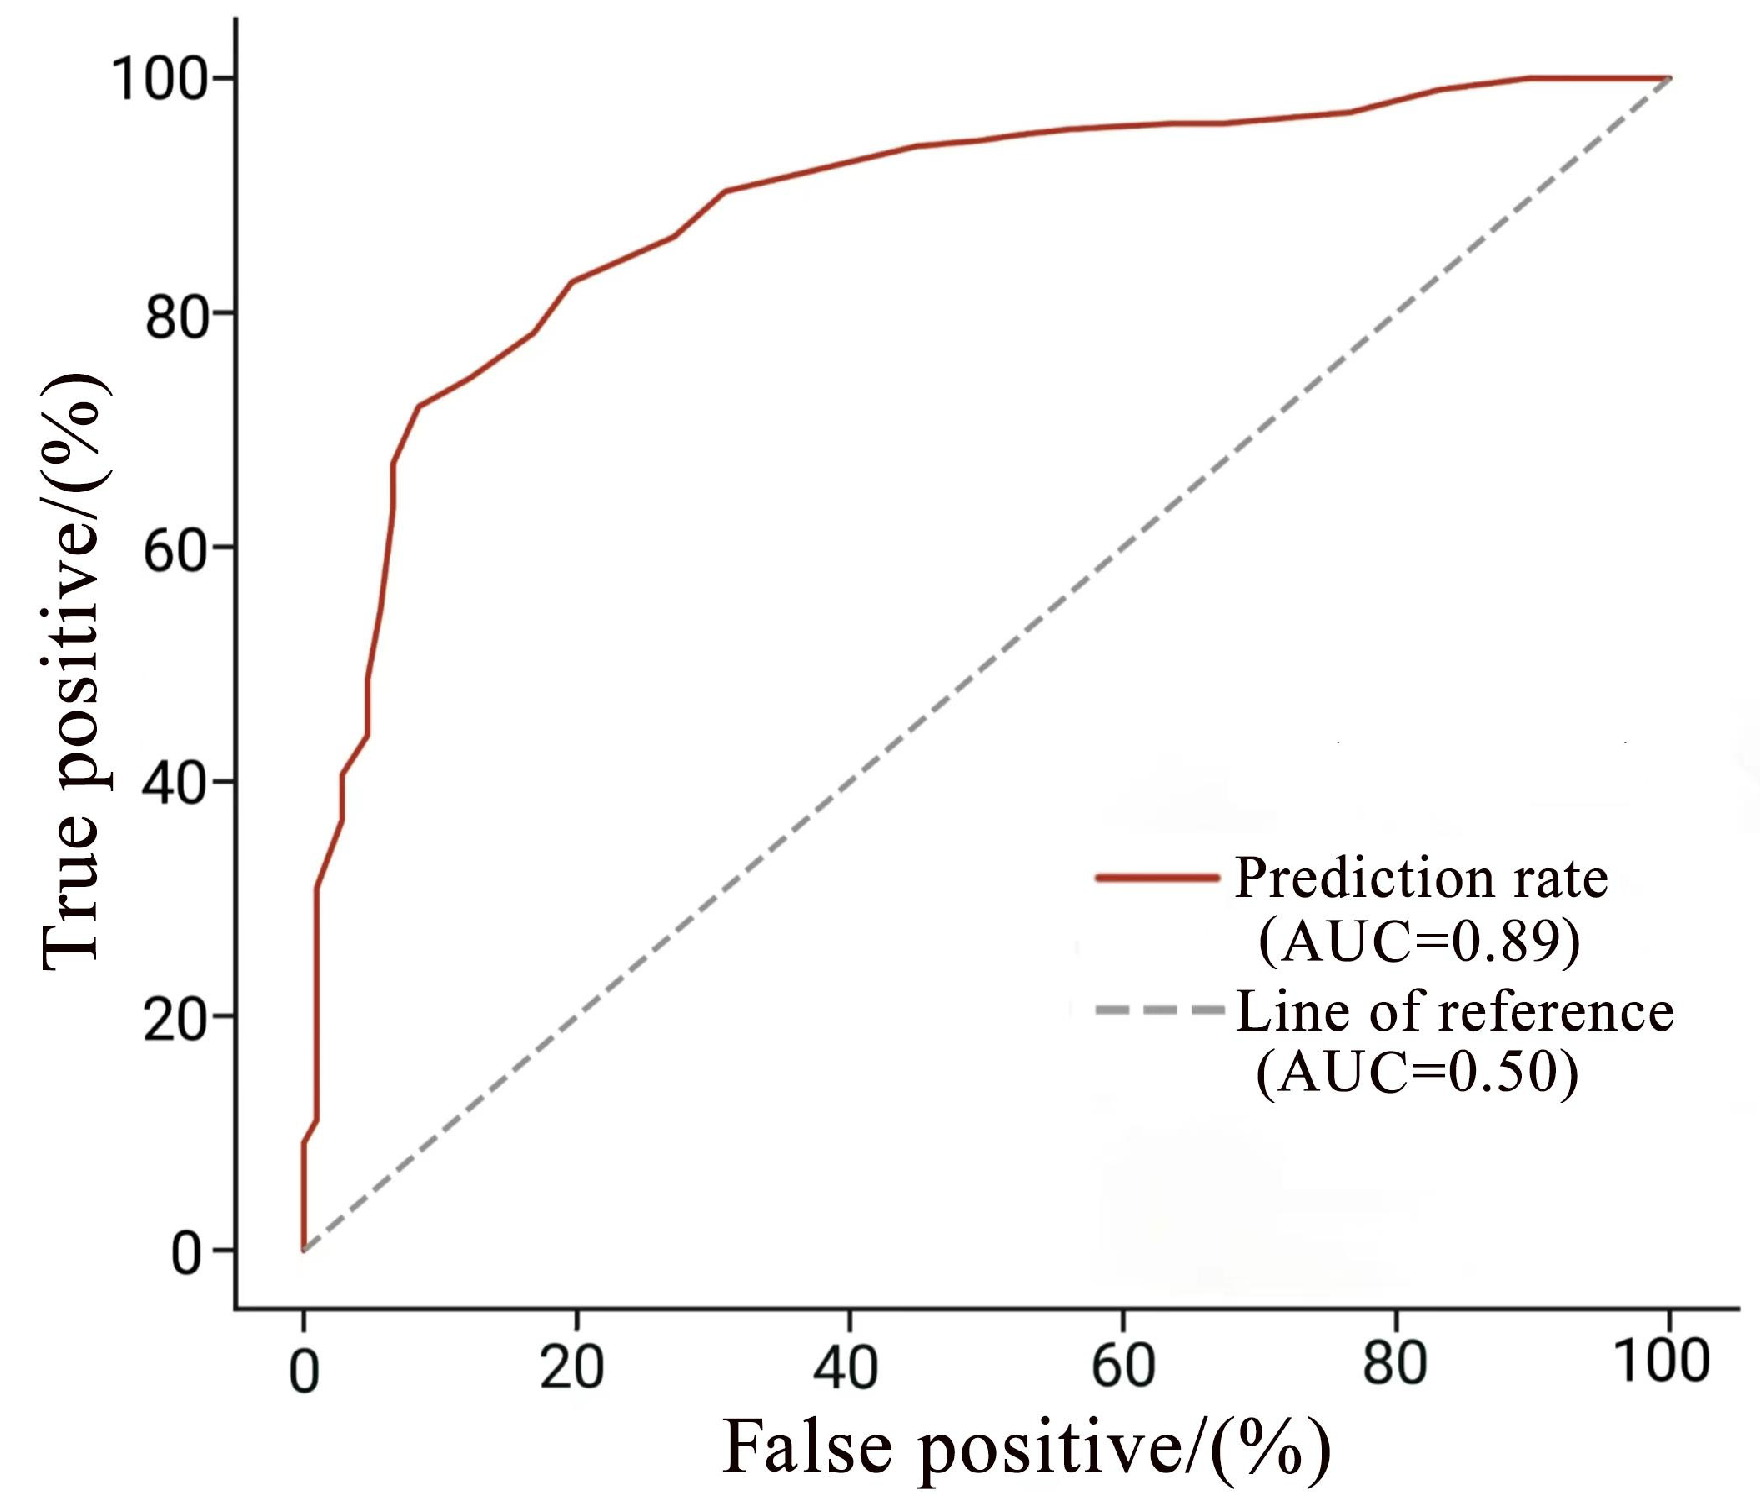
3.3. Outcome of the Efficiency Test

The prediction rate curve is shown in Figure 7. The AUC value of the risk model was 0.886, and the prediction rate was 88.6%. The closer the AUC value is to 1, the more accurate the model is. Therefore, the prediction accuracy of the model in this paper met the research needs.

4. Discussion

4.1. The Spatial Pattern of Drought Risks

Analyzing the spatial pattern of ADR can effectively reduce the negative impact of drought on agricultural production, ecological environment and regional economic loss [66,67]. This study developed a comprehensive ADR model that combined meteorological, hydrological, agricultural and socio-economic risk components. It considered the whole process of drought occurrence and could provide reliable decision-making support for ADR intervention. Consistent with previous research studies [68,69,70], the result in this paper also demonstrates that the ADR in Songnen Plain presented a pattern of being high in the southwest and low in the northeast (Figure 6). The high ADR is concentrated in Baicheng, Songyuan, Siping and Daqing, a semi-arid agro-pastoral ecotone with serious soil degradation, a weak water-holding capacity and a high eco-environmental vulnerability [71]. The temperature and evaporation were much higher than rainfall in most of Songnen Plain [72], indicating that the water resources were in serious shortage. In fact, during the past 10 years, the total water resources of cities in Songnen Plain fluctuated greatly, with a changing trend consistent with local precipitation (Figure 8), and the total water resources of cities with a high drought risk, such as Baicheng, Songyuan, Siping and Daqing, were relatively low. In addition, the mitigation capacity in these areas was inadequate, reflected in underdeveloped water supply systems, low effective irrigation rates and a low PAWC. The central part of Songnen Plain was a cross area of high risk and moderate risk. Cultivated land in this region was constantly expanding, with most of the original vegetation being replaced by secondary vegetation and monocropping farmland, where the vegetation was degrading and homogenizing and the exposure risk was rising [73]. Meanwhile, agricultural water consumption accounted for the largest proportion, indicating that agricultural activities were quite intensive there (Figure 9). Long-term tillage disturbance and a narrow vision of “use rather than conservation” resulted in the thinning of black soil and serious soil erosion in this region [74]. Furthermore, the mitigation capacity for drought in this region was insufficient due to the low river density and underdeveloped road traffic [58]. Thus, it can be concluded that a comprehensive drought risk assessment model that integrated drought mitigation capacity was of large significance [48]. Al-Amin et al. also confirmed this view [53]. This was not only a useful supplement to previous ADR assessments [75,76,77], but also greatly improved the scientificity of the assessment for making drought prevention and control policies more practical [78]. The precipitation in northeast Songnen Plain was abundant and the ADR there was low or very low [79]. Although the black soil in the high plain near Lesser Khingan Mountains was thin and susceptible to external interference, the mostly forest surroundings (Figure 3) with a good water and soil conservation ability guaranteed its agricultural production and development.

4.2. Accuracy Verification of the Model

Most previous ADR assessments only considered a few risk factors and the systematic description of the drought hazard mechanism was insufficient [80,81]. Eighteen indicators from meteorological, hydrological, agricultural and socio-economic aspects were selected to construct a comprehensive ADR model using geospatial techniques that integrated all risk components of exposure, hazard, vulnerability and mitigation capacity. It considered the whole process of drought occurrence and guaranteed the risk assessment to be more comprehensive and reliable, making great progress in this research area. Conclusions from similar studies have confirmed the reliability and applicability of the method [82]. The fuzzy logic algorithm can eliminate the errors caused by the forcible separation of continuous indicators [83] and reduce the subjectivity and inaccuracy of risk assessment in multi-criteria decision making. The prediction rate was 88.6% (Figure 7), indicating that the comprehensive ADR model developed in this paper was effective and reliable [65]. In addition, the spatial distribution of water resources corresponded to the spatial pattern of ADR (Figure 10), which further confirmed the effectiveness of the prepared model. The higher the drought risk, the lower the total water resources per unit area (TW) and agricultural water per unit area (AW). Songyuan (TW 11.1 × 10⁸ m3/km2 and AW5.5 × 108 m3/km2), Daqing (TW 13.1 × 10⁸ m3/km2 and AW 6.7 × 10⁸ m3/km2), Baicheng (TW 15.6 × 10⁸ m3/km2 and AW 6.8 × 10⁸ m3/km2) and Siping (TW 17.1 × 10⁸ m3/km2 and AW 2.3 × 10⁸ m3/km2) were the most serious drought risk regions in Songnen Plain and where the ADR management needed the most attention. Therefore, the comprehensive ADR model proposed in this paper could be applied to regional agricultural drought policy making and water resources management to ensure sustainable agricultural and socio-economic development.

4.3. Policy Suggestions

With the increase in greenhouse gas emissions, global warming has become an indisputable fact. In this context, the rainfall in China presents a trend of more in the south and less in the north, further worsening the ADR in the northern areas [84,85]. Therefore, a scientific assessment of ADR in major grain-producing areas in northern China is necessary to prevent and cope with drought events. Based on the actual situation of the study area, the following measures could be taken to alleviate the ADR and water shortage. (1) For the western agro-pastoral ecotone: promoting the Grain for Green Project and restoring degraded black soil to reduce the environmental vulnerability; developing diversified managements by taking advantages of local resources and improving the income structure of local farmers to enhance the drought resistance ability; strengthening drought risk monitoring, forecasting and early warning technology, publicizing and popularizing drought mitigation knowledge vigorously, releasing drought disaster to the public and deploying drought-resisting measures in a timely manner; (2) for the central cultivation area: strengthening the construction of water conservancy facilities (such as setting up channels, drainage ditches, etc.) to improve the drought mitigation capacity; cultivating drought-resistant and water-saving crops and optimizing agricultural planting structure through scientific agricultural management techniques; adopting scientific and reasonable irrigation methods to realize the efficient utilization of water resources; (3) for the northern high plain: strengthening the forest conservation in mountains, prohibiting deforestation on steep slopes and constructing various biological water storage projects to prevent the risk of agricultural drought from rising; (4) for cities: vigorously promoting water-saving technologies, building sponge cites and improving forest and grass vegetation coverage. In short, a coordinated strategy of population, economy, resources and environment should be implemented to promote sustainable development in the region.

4.4. Limitations and Outlook

There were inevitably some drawbacks in this study. Given that many criteria were considered under the four drought categories, it was quite difficult to collect long-time series and high-quality datasets to present the spatiotemporal evolution of drought risk, which could result in the ineffectiveness of drought management decisions to a certain extent. It would be much better to incorporate a few more criteria, such as accumulated temperature, the farming system or method, crop growth or crop yield, etc. However, it was not possible to include all these due to data access constraints, the time frame and funding. Moreover, data resolution was another threat. The soil depth and sand content used in this study were abstracted from the 2009 World Soil Database rather than actual local soil sampling data, which could lead to a certain deviation in the result. The validation of the comprehensive assessment model was conducted using soil moisture data only, while specific field-based datasets would enhance the validation. Furthermore, agricultural production is a dynamic and complex process, and different crop-planting categories and growth stages would be affected by agricultural drought differently. Thus, different drought mitigation strategies should be adopted in this case. Future research could consider addressing the drawbacks above. Nevertheless, the proposed model in this paper remained useful for drought management decisions. Accordingly, this validated comprehensive model may be extended to any other drought-prone regions with local-modified criteria and associated datasets to derive detailed spatial patterns and drought resistance strategies.

5. Conclusions

This study developed a comprehensive agricultural drought risk assessment model combining all risk components (exposure, hazard, vulnerability and mitigation capacity) using fuzzy logic and geospatial techniques. It was applied in Songnen Plain to justify its applicability. ROC and AUC techniques were applied using training and testing datasets to evaluate the efficiency of the results, and the prediction rate was 88.6%. The similarity of the water resources spatial distribution and the drought spatial pattern further verified the reliability of the model. It demonstrated that the combination of geospatial techniques and fuzzy logic was very effective in agricultural drought risk mapping. Moreover, the results suggest that drought mitigation capacity can influence the outputs greatly and should be involved in the model. Drought risk in Songnen Plain decreased from very high and high risk in the southwest to low or very low risk in the northeast. The proportion of very high risk was 11.48% and was concentrated in the southwest part, and Daqing, Baicheng, Songyuan and Siping should pay more attention to drought management. Moderate risk was mainly distributed in the central region, where cultivated land is expanding continuously. The northeast region is an important dry grain production base for its low drought risk and good ecological quality. Due to different causes of drought risk in different regions, different drought mitigation strategies should be conducted. Coordination between the social economy and ecological environment is essential to combat drought disasters and promote regional sustainable development.

Author Contributions

Conceptualization, F.G. and S.Z.; methodology, S.Z.; software, R.Y.; resources, Y.Z. (Yafang Zhao); data curation, Y.C.; writing—original draft preparation, S.Z; writing—review and editing, F.G.; visualization, S.Z.; supervision, Y.Z. (Ying Zhang). All authors have read and agreed to the published version of the manuscript.

Funding

This research was supported by Provincial and ministerial co-construction project of Integration and Demonstration of Carbon Enhancement and Acid Reduction and Capacity Enhancement Technologies for Black Soils in the Northern Songnen Plain.

Institutional Review Board Statement

Not applicable.

Informed Consent Statement

Not applicable.

Data Availability Statement

Not applicable.

Acknowledgments

We thank our colleagues for their insightful comments on an earlier version of this manuscript.

Conflicts of Interest

The authors declare no conflict of interest.

References

  1. Mishra, A.K.; Singh, V.P. A review of drought concepts. J. Hydrol. 2010, 391, 202–216. [Google Scholar] [CrossRef]
  2. Dai, A. Increasing drought under global warming in observations and models. Nat. Clim. Chang. 2013, 3, 52–58. [Google Scholar] [CrossRef]
  3. Dikshit, A.; Pradhan, B.; Alamri, A.M. Temporal Hydrological Drought Index Forecasting for New South Wales, Australia Using Machine Learning Approaches. Atmosphere 2020, 11, 585. [Google Scholar] [CrossRef]
  4. Pandey, R.P.; Pandey, A.; Galkate, R.V.; Byun, H.-R.; Mal, B.C. Integrating Hydro-Meteorological and Physiographic Factors for Assessment of Vulnerability to Drought. Water Resour. Manag. 2010, 24, 4199–4217. [Google Scholar] [CrossRef]
  5. Park, J.; Baik, J.; Choi, M.; Jeong, J.; Sur, C. Hydrological severity assessment of extreme climate conditions. Int. J. Climatol. 2019, 39, 2725–2736. [Google Scholar] [CrossRef]
  6. Pei, W.; Fu, Q.; Liu, D.; Li, T.-x.; Cheng, K.; Cui, S. Spatiotemporal analysis of the agricultural drought risk in Heilongjiang Province, China. Theor. Appl. Climatol. 2018, 133, 151–164. [Google Scholar] [CrossRef]
  7. Xu, K.; Yang, D.; Yang, H.; Li, Z.; Qin, Y.; Shen, Y. Spatio-temporal variation of drought in China during 1961–2012: A climatic perspective. J. Hydrol. 2015, 526, 253–264. [Google Scholar] [CrossRef]
  8. Li, F.; Li, H.; Lu, W.; Zhang, G.; Kim, J.-C. Meteorological Drought Monitoring in Northeastern China Using Multiple Indices. Water 2019, 11, 72. [Google Scholar] [CrossRef] [Green Version]
  9. Thomas, T.; Jaiswal, R.K.; Galkate, R.; Nayak, P.C.; Ghosh, N.C. Drought indicators-based integrated assessment of drought vulnerability: A case study of Bundelkhand droughts in central India. Nat. Hazard. 2016, 81, 1627–1652. [Google Scholar] [CrossRef]
  10. Jiao, W.; Tian, C.; Chang, Q.; Novick, K.A.; Wang, L. A new multi-sensor integrated index for drought monitoring. Agric. For. Meteorol. 2019, 268, 74–85. [Google Scholar] [CrossRef] [Green Version]
  11. Liu, X.; Guo, P.; Tan, Q.; Xin, J.; Li, Y.; Tang, Y. Drought risk evaluation model with interval number ranking and its application. Sci. Total Environ. 2019, 685, 1042–1057. [Google Scholar] [CrossRef] [PubMed]
  12. Murthy, C.S.; Laxman, B.; Sai, M.V.R.S. Geospatial analysis of agricultural drought vulnerability using a composite index based on exposure, sensitivity and adaptive capacity. Int. J. Disaster Risk Reduct. 2015, 12, 163–171. [Google Scholar] [CrossRef]
  13. Wilhite, D.A.; Glantz, M.H. Understanding: The Drought Phenomenon: The Role of Definitions. Water Int. 2009, 10, 111–120. [Google Scholar] [CrossRef] [Green Version]
  14. Wu, H.; Qian, H.; Chen, J.; Huo, C. Assessment of Agricultural Drought Vulnerability in the Guanzhong Plain, China. Water Resour. Manag. 2017, 31, 1557–1574. [Google Scholar] [CrossRef]
  15. Nasrollahi, M.; Khosravi, H.; Moghaddamnia, A.; Malekian, A.; Shahid, S. Assessment of drought risk index using drought hazard and vulnerability indices. Arab. J. Geosci. 2018, 11, 1–12. [Google Scholar] [CrossRef]
  16. Zeng, Z.; Wu, W.; Li, Z.; Zhou, Y.; Guo, Y.; Huang, H. Agricultural Drought Risk Assessment in Southwest China. Water 2019, 11, 1064. [Google Scholar] [CrossRef] [Green Version]
  17. Guttman, N.B. Comparing the Palmer Drought Index and the Standardized Precipitation Index. JAWRA J. Am. Water Resour. Assoc. 1998, 34, 113–121. [Google Scholar] [CrossRef]
  18. McKee, T.B.; Doesken, N.J.; Kleist, J. The relationship of drought frequency and duration to time scales. In Proceedings of the 8th Conference on Applied Climatology, Anaheim, CA, USA, 17–22 January 1993; pp. 179–183. [Google Scholar]
  19. Safwan, M.; Karam, A.; Enaruvbe, G.O.; Bashar, B.; Ahmed, E.; Adrienn, S.; Abdullah, A.; Endre, H. Assessing the impacts of agricultural drought (SPI/SPEI) on maize and wheat yields across Hungary. Sci. Rep. 2022, 12, 8838. [Google Scholar]
  20. Shukla, S.; Wood, A.W. Use of a standardized runoff index for characterizing hydrologic drought. Geophys. Res. Lett. 2008, 35, 226–236. [Google Scholar] [CrossRef] [Green Version]
  21. Ionita, M.; Scholz, P.; Chelcea, S. Assessment of droughts in Romania using the Standardized Precipitation Index. Nat. Hazard. 2016, 81, 1483–1498. [Google Scholar] [CrossRef] [Green Version]
  22. Sein, Z.M.M.; Zhi, X.F.; Katchele, O.F.; Kwesi, N.I.; Kenny, T.C.L.K.S.; Tchalim, G.G. Spatio-Temporal Analysis of Drought Variability in Myanmar Based on the Standardized Precipitation Evapotranspiration Index (SPEI) and Its Impact on Crop Production. Agronomy 2021, 11, 1691. [Google Scholar] [CrossRef]
  23. Naumann, G.; Barbosa, P.; Garrote, L.; Iglesias, A.; Vogt, J. Exploring drought vulnerability in Africa: An indicator based analysis to be used in early warning systems. Hydrol. Earth Syst. Sci. 2014, 18, 1591–1604. [Google Scholar] [CrossRef] [Green Version]
  24. Lina, E.; Jonathan, S. Meteorological, agricultural and socioeconomic drought in the Duhok Governorate, Iraqi Kurdistan. Nat. Hazard. 2015, 76, 421–441. [Google Scholar]
  25. Huang, S.; Huang, Q.; Chang, J.; Leng, G. Linkages between hydrological drought, climate indices and human activities: A case study in the Columbia River basin. Int. J. Climatol. 2016, 36, 280–290. [Google Scholar] [CrossRef]
  26. Zhang, B.; Wu, P.; Zhao, X.; Wang, Y.; Gao, X.; Cao, X. A drought hazard assessment index based on the VIC–PDSI model and its application on the Loess Plateau, China. Theor. Appl. Climatol. 2013, 114, 125–138. [Google Scholar] [CrossRef]
  27. Safavi, H.R.; Esfahani, M.K.; Zamani, A.R. Integrated Index for Assessment of Vulnerability to Drought, Case Study: Zayandehrood River Basin, Iran. Water Resour. Manag. 2014, 28, 1671–1688. [Google Scholar] [CrossRef]
  28. Kamali, B.; Kouchi, D.H.; Yang, H.; Abbaspour, K.C. Multilevel Drought Hazard Assessment under Climate Change Scenarios in Semi-Arid Regions-A Case Study of the Karkheh River Basin in Iran. Water 2017, 9, 241. [Google Scholar] [CrossRef]
  29. Kwon, M.; Sung, J.H. Changes in Future Drought with HadGEM2-AO Projections. Water 2019, 11, 312. [Google Scholar] [CrossRef] [Green Version]
  30. Moumita, P.; Sujata, B. Application of AHP with GIS in drought risk assessment for Puruliya district, India. Nat. Hazard. 2016, 84, 1905–1920. [Google Scholar]
  31. He, B.; Wang, J.Q.; Wu, D.; Su, L.J.; Shan, Y.Y. Agricultural drought risk assessment in Shaanxi province using principal component analysis and AHP. Agric. Res. Arid Areas 2017, 35, 219–227. [Google Scholar]
  32. Ali, M.; Deo, R.C.; Downs, N.J.; Maraseni, T. Multi-stage committee based extreme learning machine model incorporating the influence of climate parameters and seasonality on drought forecasting. Comput. Electron. Agric. 2018, 152, 149–165. [Google Scholar] [CrossRef]
  33. Prasad, R.; Deo, R.C.; Li, Y.; Maraseni, T. Input selection and performance optimization of ANN-based streamflow forecasts in the drought-prone Murray Darling Basin region using IIS and MODWT algorithm. Atmos. Res. 2017, 197, 42–63. [Google Scholar] [CrossRef]
  34. Deo, R.C.; Şahin, M. Application of the extreme learning machine algorithm for the prediction of monthly Effective Drought Index in eastern Australia. Atmos. Res. 2015, 153, 512–525. [Google Scholar] [CrossRef] [Green Version]
  35. Liu, Y.; Liu, L.; Xu, D.; Zhang, S. Risk assessment of flood and drought in major grain-producing areas based on information diffusion theory. Trans. Chin. Soc. Agric. Eng. 2010, 26, 1–7. [Google Scholar]
  36. Shan, Q.; Liu, B.C.; Liu, Y.; Yang, X.J.; Le, Y.Z.; Wang, J. Analysis on drought risk of maize based on natural disaster system theory in Liaoning province. J. Geol. Hazards Environ. Preserv. 2012, 28, 186–194. [Google Scholar]
  37. Li, L.Y. The advances on application of artificial neural network to environmental disasters prediction. J. Geol. Hazards Environ. Preserv. 2010, 21, 8–11. [Google Scholar]
  38. Ekrami, M.; Marj, A.F.; Barkhordari, J.; Dashtakian, K. Drought vulnerability mapping using AHP method in arid and semiarid areas: A case study for Taft Township, Yazd Province, Iran. Environ. Earth Sci. 2016, 75, 1–13. [Google Scholar] [CrossRef]
  39. Wijitkosum, S. Fuzzy AHP for drought risk assessment in Lam Ta Kong watershed, the north—Eastern region of Thailand. Soil Water Res. 2018, 14, 218–225. [Google Scholar] [CrossRef] [Green Version]
  40. Lewis, S.M.; Fitts, G.; Kelly, M.; Dale, L. A fuzzy logic-based spatial suitability model for drought-tolerant switchgrass in the United States. Comput. Electron. Agric. 2014, 103, 39–47. [Google Scholar] [CrossRef]
  41. Deo, R.C.; Tiwari, M.K.; Adamowski, J.F.; Quilty, J.M. Forecasting effective drought index using a wavelet extreme learning machine (W-ELM) model. Stoch. Environ. Res. Risk Assess. 2017, 31, 1211–1240. [Google Scholar] [CrossRef]
  42. Deo, R.C.; Byun, H.-R.; Adamowski, J.F.; Begum, K. Application of effective drought index for quantification of meteorological drought events: A case study in Australia. Theor. Appl. Climatol. 2017, 128, 359–379. [Google Scholar] [CrossRef]
  43. Li, X.H.; Yang, Y.; Yang, H.W. Combining BP Neural Network with Gray Model to Achieve Drought Predicting. J. Shenyang Agric. Univ. 2014, 45, 253–256. [Google Scholar]
  44. Ma, M.M.; Zhang, X.J.; Su, Z.C. Research review and perspective of drought forecasting. China Flood Drought Manag. 2021, 31, 58–63. [Google Scholar]
  45. Song, S.; Cai, H. Artificial neural network model for assessing the sustainable utilization of regional water resources. Trans. Chin. Soc. Agric. Eng. 2004, 20, 89–92. [Google Scholar]
  46. Yang, Q.; Yang, J.; Yao, R.; Huang, B.; Sun, W. Comprehensive evaluation of soil fertility by GIS and improved grey relation model. Trans. Chin. Soc. Agric. Eng. 2010, 26, 100–105. [Google Scholar]
  47. Dayal, K.S.; Deo, R.C.; Apan, A.A. Spatio-temporal drought risk mapping approach and its application in the drought-prone region of south-east Queensland, Australia. Nat. Hazard. 2018, 93, 823–847. [Google Scholar] [CrossRef]
  48. Pei, W.; Fu, Q.; Liu, D.; Li, T.; Cheng, K.; Cui, S. A Novel Method for Agricultural Drought Risk Assessment. Water Resour. Manag. 2019, 33, 2033–2047. [Google Scholar] [CrossRef]
  49. Al-Abadi, A.M.; Shahid, S.; Ghalib, H.B.; Handhal, A.M. A GIS-Based Integrated Fuzzy Logic and Analytic Hierarchy Process Model for Assessing Water-Harvesting Zones in Northeastern Maysan Governorate, Iraq. Arab. J. Sci. Eng. 2017, 42, 2487–2499. [Google Scholar] [CrossRef]
  50. Weng, B.S.; Yan, D.H. Integrated strategies for dealing with droughts in changing environment in China. Resour. Sci. 2010, 32, 309–316. [Google Scholar]
  51. Feng, P.; Wang, B.; Liu, D.L.; Yu, Q. Machine learning-based integration of remotely-sensed drought factors can improve the estimation of agricultural drought in South-Eastern Australia. Agric. Syst. 2019, 173, 303–316. [Google Scholar] [CrossRef]
  52. Zhou, W.Z.; Liu, G.H.; Pan, J.J. Distribution of available soil water capacity in China. J. Geogr. Sci. 2005, 15, 3–12. [Google Scholar] [CrossRef]
  53. Al-Amin, H.M.; Biswajeet, P.; Naser, A.; Islam, S.M.S. Agricultural drought risk assessment of Northern New South Wales, Australia using geospatial techniques. Sci. Total Environ. 2021, 756, 143600. [Google Scholar]
  54. Hoque, M.A.-A.; Pradhan, B.; Ahmed, N.; Roy, S. Tropical cyclone risk assessment using geospatial techniques for the eastern coastal region of Bangladesh. Sci. Total Environ. 2019, 692, 10–22. [Google Scholar] [CrossRef] [PubMed]
  55. GB/T 20481-2017; Grades of Meteorological Drought. General Administration of Quality Supervision, Inspection and Quarantine of the People Republic of China, China National Standardization Administration Committee: Beijing, China, 2017.
  56. Dikshit, A.; Pradhan, B.; Alamri, A.M. Long Lead Time Drought Forecasting Using Lagged Climate Variables and a Stacked Long Short-term Memory Model. Sci. Total Environ. 2020, 755, 142638. [Google Scholar] [CrossRef] [PubMed]
  57. Chou, J.; Xian, T.; Zhao, R.; Xu, Y.; Yang, F.; Sun, M. Drought Risk Assessment and Estimation in Vulnerable Eco-Regions of China: Under the Background of Climate Change. Sustainability 2019, 11, 4463. [Google Scholar] [CrossRef] [Green Version]
  58. Pandey, S.; Pandey, A.C.; Nathawat, M.S.; Kumar, M.; Mahanti, N.C. Drought hazard assessment using geoinformatics over parts of Chotanagpur plateau region, Jharkhand, India. Nat. Hazard. 2012, 63, 279–303. [Google Scholar] [CrossRef]
  59. Jia, J.Y.; Han, L.Y.; Wan, X.; Liu, W.J. Risk and Regionalization of Drought for Winter Wheat in Gansu Province. Arid Zone Res. 2019, 36, 1478–1486. [Google Scholar]
  60. Zadeh, L.A. Fuzzy Algorithms. Inf. Control. 1968, 12, 94–102. [Google Scholar] [CrossRef] [Green Version]
  61. Zhu, Q.; Zhang, M.D.; Ding, Y.L.; Zeng, H.W.; Wang, W.; Liu, F. Fuzzy logic approach for eegional landslide susceptibility analysis constrained by spatial characteristics of environmental factors. Geomat. Inf. Sci. Wuhan Univ. 2021, 46, 1431–1440. [Google Scholar]
  62. Keller, C.P. Geographic information systems for geoscientists: Modelling with GIS. Comput. Geosci. 1995, 21, 1110–1112. [Google Scholar] [CrossRef]
  63. Youssef, A.M.; Pradhan, B.; Sefry, S.A. Flash flood susceptibility assessment in Jeddah city (Kingdom of Saudi Arabia) using bivariate and multivariate statistical models. Environ. Earth Sci. 2016, 75, 12. [Google Scholar] [CrossRef]
  64. Wu, Z.; Xu, H.; Li, Y.; Wen, L.; Li, J.; Lu, G.; Li, X. Climate and drought risk regionalisation in China based on probabilistic aridity and drought index. Sci. Total Environ. 2018, 612, 513–521. [Google Scholar] [CrossRef] [PubMed]
  65. Rahmati, O.; Falah, F.; Dayal, K.S.; Deo, R.C.; Mohammadi, F.; Biggs, T.; Moghaddam, D.D.; Naghibi, S.A.; Bui, D.T. Machine learning approaches for spatial modeling of agricultural droughts in the south-east region of Queensland Australia. Sci. Total Environ. 2020, 699, 134230. [Google Scholar] [CrossRef]
  66. Baoan, H.; Huifeng, W.; Hairong, H.; Xiaoqin, C.; Fengfeng, K. Dramatic shift in the drivers of ecosystem service trade-offs across an aridity gradient: Evidence from China’s Loess Plateau. Sci. Total Environ. 2022, 858, 159836. [Google Scholar]
  67. Omondi, J.O.; Chitedze, I.; Kumatso, J. Characterization, Forecasting and Assessment of Agricultural Drought Impacts in the Sudano-Sahelian Climate of Gourma Province in Burkina FASO. Environ. Ecosyst. Sci. 2021, 5, 1–9. [Google Scholar] [CrossRef]
  68. ZHENG, S.H.; Tan, Z.H.; Zhang, W.B. Drought variation in Songnen Plain and its response to climate change. Chin. J. Agrometeorol. 2015, 36, 640. [Google Scholar]
  69. Liao, Y.; Zhang, C. Spatio-temporal distribution characteristics and disaster change of drought in China based on meteorological drought composite index. Meteorol. Mon 2017, 43, 1402–1409. [Google Scholar]
  70. NI, S.H.; WANG, H.L.; LIU, J.N.; GU, Y. Characteristics and Causes of Agricultural Drought Disasters in China. Chin. Agric. Sci. Bull. 2022, 38, 106–111. [Google Scholar]
  71. Wu, X.R.; Na, X.D.; Zang, S.Y. Application of temperature vegetation dryness index in the estimation of soil moisture of the Songnen Plain. Acta Ecol. Sin. 2019, 39, 4432–4441. [Google Scholar]
  72. Wang, H.R.; Liu, D.M.; Chen, P.S.; Li, Y.C.; Han, X.; Hao, X.Y. Distribution of maturity types of maize based on accumulated temperature rezone in northeast China. Chin. J. Agric. Resour. Reg. Plan. 2022, 43, 102–112. [Google Scholar]
  73. Shi, Y.Z.; Li, W.L.; Lu, D.M.; Wang, Z.Q.; Yang, X.J. Spatio-temporal analysis of drought vulnerability on the Loess Plateau of China at town level. Resour. Sci. 2017, 39, 2130–2140. [Google Scholar]
  74. Wu, X.Y.; Shan, B.Q.; Chen, Y.J. Research progress of land degradation. Guangdong Agric. Sci. 2013, 40, 63–66. [Google Scholar]
  75. Meza, I.; Siebert, S.; Döll, P.; Kusche, J.; Herbert, C.; Rezaei, E.E.; Nouri, H.; Gerdener, H.; Popat, E.; Frischen, J.; et al. Global-scale drought risk assessment for agricultural systems. Nat. Hazards Earth Syst. Sci. 2020, 20, 695–712. [Google Scholar] [CrossRef] [Green Version]
  76. Hao, L.; Zhang, X.; Liu, S. Risk assessment to China’s agricultural drought disaster in county unit. Nat. Hazard. 2012, 61, 785–801. [Google Scholar] [CrossRef]
  77. Li, R.; Tsunekawa, A.; Tsubo, M. Index-based assessment of agricultural drought in a semi-arid region of Inner Mongolia, China. J. Arid Land 2014, 6, 3–15. [Google Scholar] [CrossRef] [Green Version]
  78. Belal, A.-A.; El-Ramady, H.R.; Mohamed, E.S.; Saleh, A.M. Drought risk assessment using remote sensing and GIS techniques. Arab. J. Geosci. 2014, 7, 35–53. [Google Scholar] [CrossRef]
  79. Qi, S.H. Drought monitoring models with remote sensing and Spatio-Temporal characteristics of drought in China. Inst. Remote Sens. Appl. 2004. [Google Scholar]
  80. Gopinath, G.; Ambili, G.K.; Gregory, S.J.; Anusha, C.K. Drought risk mapping of south-western state in the Indian peninsula—A web based application. J. Environ. Manag. 2015, 161, 453–459. [Google Scholar] [CrossRef]
  81. Zheng, K.; Chen, H.; Zhang, L.J.; Gao, Y.H. Risk Assessment and Zoning of Agricultural Drought Disaster in Heilongjiang Province. Agric. Sci. Technol. 2011, 12, 588–591. [Google Scholar]
  82. Hoque, M.A.-A.; Pradhan, B.; Ahmed, N. Assessing drought vulnerability using geospatial techniques in northwestern part of Bangladesh. Sci. Total Environ. 2020, 705, 135957. [Google Scholar] [CrossRef]
  83. Andrić, J.M.; Lu, D.-G. Fuzzy probabilistic seismic hazard analysis with applications to Kunming city, China. Nat. Hazard. 2017, 89, 1031–1057. [Google Scholar] [CrossRef]
  84. WANG, Z.W.; Zhai, P.M. Variation of drought over northern China during 1950–2000. J. Geogr. Sci. 2003, 13, 98–105. [Google Scholar]
  85. Zhao, J.F.; Guo, J.P.; Xu, J.F.; Mao, F.; Yang, X.G.; Zhang, Y.H. Trends of Chinese dry-wet condition based on wetness index. Trans. Chin. Soc. Agric. Eng. 2010, 26, 18–24. [Google Scholar]
Figure 1. Location of the study area.
Land 12 01184 g001
Figure 2. The research framework.
Land 12 01184 g002
Figure 3. Land use map.
Land 12 01184 g003
Figure 4. Spatial pattern of standardized drought factor.
Land 12 01184 g004
Figure 5. Spatial pattern of (a) exposure, (b) hazard, (c) vulnerability and (d) mitigation capacity.
Land 12 01184 g005
Figure 6. Agricultural drought risk map of the Songnen Plain.
Land 12 01184 g006
Figure 7. Schemes follow the same formatting.
Land 12 01184 g007
Figure 8. Total water resources and precipitation in Songnen Plain.
Land 12 01184 g008
Figure 9. Main water uses and the total volume of water consumption in Songnen Plain.
Land 12 01184 g009
Figure 10. Spatial overlay of drought risk and water resources utilization.
Land 12 01184 g010
Table 1. Data sources and description.
DataTypesSourcePeriod/Year
DEMRaster (30 m)Geospatial Data Cloud (http://www.gscloud.cn/, accessed on 6 March 2023)-
SlopeRaster (30 m)Extracted from DEM-
Population densityRaster (100 m)Population density spatial distribution data set (https://data.tpdc.ac.cn/zh-hans/, accessed on 26 March 2023)2015
Land use/cover (LULC)Raster (30 m)Google Earth Engine cloud computing platform2021
Mean annual rainfall, mean annual maximum temperature,
mean annual evaporation, mean annual humidity
Raster (30 m)National meteorological science data center
(http://data.cma.cn/, accessed on 20 October 2022)
2000–2021
Soil depth, sand contentRaster (90 m)Harmonized World Soil Database (HWSD)2009
Soil moistureRaster (250 m)Geographic remote sensing ecological network platform (www.gisrs.cn/, accessed on 28 October 2022)2000–2021
NDVI, irrigation indexRaster (30 m)Google Earth Engine cloud computing platform2021
LithologyShapefile Resource and Environment Science and Data Center (http://www.igsnrr.ac.cn/, accessed on 13 January 2023)2000
Distance to road,
distance to river, river density
Shapefile National Geomatics Center of China
(http://www.ngcc.cn/ngcc/, accessed on 16 January 2023)
2018
Plant available water capacity (PAWC)Raster (90 m)Calculation based on HWSD [51]-
Water resources utilization-Water Resources Bulletin2021
Table 2. Classification and evaluation of drought exposure, hazard factors, vulnerability, and mitigation capacity.
Fuzzy Membership
Function
CriteriaVery HighHighModerateLowVery Low
Fuzzy-LARGEDEM (m)>600450–600300–450150–300<150
Slope (%)>1410–146–102–6<2
LULCCroplandConstruction LandGrasslandForestlandWetlandsWater
Mean maximum temperature (°C)13.0–14.311.9–12.910.8–11.89.5–10.78.3–9.4
Evaporation (mm)658.0–731.7612.2–657.9565.3–612.1512.8–565.2446.8–512.7
Sand (%)>8060–8040–6020–40<20
Lithologya—Granite
b—Basalt
c—Andesite
d—Gneiss
e—Sandstone
f—Graywacke
g—Arkose
h—Siltstone,
Mudstone
i—Glacial facies
j—Lake facies
k—Eolian sandstone
l—Marine facies
m—Fluvial faciesn—Weathered layer
o—Others
Distance to river (km)>43–42–31–20–1
Distance to road (km)>43–42–31–20–1
Fuzzy-LINEARPopulation density
(sq·km)
>40003000–40002000–30001000–2000<1000
Weights assigned108642−100
Fuzzy-SMALLMean rainfall (mm)406.5–467.3467.4–513.8513.9–555.8555.9–610.1610.2–688.6
Mean humidity (%)54.8–59.960.0–63.863.9–67.267.3–70.170.2–74.4
NDVI<0.20.2–0.40.4–0.60.6–0.8>0.8
Soil depth (m)0.02–0.30.3–0.50.5–0.70.7–0.90.9–0.11
Soil moisture (%)<1010–2020–3030–40>40
River density (km/km2)0–0.0190.020–0.0590.060–0.1030.104–0.1570.158–0.353
Irrigation index (%)0.01–0.050.06–0.170.18–0.350.36–0.580.59–1.06
PAWC (10−2 cm3/cm−3)<1515–1717–1919–21>21
Weights assigned246810
Disclaimer/Publisher’s Note: The statements, opinions and data contained in all publications are solely those of the individual author(s) and contributor(s) and not of MDPI and/or the editor(s). MDPI and/or the editor(s) disclaim responsibility for any injury to people or property resulting from any ideas, methods, instructions or products referred to in the content.

