Article

From Productive Landscape to Agritouristic Landscape? The Evidence of an Agricultural Heritage System—Zhejiang Huzhou Mulberry-Dyke and Fish-Pond System

1
College of Environmental and Resource Sciences, Zhejiang University, Hangzhou 310058, China
2
The Rural Development Academy, Zhejiang University, Hangzhou 310058, China
3
College of Landscape Architecture, Zhejiang A&F University, Linan 311300, China
*
Author to whom correspondence should be addressed.
Land 2023, 12(5), 1066; https://doi.org/10.3390/land12051066
Submission received: 12 April 2023 / Revised: 6 May 2023 / Accepted: 10 May 2023 / Published: 13 May 2023

Abstract

:
Agricultural Heritage Systems exhibit multiple functions of agricultural production, ecological protection, and invaluable cultures and landscapes. The mulberry-dyke and fish-pond system is an important agricultural heritage. The Nanxun District of Huzhou, China is currently the area with the most complete and largest mulberry dykes and fish ponds in the world. In the past thirty years, with changes in labor force distribution and consumer demand, the production function of mulberry dyke and fish ponds has been challenged, and the production landscape as the carrier of farming culture has been threatened. Studying the spatial characteristics and optimization of mulberry dykes and fish ponds is of great significance to the sustainable development of the regional economy, culture, and environment. This study analyzes the spatial and temporal pattern evolution of mulberry dyke and fish ponds in Nanxun District since 1975. Based on the evaluation of the environmental carrying capacity of fish ponds, and according to the development goals of agricultural heritage inheritance and “planting and breeding balance”, the Future Land Use Simulation model is adopted to optimize the study area. The results show the following findings: (1) From 1975 to 2019, fish ponds and construction land increased significantly, mulberry fields and paddy fields decreased significantly, the scale of mulberry dykes and fish ponds decreased significantly, and the proportion of mulberry dykes and fish ponds was seriously unbalanced; (2) The overall scale of fish-pond breeding in Nanxun District is too large, and the proportion of farming and breeding needs to be adjusted; (3) In view of economic growth, cultural inheritance, and environmental protection, this paper simulates the spatial layout of mulberry dykes and fish ponds in 2035, and divides mulberry dykes and fish ponds in Nanxun District into a display area and an industrial development area. The display area restores the traditional mulberry dykes and fish ponds to the greatest extent. The industrial development zone maximizes the economic benefits of agriculture on the basis of “balancing planting and breeding”. Overall, this study provides a reference for protecting Huzhou mulberry-dyke and fish-pond agricultural heritage, optimizing agricultural production space, balancing human–environment relationship, and promoting regional sustainable development.

1. Introduction

As urbanization continues to develop, global warming is intensifying, agricultural non-point source pollution is prevalent globally [1,2,3], and food security has become a huge challenge faced by all countries in the world. On the basis of actively improving food production capacity, people are also paying increasing attention to the ecological and cultural functions of agriculture [4,5,6]. For a long time, farmers in various countries have created diverse and locally adapted agricultural systems under different concepts, staff, technology, and market backgrounds, adopted ingenious management methods, and used low-level technology and limited resources to maximize returns [7,8,9]. Many of these farming models are still performing production functions today, taking into account ecological security and biodiversity protection, and also providing local people with a strong sense of cultural belonging. In order to protect these heritages, the Food and Agriculture Organization of the United Nations launched the conservation initiative of the Globally Important Agricultural Heritage Systems in 2002. However, with accelerated urbanization and industrialization, rural populations are moving to cities, and modern agriculture is developing towards intensification, mechanization, and large-scale operation, greatly improving agricultural production efficiency and economic benefits, and bringing a huge impact on traditional agricultural production models [10,11]. Therefore, it is important to ask what kind of development we want under this irreversible trend confronting the agricultural heritage system, and how such considerations can positively contribute [12]. Facing this issue, agritourism would be an effective measure to preserve agricultural heritage [13]. To determine whether a productive landscape or an agritouristic landscape is beneficial and to make a sustainable development strategy for agricultural heritage areas, it requires us to enhance the understanding of traditional production methods and conduct effective top-level design.
China’s mulberry-dyke and fish-pond agricultural model originated more than 2500 years ago [14]. The ancient working people in the Taihu Lake Basin and the Pearl River Basin made full use of biological resources and water and soil resources, carried out material circulation and energy flow by “raising silkworms with mulberry leaves, feeding fish with silkworm feces, and fertilizing mulberries with pond mud” [14], and gradually formed a multi-layer compound circulation system with silk and freshwater fish as the main products. It is a typical example of ecological agriculture and sustainable agriculture in China and was recognized as a “Globally Important Agricultural Heritage” [15] in 2017. The research on mulberry dykes and fish ponds began in the 1980s, focusing on its productivity at first, and the research content mainly focused on the circulation principle and material energy flow [16,17]. In recent years, with the development of GPS, GIS, and RS technology, the spatial and temporal scale of research has been increasing [18]. Studies have found that the scale of mulberry dykes and fish ponds in the Pearl River Delta has shrunk severely since the beginning of the 21st century, and the reasons for their degradation are closely related to monoculture, construction land occupation, and agricultural non-point source pollution [19,20,21]. Studies also evaluated the effectiveness of mulberry dykes and fish ponds being selected as a globally important agricultural heritage in mitigating land use change [22] and put forward ideas for the reconstruction of modern intensive mulberry-dyke and fish-pond systems.
At present, most of the studies on the spatial pattern of mulberry dykes and fish ponds are in the Pearl River Delta region, and studies in the Taihu Lake Basin, which is the origin of mulberry dyke and fish ponds, are few [22]. The research focuses on the microcosmic mechanism of mulberry dykes and fish ponds, while the research at the landscape level focuses on the analysis of landscape patterns and driving forces [19,20,21]. The analysis results have not been applied to the future development of mulberry dykes and fish ponds. Although isolated fish ponds and surrounding dykes may also have part of the structure and function of mulberry-dyke and fish-pond systems, they are only limited to the interface of water and land, so they cannot be classified as the mulberry-dyke and fish-pond system. Only when the mulberry dyke and the fish pond are connected, row upon row, and form a continuous patch, the water and land edge effect of the mulberry dyke and fish pond can be fully reflected and become a real mulberry-dyke and fish-pond system [16] (Figure 1). Therefore, analyzing the mulberry-dyke and fish-pond system at the landscape level and exploring the future development direction from the evolution of space-time pattern can enhance the understanding of the characteristics, advantages, and prospects of mulberry dykes and fish ponds.
This study focuses on the mulberry dykes and fish ponds in the Taihu Lake Basin. This area is one of the most economically developed areas in China. It is not only the birthplace of silk in the world and an important origin of freshwater aquaculture in China but also the main production area and important production base of grain, silkworm cocoons, and freshwater fish in China. With the development of agricultural modernization, the cultivation of freshwater fish and silkworm cocoons in this area tends to be intensive, mechanized, and digitized, and the problems, such as the shrinking and degrading of the traditional mulberry-dyke and fish-pond system and the simplification of agricultural production structure, have become increasingly prominent. Facing the contradiction between economic growth, cultural inheritance, and environmental protection, this paper aims to answer the following two questions: 1. How has the spatial pattern of mulberry dykes and fish ponds changed since 1975? 2. Can the future development of mulberry dykes and fish ponds be simulated through the analysis of historical patterns and the balancing of their comprehensive benefits? Taking Nanxun District of Zhejiang Huzhou as an example, this paper studies the temporal and spatial pattern of mulberry dykes and fish ponds in long-term sequence at the landscape scale. The spatial pattern of mulberry dykes and fish ponds in Nanxun District are simulated in 2035, trying to provide a reference for the protection and development of mulberry dyke and fish ponds, the rational planning of traditional agricultural areas, and the sustainable development of agricultural heritage in Huzhou.

2. Study Area and Data Sources
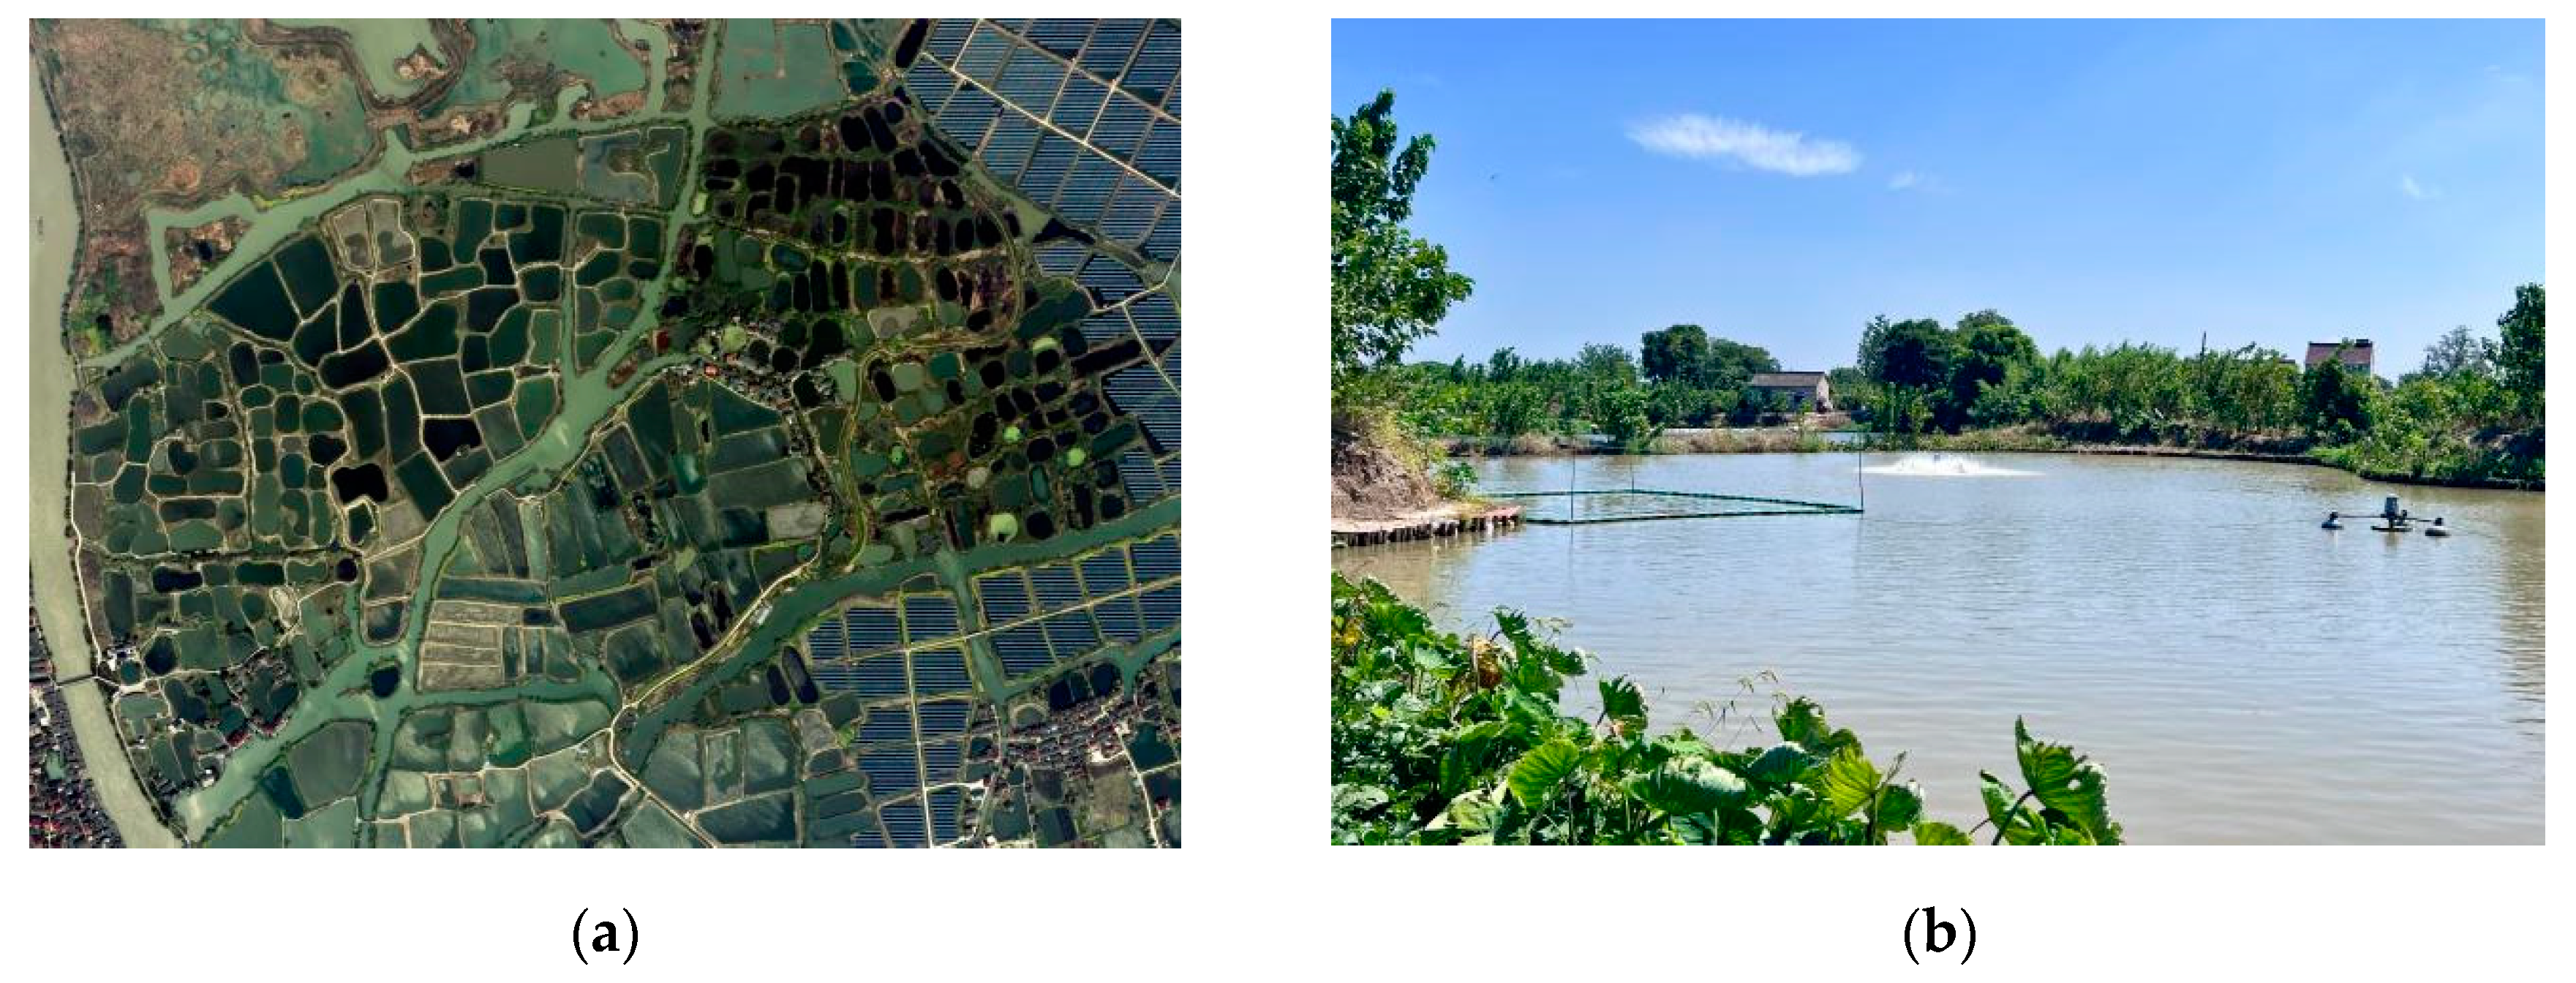
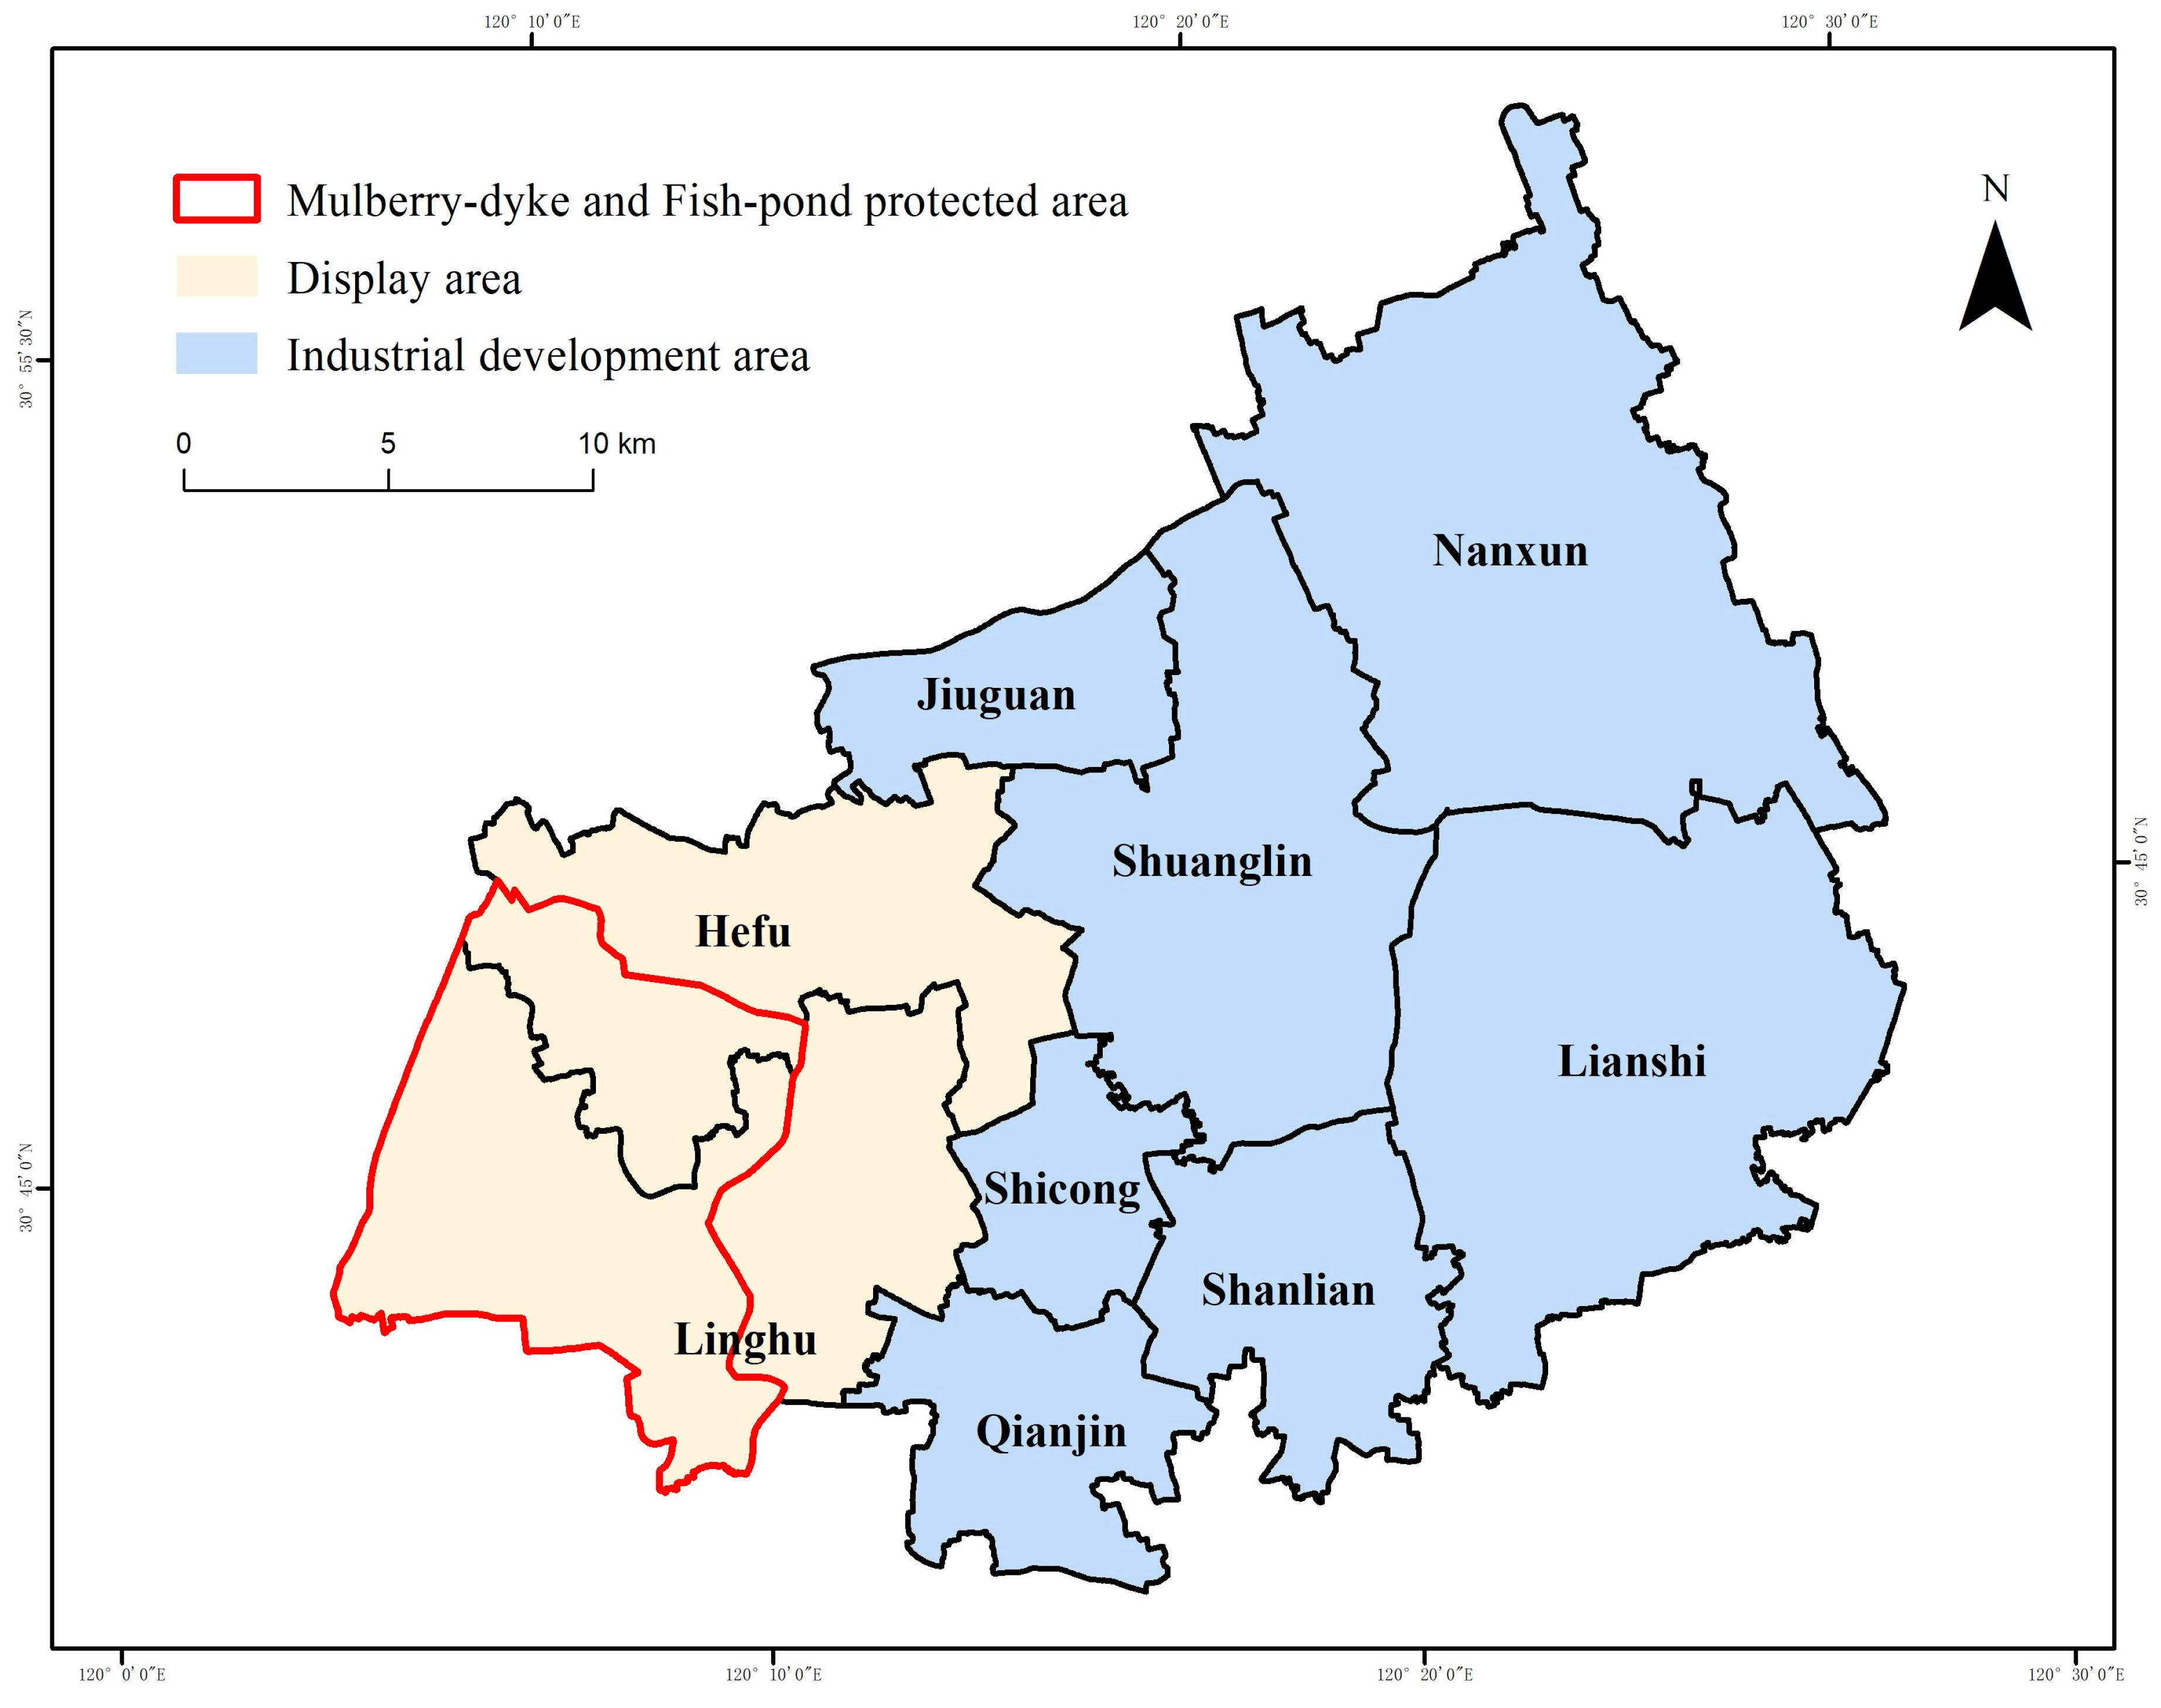
2.1. Study Area

Nanxun District is located in the east of Huzhou City, Zhejiang Province, China (Figure 2), in the north of the Hangjiahu Plain and on the south bank of Taihu Lake. It is a typical water network plain with flat terrain and a dense river network. Located in the subtropical monsoon climate zone, the annual average temperature is 15.5~16 °C, and the average precipitation is 1050~1850 mm [23]. The area of Nanxun District is 702.26 km2. In 2019, the registered population was 490,408, and the rural population was 317,766. The total output value of agriculture, forestry, animal husbandry and fishery for the year was CNY 2707.29 million [24].
The formation and evolution of mulberry dykes and fish ponds in Huzhou mainly went through five periods [14,25]: at first, the Taihu Lake Basin was low-lying and watery, and only the highlands could be used for agricultural production. During the Spring and Autumn and Warring States Period (between 770 and 221 BCE), people in the Taihu Lake Basin built ponds to garrison fields, built water conservancy projects, planted mulberry trees to feed silkworms on embankments, planted rice in polders, and raised fish in ponds, laying the foundation for the mulberry-dyke and fish-pond system. During the Three Kingdoms and Tang and Song Dynasties (between 220 and 1279 CE), the population from the north moved south, the center of the sericulture industry moved to the south, and the silk trade became prosperous. Some people accidentally discovered that the mud in the fish pond can make the mulberry tree grow rapidly, so they vigorously promoted the use of pond mud to fertilize the mulberry tree, and the mulberry-dyke and fish-pond system was initially formed. During the Yuan, Ming, and Qing dynasties (between 1279 and 1911 CE), the domestic and foreign markets of the sericulture industry further expanded, and as rice was easily affected by floods, the cost of fish farming in ponds was low, and the income was high, farmers began to change polders into fish ponds and planted mulberry trees to feed silkworms on the dyke. By the late Ming and early Qing dynasties, the Mulberry-dyke and Fish-pond system had been quite complete. After the founding of the People’s Republic of China, fishery production was vigorously promoted. From 1979 to 1985, the low-yielding old fish ponds in the Linghu area were comprehensively transformed, and the development of mulberry dyke and fish ponds reached its peak. In recent years, as aquaculture tends to be intensive and large scale, and the economic benefits of aquaculture continue to increase, while sericulture is greatly affected by the fluctuations of domestic and foreign markets, and the economic benefits of sericulture are unstable. The area of mulberry dykes continues to shrink, the area of fishponds is constantly increasing, and the ratio of mulberry dykes to fish ponds is from 6:4, 5:5, 4:6 to 3:7, 2:8, or even lower [26].

2.2. Data Source and Processing

(1) Spatial changes of mulberry dykes and fish ponds: 2019, 2015 and 2000 land use data were based on visual interpretation of Tiandi imagery for the corresponding years, with a resolution equal to 1 m; 1975 land use data were based on visual interpretation of keyhole satellite imagery in 1975, with a resolution equal to 4 m;
(2) Environmental carrying capacity of fish-pond culture: The number of nutrient elements absorbed by rice per unit output came from Criteria (GB/T 26622-2011) (N 2.2 kg/100 kg, P 0.8 kg/100 kg); the amount of nutrients absorbed per unit area of mulberry field came from related research [27] (N 414 kg/hm2, P 131 kg/hm2); the source of nitrogen and phosphorus pollution load produced by the unit output of fish-pond culture came from related research [28] (N 58.07 kg/t, P 18.99 kg/t); crop and freshwater fish production came from [24] (rice yield per unit area 7979 kg/hm2, freshwater fish production 185,793 t);
(3) Scenario simulation data: This study selects 12 driving factors from three aspects: natural factors, location conditions, and socioeconomic factors. The DEM data came from the geospatial data cloud, based on which the slope and aspect information were extracted; the main road, secondary road, water system, and other data came from the Open street map (http://www.openstreetmap.org/ (accessed on 20 November 2018)); the distance from the water system, main road, and built-up area was calculated by the ArcGIS Euclidean distance tool; 1 km × 1 km GDP data came from the Resource and Environment Science and Data Center of Chinese Academy of Sciences (http://www.resdc.cn/ (accessed on 15 December 2019)); 100 m × 100 m population distribution data came from Worldpop (https://www.worldpop.org/ (accessed on 26 October 2019)); the data of the Mulberry-dyke and Fish-pond Reserve came from [29]. All data were unified in coordinate system, resolution (30 m × 30 m) and number of rows and columns in tif format upon request.

3. Methods

3.1. Research Framework

The research framework was proposed (Figure 3). Firstly, the spatial-temporal changes of mulberry dykes and fish ponds were analyzed. Then, the environmental carrying capacity of fish-pond culture was evaluated. Based on these, the FLUS model parameters were set, and the spatial layouts of mulberry dykes and fish ponds in 2035 were simulated.

3.2. Land Use Dynamics

This study uses land-use dynamic index to analyze the degree of change in each land use type in the study area, which is expressed with the unit %, and its calculation formula is as follows:
L a n d u s e   d y n a m i c   i n d e x = U b U a U a × 1 T × 100 %
where U a is the area of a certain land use type at the beginning of the study period in hm2; U b is the area of a certain land use type at the end of the study period in hm2; T is the length of the study period.

3.3. Environmental Carrying Capacity of Fish-Pond Culture

The environmental carrying capacity of fish-pond culture is based on the principle of soil nutrient balance. The environmental carrying load coefficient of fish-pond culture ( q ) is the ratio of the total amount of nitrogen and phosphorus nutrients in the sediment ( S ) to the nutrient demand of rice and mulberry fields ( D ). Based on this, the carrying load coefficient of the fish-pond breeding environment in each town of the industrial development zone is calculated, and the calculation formula is as follows:
q = S D
When q > 1, it indicates that the scale of fish-pond culture is too large; when q = 0.8–1, it indicates that the scale of cultivation is close to balance; when q < 0.8, it indicates that the regional fish-pond culture still has a large environmental capacity [30]. According to the q value, the towns in the industrial development zone are divided into overload area ( q > 1), balance area ( q = 0.8–1), and potential area ( q < 0.8).

3.4. Scenario Simulation

The Future Land Use Simulation (FLUS) model is mainly composed of two modules: land suitability probability based on Artificial Neural Network (ANN) and Cellular Automata (CA) based on adaptive inertia mechanism [31]. It can simulate the conversion between various land use types under the influence of natural changes and human activities. The model uses the ANN module to obtain the probability of land suitability based on land use data and various driving factors, then uses the adaptive inertial competition mechanism of roulette selection to deal with the complexity and uncertainty of land use types changing under the joint influence of natural, social, and economic factors, and finally obtains simulation results of land use change with high accuracy. The accuracy of this study is 30 m.

3.4.1. Scenario Setting

In order to preserve the typical mulberry dykes and fish ponds in Nanxun District and take into account the economic benefits of agricultural production, Nanxun District was divided into a display area and an industrial development area (Figure 4). Hefu Town and Linghu Town are the birthplace and gathering area of mulberry dykes and fish ponds (already covering the Mulberry-dyke and Fish-pond Protected Area of Globally Important Agricultural Heritage), which are classified as display areas, and the rest of the towns are classified as industrial development areas. In this paper, we focused on the three types of land use, fish ponds, mulberry fields, and paddy fields, which are most closely related to mulberry-dyke and fish-pond production. The scenario settings are as follows:
(1) Display area. The goal of this area is to display, protect, and inherit the style and features of traditional mulberry dykes and fish ponds, so its original features should be restored to the greatest extent. However, due to the serious imbalance in the proportion of the current dyke and ponds, it is difficult and costly to restore the features completely, and the large-scale reduction of fish ponds will have a great impact on agricultural production. Therefore, the display area is divided into two areas: the mulberry-dyke and fish-pond system protected area and the exhibition area outside the protected area. Among them, the mulberry-dyke and fish-pond system protected area is optimized with the traditional dyke–pond ratio of 4:6, and in the display area outside the protected area, the proportion of mulberry fields should be appropriately reduced, and the ratio of dyke– pond should be 3:7 for optimization. According to the mosaic form of traditional mulberry dykes and fish ponds, the optimization goal is achieved by converting fish ponds into mulberry fields. Based on the current ratio of paddy fields to the total area of fish ponds, mulberry fields, and paddy fields, the mulberry-dyke and fish-pond protected area and the exhibition area outside the protected area are determined to account for 6% and 21%, respectively, and according to the optimized standard for the proportion of base ponds in the two areas, it was determined that the fish ponds accounted for 56% and 55%, respectively, and the mulberry fields accounted for 38% and 24%, respectively.
(2) Industrial development area. The main agricultural production methods in this area are fish-pond culture, rice planting, and silkworm cocoon culture, among which the ecological benefit of the mulberry-dyke and fish-pond system is the highest [32,33]. So referring to sediment reuse by “using pond mud to fertilize mulberry field” [25], this study used the sludge of fish ponds to provide the required nitrogen and phosphorus nutrients for rice and mulberry fields, thereby reducing the environmental pollution of fishpond culture and the application of chemical fertilizers for rice and mulberry fields. Therefore, based on the evaluation results of the environmental carrying capacity of fish ponds in the towns of the industrial development area, this study aimed at “planting and breeding balance” [34], so that the regional rice and mulberry planting can completely digest the nitrogen and phosphorus pollution of fish ponds, and fishpond culture economy can be developed with controllable pollution.
To optimize the potential area, the scale of fish-pond culture can be expanded appropriately. The economic benefits of silkworm cocoon breeding are unstable due to the influence of market economy fluctuation at home and abroad, and its production cost is high, thus the farmers’ willingness is low to engage in the production. Therefore, considering the market trend and farmers’ willingness, the mulberry fields are converted into fish ponds to increase farmers’ income. To optimize the balance area, the current ratio can be maintained. To optimize the overload area, the scale of fish-pond culture can be appropriately reduced. Paddy fields produce more stable economic benefits than mulberry fields because of stable demand, and it is highly feasible to convert fish ponds to paddy fields. Therefore, considering market stability and conversion feasibility, the fish ponds can be converted into paddy fields.
Since the unit output of fish-pond culture produces a greater nitrogen pollution load than that of phosphorus, when the nitrogen is balanced, the phosphorus must reach a balance. Therefore, the proportions of the three land types in each town under the balance of planting and breeding are calculated according to the environmental carrying load coefficient of nitrogen (Table 1), which is used as the basis for FLUS simulation.

3.4.2. Determination of Driving Factors

Land use change is the result of the joint action of many factors. In this study, based on relevant research [35,36,37] and the availability of data, 12 driving factors from three aspects were finally selected: natural factors, location conditions, and socioeconomic factors (Table 2).

3.4.3. Suitability Probability Calculation

The FLUS model trains the ANN through the selected spatial driving factors and the random sampling samples of the historical distribution of land use and obtains the development probability of the cell through the calculation of the ANN. ANN consists of three parts: the input layer, the hidden layer, and the output layer. The neuron in the input layer is the driving factor, and the output layer is the suitability probability of each land use type [31]. It is calculated as follows:
p p , k , t = j W j , k × 1 1 + e n e t j p , t
where p p , k , t is the suitability probability k of the land use type p appearing in the grid at time t ; W j , k is the adaptive weight between the hidden layer and the output layer; n e t j p , t is the signal received by the hidden layer neuron j on grid p at time t .

3.4.4. Model Parameter Setting

(1) Land demand forecast
This study uses the Markov model to predict the land demand under the zoning optimization scenario in 2035 (Table 3), and the calculation formula is as follows:
S t + 1 = S t × P i j
P i j = P 11 P 1 n P n 1 P n n 0 P i j < 1 i , j = 1 , 2 , , n j = 1 n P i j = 1 i , j = 1 , 2 , , n
where S t + 1 and S t are the land use status at time t + 1 and t , respectively; P i j is the probability that the land use type changes from i to j .
(2) Neighborhood factor
The neighborhood factor reflects the expansion ability of the land use type, and the weight ranges from 0–1, and the closer to 1, the stronger the expansion ability of the land type. Based on the relevant research on the setting of neighborhood factors in the FLUS model [38], this study characterizes the expansion ability according to the area change of each land use type from 2015 to 2019. The area change of each land use type was calculated based on the land use data from 2015 to 2019, and then dimensionless processing was performed to make the threshold between 0 and 1, which was then assigned to the neighborhood factor weight of each land use type (Table 4). According to the follow-up precision test results, this method has good adaptability to this study.
(3) Cost matrix
The cost matrix indicates whether each land use type can be converted to each other. When one land type is not allowed to be converted into another land type, the corresponding value of the matrix is set to 0, and when conversion is allowed, it is set to 1. The possibility of conversion of construction land to other land types is small, so it is set that construction land is not allowed to be converted to other land types, and other land types can be converted between each other (Table 5). This cost matrix is used for the simulation and accuracy verification of land use in 2019. In the zoning optimization scenario, the cost matrix is adjusted according to the land type conversion requirements of different zoning areas.
(4) Restricted area
If there are constraints in the simulation, the restricted transformation area can be set according to different scenarios. In this study, there are no constraints that need to be met for zoning optimization, so no restricted area is set.

3.4.5. Accuracy Verification

The land use data in 2015 and driving factors were used to simulate the land use situation in 2019, and the simulation results were compared with the actual land use data in 2019. The results showed that the accuracy rate of each type of simulation was higher than 80%. The spatial consistency and classification accuracy of the simulation results were tested by using the Kappa coefficient and the overall accuracy. The Kappa coefficient of the simulation results was 0.87, and the overall accuracy was 0.89.

4. Results

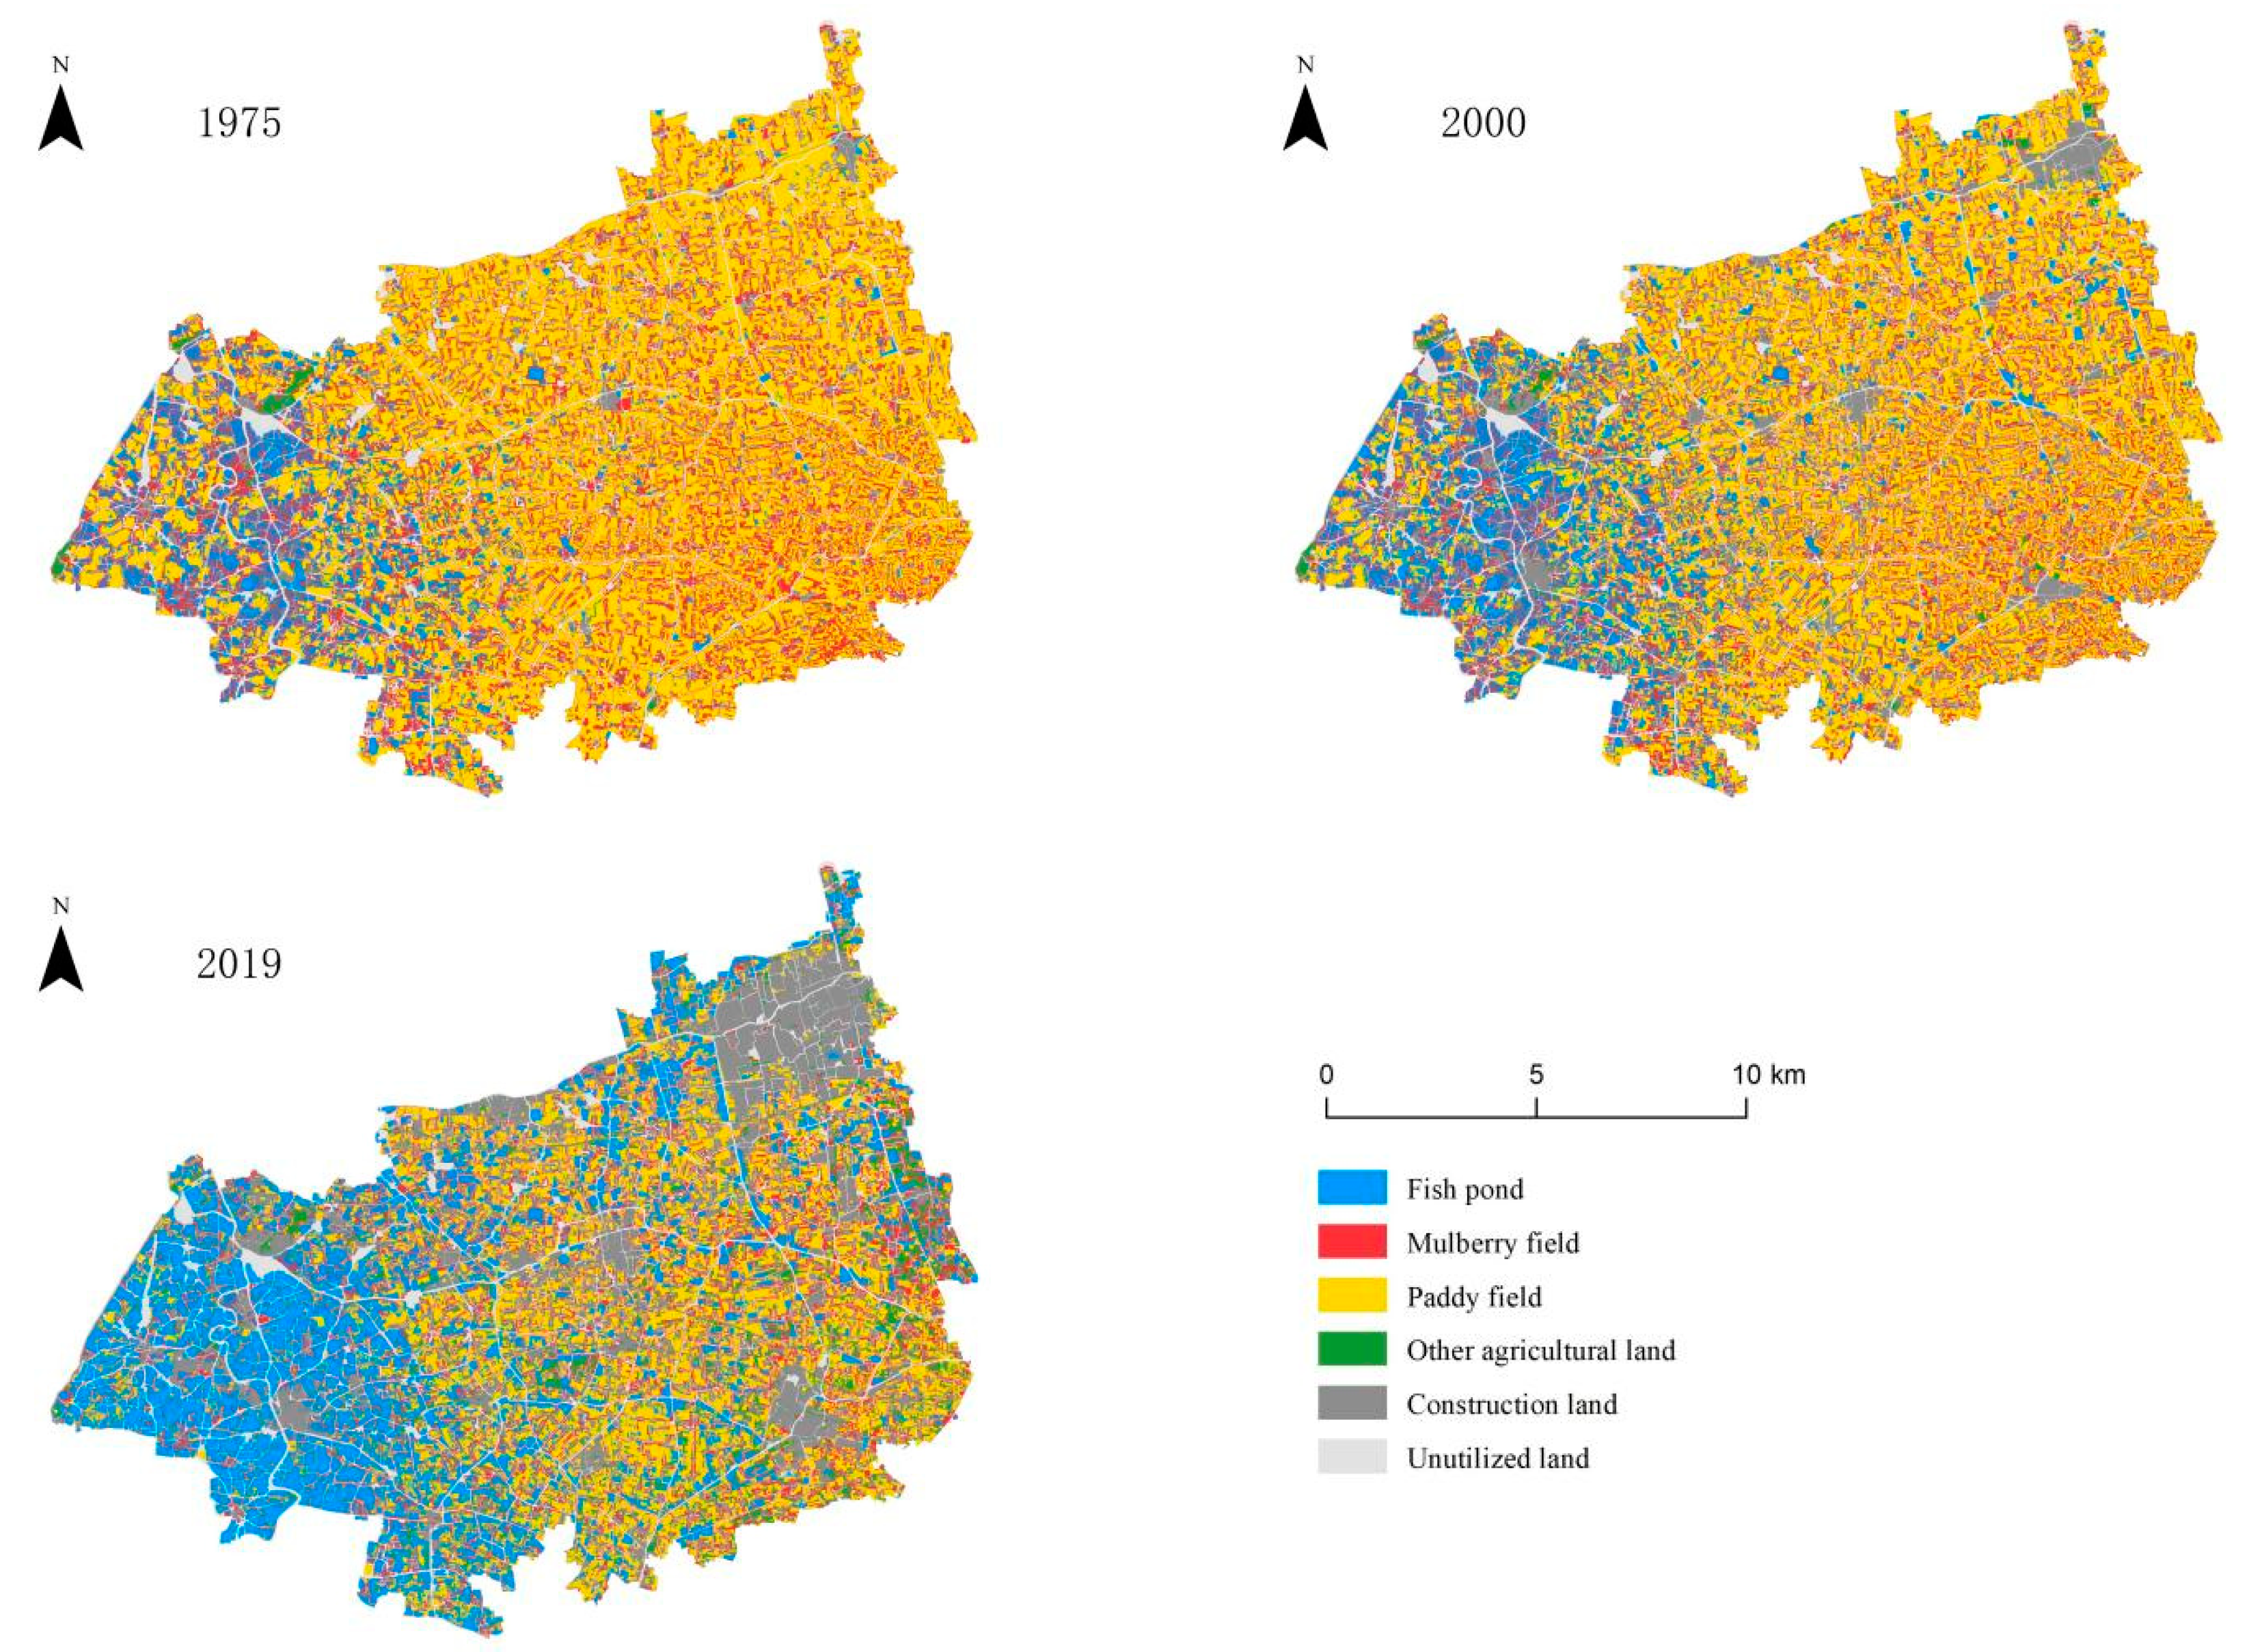
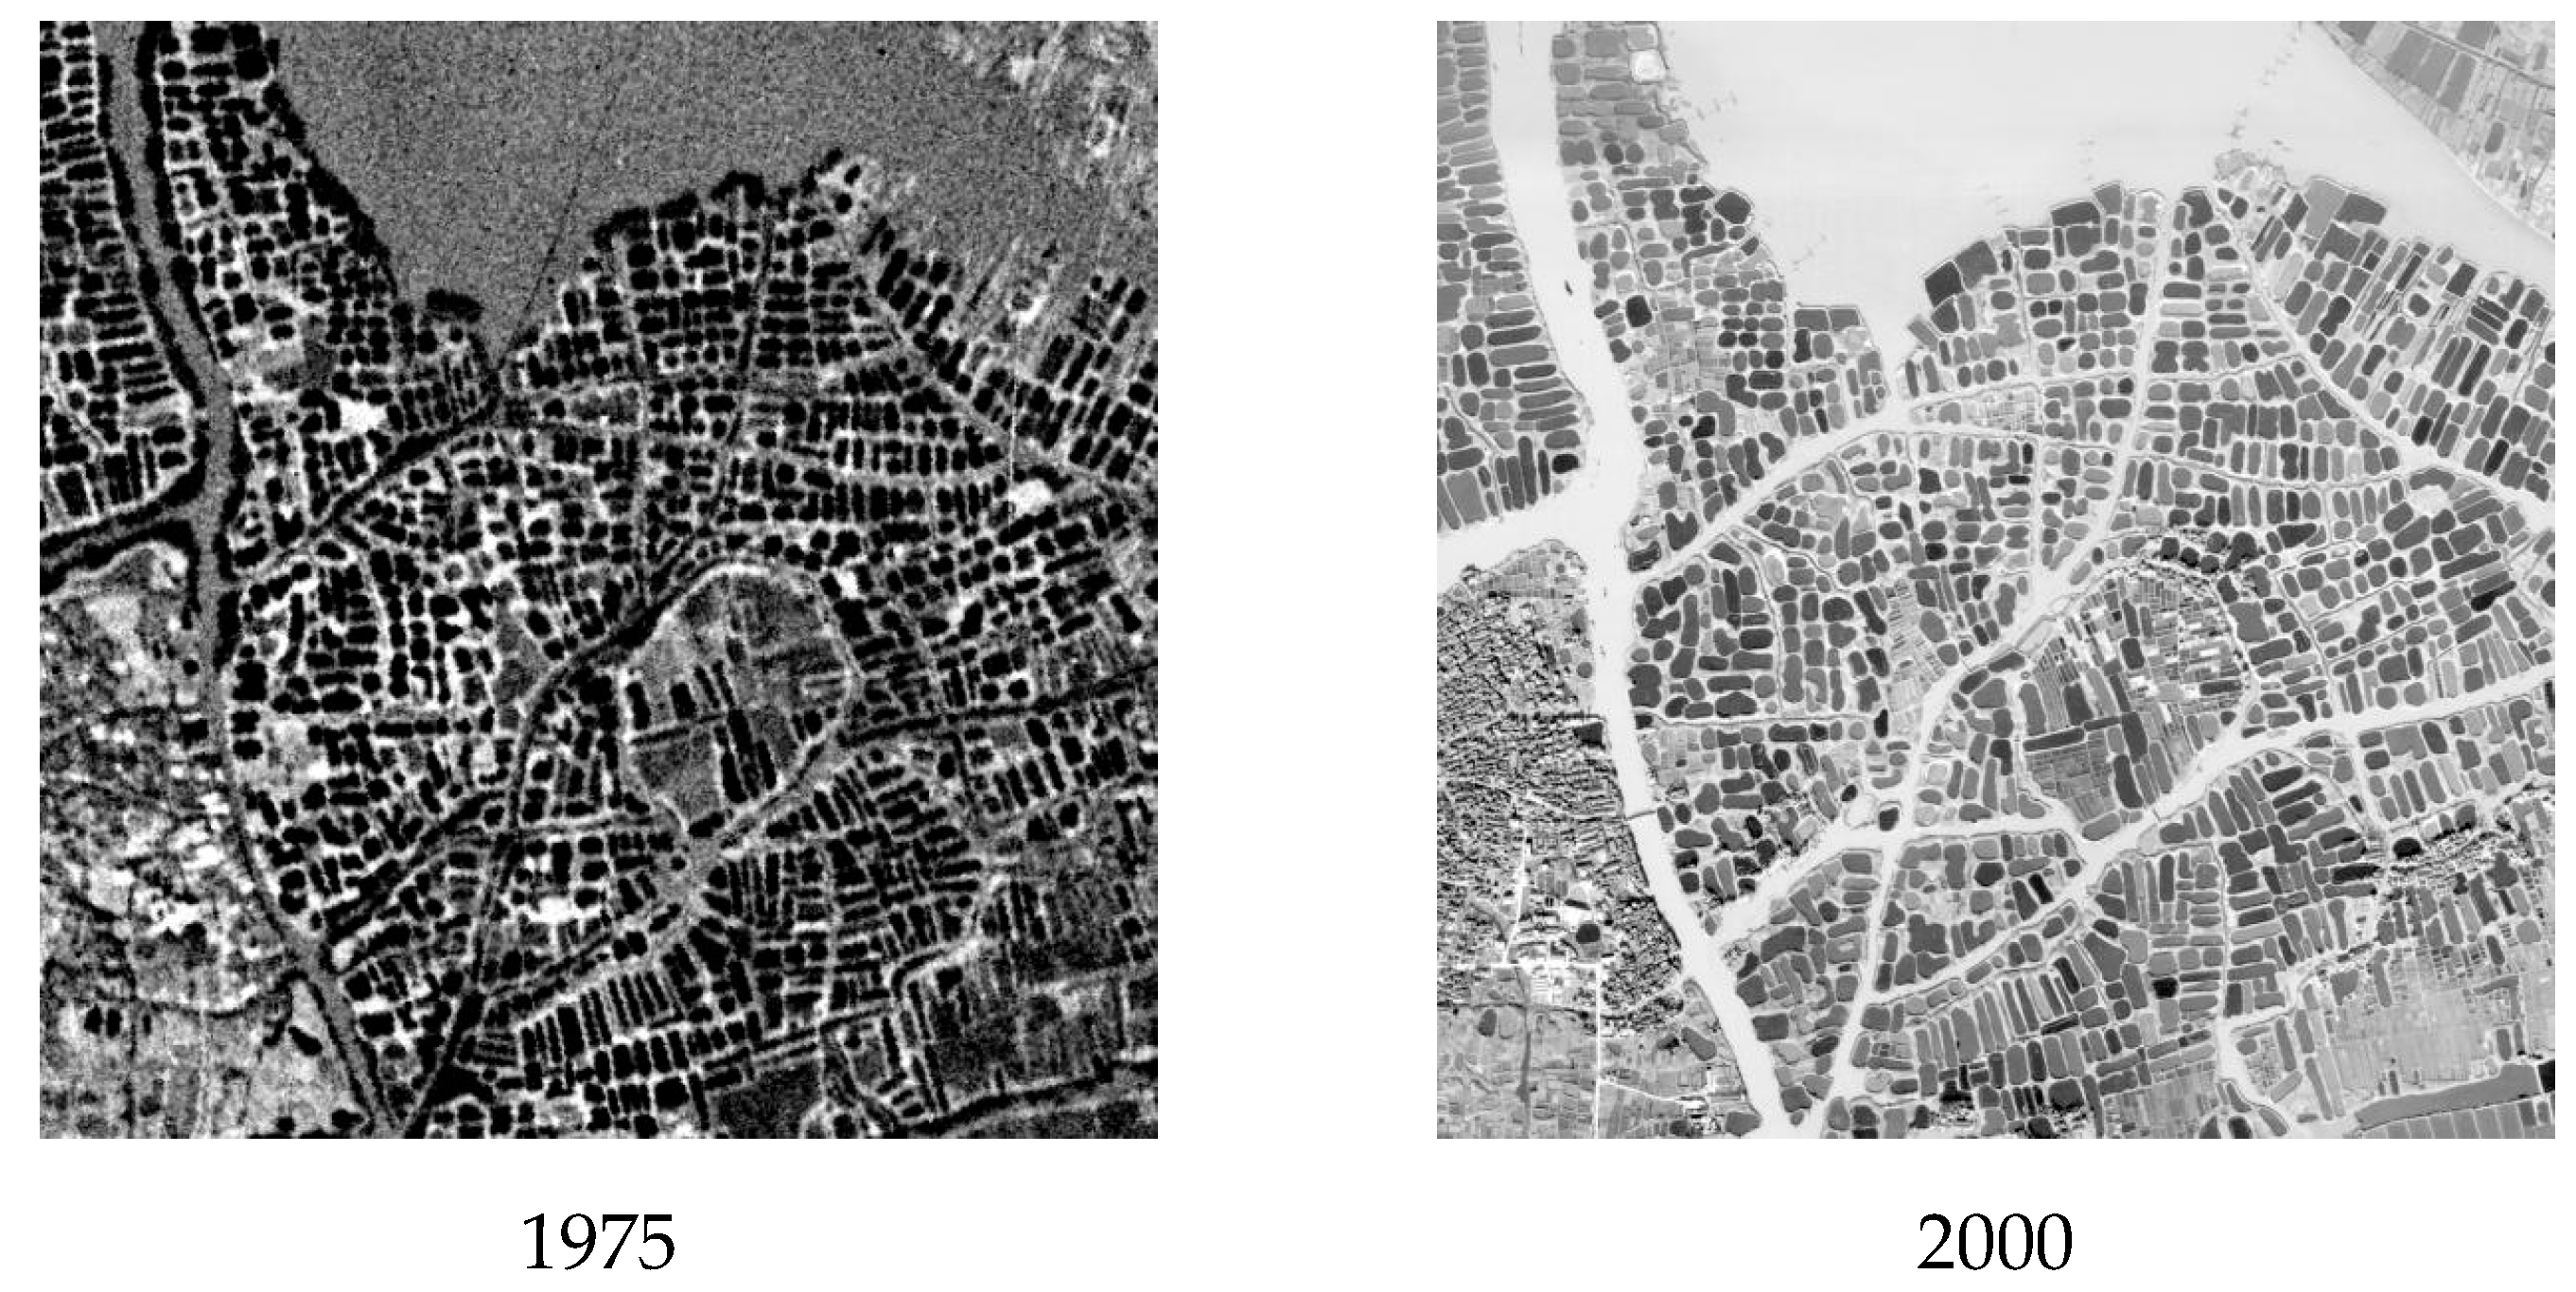
4.1. Landscape Changes of Mulberry Dykes and Fish Ponds

In general, the area of mulberry fields and paddy fields decreased significantly, while the area of fish ponds and construction land increased significantly, mainly due to the conversion of mulberry fields and paddy fields to fish ponds and construction land (Figure 5). From 1975 to 2019, fish ponds increased significantly (Table 6), and the area of fish ponds in 2019 increased by 11,314 hm2 compared with that in 1975, becoming the largest dominant land type in Nanxun District in 2019. The mulberry fields decreased significantly, and the area of mulberry fields in 2019 decreased by 7228 hm2 compared with that in 1975. The paddy fields decreased significantly, and the area of paddy fields in 2019 decreased by 20,111 hm2 compared with that in 1975, which was the most significant change in the land type. The rate of in the three land types increased significantly from 2000 to 2019. The construction land increased significantly, and the area of construction land in 2019 increased by 12,757 hm2 compared with that in 1975.
According to the changes in the structure of land use types in Nanxun District, the dominant land types in 1975 were paddy fields (50.3%), mulberry fields (22.9%), and unutilized land (12.3%). In 2000, they became paddy fields (42.2%), mulberry fields (19.8%), and construction land (12.3%). In 2019, however, there were significant changes to the land use types: fish ponds (23.9%), construction land (23.4%), and paddy fields (21.6%) (Table 6). The scale of mulberry dyke and fish ponds was significantly reduced, the proportion of dyke–pond was seriously unbalanced, and the fish ponds were gradually separated from the mulberry-dyke and fish-pond system and existed independently, rapidly expanding on a large scale. The relatively complete mulberry-dyke and fish-pond system is mainly concentrated in the west of Nanxun District. The expansion of fish ponds was mainly due to the transformation of paddy fields. In 1975, rice cultivation was the main agricultural production system in Nanxun District, but in 2019, its scale was reduced by nearly 30%. Fish-pond culture has gradually become the main agricultural production system in Nanxun District.
Major changes also occurred in mulberry fields, fish ponds, and paddy fields in each town. From 1975 to 2019, the area of fish ponds in each town increased significantly (Table 7), and the proportion increased significantly. In 2019, the proportion of fish ponds in Hefu Town, Linghu Town, and Qianjin Town was higher than 60%. The area of mulberry fields in each town continued to decrease, and the proportion decreased except for Nanxun Town, and the reduction was most obvious in Hefu Town and Linghu Town. The area of paddy fields in each town decreased significantly, and the proportion also decreased significantly. In 2019, the proportion of paddy fields in Hefu Town and Linghu Town was less than 20%. The scale of fish ponds in Hefu Town and Linghu Town was the largest, and the dyke–pond ratio was between 6:4 and 4:6, which was close to the ratio of traditional mulberry dyke and fish ponds. The structure of fish ponds and mulberry fields is also the most primitive traditional structure of mulberry dyke and fish ponds (Figure 6), that is, the mulberry field is adjacent to the fish pond and embedded in the water network and fish ponds. It shows that this area is the birthplace and gathering area of mulberry dykes and fish ponds in Nanxun District. However, due to the industrialization and large-scale development of fish ponds from 2000 to 2019, the structure of traditional mulberry dykes and fish ponds has been damaged to a certain extent and cannot be completely preserved.

4.2. Evaluation of Environmental Carrying Capacity of Fishpond Culture

According to the analysis of the environmental carrying capacity of fish-pond culture, except Lianshi Town, which is the potential area, and Shanlian Town, which is the balance area, all other towns are overloaded areas, among which Qianjin Town is the most overloaded, with an environmental load factor above 4.5 (Table 8). It shows that the overall scale of fish-pond culture in the study area is too large, which is easy to cause non-point source pollution of nitrogen and phosphorus, and it is necessary to regulate the scale of planting and breeding in the overloaded area.

4.3. Scenario Simulation of Mulberry Dyke and Fish Ponds in 2035

The FLUS model was used to simulate the land use of Nanxun District in 2035 (Figure 7), and the overlay analysis with the current land use status in 2019 was used to obtain the changes in fish ponds, mulberry fields, and paddy fields (Figure 8). The construction land in each district increased significantly and expanded outward. For the display area (Hefu Town, Linghu Town), the reduction in fish ponds and the increase in mulberry fields in the Mulberry-dyke and Fish-pond protected area were significantly greater than those in the exhibition area outside the protected area, and the restored mulberry fields and fish ponds were distributed in a traditional mosaic pattern, so as to restore the proportion structure of the traditional mulberry dykes and fish ponds to the greatest extent. For the industrial development area, only the fish ponds in the potential area (Lianshi town) increased, and the fish ponds in both the balance area and the overload area decreased. Among them, the potential area used mulberry fields as the source of fish pond expansion, and the mulberry fields had the largest reduction. The priority was to transform the mulberry fields next to the fish ponds, which is conducive to the large-scale fish-pond culture. The balance area (Shanlian Town) needs to maintain the current ratio, and the overall scale of the three land types was reduced, so that the three land types could be appropriately reduced by the same rate. The decline rate of fish ponds in the overloaded area was more than 19%, the decrease rate of mulberry fields was roughly 7%, and the paddy fields increased except for Shuanglin Town, and the increased paddy fields were concentrated and contiguous with the original paddy fields. Among them, due to severe overloading in Qianjin Town, the paddy fields had the largest growth rate of 157%.

5. Discussion

5.1. Is the Landscape of Huzhou Mulberry Dyke and Fish Ponds Shrinking? Why?

The study results show that the overall scale of mulberry dykes and fish ponds in Nanxun District, Huzhou, decreased significantly from 1975 to 2019. This result is similar to the evolution characteristics of the dyke–pond system in the Pearl River Delta [19]. To explore the reasons, the economic benefits are the key to stimulating productive development and structural change. From the economic benefits of silkworm cocoon culture, fishpond culture, and rice planting (Figure 9), it can be known that rice (japonica rice) planting has the lowest economic benefits, the economic benefits of silkworm cocoon farming have been lower than fish-pond (freshwater fish) farming in the past five years, and the economic benefits of silkworm cocoon farming have fluctuated violently and irregularly with high production risks, while the economic benefits of freshwater fish farming are relatively stable and have been increasing in recent years [39,40,41].
The main reason for the change in mulberry-dyke and fish-pond system is that farmers gradually abandon silkworm cocoon farming with low and unstable economic benefits and devote themselves to intensive fish-pond culture with gradually increasing economic benefits [42], which leads to the rapid shrinking of mulberry fields. Fish ponds are gradually separated from the mulberry-dyke and fish-pond system to exist independently and expand on a large scale. Judging from the evaluation results of the environment carrying capacity of fish-pond culture (4.2), the current large-scale expansion of fish ponds has split the internal connection of the mulberry-dyke and fish-pond system, broken the cycle of nutrients in the planting industry and aquaculture industry, and caused excessive use of chemical fertilizers and feeds and loss of organic fertilizers. All these have caused insufficient utilization of agricultural resources, resulting in double pressure on resources and the environment.

5.2. Can Mulberry-Dyke and Fish-Pond System Adapt to the Modern Agricultural Development Model?

As a model of circular agriculture and ecological agriculture, mulberry-dyke and fish-pond systems have the advantages of self-sufficiency, recycling, and “zero” pollution, and can provide feasible ideas for the combination of regional planting and breeding. Previous studies have analyzed the ecological benefits of the three major agricultural production systems of mulberry-dyke and fish-pond system, fish-pond culture, and rice planting [32,33], and mulberry-dyke fish-pond systems are more sustainable, rice planting has relatively higher resource utilization efficiency, while fish-pond culture is easier to cause environmental pressure. Combined with the results of the unbalanced proportion of mulberry-dyke and fish-pond systems and the serious shrinkage of paddy fields in this study, the spatial changes of mulberry-dyke and fish-pond systems in the study area are the result of the market economy. Although the production function of mulberry-dyke and fish-pond system is gradually weakening, its ecological value and social value as an agricultural heritage cannot be ignored. From the perspective of comprehensive economic, ecological, and social values, mulberry-dyke and fish-pond systems are in line with sustainable development goals. With the popularization of the concept of large grains [43,44,45,46] and people’s reflections on the intensification of agricultural systems [47,48,49,50], the comprehensive value of mulberry-dyke and fish-pond systems can become a new driving force for the regional economy.
The developmental direction of modern agriculture is not only intensive and efficient but also ecological. However, the area of pond farming is 2604.63 thousand hectares, accounting for 52.3% of the total freshwater farming area in China [51]. The total nitrogen and phosphorus pollutant emissions from aquaculture account for 7.0% and 7.6% of the total nitrogen and phosphorus pollutant emissions from agricultural sources, respectively [52]. It can be seen that nitrogen and phosphorus pollutant emissions from fish-pond culture have become one of the important sources of agricultural non-point source pollution in China. Therefore, the waste recycling principle of mulberry-dyke and fish-pond system can be used to solve the pollution of fish-pond culture by combining planting and breeding. At present, the research on planting and breeding balance is more concerned with the balance between livestock and poultry breeding and planting. But for the ecological development of modern agriculture in Nanxun District, what needs attention is the relationship between fish-pond culture and planting. Therefore, based on the evaluation principle and method of the environmental carrying capacity of livestock and poultry, this study proposed the environmental carrying capacity of fish-pond culture, calculated the environmental carrying load coefficient of fish-pond culture of each town in the study area, and evaluated the current situation of the planting and breeding ratio. The results showed that the overall fish-pond culture in Nanxun District was too large, and the current mulberry fields and paddy fields could not digest the nitrogen and phosphorus non-point source pollution produced by fish-pond culture, which would have a big negative impact on the local ecological environment. Therefore, the evaluation of the environmental carrying capacity of fish-pond culture is the basis of spatial optimization, which is helpful to realize the agricultural sustainable development of Nanxun District.

5.3. How Can Mulberry-Dyke and Fish-Pond Systems Be Developed to Maximize Their Value?

Agricultural heritage is a typical social–economic–environmental complex system, reflecting the comprehensive function of nature and culture [15]. This study fully recognizes the complex nature of the agricultural heritage of the mulberry-dyke and fish-pond system. Considering the economic, cultural, and ecological benefits, a zoning optimization plan is proposed for the development of the agricultural heritage of mulberry-dyke and fish-pond systems in the future. The plan sets a relatively intact small part of the area as a display area and chooses the traditional mulberry-dyke and fish-pond system for the spatial layout to develop the agritourism industry, giving play to the cultural and social value of the mulberry-dyke and fish-pond system. The rest of the area is set as an industrial development zone. The proportion of planting and breeding is adjusted based on the environmental carrying capacity of the fishpond culture, and the economic value of mulberry-dyke and fish-pond systems is made full use of under the premise of environmental protection.
There is a limitation in the research. We found that economic benefits are the most important and direct influencing factors for farmers to choose production modes. Zoning optimization needs to reduce over-expanded fish ponds and restore mulberry-dyke and fish-pond systems, a production mode that is gradually abandoned by farmers. If the wishes of local farmers are ignored, it may cause resistance to the implementation of future optimization schemes. Therefore, farmers’ wishes should be taken into consideration in the formulation of schemes in follow-up research. At the same time, when implementing the plan, we can consider more of the profit of local farmers. For example, the scenario simulation suggests that the area of paddy fields will increase after optimization. According to the 14th Five-Year Plan for Agricultural and Rural Modernization in Nanxun District, we can implement the modes of rice–shrimp rotation and rice–fish farming to make up for the economic loss caused by the reduction in fish ponds.

5.4. What Further Development Has Been Made in This Study?

This study made an analysis of spatial changes in the mulberry-dyke and fish-pond system in Nanxun District in 1975, 2000, and 2019. The results showed that the mulberry-dyke and fish-pond system decreased obviously, which is consistent with the results obtained by previous studies on the evolution rule of the Pearl River Delta dyke–pond system [53,54]. Compared to the studies in the Pearl River Delta dyke–pond system, the system in our study was further divided into the mulberry field and fish pond, and the internal evolution rule of the mulberry-dyke and fish-pond system was analyzed more specifically.
With the development of intensive agriculture, the production value of the material parts of agricultural heritage is gradually weakened, while the cultural value of the immaterial parts is constantly emerging through the way of agritouristic development and becomes an effective way to protect the heritage [55]. Through a detailed introduction of the current management forms of the globally important agricultural heritage systems in East Asia, Kajihara et al. analyzed the key cultural issues of heritages and put forward the development prospects [56]. Most studies proposed suggestions on the development of agricultural heritage qualitatively, unable to provide a spatial layout of the heritage site [57,58,59]. This study proposed a spatial optimization scheme for the heritage site and converted it into specific model parameters in the simulation process, so as to demonstrate the superiority of the scheme in the form of scenario maps.

6. Conclusions

This study found that from 1975 to 2019, the change in mulberry-dyke and fish-pond systems in Nanxun District, Huzhou was concentrated among the four land types of fish ponds, mulberry fields, paddy fields, and construction land, and the transformation happened mainly from mulberry fields and paddy fields to fish ponds and construction land. The scale of mulberry-dyke and fish-pond systems was significantly reduced, the proportion of dyke–pond was seriously unbalanced, and the fish ponds gradually separated from the mulberry-dyke and fish-pond system and existed independently. In the simulation, the mulberry-dyke and fish-pond landscape is divided into the display area and the industrial development area. The display area is the birthplace and gathering area of mulberry-dyke and fish-pond systems, and the dyke–pond ratio is mainly adjusted by inheriting the traditional production method. Therefore, the optimization direction is to restore the structure of traditional mulberry-dyke and fish-pond systems to the greatest extent on the basis of taking into account economic benefits. The environmental carrying capacity of the fish-pond culture in the industrial development area is spatially specific. There is only one potential area and one balance area, and the rest of the towns are overloaded areas. On the premise of “balancing planting and breeding”, the economic benefits of agriculture can be maximized. The optimization direction is to increase the scale of fish ponds in the potential area, maintain the current ratio in the balance area, and greatly reduce the scale of fish ponds in the overloaded area and transform them into paddy fields. This study analyzes the spatial characteristics of mulberry-dyke and fish-pond systems in a long-term sequence at the landscape scale and simulates the spatial layout of mulberry-dyke and fish-pond systems in 2035 from the perspectives of economy, culture, and environment. It provides references for repositioning the development direction of the agricultural heritage of mulberry-dyke and fish-pond systems, optimizing agricultural production space, balancing between man and environment, and promoting regional sustainable development.

Author Contributions

Conceptualization, R.Z., L.H. and K.W.; methodology, R.Z., L.H. and K.W.; software, R.Z. and L.H.; validation, R.Z., L.H., K.W. and W.H.; formal analysis, R.Z. and L.H.; investigation, R.Z. and L.H.; resources, R.Z., L.H. and K.W.; data curation, R.Z.; writing—original draft preparation, R.Z. and L.H.; writing—review and editing, R.Z., L.H., K.W. and W.H.; visualization, R.Z.; supervision, R.Z., L.H., K.W. and W.H.; project administration, R.Z., L.H. and K.W.; funding acquisition, L.H. and K.W. All authors have read and agreed to the published version of the manuscript.

Funding

This research was funded by the National Natural Science Foundation of China, grant number 41971236.

Data Availability Statement

Data sharing is not applicable to this article.

Conflicts of Interest

The authors declare no conflict of interest.

References

  1. Zhao, F.; Zhu, C.; Zhang, J.; Luo, S.; Feng, Y.; Xiang, H.; Jiang, Y.; Lu, X.; Tian, Y. Is land expropriation to keep agricultural use an effective strategy for the conservation of an urban agricultural heritage system? Evidence from China. Land 2023, 12, 363. [Google Scholar] [CrossRef]
  2. Xu, S.; Wang, R.; Gasser, T.; Ciais, P.; Peñuelas, J.; Balkanski, Y.; Boucher, O.; Janssens, I.A.; Sardans, J.; Clark, J.H.; et al. Delayed use of bioenergy crops might threaten climate and food security. Nature 2022, 609, 299–306. [Google Scholar] [CrossRef] [PubMed]
  3. Yan, M.; Zhao, J.; Qiao, J.; Han, D.; Zhu, Q.; Yang, Y.; Liu, Q.; Wang, Z. Spatial pattern evolution and influencing factors on agricultural non-point source pollution in small town areas under the background of rapid Industrialization. Int. J. Environ. Res. Public Health 2023, 20, 2667. [Google Scholar] [CrossRef] [PubMed]
  4. García-Martín, M.; Huntsinger, L.; Ibarrola-Rivas, M.J.; Penker, M.; D’Ambrosio, U.; Dimopoulos, T.; Fernández-Giménez, M.E.; Kizos, T.; Muñoz-Rojas, J.; Saito, O.; et al. Landscape products for sustainable agricultural landscapes. Nat. Food 2022, 3, 814–821. [Google Scholar] [CrossRef]
  5. MacLaren, C.; Mead, A.; Balen, D.V.; Claessens, L.; Etana, A.; Haan, J.D.; Haagsma, W.; Jäck, O.; Keller, T.; Labuschagne, J.; et al. Long-term evidence for ecological intensification as a pathway to sustainable agriculture. Nat. Sustain. 2022, 5, 770–779. [Google Scholar] [CrossRef]
  6. Wittwer, R.A.; Bender, S.F.; Hartman, K.; Hydbom, S.; Lima, R.A.A.; Loaiza, V.; Nemecek, T.; Oehl, F.; Olsson, P.A.; Petchey, O.; et al. Organic and conservation agriculture promote ecosystem multifunctionality. Sci. Adv. 2021, 7, eabg6995. [Google Scholar] [CrossRef]
  7. Xie, J.; Hu, L.; Tang, J.; Wu, X.; Li, N.; Yuan, Y.; Yang, H.; Zhang, J.; Luo, S.; Chen, X. Ecological mechanisms underlying the sustainability of the agricultural heritage rice–fish coculture system. Proc. Natl. Acad. Sci. USA 2011, 108, E1381–E1387. [Google Scholar] [CrossRef]
  8. Qiu, Z.; Chen, B.; Takemoto, K. Conservation of terraced paddy fields engaged with multiple stakeholders: The case of the Noto GIAHS site in Japan. Paddy Water Environ. 2014, 12, 275–283. [Google Scholar] [CrossRef]
  9. FAO. Globally Important Agricultural Heritage Systems. Available online: https://www.fao.org/giahs/giahsaroundtheworld/en/ (accessed on 1 January 2023).
  10. Zhang, R.; Jiang, G.; Zhang, Q. Does urbanization always lead to rural hollowing? Assessing the spatio-temporal variations in this relationship at the county level in China 2000–2015. J. Clean. Prod. 2019, 220, 9–22. [Google Scholar] [CrossRef]
  11. Jiang, Y.; Hu, B. The Opportunities and Dilemmas of the Transformation of Traditional Agricultural Towns into Modernized Agriculture—Based on the Experience of Shilong Town. In Proceedings of the 1st International Symposium on Innovative Management and Economics (ISIME 2021), Moscow, Russia, 2–3 June 2021. [Google Scholar]
  12. Aimar, F.; Jigyasu, R. Cultural landscapes of the Asia-Pacific Region. In The Routledge Handbook of Cultural Landscape Heritage in the Asia-Pacific, 1st ed.; Silva, K.D., Taylor, K., Jones, D.S., Eds.; Routledge: London, UK, 2022; pp. 416–417. [Google Scholar]
  13. Sun, Y.; Jansen-Verbeke, M.; Min, Q.; Cheng, S. Tourism potential of agricultural heritage systems. Tour. Geogr. 2011, 13, 112–128. [Google Scholar] [CrossRef]
  14. Ye, M. Zhejiang Huzhou Mulberry(Morus sp.)-Dyke & Fish-Pond System; China Agricultural Press: Beijing, China, 2017. [Google Scholar]
  15. FAO. Huzhou Mulberry-dyke & Fish-Pond System, China. Available online: https://www.fao.org/giahs/giahsaroundtheworld/designated-sites/asia-and-the-pacific/huzhou-mulberry/en/ (accessed on 1 January 2017).
  16. Zhong, G.; Wang, Z.; Wu, H. Water-Land Interaction in the Mulberry-Dyke Pond System; Science Press: Beijing, China, 1993. [Google Scholar]
  17. Gu, X.; Wang, Y.; Shi, K.; Ke, F.; Ying, S.; Lai, Q. Emergy-based sustainability evaluation of the Mulberry-Dyke and Fish-Pond System on the south bank of Taihu Lake, China. Sustainability 2022, 14, 10463. [Google Scholar] [CrossRef]
  18. Wang, C.; Huang, S.; Wang, J. Spatio-temporal dynamic evolution and simulation of dike-pond landscape and ecosystem service value based on MCE-CA-Markov: A case study of Shunde, Foshan. Forests 2022, 13, 1241. [Google Scholar] [CrossRef]
  19. Liu, J.; Chen, J.; Wang, X. Spatial-temporal change of Sanshui district’s dike-pond from 1979–2009. Phys. Procedia 2012, 25, 452–458. [Google Scholar] [CrossRef]
  20. Ma, Y.; Zhou, Z.; She, X.; Zhou, L.; Ren, T.; Liu, S.; Lu, J. Identifying dike-pond system using an improved cascade R-CNN model and high-resolution satellite images. Remote Sens. 2022, 14, 717. [Google Scholar] [CrossRef]
  21. Zhang, W.; Cheng, Z.; Qiu, J.; Park, E.; Ran, L.; Xie, X.; Yang, X. Spatiotemporal changes in Mulberry-Dyke-Fish Ponds in the Guangdong-Hong Kong-Macao Greater Bay Area over the past 40 years. Water 2021, 13, 2953. [Google Scholar] [CrossRef]
  22. Santoro, A.; Yu, Q.; Piras, F.; Fiore, B.; Bazzurro, A.; Agnoletti, M. From flood control system to agroforestry heritage system: Past, present and future of the Mulberry-Dykes and Fishponds System of Huzhou City, China. Land 2022, 11, 1920. [Google Scholar] [CrossRef]
  23. The People’s Government of Nanxun District, Huzhou City, P.R. China. Climate Profile. Available online: http://www.nanxun.gov.cn/art/2013/8/14/art_1229211047_55602052.html (accessed on 14 August 2013).
  24. Huzhou Bureau of Ststistics. Huzhou Statistical Yearbook. 2020. Available online: http://tjj.huzhou.gov.cn/art/2020/10/23/art_1229208257_58869543.html (accessed on 23 October 2020).
  25. Wu, H.; Jin, Q.; Yin, Y.; Wang, L.; Ye, M. Overview of the causes and characteristics of Mulberry-dyke and Fish-pond System in Huzhou of Zhejiang. Sci. Seric. 2018, 44, 947–951. [Google Scholar]
  26. Ding, N.; Jin, R.; Zhang, J.; Li, J.; Zhu, X.; Li, W.; Dong, K.; Wang, L. “Mulberry-Base-Fishpond” system of Linghu and the protection and utilization of the agricultural culture heritage. Bull. Seric. 2015, 46, 5–8. [Google Scholar]
  27. Zeng, Y. Study of Nutrient Characteristic of Mulberry and Balanced Fertilization Effect. Master’s Thesis, Guangxi University, Nanning, China, 2007. [Google Scholar]
  28. Li, L.; Xu, Y.; Su, B.; Qiao, F.; Lei, K.; He, J. Accounting methods and comparative analysis of pollution load from an aquaculture pond. J. Agro Environ. Sci. 2019, 38, 2174–2183. [Google Scholar]
  29. The People’s Government of Nanxun District, Huzhou City, P.R. China. Huzhou Mulberry-Dyke & Fish-Pond System Protection and Development Planning; The People’s Government of Nanxun District: Huzhou, China, 2017.
  30. Li, J.; Zhang, Z.; Mao, X.; Zhang, R. Evaluation and suggestions about China agricultural layout based on resources and ecological load. Issues Agric. Econ. 2016, 37, 26–33+110. [Google Scholar]
  31. Liu, X.; Liang, X.; Li, X.; Xu, X.; Ou, J.; Chen, Y.; Li, S.; Wang, S.; Pei, F. A future land use simulation model (FLUS) for simulating multiple land use scenarios by coupling human and natural effects. Landsc. Urban Plan. 2017, 168, 94–116. [Google Scholar] [CrossRef]
  32. Cheng, H.; Chen, C.; Wu, S.; Mirza, Z.A.; Liu, Z. Emergy evaluation of cropping, poultry rearing, and fish raising systems in the drawdown zone of Three Gorges Reservoir of China. J. Clean. Prod. 2016, 144, 559–571. [Google Scholar] [CrossRef]
  33. Liu, S.; Min, Q.; Jiao, W.; Liu, C.; Yin, J. Integrated emergy and economic evaluation of Huzhou Mulberry-Dyke and Fish-Pond Systems. Sustainability 2018, 10, 3860. [Google Scholar] [CrossRef]
  34. Qiu, L.; Long, W.; Fang, H.; Hu, W. Regional environmental carrying capacity for livestock and poultry breeding based on planting-breeding balance in Hangzhou City. J. Nat. Resour. 2016, 31, 1410–1419. [Google Scholar]
  35. Li, H.; Chen, H.; Wu, M.; Zhou, K.; Zhang, X.; Liu, Z. A dynamic evaluation method of urban ecological networks combining graphab and the FLUS model. Land 2022, 11, 2297. [Google Scholar] [CrossRef]
  36. Li, Y.; Liu, Z.; Li, S.; Li, X. Multi-scenario simulation analysis of land use and carbon storage changes in Changchun City based on FLUS and InVEST model. Land 2022, 11, 647. [Google Scholar] [CrossRef]
  37. Wu, X.; Liu, X.; Liang, X.; Chen, G. Multi-scenarios simulation of urban growth boundaries in Pearl River Delta based on FLUS-UGB. J. Geo Inf. Sci. 2018, 20, 532–542. [Google Scholar]
  38. Wang, B.; Liao, J.; Zhu, W.; Qiu, Q.; Wang, L.; Tang, L. The weight of neighborhood setting of the FLUS model based on a historical scenario: A case study of land use simulation of urban agglomeration of the Golden Triangle of Southern Fujian in 2030. Acta Ecol. Sin. 2019, 39, 4284–4298. [Google Scholar]
  39. Department of Price, National Development and Reform Commission. Compilation of Cost-Benefit Data of National Agricultural Products; China Statistics Press: Beijing, China, 1982–2020.
  40. Department of Rural Socioeconomic Survey, National Bureau of Ststistics. China Agricultural Product Price Survey Yearbook; China Statistics Press: Beijing, China, 1986–2020.
  41. Ministry of Agriculture and Rural Affairs Fishery and Fishery Administration; National Aquaculture Technology Extension Center; Chinese Fisheries Society. China Fishery Statistical Yearbook; China Agricultural Press: Beijing, China, 1999–2020. [Google Scholar]
  42. Gu, X.; Liu, M.; Min, Q. The origin and evolution of the mulberry-dyke & fish-pond by the south bank of the Tai Lake. J. Silk 2018, 55, 97–104. [Google Scholar]
  43. Andrianarimanana, M.H.; Yongjian, P.; Tanteliniaina, M.F.R. Assessment of the importance of climate, land, and soil on the global supply for agricultural products and global food security: Evidence from Madagascar. Food Policy 2023, 115, 102403. [Google Scholar] [CrossRef]
  44. Bryan, E.; Ringler, C.; Lefore, N. To ease the world food crisis, focus resources on women and girls. Nature 2022, 609, 28–31. [Google Scholar] [CrossRef] [PubMed]
  45. Nleya, T.; Clay, S.A. Near-term problems in meeting world food demands at regional levels: A special issue overview. Agron. J. 2021, 113, 4437–4443. [Google Scholar] [CrossRef]
  46. Caron, P.; Loma-Osorio, G.F.d.; Ferroni, M.; Lehmann, B.; Mettenleiter, T.C.; Sokona, Y. Global food security: Pool collective intelligence. Nature 2022, 612, 631. [Google Scholar] [CrossRef]
  47. Mhadhbi, F.; Napoléone, C. Does agricultural intensification enhance rural wellbeing? A structural model assessment at the sub-communal level: A case study in Tunisia. Sustainability 2022, 14, 16054. [Google Scholar] [CrossRef]
  48. Olivier, T.; Thébault, E.; Elias, M.; Fontaine, B.; Fontaine, C. Urbanization and agricultural intensification destabilize animal communities differently than diversity loss. Nat. Commun. 2020, 11, 2686. [Google Scholar] [CrossRef]
  49. Ray, A. The darker side of agricultural intensification—Disappearance of autumn or aus rice, entry of HYVs, and implications in terms of environmental sustainability in a ‘Green Revolution’ state of eastern India. World Dev. Sustain. 2022, 1, 100028. [Google Scholar] [CrossRef]
  50. Xu, L.; Jiang, J.; Lu, M.; Du, J. Spatial-temporal evolution characteristics of agricultural intensive management and its influence on agricultural non-point source pollution in China. Sustainability 2022, 15, 371. [Google Scholar] [CrossRef]
  51. Ministry of Agriculture and Rural Affairs Fishery and Fishery Administration; National Aquaculture Technology Extension Center; Chinese Fisheries Society. China Fishery Statistical Yearbook; China Agricultural Press: Beijing, China, 2022. [Google Scholar]
  52. Ministry of Ecology and Environment of the People’s Republic of China; National Bureau of Statistics; Minisrey of agriculture and Rural Affairs of the People’s Republic of China. Bulletin of the Second National Pollution Sources Survey. 2020. Available online: http://www.gov.cn/xinwen/2020-06/10/content_5518391.htm (accessed on 8 June 2020).
  53. Lin, M.; Feng, R.; Ji, S. Analysis on mode change and landscape pattern of the dike-pond agriculture in Zhongshan. Guangdong Agric. Sci. 2014, 41, 184–189+197+237. [Google Scholar]
  54. Liu, K.; Wang, S.; Xie, L.; Zhuang, J. Spatial evolution analysis of dike-pond systems in Foshan City. Trop. Geogr. 2008, 28, 513–517. [Google Scholar]
  55. Min, Q.; Sun, Y.; Cheng, S.; Wang, X. Primary study on the features and development of GIAHS’s tourism resources. Econ. Geogr. 2007, 27, 856–859. [Google Scholar]
  56. Kajihara, H.; Zhang, S.; You, W.; Min, Q. Concerns and opportunities around cultural heritage in East Asian Globally Important Agricultural Heritage Systems (GIAHS). Sustainability 2018, 10, 1235. [Google Scholar] [CrossRef]
  57. Zhang, Y.; Li, X. Protecting traditional agricultural landscapes by promoting industrial integration development: Practices from Important Agricultural Heritage Systems (IAHS) sites in China. Land 2022, 11, 1286. [Google Scholar] [CrossRef]
  58. Zhang, Y.; Guan, C.; Li, Z.; Luo, J.; Ren, B.; Chen, C.; Xu, Y.; Ding, J.; Huang, H. Review of Rice–Fish–Duck Symbiosis System in China—One of the Globally Important Ingenious Agricultural Heritage Systems (GIAHS). Sustainability 2023, 15, 1910. [Google Scholar] [CrossRef]
  59. Fuller, A.M.; Bao, J.; Liu, Y.; Zhou, X. Establishing tourism sustainability in a globally important agricultural heritage system in China: A case of social and eco-system recovery. Growth Chang. 2022, 53, 1267–1281. [Google Scholar] [CrossRef]
Figure 1. The Mulberry-dyke and Fish-pond System: (a) A remote sensing image of Mulberry-dyke and Fish-pond System in Huzhou (2019). Source: authors; (b) A picture of Mulberry-dyke and Fish-pond System in Huzhou. Source: authors.
Land 12 01066 g001
Figure 2. Location map of the study area. Authors’ elaboration.
Land 12 01066 g002
Figure 3. Research framework. Authors’ elaboration.
Land 12 01066 g003
Figure 4. Zoning setting of the research areas. Authors’ elaboration.
Land 12 01066 g004
Figure 5. Land use change in Nanxun District from 1975 to 2019. Authors’ elaboration.
Land 12 01066 g005
Figure 6. Morphology changes of Mulberry-Dike and Fish-Pond in Linghu Town from 1975 to 2019. Source: authors.
Land 12 01066 g006aLand 12 01066 g006b
Figure 7. Spatial distributions of land use simulations of Nanxun District in 2035. Authors’ elaboration.
Land 12 01066 g007
Figure 8. Transfer maps of fish ponds, mulberry fields, and paddy fields of Nanxun District from 2019 to 2035. Authors’ elaboration.
Land 12 01066 g008
Figure 9. Changes in economic benefits of different agricultural production systems: (a) Silkworm cocoon breeding; (b) Freshwater fish farming; (c) Japonica rice planting.
Land 12 01066 g009
Table 1. Optimization proportion of fish pond, mulberry field, and paddy field in different towns of industrial development area/%. Authors’ elaboration.
TownFish PondMulberry FieldPaddy Field
Lianshi Town21.9921.3056.70
Shanlian Town20.1018.4861.42
Shuanglin Town22.8825.1351.99
Jiuguan Town21.9421.0956.97
Nanxun Town23.5127.8448.65
Shicong Town21.2718.1760.57
Qianjin Town20.9616.8562.19
Table 2. Driving factors of land use change. Authors’ elaboration.
Types of Driving FactorsDriving FactorsData Interpretation
Natural factorsElevationElevation of each grid
SlopeSlope of each grid
AspectAspect of each grid
Locational conditionsDistance from highwayThe distance from each grid to the highway
Distance from main roadThe distance of each grid from the main road
Distance from secondary trunk roadThe distance from each grid to the secondary trunk road
Distance from administrative centerThe distance from each grid to the seat of the district and town government
Distance from built-up areaThe distance from each grid to the built-up area
Distance from rural settlementsThe distance from each grid to rural settlement
Distance from water systemThe distance from each grid to water system
Socioeconomic factorsSpatial distribution of populationThe population density of each grid
Spatial distribution of GDPThe GDP level of each grid
Table 3. Number of projected land use grids under zoning optimization scenarios of Nanxun District in 2035. Authors’ elaboration.
Fish PondMulberry FieldPaddy FieldOther Agricultural LandConstruction LandUnutilized Land
Display areaMulberry-dyke and Fish-pond protected area38,25025,9564098200316,85116,834
Exhibition area outside the protected area37,01216,15114,132439226,37215,105
Industrial development areaLianshi town15,55615,06840,11011,14341,39012,926
Shanlian town6173567518,863287313,6115170
Shuanglin town13,68115,02731,088457132,23713,999
Jiuguan town373835939706105411,4615259
Nanxun town14,86517,60330,761883165,06319,391
Shicong town3716317510,581124664243185
Qianjin town5822468117,276215190395348
Table 4. Weights of Neighborhood factors. Authors’ elaboration.
Land Use TypeFish PondMulberry FieldPaddy FieldOther Agricultural LandConstruction LandUnutilized Land
Neighborhood factor10.5200.510.750.56
Table 5. Cost matrix. Authors’ elaboration.
Land Use TypeFish PondMulberry FieldPaddy FieldOther Agricultural LandConstruction LandUnutilized Land
Fish pond111111
Mulberry field111111
Paddy field111111
Other agricultural land111111
Construction land000010
Unutilized land111111
Table 6. Statistics of land use change in Nanxun District from 1975 to 2019. Authors’ elaboration.
Land Use Type197520002019Land-Use Dynamic Index/%
Area/
hm2
Proportion/%Area/
hm2
Proportion/%Area/
hm2
Proportion/%1975–20002000–2019
Fish pond5484.727.88004.1611.416,798.2723.91.845.78
Mulberry field16,047.0022.913,932.9119.88818.6012.6−0.53−1.93
Paddy field35,297.6750.329,650.2942.215,186.9621.6−0.64−2.57
Other agricultural land1096.911.61569.202.24381.196.21.729.43
Construction land3688.115.38639.9712.316,444.4723.45.374.75
Unutilized land8611.6612.38429.5512.08596.5812.2−0.080.10
Table 7. Statistics of fish pond, mulberry field, and paddy field change in different towns of Nanxun District from 1975 to 2019. Authors’ elaboration.
TownLand Use Type197520002019
Area/
hm2
Proportion/%Area/
hm2
Proportion/%Area/
hm2
Proportion/%
Hefu TownFish pond1300.2419.91%1992.3032.57%3303.5661.61%
Mulberry field1896.4929.03%1612.1926.36%1042.1919.44%
Paddy field3335.0451.06%2512.6641.08%1015.9818.95%
Linghu TownFish pond2659.2230.94%3390.8042.20%5818.7577.76%
Mulberry field2680.4631.19%2353.8129.30%922.8812.33%
Paddy field3255.0937.87%2289.9328.50%741.669.91%
Qianjin TownFish pond543.6416.62%684.8122.74%1604.7160.38%
Mulberry field949.0229.01%893.2629.66%447.7816.85%
Paddy field1778.6954.37%1433.5247.60%605.0922.77%
Shicong TownFish pond331.7715.61%380.3119.54%642.9337.84%
Mulberry field562.9026.48%469.7424.13%308.6218.17%
Paddy field1231.2857.92%1096.6256.33%747.4043.99%
Jiuguan TownFish pond39.161.61%133.525.88%449.7626.91%
Mulberry field523.9421.51%488.7921.51%352.5221.09%
Paddy field1873.0576.89%1649.8572.61%869.1852.00%
Shuanglin TownFish pond246.883.08%459.616.36%1526.2426.06%
Mulberry field2246.6628.04%1923.4726.61%1472.2425.13%
Fish pond5517.9568.88%4844.8267.03%2859.1948.81%
Shanlian TownMulberry field75.971.91%184.915.23%607.9820.10%
Paddy field1030.0725.92%831.3023.53%558.9918.48%
Fish pond2867.2672.16%2516.9571.24%1857.9461.42%
Nanxun TownMulberry field187.531.66%616.246.09%1853.3530.31%
Paddy field2553.0122.64%2289.8522.63%1702.3527.84%
Fish pond8535.7875.70%7212.4371.28%2559.0741.85%
Lianshi TownMulberry field100.320.95%161.661.73%990.9914.29%
Paddy field3604.4333.98%3070.5132.93%2011.0429.00%
Fish pond6903.5465.08%6093.5365.34%3931.4456.70%
Table 8. The environmental carrying capacity of fish-pond culture. Authors’ elaboration.
TownN and P Nutrient Content in Sediment
S/kg
Total Nutrient Requirement
D/kg
Environmental Load Factor of Fishpond Culture
q
Evaluation
NPNPNP
Lianshi Town845,941.08276,638.901,522,687.45514,377.770.560.54Potential area
Shanlian Town518,989.01169,719.33557,560.41191,818.000.930.88Balance area
Shuanglin Town1,302,838.69426,053.151,111,403.85375,356.561.171.14Overload area
Jiuguan Town383,930.61125,552.65298,517.15101,657.991.291.24Overload area
Nanxun Town1,582,070.63517,367.341,153,986.62386,341.281.371.34Overload area
Shicong Town548,825.32179,476.37258,965.5688,134.102.122.04Overload area
Qianjin Town1,369,824.48447,958.79291,597.8097,279.014.704.60Overload area
Disclaimer/Publisher’s Note: The statements, opinions and data contained in all publications are solely those of the individual author(s) and contributor(s) and not of MDPI and/or the editor(s). MDPI and/or the editor(s) disclaim responsibility for any injury to people or property resulting from any ideas, methods, instructions or products referred to in the content.

