Article

Analysis of Urban Park Accessibility Based on Space Syntax: Take the Urban Area of Changsha City as an Example

1
School of Geographical Sciences, Hunan Normal University, Changsha 410081, China
2
School of Municipal and Geomatics Engineering, Hunan City University, Yiyang 413000, China
3
School of Information and Electronic Engineering, Hunan City University, Yiyang 413000, China
*
Author to whom correspondence should be addressed.
Land 2023, 12(5), 1061; https://doi.org/10.3390/land12051061
Submission received: 23 February 2023 / Revised: 19 April 2023 / Accepted: 9 May 2023 / Published: 12 May 2023

Abstract

:
Park green space is an important part of the green infrastructure in a city, and urban park space accessibility is an important indicator for measuring the city’s comprehensive strength, living environment, and resident happiness, which greatly affects the sustainable development and construction of the city. The spatial syntax method can discuss the accessibility of urban parks from the perspective of topology, which inherits the objective stability of the topological relationship. There are few research studies on the accessibility of urban parks. Therefore, with the support of space syntax theory and the spatial statistics method, this paper combined the data of park green space and road network to complete the accessibility evaluation of urban parks in the Changsha City urban area. This paper evaluates the accessibility of urban parks in the study area from four aspects, namely global accessibility, perceptual accessibility, local accessibility, and psychological accessibility, by using five quantitative indexes of space syntax, namely connectivity, depth, integration, selection, and synergy. The conclusions are as follows: The spatial layout area of the park is roughly consistent with the areas that have good global and local accessibility of the road network, and the global accessibility and local accessibility of the park in the study area are relatively high. The global spatial structure can be better perceived by the local space at a radius scale greater than or equal to 3000 m, and the perceptual accessibility of the park is high. Most of the urban parks in the Changsha urban area are located in sections with high space efficiency. The park space penetration is good, and nearly 70% of the parks have high psychological accessibility. Based on the overall spatial layout of urban parks, the space syntax method quantitatively and comprehensively evaluates the accessibility of urban parks from the perspective of topology. The conclusion is reliable and has important application value in the evaluation of park accessibility. It can be used as an important supplement to improve the evaluation model of accessibility.

1. Introduction

The accessibility of park green space is an important index to measure the livable level of a city [1]. Good accessibility of parks is a prerequisite for residents to fully enjoy the ecological and social service benefits of parks and has a significant positive correlation with residents’ happiness index [2]. The urban park accessibility analysis is an interdisciplinary study of multiple disciplines, including geography, transportation planning, and urban planning. Accessibility measurement can be used not only to evaluate the rationality of the spatial layout of public service facilities but also to compare the advantages and disadvantages of planning schemes [3]. The blind area of accessibility is identified through the accessibility of green space in parks so as to provide suggestions for the planning and construction of urban parks. Alternatively, compare before and after the planning and construction of the park, or whether the accessibility of urban park green space has been improved after the improvement of the road network and other infrastructure. To evaluate the accessibility of green space in urban parks, analyze and evaluate whether the construction of green space in urban parks has better-improved people’s lives, produced more social benefits, and reflected the fairness and justice people enjoy in a green space in parks [4], such as whether it has promoted people’s physical and mental health [5], and whether it has better taken into account the accessibility of vulnerable groups to obtain park services.
Urban Park accessibility is usually defined as the difficulty degree of overcoming the spatial barrier, commonly using distance, time, cost, and other indicators to express, emphasizing the spatial location of urban parks and the resistance in the process of entering urban parks [2,6,7]. It usually includes the consideration of travel distance and travel modes, such as pedestrians and vehicles, and travel is often related to the road network, so the impact of road network facilities is a key factor in the analysis of park accessibility. In the accessibility measurement, there are different methods due to the different calculations of distance. Especially when the road network is taken into account, a more realistic accessibility measurement can be achieved based on the influence of the road network and different travel modes, combined with various facilities’ POI data and social and economic data.
The research method of urban park accessibility [2,7,8,9,10,11,12,13] mainly includes statistical indicators, the minimum distance method, the travel distance or cost method, and the gravity model method. The travel distance or cost method includes the buffer zone model method, the network analysis method, the cost-weighted distance method [7], and the gravitational model method includes its modified, derived two-step mobile search method and its various models [2].
The statistical index method [2,6,7], also known as the inclusion method, usually evaluates the accessibility of parks using relevant indicators, such as the number and area of parks in a specific statistical area. This method is affected by the statistical geographical units, and the statistical areas with a large scope may usually have more parks.
The minimum distance method is mainly to consider the public mostly chooses the nearest park for recreation and leisure activities. Based on this idea, this method abstracts the residents’ departure place and the city park as points and calculates the shortest straight-line distance between the points to express the accessibility of the citizens to the park. Using the straight-line distance cannot reflect the accessibility of the residents under the actual travel conditions and the impact of the park and the residents themselves on accessibility. Both the statistical index method and minimum distance method only consider the estimated urban park benefits estimated by park location coverage but ignore the spatial transfer effect of urban park benefits. Moreover, the transfer effect of park benefits varies with different space sizes and has certain defects [14].
The travel distance or cost method [1,15] often evaluates the accessibility of the park by calculating the cumulative resistance between the city park and the citizens (such as the distance, time, or cost, etc.), which can clearly and intuitively represent the resistance of different locations in the space to the city park. Based on the different understanding of resistance, this method can be divided into the buffer zone method, cost-weighted distance method, and network analysis method. Buffer analysis [16] is centered on point or surface parks, with the maximum service straight-line distance radius to structure the buffer area to assess the spatial accessibility of the park. This method takes into account the impact of park location and service capacity on accessibility, but it believes that the residents in the service area can reach the park, but those outside the service area cannot, which cannot reflect the difference in accessibility within the service area and the travel path obstacles caused by the actual landscape, and the service radius can often not be accurately obtained either. The network analysis method [17] and cost-weighted distance method [18] can be regarded as the application of the travel distance or cost method in two different data: vector and grid. Both consider the actual transportation cost or resistance but ignore the elements such as distance attenuation, the limited distance of residents’ travel, and the park supply capacity.
The gravitational model method [19,20] understands accessibility as the magnitude and potential of the interaction force between the park’s service capacity and citizen demand and can add the park supply, resident demand, and distance attenuation factors to comprehensively investigate accessibility. The two-step floating catchment area method is a special form of the gravity model method. It integrates the supply and demand factors affecting the accessibility of the park within the range of the threshold into the accessibility measurement model by searching statistics in turn according to the given threshold value [21]. It is a popular method in current research. The two-step floating catchment area method develops a variety of attenuation functions for distance attenuation, gradually pays attention to people’s travel patterns and rules [22], and develops a variety of travel modes of distance search mode.
The above methods either consider the statistical indicators of the park itself or evaluate the accessibility of the park by investigating the distance, time, cost, and supply and demand indicators of the park but lack the measurement of the accessibility between sub-space nodes in the park space system.
The space syntax theory describes the accessibility of subspace nodes under the spatial system structure or morphology based on spatial topological relation. Spatial topological relations describe the relative spatial position relationships between spatial entities that remain constant under topological transformations. For example, a park is within an administrative region; Road A intersects Road B, Road A and Road C are adjacent, and so on. These relationships are more stable than geometric relationships or azimuthal relationships. For example, the road length, the park area, and the azimuth relationship may change with the projection, the scale, or other topological transformations, while the topological relationship will not. Therefore, the spatial syntax method based on topological relation theory can not only evaluate the accessibility quantitatively but also its results are more reliable.
The advantage of space syntax is that it can describe the influence of overall spatial structure or morphology on the accessibility of urban parks from the perspective of spatial topological relations. The method based on space syntax often divides the subspace through the traffic network and transforms the whole space into a connection graph of each subspace node. Afterward, the graph theory method is used to derive a series of spatial syntactic variables to describe the structural characteristics of the space at different levels, emphasizing the ontological nature and internal logic of the spatial structure [23,24]. This method quantifies the spatial structure characteristics from the perspective of topological space and reflects the global accessibility, local accessibility, perceptual accessibility, and psychological accessibility levels through the road network data so that the connotation of urban park accessibility is more complete, so as to evaluate the spatial distribution structure characteristics of urban parks more objectively. In other words, the special feature of space syntax is that it can describe the influence of the overall structure or form of space on the accessibility of spatial elements from the perspective of spatial topological relations. Therefore, with the support of space syntax theory, this paper studies the accessibility of green space in urban parks in Changsha City, provides references for the optimization of park green space layout in the study area, and explores the application mode of space syntax in the accessibility of parks. This paper first introduces the principle of space syntax and the quantitative index of space syntax involved in accessibility, then describes the general situation of the study area and data sources, and then analyzes the space syntax index generated in the experiment so as to obtain the accessibility of a road network and its relationship with the accessibility distribution of parks. Finally, the paper’s methods and conclusions are summarized and discussed.

2. Materials and Methods

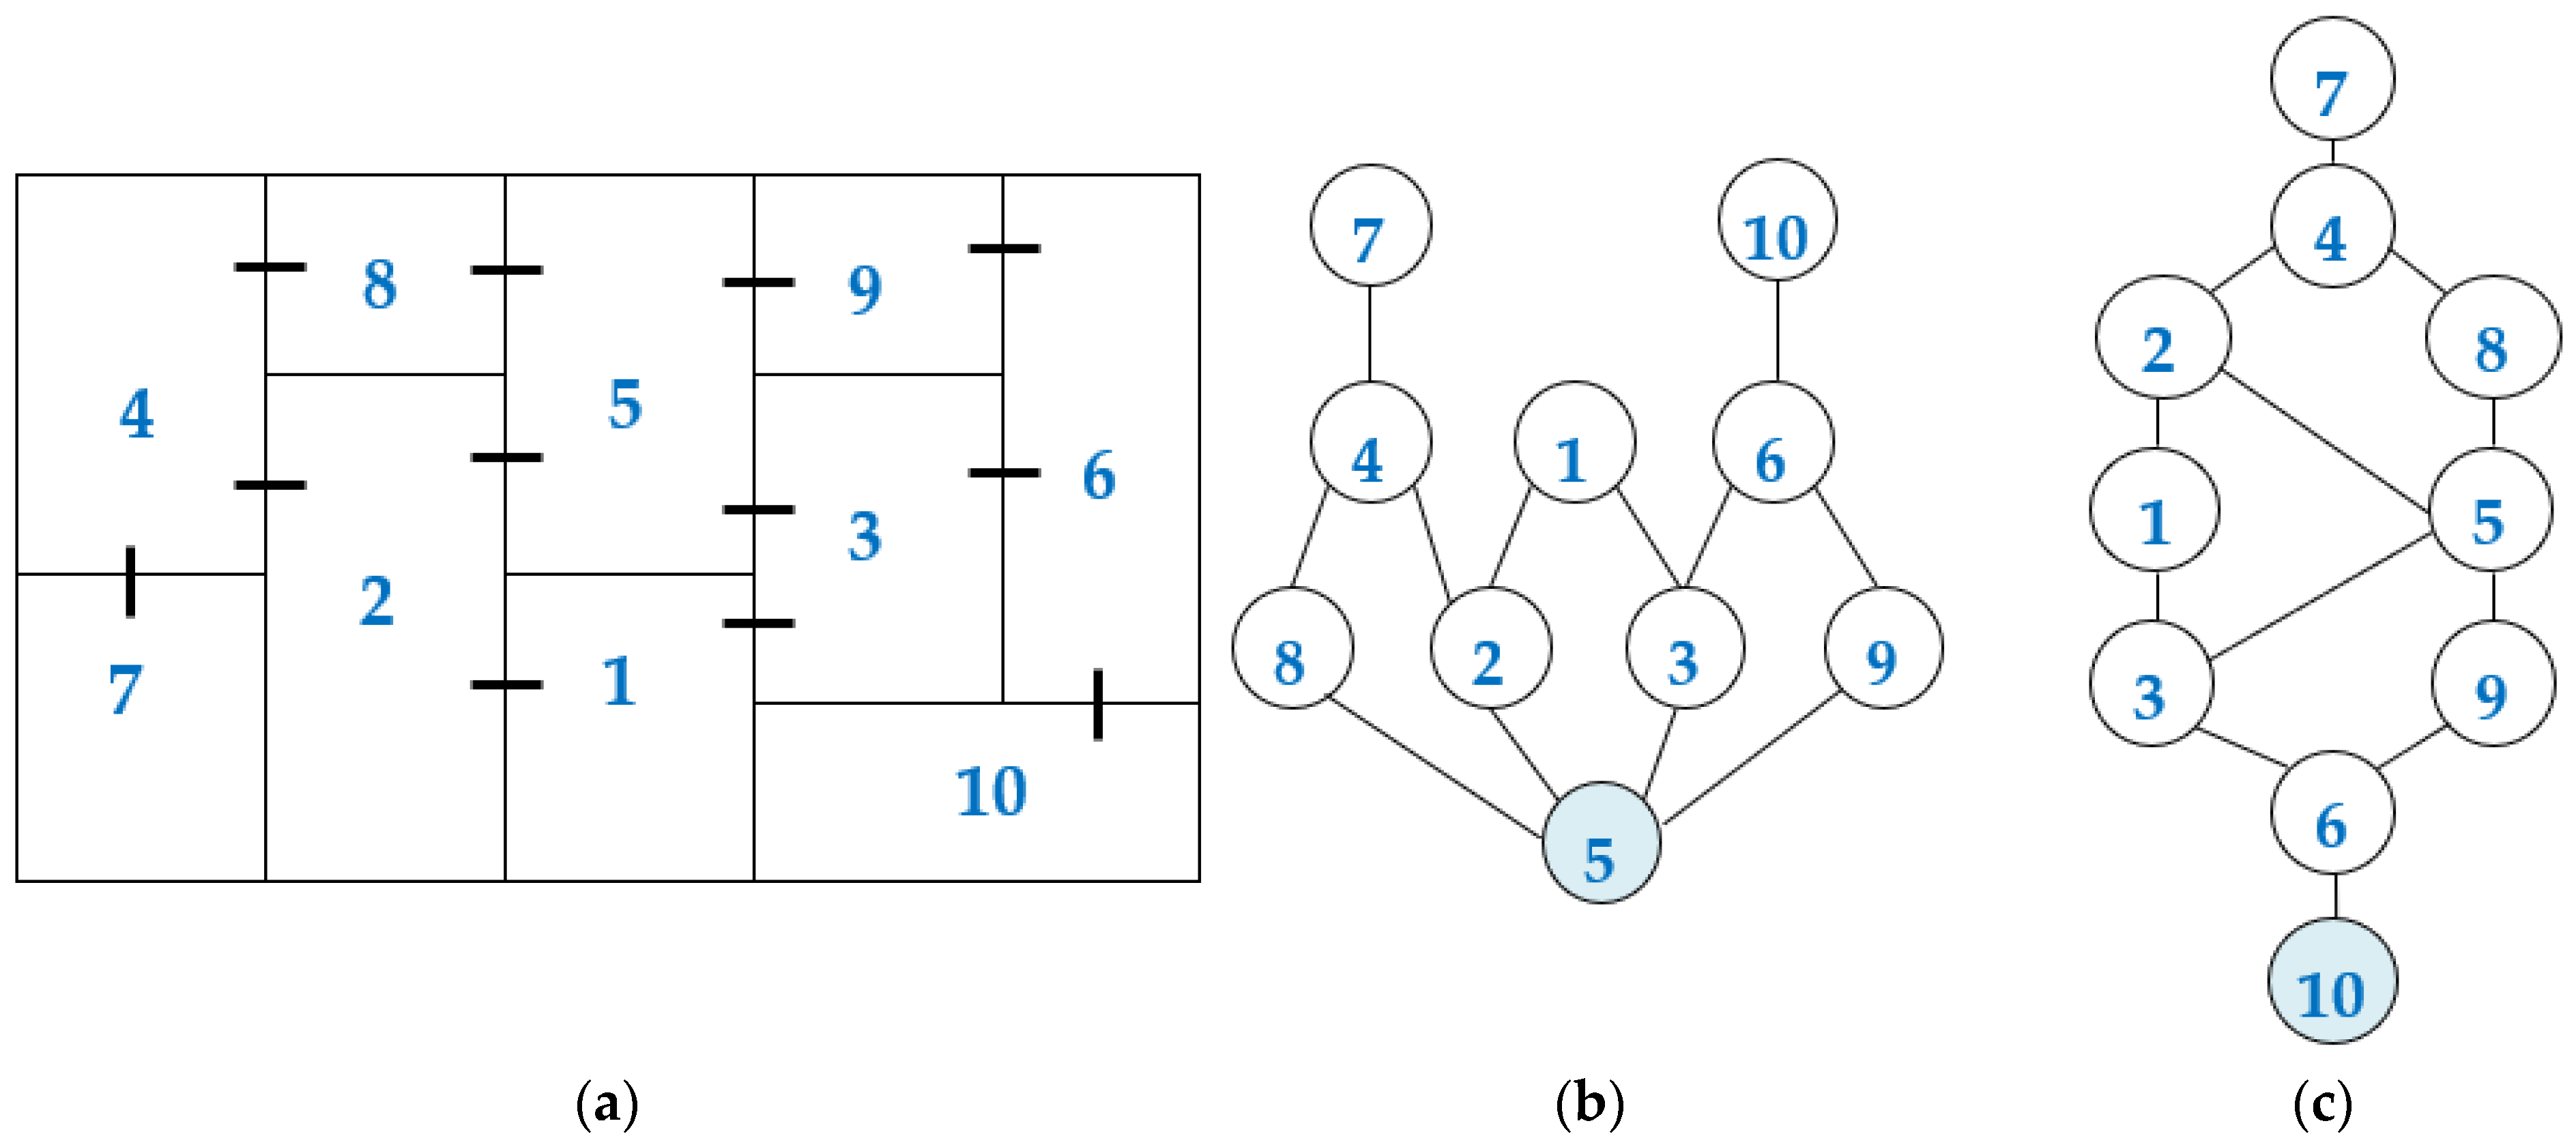
2.1. Theory of Space Syntax

Space syntax study’s spatial regional structure features based on a spatial morphology and topological relationship [24,25,26]. It is a data language to interpret and quantify the spatial form. Generally, the relationship in its space configuration can be considered or expressed graphically, and the J graph (justified graph) is commonly used to quantify it, as shown in Figure 1: (a) represents the whole space plane layout, the number represents the identifier of subspace nodes, and the short line means that the space of adjacent nodes can be connected or traversed; (b) and (c) represent the relationship between space nodes as a J graph. The same spatial configuration will form different J graphs due to the different observation nodes, which will produce different quantitative indicators. As in the graph, if observed from node 5 or from node 10, it is necessary to cross 2 and 3 subspace nodes to reach node 1, respectively, indicating that each node has different accessibility to other nodes in the space. Therefore, assigning the different indexes value to the nodes through the analysis and processing can reflect the state of the nodes in the whole space, thus representing the different properties of spatial accessibility.
Now some scholars have applied space syntax to the study of urban park accessibility [27,28,29,30]. Günaydın and Yücekaya [29] used the space syntax software DepthMap to determine the accessibility of urban green spaces in metric and topological terms and to examine and discuss their social and functional contributions. Zhao [30] uses sDNA and ArcGIS software to calculate and analyze the integration degree and penetration degree of the spatial syntactic index of the road network in the central city of Guangzhou and analyzes the spatial distribution combined with the Moran index to reflect the accessibility of urban parks. Different software platforms for spatial syntactic analysis produce different parameters.
DepthMap is commonly used space syntax software, which is simple to operate, has low data requirements, and is easy to obtain. Its main parameters produced are connectivity, depth, integration degree, selection degree, and synergy degree [31]. The connectivity degree represents the connectivity of a node space by the number of node spaces adjacent to a node space. The higher the connectivity, the stronger the permeability of the node space and the higher the spatial accessibility. The calculation formula of connectivity degree C i of node i is given in Equation (1):
C i = k i
where k i is the number of nodes directly connected to node i .
Depth represents the shortest distance (minimum steps) from a node space to the other node space, stipulating the number of steps of two adjacent nodes as one step. The sum of the shortest distance from node i to all other nodes in the system is called the total depth ( T D i ), the average of the shortest distance (minimum steps) of node i to all other nodes j j = 1 , 2 , , n j i in the space system is called the average depth value ( M D i ) of that node. Depth reflects the convenience of the node in the space system and is inversely proportional to spatial accessibility. The total depth ( T D i ) and average depth ( M D i ) of node i calculation formulas are shown in Equation (2):
T D i = j = 1 n d i j   ,   M D i = T D i n 1
where n is the number of space nodes in the space system, and d i j is the depth of the node i to the node j .
The integration degree indicates the degree of a node gathering or discrete from all other nodes in the whole spatial system. It is a reciprocal function related to the depth; the smaller the node depth value, the higher the integration degree, the higher the integration, the stronger the aggregation of the node space, and the better the spatial accessibility. The integration degree can represent the relationship of a node space to a local spatial system or a global spatial system, that is, the local integration degree and the global integration degree. The formula of integration degree I i of node i is given in Equation (3):
I i = n [ l o g 2 n + 2 3 1 + 1 ] n 1 M D i 1
where n is the number of space nodes in the space system, and M D i is the average depth value of node i .
The selection degree represents the number or probability that a route in the space system will be selected as the shortest path. Roads with a higher selection degree often have a more attractive value to the citizens, and these roads will appear in the space with a greater flow of people, with higher psychological accessibility. The calculation formula of selection degree E i of node i is given by Equation (4):
E i = 1 n 1 n 2 j = k = 1 n n j , k i n j , k
where n is the number of space nodes in the space system, n j , k i is the number of times the shortest path of the space node i to node j is selected, and n j , k is the total number of shortest paths in the space system.
Synergy degree is used to measure whether a node’s local space can be identified and fusion by the global urban space or whether it can be easier to understand the global spatial structure characteristics through local spatial structure characteristics, expressing the relationship of local space and global space. Using the local and global integration degree of all nodes participating in the statistic to obtain the synergy degree, and when the synergy degree is higher than 0.7, recognition is extremely high, with higher perceptual accessibility. The synergy calculation formula is given in Equation (5):
R 2 = [ I i g I g ¯ I i l I l ¯ ] 2 I i l I l ¯ 2 I i g I g ¯ 2
where I i g and I g ¯ represent the global integration of node i and the mean of global integration of all nodes, respectively; I i l and I l ¯ represent the local integration of node i and the mean of local integration of all nodes, respectively.
In this paper, the line segment model in space syntax theory is used for spatial segmentation and realize spatial syntactic index parameter calculation to assist urban parks accessibility analysis.

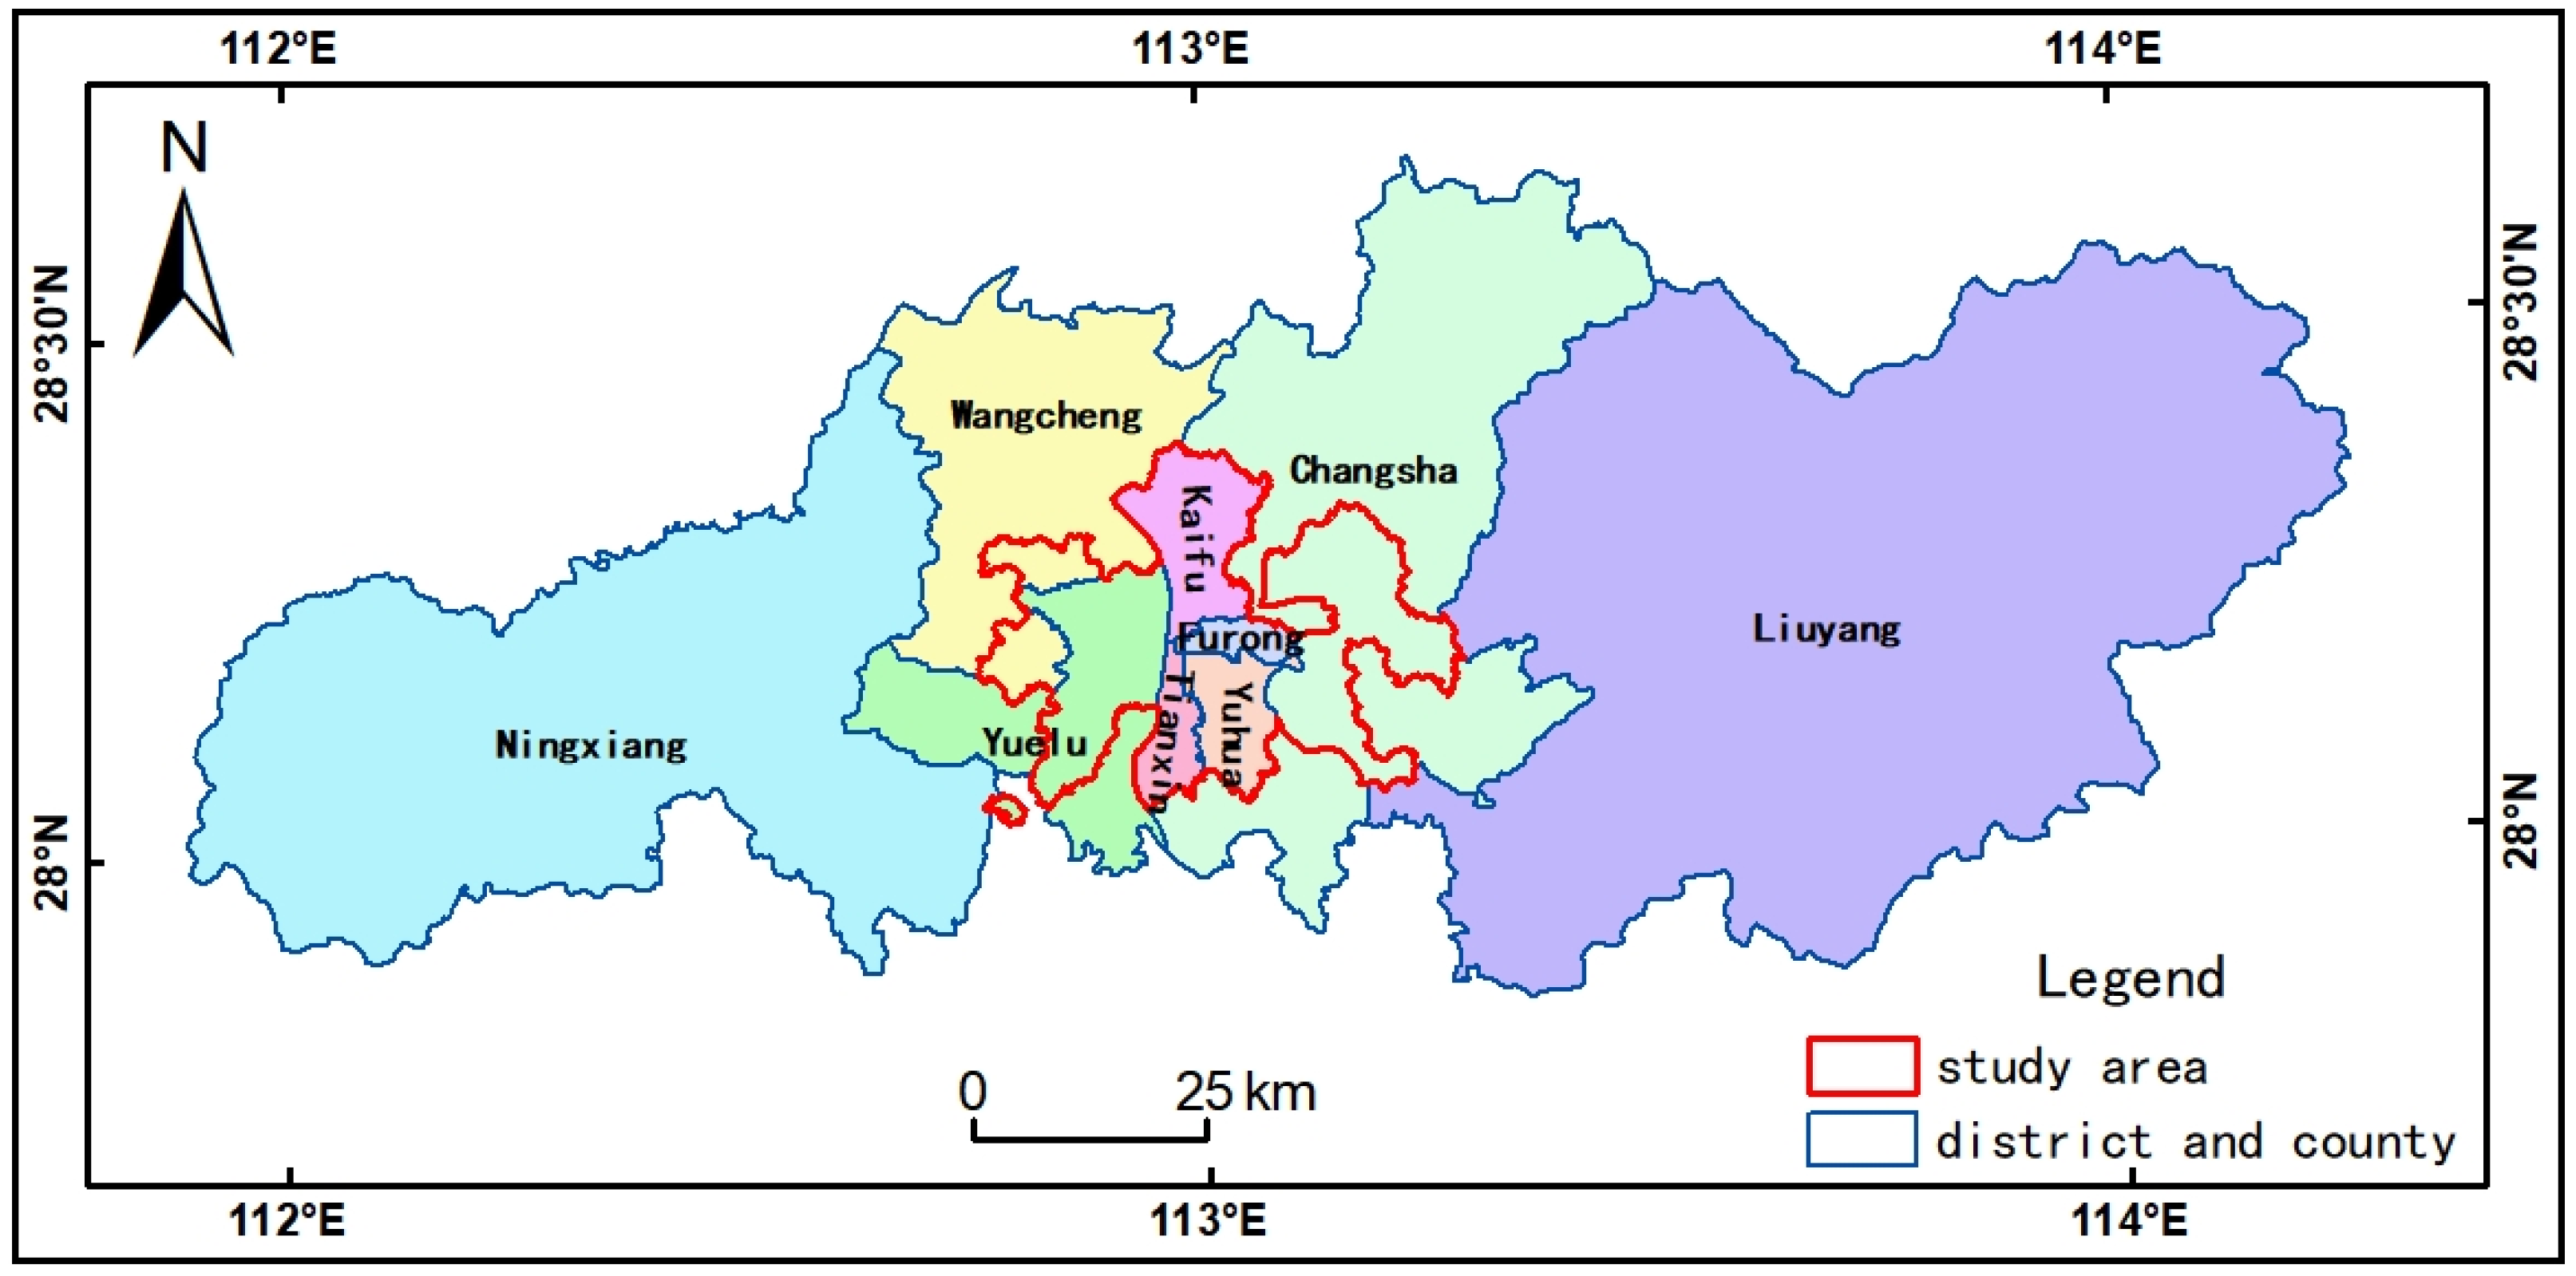
2.2. The General Situations of the Study Area
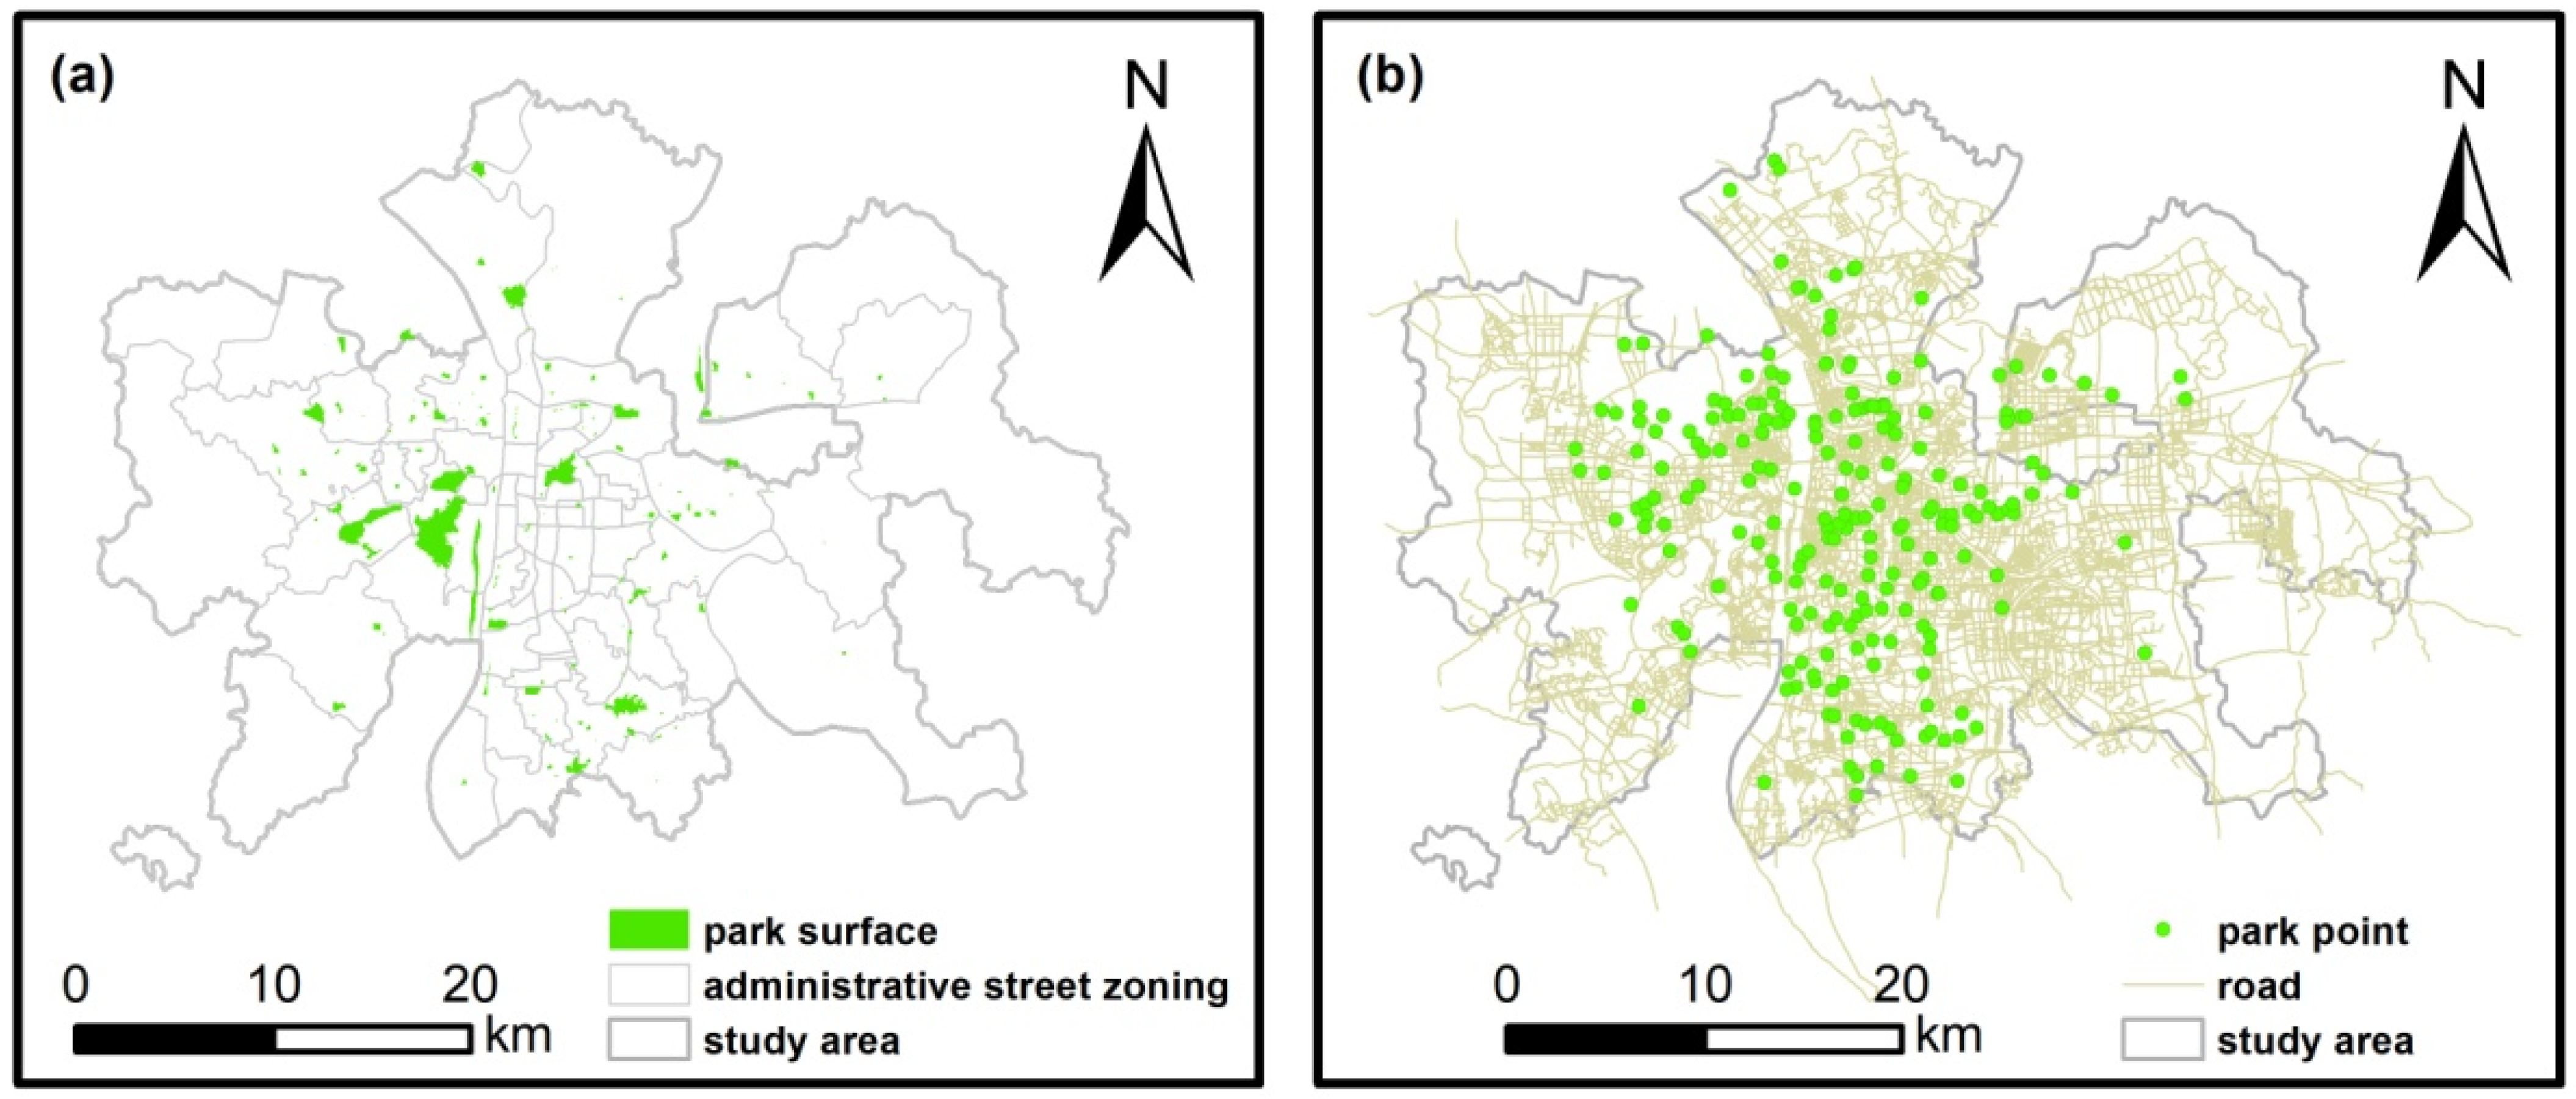
Changsha City now has jurisdiction over six districts, one county, and two county-level cities: Furong District, Tianxin District, Yuhua District, Kaifu District, Yuelu District, Wangcheng District, Changsha County, Ningxiang County-level City, and Liuyang County-level City. The total area of the city is 11,816 square kilometers, with an existing population of 10.05 million. The study area scope of this paper is delimited according to the Urban Master Planning of Changsha (2003–2020) and the Territorial Spatial Planning of Changsha (2021–2035); it is the main scope of the central city of Changsha City, including all areas of Furong District, Kaifu District, Yuhua District, Tianxin District, and Yuelu District except Lianhua Town, Yuchangping Town, and Pingtang Town. It also includes Huangjing Town and Lei Feng Town in Wangcheng District and Xingsha Town, Langli Town, Huangxing Town, and Huanghua Town in Changsha County, as shown in Figure 2. This area is the political, economic, and cultural center of Changsha City, is the concentrated distribution area of urban residents, and is also the key area of urban park construction and planning, covering an area of about 1091 square kilometers. In 2020, Changsha released the “Work Plan for Building a National Ecological Garden City” and proposed the planning goal of “opening windows to see green and going out to see scenery” for the spatial structure of urban parks so as to improve the green space structure of parks, urban quality, and the service efficiency of parks. Therefore, this paper takes Changsha City as an example to explore the application of space syntax in the accessibility of parks and studies the spatial pattern of the accessibility of urban park green space in Changsha City so as to provide a reference for the optimization of the layout and reasonable planning of urban park green space in the study area.

2.3. Data Source

This paper evaluates urban park accessibility based on space syntax to obtain spatial morphology variables, and the main data include park green space data and road network data in the study area. The park distribution data in this paper were obtained from Open Street Map (OSM, https://www.openstreetmap.org, (accessed on 9 April 2021)). We obtained the shapefiles format (.shp) OSM data in China using the Geofabrik download method, then we projected the OSM data onto the Changsha administrative division data coordinate system CGCS2000_GK_CM_111E, obtained the OSM data according to the study area scope, and extracted the park element data in the points of interest (abbreviated POI) feature classes in OSM. The OSM map POI data contains a variety of information points of interest, which include food, accommodation, travel, play, attractions, shopping, life, etc. It includes both point and area POIs; the corresponding feature classes are named pois and pois_a. The feature classes contain hundreds of category features of interest, such as banks, hotels, kindergartens, bookshops, schools, supermarkets, and parks. This paper extracts the surface and point park features data, combined with Google map images and Baidu maps for editing. There are 234 park polygon features and 234 point-features obtained in the study area. At the same time, the main roads in the study area were extracted according to the road feature class data in the OSM data, processed the double-line road to the single-line road, and then the road axes in the study area were extracted for the calculation of the spatial syntactic index parameters according to the idea of “longest and least” according to the spatial syntactic line segment model principle. The parks and road network distribution in the study area are shown in Figure 3.

3. Results

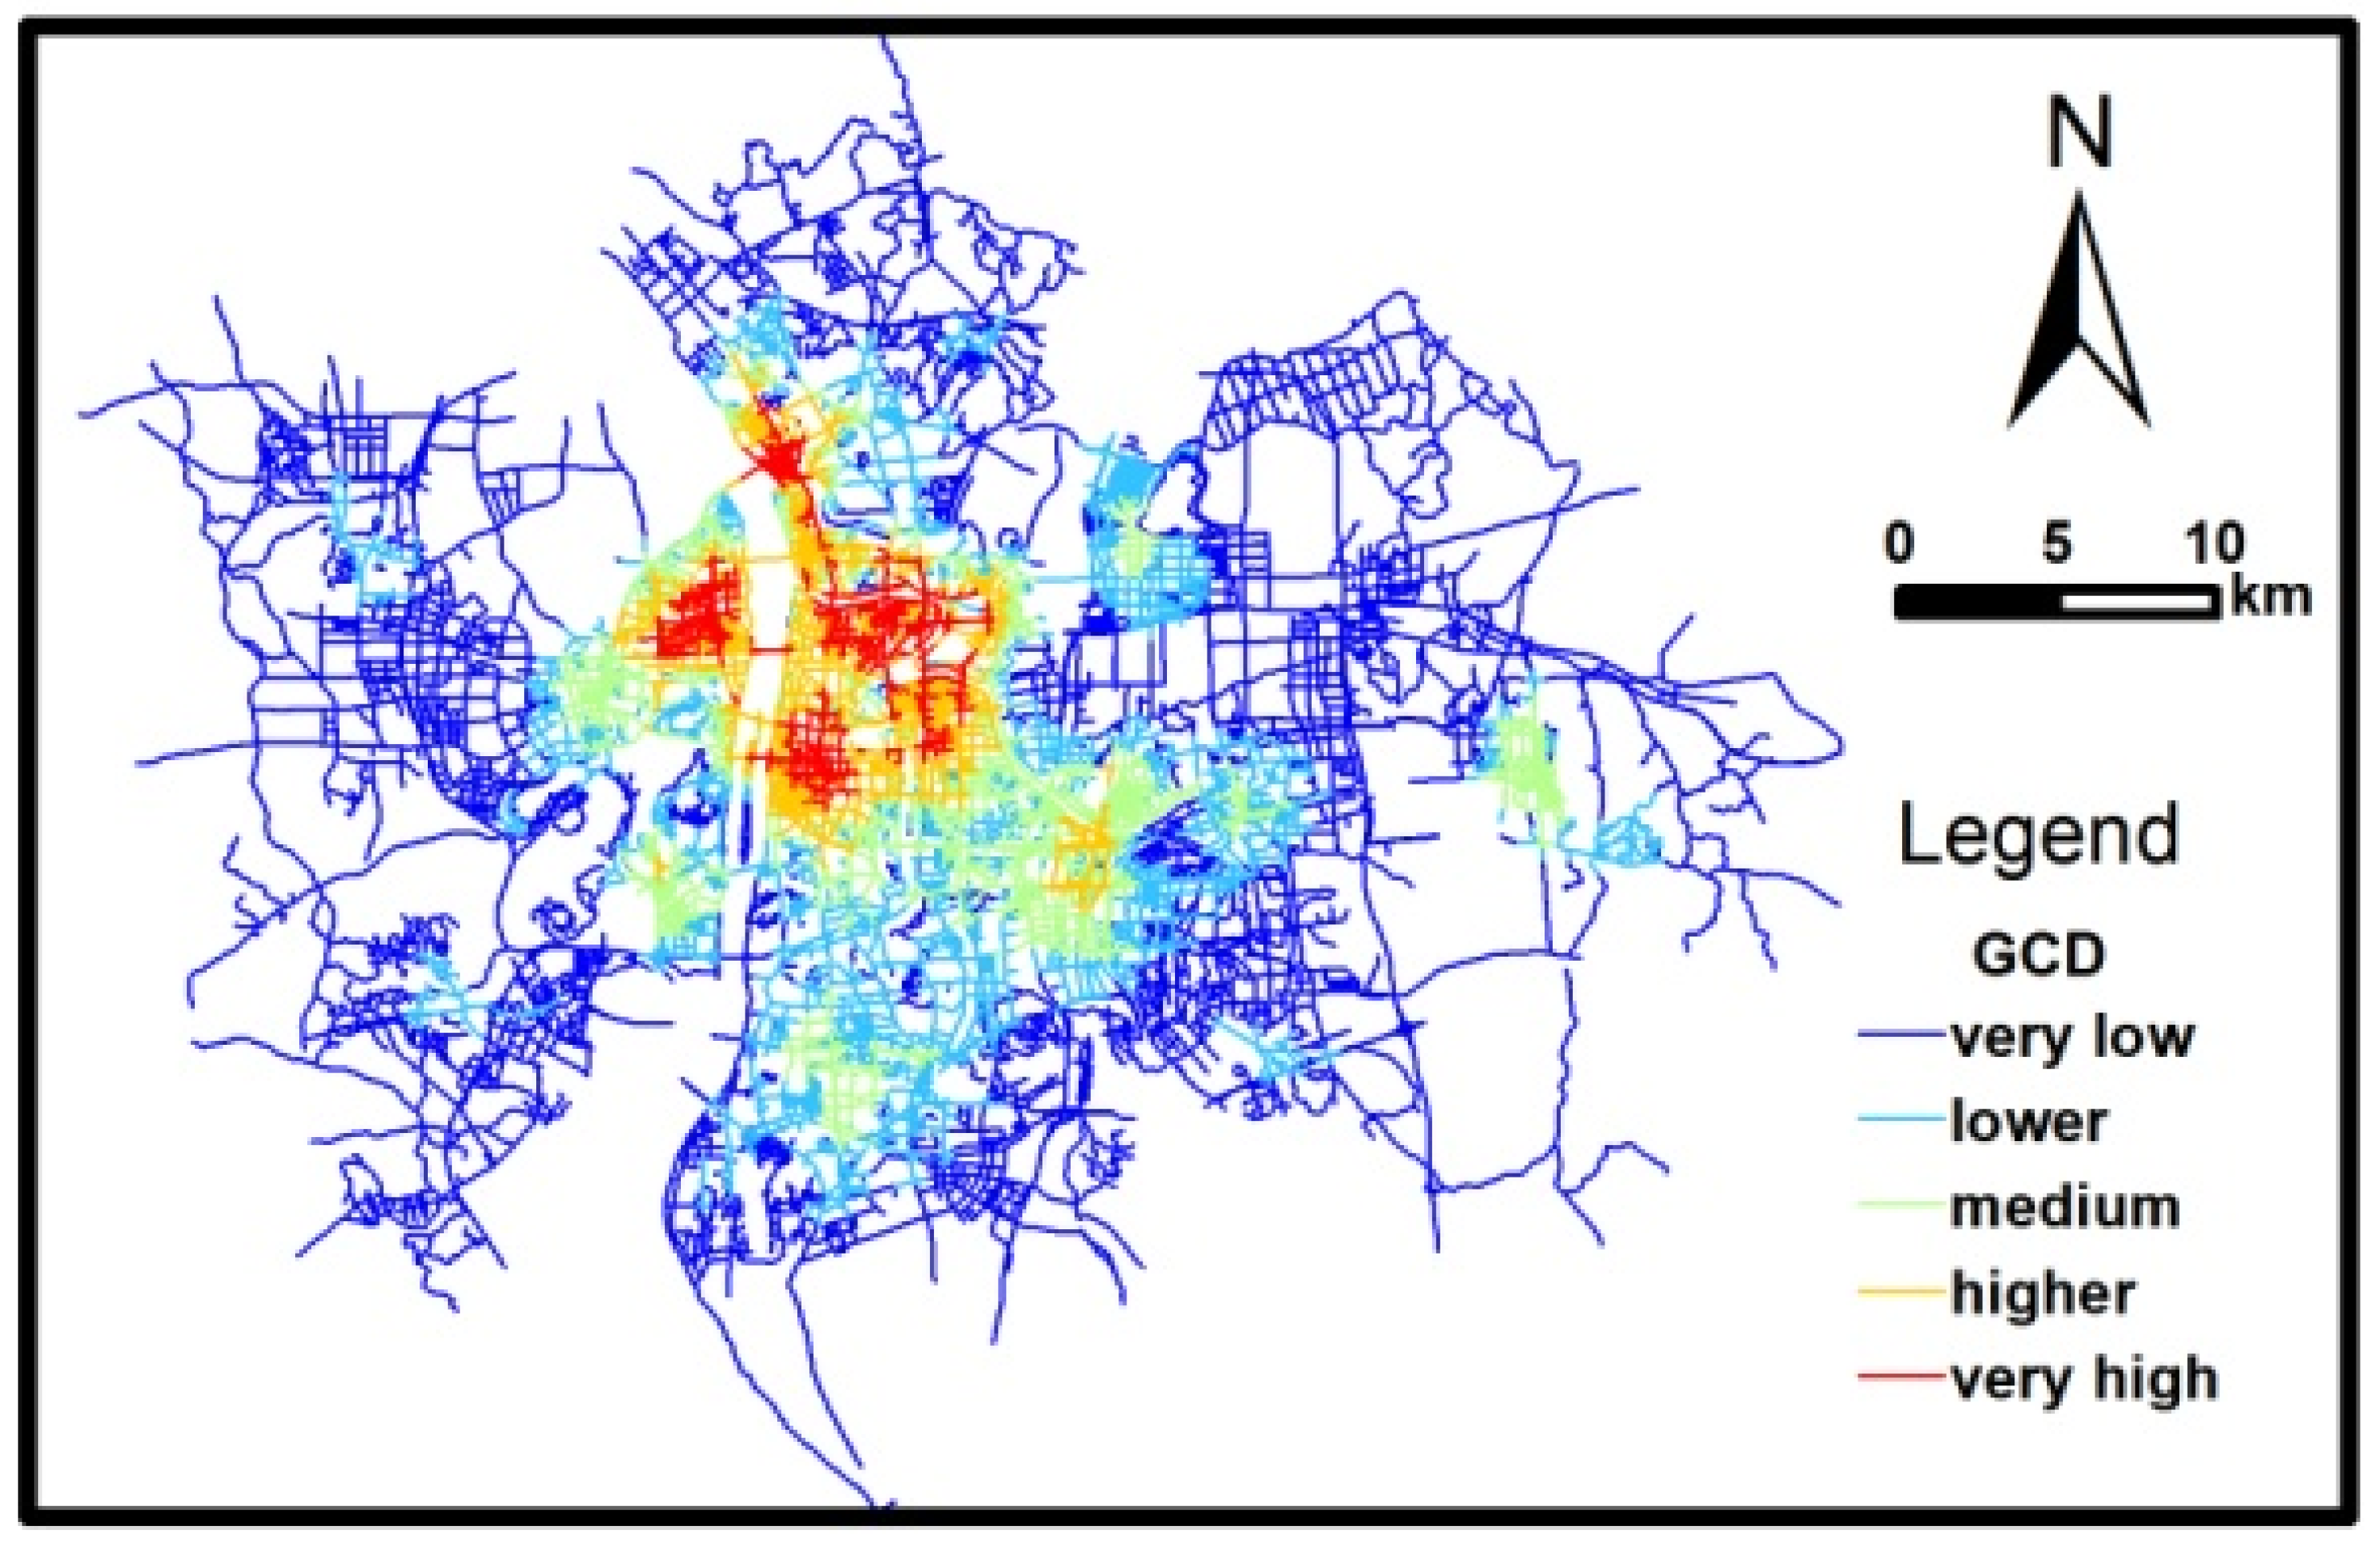
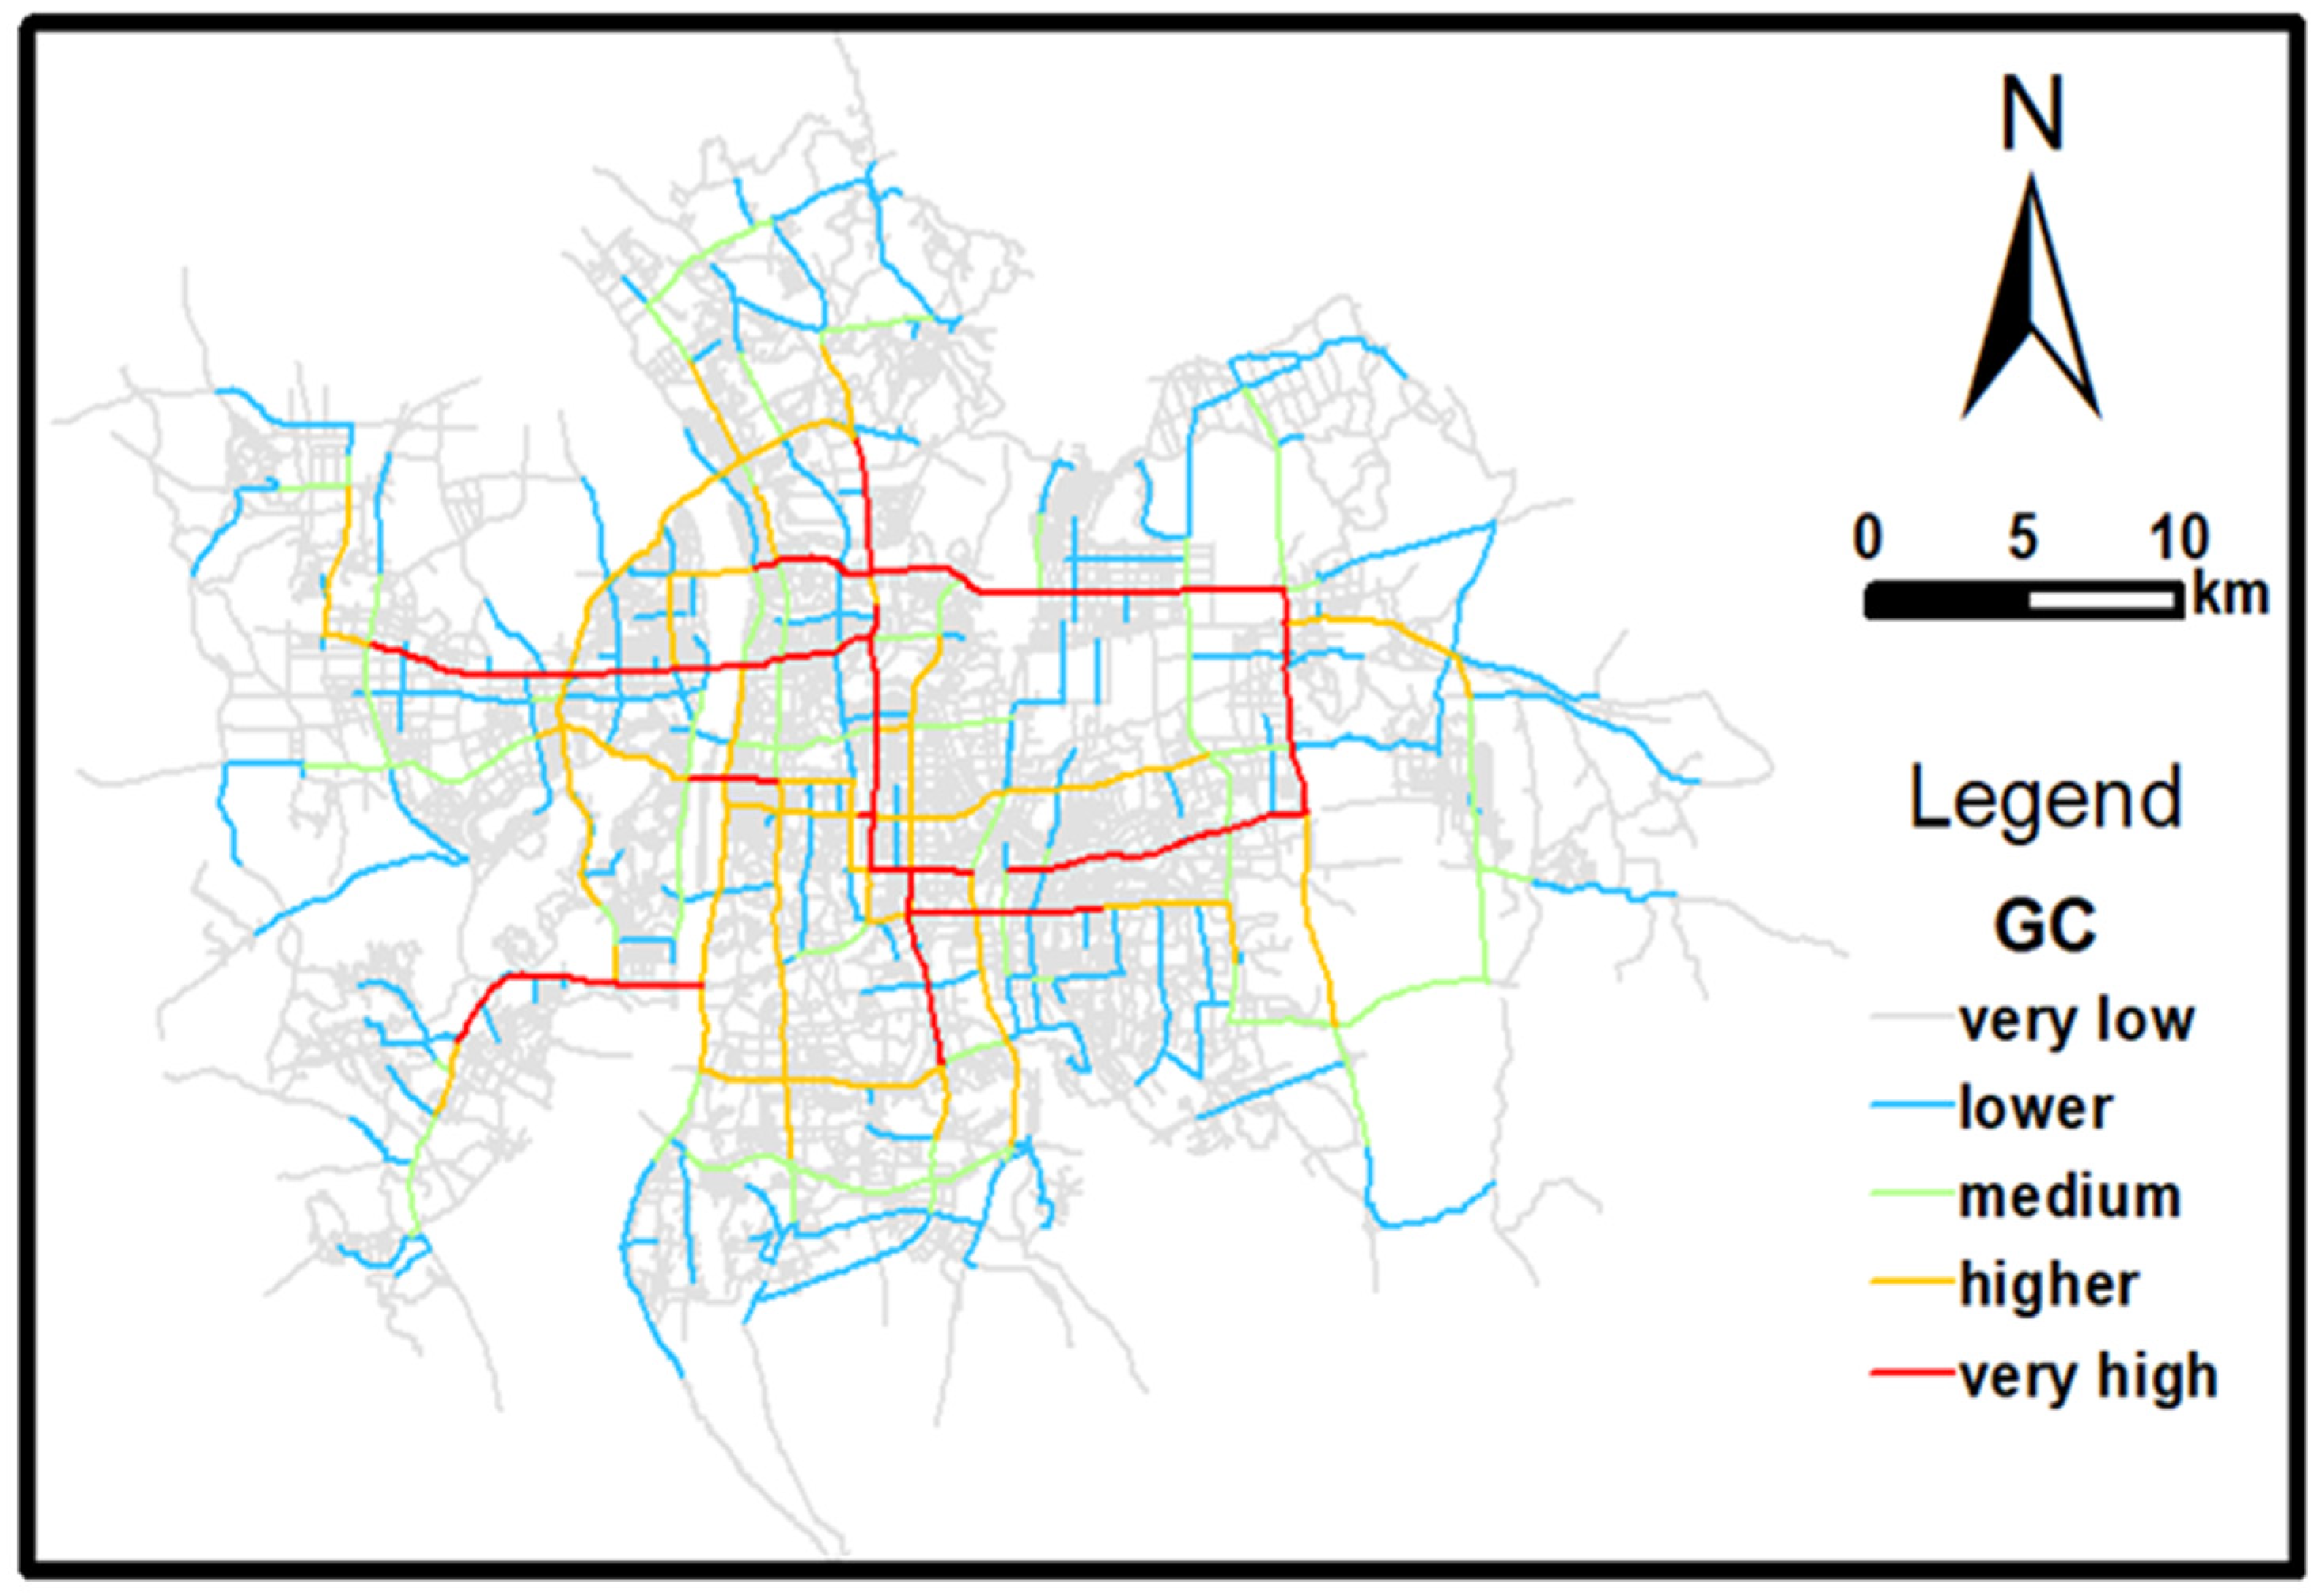
3.1. Urban Park Global Accessibility Analysis

The global accessibility of urban parks reflects the difficulty coefficient of citizens to reach the park from a traffic location without restriction in the urban spatial structure and evaluates the spatial accessibility of urban parks from the macro level. After verifying the validity of the road network line segment model of the study area, the global integration degree was calculated using DepthMap software and displayed with the natural break (Jenks) method in ArcGIS, which was divided into five grades: very low, lower, medium, higher, and very high. The park distribution and the road global integration degree distribution map were overlaid for analysis and shown in Figure 4. The roads with very high accessibility are Second Ring Road, Yuelu Avenue, Zhongqing Road, Furong Road, Xiangjiang North Road, Binjiang Landscape Road, Yinshan Road, Jinxing Road, Fuyuan Road Bridge, Yinpenling Bridge, Guihua Road, airport expressway, Changsha Ring Expressway, Laodong East Road, Liuyang Avenue and so on. These roads are important traffic arteries connecting the east and the west and connecting the north and south of Changsha. The roads have a strong carrying capacity, a high spatial agglomeration, and many commercial and residential areas along the roads, which undertake the large traffic flow and human flow in the central urban area of Changsha.
The total length of roads in the study area is 5,178,713.72 m, among which the road length with higher and very high global accessibility is 2,426,333.70 m, accounting for 47% of the road length in the area. The global accessibility of roads within the urban area of Changsha is high.
Combining these data with the information in Figure 5, it can be seen that road sections with higher global accessibility also have higher spatial connectivity, a stronger permeability of the node space, and a higher accessibility. Extraction and statistics of the parks near the roads with high global accessibility found that 118 parks were located near the sections with a high global integration degree; that is, about 50% of the parks had high global accessibility, indicating that the global accessibility of the urban parks in Changsha was generally good.

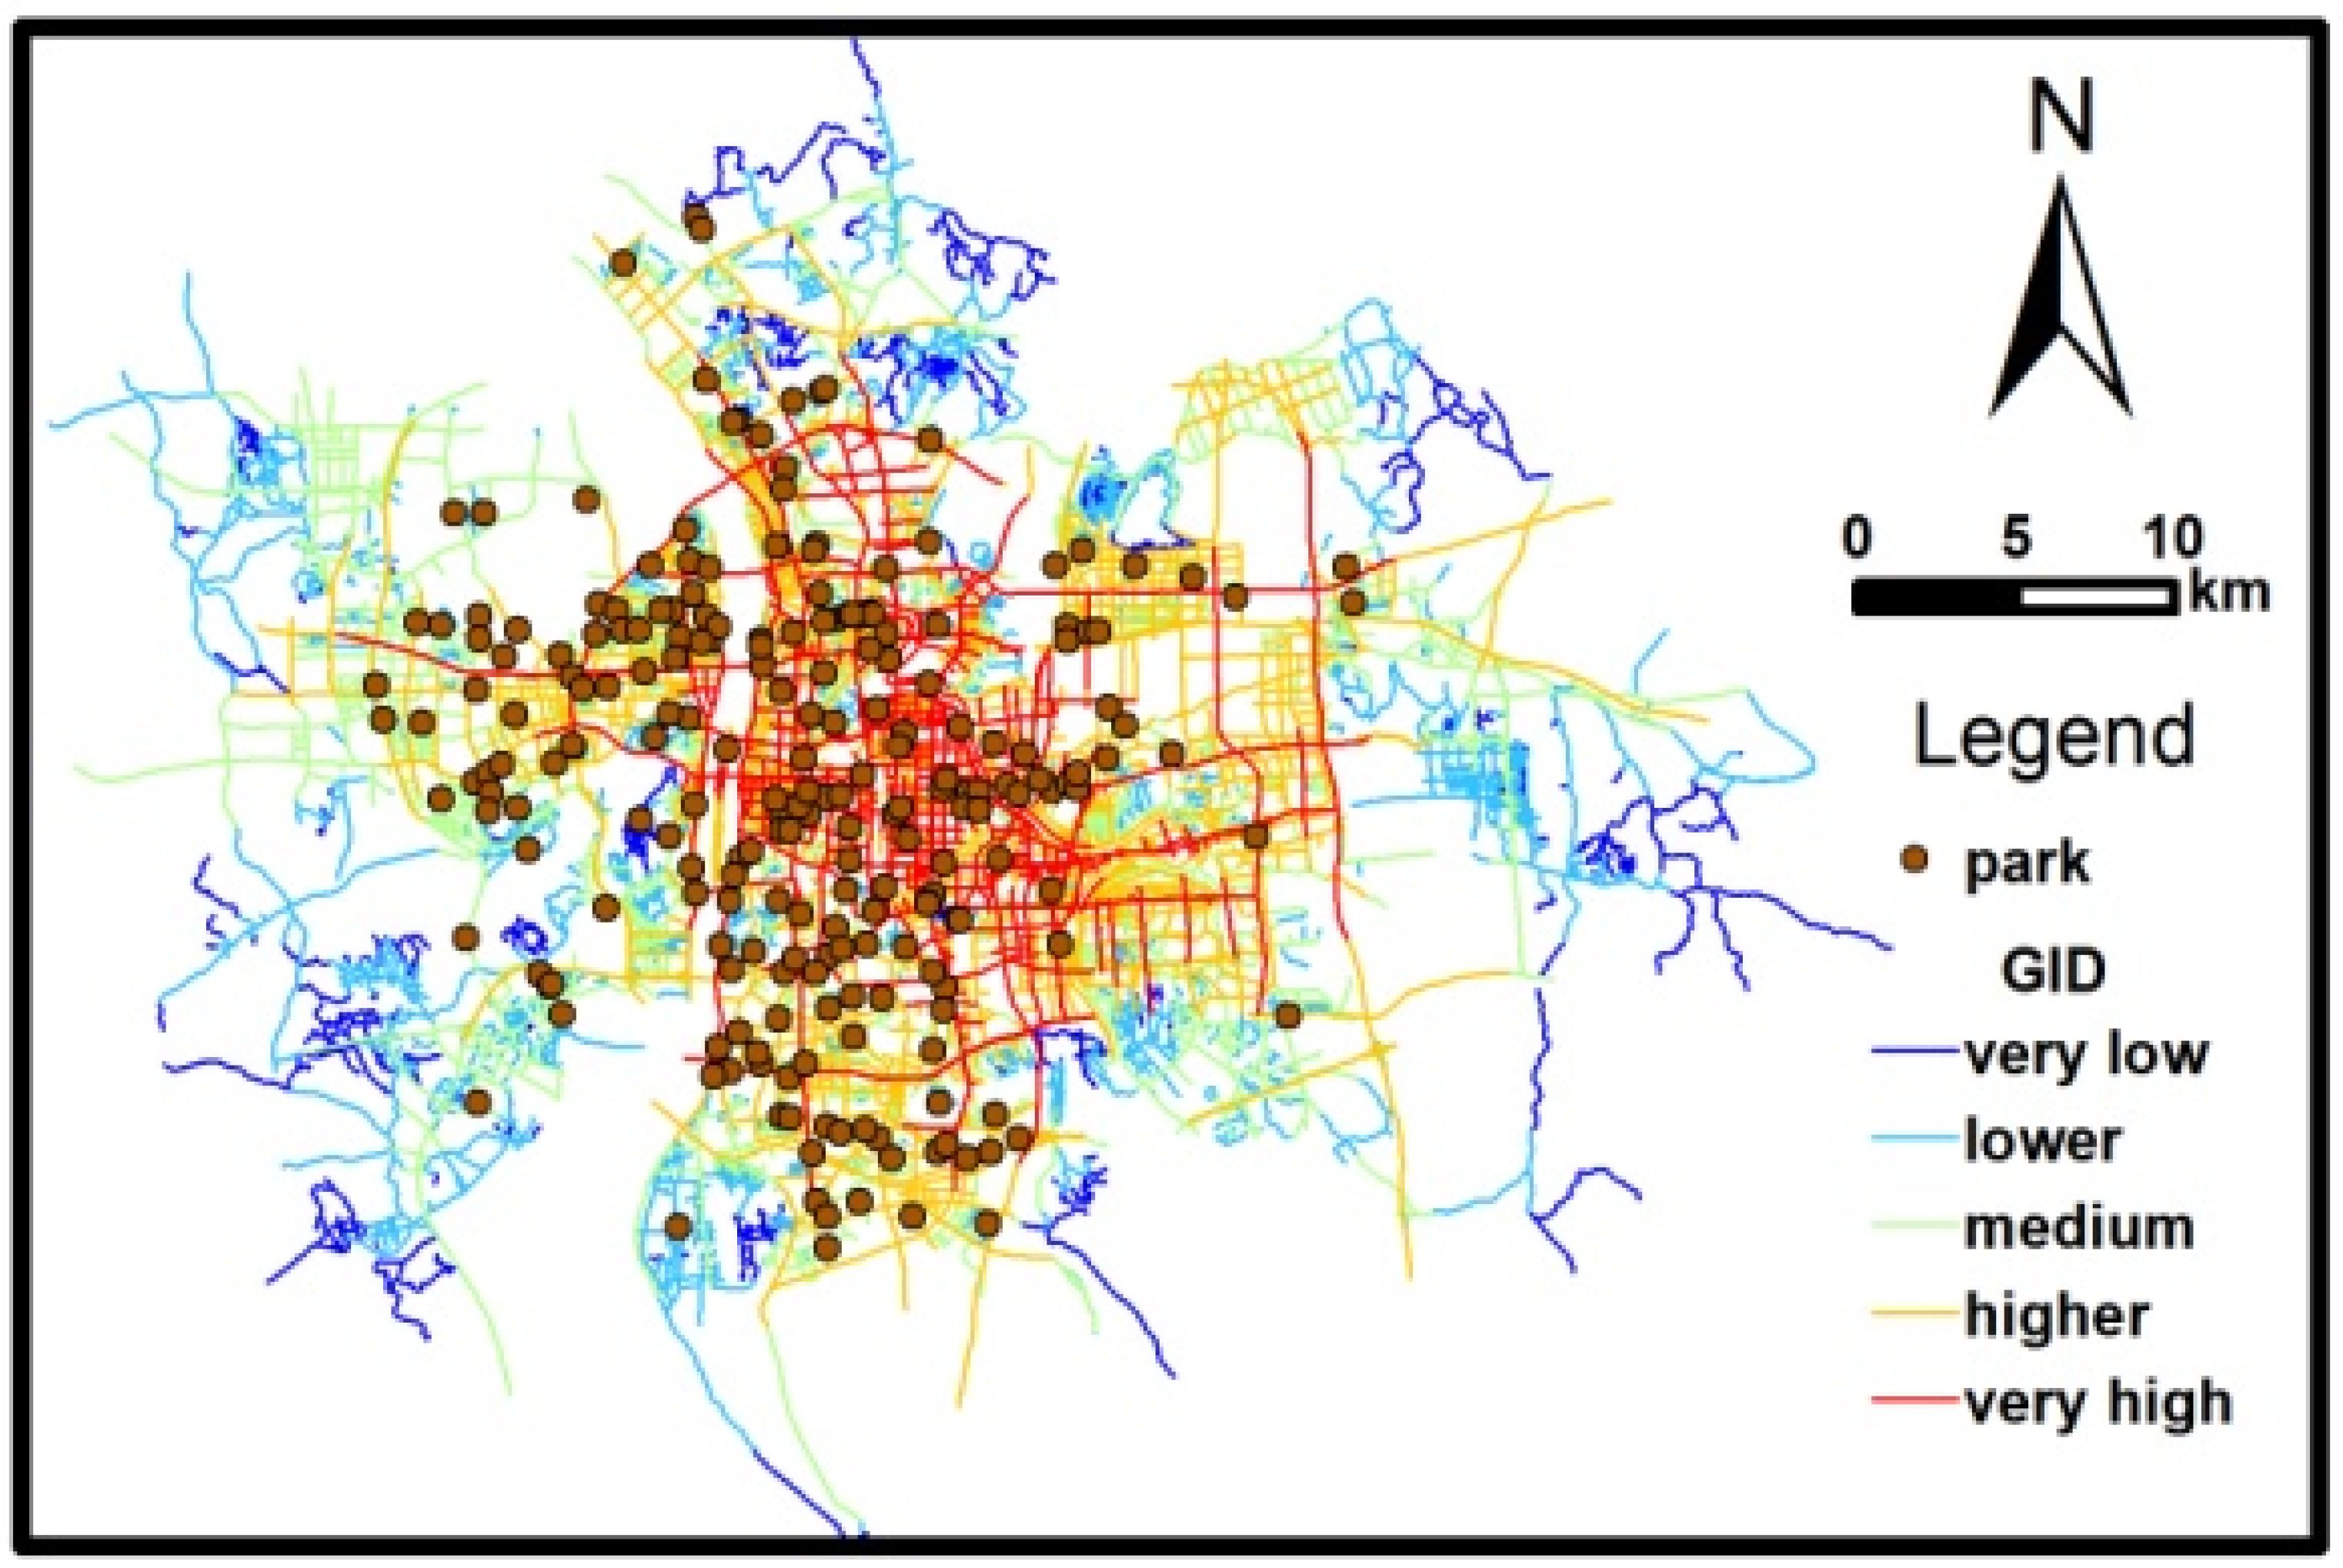
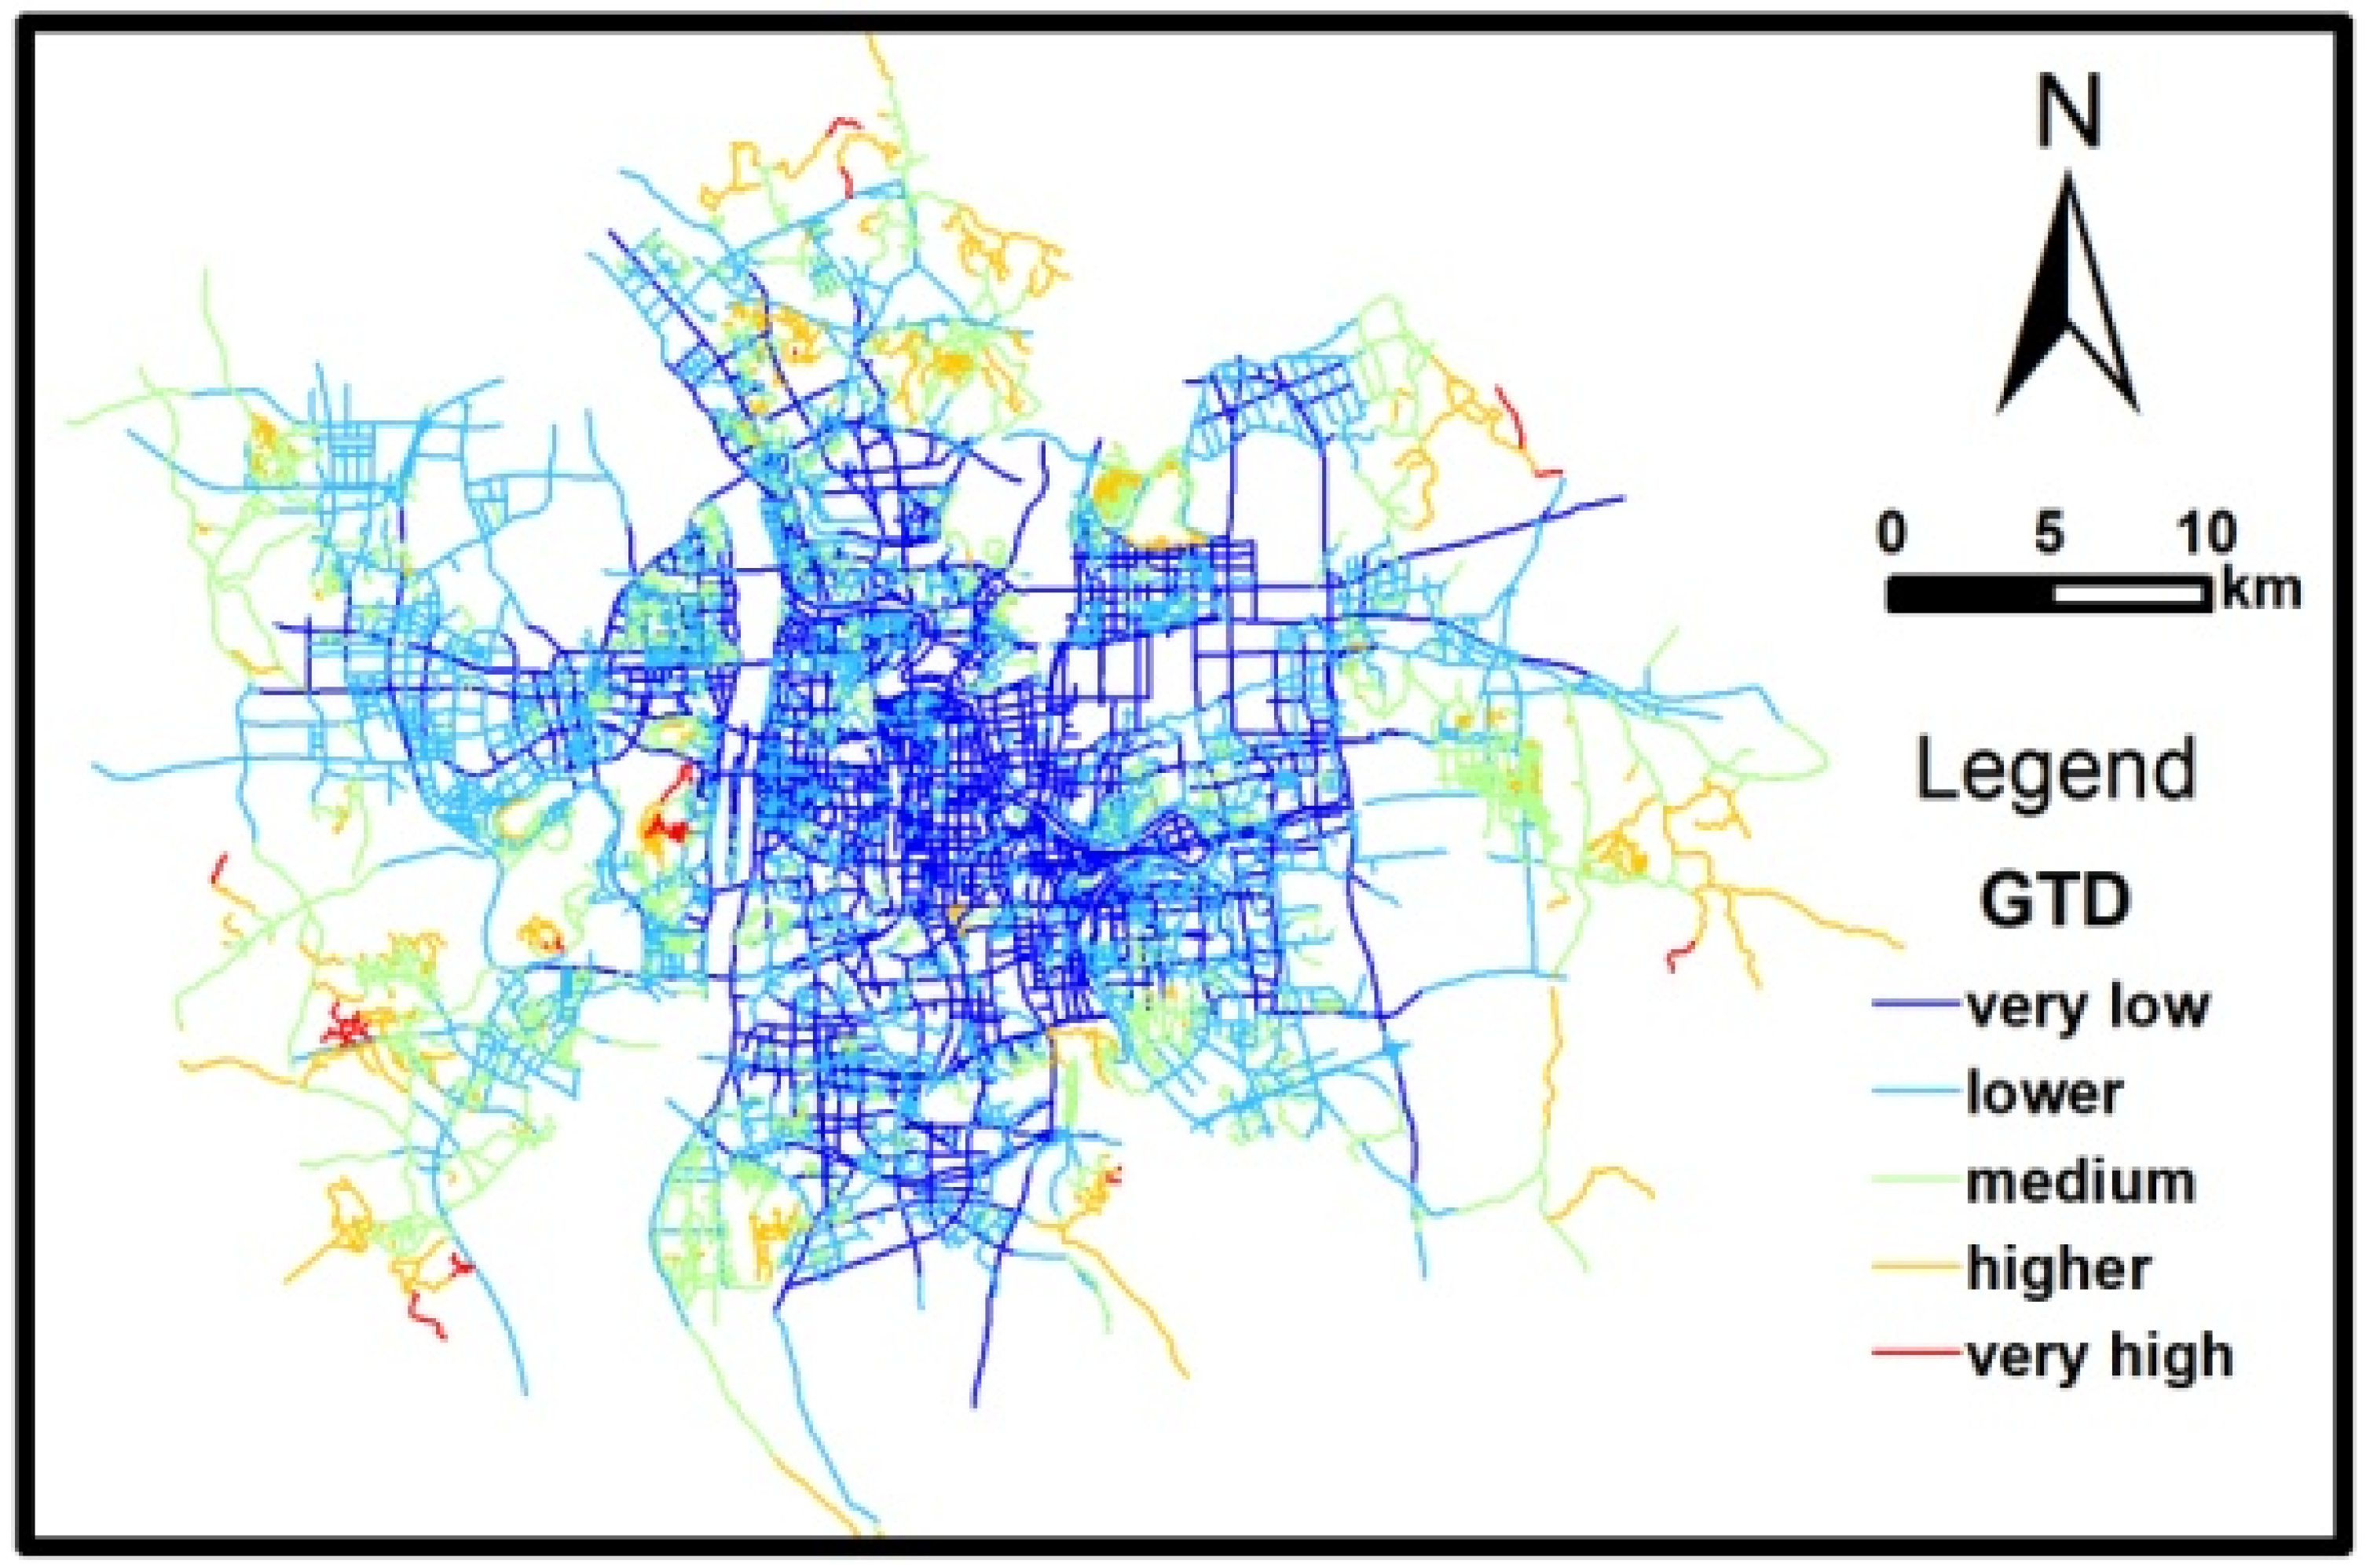
3.2. Urban Park Perceptual Accessibility Analysis

Synergy degree studies the correlation between the global road and the local integration degree, which can be used to measure the degree of perceptual accessibility of parks in the urban area of Changsha. The global integration degree reflects the relationship of each space node to all other space nodes within the global scope. The local integration degree reflects the relationship between each space node and its other space nodes within the range of a given topological distance, so it can reflect the local accessibility of the parks. The high synergy degree indicates that the global integration degree can be better perceived through the local integration degree; that is, the global spatial structure can be better perceived through the local spatial structure. Based on the checked validity road network segment model of the study area, the topological radius parameters were set at 500, 2000, 3000, 5000, and 10,000 m, and the corresponding local integration degree was calculated using DepthMap10 software. Then, the scatter plot of the local integration degree and the global integration degree of each road was listed according to different radii, and the linear trend line and the synergy degree R2 were obtained, and the results were recorded in Table 1. As shown in Table 1, the larger the topological radius, the higher the synergy degree. When the radius is less than 3000, the synergy degree is lower, the global road structure cannot be well perceived through the local road structure, and the perceptual accessibility of the park is lower. When the topological radius is equal to or greater than 3000, the synergy degree is higher, the global spatial structure can be better perceived through the local space, and the perceptual accessibility of the park is higher. At a radius of 3000, it can obtain relatively more detailed local structural features than the radius of 5000 and 10,000; at the same time, it can also maintain a good perception of the overall structure of the road. Then, the synergy degree is 0.665, and the perceptual accessibility of the study area is high.

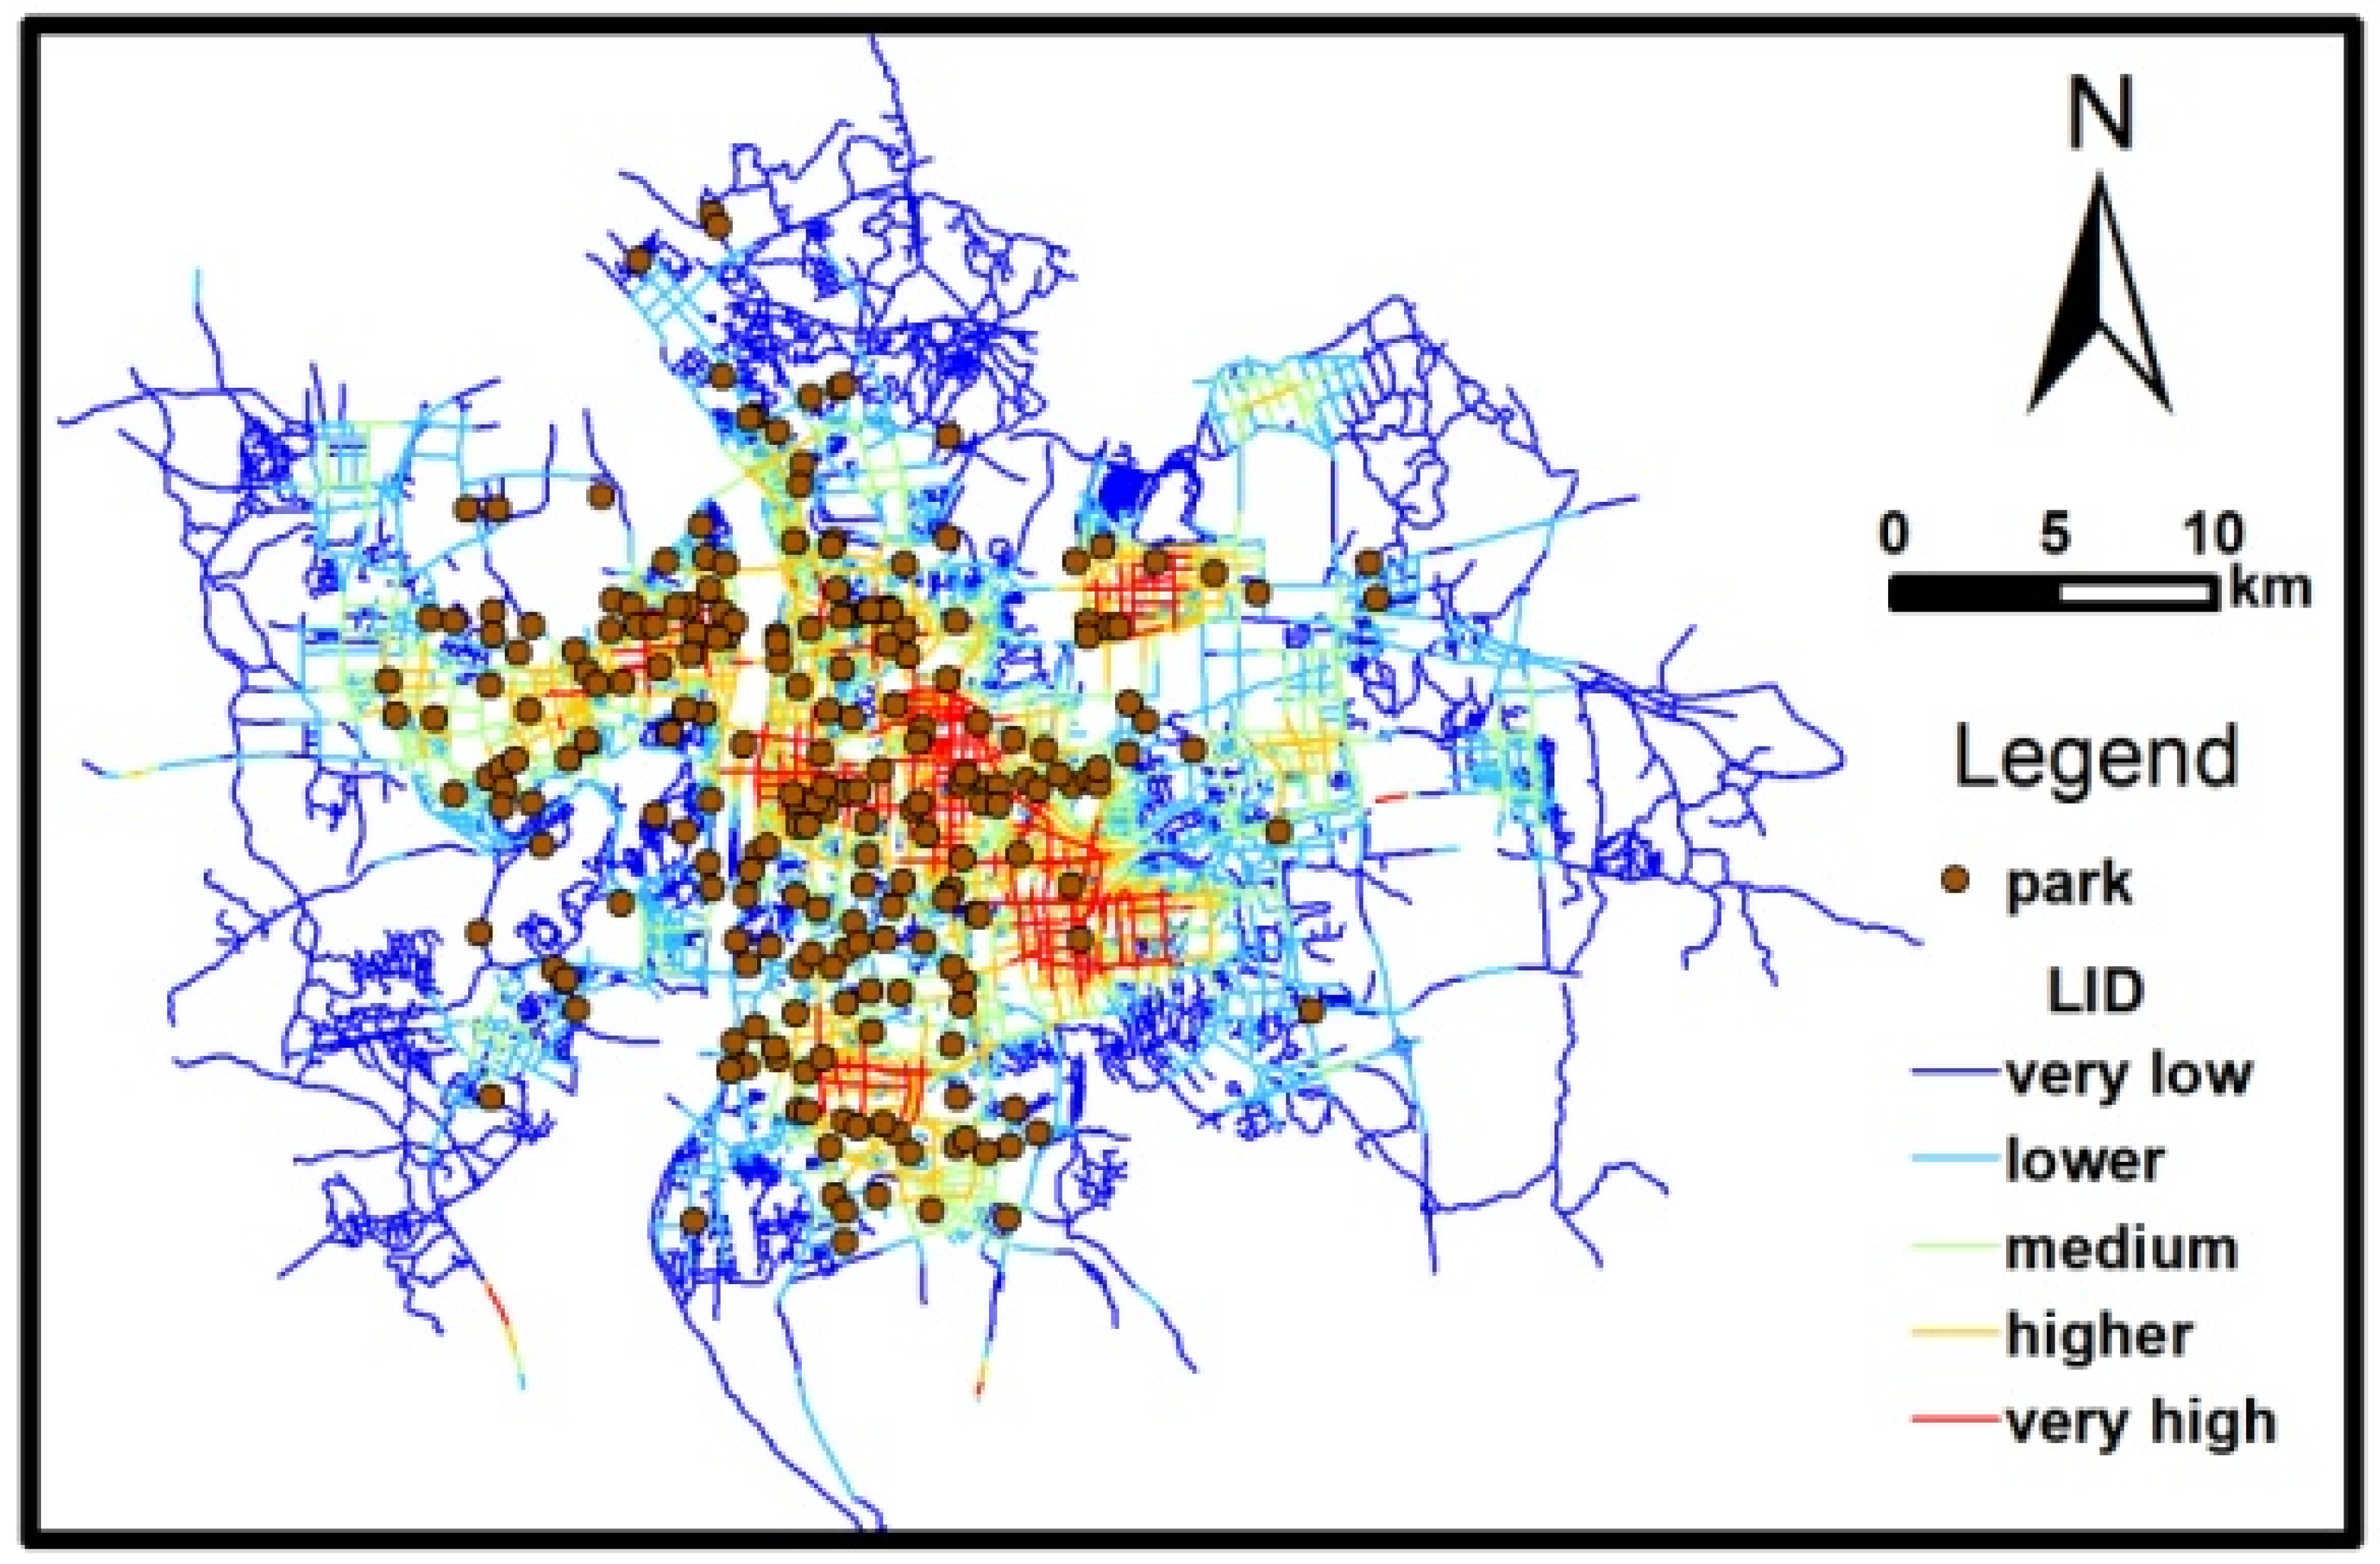
3.3. Urban Parks Local Accessibility Analysis

In this paper, the 3000 m radius local integration degree data with a relatively high synergy degree and smaller topological distance were selected to study the local accessibility of parks in the urban area of Changsha. Park distribution overlaid with road local integration degree was analyzed, as shown in Figure 6. The length of the roads with high local accessibility is 1,041,853.36 m, accounting for 20% of the road length of the study area; the overall local accessibility of the roads in the study area is low. Among them, Yuelu Avenue, Liuyanghe Avenue, Guihua Road, Laodong East Road, and the Second Ring Road and other global accessibility and local accessibility are at a high level. In this analysis, it is found that 95 parks are located near the sections with very high local integration degrees, such as the Xingsha ecological park, the National Botanical Forest Park, Yuehu Park, Lieshi Park, Shawang football park, Xuteli Park, Xingsha Cultural Park, Bafang Park, Xiaoyuan Park, Huahou New Citizen Park, Longping Central Park, etc. About 40% of the parks have high local accessibility, and about 33% of the parks’ global and local accessibilities are very high.

3.4. Urban Park Psychological Accessibility Analysis

We calculated the road global selection degree and total depth by using DepthMap to obtain Figure 7 and Figure 8. According to Figure 7, the global selection degree value of some urban roads is significantly higher than that of other roads. They are North Second Ring Road, East Second Ring Road, Fuyuan Road Bridge, Yuelu Avenue, G319, South Second Ring Road, Xiangjiang Middle Road, Xiangfu Road Bridge, Laodong East Road, Wanjiali Middle Road, Beijing–Hong Kong–Macao Expressway, Changsha Avenue, Renmin East Road, Sanyi Avenue, Changsha Ring Expressway, Fuyuan East Road, etc. They are traveling priority roads for citizens to travel.
Figure 8 shows that roads with low depth value have fewer space transitions, and their nearby parks can attract more citizens to go. Composite index spatial efficiency [29] values were derived using global selection degree and global total depth; the spatial efficiency calculation formula of node i is given in Equation (6):
S i = l n E i + 1 l n T D i + 1
where E i and T D i represent the global selection degree and the total depth of road node i . The spatial distribution of the obtained spatial efficiency values is shown in Figure 9.
The mean value of road spatial efficiency in the study area was 1.1987, which is greater than one and indicates that the overall spatial efficiency of roads is good. The length of the roads with high statistical psychological accessibility was 1,812,826.98 m, accounting for 35% of the road length of the urban study area. Overlaid the spatial efficiency value distribution with the park distribution, extracted the parks near the higher psychological accessibility roads. There were 163 parks, which account for nearly 70% of the parks near the road sections with high spatial efficiency values. It shows that the overall spatial efficiency of the roads in the study area is good, most of the parks are located near the sections with higher spatial efficiency, the urban park space penetration is good and easily triggers the travel desire of the citizens, and the overall psychological accessibility is high.

4. Discussion

Urban Park green space is an important public service facility in the city. The measurement of the spatial accessibility of public service facilities needs to select appropriate accessibility evaluation factors according to the specific spatial layout objectives of different facilities and adopt appropriate measurement methods to expand the measurement [3]. At present, the research on the accessibility of urban parks mainly considers supply, demand side, and traffic conditions. For example, the supply conditions are considered through the scale, grade, facilities, and area of the park, and the demand is considered from the distribution of population, residential areas, and other points of interest (POIs) of urban facilities within the service scope, and the transportation convenience of people to reach the park is considered through traffic. The accessibility measurement method combining Baidu thermal diagram [32], LBS data [33,34], and other multi-source data has also emerged, and corresponding research results have been achieved. The spatial syntax method cannot take into account such factors as the scale, facilities, theme, grade, and distance from the residential area of the park itself, nor the impact of the number of people in the space served by the park, as well as the impact of psychological factors such as travel mode, travel intention, etc. brought by the impact of social role, economic status, physical health, etc. on the accessibility of the park, Therefore, we can consider combining the spatial grammar method with other methods to build a more complete park accessibility measurement model. For example, by combining spatial syntax with the gravity model, especially the dominant two-step floating catchment area method, the accessibility of parks can be considered not only from the topological relationship of the overall spatial layout but also from the relationship between supply and demand and distance attenuation of parks, so as to improve the accessibility evaluation model and make the accessibility measurement of parks more comprehensive.
At present, there are many studies on accessibility evaluation, but there are relatively few works in the literature on the importance and relationship of these evaluation factors and data for the park accessibility measurement [35,36,37], which can be carried out in the future. In addition to considering the socio-economic factors, we can also include the terrain factors in three-dimensional space, such as the height difference, slope, undulation, temperature, wind speed, sunshine, humidity, and other natural factors in the park, in the evaluation scope. At present, this paper has not analyzed the factors that cause the spatial difference in park accessibility, and we can further carry out such work in the future.
In addition, at present, more and more research not only focuses on the accessibility of park services but also on many other social benefits brought by park services, such as accessibility and public health [38,39,40], accessibility, and environmental justice [41]. Researchers found that urban parks reduce the risk of chronic diseases such as obesity and cardiovascular diseases by providing outdoor fitness venues [42]. At the same time, the farther away from the park, the lower the score of mental health indicators. In the study of accessibility and environmental fairness and justice, foreign researchers have focused on the differences and unfairness of ethnic differences in the enjoyment of services and facilities such as parks. In addition, researchers have also focused on the fairness of access to park services for vulnerable groups such as the elderly, the sick, the disabled, and the poor [43,44,45]. As Changsha has been awarded the title of “The Happiest City” in China for 15 consecutive years, the fairness and justice of the accessibility of urban parks are also worth our attention in the future.

5. Conclusions

This paper uses the basic theory of space syntax and the GIS spatial analysis method to evaluate the park accessibility in the Changsha urban area from four aspects of global accessibility, perceptual accessibility, local accessibility, and psychological accessibility.
It is found that the global accessibility of the road in the study area is high, but the local accessibility is low. However, the global accessibility, local accessibility, and psychological accessibility of urban parks in Changsha are relatively high because the distribution area of urban parks is consistent with the area with high global accessibility, local accessibility, and road spatial efficiency. It can be seen that road network accessibility based on space syntax is closely related to park accessibility, and when the streets where the parks are located are more integrated, the accessibility to the parks is also higher. This conclusion is consistent with that of the literature [46], and the application of space syntax can provide support for the research on park accessibility.
Secondly, the global spatial structure can be better perceived through the local spatial structure at the radius scale of 3000 m, and the perceptual accessibility of the parks is high. However, the synergy degree of global integration and local integration in the local area below 2000 m is not high, and the synergy degree below 500 m is very low, indicating that the order of the local road network system in the Changsha urban area needs to be improved to enhance the perceptual accessibility of the park. It is basically consistent with the analysis results in the work [17,47], which, respectively. adopted network analysis and statistical correlation methods. The radius of the optimal local accessibility measure obtained in this paper is 3000 m, but the data is variable according to the scope of the study area and the actual road network. For example, 3200 m is used in reference work [48], and 2000 m is used in reference work [49]. The data need to be obtained by testing according to the actual distribution pattern of the road network.
Furthermore, an urban park is one of the elements of urban space, and the layout of an urban park is affected by the overall spatial layout. Theoretically, the accessibility of urban parks is not only related to local areas but also related to the spatial layout of the whole study area. The space syntax is for investigating the accessibility of the overall layout and its local subspace through the topological relation. Other methods, such as the minimum distance method, buffer zone method, and network analysis method, usually set a certain threshold to control the service range of park accessibility. In contrast, space syntax can examine both local and global spatial layout influences at the same time. Secondly, the space syntax method can firstly quantify the difference in urban park accessibility in the overall spatial form from the perspective of topological relationships. In contrast to accessibility methods considering geometric metric features, it better describes the influence of the overall spatial layout relationship on accessibility, and the described spatial relationship is more stable. Therefore, the uncertainty of the results can be reduced. Thirdly, the quantitative index of accessibility evaluation constructed by space syntax reflects the meaning of global accessibility, perceptual accessibility, local accessibility, and psychological accessibility, which is relatively comprehensive. Lastly, the spatial syntax method only needs the road network data of the park’s green space and urban space to carry out the accessibility research. At present, there are spatial syntax tools combined with GIS software, such as the spatial syntax tool sDNA [50], that can be embedded in ArcGIS, which makes the accessibility evaluation based on spatial syntax relatively easier to implement. The spatial syntax can not only be used to evaluate the accessibility of parks but also can be used to evaluate and measure the accessibility of urban public facilities services such as medical care for the elderly, tourist attractions, primary and secondary schools, etc.

Author Contributions

Conceptualization, J.Q. and Y.L.; methodology, Y.L. and K.W.; formal analysis, Y.L. and K.W.; investigation, Y.W.; resources, Y.W. and Y.L.; data curation, Y.W.; writing—original draft preparation, Y.L. and Y.W.; writing—review and editing, J.Q. and Y.L.; visualization, Y.W. and Y.L.; funding acquisition, Y.L. and K.W. All authors have read and agreed to the published version of the manuscript.

Funding

This research was funded by the General Project of the Education Department of Hunan Province, grant number 20C0373, 21A0510 and 22C0500, the Natural Science Foundation of Hunan Province, grant number 2021JJ50155, 2022JJ40022 and 2023JJ50354.

Data Availability Statement

All data generated or analyzed during this study are included in this published article.

Acknowledgments

The authors would like to thank the anonymous reviewers for their constructive comments on improving this research.

Conflicts of Interest

The authors declare no conflict of interest.

References

  1. Tong, D.; Sun, Y.Y.; Xie, M.M. Evaluation of green space accessibility based on improved Gaussian two-step floating catchment area method: A case study of Shenzhen City, China. Prog. Geogr. 2021, 40, 1113–1126. [Google Scholar] [CrossRef]
  2. Zhang, J.G.; Zhao, B. Urban Park accessibility research progress and field dynamics. Mod. Urban Res. 2020, 35, 2–10. [Google Scholar]
  3. Song, Z.N.; Chen, W.; Zhang, G.X.; Zhang, L. Spatial Accessibility to Public Service Facilities and Its Measurement Approaches. Prog. Geogr. 2010, 29, 1217–1224. [Google Scholar]
  4. Nes, A.; Yamu, C. Introduction to Space Syntax in Urban Studies; Springer Nature Switzerland AG: Gewerbestrasse/Cham, Switzerland, 2021. [Google Scholar] [CrossRef]
  5. Vinodkumar, M. Exploring the levels of availability and access to open/green space and health outcomes: The case of Camden, London. In Proceedings of the 13th International Space Syntax Symposium (SSS 2022), Bergen, Norway, 20–24 June 2022; p. 536. [Google Scholar]
  6. Liu, X.T. General description of spatial accessibility. Urban Transp. China 2007, 5, 36–43. [Google Scholar]
  7. Liu, C.F.; Li, X.M.; Han, D. Accessibility analysis of urban parks: Methods and key issues. Acta Ecol. Sin. 2010, 30, 5381–5390. [Google Scholar]
  8. Chen, Q.X.; Hou, Y.; Wu, S. Assessment of accessibility to urban parks in Shaoxing city from the perspective of opportunity equity. Sci. Geogr. Sin. 2016, 36, 375–383. [Google Scholar]
  9. Dong, X.G.; Qiao, Q.H.; Zhai, L.; Sun, L.; Zhen, Y.P. Evaluating the accessibility of plaza park using the gravity model. J. Geo Inf. Sci. 2019, 21, 1518–1526. [Google Scholar]
  10. Xie, K.; Xu, H.; Wu, J. The accessibility of Nanjing urban park based on GIS. Open House Int. 2019, 44, 112–117. [Google Scholar] [CrossRef]
  11. Huang, Y.H.; Liu, X.P.; Liu, Y.P.; Zhang, H. Spatial and temporal accessibility analysis of urban parks based on Amap API by means of multiple transportation: A case study of Haizhu district in Guangzhou. Geogr. Geo-Inf. Sci. 2018, 34, 50–57. [Google Scholar]
  12. Hao, F.L.; Zhang, H.R.; Wang, S.J. Spatial accessibility of urban green space in central area of Changchun: An analysis based on the multi-trip model. Sci. Geogr. Sin. 2021, 41, 697–704. [Google Scholar]
  13. Wang, F.M.; Luo, C.; Liu, Y.A. Comparative Study on Accessibility of Urban Parks in Different Levels of Residential Areas in Mountain Cities. J. Southwest China Norm. Univ. Nat. Sci. Ed. 2021, 46, 164–171. [Google Scholar]
  14. Zhang, R.; Sun, F.Y.; Shen, Y.A.; Peng, S.J.; Che, Y. Accessibility of urban park benefits with different spatial coverage: Spatial and social inequity. Appl. Geogr. 2021, 135, 102555. [Google Scholar] [CrossRef]
  15. Li, Z.H.; Chen, H.; Yan, W. Exploring Spatial Distribution of Urban Park Service Areas in Shanghai Based on Travel Time Estimation: A Method Combining Multi-Source Data. ISPRS Int. J. Geo-Inf. 2021, 10, 608. [Google Scholar] [CrossRef]
  16. Shi, T.; Li, J.Y.; Li, Y.; Yin, H.Y. Analysis of urban park accessibility in Shenyang City. Chin. J. Ecol. 2016, 35, 1345–1350. [Google Scholar]
  17. Li, M. Study on the Accessibility and Service Level of Urban Park Green Space Based on GIS: A Case Study of Yuelu District of Changsha City. Geomat. World 2020, 27, 100–106+113. [Google Scholar]
  18. Ai, B.; Huang, W.; Li, Y.B. Spatial accessibility analysis of urban parks in typical karst area based on minimum cost of proximity: A case study of Guiyang City. Carsologica Sin. 2022, 41, 952–961. [Google Scholar]
  19. Zhao, Y.; Xu, F.; Wan, Y.L. Spatial accessibility and supply-demand balance analysis method of park green space based on modified gravity model. J. Geo-Inf. Sci. 2022, 24, 1993–2003. [Google Scholar]
  20. Chang, Z.; Chen, J.Y.; Li, W.F.; Li, X. Public transportation and the spatial inequality of urban park accessibility: New evidence from Hong Kong. Transp. Res. Part-D Transp. Environ. 2019, 76, 111–122. [Google Scholar] [CrossRef]
  21. Li, Y.M.; Xie, Y.L.; Sun, S.Q.; Hu, L.F. Evaluation of Park Accessibility Based on Improved Gaussian Two-Step Floating Catchment Area Method: A Case Study of Xi’an City. Buildings 2022, 12, 871. [Google Scholar] [CrossRef]
  22. Li, Z.M.; Fan, Z.X.; Song, Y.; Chai, Y.B. Assessing equity in park accessibility using a travel behavior-based G2SFCA method in Nanjing, China. J. Transp. Geogr. 2021, 96, 103179. [Google Scholar] [CrossRef]
  23. Hiller, B.; Hanson, J. The Social Logic of Space; Cambridge University Press: Cambridge, UK, 1984. [Google Scholar]
  24. Hillier, B. Studying cities to learn about minds: Some possible implications of space syntax for spatial cognition. Environ. Plan. B Plan. Des. 2010, 39, 12–32. [Google Scholar] [CrossRef]
  25. Hillier, B.; Leaman, A.; Stansall, P.; Bedford, M. Space syntax. Environ. Plan. B 1976, 3, 147–185. [Google Scholar] [CrossRef]
  26. Bafna, S. Space Syntax-A Brief Introduction to Its Logic and Analytical Techniques. Environ. Behav. 2003, 35, 17–29. [Google Scholar] [CrossRef]
  27. Cui, M.; Cao, R.L.; Jiang, W. The subway network topology analysis of Xi’an based on space syntax. J. Shanxi Univ. Sci. Technol. 2010, 28, 124–127. [Google Scholar]
  28. Wang, J.W.; Lei, Y.; Liang, Z. Research on the Accessibility of Multi-scale Urban Park based on Space Syntax. Huazhong Archit. 2013, 31, 74–77. [Google Scholar]
  29. Günaydın, A.S.; Yücekaya, M. The evaluation of the perceptibility and accessibility: The case of GAZIANTEP. ICONARP Int. J. Archit. Plan. 2020, 8, 480–497. [Google Scholar] [CrossRef]
  30. Zhao, Y.C.; Qin, M.L.; Shi, Q.Q. The accessibility analysis of urban park green space based on spatial syntax: Taking the central city of Guangzhou as an example. Geomat. World 2022, 29, 40–45. [Google Scholar]
  31. Hu, H.H.; An, H.N. Analysis of the spatial relationship between the road structure and tourist attractions in Harbin. J. Northwest Norm. Univ. Nat. Sci. 2018, 54, 89–97. [Google Scholar]
  32. Lyu, F.N.; Zhang, L. Using multi-source big data to understand the factors affecting urban park use in Wuhan. Urban For. Urban Green. 2019, 43, 126367. [Google Scholar] [CrossRef]
  33. Lin, Y.Y.; Zhou, Y.H.; Lin, M.S.; Wu, S.D.; Li, B.Y. Exploring the disparities in park accessibility through mobile phone data: Evidence from Fuzhou of China. J. Environ. Manag. 2021, 281, 111849. [Google Scholar] [CrossRef]
  34. Chen, J.Y.; Wang, C.; Zhang, Y.B.; Li, D. Measuring spatial accessibility and supply-demand deviation of urban green space: A mobile phone signaling data perspective. Front. Public Health 2022, 10, 1029551. [Google Scholar] [CrossRef] [PubMed]
  35. Pussel, P.; Li, L. Identification and assessment of the driving forces for the use of urban green parks and their accessibility in Colombo, Sri Lanka, through analytical hierarchical processing. Geospat. Health 2019, 14, 72–80. [Google Scholar] [CrossRef]
  36. Fan, Z.X.; Duan, J.; Lu, Y.; Zou, W.T.; Lan, W.L. A geographical detector study on factors influencing urban park use in Nanjing, China. Urban For. Urban Green. 2021, 59, 126996. [Google Scholar] [CrossRef]
  37. Mao, Z.X.; Wang, W.J.; Ren, Z.B.; Zhang, D.; He, X.Y. Recreational Attractiveness of Urban Parks and Implications for Their Management: A Case Study in Changchun, China. Chin. Geogr. Sci. 2022, 32, 456–466. [Google Scholar] [CrossRef]
  38. Zhao, P.F.; Zhao, Z.X.; Liao, C.; Fang, Y.; Liu, Y. Urban park accessibility and the mental health of older adults: A case study of Haidian District, Beijing. Leis. Stud. 2023, 42, 235–252. [Google Scholar] [CrossRef]
  39. Lai, S.Q.; Deal, B. Parks, Green Space, and Happiness: A Spatially Specific Sentiment Analysis Using Microblogs in Shanghai, China. Sustainability 2023, 15, 146. [Google Scholar] [CrossRef]
  40. Xiao, Y.; Miao, S.Y.; Zhang, Y.H.; Chen, H.S.; Wu, W.J. Exploring the health effects of neighborhood greenness on Lilong residents in Shanghai. Urban For. Urban Green. 2021, 66, 127383. [Google Scholar] [CrossRef]
  41. Zhang, L.; Chen, P.F.; Hui, F.M. Refining the accessibility evaluation of urban green spaces with multiple sources of mobility data: A case study in Shenzhen, China. Urban For. Urban Green. 2022, 70, 127550. [Google Scholar] [CrossRef]
  42. Muller, G.; Harhoff, R.; Rahe, C.; Berger, K. Inner-city green space and its association with body mass index and prevalent type 2 diabetes: A cross-sectional study in an urban German city. BMJ Open 2018, 8, e019062. [Google Scholar] [CrossRef]
  43. Yue, B.J.; Lin, A.W.; Sun, C. The analysis of low-income people’s park green space accessibility based on 2SFCA in Wuhan. Mod. Urban Res. 2017, 31, 99–107. [Google Scholar]
  44. Perry, M.A.; Devan, H.; Fitzgerald, H.; Han, K.; Liu, L.T.; Rouse, J. Accessibility and usability of parks and playgrounds. Disabil. Health J. 2018, 11, 221–229. [Google Scholar] [CrossRef]
  45. Biernacka, M.; Laszkiewicz, E.; Kronenberg, J. Park availability, accessibility, and attractiveness in relation to the least and most vulnerable inhabitants. Urban For. Urban Green. 2022, 73, 127585. [Google Scholar] [CrossRef]
  46. Huang, B.X.; Chiou, S.C.; Li, W.Y. Accessibility and Street Network Characteristics of Urban Public Facility Spaces: Equity Research on Parks in Fuzhou City Based on GIS and Space Syntax Model. Sustainability 2020, 12, 3618. [Google Scholar] [CrossRef]
  47. Xianyu, Y.Y. Research on Planning and Design of Changsha Community Park under the Guidance of the Concept of “Microcirculation”. Master’s Thesis, Hunan University, Changsha, China, 2021. [Google Scholar]
  48. Fu, Y.F.; Yang, F.; Bao, Z.Y. Research on Accessibility of Hangzhou Comprehensive Parks Based on Spatial Syntax and LBS Big Data. Landsc. Archit. 2021, 28, 69–75. [Google Scholar]
  49. Sun, Y.T. Study on Accessibility of Wuhan Comprehensive Parks Based on Space Syntax. Master’s Thesis, Huazhong Agriculture University, Wuhan, China, 2015. [Google Scholar]
  50. Li, Q.; Peng, K.L.; Cheng, P. Community-Level Urban Green Space Equity Evaluation Based on Spatial Design Network Analysis (sDNA): A Case Study of Central Wuhan, China. Int. J. Environ. Res. Public Health 2021, 18, 10174. [Google Scholar] [CrossRef] [PubMed]
Figure 1. Relationship graph of space configurations (a) Example of the space configurations (b) The J graph when node 5 is the observation point (c) The J graph when node 10 is the observation point.
Land 12 01061 g001
Figure 2. The administrative division of Changsha City and the study area scope.
Land 12 01061 g002
Figure 3. The map of the parks and roads in the study area, (a) the distribution of park surface and the administrative street zoning; (b) the distribution of park points and the road network.
Land 12 01061 g003
Figure 4. Spatial distribution of road global integration degree (GID) and parks.
Land 12 01061 g004
Figure 5. Spatial distribution of roads global connectivity degree (GCD).
Land 12 01061 g005
Figure 6. Overlay map of road local integration degree (LID) and park distribution.
Land 12 01061 g006
Figure 7. The spatial distribution of road global choice (GC)degree.
Land 12 01061 g007
Figure 8. The spatial distribution of road global total depth (GTD).
Land 12 01061 g008
Figure 9. The spatial distribution of road spatial efficiency (SE).
Land 12 01061 g009
Table 1. Synergy degree of global and local integration degree.
Radius (meter)Synergy DegreePerceptual Accessibility Characteristics
5000.392The synergy degree of road space is low, the road structure around the park is not easy to be recognized, and the parks perceptual accessibility around the road is low
20000.553The synergy degree of the road space is medium, the road structure around the park can be recognized, and the parks perceptual accessibility around the road is medium
30000.665The synergy degree of the road space is high, the road structure around the park is clear and easy to recognize, and the parks perceptual accessibility around the road is high
50000.722The synergy degree of the road space is higher, the road structure around the park is easier to recognize, and the parks perceptual accessibility around the road is higher
10,0000.760The synergy degree of the road space is very high, the road structure around the park is easier to recognize, and the parks perceptual accessibility around the road is very high
Disclaimer/Publisher’s Note: The statements, opinions and data contained in all publications are solely those of the individual author(s) and contributor(s) and not of MDPI and/or the editor(s). MDPI and/or the editor(s) disclaim responsibility for any injury to people or property resulting from any ideas, methods, instructions or products referred to in the content.

