

Review of Land Use Change Detection—A Method Combining Machine Learning and Bibliometric Analysis

1
School of Geomatics, Liaoning Technical University, Fuxin 123000, China
2
Key Laboratory of Land Surface Pattern and Simulation, Institute of Geographic Sciences and Natural Resources Research, Chinese Academy of Sciences, Beijing 100101, China
3
Hebei Collaborative Innovation Center for Urban-Rural Integration Development, Shijiazhuang 050061, China
4
Jiangsu Real Estate Development Center, Nanjing 210024, China
5
Land Consolidation and Rehabilitation Center, Ministry of Natural Resources, Beijing 100035, China
*
Author to whom correspondence should be addressed.
Land 2023, 12(5), 1050; https://doi.org/10.3390/land12051050
Submission received: 20 April 2023
/
Revised: 10 May 2023
/
Accepted: 10 May 2023
/
Published: 11 May 2023
(This article belongs to the Special Issue Land Use Change and Anthropogenic Disturbances: Relationships, Management, and Policies)
Abstract
:Land use change detection (LUCD) is a critical technology with applications in various fields, including forest disturbance, cropland changes, and urban expansion. However, the current review articles on LUCD tend to be limited in scope, rendering a comprehensive review challenging due to the vast number of publications. This paper systematically reviewed 3512 articles retrieved from the Web of Science Core database between 1985 and 2022, utilizing a combination of bibliometric analysis and machine learning methods with LUCD as the main focus. The results indicated an exponential increase in the number of LUCD studies, indicating continued growth in this research field. Commonly used methods include classification-based, threshold-based, model-based, and deep learning-based change detection, with research themes encompassing forest logging and vegetation succession, urban landscape dynamics, and biodiversity conservation and management. To build an intelligent change detection system, researchers need to develop a flexible framework that integrates data preprocessing, feature extraction, land use type interpretation, and accuracy evaluation, given the continuous evolution and application of remote sensing data, deep learning, big data, and artificial intelligence.
1. Introduction
Land use and land cover (LULC) are fundamental topics in global change research, serving as the basis for human survival and development [1]. Changes in land use at various scales have significant impacts on land cover, which is crucial for research on global climate change, ecological environment monitoring, and related fields [2]. Change detection involves identifying differences in the state of an object or phenomenon over time, providing an accurate reflection of changes that occur over an extended period [3]. The timely and precise detection of changes in global land use/cover is closely linked to various aspects of global change, facilitating a better understanding of the relationship between humans and natural phenomena and better resource management and utilization [4,5,6,7].
Remote sensing (RS) is the primary means of LUCD [8], allowing for the analysis of changes in land use characteristics and processes by applying datasets from different time periods and covering large areas. RS imagery offers several advantages, such as broad coverage, long coverage periods, and relatively convenient data processing, making it a major data source for detecting land use changes over recent decades [9,10,11]. Several remote sensing satellites have been launched, providing datasets with different time and spatial resolutions. The Landsat series, which was launched by the United States in 1972 and increased the satellite image resolution to 30 m in 1982 with Landsat−4, has become one of the main data sources for researchers to detect changes in land use [12]. Other remote sensing satellites, such as the moderate-resolution imaging spectroradiometer (MODIS) and advanced very high-resolution radiometer (AVHRR), have also been widely used due to their advantages of large coverage area and high temporal resolution. Time-series datasets extracted from these satellites, such as the normalized difference vegetation index (NDVI), are important data sources for detecting vegetation changes and extracting cultivated land information [13]. In recent years, Sentinel−2, Landsat−8, and synthetic aperture radar mounted on uncrewed aerial vehicles have been increasingly used thanks to their higher temporal and spatial resolutions and faster revisit periods, driving the rapid development of technology for LUCD [14,15,16].
The emergence of multi-platform, multi-sensor, and multi-source remote sensing images, along with the increasing complexity of land use/cover change types, has led to the development of various LUCD techniques, such as classification-based change detection [17], time-series change detection [18], model-based change detection [19,20], and deep learning-based change detection [21,22]. While monitoring changes in Earth’s surface features is crucial, different authors often reach varying conclusions due to the dependence of change detection techniques on the data source and the landscape and environment of the study area, as well as various complex factors [9,23,24]. Existing literature reviews primarily focus on the research on LUCD techniques without providing a comprehensive analysis of the theme, current situation, and future development trends of change detection [25].
Bibliometrics is a valuable tool for analyzing scientific research progress by quantifying information related to a specific research topic in online citation databases. This tool identifies authors, publication quantities, and research institutions involved in the field, helping to identify key literature, provide keywords, and quantify the current status and future trends of research topics [26,27]. HistCite [28], SATI [29], and CiteSpace [30] are some common bibliometric analysis tools. Bibliometrix, an open-source tool developed by Massimo Aria in 2017 [31], offers more literature information analysis and result visualization functions and can import and convert data from multiple database sources, such as Web of Science, Scopus, Dimensions, and Lens [32]. In geography-related fields, many scholars use Bibliometrix to perform quantitative analyses of literature. Xie et al. [33] employed data mining and quantitative analysis to investigate research papers related to land degradation from 1990 to 2019 in the Web of Science Core Collection database to reveal the current research status of global land degradation and to assess future research directions. Xu et al. [34] conducted a bibliometric analysis of land consolidation literature from the Web of Science Core Collection database from 2000 to 2020, aiming to identify the historical development, evolutionary trajectory, and future trends of this theme. However, the manual selection of research literature by expert knowledge remains a disadvantage of bibliometrics, as this process is time-consuming, labor-intensive, and may miss potentially related studies, leading to narrow searches [35]. In cases where the literature growth rate outpaces the available time for manual review, it may not be possible to conduct a comprehensive search of the field [36].
To streamline the process of screening potentially relevant literature in the field of LUCD, this study employed a machine learning algorithm combined with bibliometric analysis. Specifically, the machine learning algorithm was used to select relevant literature, followed by a comprehensive analysis and evaluation of LUCD-related publications in the Web of Science Core Collection from 1985 to 2022 using the Bibliometrix R package. This study aimed to answer the following research questions: (1) What is the trend in scientific literature production on LUCD? (2) How have the journals, countries, and institutions involved in LUCD research evolved? (3) What are the current research topics and hotspots in this field, and how have they developed over time? (4) What are the potential future research directions in this field?
2. Data Collection and Cleaning
2.1. Data Sources
The Web of Science (WOS) Core Collection database was chosen as the search platform for this study due to its reputation as one of the largest and most comprehensive academic resource databases globally. With over 12,000 scientific journals across a range of fields, including natural sciences, computer science, biology, arts, and humanities, the database provides comprehensive coverage and high-quality indexed literature, making it an ideal source for retrieving a substantial number of relevant and high-quality literature entries for this study [37].
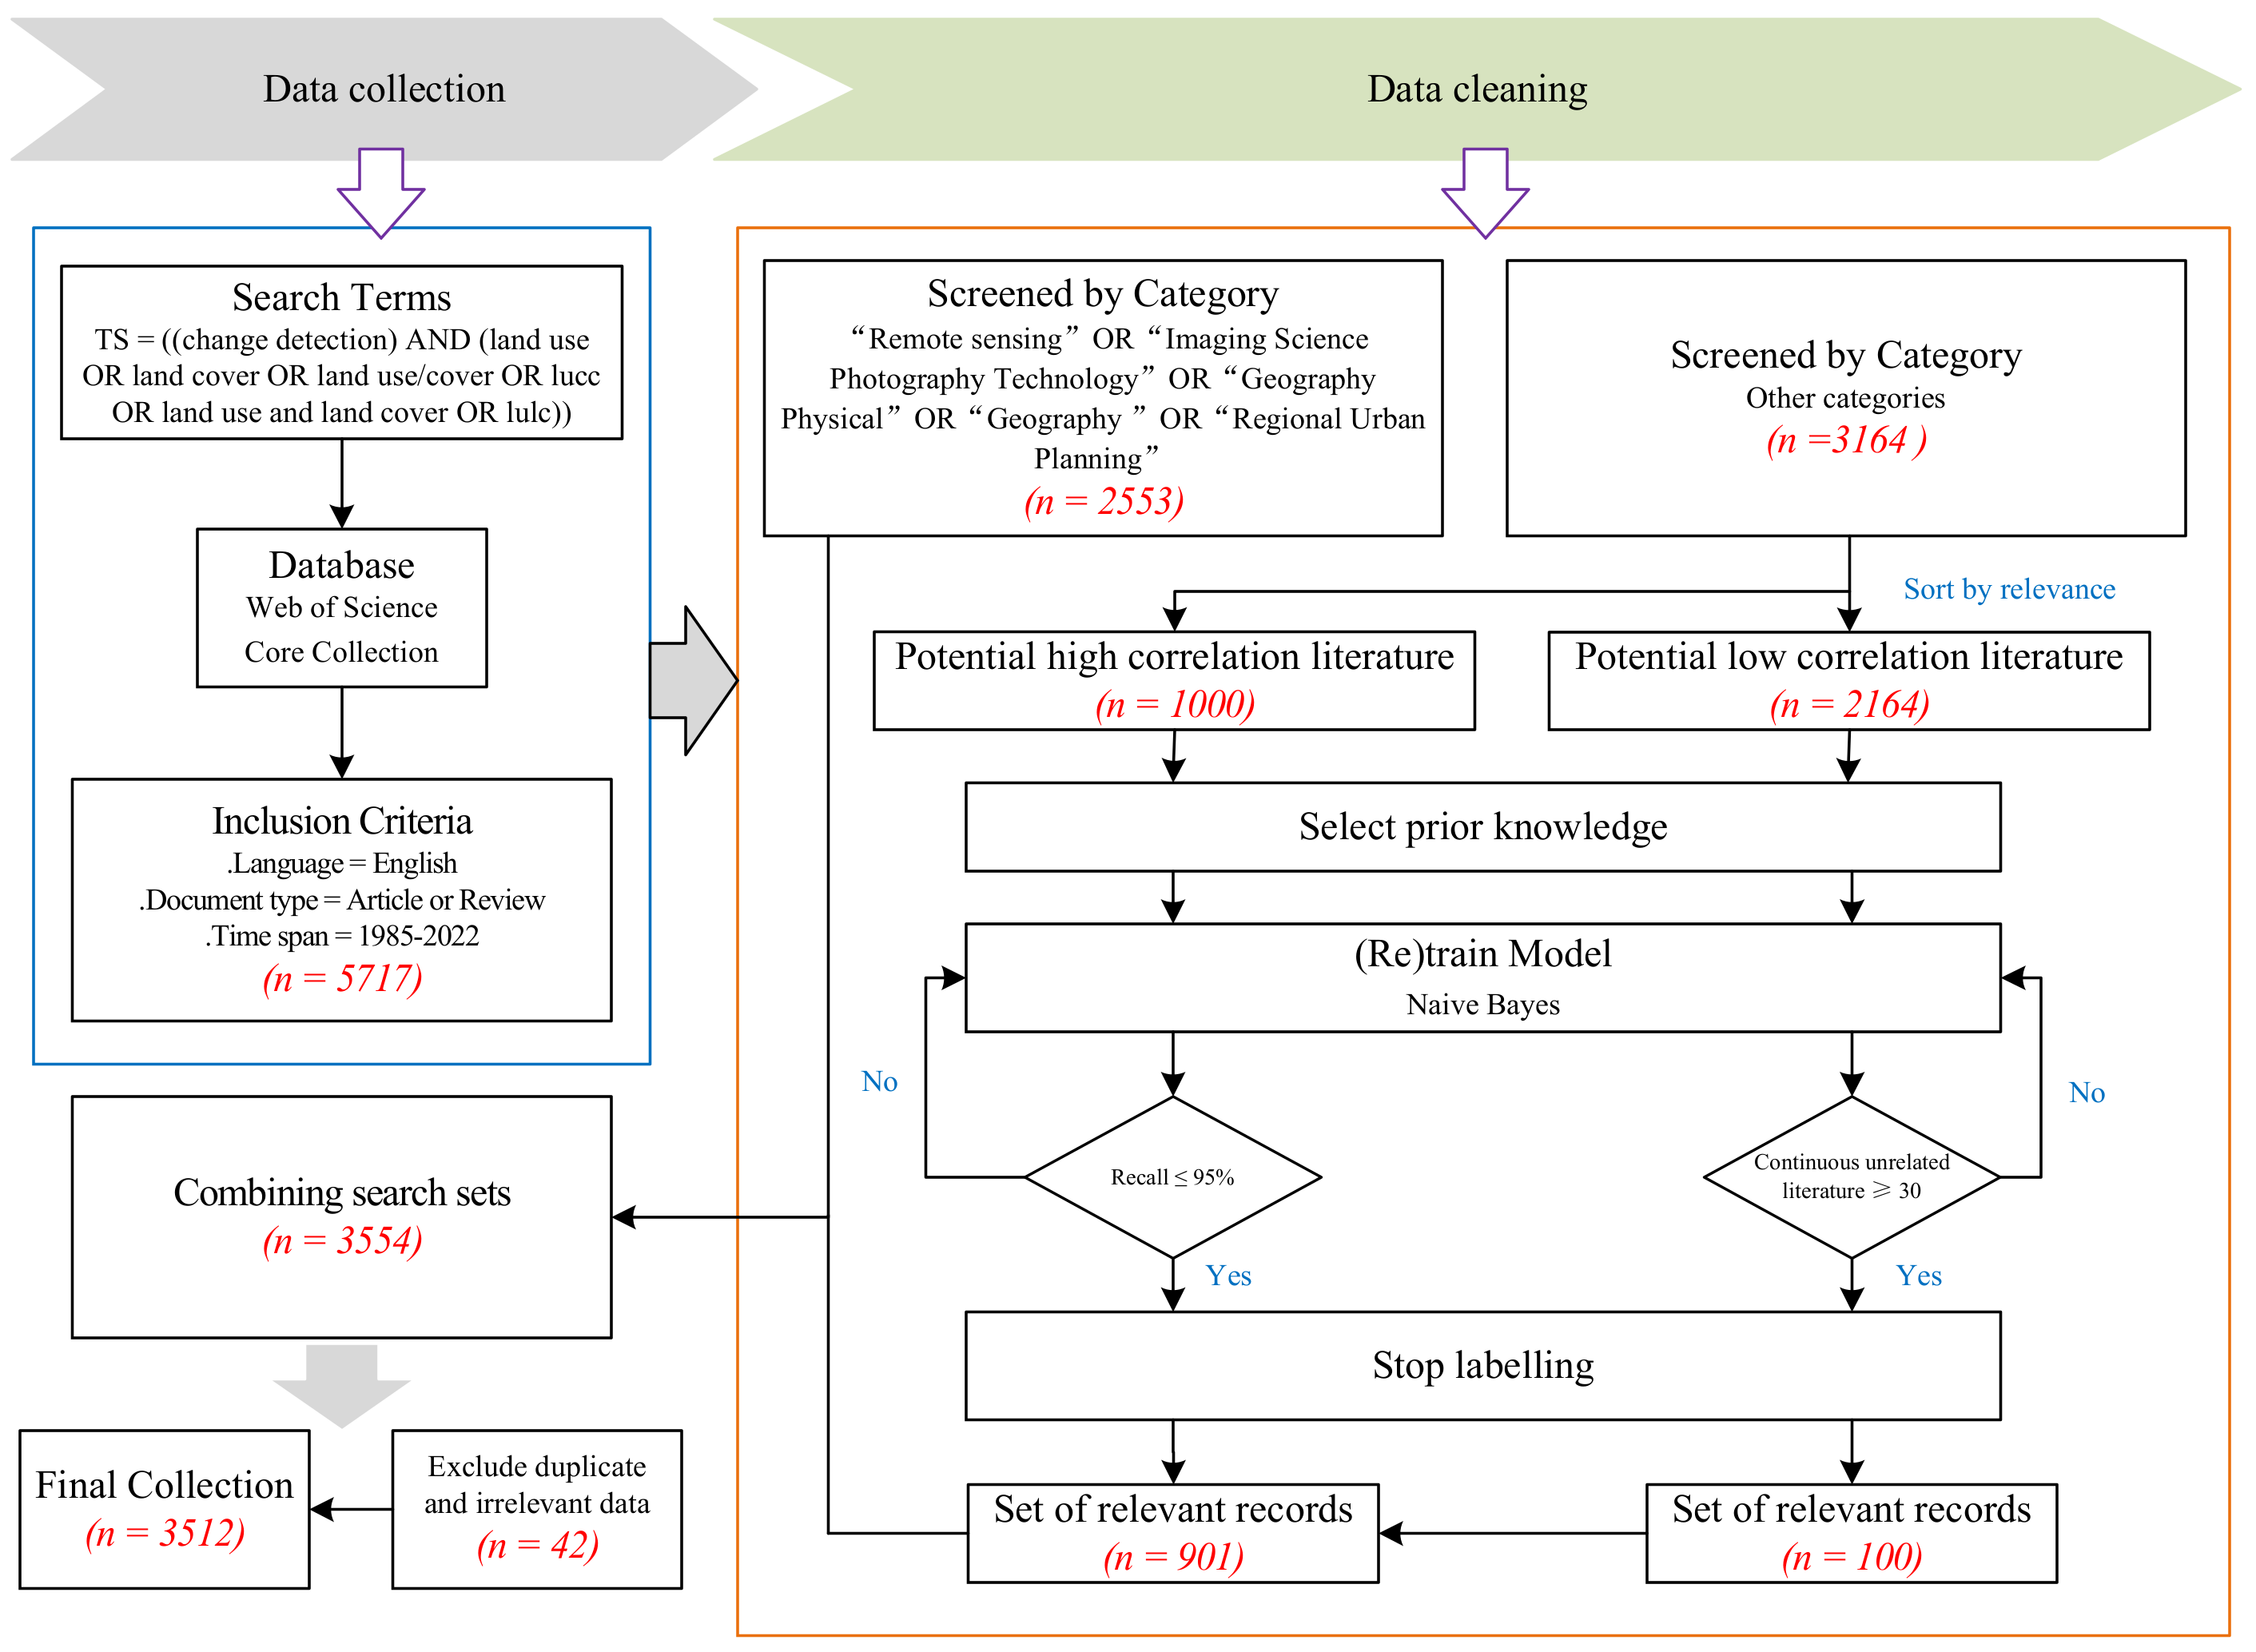
Based on our established search formula and restriction criteria, we conducted a search in the topic field (including title, abstract, author keywords, and keywords plus) of the Web of Science (WOS) core collection database on 22 December 2022, and we obtained a total of 5717 publications from the period of 1985 to 2022. We applied several filters to ensure the quality of the search results, including limiting the language to English and focusing only on document types such as “articles” and “review papers,” while excluding book chapters and editorial materials. These restrictions were put in place to ensure the relevance and reliability of the obtained literature. Our search formula, developed through repeated experimentation and expert consultation, used the terms TS = ((change detection) AND (land use OR land cover OR land use/cover OR lucc OR land use and land cover OR lulc)). To ensure that the literature search results were confined to the relevant disciplinary fields, we performed a data cleansing process, which is elaborated on in the following section. Subsequently, duplicate and irrelevant data were removed in Bibliometrix, resulting in 3512 publications that met the established criteria. The complete records and cited references were exported in “.txt” format. The entire data collection and cleaning process is illustrated in Figure 1.
2.2. Data Cleaning
To restrict the literature search results to the relevant disciplinary fields, we initially limited the search to five relevant disciplines, namely remote sensing, imaging science and photographic technology, geophysics, geography, and regional and urban planning categories in the WOS database. This approach yielded 2553 articles, but we found that many relevant papers were also published in interdisciplinary journals. Thus, we further expanded the search to include other disciplines, resulting in 3164 publications. We then employed machine learning algorithms to identify papers related to the research topic from this set of publications.
Naive Bayes (NB) is a widely used algorithm for text classification due to its speed and efficiency [38,39]. The algorithm calculates the probability of a data point belonging to a particular category using Bayes’ theorem, which assumes the independence of all features in the data point [40]. The formula for Bayes’ theorem is as follows:
where represents the data point, and represents the class that the data point belongs to.
is a constant given by the data and can be ignored. Assuming that the features in are independent, the probability of a class can be estimated as follows:
where represents the features from , and is the total number of features in . and are estimated directly from the data. Finally, the probabilities of the classes are normalized to sum up to 1, and the class with the highest probability is chosen as the final prediction.
The data cleaning process was conducted using ASReview, an open-source machine learning tool developed by van de Schoot et al. in 2021, which applies active learning to assist with the process [35]. The specific steps of the data cleaning process were as follows: First, the 3164 publications were uploaded into the ASReview software in RIS format, which contains metadata such as the title and abstract. Then, the authors used their expert knowledge to screen the titles and abstracts of the data records as prior knowledge and categorized them into two groups: “relevant” and “irrelevant”. When the number of “relevant” and “irrelevant” records reached five, the user could choose to perform a classification algorithm. These records were used to train the first model. After training, all articles in the database were sorted in order of “most relevant” to “least relevant”, and each record was presented to the authors one by one. The authors confirmed whether the record was “relevant” or “irrelevant”, and the algorithm was retrained based on this input. This entire training process was iterated, and the relevance ranking of the articles was continuously updated until the authors decided to stop confirmation.
The dynamic resampling data balancing strategy is a crucial step during the model training process, as the data of “relevant” and “not relevant” can be extremely unbalanced. In this study, we implemented this strategy by reducing the number of irrelevant records and increasing the number of relevant records through duplication, ensuring that the total number of records in the training data remained the same. We also used the default settings of the ASReview software for the remaining parameters, including TF-IDF feature extraction and a deterministic query strategy sampling. These default values were chosen based on their consistently high performance and low computation time in benchmark tests on multiple datasets [41].
The use of a data-driven combination stopping rule is a practical approach for balancing the risk of missing potentially relevant papers and the unnecessary cost of further reading irrelevant papers. In this study, we classified 3164 unidentified literature works into two categories based on WOS correlation ranking, and a target recall rate of 95% was set as the stopping criterion for the top 1000 papers classified as “potentially highly relevant papers” [36,42,43]. This ensured that a high percentage of relevant papers were included in the final dataset. For the remaining 2164 papers classified as “potentially low relevance papers”, a backup stopping criterion of screening for 30 consecutive papers labeled as “irrelevant” was used [44]. This allowed for a more efficient screening process and minimized the number of irrelevant papers that needed to be read. As a result, a total of 1001 papers related to LUCD were obtained in the interdisciplinary dataset.
3. Research Methodology
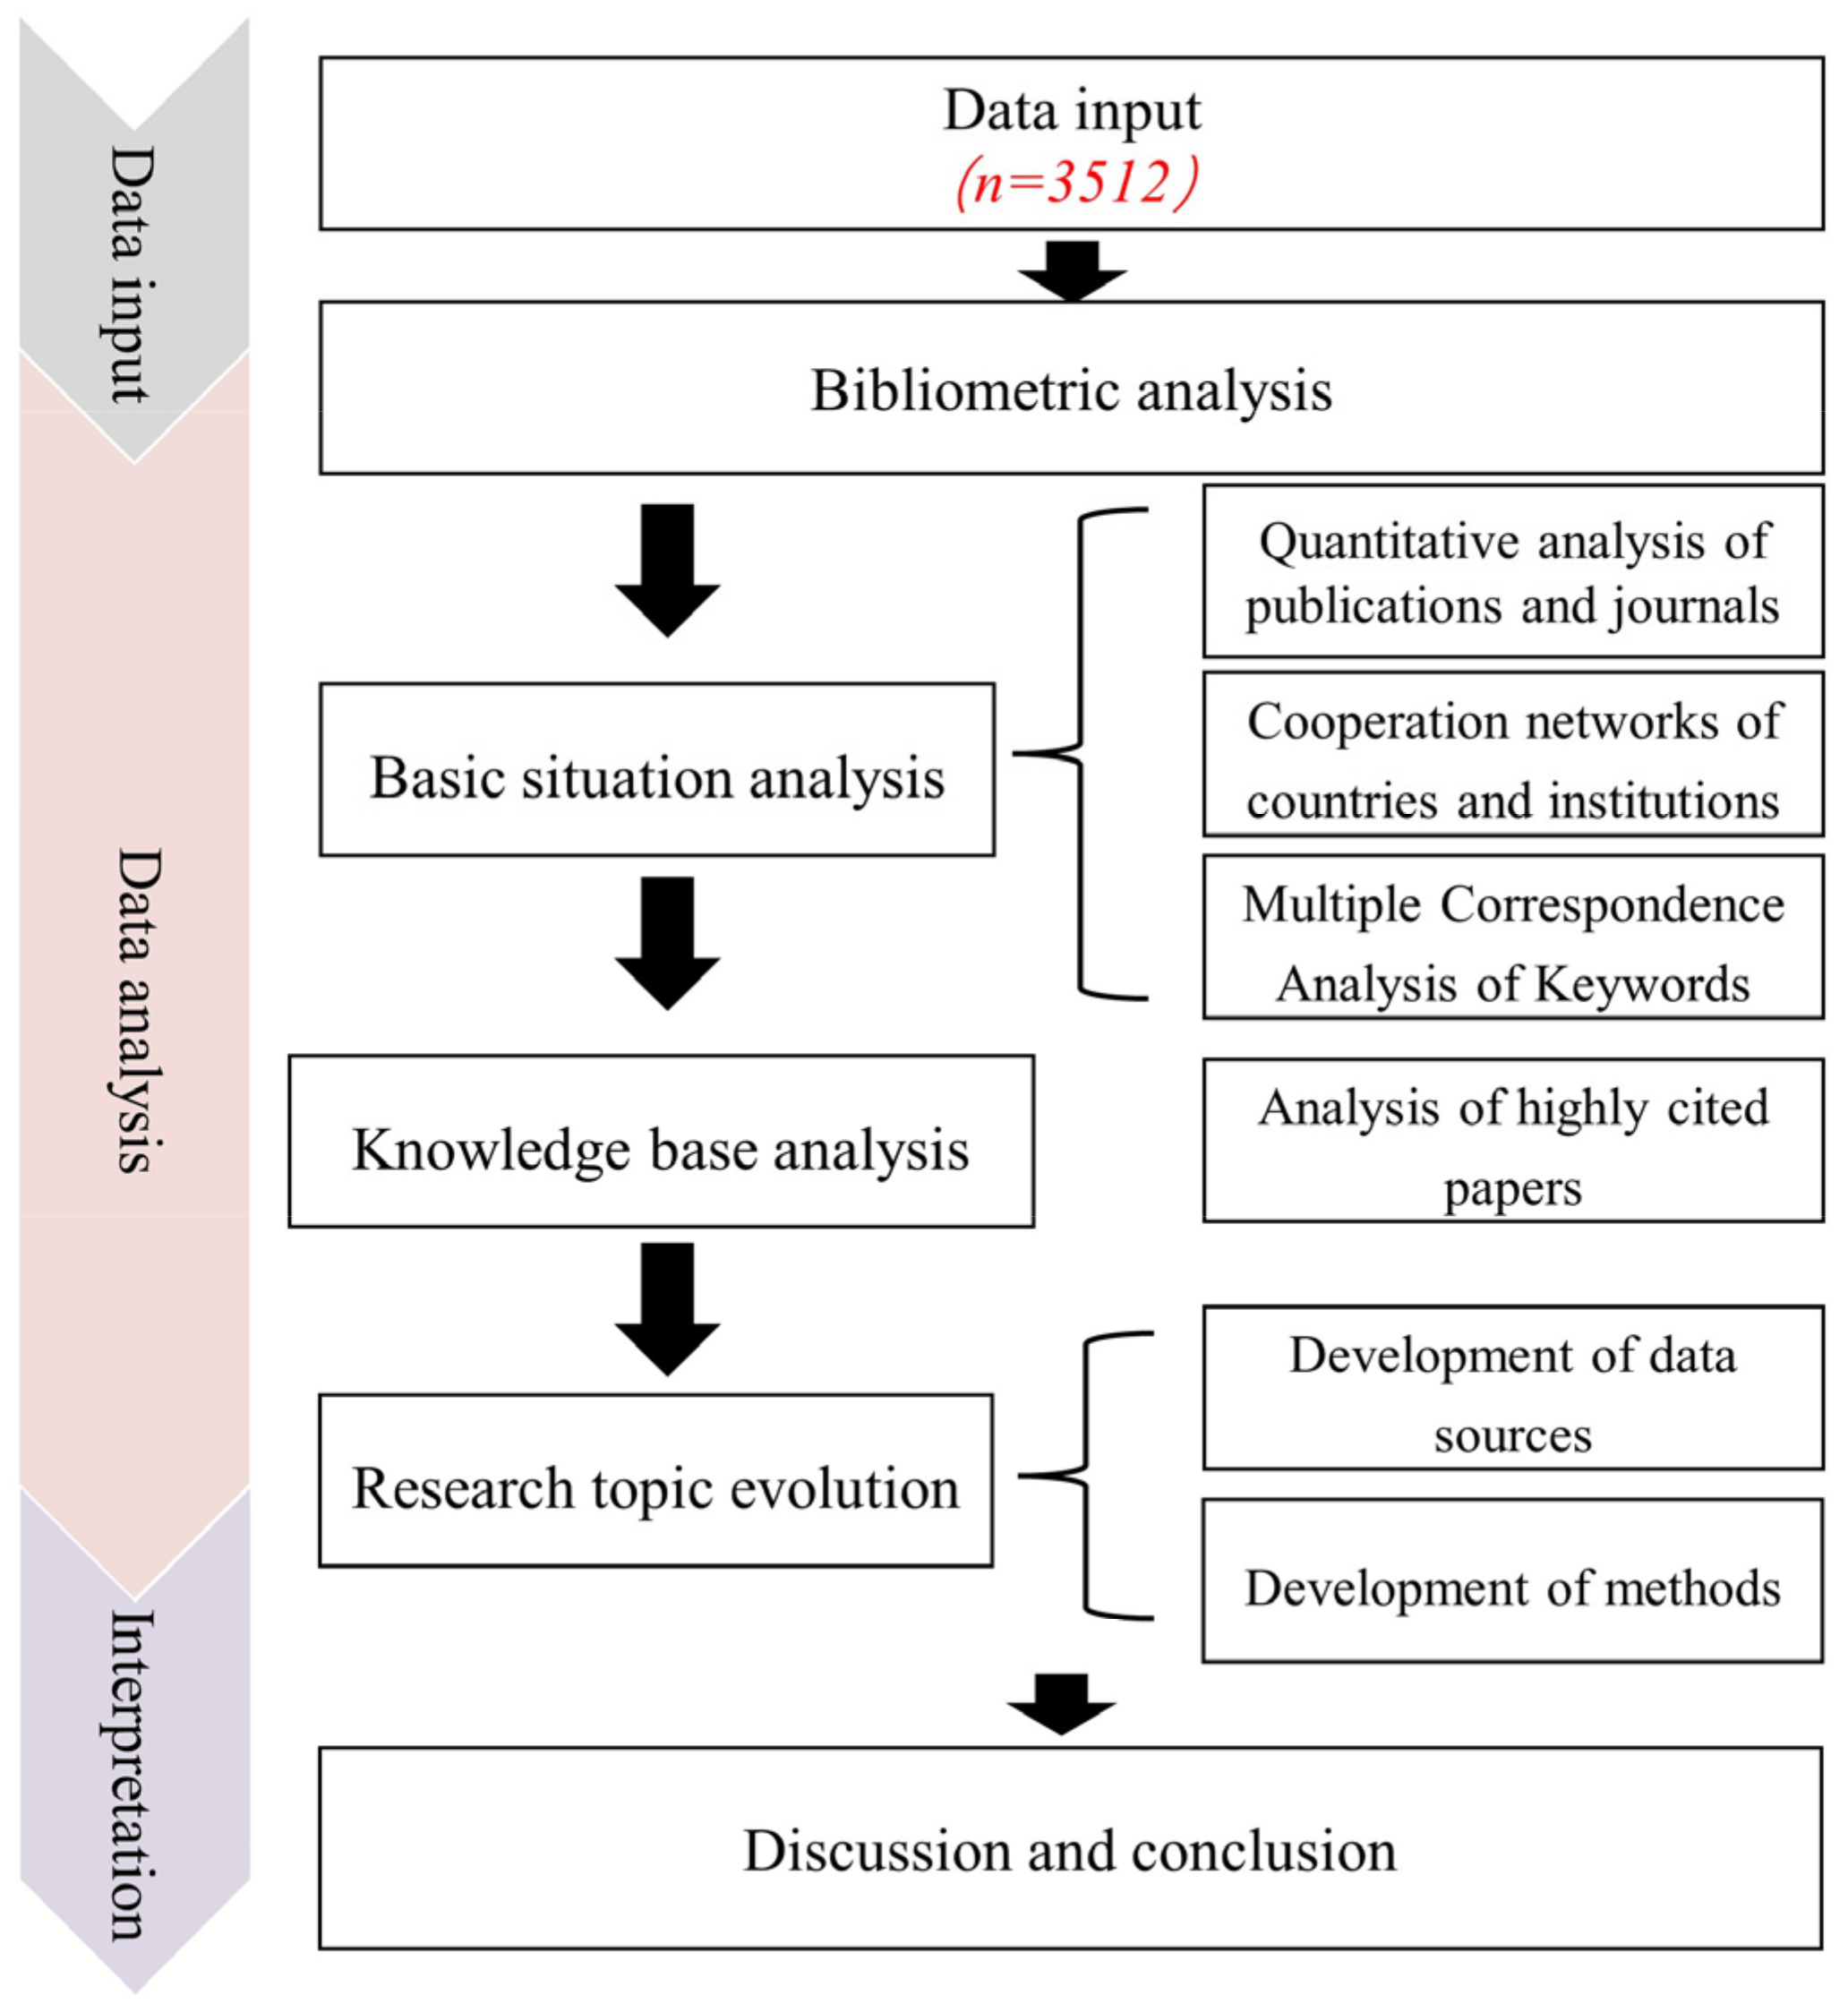
In order to analyze the research topic, current status, and trends of LUCD, we utilized Biblioshiny, a data analysis framework based on Bibliometrix that can be accessed online. Unlike Bibliometrix, which is operated through code commands, Biblioshiny utilizes the shiny package to encapsulate Bibliometrix’s core code and provides a range of statistical methods and visual charts to cater to the needs of researchers [31].
The research methods in the field of LUCD include three parts (Figure 2), namely basic situation analysis, knowledge base analysis, and thematic evolution analysis [45]. Basic situation analysis includes the quantitative analysis of publications and published journals, the analysis of cooperative networks of major research countries and institutions, and the multiple correspondence analysis of author keywords. The quantitative analysis of publications is to explore the changes in the number of publications and reveal the development history of LUCD [46]. By setting the node type to “country” and “institution” in Biblioshiny, a collaborative network analysis was conducted on the country and institution to clarify the distribution of research forces in the field of LUCD [47]. The author keywords are a concise summary of the author’s paper content, which can succinctly express the content of the paper [48]. By setting the node type of “author keywords” for multiple correspondence analysis, it can be used to identify research topics and hotspots in this field. Knowledge base analysis involves the analysis of highly cited papers, which can represent groundbreaking research achievements in this field and form a knowledge base for LUCD [46]. In order to visualize the evolution of research objects and methods in the field of LUCD, a Sankey of the evolution of research topics in this field over time was generated using the “conceptual structure” function in Biblioshiny, which was used to identify the forefront and hotspots of different development stages in this field [49].
4. Results
4.1. Analysis of the Number of Articles Issued and the Publishing Journal
4.1.1. Annual Trends in the Number of Publications
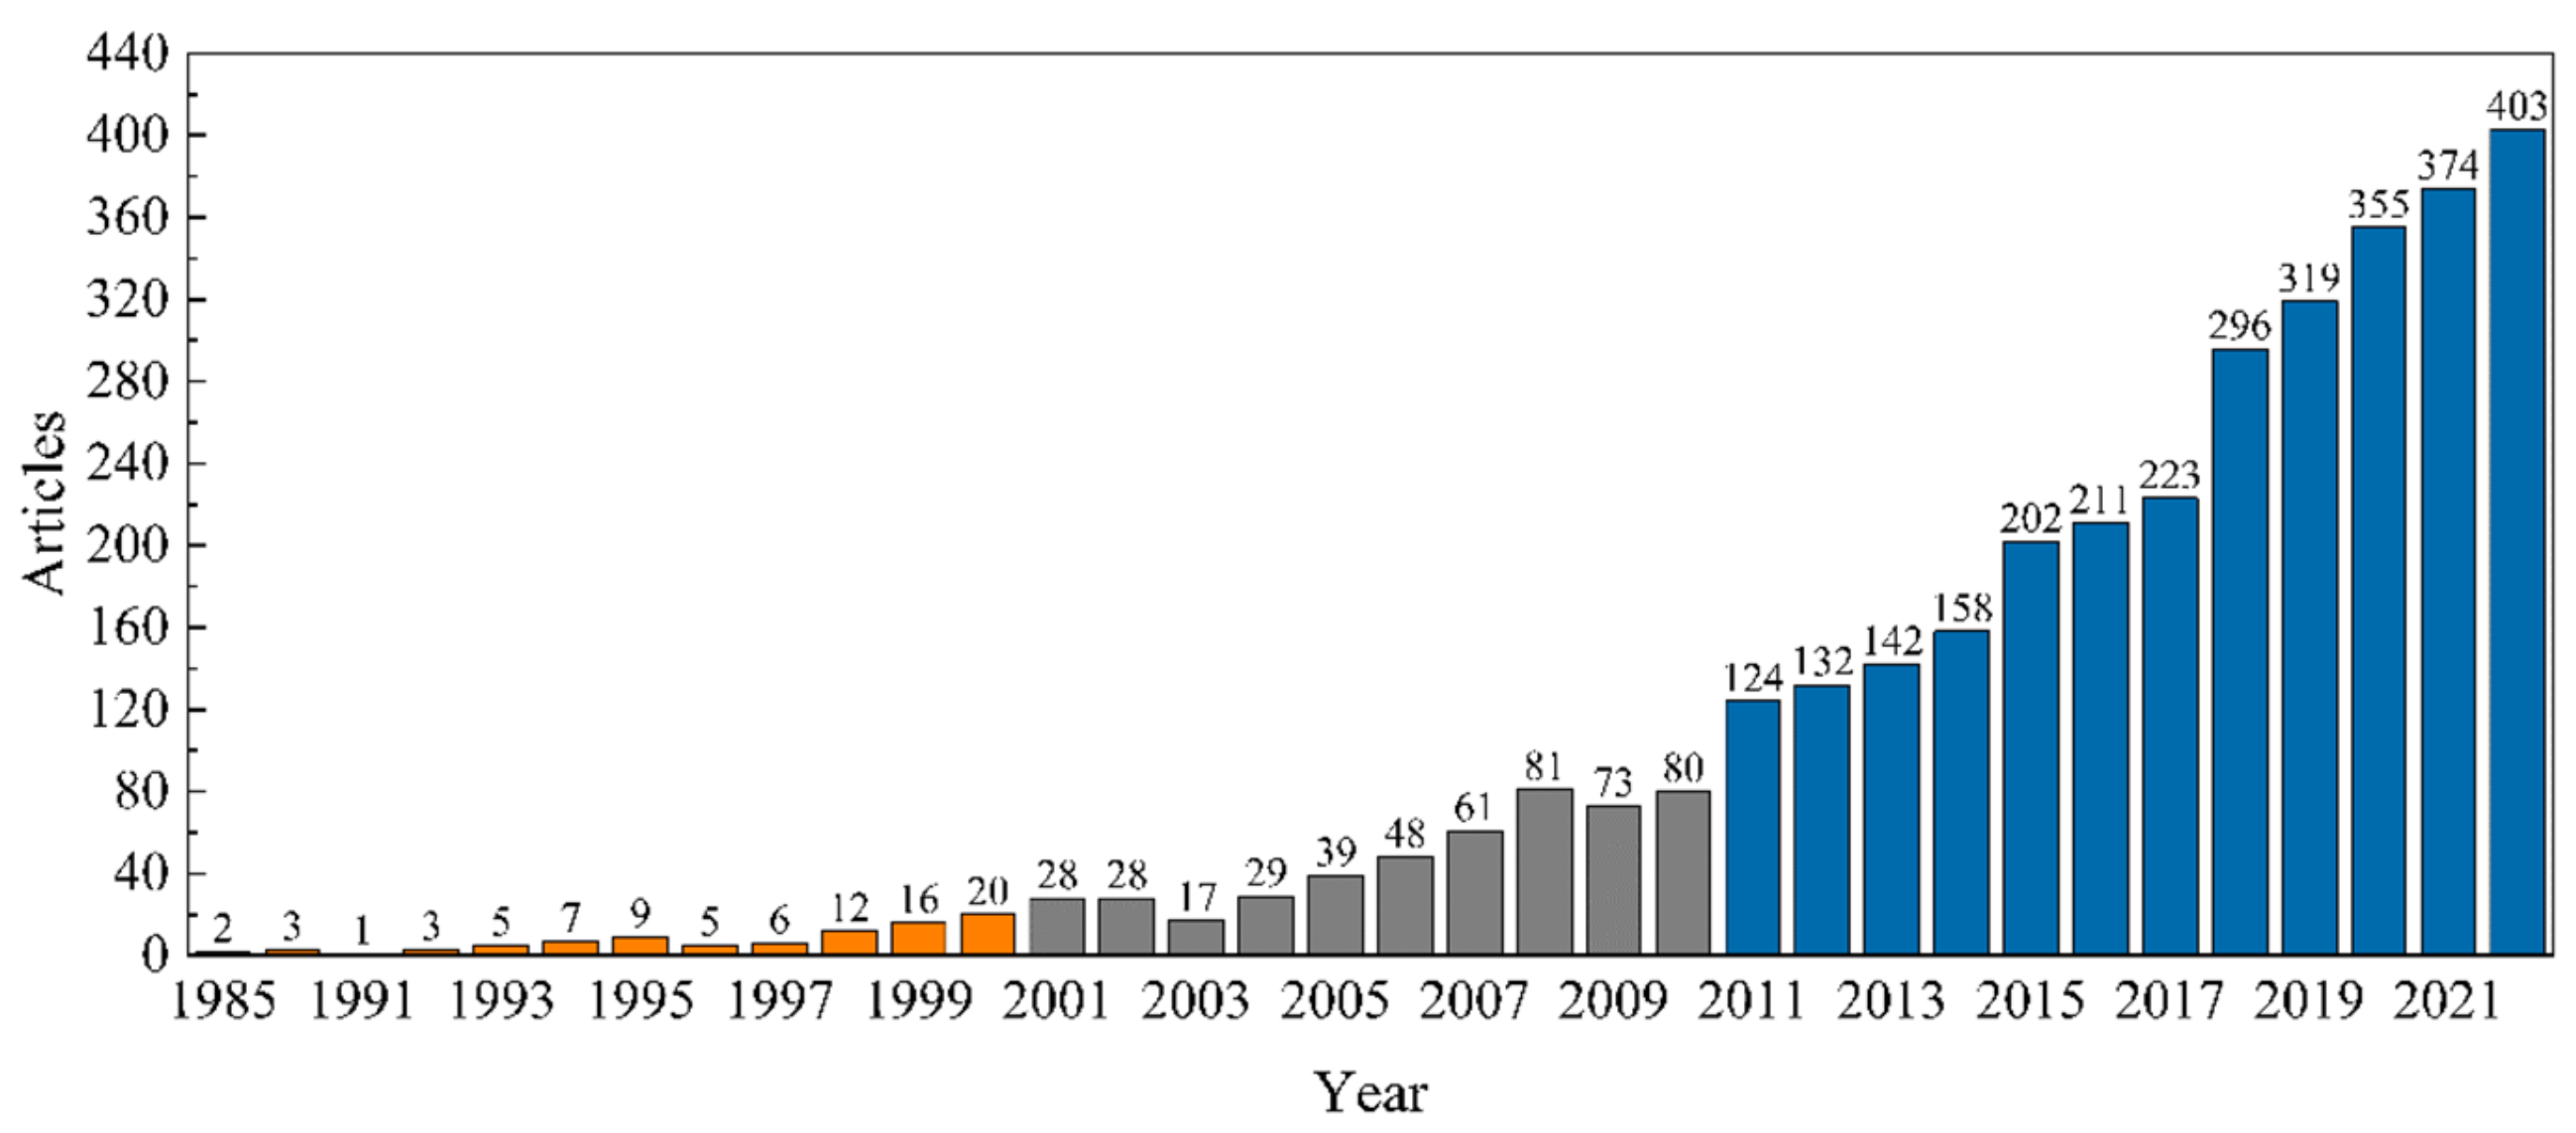
The analysis of the research history of LUCD began with a summary of the number of publications over the years (Figure 3). The period from 1985 to 2000 can be regarded as the embryonic stage of development. During this period, the number of publications in any year did not exceed 20, with a total of 89 publications. The publications in these 16 years only accounted for 2.5% of the total publications. The research content was relatively concentrated on the data sources and pre-processing of LUCD, such as image registration [50], radiometric correction [51], and their effects on change detection accuracy. The data sources for change detection mainly included SAR [52,53], AVHRR [54], and MODIS [55]. Although the number of publications during this period was not abundant, the development of different data sources laid the foundation for subsequent research.
During 2001 to 2010, there was a steady increase in publications related to LUCD, with an average of 48.4 papers published per year, accounting for 13.78% of the total publications during this period. This period was a period of rapid development in the field and was characterized by the emergence of high spatial resolution remote sensing data, such as Landsat MSS/TM and SPOT, which led to an increase in research on change detection technology [23]. The focus of research during this period was primarily on improving LUCD methods and combining multiple methods and multi-source remote sensing data for more accurate results [56,57,58].
In recent years, there has been a surge in publications related to LUCD, indicating an active stage of development in this field. Research papers published since 2011 accounted for a significant proportion of the total publications collected in this study, which was 83.68% of all publications. In the period from 2019 to 2022 alone, more than 300 papers were published each year. During this period, various research methods were employed, including classification-based change detection using dual image pairs or time-series data [59,60], object-oriented change detection [9,10], model-based change detection [19], and deep learning-based multi-temporal remote sensing image change detection [61,62]. The advancement of LUCD techniques can be attributed to the development of remote sensing, computer, and GIS technologies and to the improvement of the spatial resolution of data sources.
4.1.2. Analysis of Publishing Journals
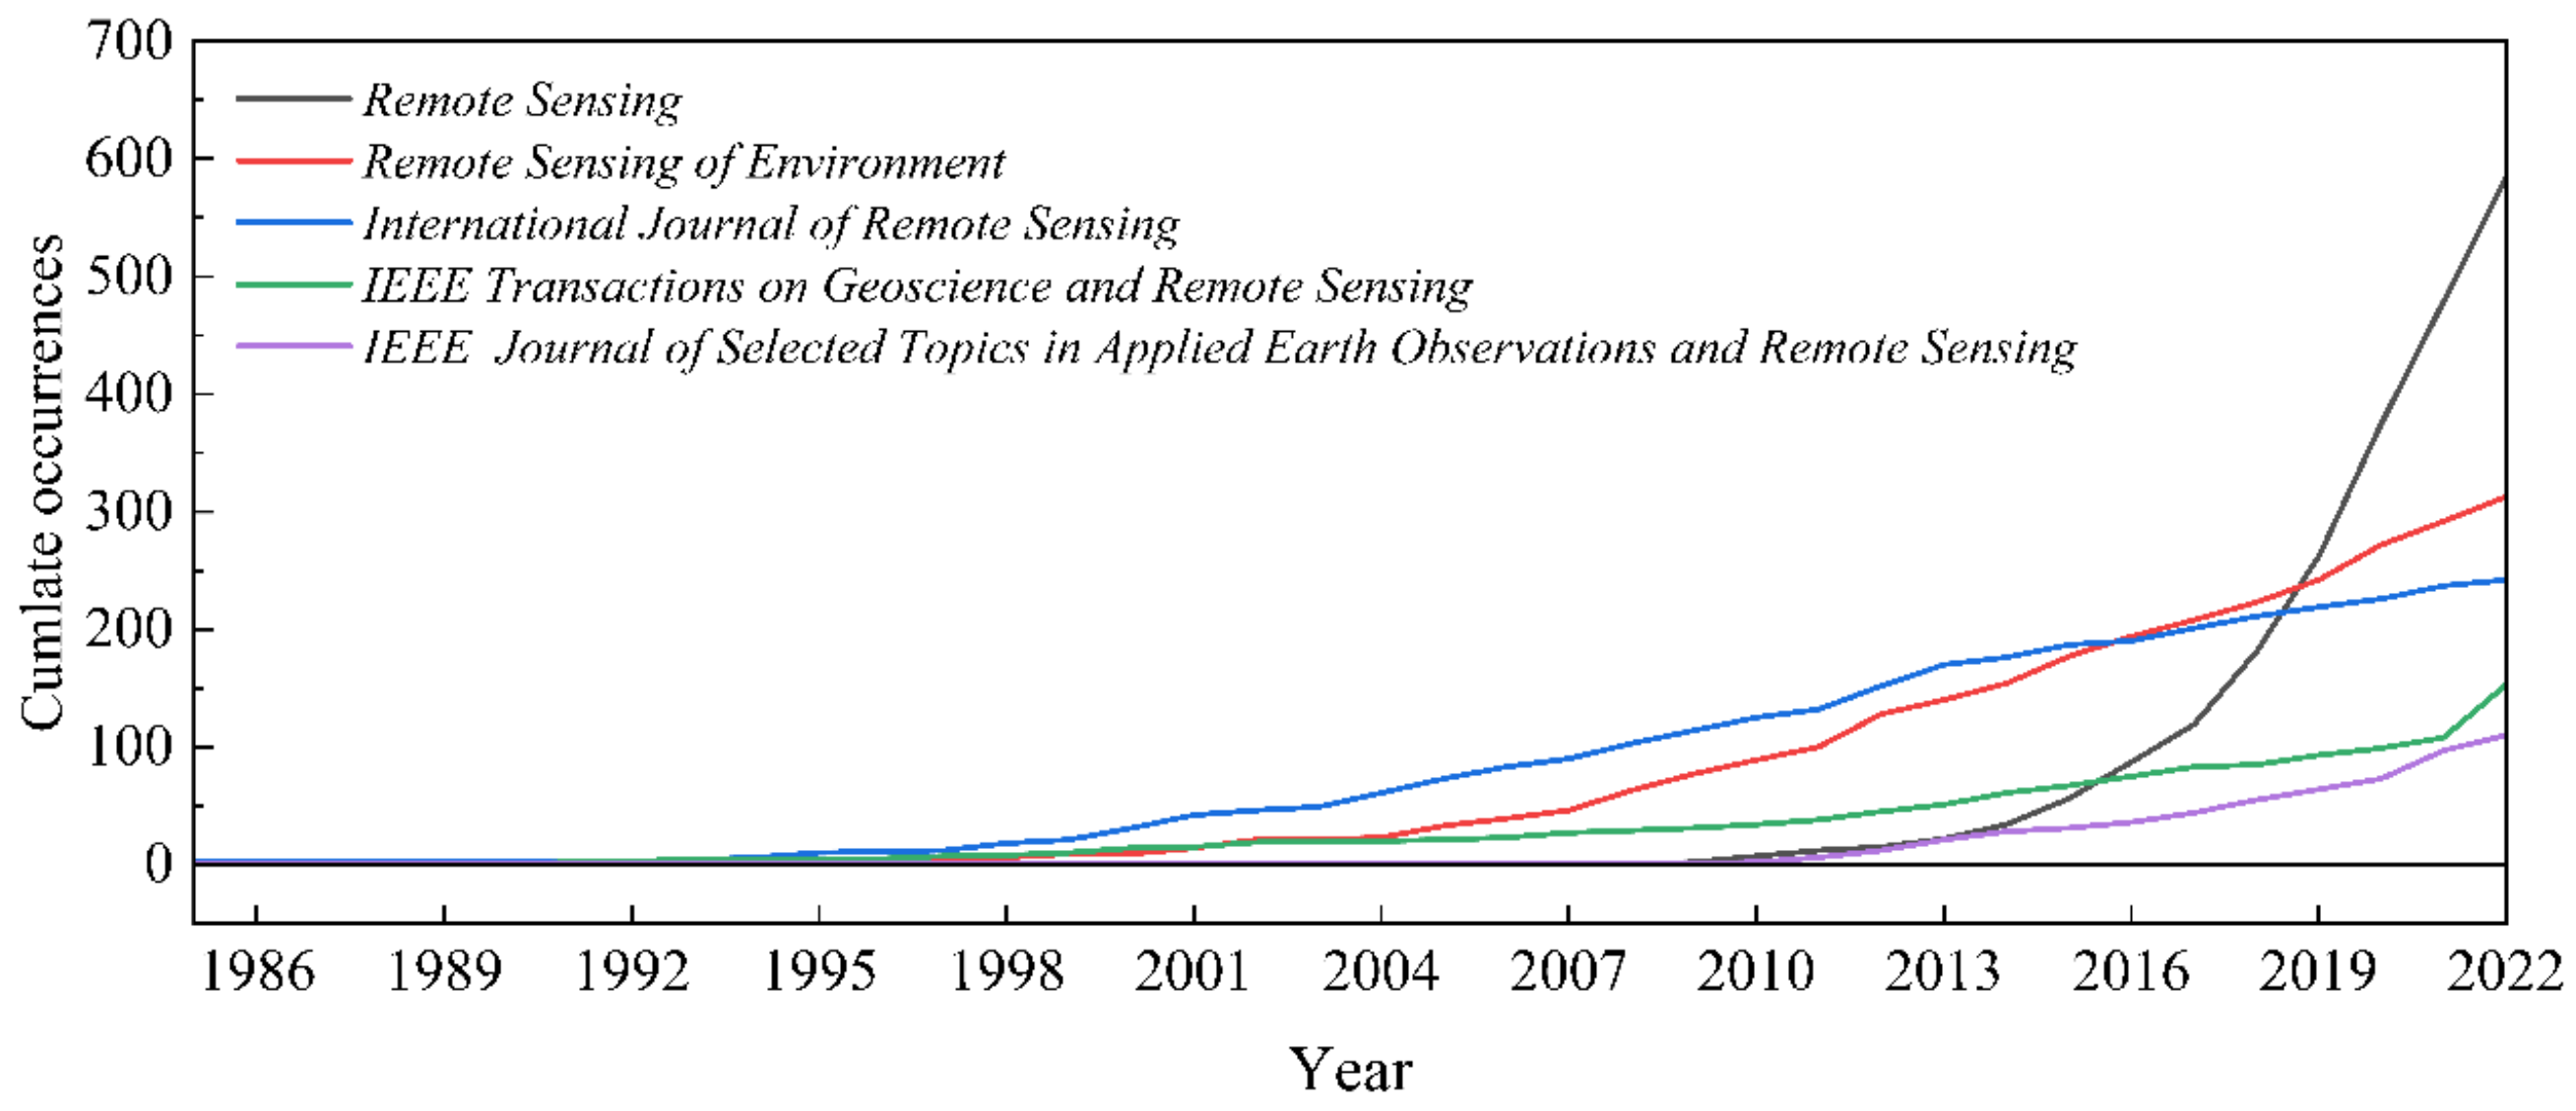
To study the development of the research area in different journals, the sources of journals were ranked considering the number of publications, the h-index, and TC (total citations) (Table 1). The h-index was used to measure the importance and impact of the authors’ cumulative research contributions, and the TC represented the total citations for all articles from a journal source. A total of 515 journals have published research on LUCD, with the top five journals contributing to 1403 papers and accounting for 39.95% of the total papers. However, a large number of journals have only published one paper on this topic, with only 47 journals publishing more than 10 papers. The top five journals in terms of the number of published papers are Remote Sensing (585 papers), Remote Sensing of Environment (313 papers), International Journal of Remote Sensing (242 papers), IEEE Transactions on Geoscience and Remote Sensing (153 papers), and IEEE Journal of Selected Topics in Applied Earth Observations and Remote Sensing (110 papers) (Table 1). The journal Remote Sensing showed the highest annual growth rate in the number of published papers, followed by Remote Sensing of Environment (Figure 4). The top ten influential journals were determined based on their local citation counts, with Remote Sensing of Environment having the highest total local citation count (Table 1). Other journals included International Journal of Remote Sensing, Remote Sensing, IEEE Transactions on Geoscience and Remote Sensing, and ISPRS Journal of Photogrammetry and Remote Sensing. These journals played a crucial role in advancing the research on LUCD during the study period.
4.2. Analysis of Key Countries and Institutions
The publication of research articles from different countries reflects the level of importance and influence of each country in the field of LUCD. Since the inception of this field, 3144 institutions from 95 countries or regions have participated in LUCD research. Among the top 10 countries in terms of publication quantity, four Asian countries (China, India, Iran, and Turkey), two American countries (the United States and Canada), three European countries (the United Kingdom, Germany, and Italy), and one Oceanian country (Australia) are represented (Table S1). China had the highest number of publications with 758, but a relatively low average citation frequency of 20.94 indicates the need for improving the quality of papers. The United States had the highest average citation frequency at 63.34, followed by Australia and Canada with 49.8 and 48.24, respectively, indicating strong research capabilities in LUCD among developed countries. A network analysis of national collaboration (Figure 5) showed that the United States exhibited the most national connections, followed by China and Germany. Despite having more publications, China had lower national connections than the United States, indicating greater independence among Chinese scientists. Regular collaborations occur among the United States, China, Japan, Canada, and Brazil, while Germany, the United Kingdom, Spain, France, and Italy often collaborate among themselves.
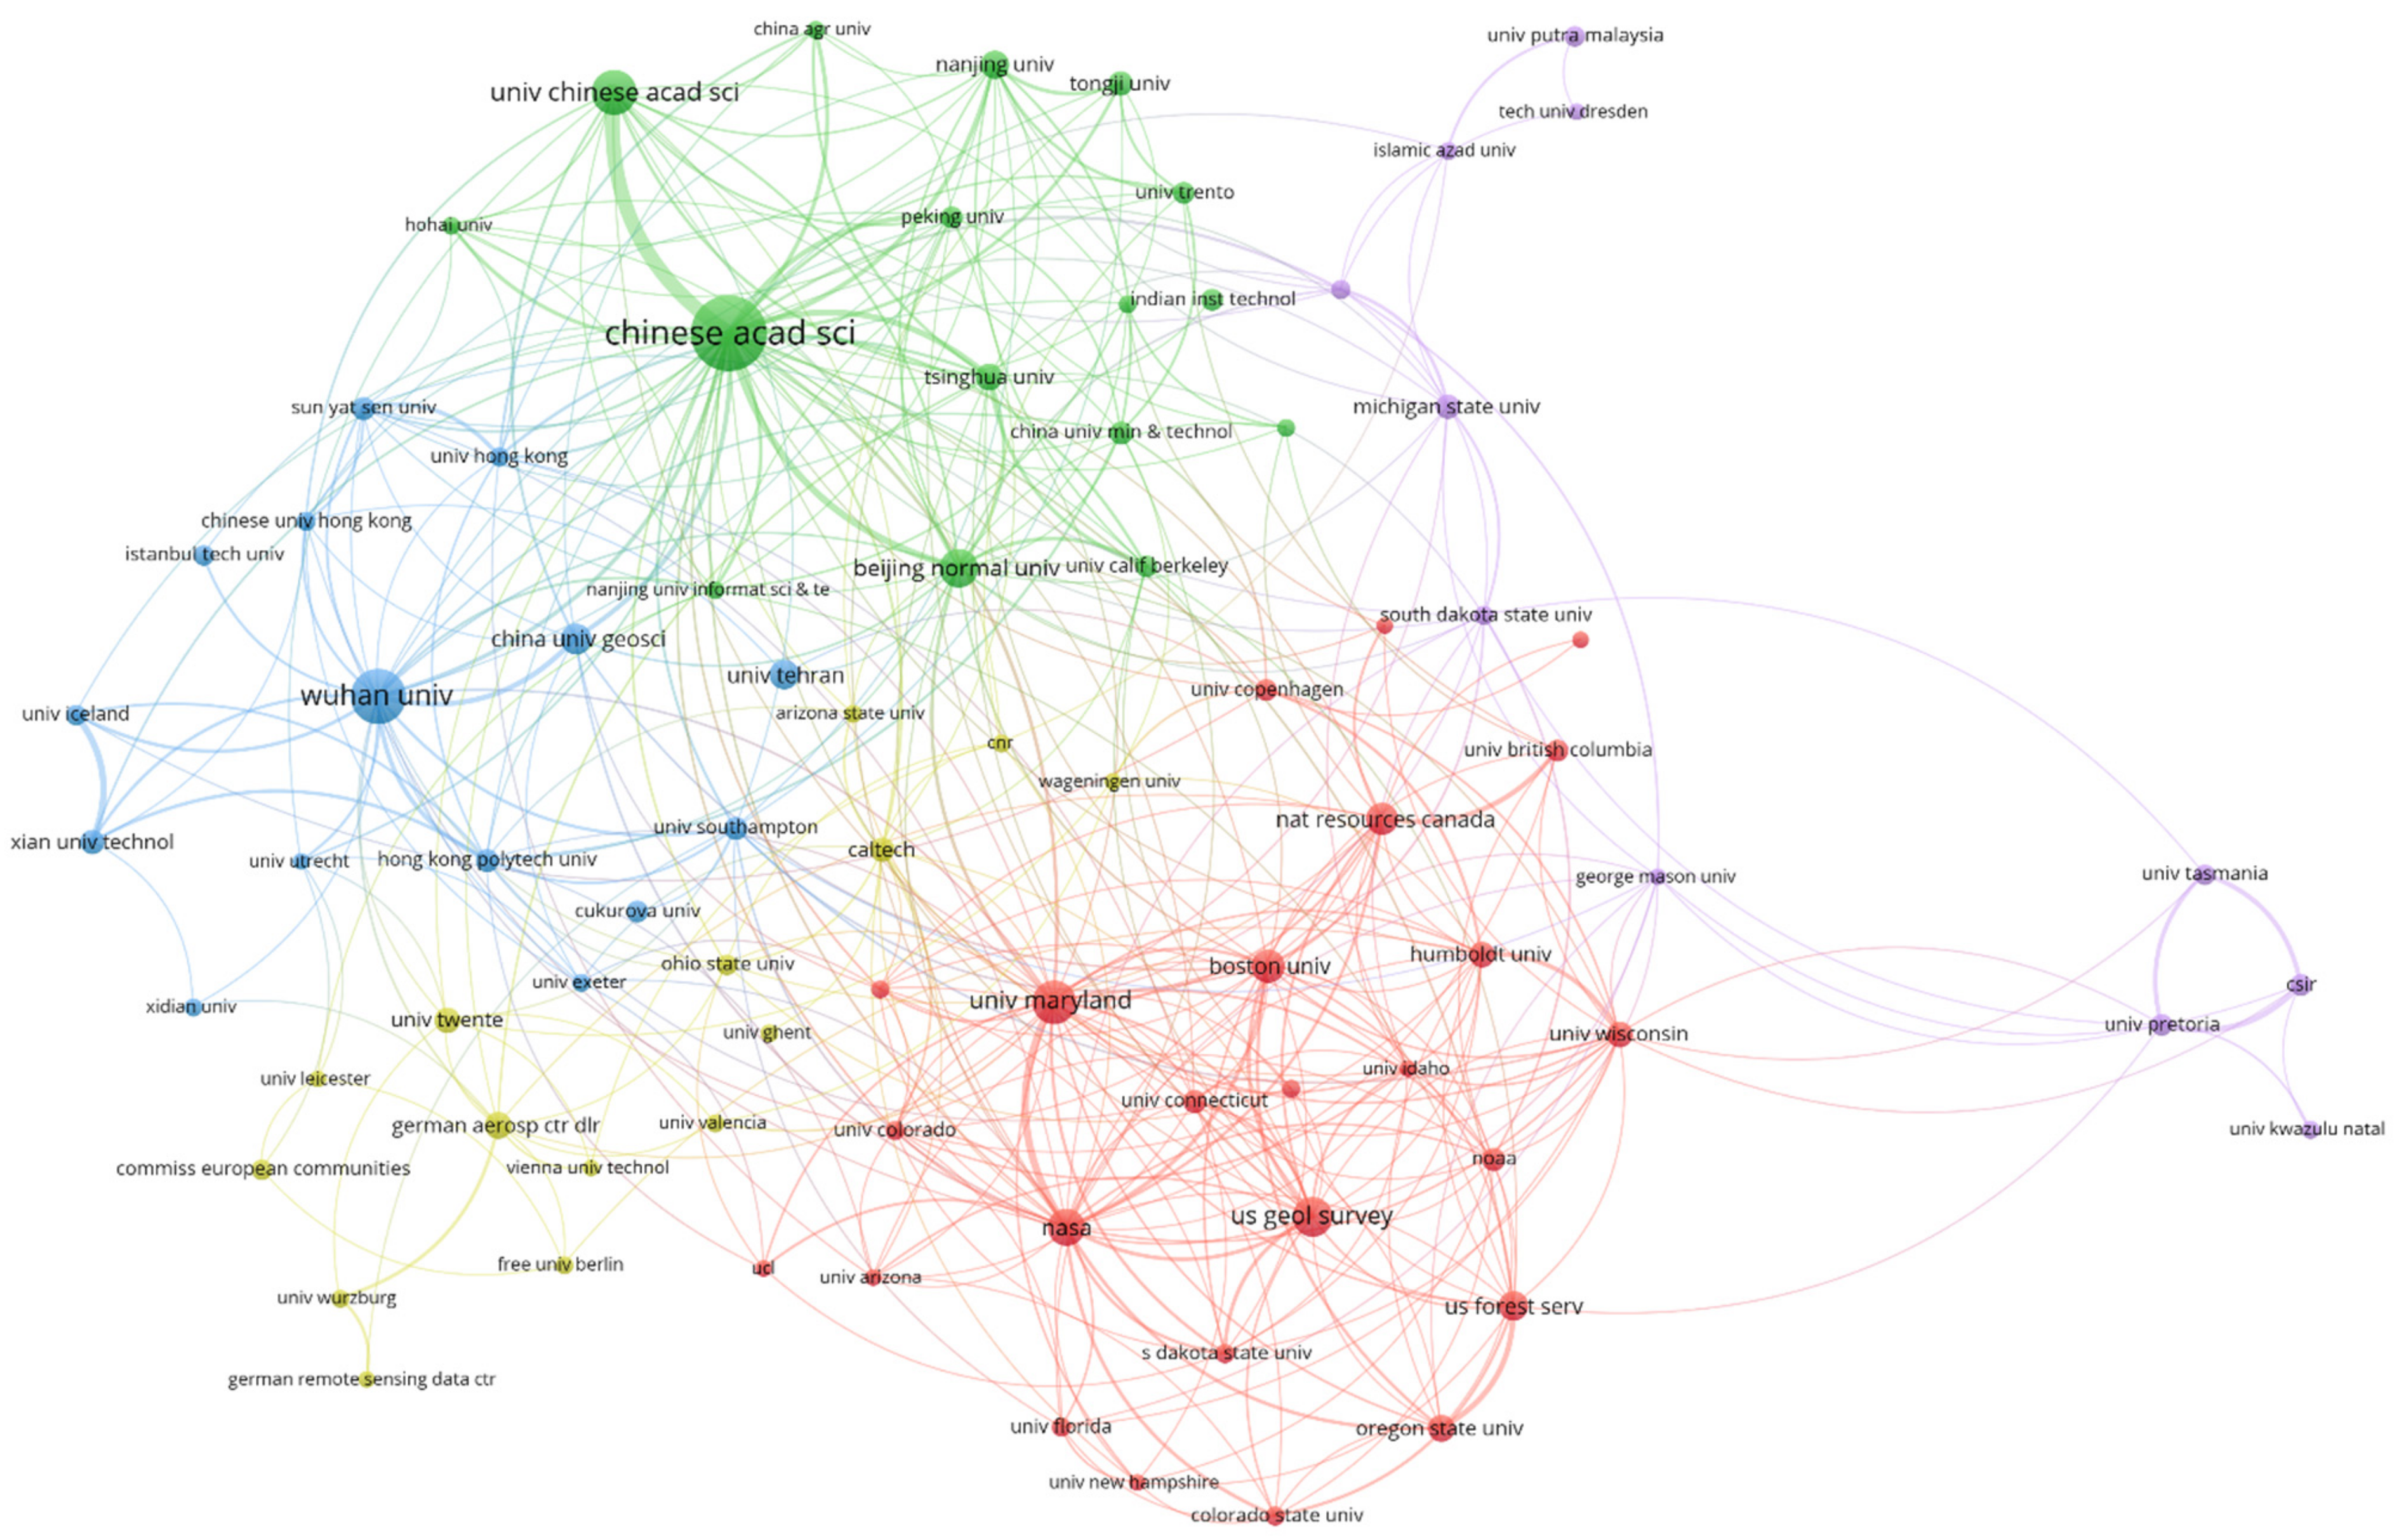
The institutions that have made significant contributions to LUCD research include Wuhan University, University of Maryland, and Chinese Academy of Sciences, with 195, 94, and 88 papers published, respectively (Table S2). Beijing Normal University and China University of Geosciences have also made notable contributions with 85 and 54 papers, respectively. The collaboration network among institutions is presented in Figure 6, where Beijing Normal University is highly central and exhibits the highest degree of collaboration. Wuhan University and the University of Maryland are also highly central in the collaboration network. These institutions, with high publication frequency and centrality, have been at the forefront of LUCD research. Notably, Beijing Normal University, Chinese Academy of Sciences, and the Institute of Geographic Sciences and Natural Resources Research of the Chinese Academy of Sciences frequently collaborate, while Wuhan University, University of Southampton, and China University of Geosciences are also commonly seen in collaborations. Additionally, University of Maryland, Boston University, and NASA Goddard Space Flight Center have a close collaboration.
4.3. Keyword Analysis
4.3.1. High-Frequency Keyword Analysis
In this study, 7922 author keywords were identified from 3512 research papers on LUCD published between 1985 and 2022. Figure 7 shows the trend of author keywords over time, with the X-axis indicating the year and the Y-axis indicating the keywords. The band represents the time span of the keyword’s attention, and the size of the dot in the middle represents the frequency of the keyword’s appearance. The top ten keywords ranked by frequency of appearance are change detection, remote sensing, Landsat, land use/cover, GIS, time series, MODIS, classification, land cover change, and NDVI. These keywords reflect the essential data sources, research fields, and methods used in LUCD research, with deforestation and urbanization also emerging as key research topics.
The blue bands in Figure 7 represent the duration of attention that each keyword has received over time, indicating changing research trends in LUCD. Keywords with blue bands further to the right indicate emerging or evolving research areas. Recent hot topics in LUCD research related to sensors include “Sentinel−2” and “synthetic aperture radar”. Methods commonly used in recent research include “random forest”, “machine learning”, and “deep learning”. “Google Earth Engine” has become a popular online remote sensing platform for researchers, enabling the deployment of algorithms online and the use of supercomputers for processing massive amounts of data. Additionally, “time series analysis” and “high spatial resolution” are keywords that reflect current research status and trends in remote sensing images for LUCD.
4.3.2. Multiple Correspondence Analysis of High-Frequency Keywords
Multiple correspondence analysis involves clustering keywords based on their correlation and reflecting the similarity between keywords based on their planar distance. This provides a classification representation of how commonly used keywords are applied together. For example, when two different keywords, such as “urbanization” and “expansion”, are used together in multiple articles, they can be clustered together, with keywords closer to the center receiving greater attention [31,63]. This analysis can provide an intuitive reflection of the research direction and themes of a particular research field [33]. The results (Figure 8) indicated that the research direction and themes of LUCD can be broadly classified into five categories. While a comprehensive review of the content of these five clusters exceeds the scope of this paper, searching for multiple keywords that appear in the same cluster using Biblioshiny yields several illustrative examples. These examples demonstrate the diversity, breadth, and intellectual depth of the work performed in each cluster.
The first category pertains to data sources and methods utilized for LUCD, which can be categorized into three types: classification-based change detection, threshold-based vegetation index change detection, and model-based change detection. Classification-based change detection is a widely used and conventional method involving the classification of single-date, dual-date, or time series images, followed by a comparison of classification results of different time periods to obtain change detection information. This method can avoid the radiometric normalization problem caused by multiple sources of sensors and can provide information on the type, time, and location of land use change. However, the accuracy of change detection depends on the accuracy of classification, and the classification errors of each time period may accumulate and ultimately affect the accuracy of change detection.
The threshold-based vegetation index change detection method is specific to a single land use type and involves setting spectral features with physical significance, or using the maximum, minimum, and mean values of the spectrum as detection indicators. A certain threshold is set to extract change information based on the temporal patterns of the target’s detection indicators. This method fully utilizes time information and is convenient for calculation, compensating for the accumulation of errors caused by classification. However, the method requires consistency in time series data and strict preprocessing to exclude the influence of multi-source sensors. Additionally, the determination of the threshold relies on expert experience and the characteristics of different regions, and it cannot directly reflect the specific information of land feature type changes.
In recent years, various model-based methods have been proposed by scholars to obtain more accurate change detection results. These methods are generally based on statistical assumptions and achieve change detection by constructing a spatiotemporal change model. Their advantages lie in their ability to effectively overcome the accumulation of errors caused by classification, as well as simplifying the problem. However, their disadvantages include difficulties in modeling, as well as the fact that the correctness and accuracy of the model directly determine the results of change detection.
In the second category, the research content of LUCD is typically associated with specific environmental factors such as forest logging, climate change, and land resource management. For instance, Milevski et al. [64] utilized Landsat images from 1999 and 2021 to apply the comparison method before and after forest logging in southern Serbia. The study showed that forest logging resulted in land degradation, increased surface runoff, and soil erosion, and it caused significant economic and environmental impacts. Similarly, Mekasha et al. [65] employed multi-temporal Landsat and MODIS images to generate land use maps of Ethiopia. The results indicated that forest areas increased, while agricultural land decreased from 1985 to 2019, which highlights the need to establish a sustainable forest management system in the region.
The third category primarily deals with land use changes resulting from the process of urbanization, and the research focus is mostly on China [66,67]. For example, Zhang et al. [68] proposed a sub-pixel method that uses multiple temporal Landsat TM images to detect land cover changes in the urban landscape of Urumqi. The results indicated that the sub-pixel change detection method can effectively detect minor changes in urban land cover in moderately spatial resolution images. Deng et al. [69] studied the spatiotemporal dynamics and changes in land use and landscape patterns in the rapid urbanization process of China from 1996 to 2006 by integrating high spatial resolution SPOT images and employing change detection methods. The results demonstrated that the landscape pattern in China underwent a fundamental transformation from being agriculture-dominated to urban-dominated within a decade.
The fourth category is focused on the dynamics of landscapes and land cover [70]. For example, Kpienbaareh et al. [71] used a change detection method with four Landsat images to assess land dynamics in the urban landscape of Navrongo, Ghana. The results showed that from 1986 to 2016, land use transitioned from agricultural land and bare land to built-up areas. Li et al. [72] classified land use into five categories (primary forest, secondary forest, agricultural land, urban areas, and water bodies) using Landsat images from 2011, 2014, and 2017 in the Amazon highway region. They analyzed the classified images to detect changes and found that population and economic growth significantly impacted forest logging and agricultural land dynamics in the region.
The fifth category of LUCD research focuses on biodiversity and protected areas. Kangabam et al. [73] employed change detection methods to assess changes in land use patterns in the Loktak Lake biodiversity hotspot located in India-Myanmar over the past 38 years. The study revealed a general increase in agricultural and residential areas, accompanied by a significant decrease in vegetation. These changes in land use patterns pose a serious threat to the local biodiversity. Scharsich et al. [74] analyzed land cover and land use changes in and around the Matobo National Park in Zimbabwe between 1989 and 2014. The study showed a decrease in agricultural land area and an increase in forested areas around the protected area, indicating that rapid land reforms played a critical role in land use changes in the area.
4.4. Analysis of Highly Cited Papers
By identifying the top ten locally cited papers (Table 2), the most representative and influential research content of LUCD can be represented, promoting the accumulation of the LUCD knowledge base. Out of ten publications, seven research papers and three reviews were included. The most commonly cited publication is the review by Lu et al. [23], which comprehensively explored the mainstream LUCD method before the publication of this literature. By linking different change detection technologies, data sources, and research areas, the key factors for the successful implementation of change detection were discussed. It provided a detailed list of the advantages and disadvantages of different change detection algorithms, emphasizing that no method is the best or suitable for all situations. The main reason why this publication is widely cited may be that it provides a detailed summary of the research progress of LUCD from several aspects: data selection and preprocessing, change detection technology, post-processing, and accuracy evaluation, and it provides suggestions on how to choose appropriate change detection methods. The review by Coppin et al. [24] published at the same time as this article is often cited. This publication focused on studying land use changes caused by ecosystem changes that are gradual (vegetation succession) or sudden (fires, floods, etc.), and it proposed insights and requirements for LUCD’s ability to address complex dynamic changes in spatial scope, background, and long-term trends. It discussed the future development of LUCD in ecosystem monitoring. Hussain et al. [9] compared traditional pixel- and statistical-based change detection techniques with object-oriented change detection techniques and discussed spatial data mining (DM) technology, which can help improve classification results by exploring different classification features to automatically or semi-automatically select decision thresholds for change detection. This article proposed that object-oriented change detection methods and data mining techniques may have great potential in the application of high-resolution or very high-resolution (VHR) images.
In the seven most-cited research articles, Song et al. [51] addressed the pre-processing steps in LUCD and argued that atmospheric correction is not a necessary step before conducting change detection. The authors suggested that image classification and change detection methods only require atmospheric correction when training data from one time or location are applied to another time or location. Yuan et al. [56] used multi-temporal Landsat TM data and supervised maximum likelihood classification to monitor and map land cover changes in the study area using post-classification change detection methods. Although this method can provide information on the type, time, and location of land use changes, its change detection accuracy is highly dependent on classification accuracy, and classification errors for each time period can accumulate and ultimately affect the accuracy of LUCD. Bruzzone and Prieto [75] proposed an unsupervised classification method using Bayesian rule analysis that does not require prior knowledge of the surveyed area and does not rely on prior statistical information. However, LUCD based on unsupervised classification methods faces challenges in identifying and labeling change trajectories.
Three highly cited research papers in LUCD proposed model-based approaches. Zhu and Woodcock [19] introduced the Continuous Change Detection and Classification (CCDC) model, which aims to detect various types of land cover changes and classify them based on detection results. The model uses the deviation of predicted values from observed values as the change metric, and a three-fold root mean square error is used to judge changes in land cover types. While the CCDC model has been widely used in the field of time-series change detection of remote sensing images, it requires high-frequency and clear observations to construct time series models and may not be accurate for regions with persistent snow or cloud cover. Additionally, the CCDC model calculates changes pixel-by-pixel and does not consider spatial features, which may introduce noise into the results.
Kennedy et al. [20] presented the Landsat-based Detection of Trends in Disturbance and Recovery (LandTrendr) model for identifying vegetation disturbances from Landsat time series data. The LandTrendr model segments the spectral or extracted index time series trajectories based on the detected changes to identify change information. However, it is a pixel-based method and does not consider spatial relationships between pixels. Additionally, it can only provide the year in which changes occurred and does not provide information on the “from-to” land cover transitions.
Verbesselt et al. [13] proposed the Breaks for Additive Seasonal and Trend (BFAST) model based on MODIS 16-day composite NDVI time series data. The model decomposes the original NDVI time series data into three components: seasonal, trend, and residual. The seasonal and trend components are fitted separately using harmonic and piecewise linear models, respectively. The Bayesian information criterion determines the number and locations of change points using least squares estimation. The BFAST model is commonly used to detect vegetation change information in NDVI and EVI data of remote sensing images, such as MODIS and Landsat. Although the BFAST method can determine the timing and spatial location of changes, it cannot provide “from-to” information. Moreover, the method detects changes pixel-by-pixel and does not consider spatial information.

Table 2.
Top 10 locally cited articles in the land use change detection (LUCD) field from 1985 to 2022.
Table 2.
Top 10 locally cited articles in the land use change detection (LUCD) field from 1985 to 2022.
| Reference | DOI | Year | Local Citations (LC) | LC Per Year | Global Citations (GC) | GC Per Year | LC/GC Ratio (%) |
|---|---|---|---|---|---|---|---|
| [23] | 10.1080/0143116031000139863 | 2004 | 521 | 26.05 | 1824 | 91.2 | 28.56 |
| [24] | 10.1080/0143116031000101675 | 2004 | 394 | 19.7 | 1395 | 69.75 | 28.24 |
| [9] | 10.1016/j.isprsjprs.2013.03.006 | 2013 | 215 | 19.5455 | 830 | 75.4545 | 25.90 |
| [76] | 10.1080/014311699213659 | 1999 | 201 | 8.04 | 654 | 26.16 | 30.73 |
| [19] | 10.1016/j.rse.2014.01.011 | 2014 | 190 | 19 | 773 | 77.3 | 24.58 |
| [56] | 10.1016/j.rse.2005.08.006 | 2005 | 182 | 9.5789 | 649 | 34.1579 | 28.04 |
| [20] | 10.1016/j.rse.2010.07.008 | 2010 | 162 | 11.5714 | 942 | 67.2857 | 17.20 |
| [75] | 10.1109/36.843009 | 2000 | 151 | 6.2917 | 855 | 35.625 | 17.66 |
| [13] | 10.1016/j.rse.2009.08.014 | 2010 | 149 | 10.6429 | 969 | 69.2143 | 15.38 |
| [51] | 10.1016/S0034-4257(00)00169-3 | 2001 | 135 | 5.8696 | 1228 | 53.3913 | 10.99 |
4.5. Analysis of the Development and Evolution of LUCD
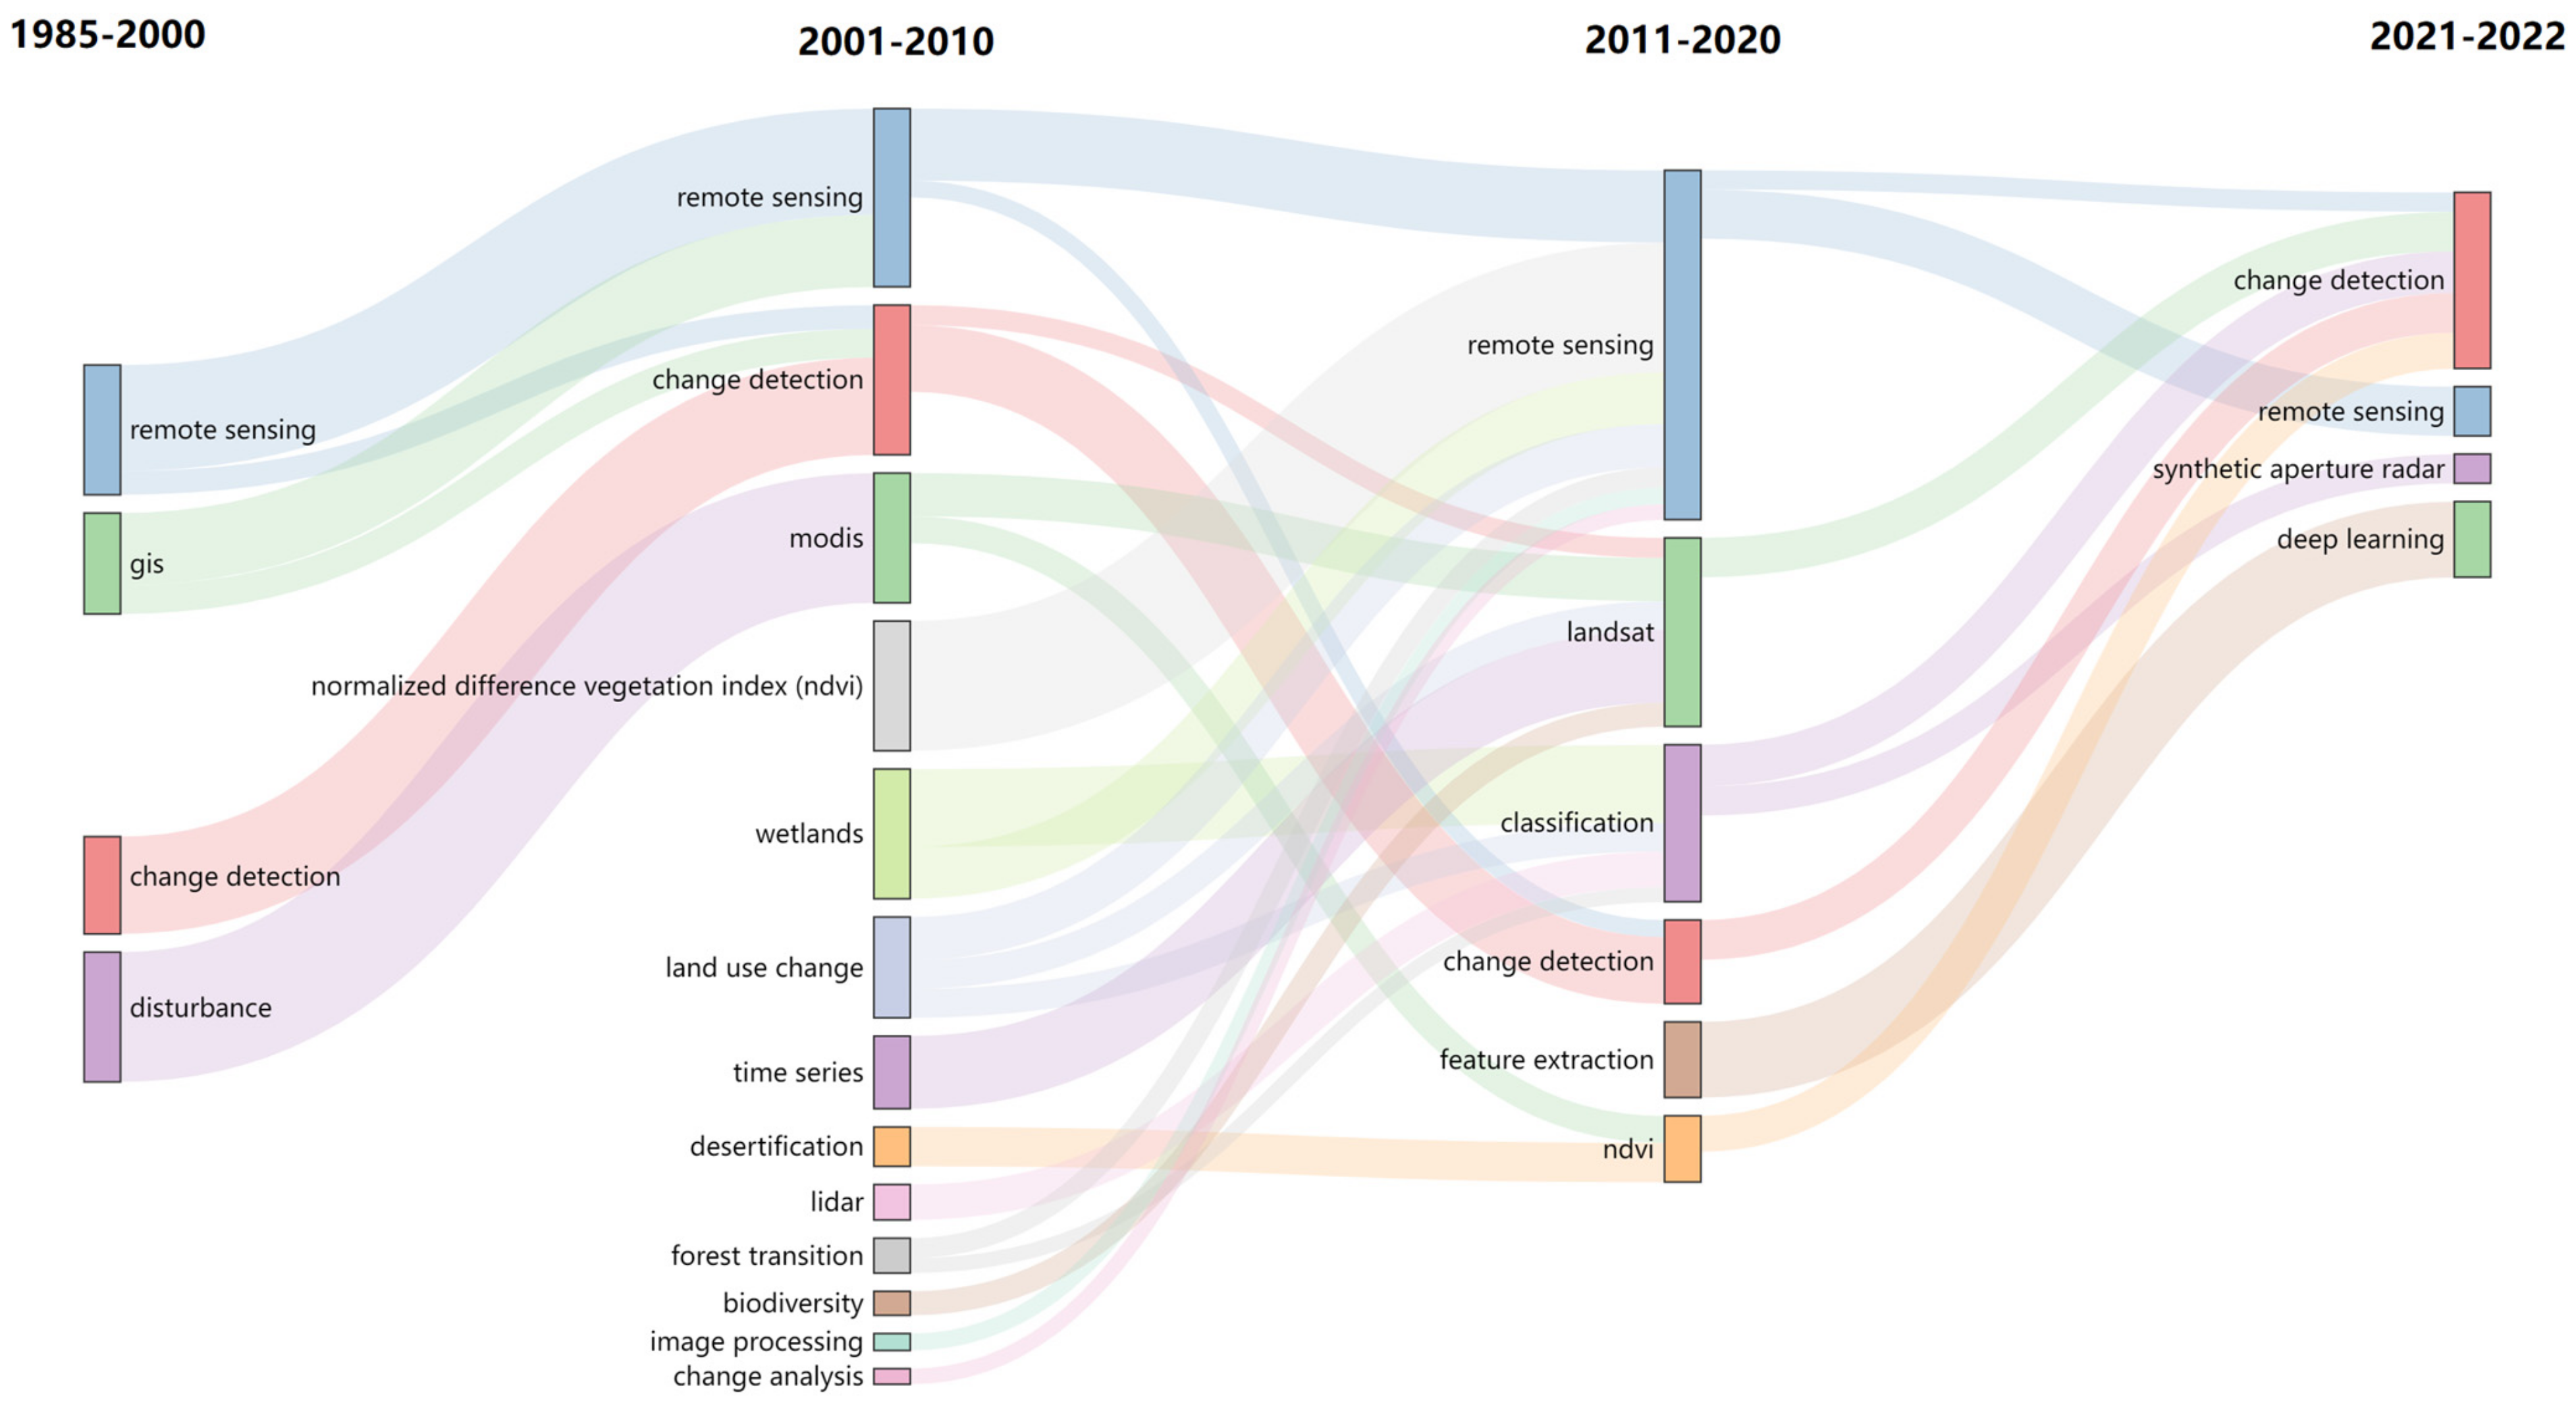
By considering the growth trend of publications in the field of LUCD (Figure 2), we divided the study period into four different stages based on the year 2000, 2010, and 2020 as time nodes, and we analyzed the evolution of research development over time (Figure 9). In general, the number of keywords increased from the first stage to the second stage and then decreased in the third and fourth stages. Among them, “change detection” and “remote sensing” were consistently present throughout the study, confirming that remote sensing is the mainstream method for LUCD. Over the past three decades of LUCD development, numerous satellites have been launched, expanding the data sources of remote sensing imagery, and scholars have proposed a multitude of LUCD methods and algorithms, providing powerful technical support for this field. This chapter summarizes the development history of change detection to provide researchers in this field with a clearer understanding.
4.5.1. Development of LUCD Data Sources
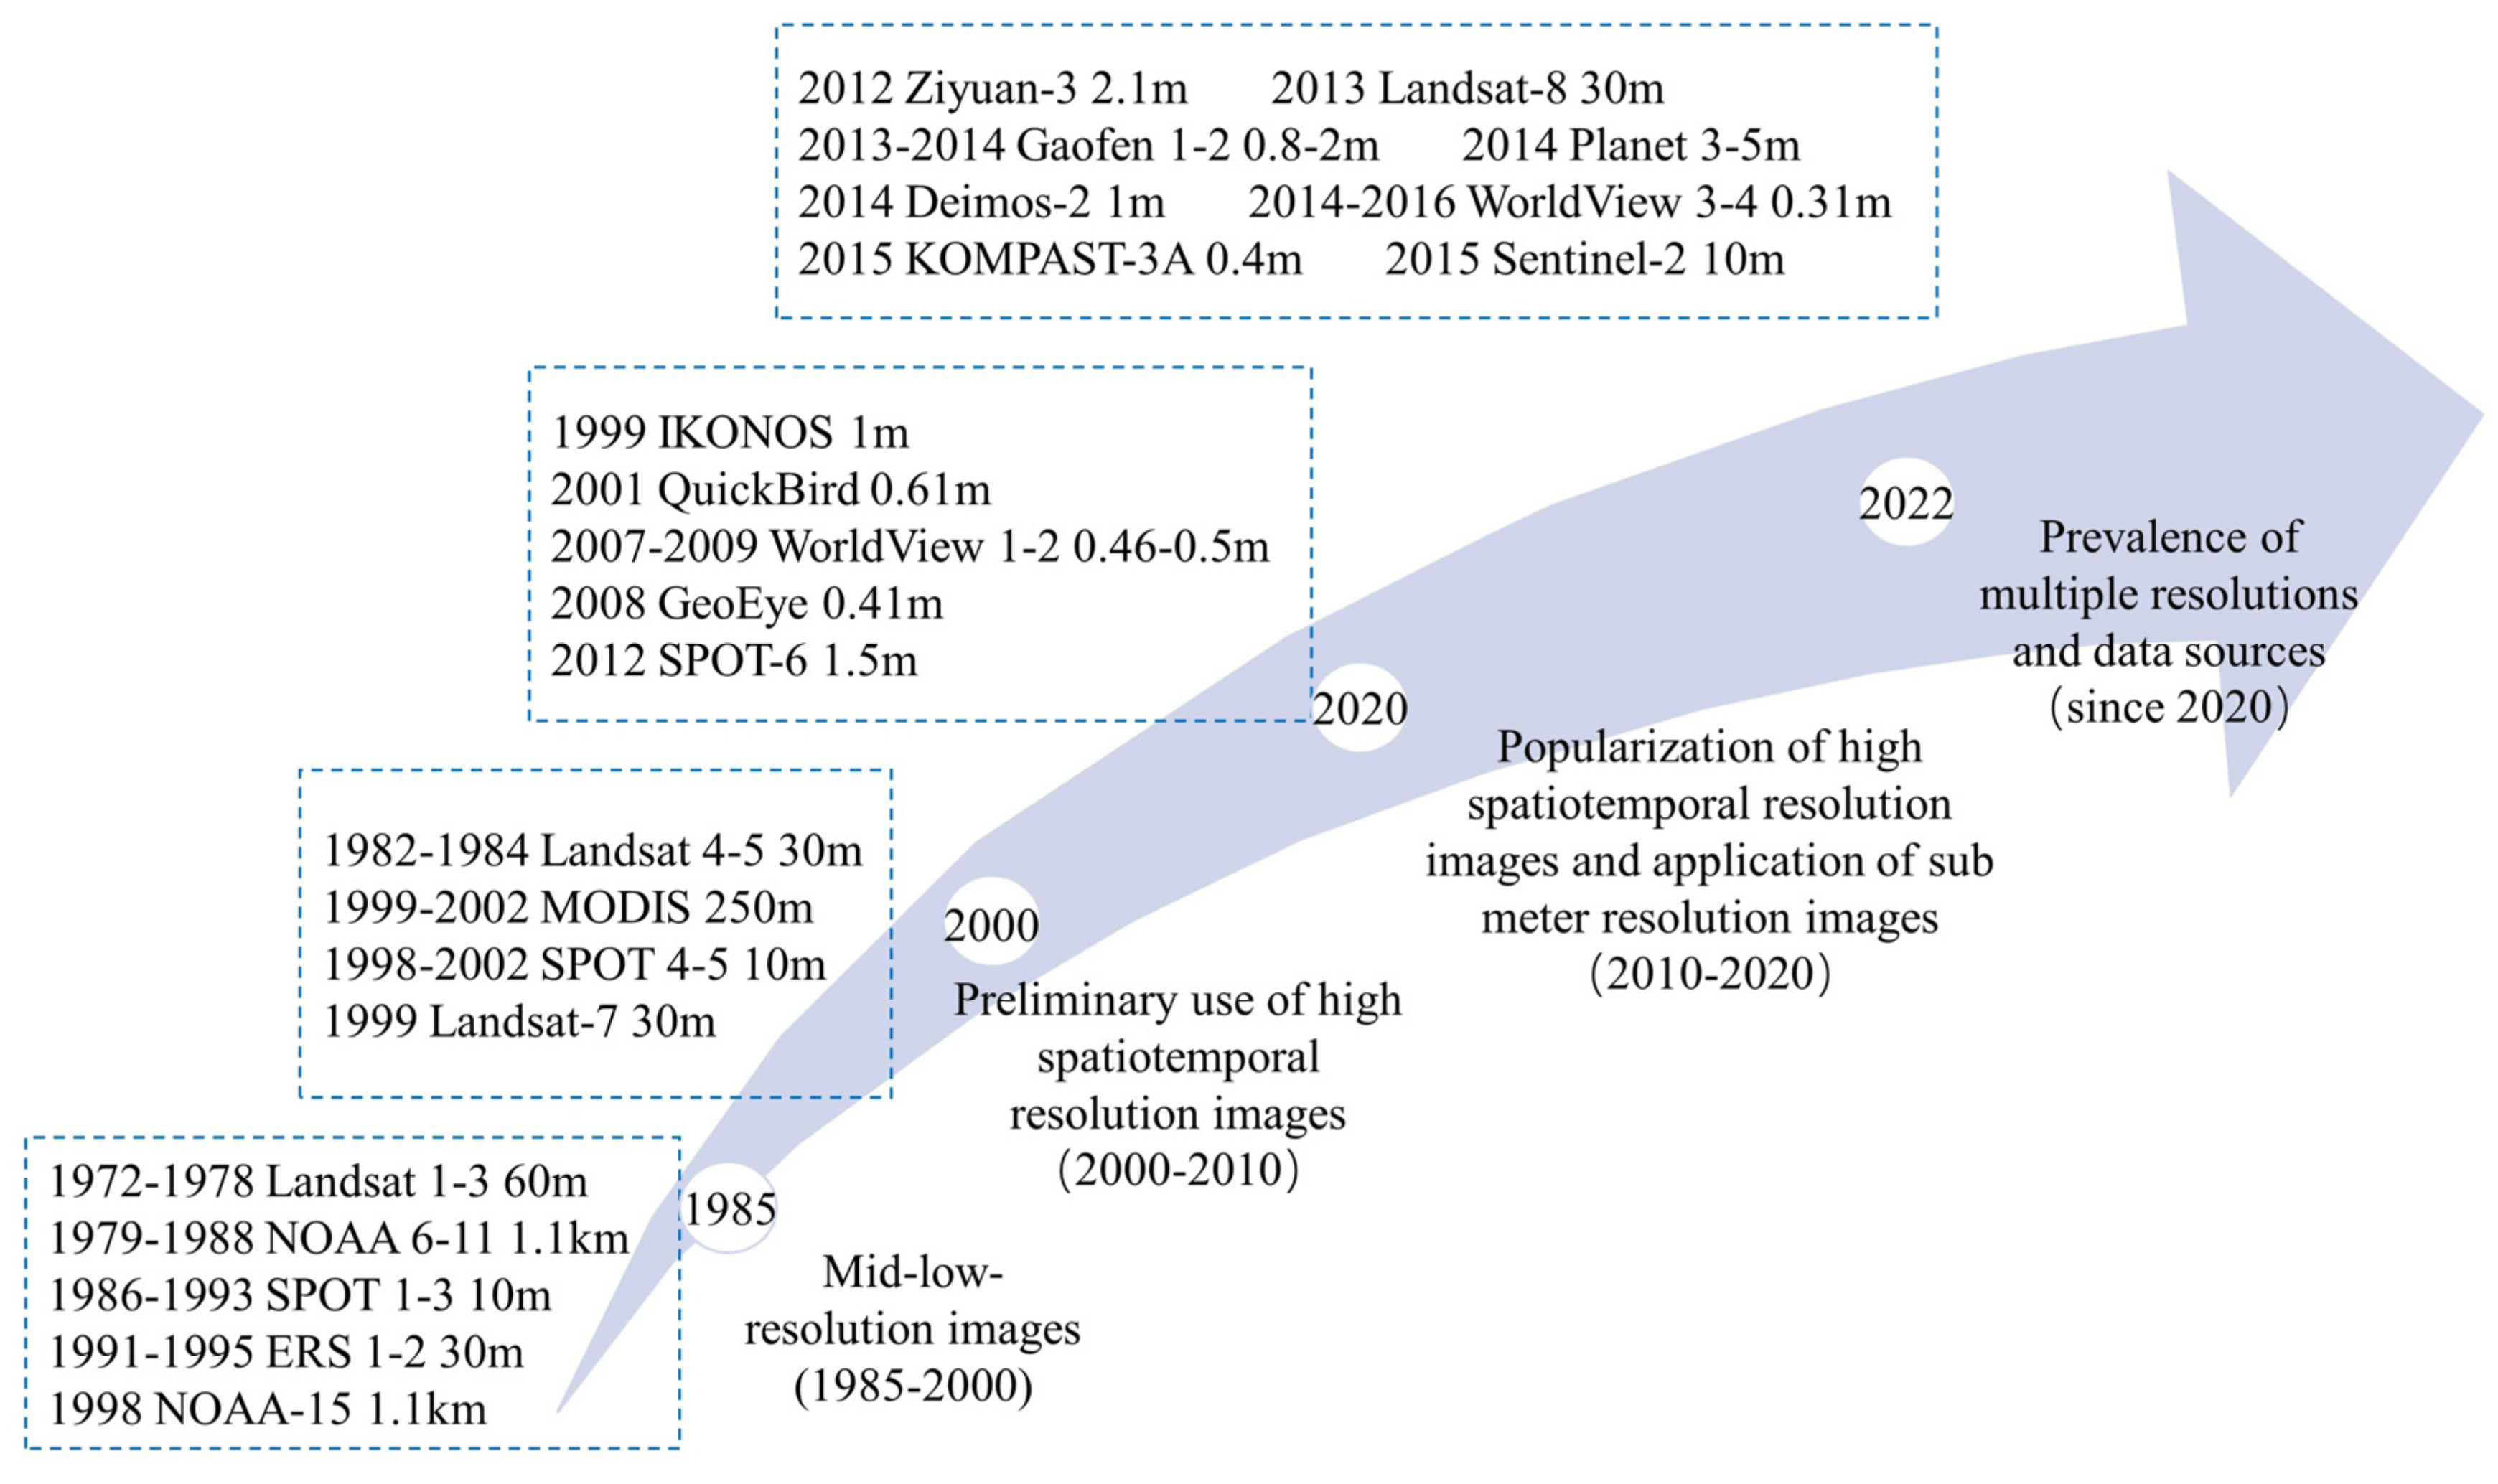
The methods for LUCD may vary depending on the satellite data sources used. In this study, the main satellite sensors available for LUCD were summarized by analyzing the articles in the database (Figure 10). The United States has been at the forefront of the field of remote sensing since the launch of the world’s first meteorological satellite in 1961, which marked the beginning of the development of remote sensing satellites. In 1972, the first Landsat−1 satellite was launched, providing moderate resolution and long-term time-series remote sensing data. In 1979, the third generation of meteorological satellites, the NOAA series, was launched, and the AVHRR sensor carried on it was widely used in large-scale land use change detection [54]. In 1982, the Landsat−4 satellite was launched, increasing the resolution to 30 m [77]. In 1986, France launched the Systeme Probatoire d’Observation de la Terre (SPOT−1) satellite, successfully increasing the spatial resolution to 10 m. The SPOT−4 satellite, launched in 1998, added the mid-infrared spectral band, enabling the classification and identification of plants and the detection of ice and snow [78]. In 1991, the European Space Agency launched the Earth Remote Sensing Satellite (ERS−1), which carried a Synthetic Aperture Radar (SAR) with a spatial resolution of 30 m, enabling the monitoring of global land ecosystem cycles.
In the development stage of LUCD, the emergence of high spatiotemporal resolution remote sensing imagery has brought significant convenience to LUCD. In 1999, the United States launched the first Terra satellite, and two years later, the Aqua satellite was launched. The MODIS sensor carried by the Aqua satellite replaced the AVHRR sensor due to its global coverage, wide spectral range, and short revisit period, and it has been widely used in large-scale LUCD [79,80]. Landsat series satellite imagery has become the most commonly used data source for LUCD due to it having the longest image span and a relatively high spatial resolution [19,59,81,82].
During the active phase of LUCD, high spatial and temporal resolution imagery has been widely applied, and sub-meter resolution imagery has started to be used. In 1999, the United States successfully launched the IKONOS satellite, which became the world’s first commercial remote sensing satellite with a resolution of better than 1 m. Subsequently, in 2001, the QuickBird satellite was successfully launched, updating the resolution to sub-meter level [10]. Since then, more and more sub-meter remote sensing satellites have been successfully launched, such as the WorldView−1 satellite launched in 2007 with a resolution of 0.5 m, the GeoEye satellite launched in 2008 with a resolution of 0.41 m, and the WorldView−3 satellite launched in 2014 with a resolution of 0.31 m [83,84]. In recent years, in addition to using these satellites for LUCD, Landsat−8 and Sentinel−2 satellites have brought new vitality to large-scale, long-term LUCD due to their extensive, free, and global availability [85]. In addition, the use of unmanned aerial vehicles for LUCD has become a popular method in the past two years [86].
4.5.2. Development of LUCD Methods
By reviewing and analyzing research papers from different stages in the development of land use change detection methods, the temporal evolution of these methods was summarized and presented (Table 3).
The early stage (1985–2000) was characterized by the limitation of technology, which led to the dominance of pixel-based statistical methods in LUCD. The method mainly employed simple algebraic operations on corresponding bands of medium- to low-resolution remote sensing images to obtain the difference image, which was then segmented using adaptive or manually determined thresholds to obtain the final change detection results. The earliest algebraic method used was the image differencing method. Lambin et al. [54] proposed a change vector analysis method that used NDVI derived from time series AVHRR images to detect the process of land cover change. The method was straightforward and resulted in a difference image by a simple subtraction of the two images. Additionally, the image ratio method was also commonly used and differed from the differencing method in that it used division to obtain the difference image. Olsson [87] utilized a band regression method, which constructed a linear regression function to detect changes in the forest area. Although the method was simple, it was highly sensitive to noise levels and geometric registration accuracy between images, and it did not consider the two-dimensional distribution characteristics of radiation information from different sensors. Another method of LUCD involved the visual interpretation of two land use maps or aerial images to detect changes in land use between the two images. However, this method was time-consuming and laborious, and the data were difficult to obtain [88,89].
During the development phase (2001–2010), the focus of LUCD shifted towards using post-classification change detection methods in combination with remote sensing imagery. In this approach, the participating remote sensing images are first classified to obtain their respective classification images. Then, these classification images are compared according to their corresponding locations to obtain the final change detection map. Various information-aided classifications, including GIS, were widely applied. Bagan et al. [90] evaluated the dynamic trend of land cover change in the Korqin Sandy Land using a post-classification change detection method with four Landsat images from 1975 to 2007. Results showed a large-scale conversion of grassland and forest to cropland over the past three decades, with desertification posing a serious threat to the local population. Additionally, Wolter et al. [91] quantified the forest land use type transitions in northeastern Minnesota using a Landsat time-series from 1990–1995. Results indicated that mature forest gradually transformed into early-successional types, such as grassland and conifer forest land, due to human activities, floods, and fires. During this period, keywords such as “NDVI” and “MODIS” emerged, indicating that scholars began to pay attention to using vegetation indices for change detection. Lunetta et al. [92] monitored land use change in the Albermarle-Pamlico estuarine system (APES) in the United States using MODIS NDVI time series from 2001 to 2005. Although this method has the advantage of being cost-effective and fast, it has a lower spatial resolution, which may lead to a loss of spatial details in change detection, making it only suitable for large-scale change detection analysis. Furthermore, this method can only provide information about the timing of change and cannot give specific “from-to” information.
In the active phase (2011–2020), with the rise of machine learning, new opportunities emerged for LUCD. Machine learning algorithms such as support vector machines (SVM), random forests (RF), and artificial neural networks (ANN) have been widely used in remote sensing image classification, improving the accuracy of image change detection. Meanwhile, with the commercialization of high spatial resolution remote sensing images, the basic unit of change detection has gradually shifted from pixels to objects, and object-based image analysis techniques have been introduced into the analysis of LUCD. This technique can effectively improve the initial classification accuracy of images and reduce the influence of classification errors on change detection results. In addition, to obtain more accurate change detection results, scholars have proposed various model-based methods by considering the temporal relationship between data image sequences. In addition to the two main data sources, Landsat and NDVI, many scholars have applied LiDAR to land use change research. For example, Yu et al. [14] used multi-spectral LiDAR data to generate a set of feature images and trained a hybrid capsule network composed of encoder and decoder networks for accurate land cover classification. Kamps et al. [15] combined LiDAR data with multi-temporal orthophotos to quantify land use change caused by deep-seated landslides near the village of Doren in Austria from 2006 to 2012. In addition, due to the high spatial and temporal resolution of Sentinel−2 satellite images, they have been widely used in LUCD, playing an important role in forest succession [93], fallow land reclamation [94], and the monitoring of land use change in mining areas [95].
In the climax phase (2021–2022), big data and artificial intelligence have led to a new wave of development in LUCD. With the development of remote sensing big data and artificial intelligence, deep learning methods have rapidly been introduced to LUCD. As an effective means of feature extraction for high-resolution remote sensing data, deep learning methods provide a new approach for image classification and change detection of high-resolution imagery. Feizizadeh et al. [21] developed a fuzzy object-based image analysis and deep learning (FOBIA-DL) method to analyze Landsat imagery from 1990 to 2020 in the Urmia Lake region of northern Iran, investigating the impact of land use and land cover change on drought and comparing it with SVM, RF, and decision tree (CART). The results indicated that the method combining object-based and deep learning approaches had the highest image classification accuracy. Moncrieff [22] used a convolutional neural network (CNN) and transformer to detect land cover changes in South Africa’s critically endangered fynbos ecosystem, demonstrating the enormous potential of this method in the continuous monitoring of habitat loss. Currently, related research is increasing rapidly, indicating that the new thinking and new mode of the big data and artificial intelligence era will have a significant impact on LUCD methods.
Table 3.
Evolution of methods in the field of land use change detection (LUCD) from 1985 to 2022.
| Data Sources | Study Region | Year | Change Detection Methods | Overall Accuracy (%) | References |
|---|---|---|---|---|---|
| AVHRR on NOAA−9 and NOAA−11 | West Africa | 1987–1989 | Change-vector analysis (CVA) | -/- | [54] |
| Aerial images | Carolina bay and bay-like wetlands | 1951, 1992 | Visual interpretation | -/- | [89] |
| Landsat TM images | USA | 1988, 1994 | Generalized linear models (GLMs) | -/- | [96] |
| Land cover map | Northern Patagonia, Argentina | 1913, 1985 | Visual interpretation and field investigation | 84.4 | [88] |
| Landsat TM images | Neuse River Basin | 1993, 2000 | Multiband image difference | 80–91 | [97] |
| Spot images | Lusitu, the Southern Province of Zambia | 1986, 1992, 1997 | Maximum likelihood classification | 83 | [78] |
| Landsat TM images | Minnesota, USA | 1990–1995 | Fitting Landsat TM images with topographic maps | 89 | [91] |
| Landsat TM images | Moist tropical region of the Amazon | 1994, 1998 | Principal component differencing | 92–99 | [98] |
| MODIS Vegetative cover conversion (VCC) | Idaho, Montana, New Mexico, Cambodia, Thailand, and Brazil | 2000 | Decision trees | 55–90 | [79] |
| Landsat TM images | Minnesota, USA | 1986, 1991, 1998, and 2002 | Maximum likelihood classification | 80–90 | [56] |
| MODIS NDVI | Albemarle, Pamlico Estuary System (APES) region of the US | 2001–2005 | Threshold method | 88 | [92] |
| Landsat TM images | Oregon, USA | 1984–2004 | Trajectory-based change detection | 77–91 | [99] |
| Landsat TM/ETM + and Landsat MSS | Horqin Sandy Land, China | 1975, 1987, 1999, and 2007 | Self-organizing mapping neural network method and subspace method | 70.66–86 | [90] |
| Landsat ETM + | Mountainous area in Mexico | 1999, 2006 | Object-based maximum likelihood (ML) and standard nearest-neighbor (SNN) | 71–77 | [100] |
| Landsat | Savannah River | 2001–2004 | The continuous monitoring of forest disturbance algorithm (CMFDA) | 95 | [82] |
| Landsat | Louisiana, Colorado, and Mississippi | 2006, 2011 | Comprehensive change detection method (CCDM) | 91 | [101] |
| Landsat | New England | 1982–2011 | CCDC | 90 | [19] |
| MODIS NDVI | Southeast Australia | 2000–2008 | Breaks for additive season and trend (BFAST) | -/- | [13] |
| Landsat | Pacific Northwest of the USA | 1985–2007 | LandTrendr | 97 | [20] |
| Sentinel−2 | Klingenberg, Saxony, Germany | 2016, 2018 | Fully convolutional neural network (FCN) and long short-term memory (LSTM) networks | 87 | [102] |
| Unmanned aerial vehicle (0.2 m) | Guangzhou, China | 2009, 2019 | A deep multitasking learning frame- work for change detection (MTL-CD) | 92.97 | [86] |
| Aerial imagery | -/- | 2012–2020 | Dual correlation attention-guided detector (DCA-Det) | 99.5 | [103] |
| Landsat5, 7, 8 | Australia | 1985–2015 | Random forest (RF) | 93 | [104] |
| Sentinel−2 | Western Cape Province of South Africa | 2016–2021 | Convolutional neural networks (CNN) and transformer | 89 | [22] |
| Landsat TM/ETM+/OLI | Shenzhen, China | 1986–2017 | Temporal segmentation and trajectory classification | 93.33 | [105] |
| 0.2 m high-resolution images | -/- | -/- | Super-resolution-based change detection network (SRCDNet) | 85.66–90.02 | [84] |
5. Discussion
5.1. Future Research Directions for LUCD
Through a systematic review of relevant research on LUCD, this study identified several areas that require further exploration.
Regarding data sources, common remote sensing data used for LUCD include AVHRR, MODIS, Landsat, and Sentinel−2. Over time, remote sensing imagery has become increasingly higher in spatial resolution, resulting in clearer land cover conditions. However, the improved spatial resolution also highlights the shadows of land cover features and exacerbates the problem of cloud cover, leading to the loss of important land cover information and adversely affecting LUCD [105,106]. Furthermore, for large-scale applications, the high spatial resolution of satellite data results in limited coverage and high computational demands, posing challenges to data analysis. Google Earth Engine (GEE) is a platform that can collect and process large amounts of already published data products, and its advanced computing capabilities surpass traditional computers and servers [107]. Researchers can utilize this platform to greatly expand the temporal and spatial scales of their research, significantly improving the accuracy and efficiency of LUCD.
In the domain of change detection, precise geometric registration and atmospheric correction or normalization between multi-temporal images are crucial factors that determine the success of the project [23]. The use of multiple sensors in the pre-processing stage requires the resolution of the issues arising from differences in spectral characteristics and geometric registration errors, especially in cases where images need to be joined or cropped. As generations of remote sensing satellites continue to upgrade, algorithms have been developed to make acquired images have similar brightness or gradually increasing brightness, allowing for a more natural joining of two images. Additionally, establishing a uniform geographic reference system can reduce registration errors between multi-source remote sensing images.
The accuracy assessment of LUCD results is crucial for decision-making. Commonly used methods for accuracy assessment include overall accuracy, Kappa coefficient, recall rate, and IOU index. However, the accuracy of the Kappa coefficient has been questioned by some scholars [108]. Additionally, the current accuracy evaluation is mainly based on the pixel-based approach, and the accuracy assessment methods for object-oriented and feature-based LUCD require further research.
In terms of methods, there are numerous types of available change detection methods for land use, each of which is suitable for different scenarios. Despite the development of various change detection technologies, it remains difficult to select the appropriate method for accurate change detection, particularly for specific research purposes or fields. With the popularity of high-resolution and sub-meter resolution remote sensing images, the consideration of different land cover types and change characteristics increases, requiring more effective detection methods to address these issues. With the advent of object-based analysis methods and models, most scholars have applied these methods to LUCD, achieving high accuracy. The most critical step in object-oriented change detection is image segmentation, and numerous scholars have proposed various segmentation methods, each with specific applicable scenarios and conditions. In future research on object-oriented LUCD, image segmentation techniques still require further in-depth research. Furthermore, threshold selection must be considered in the change detection method, and more convenient methods should be developed to quickly select the appropriate threshold and further improve the accuracy of LUCD.
In recent years, there has been an increasing amount of research focused on using deep learning methods, such as convolutional neural networks, recurrent neural networks, and transformers, to improve the accuracy of land use classification. However, the automated mining of data and the acquisition of spatiotemporal features still present some difficulty. For training change detection methods, particularly in parameter selection, a significant amount of time and effort is required. Thus, future development should focus on creating lightweight modules that can enhance the performance of network models and reduce the time required for model training. As multi-source remote sensing data, deep learning, big data, and artificial intelligence continue to develop and be applied, researchers should provide a flexible framework that can integrate critical issues related to data pre-processing, feature extraction, land use type interpretation, and accuracy evaluation, in order to construct an intelligent change detection system.
The following directions are suggested for future research in the field of LUCD, based on the analysis of past issues and existing research methods:
- (1)
- Expanding the range of image data acquisition can be achieved by combining multiple data sources.
- (2)
- Cloud platforms should be utilized to conduct more precise, long-term, and large-scale land use change detection studies.
- (3)
- Further research is needed on the geometric registration and spectral differences of multi-source remote sensing images during the preprocessing stage.
- (4)
- Accuracy evaluation should be improved, and object-oriented and feature-based accuracy evaluation methods should be developed.
- (5)
- Future research should focus on studying optimal, adaptive, and full-scale image segmentation and threshold selection techniques.
- (6)
- Based on deep learning, LUCD methods have demonstrated great potential in recent years through their multi-level and deep network structures.
5.2. Advantages and Uncertainties
This study demonstrated the effectiveness of utilizing machine learning models and software tools such as ASReview and Bibliometrix for screening articles in the field of LUCD. This approach can significantly reduce the time and labor costs involved in screening large databases of articles, making it an attractive option for researchers. Furthermore, machine learning models can be continuously improved by incorporating feedback from experts and adding relevant and non-relevant articles to the training data. Although labeling training data is a time-consuming process, ASReview significantly reduces this burden by actively identifying relevant articles and excluding irrelevant ones during the training process. Moreover, ASReview is an open-source tool that does not require any programming knowledge, making it accessible to a broad range of researchers. The use of machine learning models and software tools such as ASReview and Bibliometrix can potentially enhance the efficiency and accuracy of literature reviews in various research fields [109].
This study has several limitations that should be acknowledged. First, the bibliometric analysis results are highly dependent on the selected databases, which may not include all relevant publications in the field. In addition, this study only focused on a specific topic using the Web of Science Core Collection database. Although it is one of the most influential databases, incorporating other databases could provide a more comprehensive global perspective. Lastly, further research is needed to integrate bibliometrics with machine learning methods to improve the efficiency of systematic reviews and reduce labor costs while uncovering more interesting results. Future studies should explore more advanced machine learning techniques and data sources to further enhance the effectiveness of this approach.
In this study, a noteworthy concern arises regarding the bibliometric analysis process employed to obtain the development trends of LUCD by analyzing the article quantity and citation rate of journals. The chosen approach may be subject to influence from the publishing method of the journals, such as gold open access or subscription, and limitations on the number of articles published annually by certain journals. The comparison of journals and articles with varying publishing methods poses a challenging task and necessitates careful consideration of the underlying assumptions supporting these methods. A fundamental assumption in this context is that subscription-based journals offer superior quality control and peer review mechanisms, as publishers have a financial motivation to uphold high standards. Conversely, open access journals may be perceived as having lower barriers to entry, which can lead to lower standards of peer review and editorial oversight. However, this premise is not always accurate, as some open access journals have rigorous peer review procedures and maintain a high degree of quality control. Another presumption is that open access journals are more accessible and inclusive than subscription-based journals, as they do not require payment for article access. Nonetheless, this assertion does not fully address the reality that open access journals may levy article processing fees, which could limit access to articles for authors from low-income countries or institutions.
Furthermore, an underlying assumption posits that the free and accessible nature of open access articles may engender increased citation rates and a wider dissemination of research findings. However, limitations on the number of articles published annually by certain journals may affect the citation rates of individual articles. Should a journal be able to publish only a finite number of articles each year, authors may find it increasingly arduous to secure publication within said journal, potentially impeding the attention and citation their research receives. Nevertheless, this does not always hold true, as some journals with limited publishing capacity are highly discerning and esteemed, thereby augmenting the impact and visibility of the research they publish. Additionally, the factors influencing citation rates and impact are intricate and multivariate, variably influenced by factors such as research quality, author and journal reputation, employed methodology and techniques, as well as novelty and significance of the findings.
The significance of this study lies in its comprehensive survey of LUCD, coupled with an in-depth analysis of data sources, research areas, and various themes and methodologies. This provides researchers with a means of identifying specific research topics and content related to LUCD, and it serves as a valuable reference for practitioners in this field.
6. Conclusions
Through a combination of bibliometric analysis and machine learning, this study provides a comprehensive overview of 3512 papers related to LUCD in the core collection database of the Web of Science from 1985 to 2022. The study identified the trends of publications and main journals in the field, established the cooperation networks among major research institutions and countries, and analyzed the most influential articles and frequent keywords. Furthermore, the study examined the evolution of data sources and research methods in this field, and discussed future research directions and trends.
In the past 37 years, the publication output of the LUCD field has experienced exponential growth, which can be divided into three stages: the budding stage from 1985 to 2000, the rapid development stage from 2001 to 2010, and the active stage from 2011 to 2022. The most influential journals include Remote Sensing of Environment, International Journal of Remote Sensing, and Remote Sensing. China, the United States, India, and Germany are the main research countries, while Wuhan University, Maryland University, and the Chinese Academy of Sciences are the main research institutions. With the passage of time, the data sources in this field have become increasingly diverse, from AVHRR and MODIS to SPOT, Landsat, Sentinel, and LiDAR, with higher spatial resolutions. The research methods have also become more diverse, from early band operation and the comparison of two land use images to later detection using machine learning, deep learning, and change detection models. From the current state of research on LUCD, there are many methods to choose from, and different methods are suitable for different situations. An efficient change detection solution should provide a flexible framework that integrates multiple data sources, holistic processing, intelligent methods, and prior knowledge guidance. With the continuous development and application of remote sensing technology, computer technology, artificial intelligence, big data, and cloud platforms, the need for automated, real-time, and intelligent change detection processing is becoming increasingly evident. LUCD technology needs to solve key problems such as automatic image registration, feature extraction, target interpretation, image fusion, and data cleaning, as well as automatic data mining and knowledge discovery from spatio-temporal large databases, in order to build an intelligent LUCD system.
Supplementary Materials
The following supporting information can be downloaded at: https://www.mdpi.com/article/10.3390/land12051050/s1, Table S1: Paper status of the main countries for land use change detection (LUCD) during 1985 to 2022; Table S2: Number of articles published by the top 10 institutions for land use change detection (LUCD) during 1985 to 2022.
Author Contributions
Conceptualization, W.S.; methodology, B.L. and W.S.; formal analysis, B.L. and W.S.; investigation, Z.M. and X.L.; resources, W.S.; writing—original draft preparation, B.L. and W.S.; writing—review and editing, W.S.; supervision, W.S.; All authors have read and agreed to the published version of the manuscript.
Funding
This research was supported by The Second Tibetan Plateau Scientific Expedition and Research (Grant No. 2019QZKK0603) and the Project of National Natural Science Foundation of China (Grant No. 42071233).
Institutional Review Board Statement
Not applicable.
Informed Consent Statement
Not applicable.
Data Availability Statement
All relevant data sets in this study are described in the manuscript.
Conflicts of Interest
The authors declare no conflict of interest.
References
- Song, X.-P.; Hansen, M.C.; Stehman, S.V.; Potapov, P.V.; Tyukavina, A.; Vermote, E.F.; Townshend, J.R. Global land change from 1982 to 2016. Nature 2018, 560, 639–643. [Google Scholar] [CrossRef] [PubMed]
- Coppin, P.; Jonckheere, I.; Nackaerts, K.; Muys, B.; Lambin, E. Review ArticleDigital change detection methods in ecosystem monitoring: A review. Int. J. Remote Sens. 2004, 25, 1565–1596. [Google Scholar] [CrossRef]
- Singh, A. Review article digital change detection techniques using remotely-sensed data. Int. J. Remote Sens. 1989, 10, 989–1003. [Google Scholar] [CrossRef]
- Zhang, M.; Kafy, A.-A.; Ren, B.; Zhang, Y.; Tan, S.; Li, J. Application of the optimal parameter geographic detector model in the identification of influencing factors of ecological quality in Guangzhou, China. Land 2022, 11, 1303. [Google Scholar] [CrossRef]
- Saha, M.; Kafy, A.-A.; Bakshi, A.; Almulhim, A.I.; Rahaman, Z.A.; Al Rakib, A.; Fattah, M.A.; Akter, K.S.; Rahman, M.T.; Zhang, M. Modelling microscale impacts assessment of urban expansion on seasonal surface urban heat island intensity using neural network algorithms. Energy Build. 2022, 275, 112452. [Google Scholar] [CrossRef]
- Yang, K.; Hou, H.; Li, Y.; Chen, Y.; Wang, L.; Wang, P.; Hu, T. Future urban waterlogging simulation based on LULC forecast model: A case study in Haining City, China. Sustain. Cities Soc. 2022, 87, 104167. [Google Scholar] [CrossRef]
- Siddik, M.S.; Tulip, S.S.; Rahman, A.; Islam, M.N.; Haghighi, A.T.; Mustafa, S.M.T. The impact of land use and land cover change on groundwater recharge in northwestern Bangladesh. J. Environ. Manag. 2022, 315, 115130. [Google Scholar] [CrossRef]
- Sobhani, P.; Esmaeilzadeh, H.; Mostafavi, H. Simulation and impact assessment of future land use and land cover changes in two protected areas in Tehran, Iran. Sustain. Cities Soc. 2021, 75, 103296. [Google Scholar] [CrossRef]
- Hussain, M.; Chen, D.; Cheng, A.; Wei, H.; Stanley, D. Change detection from remotely sensed images: From pixel-based to object-based approaches. ISPRS J. Photogramm. Remote Sens. 2013, 80, 91–106. [Google Scholar] [CrossRef]
- Chen, G.; Hay, G.J.; Carvalho, L.M.; Wulder, M.A. Object-based change detection. Int. J. Remote Sens. 2012, 33, 4434–4457. [Google Scholar] [CrossRef]
- Singh, P.; Kikon, N.; Verma, P. Impact of land use change and urbanization on urban heat island in Lucknow city, Central India. A remote sensing based estimate. Sustain. Cities Soc. 2017, 32, 100–114. [Google Scholar] [CrossRef]
- Zhu, Z.; Wulder, M.A.; Roy, D.P.; Woodcock, C.E.; Hansen, M.C.; Radeloff, V.C.; Healey, S.P.; Schaaf, C.; Hostert, P.; Strobl, P. Benefits of the free and open Landsat data policy. Remote Sens. Environ. 2019, 224, 382–385. [Google Scholar] [CrossRef]
- Verbesselt, J.; Hyndman, R.; Newnham, G.; Culvenor, D. Detecting trend and seasonal changes in satellite image time series. Remote Sens. Environ. 2010, 114, 106–115. [Google Scholar] [CrossRef]
- Yu, Y.; Guan, H.; Li, D.; Gu, T.; Wang, L.; Ma, L.; Li, J. A hybrid capsule network for land cover classification using multispectral LiDAR data. IEEE Geosci. Remote Sens. Lett. 2019, 17, 1263–1267. [Google Scholar] [CrossRef]
- Kamps, M.T.; Bouten, W.; Seijmonsbergen, A.C. LiDAR and orthophoto synergy to optimize object-based landscape change: Analysis of an active landslide. Remote Sens. 2017, 9, 805. [Google Scholar] [CrossRef]
- Roy, D.P.; Wulder, M.A.; Loveland, T.R.; Woodcock, C.E.; Allen, R.G.; Anderson, M.C.; Helder, D.; Irons, J.R.; Johnson, D.M.; Kennedy, R. Landsat-8: Science and product vision for terrestrial global change research. Remote Sens. Environ. 2014, 145, 154–172. [Google Scholar] [CrossRef]
- Chen, X.; Chen, J.; Shi, Y.; Yamaguchi, Y. An automated approach for updating land cover maps based on integrated change detection and classification methods. ISPRS J. Photogramm. Remote Sens. 2012, 71, 86–95. [Google Scholar] [CrossRef]
- Lin, Y.; Zhang, L.; Wang, N. A new time series change detection method for landsat land use and land cover change. In Proceedings of the 2019 10th International Workshop on the Analysis of Multitemporal Remote Sensing Images (MultiTemp), Shanghai, China, 5–7 August 2019; pp. 1–4. [Google Scholar]
- Zhu, Z.; Woodcock, C.E. Continuous change detection and classification of land cover using all available Landsat data. Remote Sens. Environ. 2014, 144, 152–171. [Google Scholar] [CrossRef]
- Kennedy, R.E.; Yang, Z.; Cohen, W.B. Detecting trends in forest disturbance and recovery using yearly Landsat time series: 1. LandTrendr—Temporal segmentation algorithms. Remote Sens. Environ. 2010, 114, 2897–2910. [Google Scholar] [CrossRef]
- Feizizadeh, B.; Mohammadzade Alajujeh, K.; Lakes, T.; Blaschke, T.; Omarzadeh, D. A comparison of the integrated fuzzy object-based deep learning approach and three machine learning techniques for land use/cover change monitoring and environmental impacts assessment. GISci. Remote Sens. 2021, 58, 1543–1570. [Google Scholar] [CrossRef]
- Moncrieff, G.R. Continuous land cover change detection in a critically endangered shrubland ecosystem using neural networks. Remote Sens. 2022, 14, 2766. [Google Scholar] [CrossRef]
- Lu, D.; Mausel, P.; Brondizio, E.; Moran, E. Change detection techniques. Int. J. Remote Sens. 2004, 25, 2365–2401. [Google Scholar] [CrossRef]
- Chughtai, A.H.; Abbasi, H.; Ismail, R.K. A review on change detection method and accuracy assessment for land use land cover. Remote Sensing Applications Society and Environment 2021, 22, 100482. [Google Scholar] [CrossRef]
- Zhang, M.; Kafy, A.-A.; Xiao, P.; Han, S.; Zou, S.; Saha, M.; Zhang, C.; Tan, S. Impact of urban expansion on land surface temperature and carbon emissions using machine learning algorithms in Wuhan, China. Urban Clim. 2023, 47, 101347. [Google Scholar] [CrossRef]
- Rousseau, D.M. The Oxford Handbook of Evidence-Based Management; Oxford University Press: Oxford, UK, 2012. [Google Scholar]
- Crane, D. Invisible Colleges: Diffusion of Knowledge in Scientific Communities; University Of Chicago Press: Chicago, IL, USA, 1972. [Google Scholar]
- Garfield, E. From the science of science to Scientometrics visualizing the history of science with HistCite software. J. Informetr. 2009, 3, 173–179. [Google Scholar] [CrossRef]
- Zhuang, J.; Nie, Q.; Man, W.; You, C. Visualization applications of the bibliometric software SATI and Histcite. In Proceedings of the Proceedings of the 2022 2nd International Conference on Business Administration and Data Science (BADS 2022), Xinjiang, China, 28–30 October 2022. [Google Scholar]
- Wang, W.; Lu, C. Visualization analysis of big data research based on Citespace. Soft Comput. 2020, 24, 8173–8186. [Google Scholar] [CrossRef]
- Aria, M.; Cuccurullo, C. bibliometrix: An R-tool for comprehensive science mapping analysis. J. Informetr. 2017, 11, 959–975. [Google Scholar] [CrossRef]
- Gagolewski, M. Bibliometric impact assessment with R and the CITAN package. J. Informetr. 2011, 5, 678–692. [Google Scholar] [CrossRef]
- Xie, H.; Zhang, Y.; Wu, Z.; Lv, T. A bibliometric analysis on land degradation: Current status, development, and future directions. Land 2020, 9, 28. [Google Scholar] [CrossRef]
- Xu, X.; Chen, Q.; Zhu, Z. Evolutionary overview of land consolidation based on bibliometric analysis in web of science from 2000 to 2020. Int. J. Environ. Res. Public Health 2022, 19, 3218. [Google Scholar] [CrossRef]
- Van de Schoot, R.; de Bruin, J.; Schram, R.; Zahedi, P.; de Boer, J.; Weijdema, F.; Kramer, B.; Huijts, M.; Hoogerwerf, M.; Ferdinands, G. An open source machine learning framework for efficient and transparent systematic reviews. Nat. Mach. Intell. 2021, 3, 125–133. [Google Scholar] [CrossRef]
- Van den Bulk, L.M.; Bouzembrak, Y.; Gavai, A.; Liu, N.; van den Heuvel, L.J.; Marvin, H.J. Automatic classification of literature in systematic reviews on food safety using machine learning. Curr. Res. Food Sci. 2022, 5, 84–95. [Google Scholar] [CrossRef] [PubMed]
- Ellegaard, O.; Wallin, J.A. The bibliometric analysis of scholarly production: How great is the impact? Scientometrics 2015, 105, 1809–1831. [Google Scholar] [CrossRef]
- Ting, S.; Ip, W.; Tsang, A.H. Is Naive Bayes a good classifier for document classification. Int. J. Softw. Eng. Its Appl. 2011, 5, 37–46. [Google Scholar]
- Pratama, B.Y.; Sarno, R. Personality classification based on Twitter text using Naive Bayes, KNN and SVM. In Proceedings of the 2015 International Conference on Data and Software Engineering (ICoDSE), Yogyakarta, Indonesia, 25–26 November 2015; pp. 170–174. [Google Scholar]
- Rish, I. An empirical study of the naive Bayes classifier. In Proceedings of the IJCAI 2001 Workshop on Empirical Methods in Artificial Intelligence, Seattle, WA, USA, 4 August 2001; pp. 41–46. [Google Scholar]
- Ferdinands, G.; Schram, R.; Bruin, J.d.; Bagheri, A.; Oberski, D.L.; Tummers, L.; Schoot, R.v.d. Active Learning for Screening Prioritization in Systematic Reviews—A Simulation Study; Utrecht University: Utrecht, The Netherlands, 2020. [Google Scholar]
- Howard, B.E.; Phillips, J.; Tandon, A.; Maharana, A.; Elmore, R.; Mav, D.; Sedykh, A.; Thayer, K.; Merrick, B.A.; Walker, V. SWIFT-Active Screener: Accelerated document screening through active learning and integrated recall estimation. Environ. Int. 2020, 138, 105623. [Google Scholar] [CrossRef]
- Van Haastrecht, M.; Sarhan, I.; Yigit Ozkan, B.; Brinkhuis, M.; Spruit, M. SYMBALS: A systematic review methodology blending active learning and snowballing. Front. Res. Metr. Anal. 2021, 6, 33. [Google Scholar] [CrossRef]
- Ros, R.; Bjarnason, E.; Runeson, P. A machine learning approach for semi-automated search and selection in literature studies. In Proceedings of the 21st International Conference on Evaluation and Assessment in Software Engineering, Karlskrona, Sweden, 15–16 June 2017; pp. 118–127. [Google Scholar]
- Liu, L.; Zou, G.; Zuo, Q.; Li, S.; Bao, Z.; Jin, T.; Liu, D.; Du, L. It is still too early to promote biodegradable mulch film on a large scale: A bibliometric analysis. Environ. Technol. Innov. 2022, 27, 102487. [Google Scholar] [CrossRef]
- Liang, Y.; Song, W. Ecological and Environmental Effects of Land Use and Cover Changes on the Qinghai-Tibetan Plateau: A Bibliometric Review. Land 2022, 11, 2163. [Google Scholar] [CrossRef]
- Liu, B.; Song, W.; Sun, Q. Status, Trend, and Prospect of Global Farmland Abandonment Research: A Bibliometric Analysis. Int. J. Environ. Res. Public Health 2022, 19, 16007. [Google Scholar] [CrossRef]
- Tripathi, M.; Kumar, S.; Sonker, S.; Babbar, P. Occurrence of author keywords and keywords plus in social sciences and humanities research: A preliminary study. COLLNET J. Scientometr. Inf. Manag. 2018, 12, 215–232. [Google Scholar] [CrossRef]
- Rodríguez-Soler, R.; Uribe-Toril, J.; Valenciano, J.D.P. Worldwide trends in the scientific production on rural depopulation, a bibliometric analysis using bibliometrix R-tool. Land Use Policy 2020, 97, 104787. [Google Scholar] [CrossRef]
- Townshend, J.R.; Justice, C.O.; Gurney, C.; McManus, J. The impact of misregistration on change detection. IEEE Trans. Geosci. Remote Sens. 1992, 30, 1054–1060. [Google Scholar] [CrossRef]
- Song, C.; Woodcock, C.E.; Seto, K.C.; Lenney, M.P.; Macomber, S.A. Classification and change detection using Landsat TM data: When and how to correct atmospheric effects? Remote Sens. Environ. 2001, 75, 230–244. [Google Scholar] [CrossRef]
- Cihlar, J.; Pultz, T.J.; Gray, A. Change detection with synthetic aperture radar. Int. J. Remote Sens. 1992, 13, 401–414. [Google Scholar] [CrossRef]
- Rignot, E.; Way, J.B. Monitoring freeze—Thaw cycles along North—South Alaskan transects using ERS-1 SAR. Remote Sens. Environ. 1994, 49, 131–137. [Google Scholar] [CrossRef]
- Lambin, E.F.; Strahler, A.H. Indicators of land-cover change for change-vector analysis in multitemporal space at coarse spatial scales. Int. J. Remote Sens. 1994, 15, 2099–2119. [Google Scholar] [CrossRef]
- Running, S.W.; Justice, C.; Salomonson, V.; Hall, D.; Barker, J.; Kaufmann, Y.; Strahler, A.H.; Huete, A.; Muller, J.-P.; Vanderbilt, V. Terrestrial remote sensing science and algorithms planned for EOS/MODIS. Int. J. Remote Sens. 1994, 15, 3587–3620. [Google Scholar] [CrossRef]
- Yuan, F.; Sawaya, K.E.; Loeffelholz, B.C.; Bauer, M.E. Land cover classification and change analysis of the Twin Cities (Minnesota) Metropolitan Area by multitemporal Landsat remote sensing. Remote Sens. Environ. 2005, 98, 317–328. [Google Scholar] [CrossRef]
- Desclée, B.; Bogaert, P.; Defourny, P. Forest change detection by statistical object-based method. Remote Sens. Environ. 2006, 102, 1–11. [Google Scholar] [CrossRef]
- Shalaby, A.; Tateishi, R. Remote sensing and GIS for mapping and monitoring land cover and land-use changes in the Northwestern coastal zone of Egypt. Appl. Geogr. 2007, 27, 28–41. [Google Scholar] [CrossRef]
- Abd El-Kawy, O.; Rød, J.; Ismail, H.; Suliman, A. Land use and land cover change detection in the western Nile delta of Egypt using remote sensing data. Appl. Geogr. 2011, 31, 483–494. [Google Scholar] [CrossRef]
- Rawat, J.; Kumar, M. Monitoring land use/cover change using remote sensing and GIS techniques: A case study of Hawalbagh block, district Almora, Uttarakhand, India. Egypt. J. Remote Sens. Space Sci. 2015, 18, 77–84. [Google Scholar] [CrossRef]
- Mou, L.; Bruzzone, L.; Zhu, X.X. Learning spectral-spatial-temporal features via a recurrent convolutional neural network for change detection in multispectral imagery. IEEE Trans. Geosci. Remote Sens. 2018, 57, 924–935. [Google Scholar] [CrossRef]
- Peng, D.; Zhang, Y.; Guan, H. End-to-end change detection for high resolution satellite images using improved UNet++. Remote Sens. 2019, 11, 1382. [Google Scholar] [CrossRef]
- Demiroz, F.; Haase, T.W. The concept of resilience: A bibliometric analysis of the emergency and disaster management literature. Local Gov. Stud. 2019, 45, 308–327. [Google Scholar] [CrossRef]
- Milevski, I.; Zwoliński, Z.; Meraj, G.; Mihajlović, L.M. Deforestation as a Cause of Increased Surface Runoff in the Catchment: Remote Sensing and SWAT Approach—A Case Study of Southern Serbia. Front. Environ. Sci. 2022, 10, 896404. [Google Scholar]
- Mekasha, S.T.; Suryabhagavan, K.; Kassawmar, T. Geospatial modeling of forest cover dynamics and impact on climate variability in Awi Zone, Ethiopia. Trop. Ecol. 2021, 63, 183–199. [Google Scholar] [CrossRef]
- Zhang, N.; Zhang, J.; Chen, W.; Su, J. Block-based variations in the impact of characteristics of urban functional zones on the urban heat island effect: A case study of Beijing. Sustain. Cities Soc. 2022, 76, 103529. [Google Scholar] [CrossRef]
- Liu, S.; Zhang, J.; Li, J.; Li, Y.; Zhang, J.; Wu, X. Simulating and mitigating extreme urban heat island effects in a factory area based on machine learning. Build. Environ. 2021, 202, 108051. [Google Scholar] [CrossRef]
- Zhang, C.; Chen, Y.; Lu, D. Detecting fractional land-cover change in arid and semiarid urban landscapes with multitemporal Landsat Thematic mapper imagery. GISci. Remote Sens. 2015, 52, 700–722. [Google Scholar] [CrossRef]
- Deng, J.S.; Wang, K.; Hong, Y.; Qi, J.G. Spatio-temporal dynamics and evolution of land use change and landscape pattern in response to rapid urbanization. Landsc. Urban Plan. 2009, 92, 187–198. [Google Scholar] [CrossRef]
- Wu, X.; Zhang, J.; Geng, X.; Wang, T.; Wang, K.; Liu, S. Increasing green infrastructure-based ecological resilience in urban systems: A perspective from locating ecological and disturbance sources in a resource-based city. Sustain. Cities Soc. 2020, 61, 102354. [Google Scholar] [CrossRef]
- Kpienbaareh, D.; Oduro Appiah, J. A geospatial approach to assessing land change in the built-up landscape of Wa Municipality of Ghana. Geogr. Tidsskr.-Dan. J. Geogr. 2019, 119, 121–135. [Google Scholar] [CrossRef]
- Li, G.; Lu, D.; Moran, E.; Calvi, M.F.; Dutra, L.V.; Batistella, M. Examining deforestation and agropasture dynamics along the Brazilian TransAmazon Highway using multitemporal Landsat imagery. GISci. Remote Sens. 2019, 56, 161–183. [Google Scholar] [CrossRef]
- Kangabam, R.D.; Selvaraj, M.; Govindaraju, M. Assessment of land use land cover changes in Loktak Lake in Indo-Burma Biodiversity Hotspot using geospatial techniques. Egypt. J. Remote Sens. Space Sci. 2019, 22, 137–143. [Google Scholar] [CrossRef]
- Scharsich, V.; Mtata, K.; Hauhs, M.; Lange, H.; Bogner, C. Analysing land cover and land use change in the Matobo National Park and surroundings in Zimbabwe. Remote Sens. Environ. 2017, 194, 278–286. [Google Scholar] [CrossRef]
- Bruzzone, L.; Prieto, D.F. Automatic analysis of the difference image for unsupervised change detection. IEEE Trans. Geosci. Remote Sens. 2000, 38, 1171–1182. [Google Scholar] [CrossRef]
- Mas, J.-F. Monitoring land-cover changes: A comparison of change detection techniques. Int. J. Remote Sens. 1999, 20, 139–152. [Google Scholar] [CrossRef]
- Dai, X.; Khorram, S. The effects of image misregistration on the accuracy of remotely sensed change detection. IEEE Trans. Geosci. Remote Sens. 1998, 36, 1566–1577. [Google Scholar]
- Petit, C.; Scudder, T.; Lambin, E. Quantifying processes of land-cover change by remote sensing: Resettlement and rapid land-cover changes in south-eastern Zambia. Int. J. Remote Sens. 2001, 22, 3435–3456. [Google Scholar] [CrossRef]
- Zhan, X.; Sohlberg, R.; Townshend, J.; DiMiceli, C.; Carroll, M.; Eastman, J.; Hansen, M.; DeFries, R. Detection of land cover changes using MODIS 250 m data. Remote Sens. Environ. 2002, 83, 336–350. [Google Scholar] [CrossRef]
- Verbesselt, J.; Zeileis, A.; Herold, M. Near real-time disturbance detection using satellite image time series. Remote Sens. Environ. 2012, 123, 98–108. [Google Scholar] [CrossRef]
- Hansen, M.C.; Loveland, T.R. A review of large area monitoring of land cover change using Landsat data. Remote Sens. Environ. 2012, 122, 66–74. [Google Scholar] [CrossRef]
- Zhu, Z.; Woodcock, C.E.; Olofsson, P. Continuous monitoring of forest disturbance using all available Landsat imagery. Remote Sens. Environ. 2012, 122, 75–91. [Google Scholar] [CrossRef]
- Wen, D.; Huang, X.; Bovolo, F.; Li, J.; Ke, X.; Zhang, A.; Benediktsson, J.A. Change detection from very-high-spatial-resolution optical remote sensing images: Methods, applications, and future directions. IEEE Geosci. Remote Sens. Mag. 2021, 9, 68–101. [Google Scholar] [CrossRef]
- Liu, M.; Shi, Q.; Marinoni, A.; He, D.; Liu, X.; Zhang, L. Super-resolution-based change detection network with stacked attention module for images with different resolutions. IEEE Trans. Geosci. Remote Sens. 2021, 60, 1–18. [Google Scholar] [CrossRef]
- Hemati, M.; Hasanlou, M.; Mahdianpari, M.; Mohammadimanesh, F. A systematic review of landsat data for change detection applications: 50 years of monitoring the earth. Remote Sens. 2021, 13, 2869. [Google Scholar] [CrossRef]
- Sun, Y.; Zhang, X.; Huang, J.; Wang, H.; Xin, Q. Fine-grained building change detection from very high-spatial-resolution remote sensing images based on deep multitask learning. IEEE Geosci. Remote Sens. Lett. 2020, 19, 1–5. [Google Scholar] [CrossRef]
- Olsson, H. Regression functions for multitemporal relative calibration of Thematic Mapper data over boreal forest. Remote Sens. Environ. 1993, 46, 89–102. [Google Scholar] [CrossRef]
- Kitzberger, T.; Veblen, T.T. Fire-induced changes in northern Patagonian landscapes. Landsc. Ecol. 1999, 14, 1–15. [Google Scholar] [CrossRef]
- Kirkman, L.K.; Lide, R.F.; Wein, G.; Sharitz, R.R. Vegetation changes and land-use legacies of depression wetlands of the western coastal plain of South Carolina: 1951–1992. Wetlands 1996, 16, 564–576. [Google Scholar] [CrossRef]
- Bagan, H.; Takeuchi, W.; Kinoshita, T.; Bao, Y.; Yamagata, Y. Land cover classification and change analysis in the Horqin Sandy Land from 1975 to 2007. IEEE J. Sel. Top. Appl. Earth Obs. Remote Sens. 2010, 3, 168–177. [Google Scholar] [CrossRef]
- Wolter, P.T.; White, M.A. Recent forest cover type transitions and landscape structural changes in northeast Minnesota, USA. Landsc. Ecol. 2002, 17, 133–155. [Google Scholar] [CrossRef]
- Lunetta, R.S.; Knight, J.F.; Ediriwickrema, J.; Lyon, J.G.; Worthy, L.D. Land-cover change detection using multi-temporal MODIS NDVI data. Remote Sens. Environ. 2006, 105, 142–154. [Google Scholar] [CrossRef]
- Szostak, M.; Hawryło, P.; Piela, D. Using of Sentinel-2 images for automation of the forest succession detection. Eur. J. Remote Sens. 2018, 51, 142–149. [Google Scholar] [CrossRef]
- Szostak, M.; Pietrzykowski, M.; Likus-Cieślik, J. Reclaimed area land cover mapping using Sentinel-2 Imagery and LiDAR Point Clouds. Remote Sens. 2020, 12, 261. [Google Scholar] [CrossRef]
- Lobo, F.d.L.; Souza-Filho, P.W.M.; Novo, E.M.L.d.M.; Carlos, F.M.; Barbosa, C.C.F. Mapping mining areas in the Brazilian amazon using MSI/Sentinel-2 imagery (2017). Remote Sens. 2018, 10, 1178. [Google Scholar] [CrossRef]
- Morisette, J.; Khorram, S.; Mace, T. Land-cover change detection enhanced with generalized linear models. Int. J. Remote Sens. 1999, 20, 2703–2721. [Google Scholar] [CrossRef]
- Lunetta, R.S.; Ediriwickrema, J.; Johnson, D.M.; Lyon, J.G.; McKerrow, A. Impacts of vegetation dynamics on the identification of land-cover change in a biologically complex community in North Carolina, USA. Remote Sens. Environ. 2002, 82, 258–270. [Google Scholar] [CrossRef]
- Lu, D.; Mausel, P.; Batistella, M.; Moran, E. Land-cover binary change detection methods for use in the moist tropical region of the Amazon: A comparative study. Int. J. Remote Sens. 2005, 26, 101–114. [Google Scholar] [CrossRef]
- Kennedy, R.E.; Cohen, W.B.; Schroeder, T.A. Trajectory-based change detection for automated characterization of forest disturbance dynamics. Remote Sens. Environ. 2007, 110, 370–386. [Google Scholar] [CrossRef]
- Aguirre-Gutiérrez, J.; Seijmonsbergen, A.C.; Duivenvoorden, J.F. Optimizing land cover classification accuracy for change detection, a combined pixel-based and object-based approach in a mountainous area in Mexico. Appl. Geogr. 2012, 34, 29–37. [Google Scholar] [CrossRef]
- Jin, S.; Yang, L.; Danielson, P.; Homer, C.; Fry, J.; Xian, G. A comprehensive change detection method for updating the National Land Cover Database to circa 2011. Remote Sens. Environ. 2013, 132, 159–175. [Google Scholar] [CrossRef]
- Sefrin, O.; Riese, F.M.; Keller, S. Deep learning for land cover change detection. Remote Sens. 2020, 13, 78. [Google Scholar] [CrossRef]
- Zhang, L.; Hu, X.; Zhang, M.; Shu, Z.; Zhou, H. Object-level change detection with a dual correlation attention-guided detector. ISPRS J. Photogramm. Remote Sens. 2021, 177, 147–160. [Google Scholar] [CrossRef]
- Calderón-Loor, M.; Hadjikakou, M.; Bryan, B.A. High-resolution wall-to-wall land-cover mapping and land change assessment for Australia from 1985 to 2015. Remote Sens. Environ. 2021, 252, 112148. [Google Scholar] [CrossRef]
- Jing, C.; Zhou, W.; Qian, Y.; Yu, W.; Zheng, Z. A novel approach for quantifying high-frequency urban land cover changes at the block level with scarce clear-sky Landsat observations. Remote Sens. Environ. 2021, 255, 112293. [Google Scholar] [CrossRef]
- Zhu, Z.; Woodcock, C.E. Automated cloud, cloud shadow, and snow detection in multitemporal Landsat data: An algorithm designed specifically for monitoring land cover change. Remote Sens. Environ. 2014, 152, 217–234. [Google Scholar] [CrossRef]
- Gorelick, N.; Hancher, M.; Dixon, M.; Ilyushchenko, S.; Thau, D.; Moore, R. Google Earth Engine: Planetary-scale geospatial analysis for everyone. Remote Sens. Environ. 2017, 202, 18–27. [Google Scholar] [CrossRef]
- Pontius, R.G., Jr.; Millones, M. Death to Kappa: Birth of quantity disagreement and allocation disagreement for accuracy assessment. Int. J. Remote Sens. 2011, 32, 4407–4429. [Google Scholar] [CrossRef]
- Nosek, B.A.; Alter, G.; Banks, G.C.; Borsboom, D.; Bowman, S.D.; Breckler, S.J.; Buck, S.; Chambers, C.D.; Chin, G.; Christensen, G. Promoting an open research culture. Science 2015, 348, 1422–1425. [Google Scholar] [CrossRef] [PubMed]
Figure 1.
Data collection and cleaning flow diagram.

Figure 2.
Research design and workflow.

Figure 3.
Annual publication trend of land use change detection (LUCD) from 1985 to 2022.

Figure 4.
Source growth curve of land use change detection (LUCD) journals from 1985 to 2022.

Figure 5.
National cooperation network in the field of land use change detection (LUCD) from 1985 to 2022.
Figure 5.
National cooperation network in the field of land use change detection (LUCD) from 1985 to 2022.

Figure 6.
Institutional cooperation network in the field of land use change detection (LUCD) from 1985 to 2022.
Figure 6.
Institutional cooperation network in the field of land use change detection (LUCD) from 1985 to 2022.

Figure 7.
Time trend of author keywords in the field of land use change detection (LUCD) from 1985 to 2022.
Figure 7.
Time trend of author keywords in the field of land use change detection (LUCD) from 1985 to 2022.

Figure 8.
Multiple correspondence analysis of keywords in the field of land use change detection (LUCD) from 1985 to 2022.
Figure 8.
Multiple correspondence analysis of keywords in the field of land use change detection (LUCD) from 1985 to 2022.

Figure 9.
Theme evolution in the field of land use change detection (LUCD) from 1985 to 2022.

Figure 10.
Satellite data and launch time used in different periods of land use change detection (LUCD).
Figure 10.
Satellite data and launch time used in different periods of land use change detection (LUCD).

Table 1.
Top 10 journals with the most publications on land use change detection (LUCD) from 1985 to 2022.
Table 1.
Top 10 journals with the most publications on land use change detection (LUCD) from 1985 to 2022.
| Sources | Articles | Total Citations (TC) | H-Index |
|---|---|---|---|
| Remote Sensing | 585 | 11,380 | 49 |
| Remote Sensing of Environment | 313 | 36,064 | 98 |
| International Journal of Remote Sensing | 242 | 13,400 | 50 |
| IEEE Transactions on Geoscience and Remote Sensing | 153 | 7961 | 47 |
| IEEE Journal of Selected Topics in Applied Earth Observations and Remote Sensing | 110 | 2019 | 25 |
| International Journal of Applied Earth Observation and Geoinformation | 88 | 2310 | 28 |
| ISPRS Journal of Photogrammetry and Remote Sensing | 88 | 5593 | 38 |
| Environmental Monitoring and Assessment | 65 | 1438 | 19 |
| Journal of Applied Remote Sensing | 58 | 591 | 12 |
| Photogrammetric Engineering and Remote Sensing | 58 | 2962 | 26 |
Note: The h-index is a quantitative index used to characterize the number and level of academic outputs, which was proposed by American physicist Jorge E. Hirsch in 2005; the higher the value, the greater the impact of the journal in the field.
Disclaimer/Publisher’s Note: The statements, opinions and data contained in all publications are solely those of the individual author(s) and contributor(s) and not of MDPI and/or the editor(s). MDPI and/or the editor(s) disclaim responsibility for any injury to people or property resulting from any ideas, methods, instructions or products referred to in the content. |
© 2023 by the authors. Licensee MDPI, Basel, Switzerland. This article is an open access article distributed under the terms and conditions of the Creative Commons Attribution (CC BY) license (https://creativecommons.org/licenses/by/4.0/).
Share and Cite
MDPI and ACS Style
Liu, B.; Song, W.; Meng, Z.; Liu, X. Review of Land Use Change Detection—A Method Combining Machine Learning and Bibliometric Analysis. Land 2023, 12, 1050. https://doi.org/10.3390/land12051050
AMA Style
Liu B, Song W, Meng Z, Liu X. Review of Land Use Change Detection—A Method Combining Machine Learning and Bibliometric Analysis. Land. 2023; 12(5):1050. https://doi.org/10.3390/land12051050
Chicago/Turabian StyleLiu, Bo, Wei Song, Zhan Meng, and Xinwei Liu. 2023. "Review of Land Use Change Detection—A Method Combining Machine Learning and Bibliometric Analysis" Land 12, no. 5: 1050. https://doi.org/10.3390/land12051050
Note that from the first issue of 2016, this journal uses article numbers instead of page numbers. See further details here.