Review

Land Consumption Classification Using Sentinel 1 Data: A Systematic Review

1
Geodesy and Geomatics Division—DICEA, Sapienza University of Rome, via Eudossiana, 00184 Rome, Italy
2
Sapienza School for Advanced Studies, Sapienza University of Rome, viale Regina Elena, 00161 Rome, Italy
3
ISPRA—Italian Institute for Environmental Protection and Research, via Vitaliano Brancati, 00144 Rome, Italy
*
Author to whom correspondence should be addressed.
Land 2023, 12(4), 932; https://doi.org/10.3390/land12040932
Submission received: 2 March 2023 / Revised: 13 April 2023 / Accepted: 14 April 2023 / Published: 21 April 2023
(This article belongs to the Section Land – Observation and Monitoring)

Abstract

:
The development of remote sensing technology has redefined the approaches to the Earth’s surface monitoring. The Copernicus Programme promoted by the European Space Agency (ESA) and the European Union (EU), through the launch of the Synthetic Aperture Radar (SAR) Sentinel-1 and the multispectral Sentinel-2 satellites, has provided a valuable contribution to monitoring the Earth’s surface. There are several review articles on the land use/land cover (LULC) matter using Sentinel images, but it lacks a methodical and extensive review in the specific field of land consumption monitoring, concerning the application of SAR images, in particular Sentinel-1 images. In this paper, we explored the potential of Sentinel-1 images to estimate land consumption using mathematical modeling, focusing on innovative approaches. Therefore, this research was structured into three principal steps: (1) searching for appropriate studies, (2) collecting information required from each paper, and (3) discussing and comparing the accuracy of the existing methods to evaluate land consumption and their applied conditions using Sentinel-1 Images. Current research has demonstrated that Sentinel-1 data has the potential for land consumption monitoring around the world, as shown by most of the studies reviewed: the most promising approaches are presented and analyzed.

1. Introduction

Land consumption, or land take, can be defined as the conversion of agricultural or naturally healthy soil into residential, commercial, or other developed areas with artificial covering (consumed land), due to the removal of vegetation and the loss of natural or semi-natural soil [1].
The European Union (EU) and the Member States have soil-concerned reporting duties because of many international agreements in which the EU is involved (e.g., Sustainable Development Goals—SDGs; United Nations Convention to Combat Desertification—UN CCD; United Nations Framework Convention on Climate Change—UN FCCC; United Nations Convention on Biological Diversity—UN CBD) [2]. Moreover, assessing the growth pace of land consumption is significant in terms of the European objectives: no net land take by 2050 [3] and the five EU Missions, belonging to the Horizon Europe research and innovation program for the years 2021–2027, a new way to create practical solutions to some of our most critical challenges by 2030 [4].
Despite that, at the moment, there are no signs of change in chronological trends: land consumption proceeds to increase annually at the European and global levels [5,6,7]. Soil monitoring is still not implemented in a systematic, harmonized way. In comparison to other precious resources, such as water, EU Member States have no legal obligations to report on soil. Actually, in many Member States, there are weak, insufficient, or non-active soil monitoring programs, compromising the EU soil monitoring, which results in a lack of data to assess policy options [2].
The Earth Observation (EO) platforms, with the advancement of remote sensing technology, have become increasingly suitable to collect a large range of data. These data have become fundamental for environmental monitoring through mapping earth features and detecting changes on the land surface. Therefore, researchers have analyzed a widening set of approaches, involving processes, techniques, methods, and algorithms, for mapping land consumption, detecting changes, and testing different datasets collected by different sensors. Since the development of new approaches is strictly interlinked with the growth of technology, it is appropriate to constantly examine the available instruments to detect and classify, and then monitor the trend of this phenomenon, to mitigate the potential for bad societal consequences well in advance.
A wide range of EO satellites have been launched in space, and correspondingly, many kinds of images are available: optical, microwave Synthetic Aperture Radar (SAR) [8,9], multispectral (MS), or hyperspectral (HS) [10]. Many traditional approaches of land consumption mapping based on optical and multispectral images are still relatively limited in their applications since they are affected by various factors, such as the influences of atmospheric conditions, changing seasons, satellite sensors, and solar elevations, reducing the accuracy of the results [11].
To date, global scale land consumption mapping (e.g., national level) is mostly conducted through the assistance of well-trained operators able to recognize the transformations that have taken place, aided by suitable spectral indices masks [12,13]. This requires a time-consuming and expensive process. For this reason, it is important to define and implement automatic methods that are able to speed up land consumption mapping and cut costs. Some remote sensing image classification techniques have been developed over the last decades for land consumption mapping or change detection. They include the commonly used supervised or unsupervised methods applying pixel-based or object-based approaches. Some of the existing methods are based on a mix of semi-automatic classification and photointerpretation of satellite and airborne optical images [7], whereas more recent methods are focused on spectral indices [14,15], machine learning technics [16], integration of SAR and optical images [1], or a combination between radar and Geospatial Big Data [17]. However, those methods always are dependent on the datasets used. Therefore, this paper wants to focus on Sentinel-1 data to monitor land consumption and soil sealing because of their potential advantages and availability, providing large opportunities for future research.

Goal of This Study

A lot of existing reviews are focused on land use/land cover (LULC) classification or LULC change detection monitoring, focusing on different remote sensing classification approaches, optical/multispectral images, and algorithms utilized [18,19,20,21,22,23,24,25,26]. Other reviews are focused purely on the impact of land use and its effects on the environment [27,28]. Indeed, the impact of the land cover on land surface temperature, biodiversity, evapotranspiration, groundwater table, peak runoff, infiltration, stormwater, pollution, imperviousness, etc. is becoming more significant. Therefore, there are also a lot of review articles on the LULC matter, but to our best knowledge, a systematic and comprehensive review in the specific field of Land Consumption Monitoring, concerning the application of SAR images, in particular Sentinel-1 images, is not available yet.
It comes out that a more systematic analysis is necessary to get an extensive and objective comprehension of the applications of medium-resolution SAR images for Land Consumption Classification and Change Detection analysis. The different applications for which Sentinel-1 images were applied and the problems encountered in such studies are beneficial information for researchers interested in Land Consumption and medium-resolution SAR images.
Through a meta-analysis, the publications related to Sentinel-1 and Land Consumption are identified, and the main scientific advances noted in the literature are summarized. Finally, a conclusion, critical summary, and future perspective are given.

2. Background Analysis

2.1. Fundamentals on Land Consumption

According to ISPRA and EEA, land consumption, or land take, is
“a phenomenon associated with the loss of an important environmental resource: agricultural, natural, or semi-natural land. The phenomenon refers to an increase of the artificial covering of the ground, due to settlement dynamics. It is defined as a change from a non-artificial covering (unconsumed land) to an artificial covering of the soil (consumed land)”
[7,29]
Although we take it for granted, “soil is one of the most important fragile, non-renewable resource in our lifetime that needs to be carefully managed and safeguarded for future generations. Indeed, soil is the basis of 95% of our food. It provides clean water and habitats for biodiversity while contributing to climate resilience. It supports our cultural heritage and landscapes and is the basis of our economy and prosperity” [2].
Thus, the soil is involved in many ecosystem functions (e.g., filtration and transformation of many substances, biomass production, cultural and historic functions, habitat provision, etc.) [30]. Soil is also an essential—and often neglected—element of the climate system. It allows for storing huge quantities of carbon, just second after the oceans. Mostly, climate change might be the effect of more carbon being stored in plants and soil or more carbon being released into the atmosphere, depending on the regions and agricultural techniques used. The restoration of key ecosystems on land and land sustainable use in rural and urban areas can facilitate us mitigating and adapting to climate change [29].
One centimeter of soil can take hundreds of years to form but can get lost in just a single storm or industrial incident [2]. Its loss is mostly attributable to industrial activities, urbanization, construction of new buildings and infrastructures, expansion, development, densification of urban areas, etc. [1,31]. Land consumption consequences are various, namely, contamination, loss of soil fertility and the ability to produce raw materials, erosion, hydrologic cycle alteration, impact on biodiversity, loss of high-quality agricultural land, higher risk of flooding, effects on climate changes, cultural and landscape heritage, degradation of the landscape, scenic pollution, etc. [7,31].
Furthermore, soils are threatened throughout Europe and the world in general because of a number of human activities (e.g., intensive agriculture, production and land use, current consumption patterns, and industrial and construction activities) which are exacerbated by climate change. By 2050, 500–700 million people worldwide are likely to be forced to migrate due to a combination of climate change and soil degradation. By an accurate analysis, the Mission Board Soil Health and Food and the Joint Research Centre (JRC) concluded that 60–70% of soils in the EU are in an unhealthy state [32].
At the global level, the temperature increase is due to the release of greenhouse gases in the atmosphere, the increase of the saturated water vapor pressure, and the rise of the sea surface [33]. By contrast, in urban areas, the relative humidity has significantly decreased due to the diminution in the amount of evaporation (steam amount) based on the diminution of the water surface and green areas and the increase in the temperature due to the heat storage by buildings and waste heat [1,34]. In addition, part of the precipitation that drops on the soil surface, infiltrates, and crosses the subsoil, whereas part of that evaporates into the atmosphere, falls to the soil surface, and is finally introduced into water bodies, including lakes, oceans and rivers [35]. Nevertheless, once the soil surface is covered, this natural cycle of water will be greatly altered [36]. High waterproofing areas have various effects on water balance and water regulation [37].
In the context of increasing urban population and economic development, the built-up areas have been widely expanding in large urban cities at a world scale [38]. According to United Nations [39], by 2030, the urban population will represent 60% of the total global population. Knowledge of the spatial distribution of the built-up areas is essential for the analysis of urban expansion and urban heat islands, as well as for the development of strategies to prevent disaster management and to detect abusive phenomena. Therefore, land consumption monitoring is a fundamental requirement for defining appropriate policies and sustainable planning. In fact, an efficient land consumption monitoring strategy makes it possible to quantify changes in the territory, identify trends, and adopt effective development policies. At the European level, this phenomenon is an important issue, which has prompted the European Commission to publish guidelines of good practice to limit, mitigate, or compensate for soil sealing [37] to reduce land consumption and changes in the LULC [1].

2.2. Fundamentals on SAR Images and Sentinel-1 Mission

Although optical images have a high capability for urban monitoring [12,18], they still have some limitations, including their dependence on climatic conditions and spectral information: clouds appear impenetrable in all-optical frequency bands, they completely distort the spectral reflectance signal, and obscure the view of the ground below. Consequently, there are considerable data gaps in spatiotemporal domains. Therefore, cloud cover is a significant obstacle for applications that require continuous observation over a given period, such as land take monitoring [40]. The inability to obtain optical images at night/darkness is another problem that can make the land cover classification challenging [41].
The use of SAR represents a new era in land monitoring remote sensing technology. SAR enables imaging in all weather conditions and at night, with the ability to detect phenomena based on their location, roughness, and geometry, facilitating the land cover classification [42,43]. SAR images can be particularly useful for monitoring areas where optical images are unusable since the cloud cover or the dark time is almost permanent [41,44]. SAR sensors can, therefore, regularly provide information about the terrain. This makes it possible to monitor rapid changes in land use and the development of urban areas, providing helpful information for land use planning and reducing the land take. For example, JERS-1 SAR series images were used to analyze land use changes [45] and COSMO-Skymed data were used for land cover classification [46]. Then, other works include unsupervised change detection [1,47].
Built-up areas, such as buildings, are typically characterized by high backscattering values and do not change significantly in a short time: hence, they can be easily recognized in multitemporal image series [48] Built-up areas are also highly coherent. Considering two multitemporal images, for vegetation the corresponding “Time Average Coherence” values are significantly lower with respect to the ones of the built-up areas, which are in general highly coherent [49]. This determines that the stable increase in coherence and intensity of the signal most likely indicates land consumption [50].
Moreover, ascending and descending orbits are complementary. Only a small number of pixels representing built-up areas are selected simultaneously in both the ascending and descending maps. This shows the strong dependence of the building representation within the SAR backscattering on their specific geometric positioning [51].
There are many existing and available medium-resolution satellite images (10–30 m) for land consumption mapping, including Envisat and ERS-1/2, but Sentinel 1 image results are still one of the most promising because they are freely accessible and they improve information, in terms of reliability and timeliness of the data [52].
Sentinel-1 is an imaging radar mission, by the European Space Agency’s (ESA) Copernicus Sentinel-1 constellation [52], which supplies continuous all-weather, day-and-night imagery at C band. The mission consists of a constellation of two satellites, Sentinel-1A and Sentinel-1B, which share the same orbital plane. The first of the dual Sentinel-1 satellites was launched on 3 April 2014 and its identical twin was launched on 25 April 2016, but it was actually decommissioned because of an anomaly related to the instrument electronics power supply provided by the satellite platform, leaving it unable to deliver reliable radar data [4]. The Sentinel-1 mission operates in four unique imaging modes with different resolutions (down to 5 m) and coverage (up to 400 km). It provides double polarization capability, very short revisit times, and fast product delivery. Precise measurements of spacecraft position and attitude are available for each observation (Table 1).
SAR has the advantage of operating at wavelengths unimpeded by cloud cover or a lack of illumination and can acquire data on a site during day or night in all weather conditions. Sentinel-1, with its C-SAR instrument, is able to offer reliable, repeated wide-area monitoring [52,53]. The Sentinel-1 mission was also planned to provide improved revisit frequency, coverage, timeliness and reliability for operational services, and applications requiring long time series [52,54].

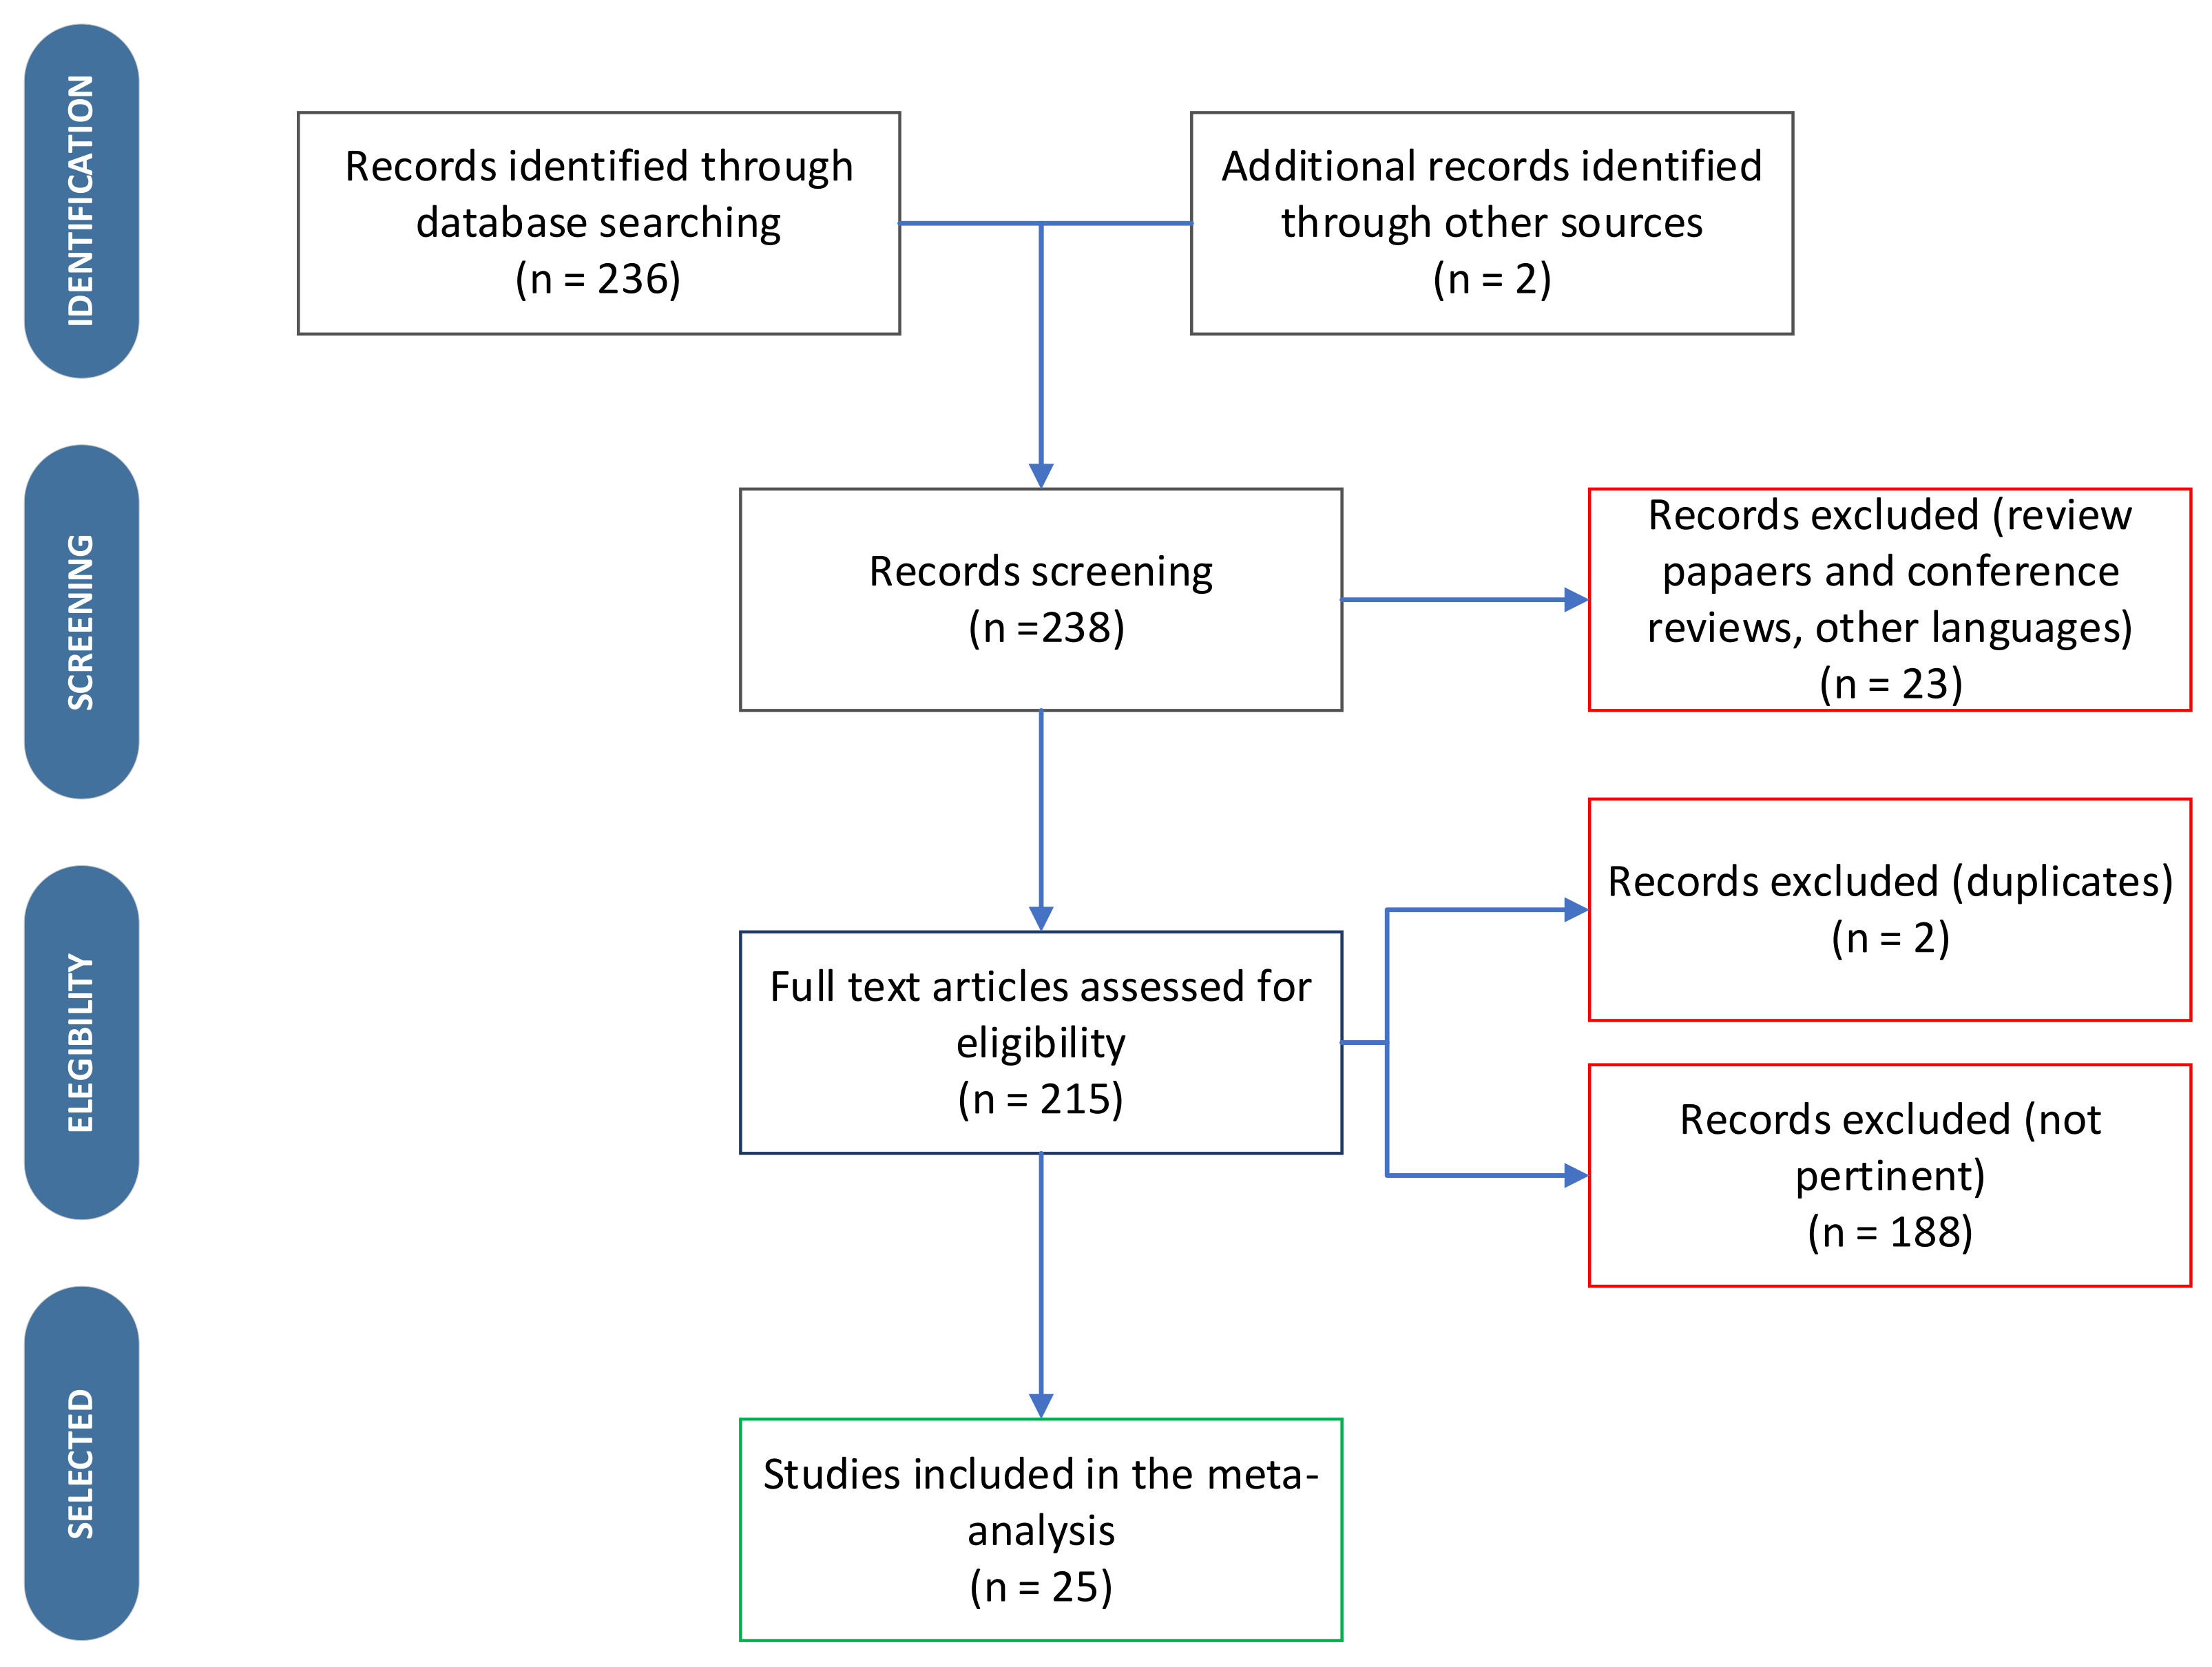
3. Materials and Methods

In this paper, we reviewed the available literature on the potential of Sentinel-1 images to estimate land consumption using different kinds of mathematical modeling, focusing, in particular, on innovative techniques.
Accordingly, this research was organized into three main steps: (1) searching for relevant papers, (2) collecting information needed from each paper, and (3) analyzing the existing methods, their accuracy, and their applied conditions.
In the first step, an extensive survey of studies involving Sentinel-1 images for land consumption mapping and change detection was conducted. To find potentially relevant research papers, we used Scopus “http://www.scopus.com (accessed on 15 February 2022)” which is a web database of peer-reviewed (and non-peer-reviewed) literature. We selected simultaneously the keywords ‘land consumption’ and ‘Sentinel 1’. We also included variants of these terms, such as ‘soil consumption’, ‘land take’, ‘soil sealing’, and ‘urban land cover’. The last literature search was performed in February 2022. The automated query returned a total of 234 articles. Then, the specific search was limited to peer-reviewed journal papers, after removing review papers (as they are not original methods for land consumption monitoring), conference reviews (for the same reason before), erratum, and articles still in the press. Only English languages were included. A total of 215 articles were identified in this process and manually examined. After reading the abstract and, where necessary, the complete article, we extracted the relevant information from each paper. For this purpose, information related to three types of parameters was collected from each paper: specific application (e.g., land use, land cover, land consumption, impact assessment, etc.), type and name of images used (e.g., Sentinel-1, Terrasar-X, Landsat, Sentinel-2, etc.), and analysis type (e.g., mapping, classification, change detection, quantitative analysis, etc.). Thus, we eliminated sources that were clearly not focused on the theme of the research (that were not focused on land consumption classification/change detection using Sentinel-1 images) and n. 2 duplicated articles. Therefore, a total number of 23 studies, that met the explained criteria, were selected. Moreover, 2 papers not resulting from the research were added from another source, Google Scholar “https://scholar.google.com/ (accessed on 8 February 2022)”, for a total of 25 papers (Figure 1). The full text of such papers was read to extract the following detailed information:
  • Type of analysis conducted (e.g., mapping, classification or change detection);
  • Software used (e.g., SNAP, ENVI, etc.);
  • Methodologies implemented (e.g., combining Radar and Geospatial Big Data, integrating SAR and Optical data, considering Sentinel-1 features, etc.);
  • Algorithms applied (e.g., supervised/unsupervised Machine Learning (ML) algorithms, Bayesian Algorithms, Object/Pixel-Based learning algorithms, etc.);
  • Study areas considered (e.g., local/city scale, national scale, global scale, etc.);
  • Dataset considered (e.g., orbits, spatial and temporal resolution, number of images, etc.);
  • Results obtained (e.g., overall accuracy, k-index, producer accuracy, visual analysis accuracy, etc.);
  • Potential issues and gained benefits.
A simple statistical analysis was conducted in Scopus environment using the above data to analyze the current status and trends in the use of Sentinel-1 images to monitor land consumption. Statistics included the number of papers published annually from 2014 (year of the satellites’ launch) to today, as shown in Figure 2a, the number of journal articles by country, Figure 2b, the percentage of papers by type, Figure 2c, the number of studies by author, Figure 2d.
Analyzing charts, it results that the first article about land consumption monitoring with Sentinel-1 data was published in 2016, which can be explained by considering that the first Sentinel-1 was launched in 2014. Indeed, graphs show a gradual increase over the years since the issue is becoming increasingly popular across researchers and institutions and we expect an even greater sprawl. Moreover, it is outlined that Italy and China are actually the countries more specialized in the subject matter, even if other countries all over the world are increasingly evolving.

4. Analysis of Existing Approaches to Map Land Consumption with Sentinel-1 Images

The analysis of the selected papers is organized as follows. Section 4.1 briefly introduces the study area, the dataset, and the software used in different studies. In Section 4.2, a detailed description of the proposed methodologies is given together with the discussion of results. Furthermore, the structured comparison of methodologies is presented afterwards, where characteristics, accuracies, strengths, and weaknesses of the proposed approaches are discussed.

4.1. Study Area, Dataset, and Software

A total of 22 studies out of 25 selected have chosen a local/city/regional scale study area. Just three articles [17,55,56] consider the national scale as a study area to detect land consumption. These methods, indeed, were used to produce, respectively, a comparative study of 40 cities across the world and the national land consumption map of Italy. Many well-labeled points were used as a validation test to validate and compare the results chosen as a subset of the study area to reduce the computational effort.
To download Sentinel-1 and Sentinel-2 images, Copernicus Open Access Hub (https://scihub.copernicus.eu, accessed on 1 March 2023) is often used, previously known as Sentinels Scientific Data Hub. It provides complete, free, and open access to Sentinel-1, Sentinel-2, Sentinel-3, and Sentinel-5P user products, starting from the In-Orbit Commissioning Review (IOCR).
Software more commonly used to pre-process Sentinel-1 images is SNAP, which is open source, intuitive, and easy to use. It can be downloaded from the ESA website and is composed of toolboxes that can manage, process, analyze, and visualize both multispectral and SAR images. It gives the opportunity to non-expert users to implement reliable pre-processing analysis in a short time. It has been used by nine authors to correct images before using them in a single process (Table 2). The other five authors used ENVI, integrated with Esri’s ArcGIS platform, also a valuable, reliable, accurate, but paid software (Table 2). Just one author [49] used ERDAS Image software to apply the most popular supervised classification method, Maximum Likelihood Classification (MLC).
Lastly, Google Earth Engine is used by different studies to implement pre-processing and classification algorithms. It is a very useful instrument, since it allows for directly visualizing images through the Copernicus hub and working on them without downloading them, and quickly changing location, type of products, etc.

4.2. Methodologies

The aim of this section is to analyze and compare existing methodologies used to classify land consumption with Sentinel-1 images. Table 3 summarizes the main characteristics of the process accustomed by selected articles.
Different approaches have been used recently to map LULC [19,21,73]. This paper does not consider these approaches, but only those focused on land consumption/soil sealing, considering that they are a subset of the general land cover classification system. In particular, the goal of this paper is to analyze existing approaches dedicated to mapping land consumption exploiting freely accessible medium-resolution SAR images, such as Sentinel-1, since there are a lot of existing reviews on land consumption using high-resolution images, as mentioned above.
To analyze and discuss in detail all the mentioned approaches, we have decided to divide them into 4 categories, illustrated thereafter:
  • Type A—Land consumption mapping combining SAR and Geospatial Big Data;
  • Type B—Land consumption change detection;
  • Type C—Land consumption mapping using data fusion or data integration;
  • Type D—Land consumption mapping using approaches considering only Sentinel-1 image features.

4.2.1. Type A—Land Consumption Mapping Combining SAR and Geospatial Big Data

To classify land consumption, good results are obtained integrating Remote Sensing data (including Sentinel-1 data) and Geospatial Big Data.
Shi et al. [63] investigated the opportunity of combining multisource remote sensing images and data extracted from the WeChat social network to classify urban LULC. In particular, SAR and optical images were used for different scopes. High-resolution optical images helped delineate the land parcel through a segmentation algorithm. Low-resolution multispectral images were used for specific classification by integrating object-based images analysis, decision tree, and Random Forest (RF) algorithms: urban villages, streets, commercial buildings, and residential buildings were the classes considered. Afterward, SAR Sentinel-1A data reduced the confusion between commercial buildings, greenhouses, and water. Lastly, the distribution users of WeChat data improved the classification accuracies of urban villages, greenhouses, and commercial buildings. This approach, while very innovative, is strictly linked to the availability of social media data.
Recently, Hu et al. [17] examined land take by associating demographic information with remote sensing data. In particular, they refined data starting from the Local Climate Zones (LCZs) maps used as proxies to disaggregate the global population grids (GHS-POP) and the Morphological Urban Areas (MUA) extent to improve the spatial details of population data. RF is the classifier chosen for the Local Climate Classification task, on a global scale, performing an intra-urban land consumption analysis for 40 cities across the globe. This method’s results are less reliable if applied to cities different from the trained ones, and it istightly conditioned by the availability of the population data.
There is potential for these linear approaches, even though, as mentioned above, we need to consider that they are bound to the availability of Geospatial Big Data (e.g., social media data and global population data). Indeed, often third-party Geospatial Big Data have been explored just to validate results [70,74]. Wrapping up, too few studies regarding Sentinel-1 and Geospatial Big Data have been conducted but the approach seems to be promising and larger research should be considered.

4.2.2. Type B—Land Consumption Change Detection

Some articles consider detecting changes that occurred in land consumption, most of them integrating SAR and Optical Data.
Mastrorosa et al. [1] exploited the SAR amplitude feature to detect changes in land consumption and update existing soil sealing maps. The main assumption is that a change in land consumption is associated with an increase of the SAR amplitude values. The automatic procedure used multi-temporal Sentinel-1 data to apply the Step Detection Algorithm based on a Bayesian approach as proposed by O Ruanaidh and Fitzgerald [75], which detected the probability that changes occurred and the time in which they took place. Optical imageries, then, were used to produce a Normalized Difference Vegetation Index (NDVI) map, for filtering results and removing false-positive changes. The proposed approach is automatic, simple, unsupervised, and even feasible for non-expert users. However, it should be considered that, whenever new objects are characterized by low amplitude, such as streets, squares, or a set of solar panels, changes are not punctually detected.
Positive results are also achieved by integrating NDVI and backscattering analysis. Differently than Mastrorosa et al. [1], here, Strollo et al. [56] exploited the assumptions that land consumption causes a decrease in the NDVI index due to the removal of vegetation cover and an increase in the backscattering values. Using Sentinel-2 images, the difference between two maximum NDVI rasters is calculated in order to assess the possible land consumption changes. Then, to enhance the reliability of the results, Sentinel-1 images have been employed to distinguish bare soil from urban areas, both resulting in low NDVI. This mask, resulting from the difference between the median backscattering, allowed removing from the map changes attributed to bare soil and not to the real land consumption. This method, though very simple and with high accuracy, depends on the arbitrariness of thresholds.
On the same line, considering the same assumptions of Strollo et al. [56], Luti et al. [55] developed a fully automatic workflow, using the multitemporal acquisition of Sentinel-1 and Sentinel-2 images, in order to detect changes that occurred between 2018 and 2019 in the study area of Italy. As the acquisition orbit influences the angle of view of Sentinel-1 images, the ascending and descending orbits were considered separately, to preserve the information related to object configuration and orientation on the ground. Three approaches were used and compared, which produced different and good results; however, the smallest changes (less than one pixel) are omitted, and false or not permanent changes are often considered.
In 2021, Nistor et al. [61] investigated the urban landscape changes for the last 50 years in Bucharest, introducing a new method assessed through the Build-up Change Index (BCI). The first phase was related to the identification of available data input for the analysis: high and medium-resolution MS and SAR images were used. Following that, data pre-processing was performed, including data correction and enhancement of chosen data. The third phase corresponded to data processing in GIS for urban land cover feature delineation, based on image interpretation techniques on MS images and semi-automatic classification of Sentinel-1 and Sentinel-2 decorrelated data stack, using the Support Vector Machine (SVM) algorithm with a radial basis function. At last, data mapping and statistical analysis were implemented to compare the different datasets’ results through the BCI. Outcomes validated the good results for the integration of Sentinel-1 and Sentinel-2 data for a city with heterogeneous urban patterns.
Recently, Gruenhagen and Juergens [70], using a principle similar to the Rapid and Easy Change detection on Time series using the coefficient of Variation (REACTIV) proposed by Koeniguer and Nicolas [76], showed the use of the Multitemporal Difference-Adjusted Dispersion Threshold (MDADT) method to record land cover changes in the form of building demolitions and new construction. These changes have been validated with third-party Geospatial Big Data, showing quite accurate results. This approach uses only SAR data that were rarely considered in previously existing land consumption change detection. Nevertheless, only medium-term land cover changes were considered, and small changes were not detected due to the spatial resolution of SAR data.
By analyzing the results, we can conclude that the change detection approaches using Sentinel-1 data are actually based on various assumptions, datasets, and algorithms. However, the common issue experienced is the underestimation of small changes, due to the medium spatial resolution of Sentinel-1 images, even when the integration between Sentinel-1 and Sentinel-2 images occurs. Moreover, changes that are not permanent are often detected, due to the increasing SAR backscattering of artificial structures, even for a temporary period. Frequently, to limit those issues, a temporal series of Sentinel-1 images is deemed [1,56].

4.2.3. Type C—Land Consumption Mapping Using Data Fusion or Data Integration

Several studies have shown that urban land cover classification can be improved when SAR data are combined with optical data, instead of using SAR Sentinel-1 or optical data independently [77].
As a central task in the field of remote sensing imagery, remote sensing image fusion techniques aim to get an image that simultaneously has both high spectral and high spatial resolutions.
In 2016, Pesaresi et al. performed a new image classification method for built-up area mapping called Symbolic Machine Learning (SML) [78]. In this paper, after demonstrating that the SML classifier outperforms other parametric and non-parametric classifiers in terms of both computational efficiency and accuracy, a preliminary test was carried out with the aim of evaluating the applicability of the SML classifier on Sentinel-2 imagery. Then, it assessed the complementarity of Sentinel-1 and Sentinel-2. The result validated appreciable improvement in the quality of the classification gained from the complementarity between Sentinel-1 and Sentinel-2 images; although, highways were not always detected, and build-up surfaces were often underestimated in areas where shadows hampered the automated classification.
Along the same line, Zhou et al. [68] achieved higher urban classification accuracy with the combination of SAR Sentinel-1 and optical Hyperion images, compared to the classification using exclusively the combination of SAR features (e.g., texture, coherence, backscatter intensity, and color) extracted from Sentinel-1 data and assessed by performing the RF classifier. This linear approach could be improved by considering images from different seasons to investigate the impact of seasonality on urban land cover classification.
A different innovative method was proposed by Iannelli and Gamba [59]: a simplified and less computationally demanding version of the Urban Extractor (UEXT) algorithm whose latest version is described by Lisini et al. [79]. The proposed approach exploited both the double bounce backscatter that showed up in multi-temporally averaged and despeckled sets of SAR images, due to the presence of artificial structures, and the finer spatial and spectral resolution of MS data, used to improve the classification. In particular, the simultaneous use of SAR Sentinel-1 and MS Sentinel-2 data, both with specific issues, but complementary in their ability to discriminate urban elements of the landscape from natural ones, led to slightly better mapping results. However, the accuracy is still under 90%.
On the contrary, Tsolakidis and Vafiadis [66] demonstrated the superiority of the multispectral Sentinel-2 classification compared to the combined Sentinel-1 and Sentinel-2 classifications. Indeed, similarly to Pesaresi et al. [78] but using an RF algorithm, in 2020, Tsolakidis and Vafiadis [66] proposed an urban land cover classification methodology integrating Sentinel-1 and Sentinel-2 images after pre-processing. The resulting classification was compared to the one using only multispectral Sentinel-2 images. The outcomes showed that the classification of the MS images was better than the one integrating the two Sentinel-1 and Sentinel-2 images. In fact, the salt and pepper effect improved the mixed image classification, and the Overall Accuracy (OA) and k coefficient have been reduced.
Once again, better classification results were produced using data combination from Sentinel-1 and Sentinel-2, rather than separate imageries, are demonstrated by Hu et al. [71]. Indeed, to reduce the confusion between water and dark impervious surfaces, he processed the combination of MS Sentinel-2 and SAR Sentinel-1 data via the layer stacking method and implemented the classification using the novel approach the Support Vector Machine with Composite Kernels (SVM-CK). In particular, the results indicated that SAR Sentinel-1 data identified urban land cover types with lower accuracy than MS Sentinel-2 data with the same spatial resolution, while improvement was achieved by the fusion of the two. Furthermore, the SVM-CK algorithm performed better compared to others ML algorithms: nevertheless, misclassifications were often observed.
In 2021, Shrestha et al. [64] and [60] confirmed the better performance of the combined data in built-up classification than optical data exclusively. The study used a pixel-based fusion of Sentinel-1 and Sentinel-2 datasets (14 bands stacked images), applying the RF land cover classification method, to map the impervious surfaces at the city scale. However, the method results are time consuming if considering a larger study area and its results are challenging to replicate in tropical regions where MS images are often contaminated by cloud cover.
Then, Nistor et al. [61] performed the image classification process based on the recent satellite Sentinel-1 and Sentinel-2 images from 2018 after creating a hybrid and highly decorrelated image stack dataset. Lastly, the data mapping and statistical analysis were implemented using the SVM algorithm with a radial basis function and obtained high-accuracy results.
Good results are also achieved by Petrushevsky et al. [72]. They explored the chance of combining the unique SAR ability to detect stable targets, e.g., urban structures, with the fine resolution of optical surveys. First, the Simple Linear Iterative Clustering (SLIC) superpixel algorithm was used to perform the segmentation of an optical image, so that the final product follows the visible borders between land covers. Then, since pixels labeled by the same segment are assumed to belong to a similar land cover, SAR multi-temporal features (coherence and intensity) were estimated over the segments. An RF regressor model was subsequently trained to identify urban segments by features retrieved from a SAR stack containing at least eight images of the same area. Two stacks with different orbits (ascending and descending) were used to enhance accuracy since urban structures are distributed randomly, and they affect the characteristics of the returned signal. The classification products were given as the percent of urban pixels in a segment, since some segments do not contain only samples from one class, and finally a minimum threshold was established to achieve binary classification. The training of the RF model was performed on 5% of the segments, achieving a good OA of 90.29%. The main issue is the misclassification of many urban pixels surrounded by non-urban pixels.
A further analysis of the previous method was proposed by the same authors in 2022 [57]. Here, the Sentinel-2 image was used to identify clusters of similar pixels. The choice of Sentinel-2 bands was based on empirical experiments, which showed superior performance using the Green-Blue-NIR high-resolution channels. Then, for each cluster of pixels identified in the segmentation process, a set of SAR features from the Sentinel-1 stack was extracted (e.g., differential entropy, sigmanought, and polarimetric coherence). Finally, a Fuzzy C-Mean, an unsupervised classifier, was used to translate the features into urban membership level and was a fixed threshold on the result to obtain binary classification and achieve an urban mapping. Here, roads are usually confined surfaces without any double-bounce scattering mechanisms and are surrounded by decorrelating targets, resulting in difficulty detecting and classifying.
As mentioned above (Section 4.2.1), recently, Hu et al. [17] investigated land consumption by associating demographic information to intra-urban knowledge on structural variability by the LCZs. The developed classification system fused freely-accessible SAR Sentinel-1 data and optical Sentinel-2 data via a semi-supervised strategy, then they applied data results for mapping LCZ. RF was the classifier chosen for the Local Climate Classification task, on a global scale. LCZ classes were, then, used as a proxy to disaggregate the GHS-POP. At last, to improve the spatial details of population data, the MUA urban extent was used, revealing that urban land consumption differs immensely across the globe. This approach turns out low accuracy results if considering cities different from the trained ones.
The fusion of Sentinel-1 and Sentinel-2 data successfully resulted in reducing the effect of shadows caused by low sun elevation and tall buildings on Sentinel-2 images that degrade the mapping accuracy. Sun et al. [80] explored more valid polarimetric features of Sentinel-1 and proposed a hierarchical framework for impervious surface mapping at the city scale by synergic fusion of dual-polarized SAR and MS information.
The method integrating SAR and optical data stands as the main obstacle. The classifier used in previous studies often simply stacks the features extracted from optical images and SAR images together. Nevertheless, optical reflectance data and SAR backscattering data do not correlate [81]. Features extracted from optical and SAR have different statistical characteristics, dimensions, and physical meanings [82].
The conventional layer-stacking approach cannot make full use of much information with different characteristics. Therefore, many studies explored advanced methods to better depict and differentiate heterogeneous features in order to integrate SAR and optical data more effectively.
For instance, to solve the problem, Sun et al. [65] proposed the Multiple Kernel Learning (MKL) methods using a balanced linear combination of multiple basic kernels instead of a single one, where each kernel describes a different characteristic of the data and is thus able to exploit discriminative information from different sources. He fused heterogeneous features more effectively and provided improved performance to derive a subpixel impervious surface map by employing the developed Multiple Kernel Support Vector Regression (MKSVR) models, ensuring the improvement of performance, despite the method being built on the arbitrariness of parameters choice.
Then, in 2021, Forget et al. [83] proposed a mapping approach based on multi-sensor satellite imagery (Sentinel-1, ERS, Landsat, Envisat) and the volunteered geographic information (OpenStreetMap) to estimate the urban expansion in Sub-Saharan Africa, considering a sample of 45 urban areas as case studies, properly selected to maximize the diversity in relation to climate, dimension, population density, geography, and economy. The classification of built-up areas for each case study and each data (from 1995 to 2015) initiated from the collection was always filtered for the considered period of training samples for both built-up and non-built-up areas, extracted from OpenStreetMap. Following that, the extraction of features both from SAR and from optical imagery was performed. Then, the final pixel-based supervised classification was elaborate considering an RF algorithm built on 100 trees and a maximum number of features per tree equal to the square root of the total number of features. At last, a simple mean filter with a 3 × 3-window size allowed for the partial removal of noise, illumination artifacts, and roads. The main issues encountered are due to the availability of data since the long period is considered and due to the presence of training samples.
A different approach, based on Convolutional Neural Networks (CNN), was explored by Yang et al. [69] in 2022. The proposed method exploited the synergetic use of both active and passive remote-sensing data, SAR Sentinel-1 and MS Sentinel-2 and the features of spectral indices. The framework was based on two-dimensional (2D) and three-dimensional (3D) hybrid Convolutional Neural Networks (CNN), integrating Sentinel-1 and Sentinel-2 images and spectral indices, resulting in particular efficiency in high humidity surfaces. To verify the accuracy of the proposed classification model, the approach was compared with k-Nearest Neighbors (KNN), 2D CNN, 3D CNN, SVM, and hybridSN classification models, producing an OA of 98.87 e k-index of 0.98. These results were better than the ones obtained using Sentinel-1 and Sentinel-2 separately or the fusion classification based on Sentinel-1 and Sentinel-2 combined. Here, the synergistic effect of active-passive remote-sensing data was well exploited to improve the urban land-use classification, especially in high surface humidity, cloud cover, and foggy weather: still, the network structure of the model results is quite complex.
Having analyzed all papers and the related results, we can wrap up that the approaches considered are assorted (even if the pixel-based methods are usually preferred) but all of them asserted an issue related to the misclassification due to the Sentinel-1 image’s medium resolution. Moreover, all the examined studies (except for one) demonstrated better results by integrating Sentinel-1 and optical data, compared to the use of Sentinel-1 or optical data separately. Indeed, the complementary nature of Sentinel-1 and optical data were exploited by both considering the double bounce backscatter that showed up in multi-temporally averaged and despeckled sets of SAR images due to the presence of artificial structures, and the finer spatial and spectral resolution of MS data was usually used to improve the classification. Even here, the spatial resolution limitation might be reduced by considering a temporal series of Sentinel-1 images [83].

4.2.4. Type D—Land Consumption Mapping Using Approaches Considering Only Sentinel-1 Image Features

In several studies, SAR texture analysis increased the classification accuracy of land consumption. Holobâcă et al. [49] carried out an innovative method for land consumption detection based on Sentinel-1 data. After an image pre-processing, the built-up areas have been extracted by means of the Iterative Self-Organizing Data Analysis Technique (ISODATA) unsupervised classification and texture analysis by mixed classes (Iso-Tex), using the Sentinel-1 double polarization and a combination of images from both ascendant and descendant orbit. This method performed better than the one using a supervised classification with the MLC Algorithm described by Boudinaud in 2017 [84].
Some studies aimed to map built-up areas by using only multi-temporal SAR features, such as the backscattering intensity and the Interfermetric Synthetic Aperture Radar (InSAR) coherence. This is possible considering two main hypotheses: built-up areas in SAR images appear very bright and they are coherent in time. The reason for the first assumption is that in the presence of buildings a ‘double bounce’ effect leads to a very high backscattering; the second assumption can be formulated considering these built-up structures are hard to target so that InSAR coherence is mostly constant in time.
In particular, InSAR coherence allows for discriminating false alarms caused by other land cover classes that also show high backscattering values but are not coherent in time (e.g., specific types of vegetated areas), as demonstrated by Chini et al. [74] and [48]. Specifically, the newly developed algorithm proposed in the papers was applied to five distinct test sites located in semiarid and arid regions and was built on adaptive parametric thresholding. First, pixels with high backscattering values in both VV and VH polarimetric channels were identified, and then the inSAR coherence was used to reduce false alarms, obtaining OA up to 98% and using Global Urban Footprint (GUF) as a Reference Map.
Furthermore, the multitemporal InSAR coherence and intensity series allowed also for reducing speckle noise without losing spatial resolution. It was possible to obtain intensity and coherence features by averaging multi-temporal SAR series, as shown by Chini et al. [74] and [48].
Based on InSAR coherence, highlighting all surfaces with constantly high backscattered intensity, steady physical parameters through time, and fixed shape (such as urban areas) is the method developed in 2020 by Semenzato et al. [62]. It was a semi-automatic process capable of monitoring and mapping urban areas and specifically calculating the spatial extent of urban features over non-urban areas (e.g., urban footprint). A series of multi-temporal coherence images were stacked in order to increase the accuracy of the single classified coherence image. Then, both supervised and unsupervised classifications, respectively using RF, MLC, and K-means classifiers, were performed and compared. In the end, an accuracy assessment was processed, considering the properly preprocessed Carta di Copertura del Suolo (CCS) as a reference, resulting in high OA (up to 90%).
As mentioned in par. 4.2.2, similar to the REACTIV approach of Koeniguer and Nicolas [76], the MDADT method was tested by Gruenhagen and Juergens [70]. Whereas, in the first method, land cover change was represented in the Hue Saturation Value (HSV) color space. In the MDADT method, a threshold was applied to detect building demolitions and new constructions. This method allowed for straightforward and simple robust detection of urban land cover change outliers in the distribution, showing quite accurate results.
In 2021, Ghasemi et al. [58] employed the MLC and SVM algorithms for supervised classification using Sentinel-1 images. In both algorithms, they performed the classification once by using the SAR backscattering coefficient and once by combining the backscattering coefficients with the statistical data obtained from the texture. The results showed that the use of SAR images only with backscattering intensity resulted in poor performance while using the Gray-Level Co-occurrence Matrix (GLCM) and texture features increased the accuracy. The statistical results obtained from the ML and SVM classifications for SAR images at VV and VH polarization indicated that the latter performed better than the former. Furthermore, in both algorithms, separation of the road from barren lands was difficult in the SAR images, as they are more sensitive to the physical features of the phenomena and since the roads have the same reflection as bare lands. In this process, therefore, Sentinel-1 images were used as basic materials and Sentinel-2 images were used to evaluate the accuracy of the classification.
To Summarize, the most successful processes are based on the integration of InSAR coherence and backscattering intensity, considering both ascending and descending orbits. These methods are quite new and are more complex than the methods analyzed in previous paragraphs but they result in an accurate classification, and they have the potential to continue to be studied.
Table 3. Summary of analyzed articles.
PaperTypeMethodModeAlgorithms/
Techniques
Accuracy AssessmentAdvantagesDisadvantages
[63]AObject-basedSupervisedSegmentation algorithm
Decision tree
RF
OA: 91.55%
K: 0.89
Reduced confusion between greenhouses and vegetation thanks to the population density (in urban areas higher than in vegetation areas).Availability of Social Media data.
[17]A–CPixel-basedSupervisedRF;
K-means
OA: variousPossible use for global scale.Several accuracies (different cities considered). Availability of global population data (GHS-POP).
Low accuracy if considering cities different from trained ones.
[1]BPixel-basedUnsupervisedBayesian algorithm Visual analysisThis approach is simple, unsupervised, automatic, and
feasible for users who are not experts in the field.
Changes are not detected whenever the new objects are characterized by low amplitude, such as a street, a square, or a set of solar panels.
[56]BPixel-basedUnsupervisedNDVI applicated to optical images;
Median backscattering;
Photointerpretation
OA: 97.7–99.66%High accuracy.
Global scale.
Arbitrariness of thresholds.
[70]BPixel-basedUnsupervisedMDADTVisual analysisUse only SAR data, consider large area, and long time period. Only detected medium-term land cover changes.
Small changes were not recorded due to the spatial resolution of Sentinel-1 images.
[61]B–CPixel-basedSupervisedSVM with radial basesS1: OA = 96%
K = 0.942
S1-S2: OA = 96% K = 0.942
Data are integrated and harmonized, thus obtaining a very accurate result for a city with a complex and heterogeneous urban pattern.
These new products offer support for conducting spatial and statistical analysis for changes that occurred in the urban landscape.
Limited number of classes that can be extracted due to the similar spectral signature of some classes.
[55]BPixel-basedUnsupervisedNDVI applicated to optical images;
Median backscattering;
Photointerpretation
OA: variousGlobal scale.
No training areas.
Time and cost-effective.
Omissions are mainly related to the smallest changes, which are less than one pixel in size.
Could be detected false or not permanent changes.
[64]CPixel-basedSupervisedRFOA: 85–98%
K: 0.8–1
The technique would mainly benefit urban areas with open spaces within the settlement due to higher spatial resolution of Sentinel data despite the urban density.To replicate the process in tropical regions would be challenging, being S-2 data constantly contaminated with cloud covers.
For a larger study area, the method can be computationally time consuming.
[71]CPixel-basedSupervisedSVM-CK
OA = 92.12%
K = 0.89
The fusion of Sentinel-2B MSI and Sentinel-1A SAR data efficiently improve land cover classification in cloud-prone regions.Possible misclassification.
[65]CPixel-basedSupervisedMKSVRRMSE: 0.2031
R2: 0.8321
Improved accuracy compared with the same method using optical image alone.Setting parameters. Computational efficiency.
[66]CPixel-basedSupervisedRFS2:OA: 95%
S1-S2:OA: 91%
-Salt and pepper effect improved the mixed image classification, and overall accuracy and k coefficient have been reduced to respect multispectral S2 classification.
[72]CObject-basedSupervisedS1: MLC, RF
S2: SLIC
OA: 90%Free and open access data.
The ability to follow high-resolution details in a mixed environment.
A low number of calibration parameters is required, reducing tuning sensitivity.
Urban pixels surrounded by many not-urban pixels will be misclassified.
Inconsistencies of Sentinel 2.
Quite complex approach.
[78]CPixel-basedSupervisedSMLVisual analysisThe capacity to handle different sets of input features, such as radiometric, textural, and morphological descriptors.
The distinction between built-up areas and fluvial gravel, similar in terms of radiometric characteristics but having different surface roughness becomes possible.
Highways are not detected.
Underestimate the built-up surfaces in high density areas where shadows hamper the automated classification.
[57]CObject-basedUnsupervisedS2: Super-pixel segmentation;
S1: Fuzzy C-Mean
OA: 88–95%
K: 0.58–0.61
The SAR features are tuned to detect high concentrations of permanent scatterers and stable targets.
Unsupervised classification: no training dataset used, making the proposed solution applicable worldwide.
Frequently updated.
Object-based approach limits the size of the smallest detail.
Roads are narrow surfaces without any double-bounce scattering mechanisms (usually) and are surrounded by decorrelating targets, causing difficulties in their classification.
[83]CPixel-basedSupervisedRFF1 score: 0.81–0.98;
K-fold Cross Validation (CV): 0.90–0.95
RF class probabilities were post-processed using a simple mean filter with a 3 × 3 window size. This allowed a partial removal of noise, illumination artifacts, and roads.Availability of data since the long period considered.
Lots of training samples.
[68]CPixel-basedSupervisedRFOA: 99%
K: 0.98
High accuracy.Impact of seasonality in urban land cover mapping.
[60]CPixel-basedSupervisedRFOA: 92–95%
K: 0.88–0.92
High accuracys.Slight underestimation of impervious surface for the city.
[59]CPixel-basedSupervisedUEXTOA: 75-82%
K: 0.5–0.65
Overcome limits in mountainous regions, often erroneously identified as urban structures. Reduces number of false positives.
Low computational demand.
Higher repeatability over a long time.
Low accuracy.
[69]CPixel-basedSupervisedMulti-Attention Module Hybrid CNN (MAMHybridNet)OA: 98.87
K: 0.98
Good performance in high surface humidity, cloud cover, and foggy weather.
High accuracy.
Quite complex model.
[49]DPixel-based\UnsupervisedMLC; ISODATA +
Texture analyses
MLC: K < 0.80
ISO-TEX: K > 0.80
Higher accuracy level compared to the
supervised classification.
MLC: The confusions between the urban and non-urban were detected in the high backscatter areas. The disparities occur especially on more extended, excessively humid, or bare soil areas.
ISO-TEX: the spectral response was explored on all 20 bands by land use classes that are narrow enough to capture a particular classification problem.
[74]DPixel-basedUnsupervisedHierarchical Split Based ApproachVisual analysis Reduces shadow and layover areas.
Removes the permanent water bodies.
Reduce false alarms.
Limited geometric resolution of the Sentinel satellites with respect to other commercial satellites.
[85]DPixel-basedUnsupervisedHierarchical Spilt Based thresholding approach (HSBA)OA: 91–97% Reduces the speckle without losing spatial resolution.Limited geometric resolution of the Sentinel satellites with respect to other commercial satellites.
[58]DPixel-basedSupervised
MLC; SVM
SVM: K = 0.72
ML: K = 0.61
Good performance in separating water bodies.Better accuracy only in semi-arid areas (due to low atmospheric turbulences).
Backscattering coefficient may differ based on the geometric orientation of the objects.
[62]DPixel-basedSupervised; UnsupervisedMLC; RD; K-means OA: 85–90%
Visual analysis
Completely based on Open data.Limited geometric resolution of the Sentinel satellites with respect to other commercial satellites.
[48]DPixel-basedUnsupervisedHierarchical Spilt Based tresholding approach (HSBA)OA: 91.55–97.93%
K: 0.29–0.47
Reduces shadow and layover areas.
Reduces the speckle without losing spatial resolution. Reduces false alarms.
Variability of accuracies.
Limited geometric resolution of the Sentinel satellites with respect to other commercial satellites.

5. Conclusions

Assessing the pace of growth of land consumption is important considering the European objectives for 2050, an important policy document that aims to achieve zero net soil sealing by 2050 [3]. To achieve such a goal, some documents were delivered at the European and global levels, such as the “Guidelines on best practice to limit, mitigate or compensate Soil Sealing”, the guidelines of good practices issued by the European Union [37] and the “Sustainable development goals”, the guideline released by United Nation [86]. In particular, in this last report, the goals regarding land consumption issues are goals 11—“Make cities and human settlements inclusive, safe, resilient and sustainable”— and goal 15—“Sustainably manage forests, combat desertification, halt and reverse land degradation, halt biodiversity loss” [86]. Despite all that, there are currently no signs of change in historical trends and land consumption continues to increase annually at the European and global levels [5,7].
Thanks to the frequent revisiting of the ESA Sentinel missions, we will be able to monitor land consumption in an innovative, novel, and speedy way (e.g., even on a monthly basis, depending on the phenomena in action). That allows for managing land use in an effective and sustainable way at multiple scales (municipal, regional, national, and global levels). Users could be public administrations, mainly at the local level, as they are responsible for land-use plans and operational tasks to support soil protection among their municipalities, environmental protection agencies, park authorities, regions, and basin authorities.
Although Sentinel-1 data offer the potential for monitoring urban expansion, Sentinel-1 images are relatively new (approximated 6 years), so there are not yet many studies concerned with Sentinel-1 land consumption applications. Indeed, as demonstrated from the Scopus research conducted in this study, most of the studies employing Sentinel-1 data mainly focused on general land cover classification (which is the reason they were excluded from the current review).
This study aimed at understanding the contribution of Sentinel-1 data towards land consumption monitoring. The current research has shown that most of the reviewed studies indicated that Sentinel-1 data has the potential for land consumption monitoring across the world. Many studies have reported the superiority of Sentinel-1 over optical sensors, especially in regions affected by cloud cover (Table 3). In many studies, Sentinel-1 data are integrated with optical data, such as Sentinel-2, showing a good/better performance, exploiting the advantages of optical and SAR data, and reducing the respective shortcomings. The approaches aim at exploiting the finer spatial and spectral resolutions of MS data, such as Sentinel-2, as well as the double-bounce backscatter effect that is common in all built-up areas in the SAR, such as Sentinel-1 data (Table 3). Many classification methods have been applied to Sentinel-1 data, including both pixel and object-based approaches, using ML classifiers (e.g., RF and SVM) or new methodology/procedures, integrating Sentinel-1 and optical data, Sentinel-1 and Geospatial Big Data or just exploiting Sentinel-1 features, providing great potential for improving land consumption classification (Table 3).
In summary, the major strength of Sentinel-1 is the high temporal resolution and the availability of images regardless of meteorological conditions. Indeed, the spatial resolution limitation might be reduced by considering a temporal series of Sentinel-1 images. The approach is successful, but it requires the scene to remain stable for an extended period, which reduces the possibility of continuous monitoring. In order to obtain the best classification results from Sentinel-1 images, a number of factors being used (such as the dataset used, the quality of the pre-processing, the selection of the classification method and classifier, and the choice of training data and test area) need to be considered. It is important to employ geometric, radiometric correction, and despeckling on the images using appropriate methods and tools. Indeed, a lot of variation can be obtained depending on the quality of the pre-processing conducted on the images before classification, especially in areas with spatial topographic variations or areas with complex morphology.
The major practical application of our results is to support researchers in choosing the most promising methods to work on. Researchers can prioritize their efforts by obtaining a clearer idea of expected improvements achieved by different methods (Table 3). Therefore, there is a need to continue studying land consumption classification using contemporary Sentinel-1 data while also exploring its performance in detecting different aspects (e.g., road networks, buildings, solar panels, etc.) that are often difficult to identify. Further analysis should also be conducted on a larger scale to standardize the land consumption monitoring process, making it independent of the place considered, creating a way to make the hyperparameter (ML parameters) changes automatically.
It could be promising to focalize on the integration of Sentinel 1 and Sentinel 2 images, taking advantage of the positive results of both and offsetting the medium-spatial resolution by increasing the number of images considered. As a further analysis, we can consider areas with various morphologies (e.g., Lazio), in which we already have accurate temporal land consumption maps provided by ISPRA on which to test the different methodologies (based on Sentinel-1 only or through the integration of Sentinel-2 and/or Geospatial Big Data) and to explore the consequent results. Future review studies could also explore the applications of Sentinel-1 data to specific regions of the world (e.g., Europe, Asia, Africa, etc.).
Moving forward, Sentinel-1 offers new opportunities for the private sector, government organizations, the scientific community, and practitioners to increase the availability of regional, national, continental, and global level land consumption maps based on the medium-resolution Sentinel-1 data.

Author Contributions

Conceptualization, S.M., M.M., M.C. and L.C.; methodology, S.M. and L.C.; formal analysis, S.M. and L.C.; investigation, S.M. and L.C.; resources, S.M. and L.C.; data curation, S.M., L.C., M.M. and M.C.; writing—original draft preparation, S.M.; writing—review and editing, S.M., M.C., M.M. and L.C.; supervision, M.C. and M.M.; project administration, S.M.; funding acquisition, M.C. and M.M. All authors have read and agreed to the published version of the manuscript.

Funding

This research was partially supported by one Ph.D. fellowship granted to Sara Mastrorosa by Sapienza University of Rome within the PhD course in Infrastructure and transport. The APC was funded by Sapienza University of Rome.

Data Availability Statement

Not applicable.

Conflicts of Interest

The authors declare no conflict of interest.

References

  1. Mastrorosa, S.; Crosetto, M.; Congedo, L.; Munafò, M. Land consumption monitoring: An innovative method integrating SAR and optical data. Environ. Monit. Assess. 2018, 190, 588. [Google Scholar] [CrossRef] [PubMed]
  2. European Commission. Soil Deal for Europe; Publications Office of the European Union: Luxemburg, 2022. [Google Scholar] [CrossRef]
  3. European Commission. Future Brief: No Net Land Take by 2050? European Union: Luxemburg, 2016. [Google Scholar] [CrossRef]
  4. EU Missions in Horizon Europe. Available online: https://research-and-innovation.ec.europa.eu/funding/funding-opportunities/funding-programmes-and-open-calls/horizon-europe/eu-missions-horizon-europe_en (accessed on 31 October 2022).
  5. EEA. Land and Soil in Europe; Luxembourg Publications Office of the European Union: Luxemburg, 2020. [Google Scholar] [CrossRef]
  6. FAO. Urbanisation and Soil Sealing; FAO: Rome, Italy, 2022. [Google Scholar]
  7. Munafò, M. “Consumo Di Suolo, Dinamiche Territoriali e Servizi Ecosistemici”. 2022. Report ISPRA-SNPA 32/22. Available online: https://www.snpambiente.it/2022/07/26/consumo-di-suolo-dinamiche-territoriali-e-servizi-ecosistemici-edizione-2022/ (accessed on 9 January 2023).
  8. Shang, R.; Yuan, Y.; Jiao, L.; Meng, Y.; Ghalamzan, A.M. A self-paced learning algorithm for change detection in synthetic aperture radar images. Signal Process. 2018, 142, 375–387. [Google Scholar] [CrossRef]
  9. Sumaiya, M.; Kumari, R.S.S. Gabor filter based change detection in SAR images by KI thresholding. Optik 2017, 130, 114–122. [Google Scholar] [CrossRef]
  10. Marinelli, D.; Bovolo, F.; Bruzzone, L. A Novel Change Detection Method for Multitemporal Hyperspectral Images Based on Binary Hyperspectral Change Vectors. IEEE Trans. Geosci. Remote. Sens. 2019, 57, 4913–4928. [Google Scholar] [CrossRef]
  11. Khorram, S.; Koch, F.H.; Wiele, C.; Nelson, S.A.C. Remote Sensing; Springer Science & Business Media: Berlin/Heidelberg, Germany, 2012; ISBN 978-1-4614-3102-2. [Google Scholar]
  12. Congedo, L.; Marinosci, I.; Ritano, N.; Strollo, A.; De Fioravante, P.; Munafò, M. Monitoring of Land Consumption: An Analysis of Loss of Natural and Agricultural Areas in Italy. Annali. Botanica. 2017, 7, 1–9. [Google Scholar] [CrossRef]
  13. Lam, N.S.-N. Methodologies for Mapping Land Cover/Land Use and its Change. Adv. Land Remote Sens. Syst. Model. Invers. Appl. 2008, 341–367. [Google Scholar] [CrossRef]
  14. As-Syakur, A.R.; Adnyana, I.W.S.; Arthana, I.W.; Nuarsa, I.W. Enhanced Built-Up and Bareness Index (EBBI) for Mapping Built-Up and Bare Land in an Urban Area. Remote. Sens. 2012, 4, 2957–2970. [Google Scholar] [CrossRef]
  15. Sun, Z.; Wang, C.; Guo, H.; Shang, R. A Modified Normalized Difference Impervious Surface Index (MNDISI) for Automatic Urban Mapping from Landsat Imagery. Remote. Sens. 2017, 9, 942. [Google Scholar] [CrossRef]
  16. Hagenauer, J.; Omrani, H.; Helbich, M. Assessing the performance of 38 machine learning models: The case of land consumption rates in Bavaria, Germany. Int. J. Geogr. Inf. Sci. 2019, 33, 1399–1419. [Google Scholar] [CrossRef]
  17. Hu, J.; Wang, Y.; Taubenböck, H.; Zhu, X.X. Land consumption in cities: A comparative study across the globe. Cities 2021, 113, 103163. [Google Scholar] [CrossRef]
  18. Gómez, C.; White, J.C.; Wulder, M.A. Optical remotely sensed time series data for land cover classification: A review. ISPRS J. Photogramm. Remote. Sens. 2016, 116, 55–72. [Google Scholar] [CrossRef]
  19. Khatami, R.; Mountrakis, G.; Stehman, S.V. A meta-analysis of remote sensing research on supervised pixel-based land-cover image classification processes: General guidelines for practitioners and future research. Remote. Sens. Environ. 2016, 177, 89–100. [Google Scholar] [CrossRef]
  20. Ma, L.; Li, M.; Ma, X.; Cheng, L.; Du, P.; Liu, Y. A review of supervised object-based land-cover image classification. ISPRS J. Photogramm. Remote. Sens. 2017, 130, 277–293. [Google Scholar] [CrossRef]
  21. MohanRajan, S.N.; Loganathan, A.; Manoharan, P. Survey on Land Use/Land Cover (LU/LC) change analysis in remote sensing and GIS environment: Techniques and Challenges. Environ. Sci. Pollut. Res. 2020, 27, 29900–29926. [Google Scholar] [CrossRef]
  22. Phiri, D.; Simwanda, M.; Salekin, S.; Nyirenda, V.R.; Murayama, Y.; Ranagalage, M. Sentinel-2 Data for Land Cover/Use Mapping: A Review. Remote. Sens. 2020, 12, 2291. [Google Scholar] [CrossRef]
  23. Phiri, D.; Morgenroth, J. Developments in Landsat Land Cover Classification Methods: A Review. Remote. Sens. 2017, 9, 967. [Google Scholar] [CrossRef]
  24. Shafique, A.; Cao, G.; Khan, Z.; Asad, M.; Aslam, M. Deep Learning-Based Change Detection in Remote Sensing Images: A Review. Remote. Sens. 2022, 14, 871. [Google Scholar] [CrossRef]
  25. Yan, W.Y.; Shaker, A.; El-Ashmawy, N. Urban land cover classification using airborne LiDAR data: A review. Remote Sens. Environ. 2015, 158, 295–310. [Google Scholar] [CrossRef]
  26. Yin, J.; Dong, J.; Hamm, N.A.; Li, Z.; Wang, J.; Xing, H.; Fu, P. Integrating remote sensing and geospatial big data for urban land use mapping: A review. Int. J. Appl. Earth Obs. Geoinf. 2021, 103, 102514. [Google Scholar] [CrossRef]
  27. Chatterjee, U.; Majumdar, S. Impact of land use change and rapid urbanization on urban heat island in Kolkata city: A remote sensing based perspective. J. Urban Manag. 2021, 11, 59–71. [Google Scholar] [CrossRef]
  28. Dong, J.; Zhang, Z.; Da, X.; Zhang, W.; Feng, X. Eco-environmental effects of land use transformation and its driving forces from the perspective of “production-living-ecological” spaces: A case study of Gansu Province. Acta Ecol. Sin. 2021, 41, 5919–5928. [Google Scholar] [CrossRef]
  29. EEA. Urban Soil Sealing in Europe. 2011. Available online: https://www.eea.europa.eu/articles/urban-soilsealing-in-europe (accessed on 20 December 2022).
  30. Adhikari, K.; Hartemink, A.E. Linking soils to ecosystem services—A global review. Geoderma 2016, 262, 101–111. [Google Scholar] [CrossRef]
  31. Scalenghe, R.; Marsan, F.A. The anthropogenic sealing of soils in urban areas. Landsc. Urban Plan. 2009, 90, 1–10. [Google Scholar] [CrossRef]
  32. Giuffré, G.; Ricci, A.; Bisoffi, S.; Dönitz, E.; Voglhuber-Slavinsky, A.; Helming, K.; Evgrafova, A.; Ratinger, T.; Robinson, D.A. Mission Area: Soil Health and Food: Foresight on Demand Brief in Support of the Horizon Europe Mission Board; Publications Office of the European Union: Luxembourg, 2021. [Google Scholar] [CrossRef]
  33. Intergovernmental Panel on Climate Change (IPCC). Climate change 2022: The physical science basis. In Contribution of Working Group I to the Fourth Assessment Report of the Intergovernmental Panel on Climate Change 2022; Cambridge University Press: Cambridge, UK, 2022. [Google Scholar]
  34. Murata, T.; Kawai, N. Degradation of the urban ecosystem function due to soil sealing: Involvement in the heat island phenomenon and hydrologic cycle in the Tokyo metropolitan area. Soil Sci. Plant Nutr. 2018, 64, 145–155. [Google Scholar] [CrossRef]
  35. Scheyer, J.M.; Hipple, K. Urban Soil Primer; Natural Resources Conservation Service: Washington, DC, USA, 2005. [Google Scholar]
  36. Hameed, H.M. Estimating the Effect of Urban Growth on Annual Runoff Volume Using GIS in the Erbil Sub-Basin of the Kurdistan Region of Iraq. Hydrology 2017, 4, 12. [Google Scholar] [CrossRef]
  37. European Commission. Guidlines on Best Pratice to Limit, Mitigate or Compensate Soil Sealing; Publications Office of the European Union: Luxembourg, 2012. [Google Scholar]
  38. Sultan, H.; Rashid, W.; Shi, J.; Rahim, I.U.; Nafees, M.; Bohnett, E.; Rashid, S.; Khan, M.T.; Shah, I.A.; Han, H.; et al. Horizon Scan of Transboundary Concerns Impacting Snow Leopard Landscapes in Asia. Land 2022, 11, 248. [Google Scholar] [CrossRef]
  39. United Nations, Department of Economic and Social Affairs. Population Division (2019). In World Urbanization Prospects: The 2018 Revision; United Nations: New York, NY, USA, 2019; ISBN 978-92-1-148319-2. [Google Scholar]
  40. Ghildiyal, S.; Goel, N.; Saini, M. Cloud Removal in Satellite Imagery Using Adversarial Network and RGB-Optical Data Fusion. In Proceedings of the 2022 IEEE 5th International Conference on Multimedia Information Processing and Retrieval (MIPR), Virtual, 2–4 August 2022; pp. 407–412. [Google Scholar] [CrossRef]
  41. Richards, J.A.; Jia, X. Remote Sensing Digital Image Analysis: An introduction, 4th ed.; Springer: Berlin/Heidelberg, Germany, 2006; ISBN 3-540-25128-6. [Google Scholar]
  42. Pandey, P.C.; Koutsias, N.; Petropoulos, G.P.; Srivastava, P.K.; Ben Dor, E. Land use/land cover in view of earth observation: Data sources, input dimensions, and classifiers—A review of the state of the art. Geocarto Int. 2021, 36, 957–988. [Google Scholar] [CrossRef]
  43. Gomez-Chova, L.; Fernández-Prieto, D.; Calpe, J.; Soria, E.; Vila, J.; Camps-Valls, G. Urban monitoring using multi-temporal SAR and multi-spectral data. Pattern Recognit. Lett. 2005, 27, 234–243. [Google Scholar] [CrossRef]
  44. Zhu, Z.; Woodcock, C.E.; Rogan, J.; Kellndorfer, J. Assessment of spectral, polarimetric, temporal, and spatial dimensions for urban and peri-urban land cover classification using Landsat and SAR data. Remote. Sens. Environ. 2012, 117, 72–82. [Google Scholar] [CrossRef]
  45. Angelis, C.F.; Freitas, C.C.; Valeriano, D.M.; Dutra, L.V. Multitemporal analysis of land use/land cover JERS-1 backscatter in the Brazilian tropical rainforest. Int. J. Remote. Sens. 2002, 23, 1231–1240. [Google Scholar] [CrossRef]
  46. Satalino, G.; Impedovo, D.; Balenzano, A.; Mattia, F. Land cover classification by using multi-temporal COSMO-SkyMed data. In Proceedings of the 2011 6th International Workshop on the Analysis of Multi-Temporal Remote Sensing Images, Multi-Temp 2011, Trento, Italy, 12–14 July 2011; pp. 17–20. [Google Scholar] [CrossRef]
  47. Yousif, O.; Ban, Y. Object-Based Change Detection in Urban Areas Using Multitemporal High Resolution SAR Images with Unsupervised Thresholding Algorithms. Remote Sens. Digit. Image Process. 2016, 20, 89–105. [Google Scholar] [CrossRef]
  48. Chini, M.; Pelich, R.; Hostache, R.; Matgen, P.; Lopez-Martinez, C. Towards a 20 m Global Building Map from Sentinel-1 SAR Data. Remote. Sens. 2018, 10, 1833. [Google Scholar] [CrossRef]
  49. Holobâcă, I.-H.; Ivan, K.; Alexe, M. Extracting built-up areas from Sentinel-1 imagery using land-cover classification and texture analysis. Int. J. Remote. Sens. 2019, 40, 8054–8069. [Google Scholar] [CrossRef]
  50. Che, M.; Vizziello, A.; Gamba, P. Spatio-Temporal Urban Change Mapping With Time-Series SAR Data. IEEE J. Sel. Top. Appl. Earth Obs. Remote. Sens. 2022, 15, 7222–7234. [Google Scholar] [CrossRef]
  51. Che, M.; Gamba, P. Urban Change Pattern Exploration Using Fine-resolution SAR of Ascending and Descending Orbits. In Proceedings of the 2020 IEEE Radar Conference (RadarConf20), Florence, Italy, 21–25 September 2020. [Google Scholar] [CrossRef]
  52. ESA. Sentinel-1. 2021. Available online: https://sentinels.copernicus.eu/web/sentinel/missions/sentinel-1 (accessed on 24 November 2022).
  53. Fletcher, K.; European Space Agency. Sentinel-1: ESA’s Radar Observatory Mission for GMES Operational Services (ESA SP-1322/1, March 2012); ESA Communications: Noordwijk, The Netherlands, 2012; ISBN 978-92-9221-418-0. [Google Scholar]
  54. NASA ARSET. Basics of Synthetic Aperture Radar (SAR), Session ¼. 2018. Available online: https://www.youtube.com/watch?v=Xemo2ZpduHA (accessed on 24 November 2022).
  55. Luti, T.; De Fioravante, P.; Marinosci, I.; Strollo, A.; Riitano, N.; Falanga, V.; Mariani, L.; Congedo, L.; Munafò, M. Land Consumption Monitoring with SAR Data and Multispectral Indices. Remote. Sens. 2021, 13, 1586. [Google Scholar] [CrossRef]
  56. Strollo, A.; Smiraglia, D.; Bruno, R.; Assennato, F.; Congedo, L.; De Fioravante, P.; Giuliani, C.; Marinosci, I.; Riitano, N.; Munafò, M. Land consumption in Italy. J. Maps 2020, 16, 113–123. [Google Scholar] [CrossRef]
  57. Petrushevsky, N.; Manzoni, M.; Monti-Guarnieri, A. Fast Urban Land Cover Mapping Exploiting Sentinel-1 and Sentinel-2 Data. Remote. Sens. 2021, 14, 36. [Google Scholar] [CrossRef]
  58. Ghasemi, M.; Karimzadeh, S.; Feizizadeh, B. Urban classification using preserved information of high dimensional textural features of Sentinel-1 images in Tabriz, Iran. Earth Sci. Informatics 2021, 14, 1745–1762. [Google Scholar] [CrossRef]
  59. Iannelli, G.C.; Gamba, P. Jointly exploiting sentinel-1 and sentinel-2 for urban mapping. In Proceedings of the International Geoscience and Remote Sensing Symposium (IGARSS), Valencia, Spain, 22–27 July 2018; pp. 8209–8212. [Google Scholar] [CrossRef]
  60. Shrestha, B.; Ahmad, S.; Stephen, H. Fusion of Sentinel-1 and Sentinel-2 data in mapping the impervious surfaces at city scale. Environ. Monit. Assess. 2021, 193, 556. [Google Scholar] [CrossRef]
  61. Nistor, C.; Vîrghileanu, M.; Cârlan, I.; Mihai, B.-A.; Toma, L.; Olariu, B. Remote Sensing-Based Analysis of Urban Landscape Change in the City of Bucharest, Romania. Remote. Sens. 2021, 13, 2323. [Google Scholar] [CrossRef]
  62. Semenzato, A.; Pappalardo, S.E.; Codato, D.; Trivelloni, U.; De Zorzi, S.; Ferrari, S.; De Marchi, M.; Massironi, M. Mapping and Monitoring Urban Environment through Sentinel-1 SAR Data: A Case Study in the Veneto Region (Italy). ISPRS Int. J. Geo-Inf. 2020, 9, 375. [Google Scholar] [CrossRef]
  63. Shi, Y.; Qi, Z.; Liu, X.; Niu, N.; Zhang, H. Urban Land Use and Land Cover Classification Using Multisource Remote Sensing Images and Social Media Data. Remote. Sens. 2019, 11, 2719. [Google Scholar] [CrossRef]
  64. Shrestha, B.; Stephen, H.; Ahmad, S. Impervious Surfaces Mapping at City Scale by Fusion of Radar and Optical Data through a Random Forest Classifier. Remote. Sens. 2021, 13, 3040. [Google Scholar] [CrossRef]
  65. Sun, G.; Kong, Y.; Jia, X.; Zhang, A.; Rong, J.; Ma, H. Synergistic Use of Optical and Dual-Polarized SAR Data With Multiple Kernel Learning for Urban Impervious Surface Mapping. IEEE J. Sel. Top. Appl. Earth Obs. Remote. Sens. 2019, 12, 223–236. [Google Scholar] [CrossRef]
  66. Tsolakidis, I.; Vafiadis, M. Urban land cover mapping, using open satellite data. Case study of the municipality of Thessaloniki. IOP Conf. Series Earth Environ. Sci. 2020, 410, 012062. [Google Scholar] [CrossRef]
  67. Kamusoko, C. Improving Urban Land Cover Mapping; Springer Geography: Berlin/Heidelberg, Germany, 2022; pp. 89–103. [Google Scholar] [CrossRef]
  68. Zhou, T.; Li, Z.; Pan, J. Multi-Feature Classification of Multi-Sensor Satellite Imagery Based on Dual-Polarimetric Sentinel-1A, Landsat-8 OLI, and Hyperion Images for Urban Land-Cover Classification. Sensors 2018, 18, 373. [Google Scholar] [CrossRef]
  69. Yang, Z.; Zhang, H.; Lyu, X.; Du, W. Improving Typical Urban Land-Use Classification with Active-Passive Remote Sensing and Multi-Attention Modules Hybrid Network: A Case Study of Qibin District, Henan, China. Sustainability 2022, 14, 14723. [Google Scholar] [CrossRef]
  70. Gruenhagen, L.; Juergens, C. Multitemporal Change Detection Analysis in an Urbanized Environment Based upon Sentinel-1 Data. Remote. Sens. 2022, 14, 1043. [Google Scholar] [CrossRef]
  71. Hu, B.; Xu, Y.; Huang, X.; Cheng, Q.; Ding, Q.; Bai, L.; Li, Y. Improving Urban Land Cover Classification with Combined Use of Sentinel-2 and Sentinel-1 Imagery. ISPRS Int. J. Geo-Inf. 2021, 10, 533. [Google Scholar] [CrossRef]
  72. Petrushevsky, N.; Manzoni, M.; Guarnieri, A.M. High-Resolution Urban Mapping By Fusion Of Sar And Optical Data. ISPRS Int. Arch. Photogramm. Remote. Sens. Spat. Inf. Sci. 2021, 43, 273–278. [Google Scholar] [CrossRef]
  73. Ma, L.; Liu, Y.; Zhang, X.; Ye, Y.; Yin, G.; Johnson, B.A. Deep learning in remote sensing applications: A meta-analysis and review. ISPRS J. Photogramm. Remote Sens. 2019, 152, 166–177. [Google Scholar] [CrossRef]
  74. Chini, M.; Pelich, R.; Hostache, R.; Matgen, P. Built-up areas mapping at global scale based on adaptive parametric thresholding of Sentinel-1 intensity & coherence time series. In Proceedings of the 2017 9th International Workshop on the Analysis of Multitemporal Remote Sensing Images, Brugge, Belgium, 27–29 June 2017. [Google Scholar] [CrossRef]
  75. Ravishanker, N.; O’Ruanaidh, J.J.K.; Fitzgerald, W.J. Numerical Bayesian Methods Applied to Signal Processing. J. Am. Stat. Assoc. 1997, 92, 1646. [Google Scholar] [CrossRef]
  76. Koeniguer, E.C.; Nicolas, J.-M. Change Detection Based on the Coefficient of Variation in SAR Time-Series of Urban Areas. Remote. Sens. 2020, 12, 2089. [Google Scholar] [CrossRef]
  77. Weng, Q. Remote sensing of impervious surfaces in the urban areas: Requirements, methods, and trends. Remote. Sens. Environ. 2012, 117, 34–49. [Google Scholar] [CrossRef]
  78. Pesaresi, M.; Corbane, C.; Julea, A.; Florczyk, A.J.; Syrris, V.; Soille, P. Assessment of the Added-Value of Sentinel-2 for Detecting Built-up Areas. Remote. Sens. 2016, 8, 299. [Google Scholar] [CrossRef]
  79. Lisini, G.; Salentinig, A.; Du, P.; Gamba, P. SAR-Based Urban Extents Extraction: From ENVISAT to Sentinel-1. IEEE J. Sel. Top. Appl. Earth Obs. Remote Sens. 2017, 11, 2683–2691. [Google Scholar] [CrossRef]
  80. Sun, G.; Cheng, J.; Zhang, A.; Jia, X.; Yao, Y.; Jiao, Z. Hierarchical fusion of optical and dual-polarized SAR on impervious surface mapping at city scale. ISPRS J. Photogramm. Remote. Sens. 2022, 184, 264–278. [Google Scholar] [CrossRef]
  81. Zhang, J.; Yang, J.; Zhao, Z.; Li, H.; Zhang, Y. Block-regression based fusion of optical and SAR imagery for feature enhancement. Int. J. Remote. Sens. 2010, 31, 2325–2345. [Google Scholar] [CrossRef]
  82. Gu, Y.; Wang, Q.; Jia, X.; Benediktsson, J.A. A Novel MKL Model of Integrating LiDAR Data and MSI for Urban Area Classification. IEEE Trans. Geosci. Remote. Sens. 2015, 53, 5312–5326. [Google Scholar] [CrossRef]
  83. Forget, Y.; Shimoni, M.; Gilbert, M.; Linard, C. Mapping 20 Years of Urban Expansion in 45 Urban Areas of Sub-Saharan Africa. Remote. Sens. 2021, 13, 525. [Google Scholar] [CrossRef]
  84. Boudinaud, L. Mapping Urban Area with Sentinel-1 Data: A Tutorial Using SNAP and SCP for QGIS. Available online: https://fromgistors.blogspot.com/2017/04/mapping-urban-area-with-sentinel-1-data.html (accessed on 16 December 2022).
  85. Chini, M.; Pelich, R.; Hostache, R.; Matgen, P.; Lopez-Martinez, C. Polarimetric and multitemporal information extracted from sentinel-1 SAR data to map buildings. In Proceedings of the International Geoscience and Remote Sensing Symposium (IGARSS), Valencia, Spain, 22–27 July 2018; pp. 8132–8134. [Google Scholar] [CrossRef]
  86. Org, S.U. Transforming Our World: The 2030 Agenda for Sustainable Development; United Nations: New York, NY, USA, 2015. [Google Scholar]
Figure 1. Flow Diagram for manuscript selection.
Land 12 00932 g001
Figure 2. (a) Documents by year, (b) Documents by country, (c) Documents by type, (d) Documents by author (statistics extracted from Scopus research).
Land 12 00932 g002
Table 1. Sentinel-1 satellite characteristics [53].
Interferometric Wide-Swath Mode (IW)Wave ModeStrip Map ModeExtra Wide-Swath Mode (EW)
ParametersPolarizationDual
(HH + HV, VV + VH)
Single
(HH, VV)
Dual
(HH + HV, VV + VH)
Dual
(HH+HV, VV + VH)
Azimuth resolution20 m5 m5 m40 m
Ground range resolution5 m5 m5 m20 m
Azimuth and range looksSingleSingleSingleSingle
ProductsLevel 2OceanOceanOceanOcean
Level 1Single Look Complex-Single Look ComplexSingle Look Complex
Level 0Raw data-Raw dataRaw data
CharacteristicLifetime7 years (consumables for 12 years)
Launch date1A—3 April 2014 | 1B—25 April 2016 timeframe
Launcher/LocationSoyuz, Kourou (both launches)
OrbitNear-polar, Sun-synchronous, about 690 km, 12 days repeat cycle
Orbital period98.6 min
Table 2. Characteristics of common Software used for Sentinel-1 pre-processing and downloading.
SoftwareDeveloperApplicationDescriptionRelated Paper
Copernicus Open AccessEuropean Space Agency (ESA)DownloadingIt provides complete, free, and open access to Sentinel-1, Sentinel-2, Sentinel-3, and Sentinel-5P user products. The self-registration process is automatic and immediate. Registration grants access rights for searching and downloading Sentinels products. Search queries on the products stored on the archive and filtering of results are possible via a full-text search bar, using filters for the different acquisition modes, product types, product levels, and geographical areas.[57,58,59,60]
SNAP—Sentinel 1 ToolboxEuropean Space Agency (ESA)Preprocessing;
Classification
A graphical user interface (GUI) used for both polarimetric and interferometric processing of SAR data. Start to finish processing includes algorithms for calibration, speckle filtering, co-registration, orthorectification, mosaicking, and data conversion.[17,49,59,60,61,62,63,64,65,66]
ENVIInventory Optimization Solutions (IOS)Preprocessing;
Classification
Software built in IDL, a powerful programming language, allows for easy features and functionality customization to meet unique needs.
It makes it easier than ever to read, explore, prepare, analyze, and share information from imagery.
[1,61,67,68,69]
ERDAS ImageERDAS, Inc.Preprocessing;
Classification
Used widely for processing remote sensing data since it provides a framework for integrating sensor data and imagery from many sources. It is based on a Hierarchical File Format (HFA) structure. It allows to apply algorithms and validate results (accuracy assessment).[49]
Google Earth ImageryGoogleValidatingGoogle Earth includes many images collected from satellites orbiting the planet. These images come from various satellite companies and are grouped into a mosaic of photographs taken over many days, months and years. It allows to validate results in visual mode[70,71]
Google Earth EngineGoogleDownloading; Preprocessing;
Classification
Google Earth Engine combines a multi-petabyte catalogue of satellite imagery and geospatial datasets with planetary-scale analysis capabilities. It is used to detect changes, map trends, and quantify differences on the Earth’s surface. The client libraries provide Python and JavaScript wrappers around our web API. It is free.[1,17,55,59,61,68,69,70,72]
Disclaimer/Publisher’s Note: The statements, opinions and data contained in all publications are solely those of the individual author(s) and contributor(s) and not of MDPI and/or the editor(s). MDPI and/or the editor(s) disclaim responsibility for any injury to people or property resulting from any ideas, methods, instructions or products referred to in the content.

