
Spatiotemporal Variation in the Yangtze River Delta Urban Agglomeration from 1980 to 2020 and Future Trends in Ecosystem Services

1
School of Architecture and Planning, Anhui Jianzhu University, Hefei 230022, China
2
Collaborative Innovation Center for Urbanization Construction of Anhui Province, Anhui Jianzhu University, Hefei 230022, China
3
State Key Laboratory of Hydraulic Engineering Simulation and Safety, School of Civil Engineering, Tianjin University, Tianjin 300072, China
4
State Key Laboratory of Simulation and Regulation of Water Cycle in River Basin, China Institute of Water Resources and Hydropower Research, Beijing 100044, China
5
School of Landscape Architecture, Nanjing Forestry University, Nanjing 210037, China
*
Author to whom correspondence should be addressed.
†
These authors contributed equally to this work.
Land 2023, 12(4), 929; https://doi.org/10.3390/land12040929
Submission received: 4 March 2023
/
Revised: 13 April 2023
/
Accepted: 17 April 2023
/
Published: 21 April 2023
(This article belongs to the Special Issue The Dynamics of Biodiversity and Landscape Ecology: Patterns, Processes, and Planning)
Abstract
:Over the past 40 years of reform and opening up, human activities in the Yangtze River Delta region have caused major changes in land use patterns and ecosystem functions. Clarifying the spatiotemporal change characteristics and future development trends of ecosystem service functions is the basis for rational land development and utilization. In this study, the InVEST model and the CASA model were used to calculate habitat quality, water conservation, carbon sequestration and oxygen release, and soil conservation ecosystem services in the Yangtze River Delta urban agglomeration from 1980 to 2020. The spatial pattern, change law, and future trend of these services were analyzed using the Theil–Sen median trend analysis, Mann–Kendall test, and Hurst index analysis. The results show that the four types of ecosystems in the Yangtze River Delta urban agglomeration (habitat quality, water conservation, carbon sequestration and oxygen release, and soil conservation) exhibited an overall spatial pattern of being high in the southwest mountainous area and low in the northeast plain, and the conversion from constructed to agriculture was the most frequent type of land conversion over the past 40 years. From 1980 to 2020, the average level of habitat quality showed a downward trend and is expected to continue to deteriorate in the future. Water conservation, carbon sequestration and oxygen release, and soil conservation showed a fluctuating upward trend, with the latter two primarily predicted to have a future trend of improvement. The changes in ecosystem services exhibit gradient effects and horizontal spatial differentiation. The decline in ecosystem service functions is more pronounced in the vicinity of large cities. It is thus necessary to accelerate the transformation of the economic development model, and abandon the extensive urbanization development model, and promote high-quality urbanization development on the basis of improving resource and environmental carrying capacities.
1. Introduction
The United Nations’ Millennium Ecosystem Assessment 2005 report indicates that 60% of the ecosystems on which humans rely for survival are currently experiencing ongoing degradation [1,2]. Global land use changes over the past 60 years have far surpassed the sum of changes during the 18th and 19th centuries, resulting in a continued decline in the supply capacity of some critical ecosystem services such as climate regulation and food provision, which impacts human development and well-being in addition to threatening regional ecological security [3]. Understanding the spatiotemporal changes and future trends in ecosystem services is crucial for revealing the feedback mechanisms between ecosystem services and human activities, understanding the trade-offs and synergies of ecosystem services in space, supporting effective management of regional ecosystems, and laying the foundation for implementing regional ecological compensation mechanisms [4].
Since the launch of the United Nations-funded Millennium Ecosystem Assessment project in the 21st century, research on ecosystem services has become a hot topic and frontier in the fields of ecology [5], regional planning, and land resource management. Domestic and international scholars have put forward a series of profound academic achievements regarding the spatial differentiation of ecosystem services for different regions [6] and scales, evaluation techniques, management frameworks [7], driving mechanisms, and ecological compensation strategies [8,9]. There are many factors that affect the functionality of ecosystem services, such as topographic and geomorphological features, land use changes, climate change, and human activities [10], which can alter the structure and spatial characteristics of ecosystems and thereby affect the spatiotemporal distribution and changes in ecosystem services [11,12,13]. However, currently, scholars are more focused on the evolution of the quantity of ecosystem services, and further research is needed to explore the spatial characteristics of ecosystem services. Especially for long-term changes, the evaluation methods used are relatively simple. Currently, in long time series studies, Theil-Sen median trend analysis, Mann–Kendall analysis, and Hurst exponent analysis are used to measure the spatiotemporal changes and predictions of vegetation coverage. In order to objectively reveal the long-term changes in ecosystem service functions in the research area, this article intends to use these methods to explore the spatiotemporal characteristics and future trends of ecosystem services in the research area. This is expected to provide important support for revealing the feedback mechanism between ecosystem services and human activities, understanding the real reflection of spatial ecosystem service trade-offs and collaborative effects, and promoting effective management of regional ecosystems.
As one of the most dynamic and economically prosperous regions in China, the Yangtze River Delta region is facing increasing human activities and pressures on its ecological environment. The continuous increase in human activities has led to a severe decline in ecosystem services, such as decreasing forest coverage, serious soil erosion, and deteriorating air quality. Therefore, it has become urgent and essential to study the spatiotemporal changes in ecosystem services in the Yangtze River Delta region. Such research can provide scientific evidence for government departments to formulate relevant environmental protection policies and sustainable development plans. At the same time, understanding the trends and spatial distribution of ecosystem services in the region can better promote the balance between economic development and environmental protection for people and enterprises in the Yangtze River Delta region. Therefore, studying the spatiotemporal changes in ecosystem services in the Yangtze River Delta region is of great significance for the sustainable development and environmental protection of the region. [14,15]. The normal functioning of ecosystem services within the region significantly affects the high-quality development of the region as a whole. Habitat quality, soil conservation, carbon sequestration and oxygen release, and water conservation are the main ecosystem services that affect the Yangtze River Delta urban agglomeration [13,16].
In order to explore the spatial and temporal distribution of the four types of ecosystem services in the Yangtze River Delta urban agglomeration and whether the changes in the four types of ecosystem services are sustainable. This paper will examine the following aspects: (1) calculated four types of ecosystem services in the Yangtze River Delta urban agglomeration from 1980 to 2020 using the InVEST and CASA models; (2) explored the spatial and temporal changes in 40a ecosystem services using non-parametric Theil-Sen median trend analysis and Mann–Kendall tests; (3) the sustainability status of these four types of ecosystem service trends based on the Hurst index.
2. Materials and Methods
2.1. Study Area
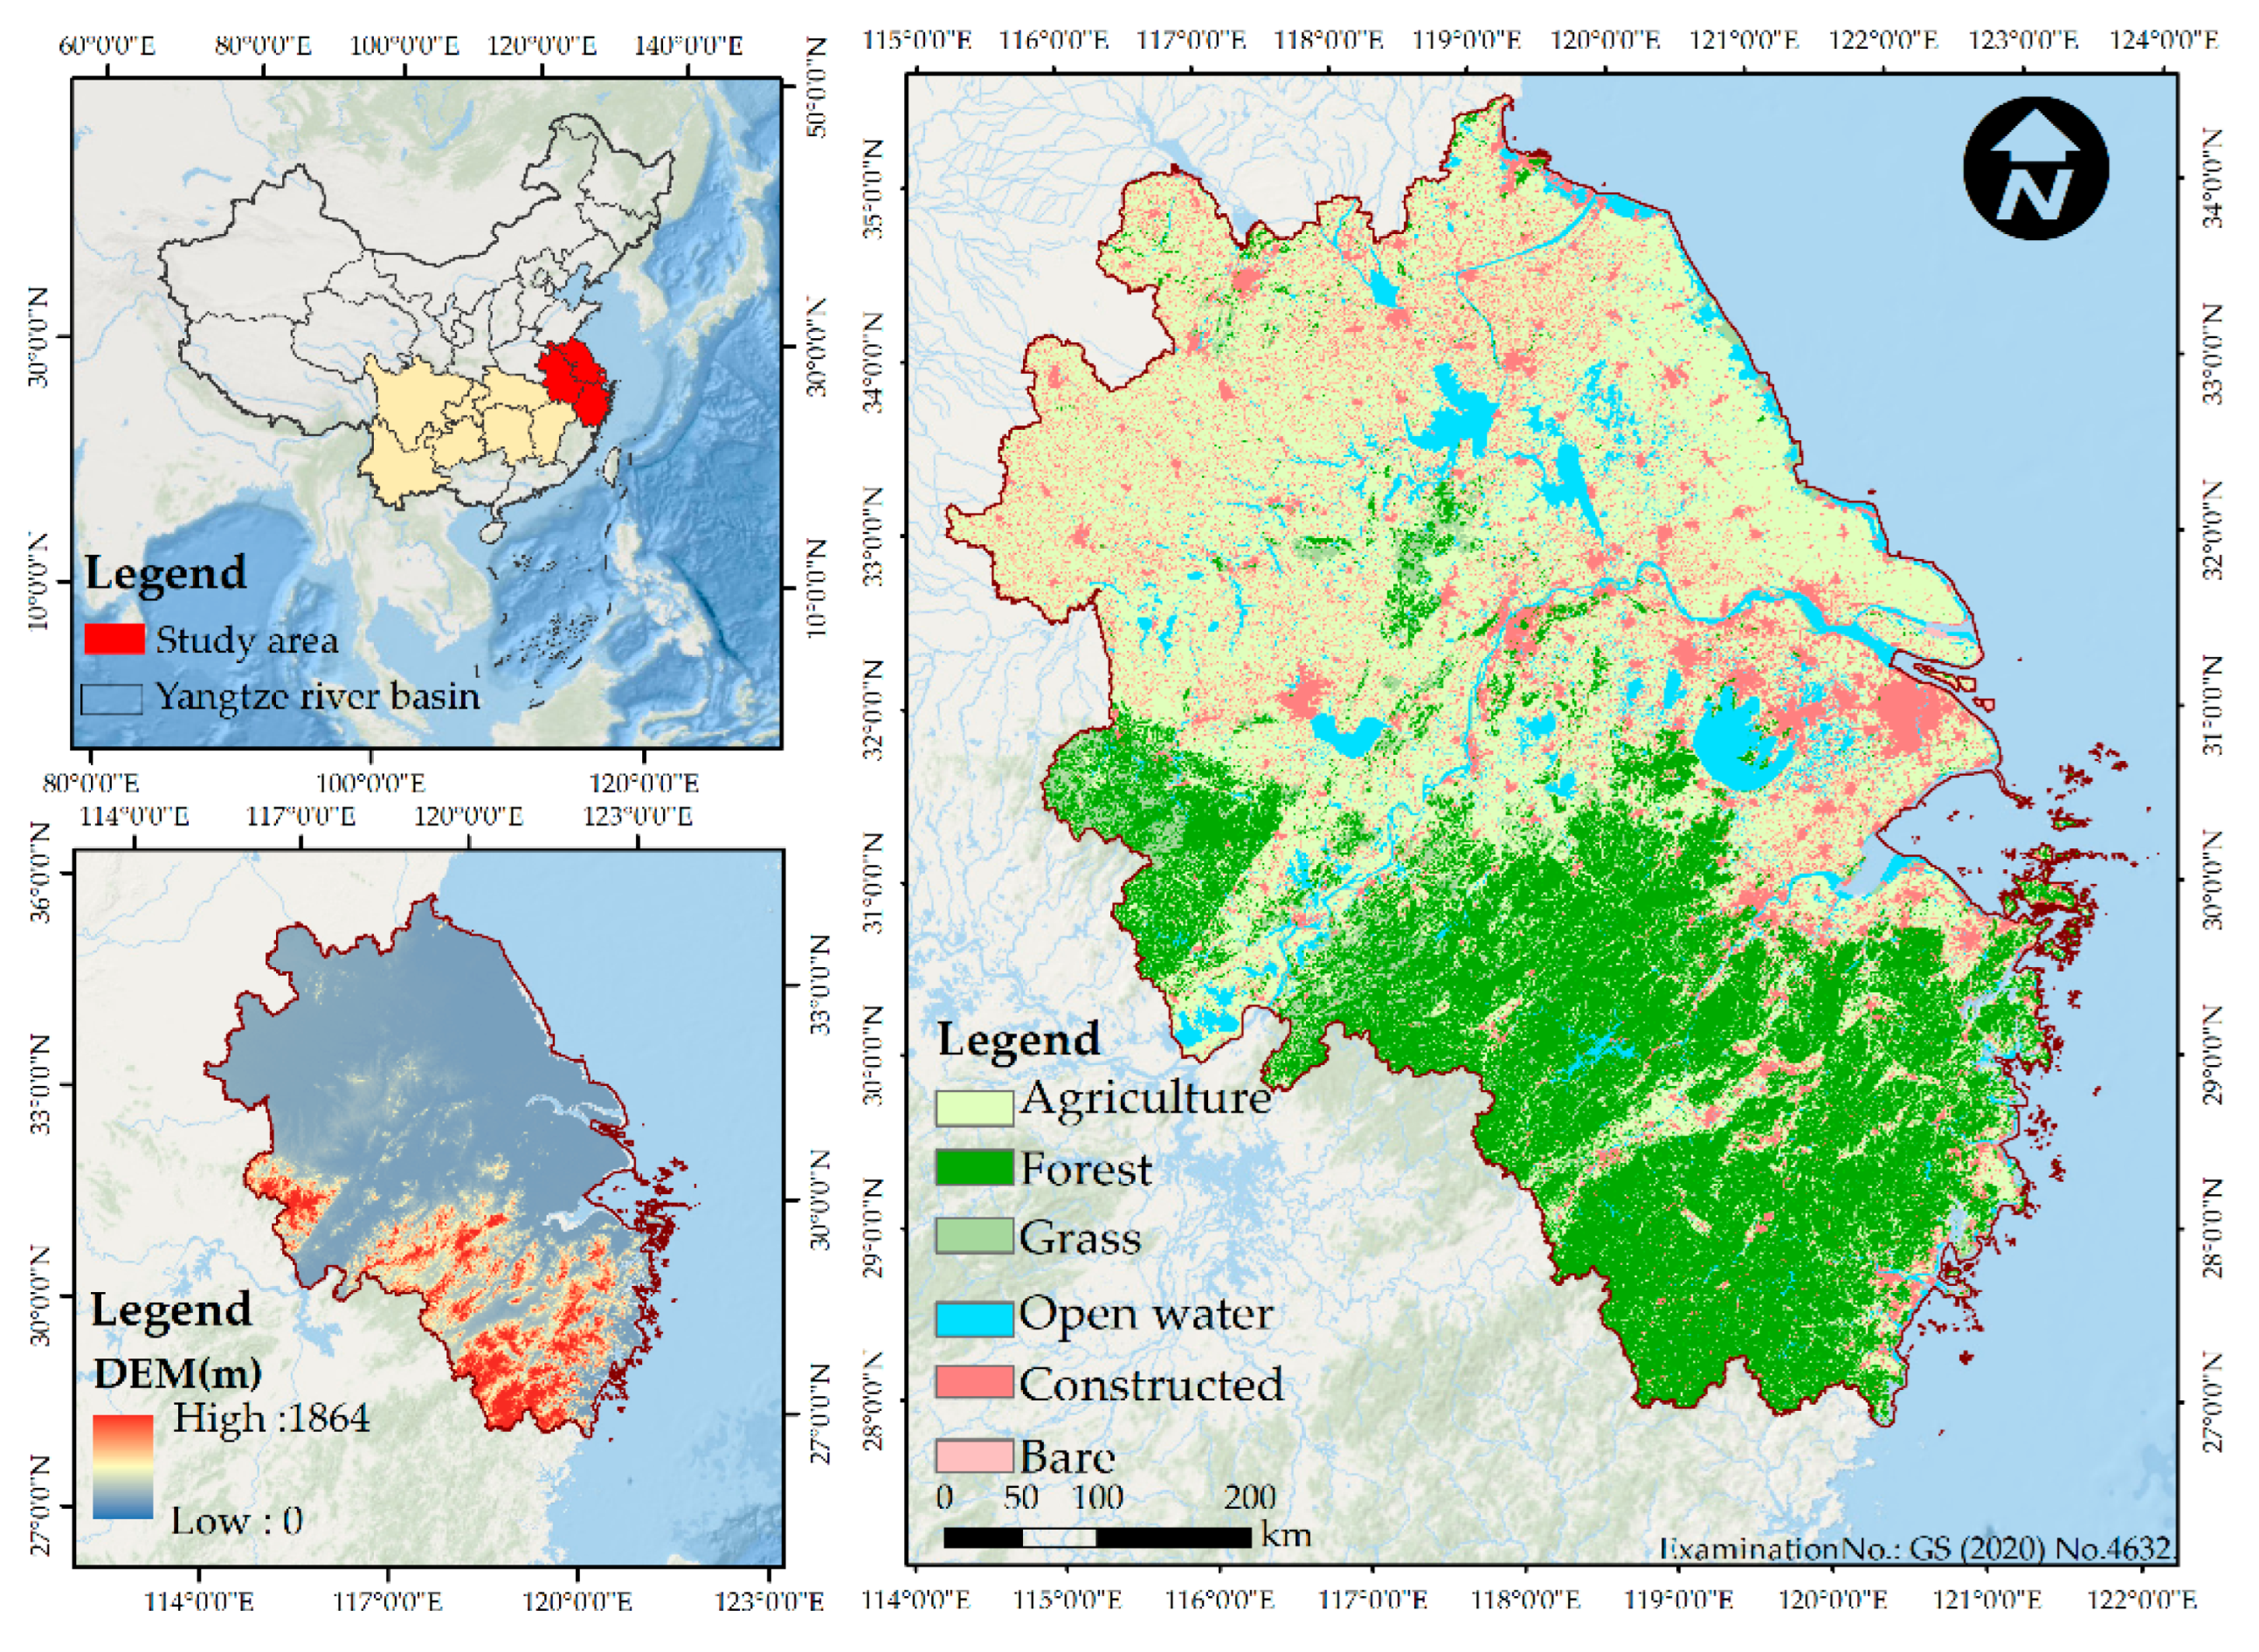
The Yangtze River Delta region covers an area of 358,000 square kilometers and had a population of 227 million people at the end of 2019 (Figure 1). With less than 4% of China’s land area, it contributes nearly one-fourth of the country’s total economic output and one-third of its total import and export volume. In terms of climate, the Yangtze River Delta region belongs to the subtropical monsoon climate zone, with hot and humid summers and cold and rainy winters. The average temperature in summer is between 25 °C–30 °C, and in winter, it is between 5 °C–10 °C. The annual average precipitation is about 1000–1500 mm. Additionally, due to its proximity to the ocean, the Yangtze River Delta region is often affected by typhoons and heavy rains, which increases the risk of natural disasters. In terms of geography, the Yangtze River Delta region has a complex and diverse terrain, including mountains, plains, and hills. The region is also the intersection of the Yangtze River and Qiantang River systems, forming the Yangtze River Delta and Qiantang River Delta, which are the two most important delta regions in China. In addition, the Yangtze River Delta region is home to famous cultural and natural attractions such as the Suzhou Gardens and West Lake, making it one of China’s most important tourist regions. However, the rapid development of urbanization since the reform and opening up has resulted in drastic changes in land use, leading to ecological degradation, which poses obstacles to economic development.
2.2. Data Sources and Pre-Processing
The basic data used in this study includes the following five types:
- (1)
- Meteorological observation data, including radiation, precipitation, and temperature data, were obtained from the China Regional High Spatiotemporal Resolution Surface Meteorological Element Driving Dataset downloaded from the website (https://data.tpdc.ac.cn/zh-hans, accessed on 23 April 2022).
- (2)
- Land use data for five periods (1980, 1990, 2000, 2010, and 2020) with a spatial resolution of 30 m were obtained from the Chinese Academy of Sciences Resource and Environmental Science Data Center (https://www.resdc.cn/, accessed on 23 April 2022).
- (3)
- DEM elevation data with a spatial resolution of 90m were obtained from the Chinese Academy of Sciences Resource and Environmental Science Data Center and used with ASTER Global Digital Elevation Model (ASTER GDEM) data (https://www.resdc.cn/, accessed on 23 April 2022).
- (4)
- NPP dataset: Due to the lack of NPP data for 1980 and the large differences in NPP values from different datasets, the 1985 NPP data were instead used to maintain consistency in the dataset. The NPP data used in this study were obtained from the Global Change Science Research Data Publishing System (http://www.geodoi.ac.cn/WebCn/Default.aspx, accessed on 25 April 2022) [17].
- (5)
- Soil data were obtained from the Chinese Soil Dataset (v1.2), based on the World Soil Database (HWSD), with a resolution of 1km (http://westdc.westgis.ac.cn, accessed on 25 April 2022) [18].
All data were resampled to a uniform resolution of 100 m × 100 m and a unified coordinate system using the resampling function of the ArcGIS platform. The study data are described in Table 1.
3. Research Methodology
3.1. Research Framework
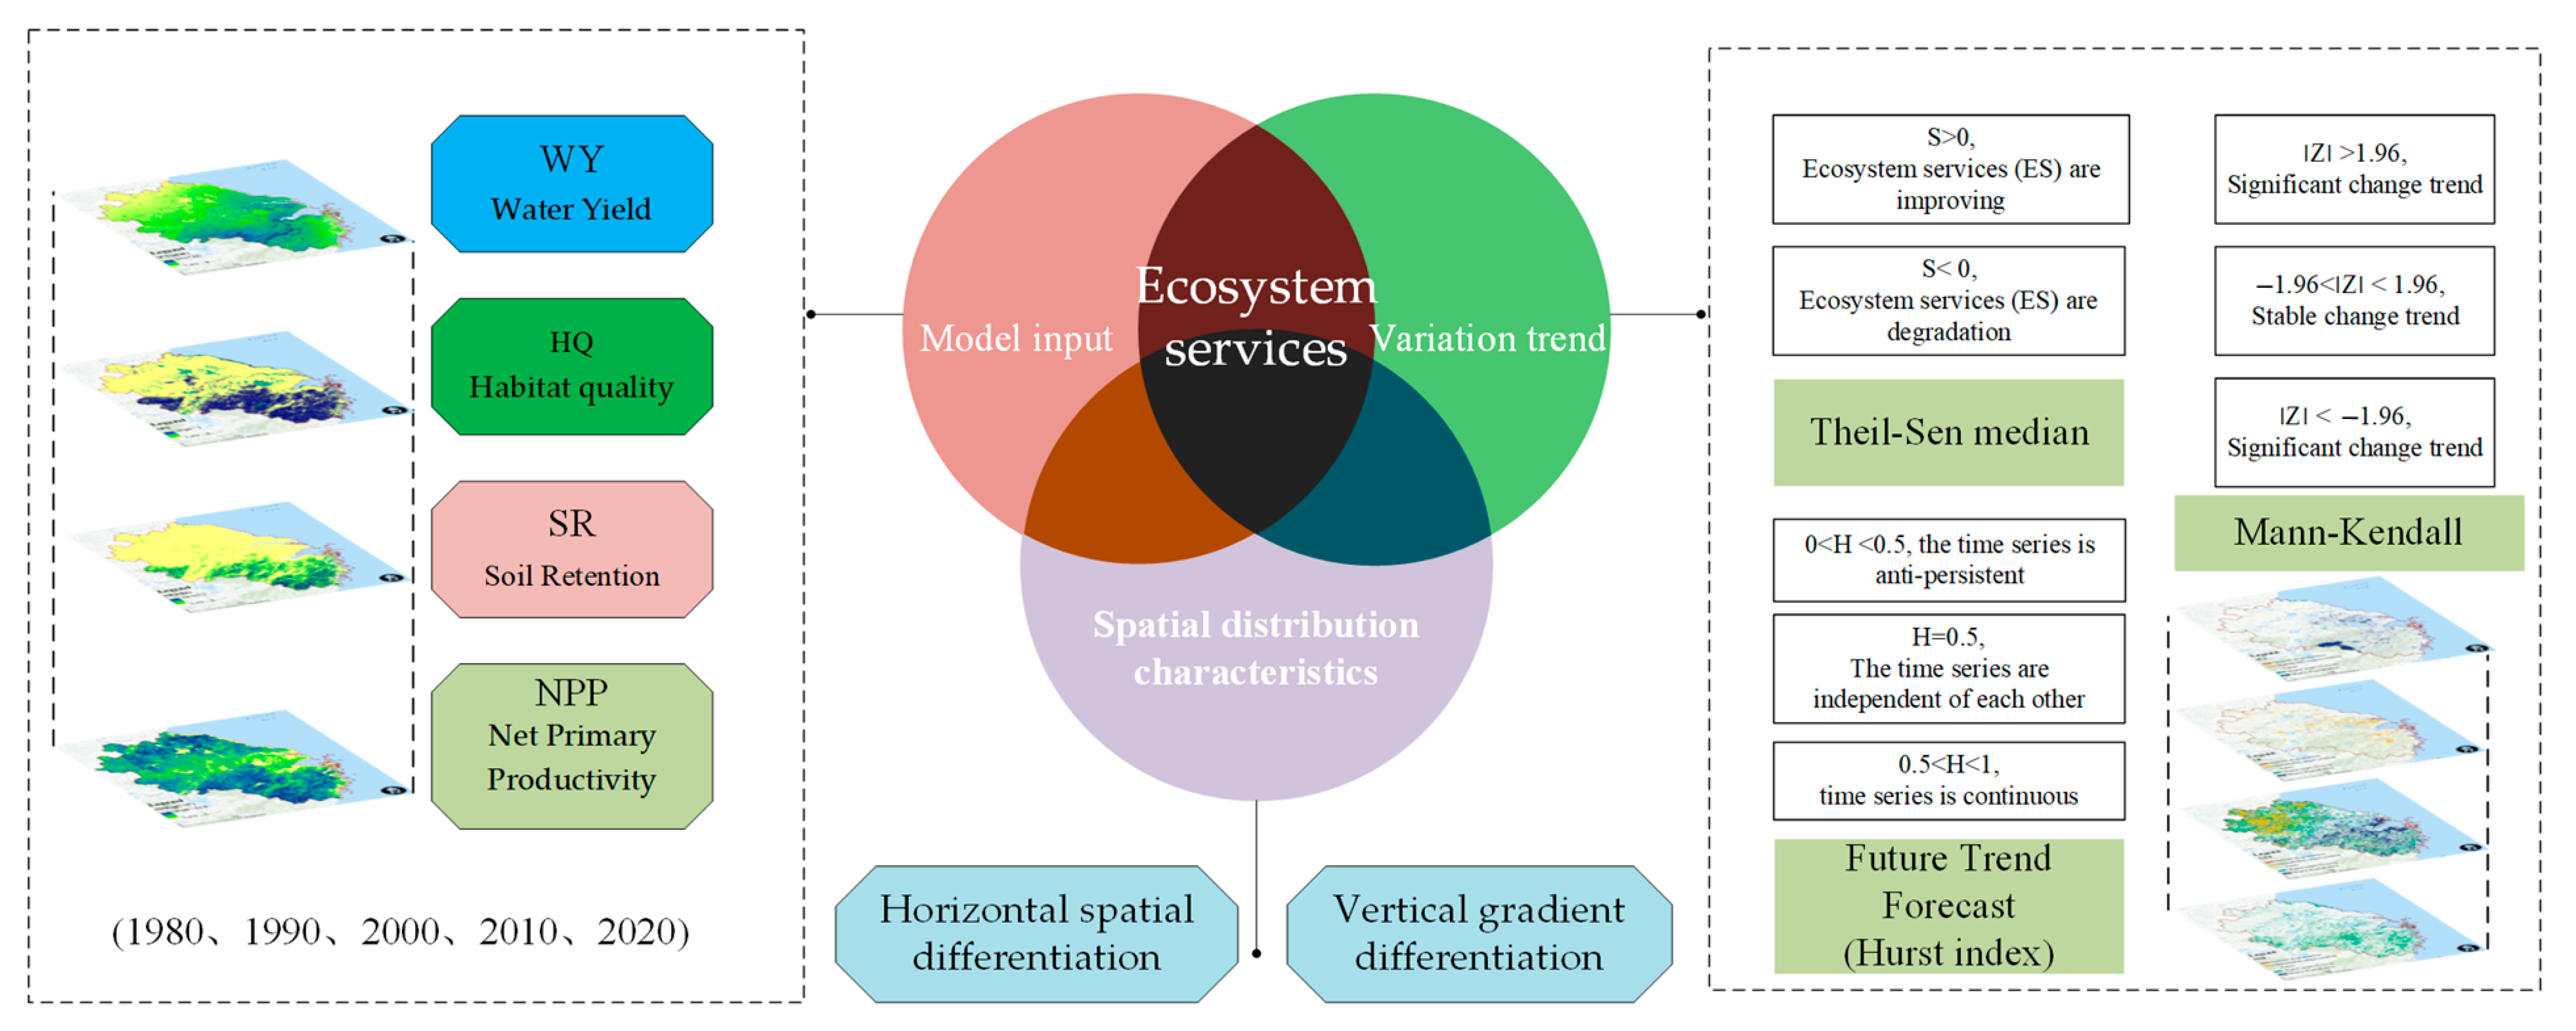
This study uses spatial quantification methods for ecosystem services, such as the Invest model and the CASA model, to conduct a quantitative assessment of the spatiotemporal variations in habitat quality, soil conservation services, water production services, carbon sequestration, and oxygen release in the ecosystem of the Yangtze River Delta urban agglomeration. To further explore the temporal dynamics of the identified ecosystem services, a nonparametric trend estimation method, Sen&MK, and the Hurst index are introduced. The MATLAB platform is utilized to measure the spatiotemporal evolution characteristics and future trends in ecosystem service functions. The technical approach of this paper is as follows (Figure 2):
3.2. Ecosystem Services
- (1)
- Habitat Quality
The InVEST model is an ecosystem service assessment model that includes the Habitat Quality Module [19]. This module is based on the relationship between land cover and habitat threats. It calculates the threat intensity of habitat threats by considering factors such as the stress radius, spatial weight, and spatial attenuation type. It combines other land cover habitat adaptability and sensitivity to habitat threats to determine the habitat quality of the region [20]. The specific formula is as follows:
In the equation, represents the habitat quality index of grid x in landscape type j in the study area. The value range of is [0, 1], which represents the habitat suitability score of the landscape type . is the half-saturation constant, which is set based on the data precision of the study area. In this paper, is set to 50. is the scale constant, which is generally set to 2.5. Based on the InVEST model manual and relevant studies, this research established the parameter table of the Habitat Quality module. The table for the parameter settings of the Habitat Quality module can be found in the Supplementary Materials (Tables S1 and S2). Please refer to the Supplementary Materials for more details [21,22].
- (2)
- Water Yield
In this study, the Water Yield module of the InVEST model was used to assess the water yield function of the study area [19,23]. This was primarily accomplished by applying the Budyko water–energy balance equation. The specific formula is as follows:
In the equation, represents the annual water yield (mm) of each grid cell in the watershed, represents the actual annual evapotranspiration (mm) of the grid cell , and represents the annual precipitation (mm) of the grid cell .
- (3)
- Soil Retention
The assessment of soil conservation function in the study area was carried out using the sediment retention module of the InVEST model [19], which is based on the calculation principle of the USLE (universal soil loss equation). The calculation formula is as follows:
In the equation, represents soil conservation (), determined by the difference between potential soil erosion () and actual soil erosion (); R represents the rainfall erosion factor. Due to limitations in rainfall data, the value is estimated and validated based on different types of rainfall data; is the soil erodibility factor; is the slope length and slope factor; is the vegetation cover and management factor; is the soil conservation measure factor. In the model, and values are fixed values used to adjust the actual deviation in calculating soil conservation, as shown in Table 2, which is determined based on relevant literature [3].
- (4)
- Net primary production
NPP (net primary productivity) is the net amount of organic matter fixed by vegetation through photosynthesis, which is an important indicator of ecosystem carbon storage services [24,25,26]. In this study, the CASA (Carnegie–Ames–Stanford Approach) model was used to calculate NPP. The CASA model calculates the net primary productivity of the ecosystem based on the utilization efficiency of light energy, water, nutrients, and other resources required for vegetation growth. The calculation formula is as follows:
where represents the net primary productivity () at location and time ; represents the absorbed photosynthetically active radiation () at location and time ; and denotes the light use efficiency at location and time .
3.3. Theil–Sen Median and Mann–Kendall Analyses
Using Theil–Sen median trend analysis and the Mann–Kendall test [27,28,29], this study investigates the spatial distribution characteristics, temporal variation characteristics, and changing trends in habitat quality, water conservation, net primary productivity (NPP), and soil conservation in the Yangtze River Delta region. Previous studies have shown that the combination of Theil–Sen median trend analysis and Mann–Kendall test methods can be used to determine the trend changes in long-term time series data. Theil–Sen median trend analysis is a robust nonparametric statistical trend calculation method that can reduce the influence of data outliers. Its calculation formula is as follows:
When > 0, it reflects an increasing trend in the provision of ecosystem services, whereas when > 0, it reflects a decreasing trend in the provision of ecosystem services.
Mann–Kendall is a nonparametric statistical test method used to determine the significance of trends. It does not require samples to follow a certain distribution and is not affected by a small number of outliers. Mann–Kendall can accurately reflect whether there are significant changes in ecosystem services over long time series. The calculation formula is as follows:
In the formula, and respectively represent the values of pixel in year and year , and represents the length of the time series. is the sign function, and the value range of the Z statistic is (). At a given significance level , when , it indicates that there is a significant change in the study series at the α level. Generally, α = 0.05 is chosen. In this study, the significance of the trend of ecosystem services time series changes is evaluated at a confidence level of 0.05.
3.4. Hurst Exponent Analysis
Self-similarity and long-term dependence are commonly observed phenomena in nature [30,31]. Among various effective methods for quantitatively describing the long-term dependence of time series information, the Hurst exponent is widely used in fields such as hydrology, economics, climatology, and geology [32,33]. The calculation principle is as follows:
- (1)
- For any positive integer 1, define the mean sequence :
- (2)
- Deviation:
- (3)
- Range:
- (4)
- Standard deviation:
The dimensionless ratio R/S is used to quantify the Hurst phenomenon, which is a common feature of self-similarity and long-term dependence in natural systems. If there exists an H such that , it indicates the presence of the Hurst phenomenon in , where H is the Hurst exponent. The Hurst exponent is obtained by least squares fitting of the plot in a log–log coordinate system. The Hurst exponent can take values within the following range:
- (1)
- 0 < H < 0.5 indicates anti-persistence in the ecological system service time series, meaning that past variables are negatively correlated with future trends, and the series has characteristics of sudden jumps or mutations. The closer H is to 0, the stronger the anti-persistence.
- (2)
- H = 0.5 indicates that the ecological system service time series is a set of independent random variables.
- (3)
- 0.5 < H < 1 indicates a long-term correlation in the ecological system service time series, and the process has persistence. The closer H is to 1, the stronger the persistence.
4. Results
4.1. Evolution Characteristics of Spatiotemporal Pattern of Land Use
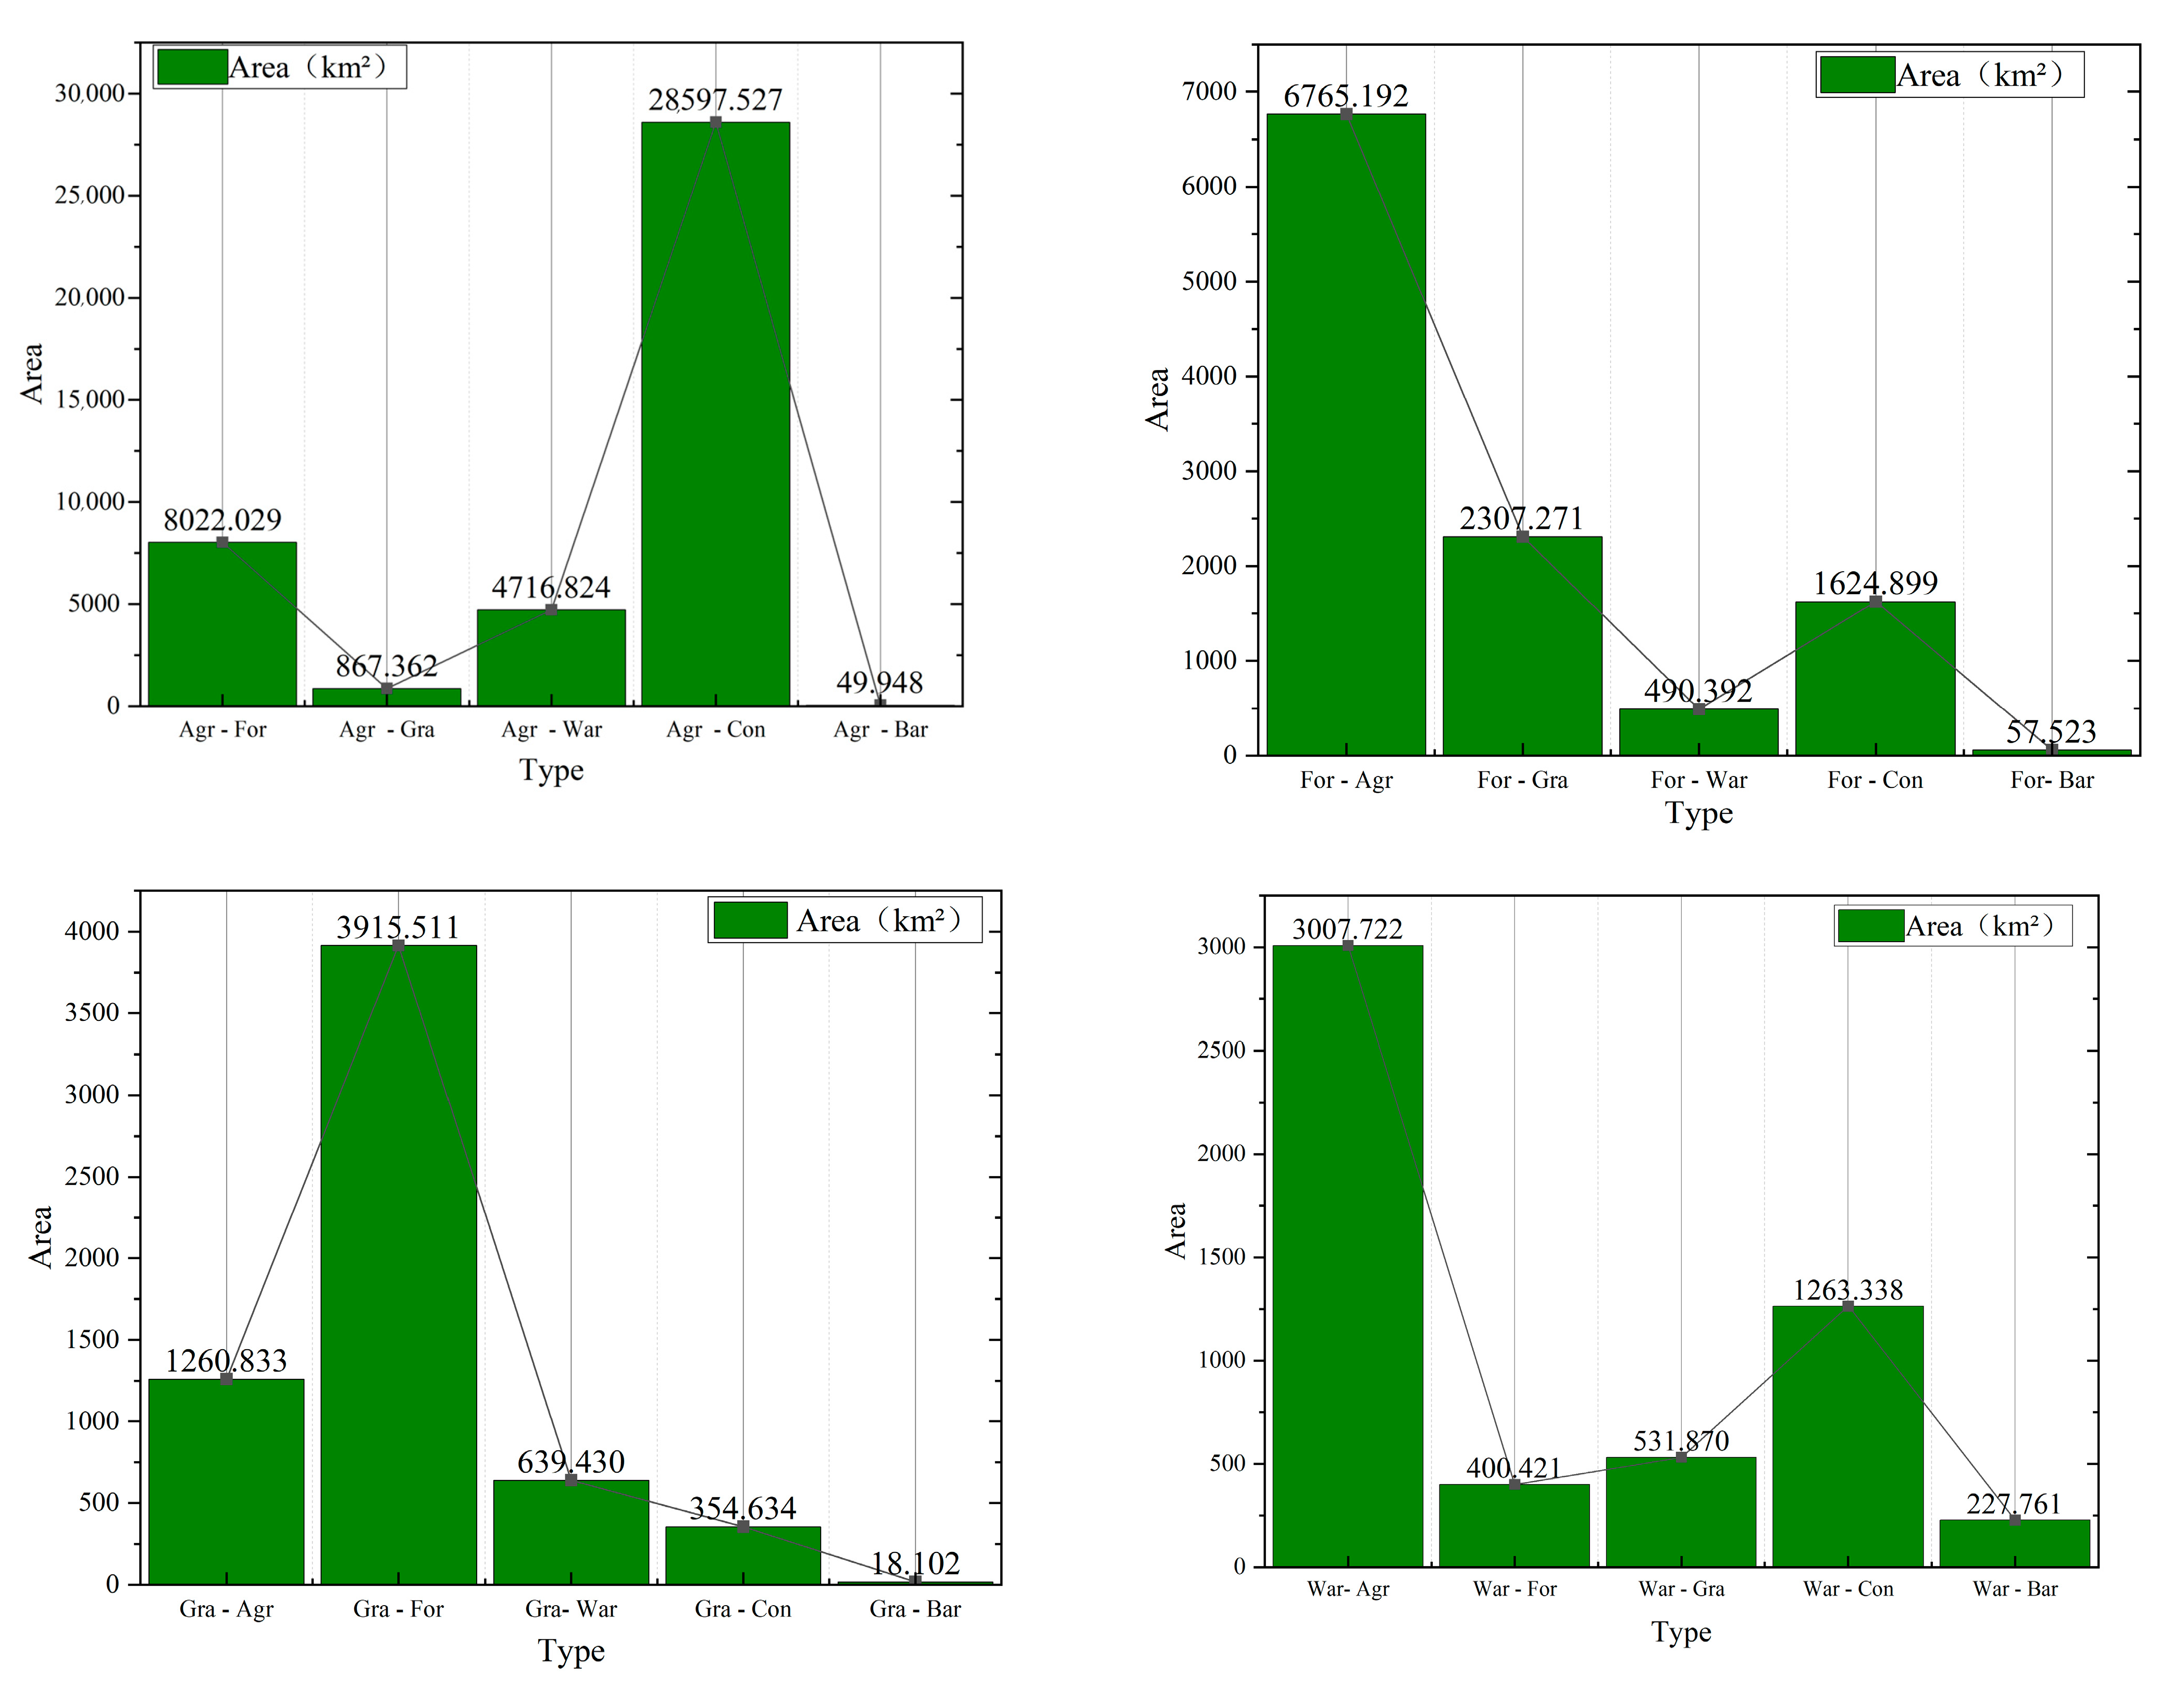
Based on the land use data in 1980, 1990, 2000, 2010, and 2020, the land use transition matrices were calculated for each year, and a Sankey diagram was generated to visualize the land use transitions. As shown in Figure 3, the conversion between agriculture and constructed was the most dramatic among all land use types from 1980 to 2020. Specifically, 28,597.53 of agriculture was converted to constructed, while 8621.68 of constructed was converted to agriculture (Figure A1 in Appendix A).
The main areas of change were located around large cities, such as Shanghai, Suzhou, Nanjing, and Hefei, which are more economically developed (Figure 4). In the Zhejiang region (including Shaoxing, Hangzhou, and Taizhou), a large number of grasslands were converted to forests and agriculture to forests. In the Jianghuai Plain region, land use changes were mostly between agriculture and constructed due to new village construction, urban expansion, and village shrinkage and relocation resulting in agriculture. In coastal areas, such as Yancheng in Jiangsu and Chongming Island in Shanghai, water areas were transformed into other types of land for reclamation projects, with water areas mainly being converted into agriculture and constructed. From 1980 to 1990, land use changes in the Yangtze River Delta were the most dramatic, with conversions between agriculture and constructed and large-scale conversions from agriculture to forests and from forests to agriculture. The increase in constructed was slower from 1990 to 2000 compared with the other periods. From 2000 to 2020, the conversion of agriculture to constructed was the most significant, indicating rapid urbanization during this period.
4.2. Overall Distribution Characteristics of Ecosystem Services
- (1)
- Horizontal spatial differentiation characteristics
Between 1980 and 2020, the four types of ecosystem services (habitat quality, water retention, net primary productivity (NPP), and soil conservation) in the Yangtze River Delta region exhibited obvious geographic and spatial differentiation, showing a pattern of being high in the southern mountains and low in the northern plains (Figure 5). The mean values of the four ecosystem services during this period were 0.52, 545.03 mm, 288.72 , and 1027.2 t/ha for habitat quality (HQ), water retention (WY), NPP, and soil conservation (SDR), respectively. The spatial differentiation of HQ and SDR was greater than that of WY and NPP, mainly because the key influencing factors in HQ and SDR were land use data, and the overall pattern of land use was restricted by the natural geographic foundation. WY and NPP were mainly constrained by multiple factors such as climatic conditions (rainfall, temperature, solar radiation, and potential evapotranspiration) and land use, so their spatial differentiation showed pattern differences in different periods dominated by changes in climatic conditions.
- (2)
- Vertical spatial differentiation characteristics
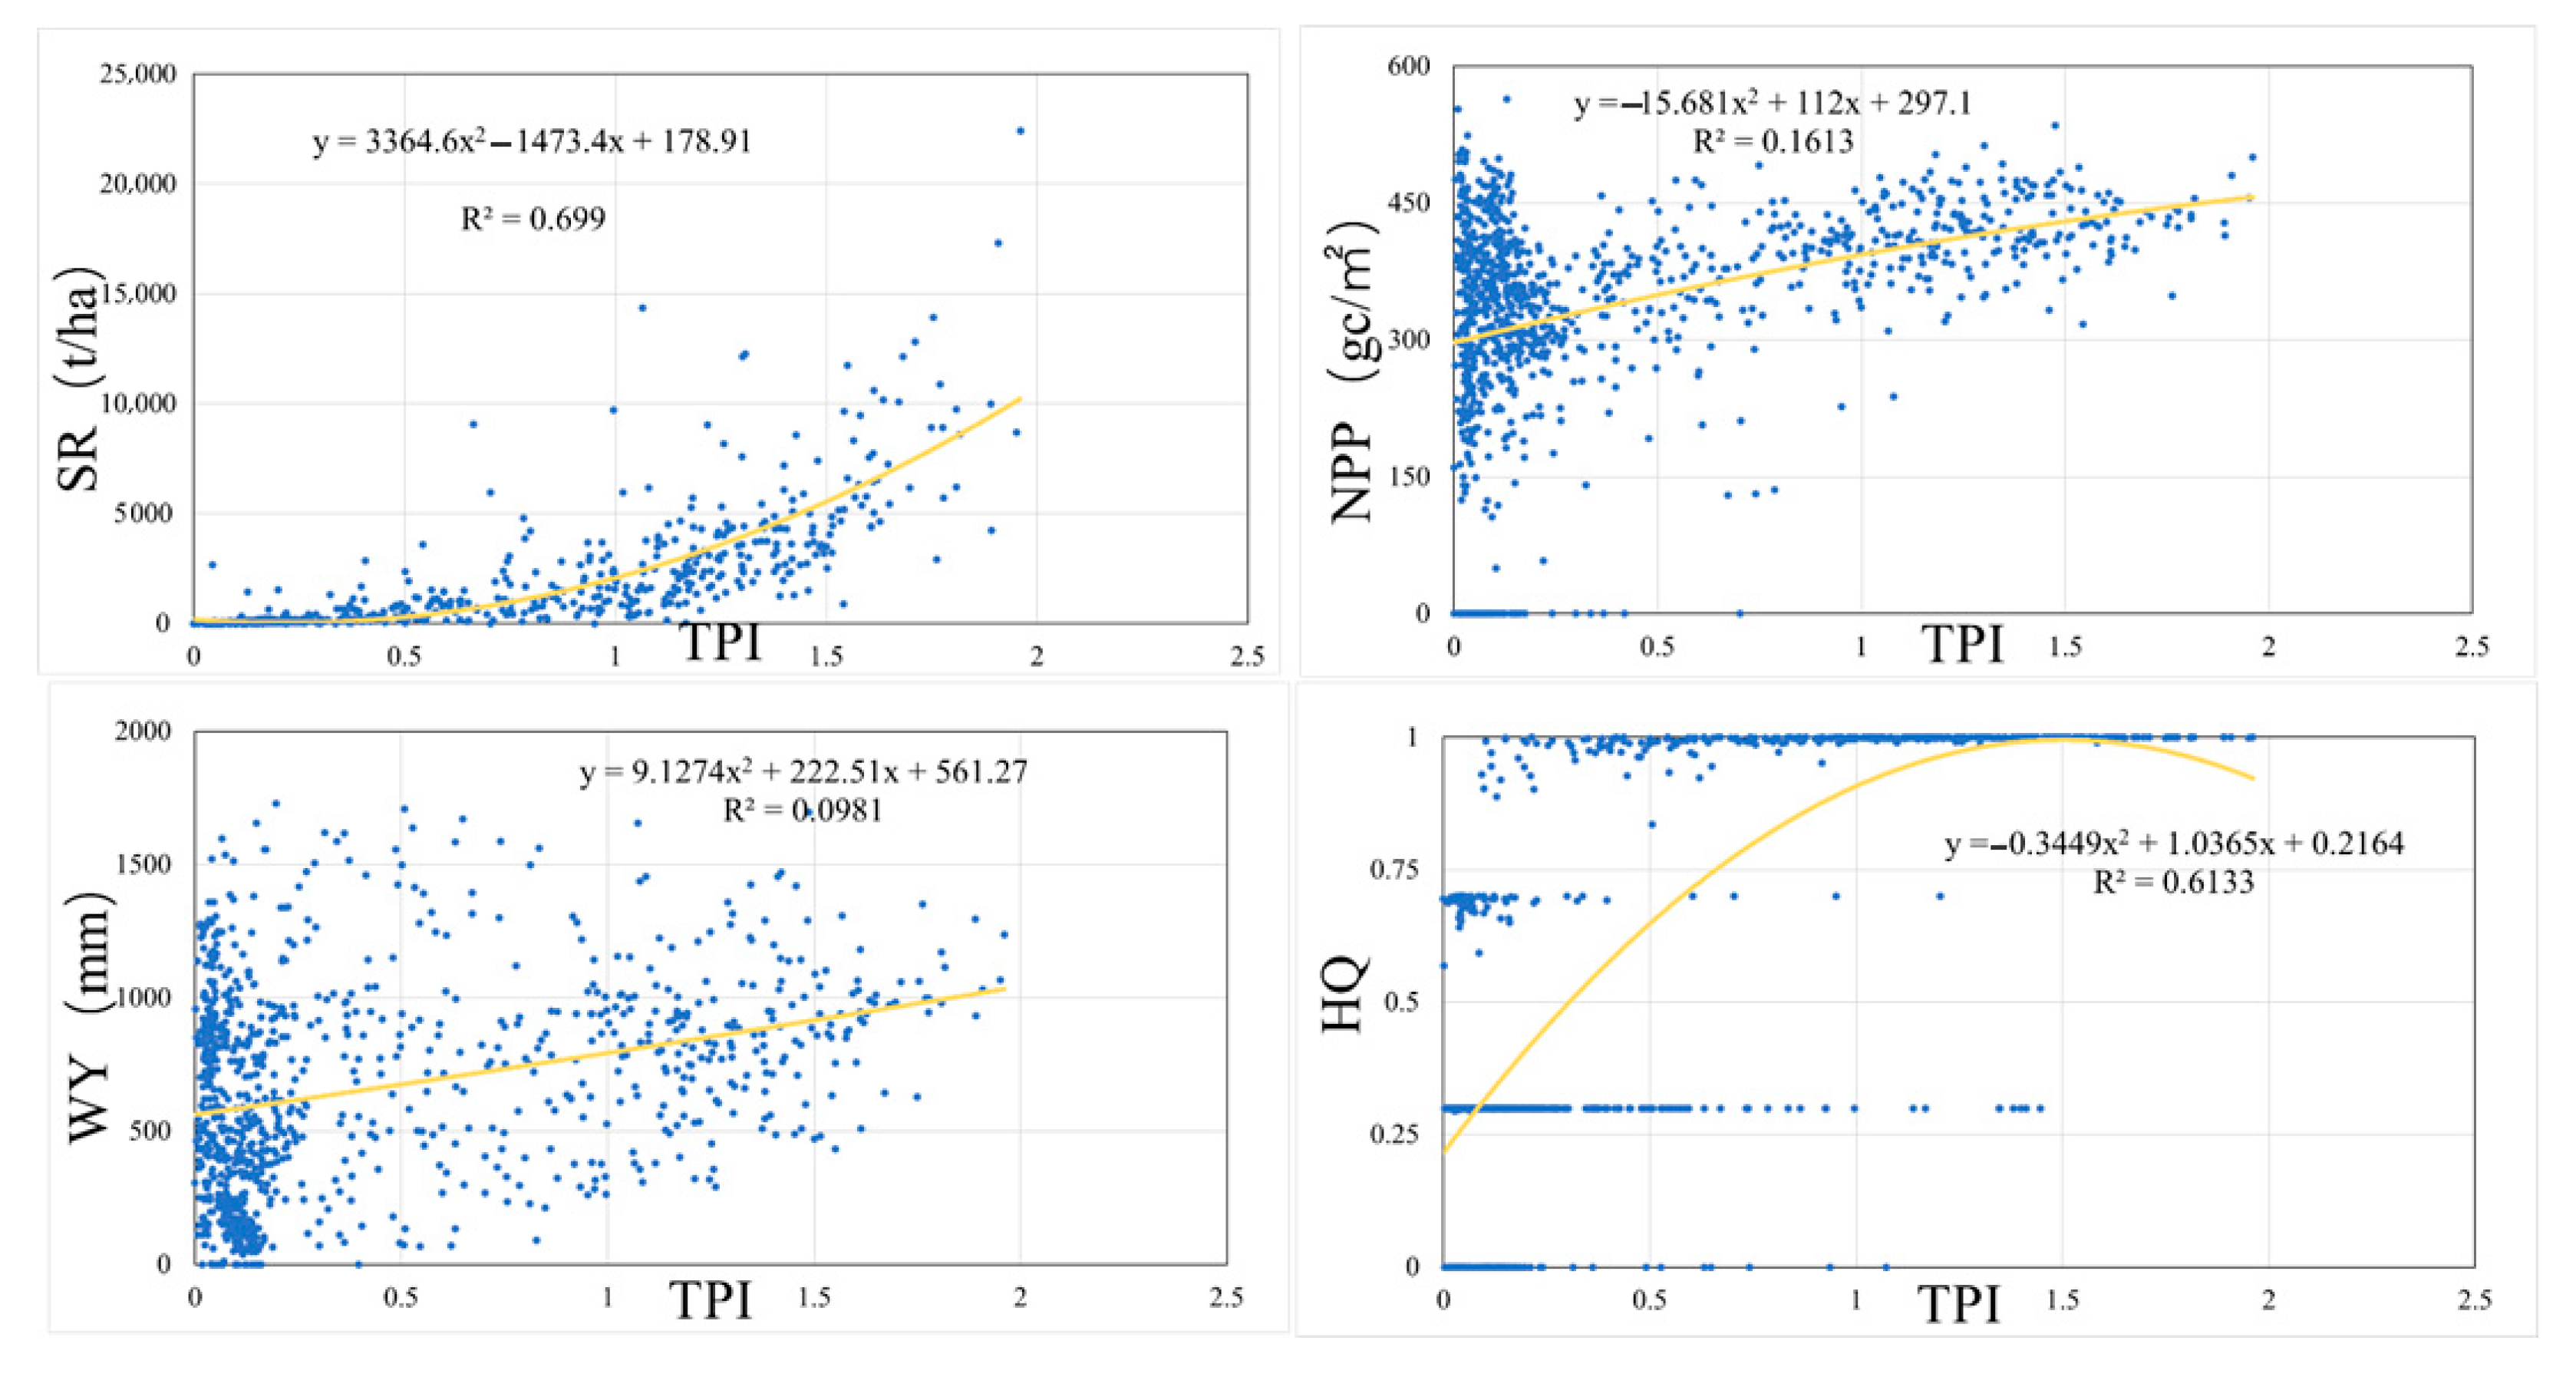
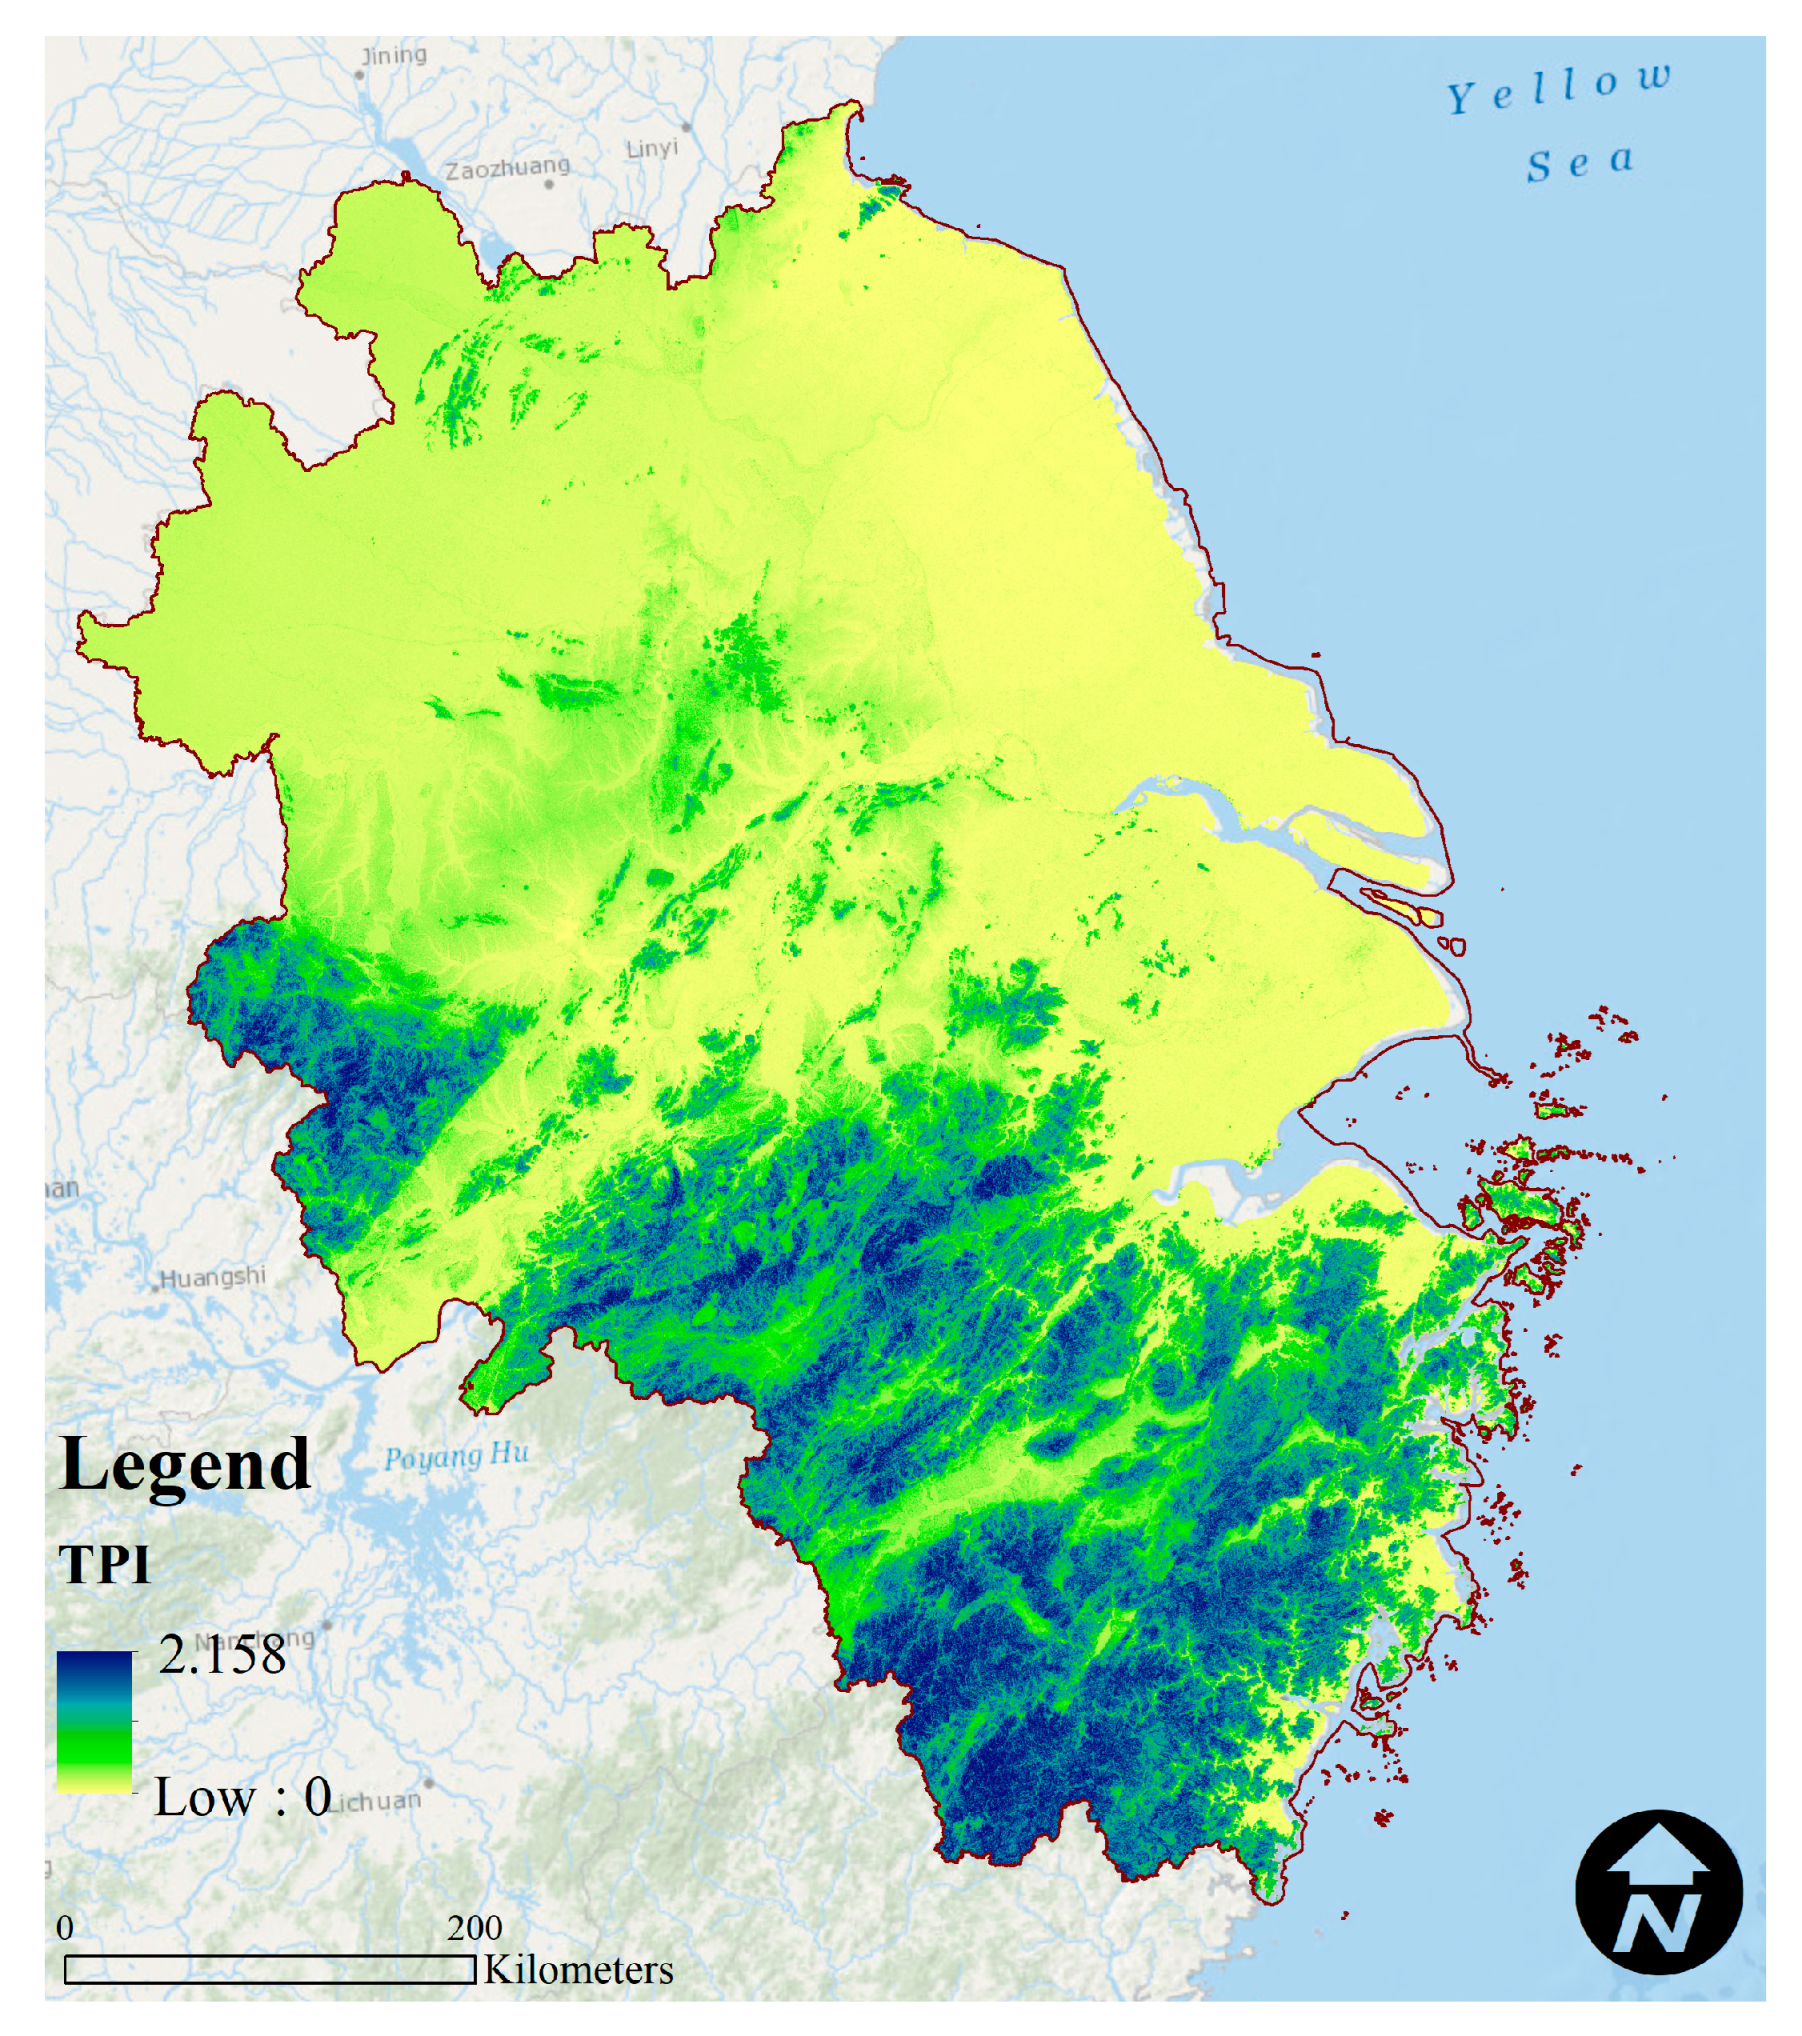
The terrain ruggedness of the Yangtze River Delta region was calculated using the topographic position index formula based on slope and elevation data extracted from the DEM between 1980 and 2020. The overall terrain of the Yangtze River Delta showed a distribution pattern of higher in the southwest and lower in the northeast (Figure A2 in Appendix A). Fish nets were created using ArcGIS, and the values of the terrain position index (TPI) and the four types of ecosystem services at each point were sampled. Scatter plots were created to visualize the relationship between the terrain position index and the four types of ecosystem services (Figure 6), and regression analysis was performed. In the results, two opposite trends were observed for the relationship between the four types of ecosystem services and the terrain. In terms of correlation, the polynomial curve fitting coefficients () of soil conservation (SR) and habitat quality (HQ) were 0.69 and 0.61, respectively, indicating that terrain ruggedness is one of the important factors affecting soil conservation and habitat quality. Although the curve fitting coefficients of water conservation, carbon sequestration, oxygen release, and terrain ruggedness were not high, their distribution characteristics showed that these ecosystem services were also affected by terrain ruggedness to some extent. As terrain ruggedness increases, natural conditions such as sunlight, temperature, and precipitation gradually change, the population and human activities decrease, and the land use structure changes.
4.3. Spatial and Temporal Change Trend in Ecosystem Services
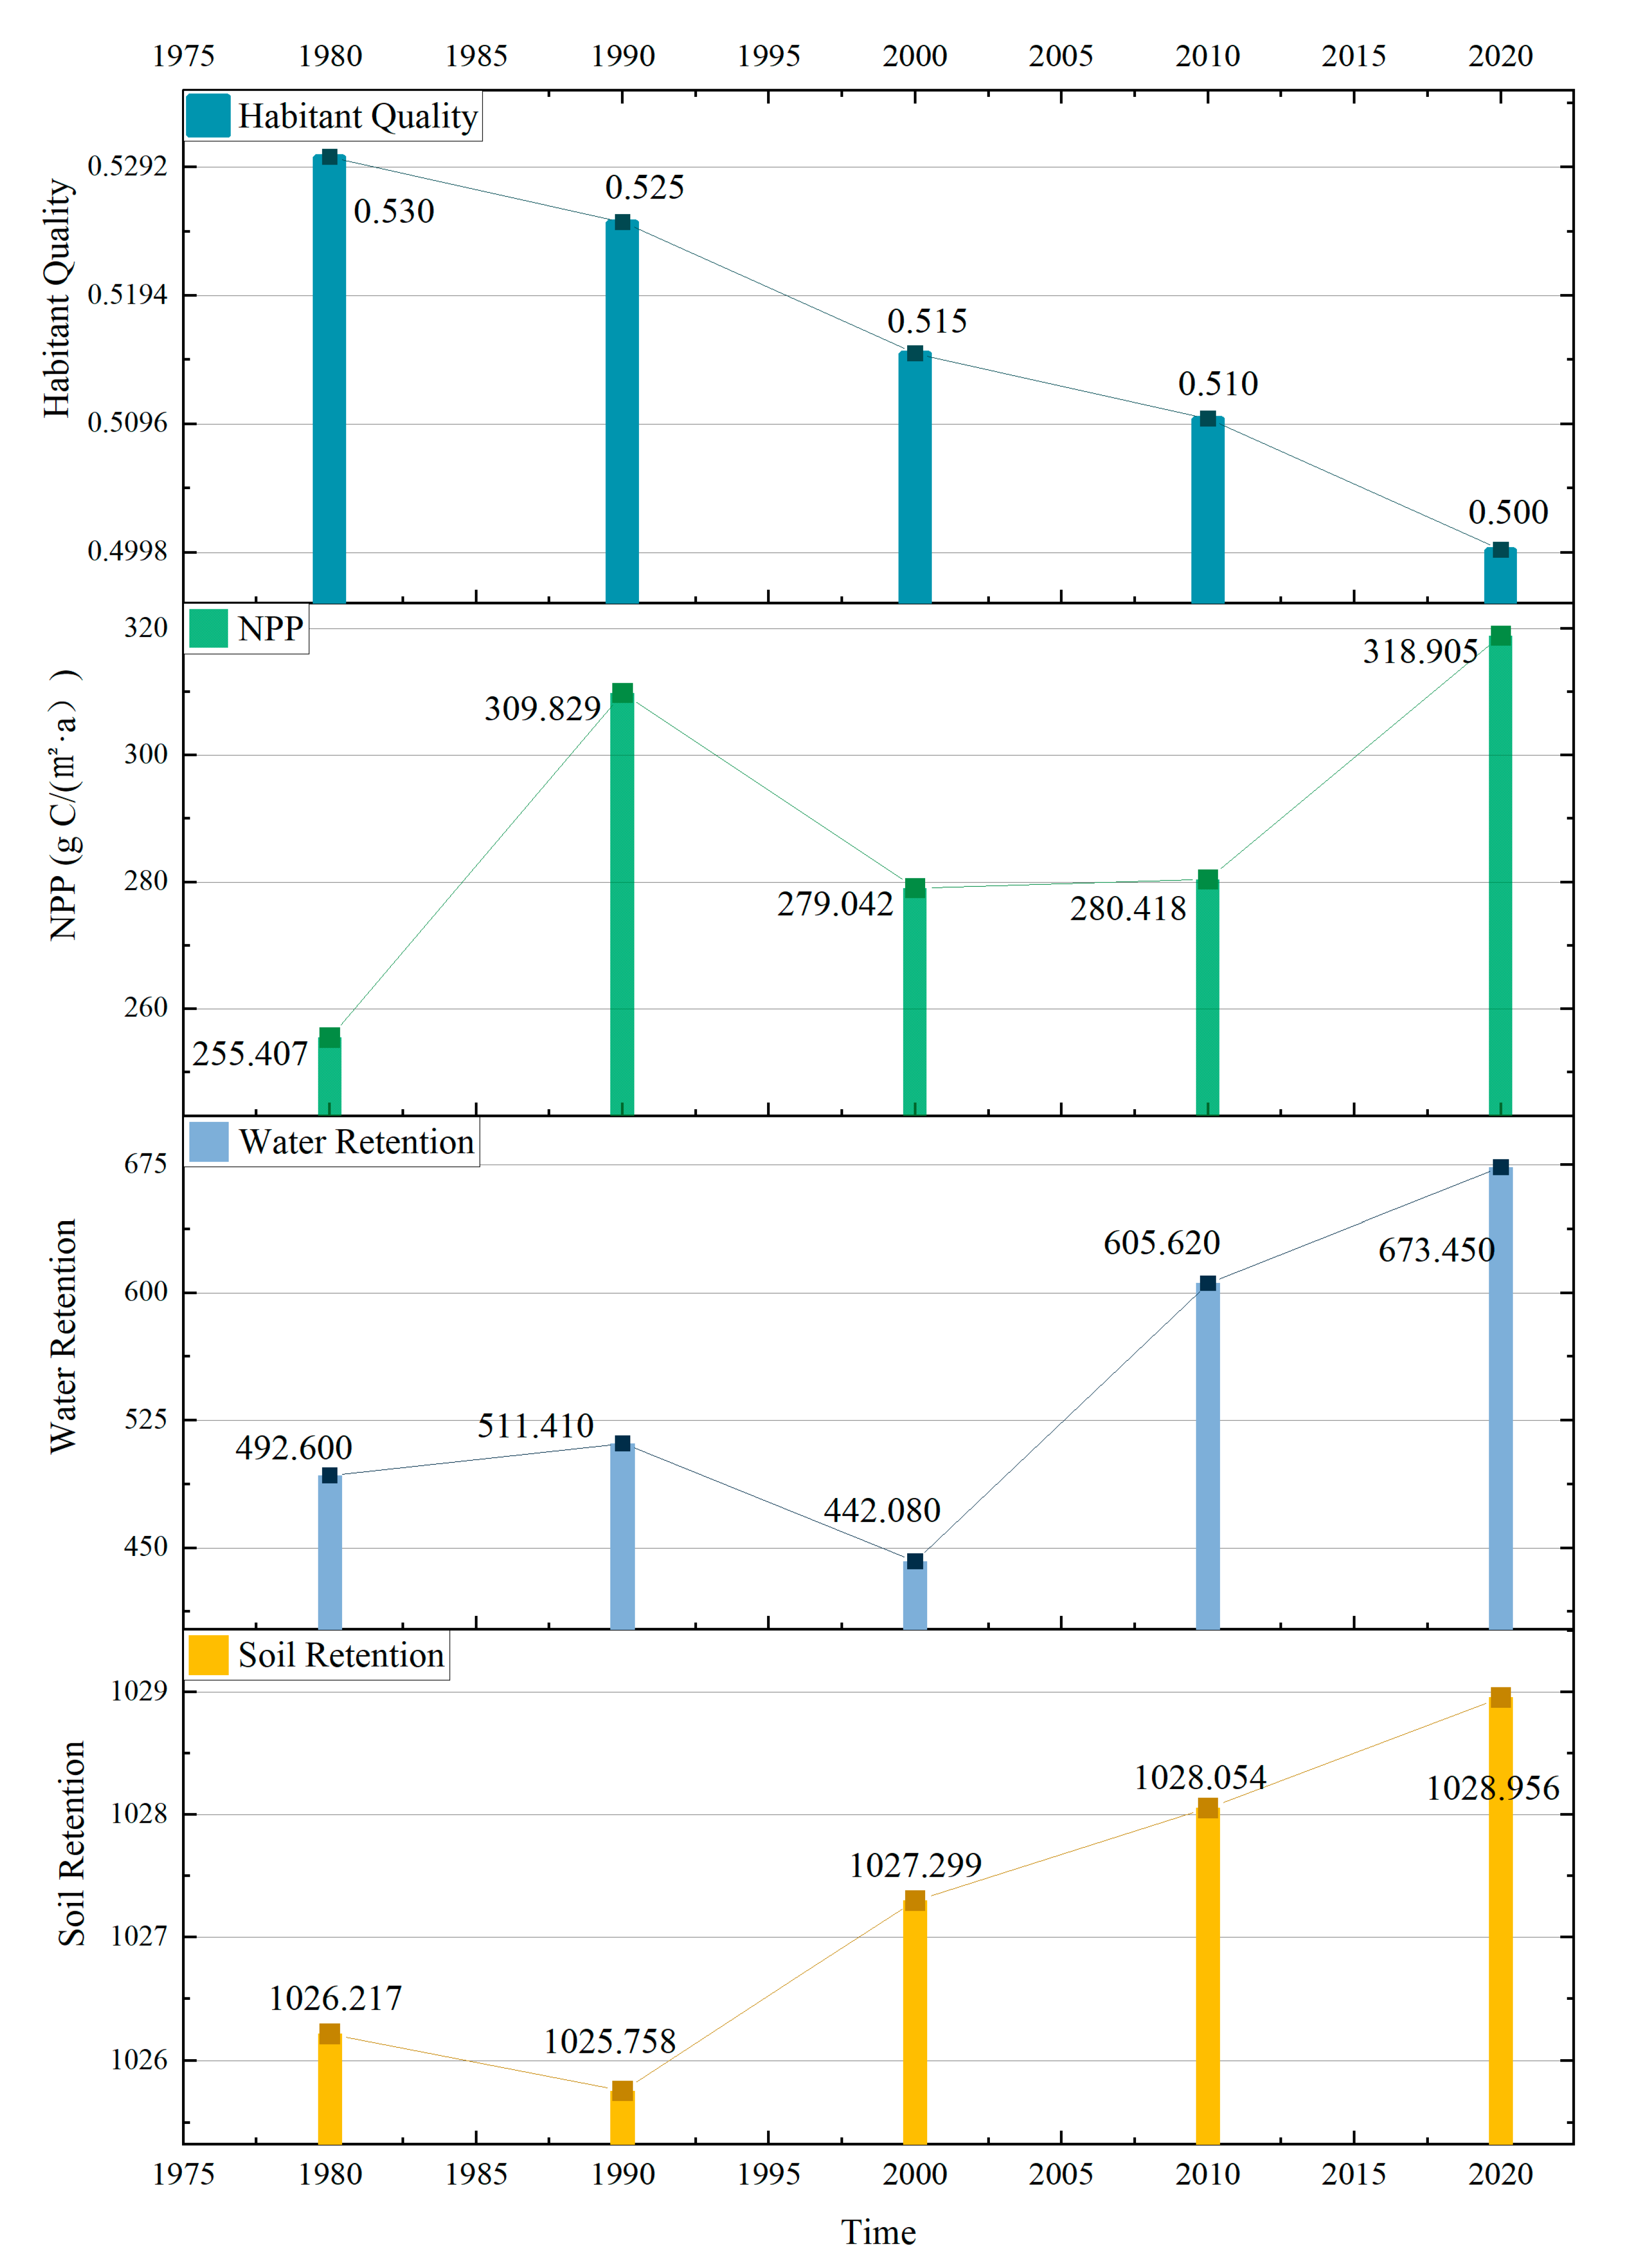
Measuring the changes in ecosystem services in the Yangtze River Delta from 1980 to 2020 using the Theil–Sen median and Mann–Kendall models. Over the past 40 years, the average regional habitat quality has slightly declined, with some fluctuations in water conservation, net primary productivity (NPP), and soil conservation, but these services have increased overall. According to Table 2, the four categories of ecosystem services in the Yangtze River Delta have generally improved from 1980 to 2020. Combining Table 3 with the mean values of the four ecosystem services, we found that although the overall level of habitat quality has declined, the habitat quality values range from 0.500 to 0.530, and the area with improved habitat quality (18.90%) is much greater than the area with degraded quality (0.80%). It is inferred that this may be due to the conversion of high-quality habitats, such as forests, grasslands, and water bodies, to low-quality construction land.
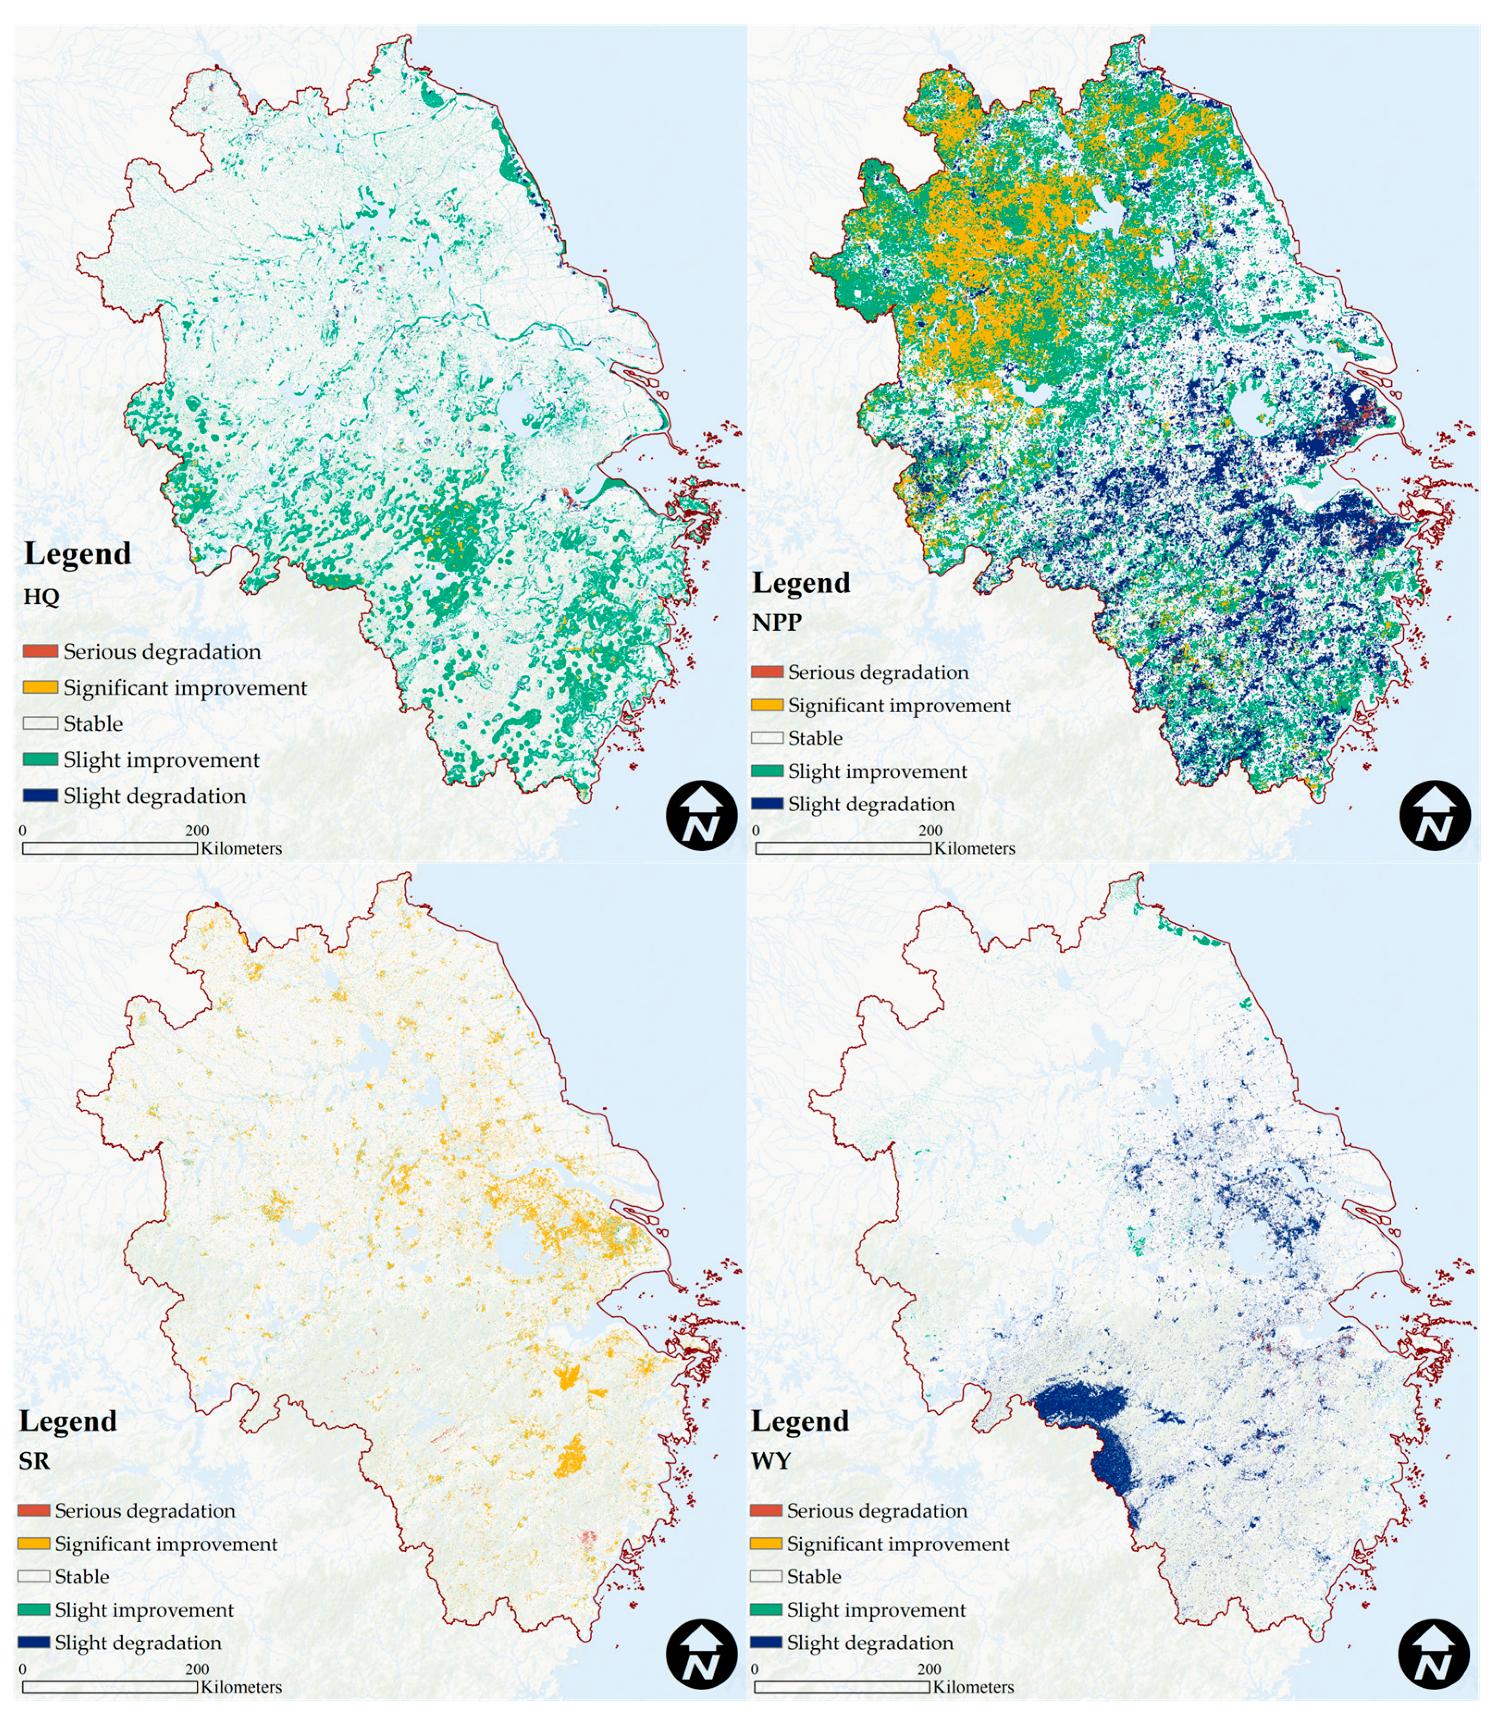
The trends in the four ecosystem services exhibit spatial differentiation in the study area (Figure 7). The degraded habitat quality is mainly located in coastal areas near Hangzhou and Yancheng, while improved habitats are distributed mainly in the southern parts of Anhui and Zhejiang. Water conservation has shown a large area of degradation in Huangshan and Quzhou, and there have been many areas of decline in water conservation capacity in Suzhou, Wuxi, Changzhou, and Hangzhou. It is worth noting that there has been a slight improvement in water conservation capacity in some parts of Lianyungang and Yancheng in Jiangsu Province, while the overall water conservation capacity in the Jianghuai Plain has remained stable, with minor improvements in some areas. Soil conservation has shown a large increase in the study area from 1980 to 2020. Previous research has shown that the conversion of dry land to other land types (forests, grass, and constructed) can lead to an increase in soil conservation function, with an overall improvement rate of 8.03% and a degradation rate of 0.12% (Figure 8).
4.4. Analysis on Sustainability of Ecosystem Service Change Trend
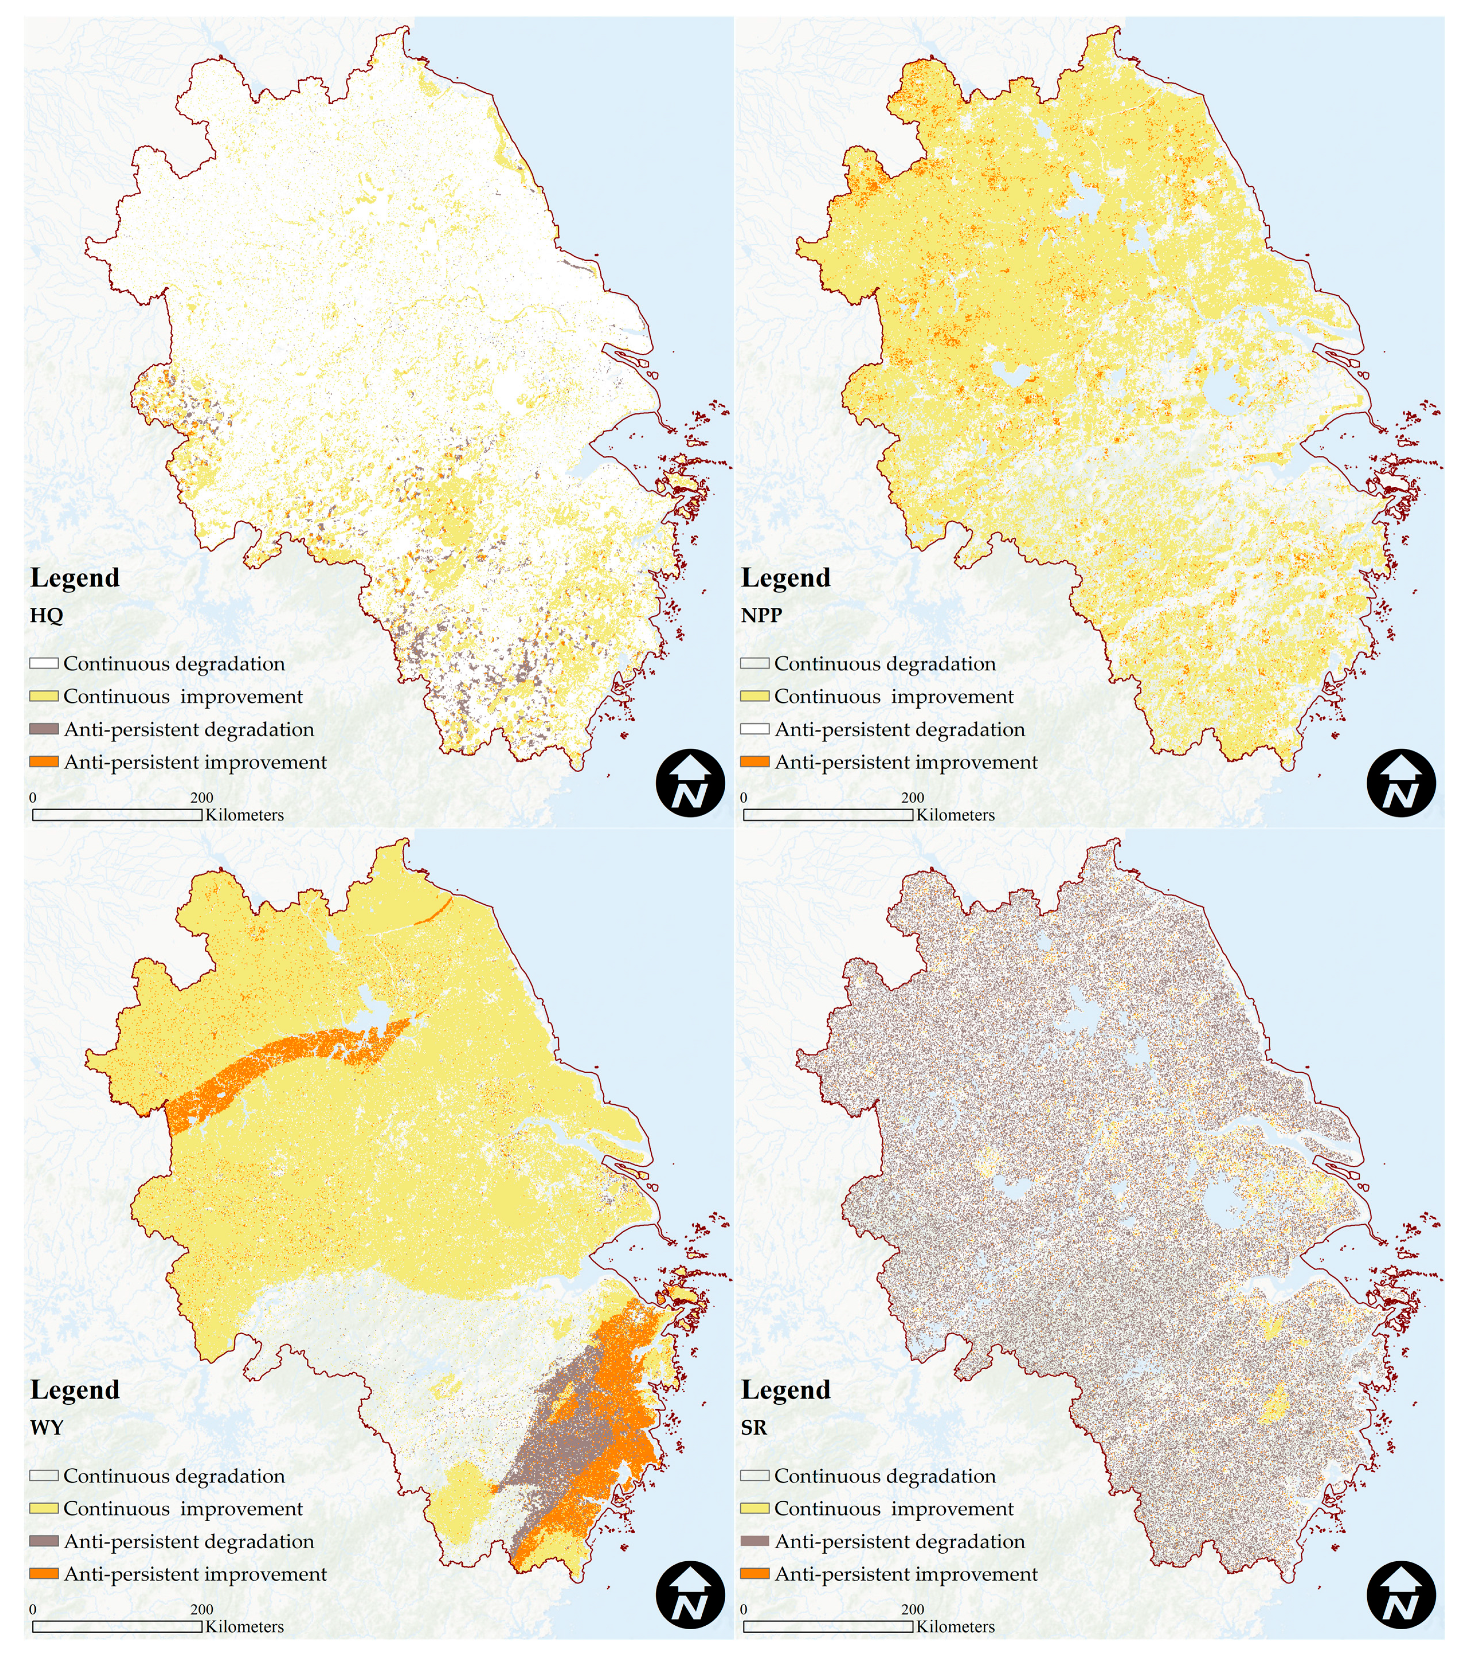
Continuous analysis and statistical analysis of the four ecosystem services from 1980 to 2020 (Table 4) and the overlay of the Hurst exponent and Theil–Sen median trend analysis reveal the spatial distribution of sustainable spatial distribution of the four ecosystem services. Soil conservation in the Yangtze River Delta is mainly unsustainable, while habitat quality, water conservation, and NPP are mainly sustainable (Figure 9).
The area with continuously degraded habitat quality is found to account for 79.31% of the study area in the future, while the area with sustainable improvement accounts for 17.74% of the study area and is mainly concentrated in the mountainous areas of Zhejiang Hangzhou, Wenzhou, Taizhou, Anhui Dabie, and Huangshan. It is worth noting that there are still scattered areas of unsustainable improvement and degradation in the surrounding areas. As for the Yangtze River Delta region, where land expansion for construction is more intense, more attention should be paid to the impact of land use conversion from high-quality habitats to other uses on the regional ecological environment.
The area with continuously improved water conservation accounts for 63.16% of the study area in the future and is mainly in the northeastern plain of the Yangtze River Delta, while the area with continuous degradation and unsustainable improvement accounts for 32.59% of the study area and is mainly distributed in the southwestern part of the study area and the Huaihe River Basin, with scattered concentrations around Hefei, Nanjing, Suzhou, Wuxi, Changzhou, and Shanghai.
5. Discussion
5.1. Comparison of Measurement Differences in the Temporal and Spatial Trends of Ecosystem Services
The diversity of ecosystem balance and coordination relationships in different regions reflects differences in physical geography and human activities [34,35]. However, at the regional scale, the correlation coefficients between ecosystem services in different regions differ significantly from those at the global scale. Our findings show that water conservation, soil conservation, and net production value of the Yangtze Delta region are on an increasing trend, increasing by 180.85 mm, 2.739 t/ha, and 63.498 gc/m2, respectively, between 1980 and 2020. This is the same conclusion as Lin’s study [36]. However, in terms of carbon stocks, we believe that carbon stocks in the Yangtze Delta region have risen in recent years, which is different from Li’s study [37]. We believe that this is due to some differences in the results due to different research methods (the InVEST model and the CASA model) and different scales of research. Further research is needed to confirm how the carbon stocks in the Yangtze River Delta region have changed.
From 1980 to 2020, the four types of ecosystem services in the Yangtze River Delta urban agglomeration showed different trends in change and spatial differentiation. The degradation of habitat quality mainly occurred in the coastal areas of Hangzhou and Yancheng cities, and the water conservation function showed large-scale degradation in the Huangshan and Quzhou areas. The water conservation ability of some areas in Lian-Yungang and Yancheng cities slightly improved, while the overall water conservation ability of the Jianghuai Plain did not change significantly, and some areas showed slight improvement. The soil conservation function showed an overall trend of improvement. However, no other scholars have studied the sustainable change trends of the four types of ecosystems in the Yangtze River Delta region, so the results obtained in this paper cannot be compared as the use of the Hurst index to calculate sustainability is commonly used to explore changes in NDVI [33]. Can the Hurst index be applied to study the sustainability of ecosystem services? We will conduct further work in the future to obtain more stable conclusions.
5.2. Feedback Mechanisms between Human Activities and Ecosystems
The concept of ecosystem services is widely understood as the benefits that humans derive from the natural functions of a healthy ecosystem [38]. This misconception leads people to believe that ecosystem services are a one-way flow of benefits from ecosystems to humans. This understanding has gradually been corrected as people have discovered that human actions often contribute to the maintenance and enhancement of ecosystems [39,40,41].
As a rapidly urbanizing Yangtze River Delta urban agglomeration, human activities within the region were dominated by various construction activities in the early stages of development, and this rapid and disorderly urbanization process caused serious conflicts between urban construction and ecological protection in space, which gradually transformed into obstacles to normal human activities [42]. Currently, scholars have conducted in-depth research on the spatial response relationship between human activities and ecosystem services, but the focus has mostly been on the impact of human activities on ecosystem services at the global scale, with less attention paid to the interaction of human activities with different ecosystem service functions at different scales and in different regions. The carbon emissions, land use changes, lifestyle changes, and policy changes reflected by human activities will cause changes in the services provided by the ecosystem. An accurate understanding of the mutual feedback mechanism between human activities and the ecosystem is conducive to better promoting regional high-quality development [43]. Over the past 40 years, the biodiversity of the study area has significantly decreased, while other ecosystem services (water conservation, NPP, and soil conservation) are in a state of rising frequency. However, the loss of biodiversity can cause instability in the overall ecosystem services. Therefore, the Hurst model results indicate that the ecosystem services in most areas of the study area may still experience degradation in the future.
5.3. Insufficient Research
This study focuses on exploring the spatial patterns and trends of four types of ecosystem services in the Yangtze River Delta urban agglomeration, with a focus on identifying key areas of change patterns. The aim is to provide guidance for relevant departments in developing ecological restoration plans, diagnosing ecological restoration spaces in land use planning, and establishing ecological control lines. Due to limitations in data acquisition, some evaluation indicators may have been omitted, and the reliability of the data is based on previous research. In future research, to meet actual needs, further scientific validation of long-term data acquisition and the inclusion of ecosystem service evaluation indicators based on local characteristics will be required.
Regression analysis and gradient analysis were used to preliminarily study the terrain gradient effects of ecosystem services in the Yangtze River Delta region. This has some significance in reflecting spatial differences in ecosystem services, but it should be noted that this effect is the result of the combined action of natural geographic elements and human activities. Due to limitations in the research data, the impact mechanism has not been explored in depth. Therefore, it is necessary to quantitatively analyze the effects of natural and socioeconomic factors on the terrain gradient effects of ecosystem services and reveal their mechanisms and degree of influence based on the collection of additional socioeconomic data.
6. Conclusions
This study conducted a quantitative analysis of land use changes, spatial patterns, trends, and sustainability of ecosystem services in the Yangtze River Delta urban agglomeration from 1980 to 2020 using Theil–Sen median trend analysis, Mann–Kendall test, Hurst index, and other methods. The main conclusions are as follows:
- (1)
- The four types of ecosystem services in the Yangtze River Delta urban agglomeration exhibit a spatial pattern of high in the southwest mountainous area and low in the northeast plain at the horizontal spatial level.
- (2)
- The most dramatic conversion of land in the Yangtze River Delta urban agglomeration was between agriculture and constructed; the main areas where the change occurred were around large cities such as Shanghai, Suzhou, Nanjing, Hefei, Hangzhou, and Ningbo.
- (3)
- The four types of ecosystem services in the Yangtze River Delta urban agglomeration showed different trends in change and spatial differentiation. The soil conservation function in the Yangtze River Delta region is mainly characterized by anti-sustainability, while habitat quality, water conservation, and NPP are mainly characterized by sustainability.
Supplementary Materials
The following supporting information can be downloaded at: https://www.mdpi.com/article/10.3390/land12040929/s1, Table S1: The weight and maximum influence distance of threat sources; Table S2: Sensitivity of each land use type to threat factors.
Author Contributions
Conceptualization, Y.W. and X.G.; methodology, H.Y.; software, H.Y.; validation, H.Y. and X.G.; formal analysis, Y.W.; investigation, X.G.; resources, Y.W.; data curation, Y.W.; writing—original draft preparation, Y.W.; writing—review and editing, X.G.; visualization, H.Y.; supervision, H.Y.; project administration, Y.W. and X.G.; funding acquisition, Y.W. and X.G. All authors have read and agreed to the published version of the manuscript.
Funding
This research was supported by the Key Project of Provincial Humanities and Social Sciences Research in Anhui Universities (Grant Number: SK2020A0257) and the National Natural Science Foundation of China (Grant Number: 42071286).
Data Availability Statement
Not applicable.
Conflicts of Interest
The authors declare no conflict of interest.
Appendix A
Figure A1.
Changes in land use quantity of the Yangtze River Delta urban agglomeration from 1980 to 2020 (Agr, agriculture; For, forests; Gra, grass; War, Water; Con, Constructed; Bar, bare).
Figure A1.
Changes in land use quantity of the Yangtze River Delta urban agglomeration from 1980 to 2020 (Agr, agriculture; For, forests; Gra, grass; War, Water; Con, Constructed; Bar, bare).


Figure A2.
Spatial distribution of topographic potential index in the Yangtze River Delta.

References
- Carpenter, S.R.; Defries, R.; Dietz, T.; Mooney, H.A.; Polasky, S.; Reid, W.V.; Scholes, R.J. Millenium Ecosystem Assessment: Research Needs. Science 2006, 314, 257–258. [Google Scholar] [CrossRef] [PubMed]
- Carpenter, S.R.; Mooney, H.A.; Agard, J.; Capistrano, D.; DeFries, R.S.; Diaz, S.; Dietz, T.; Duraiappah, A.K.; Oteng-Yeboah, A.; Pereira, H.M.; et al. Science for managing ecosystem services: Beyond the Millennium Ecosystem Assessment. Proc. Natl. Acad. Sci. USA 2009, 106, 1305–1312. [Google Scholar] [CrossRef] [PubMed]
- Yu, H.R.; Gu, X.C.; Liu, G.H.; Fan, X.; Zhao, Q.; Zhang, Q. Construction of Regional Ecological Security Patterns Based on Multi-Criteria Decision Making and Circuit Theory. Remote Sens. 2022, 14, 22. [Google Scholar] [CrossRef]
- Peng, J.; Hu, X.X.; Qiu, S.J.; Hu, Y.N.; Meersmans, J.; Liu, Y.X. Multifunctional landscapes identification and associated development zoning in mountainous area. Sci. Total Environ. 2019, 660, 765–775. [Google Scholar] [CrossRef] [PubMed]
- Sturck, J.; Verburg, P.H. Multifunctionality at what scale? A landscape multifunctionality assessment for the European Union under conditions of land use change. Landsc. Ecol. 2017, 32, 481–500. [Google Scholar] [CrossRef]
- Fan, X.; Gu, X.C.; Yu, H.R.; Long, A.H.; Tiando, D.S.; Ou, S.Y.; Li, J.F.; Rong, Y.J.; Tang, G.L.; Zheng, Y.J.; et al. The Spatial and Temporal Evolution and Drivers of Habitat Quality in the Hung River Valley. Land 2021, 10, 20. [Google Scholar] [CrossRef]
- Haas, J.; Ban, Y.F. Urban growth and environmental impacts in Jing-Jin-Ji, the Yangtze, River Delta and the Pearl River Delta. Int. J. Appl. Earth Obs. Geoinf. 2014, 30, 42–55. [Google Scholar] [CrossRef]
- Sun, X.; Long, Z.; Jia, J. A multi-scale Maxent approach to model habitat suitability for the giant pandas in the Qionglai mountain, China. Glob. Ecol. Conserv. 2021, 30, e01766. [Google Scholar] [CrossRef]
- Sun, X.; Yang, P.; Tao, Y.; Bian, H.Y. Improving ecosystem services supply provides insights for sustainable landscape planning: A case study in Beijing, China. Sci. Total Environ. 2022, 802, 13. [Google Scholar] [CrossRef]
- Zuo, L.Y.; Gao, J.B.; Du, F.J. The pairwise interaction of environmental factors for ecosystem services relationships in karst ecological priority protection and key restoration areas. Ecol. Indic. 2021, 131, 13. [Google Scholar] [CrossRef]
- Li, W.J.; Wang, Y.; Xie, S.Y.; Sun, R.H.; Cheng, X. Impacts of landscape multifunctionality change on landscape ecological risk in a megacity, China: A case study of Beijing. Ecol. Indic. 2020, 117, 12. [Google Scholar] [CrossRef]
- Zhong, Z.; Fang, X.N.; Zhang, Y.; Shu, X.F.; Guo, D. Mapping Ecosystem Service Supply-Demand Bundles for an Integrated Analysis of Tradeoffs in an Urban Agglomeration of China. Land 2022, 11, 18. [Google Scholar] [CrossRef]
- Wang, C.D.; Li, W.Q.; Sun, M.X.; Wang, Y.T.; Wang, S.B. Exploring the formulation of ecological management policies by quantifying interregional primary ecosystem service flows in Yangtze River Delta region, China. J. Environ. Manage. 2021, 284, 11. [Google Scholar] [CrossRef]
- Du, H.Y.; Wang, D.D.; Wang, Y.Y.; Zhao, X.L.; Qin, F.; Jiang, H.; Cai, Y.L. Influences of land cover types, meteorological conditions, anthropogenic heat and urban area on surface urban heat island in the Yangtze River Delta Urban Agglomeration. Sci. Total Environ. 2016, 571, 461–470. [Google Scholar] [CrossRef] [PubMed]
- Dai, X.; Wang, L.; Yang, L.; Wang, S.; Li, Y.; Wang, L. Predicting the supply-demand of ecosystem services in the Yangtze River Middle Reaches Urban Agglomeration. Prog. Phys. Geogr. -Earth Environ. 2022, 46, 530–546. [Google Scholar] [CrossRef]
- Zhou, Z.C.; Wang, J. Evolution of landscape dynamics in the Yangtze River Delta from 2000 to 2020. J. Water Clim. Chang. 2022, 13, 1241–1256. [Google Scholar] [CrossRef]
- Chen, P. Monthly Net Primary Productivity of China’s Terrestrial Ecosystems North of 18° N, 1-kilometer Grid Data Set (1985–2015). J. Glob. Change Data 2019, 3, 34–41. [Google Scholar]
- FAO; IIASA; ISRIC; ISSCAS; JRC. Harmonized World Soil Database (HWSD), Version 1.1; 2012. Available online: https://pure.iiasa.ac.at/id/eprint/17595/ (accessed on 15 February 2023).
- Sharp, R.; Chaplin-Kramer, R.; Wood, S.; Guerry, A.; Douglass, J. InVEST User’s Guide; The Natural Capital Project: Stanford, CA, USA, 2018. [Google Scholar]
- Redhead, J.W.; Stratford, C.; Sharps, K.; Jones, L.; Ziv, G.; Clarke, D.; Oliver, T.H.; Bullock, J.M. Empirical validation of the InVEST water yield ecosystem service model at a national scale. Sci. Total Environ. 2016, 569, 1418–1426. [Google Scholar] [CrossRef]
- Armoskaite, A.; Aigars, J.; Andersone, I.; Hansen, H.S.; Schroder, L.; Strake, S. Assessing change in habitat composition, ecosystem functioning and service supply in Latvian protected stony reefs. J. Environ. Manag. 2021, 298, 12. [Google Scholar] [CrossRef]
- Peng, J.; Liu, Y.X.; Liu, Z.C.; Yang, Y. Mapping spatial non-stationarity of human-natural factors associated with agricultural landscape multifunctionality in Beijing-Tianjin-Hebei region, China. Agric. Ecosyst. Environ. 2017, 246, 221–233. [Google Scholar] [CrossRef]
- Cong, W.; Sun, X.; Guo, H.; Shan, R. Comparison of the SWAT and InVEST models to determine hydrological ecosystem service spatial patterns, priorities and trade-offs in a complex basin. Ecol. Indic. 2020, 112, 106089. [Google Scholar] [CrossRef]
- Jun, S.; Gao, Z.Q.; Cui, L.L. Net Primary Production and Its Change in Chinese Plantation; In Proceedings of the Conference on Remote Sensing and Modeling of Ecosystems for Sustainability III, San Diego, CA, USA, 14–16 August 2006.
- Liu, Z.H.; Wang, T.; Qu, Y.H.; Liu, H.M.; Wu, X.F.; Wen, Y. Prediction of High-Quality MODIS-NPP Product Data. Remote Sens. 2019, 11, 1458. [Google Scholar] [CrossRef]
- Peng, J.; Shen, H.; Wu, W.H.; Liu, Y.X.; Wang, Y.L. Net primary productivity (NPP) dynamics and associated urbanization driving forces in metropolitan areas: A case study in Beijing City, China. Landsc. Ecol. 2016, 31, 1077–1092. [Google Scholar] [CrossRef]
- Newson, R. Confidence intervals for rank statistics: Percentile slopes, differences, and ratios. Stata J. 2006, 6, 497–520. [Google Scholar] [CrossRef]
- Peng, H.; Wang, S.; Wang, X. Consistency and asymptotic distribution of the Theil-Sen estimator. J. Stat. Plan. Inference 2008, 138, 1836–1850. [Google Scholar] [CrossRef]
- Korneta, P.; Rostek, K. The Impact of the SARS-CoV-19 Pandemic on the Global Gross Domestic Product. Int. J. Environ. Res. Public Health 2021, 18, 5246. [Google Scholar] [CrossRef] [PubMed]
- Geng, W.; Li, Y.; Zhang, P.; Yang, D.; Jing, W.; Rong, T. Analyzing spatio-temporal changes and trade-offs/synergies among ecosystem services in the Yellow River Basin, China. Ecol. Indic. 2022, 138, 108825. [Google Scholar] [CrossRef]
- Guo, A.; Zhang, Y.; Zhong, F.; Jiang, D. Spatiotemporal Patterns of Ecosystem Service Value Changes and Their Coordination with Economic Development: A Case Study of the Yellow River Basin, China. Int. J. Environ. Res. Public Health 2020, 17, 8474. [Google Scholar] [CrossRef] [PubMed]
- Wei, P.; Chen, S.; Wu, M.; Jia, Y.; Xu, H.; Liu, D. Increased Ecosystem Carbon Storage between 2001 and 2019 in the Northeastern Margin of the Qinghai-Tibet Plateau. Remote Sens. 2021, 13, 3986. [Google Scholar] [CrossRef]
- Sanz, E.; Martin Sotoca, J.J.; Saa-Requejo, A.; Diaz-Ambrona, C.H.; Ruiz-Ramos, M.; Rodriguez, A.; Tarquis, A.M. Clustering Arid Rangelands Based on NDVI Annual Patterns and Their Persistence. Remote Sens. 2022, 14, 4949. [Google Scholar] [CrossRef]
- Galler, C.; von Haaren, C.; Albert, C. Optimizing environmental measures for landscape multifunctionality: Effectiveness, efficiency and recommendations for agri-environmental programs. J. Environ. Manag. 2015, 151, 243–257. [Google Scholar] [CrossRef]
- Lai, X.; Yu, H.; Liu, G.; Zhang, X.; Feng, Y.; Ji, Y.; Zhao, Q.; Jiang, J.; Gu, X. Construction and Analysis of Ecological Security Patterns in the Southern Anhui Region of China from a Circuit Theory Perspective. Remote Sens. 2023, 15, 1385. [Google Scholar] [CrossRef]
- Lin, C.; Xu, X. Spatiotemporal variations of gross ecosystem product and identification of important ecological protection spaces in the Yangtze River Delta. Resour. Sci. 2022, 44, 847–859. [Google Scholar] [CrossRef]
- Li, C.; Zhao, J.; Zhuang, Z.; Gu, S. The spatiotemporal evolution and influencing factors of ecosystem service trade-off intensity in the Yangtze River Delta urban agglomeration. J. Ecol. 2022, 42, 5708–5720. [Google Scholar]
- Enfors, E.I.; Gordon, L.J. Analysing resilience in dryland agro-ecosystems: A case study of the Makanya catchment in Tanzania over the past 50 years. Land Degrad. Dev. 2007, 18, 680–696. [Google Scholar] [CrossRef]
- Bennett, E.M.; Peterson, G.D.; Gordon, L.J. Understanding relationships among multiple ecosystem services. Ecol. Lett. 2009, 12, 1394–1404. [Google Scholar] [CrossRef]
- Sun, Y.; Li, J.; Liu, X.; Ren, Z.; Zhou, Z.; Duan, Y. Spatially Explicit Analysis of Trade-Offs and Synergies among Multiple Ecosystem Services in Shaanxi Valley Basins. Forests 2020, 11, 209. [Google Scholar] [CrossRef]
- Yang, G.; Ge, Y.; Xue, H.; Yang, W.; Shi, Y.; Peng, C.; Du, Y.; Fan, X.; Ren, Y.; Chang, J. Using ecosystem service bundles to detect trade-offs and synergies across urban-rural complexes. Landsc. Urban Plan. 2015, 136, 110–121. [Google Scholar] [CrossRef]
- Chen, W.; Zhao, H.; Li, J.; Zhu, L.; Wang, Z.; Zeng, J. Land use transitions and the associated impacts on ecosystem services in the Middle Reaches of the Yangtze River Economic Belt in China based on the geo-informatic Tupu method. Sci. Total Environ. 2020, 701, 134690. [Google Scholar] [CrossRef] [PubMed]
- Wang, Y.Z.; Ji, Y.W.; Yu, H.R.; Lai, X.Y. Measuring the Relationship between Physical Geographic Features and the Constraints on Ecosystem Services from Urbanization Development. Sustainability 2022, 14, 8149. [Google Scholar] [CrossRef]
Figure 1.
Land use and geomorphology of the study area.

Figure 2.
Research technical route.

Figure 3.
Sankey diagram map of land use transfer in the Yangtze River Delta.

Figure 4.
Spatial distribution of land use type change in the Yangtze River Delta.

Figure 5.
Distribution of ecosystem service patterns in the Yangtze River Delta from 1980 to 2020.

Figure 6.
Analysis of vertical gradient characteristics of ecosystem services of urban agglomeration in the Yangtze River Delta.
Figure 6.
Analysis of vertical gradient characteristics of ecosystem services of urban agglomeration in the Yangtze River Delta.

Figure 7.
Analysis of the change in types of ecosystem services in the Yangtze River Delta from 1980 to 2020.
Figure 7.
Analysis of the change in types of ecosystem services in the Yangtze River Delta from 1980 to 2020.

Figure 8.
Analysis of the change in types of ecosystem services in the Yangtze River Delta from 1980 to 2020.
Figure 8.
Analysis of the change in types of ecosystem services in the Yangtze River Delta from 1980 to 2020.

Figure 9.
Analysis of the sustainability trend of ecosystem services in the Yangtze River Delta urban agglomeration.
Figure 9.
Analysis of the sustainability trend of ecosystem services in the Yangtze River Delta urban agglomeration.


Table 1.
Data sources and descriptions.
| Data | Source | Spatial Resolution |
|---|---|---|
| DEM | Chinese Academy of Sciences Resource and Environmental Science Data Center | Grid (90 m) |
| Soil database data | Centre for Resource and Environmental Sciences, Chinese Academy of Sciences | Grid (1 km) |
| Resolution land use data | Center for Resource and Environmental Sciences, Chinese Academy of Sciences | Grid (30 m) |
| Meteorological observation data | China Regional High Spatiotemporal Resolution Surface Meteorological Element Driving Dataset | Grid (1 km) |
| MODIS_NPP dataset | the Global Change Science Research Data Publishing System | Grid (250 m) |
Table 2.
P value and C value of different land use types.
| Land Use Type | Agriculture | Forests | Grass | Open Water | Constructed | Bare |
|---|---|---|---|---|---|---|
| P | 0.29 | 0.7 | 0.5 | 0.2 | 0.16 | 0.27 |
| C | 0.27 | 0.01 | 0.06 | 0 | 0.2 | 0.35 |
Table 3.
Trends in the ecological system of the Yangtze River Delta urban agglomeration from 1980 to 2020.
Table 3.
Trends in the ecological system of the Yangtze River Delta urban agglomeration from 1980 to 2020.
| Type | Habitat Quality | NPP | Soil Conservation | Water Conservation |
|---|---|---|---|---|
| Serious degradation | 0.13% | 0.35% | 0.12% | 0.10% |
| Slight degradation | 0.67% | 14.61% | 0.00% | 5.78% |
| Stable | 81.00% | 45.19% | 91.85% | 93.38% |
| Slight improvement | 17.88% | 27.31% | 1.38% | 0.74 |
| Significant improvement | 1.20% | 12.54% | 6.65% | 0.00% |
Table 4.
Persistence of changes in the ecosystem of the Yangtze River Delta urban agglomeration from 1980 to 2020.
Table 4.
Persistence of changes in the ecosystem of the Yangtze River Delta urban agglomeration from 1980 to 2020.
| Change Trend | Constancy | Change Type | Habitat Quality (%) | Water Conservation (%) | Soil Conservation (%) | NPP (%) |
|---|---|---|---|---|---|---|
| <0 | <0.5 | Anti-persistent degradation | 2.26 | 4.25 | 67.93 | 0.55 |
| <0 | ≥0.5 | Continuous degradation | 79.31 | 25.05 | 22.90 | 33.58 |
| ≥0 | <0.5 | Counter continuous improvement | 0.69 | 7.54 | 4.20 | 3.31 |
| ≥0 | ≥0.5 | Continuous improvement | 17.74 | 63.16 | 4.97 | 62.56 |
Disclaimer/Publisher’s Note: The statements, opinions and data contained in all publications are solely those of the individual author(s) and contributor(s) and not of MDPI and/or the editor(s). MDPI and/or the editor(s) disclaim responsibility for any injury to people or property resulting from any ideas, methods, instructions or products referred to in the content. |
© 2023 by the authors. Licensee MDPI, Basel, Switzerland. This article is an open access article distributed under the terms and conditions of the Creative Commons Attribution (CC BY) license (https://creativecommons.org/licenses/by/4.0/).
Share and Cite
MDPI and ACS Style
Wang, Y.; Gu, X.; Yu, H. Spatiotemporal Variation in the Yangtze River Delta Urban Agglomeration from 1980 to 2020 and Future Trends in Ecosystem Services. Land 2023, 12, 929. https://doi.org/10.3390/land12040929
AMA Style
Wang Y, Gu X, Yu H. Spatiotemporal Variation in the Yangtze River Delta Urban Agglomeration from 1980 to 2020 and Future Trends in Ecosystem Services. Land. 2023; 12(4):929. https://doi.org/10.3390/land12040929
Chicago/Turabian StyleWang, Yongzheng, Xinchen Gu, and Haoran Yu. 2023. "Spatiotemporal Variation in the Yangtze River Delta Urban Agglomeration from 1980 to 2020 and Future Trends in Ecosystem Services" Land 12, no. 4: 929. https://doi.org/10.3390/land12040929
Note that from the first issue of 2016, this journal uses article numbers instead of page numbers. See further details here.