
Spatiotemporal Evolution and Influencing Factors of Social-Ecological System Vulnerability in the Guangdong–Hong Kong–Macau Greater Bay Area

1
Center of Marine Development, Macau University of Science and Technology, Macau 999078, China
2
Southern Marine Science and Engineering Guangdong Laboratory (Zhuhai), Zhuhai 519000, China
*
Author to whom correspondence should be addressed.
Land 2023, 12(4), 924; https://doi.org/10.3390/land12040924
Submission received: 9 February 2023
/
Revised: 10 April 2023
/
Accepted: 11 April 2023
/
Published: 20 April 2023
(This article belongs to the Special Issue Current and Future Trends of Socio-Economic Values in Terrestrial Ecosystem Services)
Abstract
:Catalyzed by global change and human activities, social and ecosystems are constantly under increasingly dynamic transformations. The Guangdong–Hong Kong–Macau Greater Bay Area (GBA), bordering the South China Sea and located in the Pearl River Delta Plain, is a typical region of complex SESs with rapid socioeconomic development but severe ecosystem degradation. Therefore, based on the relevant data of 11 GBA cities from 2010–2020, this paper constructs an indicator system for assessing land–sea SESs by extracting from three aspects: exposure, sensitivity, and adaptive capacity. Through the construction of a vulnerability assessment indicator system, via the explicit spatial vulnerability indicator calculation model, and vulnerability factor diagnostic model, this study comprehensively analyzes vulnerability levels, spatiotemporal evolution, and SES vulnerability factors. The study found that, since 2010, the SES vulnerability of the GBA has shown an overall trend of alleviation, and the overall geographical distribution of classified vulnerability levels is rather concentrated, with cities around the Pearl River Estuary relatively less vulnerable. The augmentation of per-capita fiscal expenditure, per-capita gross regional product, and decent air quality rate are the critical ingredients to remedy the vulnerability in the GBA.
1. Introduction
Entering the 20th century, the global industrial revolution has seen a boost-up. In 1981, geologist Timmermann (1981) introduced the term “vulnerability”, having since been widely used on multidisciplinary occasions such as disaster science, ecology, economics, and engineering [1,2,3]. A growing number of scholars have proposed vulnerability as a research priority and called attention to economic sustainability. Since the 1990s, propelled by international research programs such as IHDP, IPCC, and IGBP [4,5,6], vulnerability-related aspects of research have come to be a frontier and hotspot in several sciences, mainly focusing on the following aspects: (1) the content of vulnerability research has gradually been enlarged from vulnerability concept and theory construction [7] to single and coupled system vulnerability [8], such as hazard system [9], ecosystem [10], water environment system [11], social system [12], and economic system [13]. (2) The dimensions of vulnerability quantification have been extended from the qualitative analysis of influencing factors and mechanisms of systemic vulnerability [14] to the comprehensive assessment of systemic vulnerability based on indicator systems, deducing corresponding instructions and recommendations through quantitative calculation [15]. (3) The case areas on vulnerability mainly concentrate on impoverished mountainous areas that are physically geographically fragile [16], as well as rural [17], borderland [18], and arid desert areas [19], etc., with there being relatively few vulnerability studies for economically developed and coastal areas. (4) Various methods combining system vulnerability assessment and comparison have become mainstream now, such as SEE-BP neural network [13], data envelopment analysis [20], DEA cross-efficiency model [11], etc. The thinking and exploring of vulnerability issues from multidimensional perspectives play a better role in local social, environmental, and ecological sustainable development.
Under this new trend, vulnerability research focuses on case evaluation and theoretical discussion, and gradually evolves to the empirical stage. In the VSD (vulnerability scoping diagram) vulnerability assessment framework proposed, vulnerability is divided into three parts: exposure-sensitivity-adaptability, which has become the most widely applicable assessment framework at present [21]. The research focus of each part has been selected, mainly including vulnerability assessment; resilience assessment and improvement; adaptive cycle and governance; or self-combination and comprehensive research of the three parts according to the characteristics of the study area [22]. On the basis of on-the-spot investigations, scholars have constructed relevant index systems to construct an evaluation index framework and used different methods or models to quantitatively evaluate social-ecological systems. For example, the evaluation index system of Dunhuang’s social-ecological system resilience was constructed in subdimensions, and TOPSIS and BP neural network methods were used to explore the spatio-temporal evolution and disturbance factors of the social-ecological system’s resilience [23].
One of the world’s four major bay areas, the Guangdong–Hong Kong–Macau Greater Bay Area (GBA hereafter), with its unique geographic advantages, has traditionally been the frontline of China’s reform, opening-up, and economic development. However, the region’s burgeoning population, frequent social activities, vast economic volumes, and rapid social changes leave the social-ecological systems (SESs hereafter) in the GBA more prone to non-equilibrium status. Some scholars have established an evaluation index system for urban resilience and found that there are significant differences in urban ecological resilience due to factors such as local economy, finance, and urbanization. Other scholars use machine learning algorithms to conduct research and evaluation on urban ecological changes, and believe that the rapid expansion of cities in Wuhan is deformed, and more attention should be paid to the quality of urban development and environmental sustainability. It has been a key priority in the GBA to balance downscaled high-speed development with ecological sustainability. For more than 40 years of reform and opening-up, the Guangdong Province is at the forefront of economic development and reform, enjoying the exceptional advantage of proximity to Hong Kong and Macau. Rapidly developed into the country’s economically top province, the total economic output of 11 cities in the GBA in 2020 exceeded RMB 11 trillion, making it one of the country’s most dynamic regions nowadays. However, the region’s burgeoning population, frequent social activities, vast economic volumes, and rapid social changes leave the social-ecological systems (SESs hereafter) in the GBA more prone to non-equilibrium status. It has been a key priority in the GBA to balance downscaled high-speed development with ecological sustainability [13,24,25,26].
Until now, domestic and foreign studies on SES vulnerability mainly evolve around “tipping points” [27,28] on inland or areas under specific conditions, seldom extending the research range to a certain city cluster [29]. The extraction of SES vulnerability indicators, the construction of an assessment indicator system, and the calculation of indicator weights, influencing factors, and mechanisms are still shredded in the research stage. Based on the social ecological coupling perspective and the urban characteristics of the Gulf region, constructing a comprehensive system of social-ecological system vulnerability assessment indicators that conforms to the actual situation of local economic and social development, and making reasonable adaptive decisions based on the analysis results, can better help protect urban ecology, promote ecological, and economic integration, and maintain regional sustainable development. Therefore, the paper sheds light on 11 GBA cities, comprehensively considers the social and economic development of the Greater Bay Area over the years, extracts and constructs a comprehensive system of SES vulnerability assessment indicators consistent with the GBA with the help of VSD (Vulnerability Scoping Diagram) analysis framework to perform a quantitative calculation of vulnerability. The quantitative measurement of the SESs in the region from 2010 to 2020 reveals the spatial and temporal evolution of vulnerability and explores its influencing factors in order to provide a theoretical basis for the sustainable development of the GBA.
2. Materials and Methods
2.1. Study Area
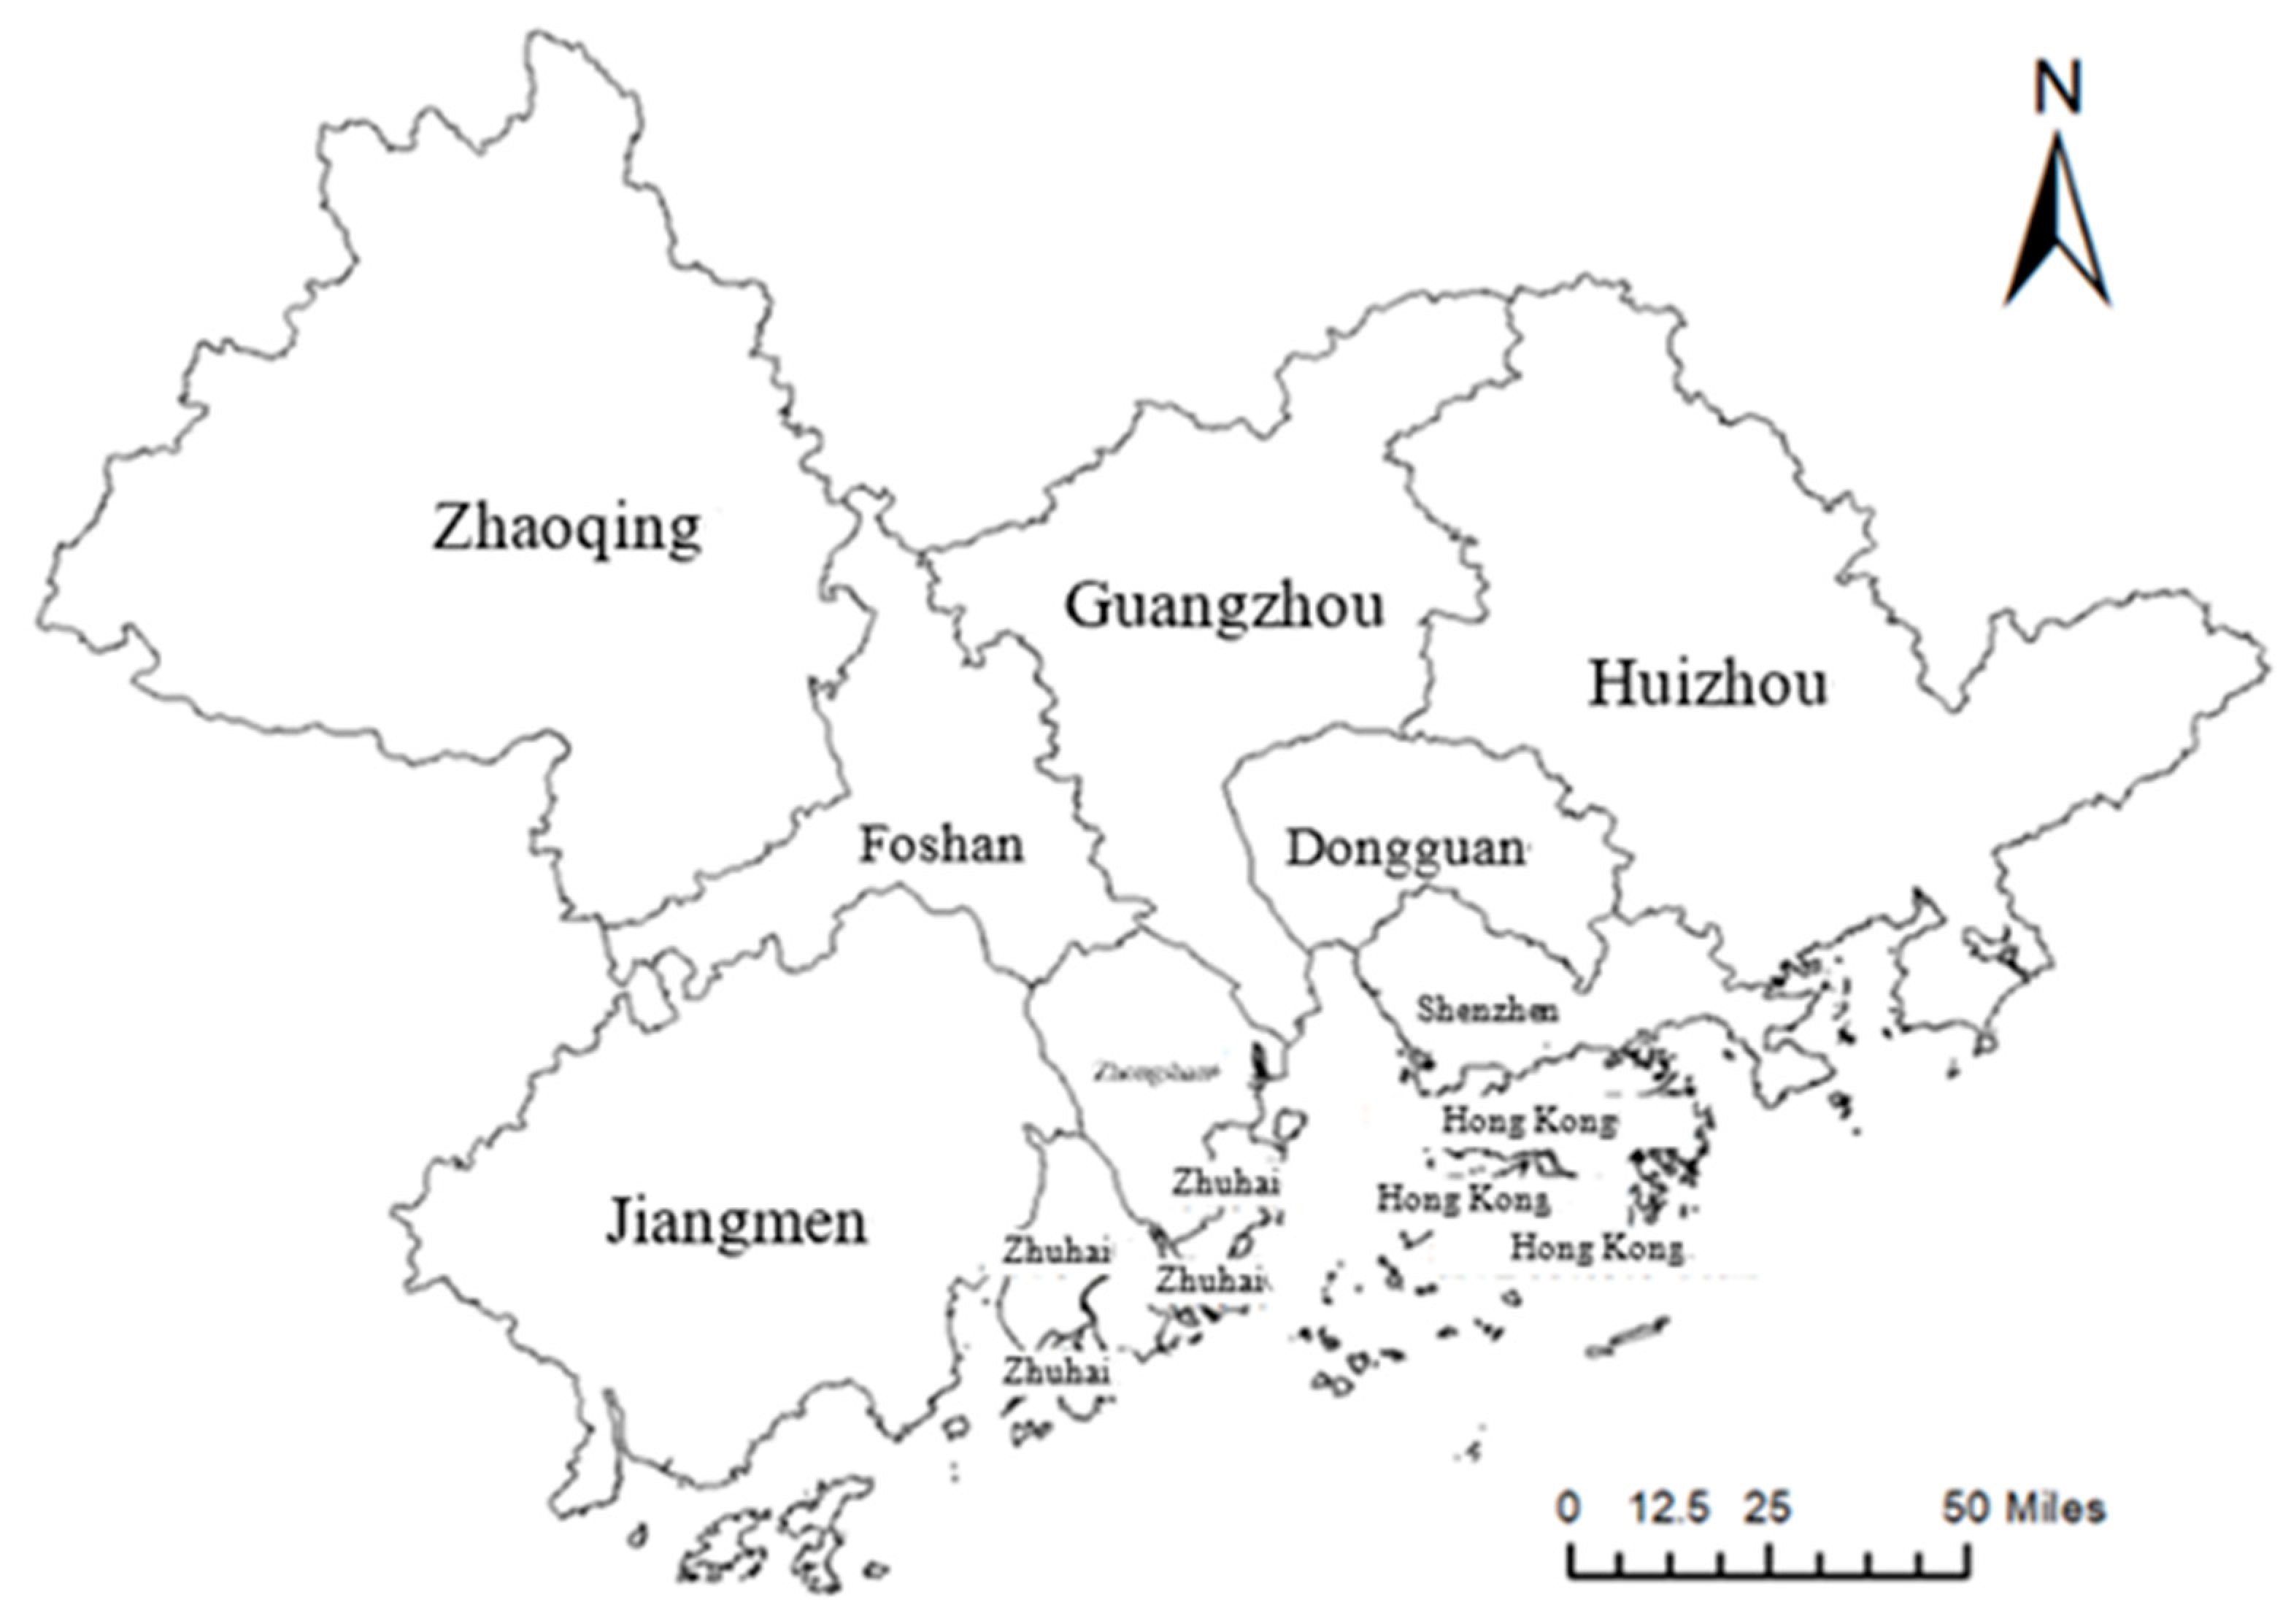
Sitting in the Pearl River Delta region of China, the GBA comprises Hong Kong, Macau Special Administrative Regions, and Guangdong Province cities of Guangzhou, Shenzhen, Zhuhai, Foshan, Huizhou, Dongguan, Zhongshan, Jiangmen, and Zhaoqing (Figure 1). In July 2017, the Framework Agreement on Deepening Guangdong–Hong Kong–Macau Cooperation in the Development of the Bay Area was signed in Hong Kong [30], preceding the Chinese government-issued Outline of the Development Plan for the Greater Bay Area, February 2019 [21]. It calls for the development of the GBA into a dynamic world-class city cluster, an international center of science and technology innovation, an important support for the construction of the “Belt and Road”, a demonstration area for in-depth Mainland–Hong Kong–Macau cooperation, and a high-quality one-hour living circle habitable, workable, and travelable. An overall population of 86 million, an entire economic output of RMB 11.4 trillion, and a total area of 54,900 km2 were attained by the GBA in 2021, strengthening its position as a prominent “blue economy” [31,32,33].
2.2. Methods and Data
2.2.1. Indicator System
Within the four main types of analytical frameworks currently used globally for SES research including policy, eco-centric, vulnerability, and integrative [29], the TVUL (Vulnerability Framework) framework proposed by Turner et al. (2003), an anthropocentric vulnerability framework, focuses more on the exposure, sensitivity, resilience, and behavioral orientation and response of vulnerable subjects in multiple ecosystems [34]. Polsky et al. (2007) further proposed the regional-scale multi-element, multi-risk turbulent Vulnerability Scoping Diagram (VSD) [35], an integrative framework prevalent in case studies of quantitative vulnerability assessment of various regions. The VSD framework adopts a stepwise hierarchical data organization defined by “target-dimension-factor-indicator”, able to effectively reflect the internal mechanisms of SES vulnerability and help realize the quantitative calculations of vulnerability. This paper is based on the VSD framework, the SES vulnerability indicators are inputted as the target layer, decomposing vulnerability into three dimensions of exposure, sensitivity, and adaptive capacity [23]. It aims to fully unroll the integrated process of SES coupling, coordination, and development in the GBA, revealing the sensitivity of exposed units to stress, the adaptive capacity to cope with it, and the adaptive regulation of the system under turbulent natural and socioeconomic potential pressures and risks. The corresponding results obtained through analysis can better help the GBA achieve social and ecological integration development. Thus, according to the definition of SES vulnerability, an indicator system fitting the characteristics of its hierarchy and development in the GBA is constructed in relation to regional characteristics of the area (Table 1).
Exposure, being a carrier and causal factor triggering ecological changes, covers climate, vegetation conditions, and socioeconomic activities of natural systems, for which excessive rainfall, increased frequency of acid rain, and typhoon impacts all contribute to increased exposure of the natural environment. Concerning human activities, the increase in population density and the number of tourists deepen the traces of human activities and amplify environmental pressure, with the growing land-use intensity proving human activities’ damage to land ecology. The gaining of regional vegetation coverage and the ratio of arable land will alleviate the exposure measurably and stabilize the SES.
Sensitivity is a trait about the propensity of exposed units to perceive external disturbances and stresses, originating from the states and responses exhibited by eco- and social systems coping with external turbulences and internal succession [35]. Being the leading edge of China’s reform and opening-up, the GBA boasts its domestically first-rate economic development, with industrial structure mainly concentrated in the secondary and tertiary sectors, accompanied by a clustered regional population. Hence in terms of economy, the paper considers growth rates of secondary and tertiary sectors, the Engel coefficient, and per-capita gross regional product as indicators for measuring the sensitivity of economic aspects. The social-ecological parts, on the other hand, take focus on demographic and ecological aspects, assigning natural population growth rate, urbanization rate, mortality rate, and air quality improvement rate as the social measures.
The adaptive capacity aspect refers to the adaptive strategies within the SES to regulate, reduce, prevent, or even expose to hazards. Total investment in fixed assets, per-capita disposable income of residents, per-capita fiscal expenditure, and total annual import and export manifest the living standards of residents, public service capacity, and changes in the economic environment, positively correlated with adaptive capacity. The comprehensive utilization rate of industrial solid waste, public transportation vehicles, number of hospital beds, and road density deliver a multi-perspective depiction of the social infrastructure construction, with the number of college students per 10,000 people suggesting the education level of the population, and sound infrastructure construction and education level contributing to the enhancement of the ability to cope with risks and improve adaptive capacity.
2.2.2. Measurements of SES Vulnerability
Treatment of Assessment Indicators
To cancel the influence of the scale of the indicator data as well as its own degree of variation and numerical magnitude, standardization was performed using Equations (1) and (2) [36].
where is standardized data, is the value of indicator in year , and are the maximum and minimum values of the -th indicator in all years, respectively.
Calculation of Indicator Weights
The weights are crucial factors in determining the results of SES vulnerability measurement. The paper employs SPSS19.0 software to conduct a principal component analysis with a KMO statistic of 0.781, corresponding to p-value of 0.000, with the commonality of all variables higher than 50%. Four common factors were extracted, with eigenvalues of 9.297, 3.101, 1.499, and 1.132, respectively, and the cumulative variance contribution 88.41%. To optimize the common factors’ interpretability, coefficients in the factor loading matrix were differentiated between 0–1, with the initial factor loading model processed by Varimax rotation, yielding weights of each indicator via calculations of Equation (3) and normalization (Table 1)
where is the factor loading score of each principal component post rotation; is the eigenvalue; is the variance contribution of each principal component; is the cumulative contribution of eigenvalues higher than one. Since the weights of each indicator should be determined separately according to the three dimensions of vulnerability, the normalization process needs be performed to obtain the corresponding .
For exposure, due to domestically phenomenal human activities, high urbanization rate, and chart-topping economic development of the GBA, natural systems’ weights slightly outnumber their human activities counterparts, with the frequency of acid rain (0.123) exerting the greatest impact on exposure and typhoons (0.089) exerting the smallest, and with population density posing the largest weight (0.147), and the ratio of cultivated land the least (0.086) among human activities. In terms of sensitivity, the higher weights are attributed to GDP per capita (0.171) and urbanization rate (0.140), while mortality rate (0.072) is less influential. In terms of adaptive capacity, per-capita fiscal expenditure (0.141), total investment in fixed assets (0.125), road density (0.118) and comprehensive utilization rate of industrial solid waste (0.114) are the key points in reducing exposure risk stress and sensitivity in the GBA.
2.2.3. Quantitative Vulnerability Model Construction
Currently, the quantitative calculation of vulnerability mainly involves a function model, principal component analysis, artificial neural network, spatial multi-criteria assessment, and Graphic Overlay Method [37]. To deliver an accurate calculation of the vulnerability of the research object, the paper combines natural and social characteristics of the GBA, based on causal links and logical relationships among exposure-sensitivity-adaptability in the VSD framework. With references to empirical studies such as Chen et al. (2016) and Wang et al. (2021) [37,38], the explicit spatial vulnerability indicator calculation model of Frazier et al. (2014) (Equation (4)) is specified for quantitative measurement of vulnerability in the GBA [31,39,40].
where is vulnerability, is exposure, is sensitivity, and is adaptive capacity.
2.2.4. Classification of City Vulnerability Levels
Due to the lack of a unified standard for the classification of SES vulnerability in the GBA, considering the relevant studies of urban vulnerability [41] and ecological vulnerability [36], taking into account the specific characteristics of the GBA, the vulnerability degree of cities is classified into five levels, namely, for low vulnerability, for relatively low vulnerability, for moderate vulnerability, for relatively high vulnerability, and for high vulnerability.
2.2.5. Diagnostic Model of Vulnerability-Causing Factors
To further identify the main factors affecting SES vulnerability of the GBA and to guarantee the SESs’ coordinated and sustainable development, in this paper, we introduce the obstacle degree model for a vulnerability factor diagnosis comprising factor contribution degree, indicator deviation degree, and obstacle degree of 26 secondary factors in Table 1. Among them, factor contribution degree is the degree of a single factor’s influence on the total target, i.e., its weight on the total target; the indicator deviation degree indicates the gap between a single indicator and the socioeconomic development target, which is the difference between the standardized value of a single indicator and 100%; and the obstacle degree indicates the impact value of a single indicator on the sustainable development of the SES, serving as the purpose and result of the system vulnerability diagnosis. The obstacle degree is calculated by the following formula.
where is the single indicator’s obstacle degree, is the degree of deviation from the indicator, is the degree of factor contribution, is the weight of the -th categorized indicator, and is the weight of the -th single indicator on the -th categorized indicator.
2.2.6. Data Sources
The data of Guangdong Province cities mainly come from China City Statistical Yearbooks, China Regional Economic Statistical Yearbooks, Guangdong Statistical Yearbooks, Guangdong Rural Statistical Yearbooks and each city’s Annual Statistical Yearbooks, Annual Meteorological Bulletins, Ecological Environment Bulletins, National Economic and Social Development Statistical Bulletins, etc. The relevant data for Hong Kong and Macau are primarily from the International Statistical Yearbooks, the official website of the National Bureau of Statistics, the official website of Hong Kong Census and Statistics Department, and the official website of the Statistics and Census Service of Macau. Since the data of Hong Kong and Macau employ unique units of measurement than those of mainland China, their currencies (HKD and MOP) are therefore uniformly converted into RMB for calculation. Meanwhile, due to the limitation of certain data availability, individual missing indicators of specific cities are filled in by interpolation method.
3. Results
3.1. SES Vulnerability Analysis of the GBA
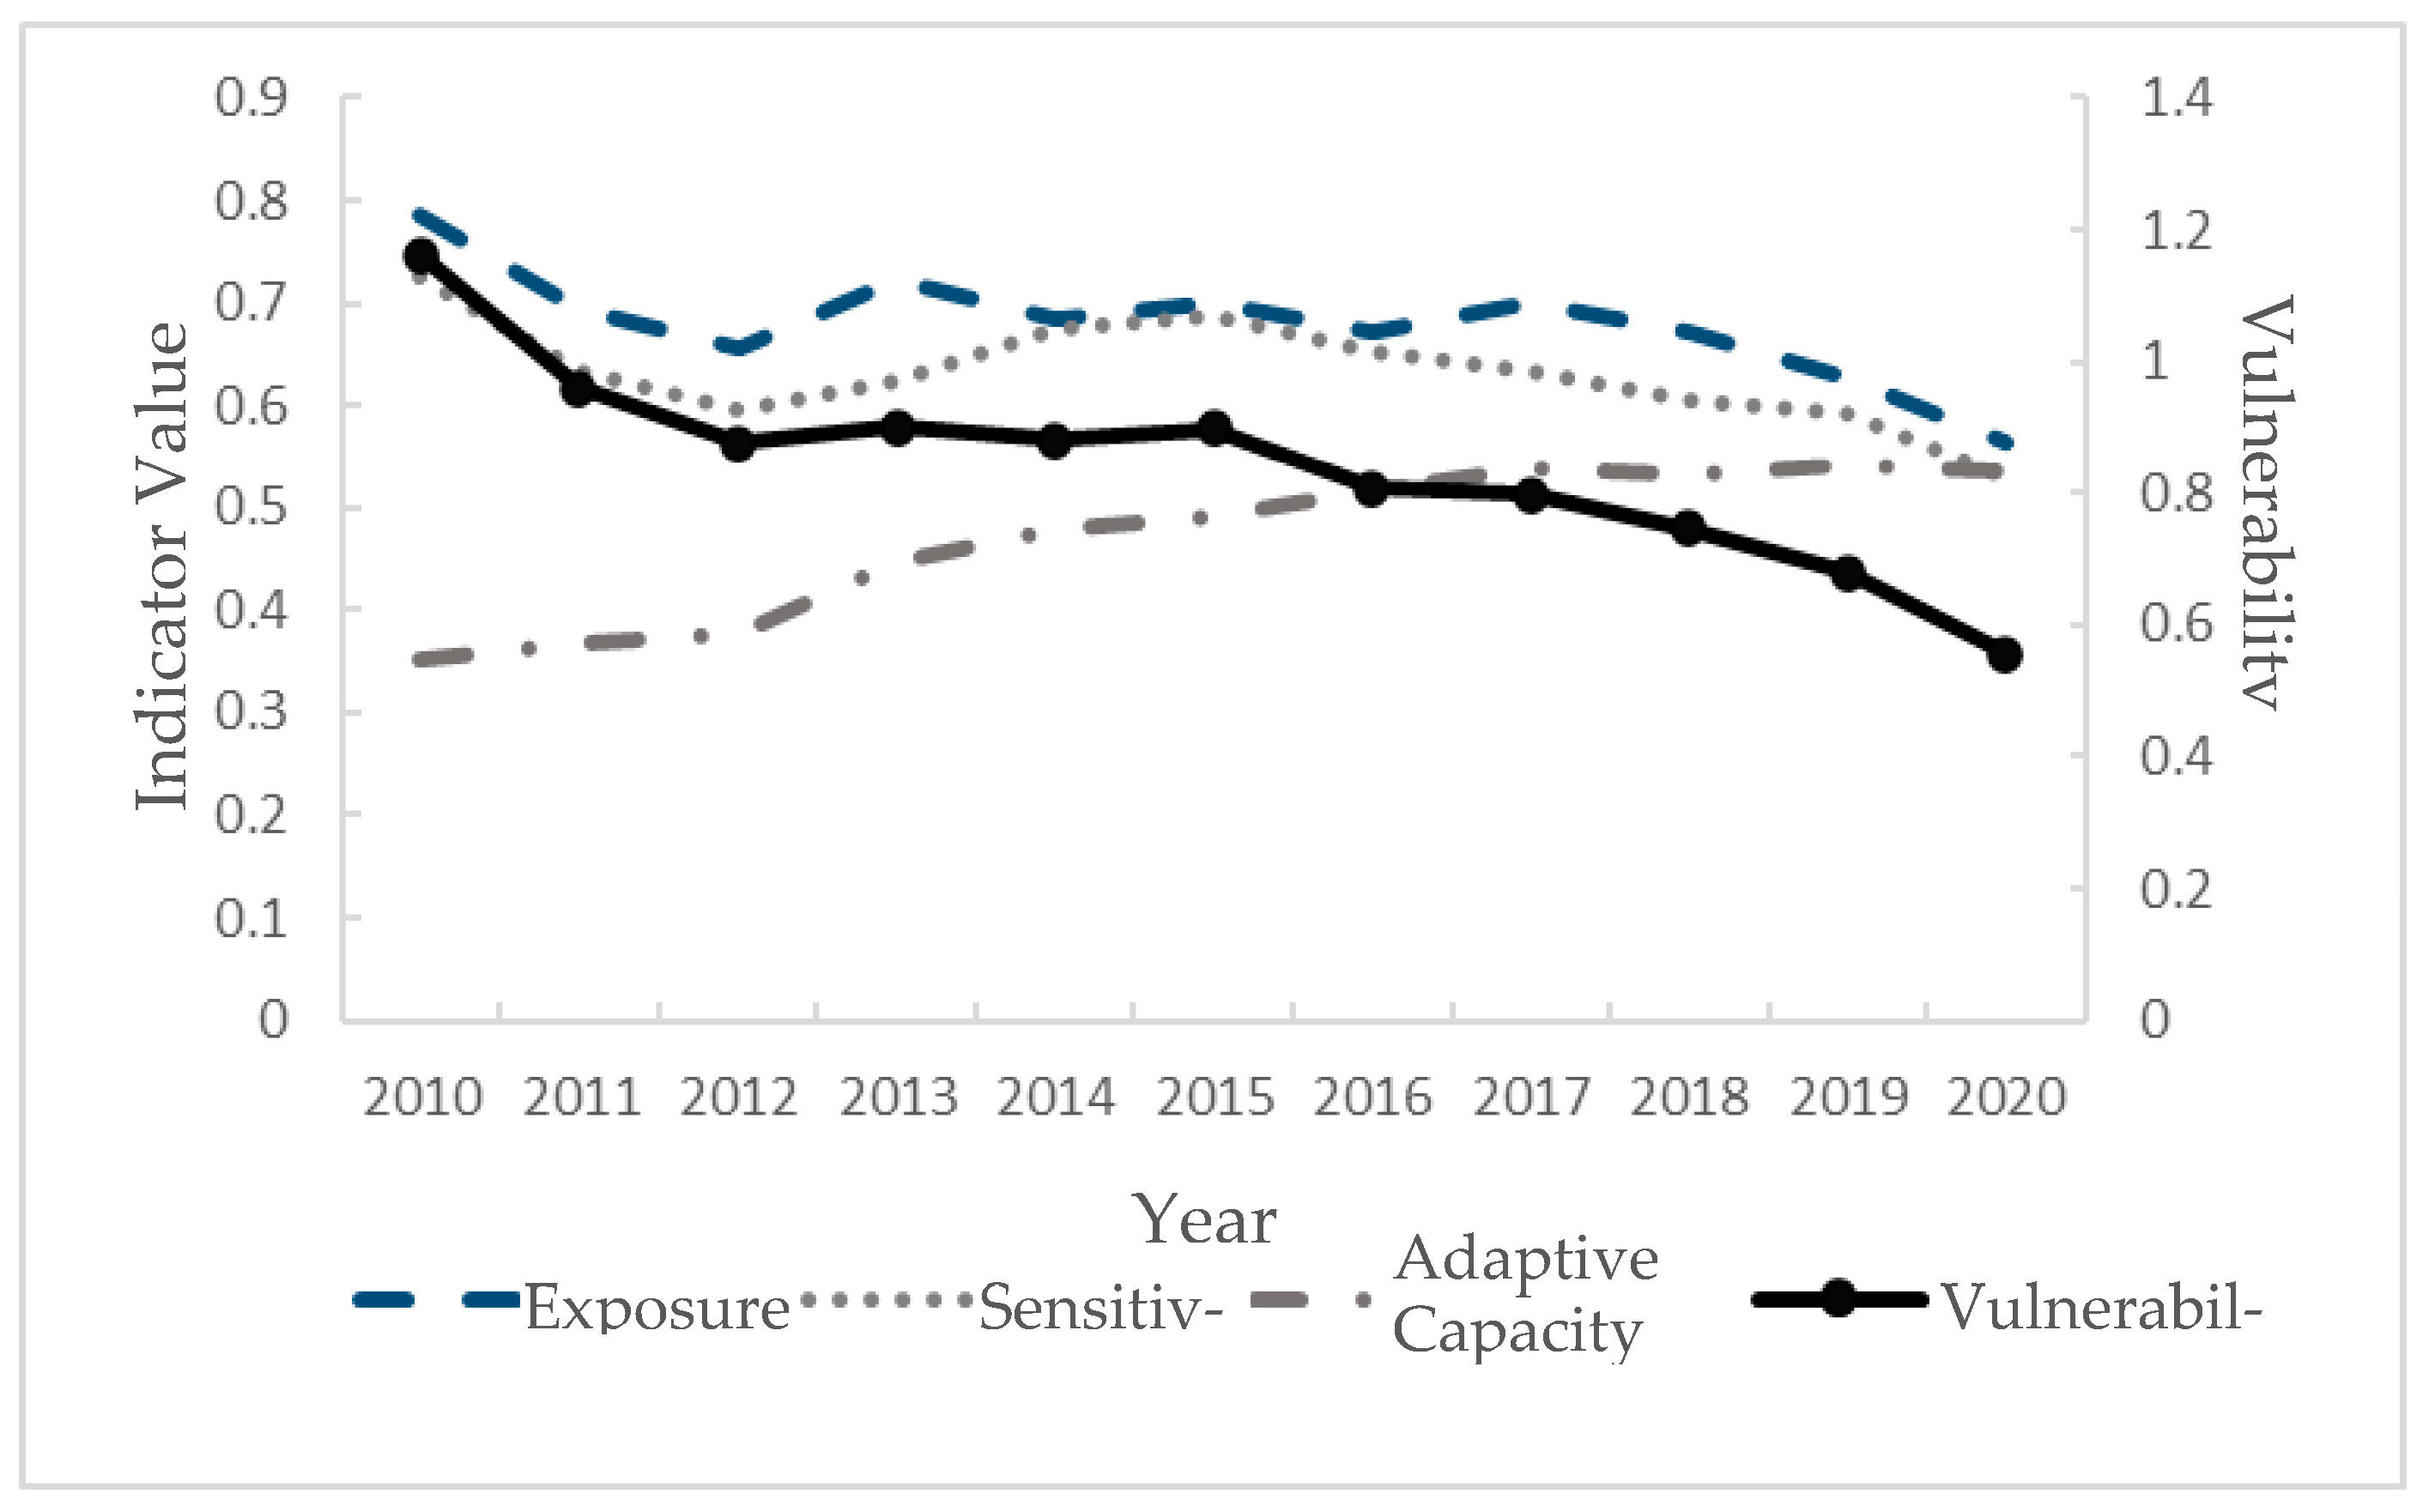
Under the VSD framework and via the vulnerability indicator calculation model, the SES vulnerability results of the GBA are revealed as follows (Figure 2): (1) in terms of exposure, the GBA features subtropical monsoon climate with high temperature, large precipitation, and frequent summer typhoons. Owing to its frontline location in the reform and opening-up, it exhibits an obvious economic growth rate, a dense population, high urbanization, high land use intensity, and diminishing ratio of arable land. As a result, with the increasingly rapid population movement and climate change, the exposure indicator of the GBA always ranges between 0.6–0.8 in a gradual decreasing trend. Among them, in 2010, 2013, and 2017, the SES exposure indicator displayed a small increase due to the influence of mega rainfalls, typhoons, population movement, and the change in environmental assessment regulations. In 2020, influenced by the COVID-19 pandemic, the number of tourists declined sharply [42], with most cities’ pm2.5 indicators dropping to historical lows [43], and the exposure indicator decreasing significantly compared with 2019.
(2) In terms of sensitivity, the GBA, one of the top economic powerhouses in China, has gradually transformed into an important East Asian industrial circulation pivot since the reform and opening up along with the process of globalization, deepening the degree of inter-city correlation and integration ever since. However, the rapid growth of secondary and tertiary sectors and the upsurging urban population have kept the sensitivity of the GBA at high stake. In 2013 and 2015, because of the accelerated economic development of some cities, the growth rate of secondary and tertiary sectors increased significantly that year, resulting in a slight upward trend of sensitivity compared with one year before. Yet after 2015, as the growth rate of secondary and tertiary sectors in most cities declined and the natural population growth rate downshifted, the overall sensitivity indicator of the GBA gradually displayed a continuous downward trend.
(3) In terms of adaptive capacity, since 2010, Guangdong, Hong Kong, and Macau governments have ratcheted up the total investment in fixed assets and fiscal expenditure [44], with per-capita disposable income of residents elevated, comprehensive utilization rate of industrial solid waste improved, road density enhanced, and the SES adaptive capacity of the GBA raised yearly. However, with the trade friction between China and the United States [45], the declining number of hospital beds per 10,000 people, and the emergence of the coronavirus pandemic, the growth rate of the GBA adaptive capacity indicator has tended to slack off in recent years.
(4) For SES vulnerability of the GBA as a whole, with the slow decline of exposure and sensitivity indicators, and the progressive improvement of system adaptive capacity, its overall system vulnerability indicator tends to go down. Although the overall GBA vulnerability was maintained at around 0.9 during 2012–2015 due to small fluctuations in systematic exposure and sensitivity indicators, by 2020, it dropped to its decade low at 0.556.
3.2. Spatiotemporal Evolution and Characteristics of SES Vulnerability
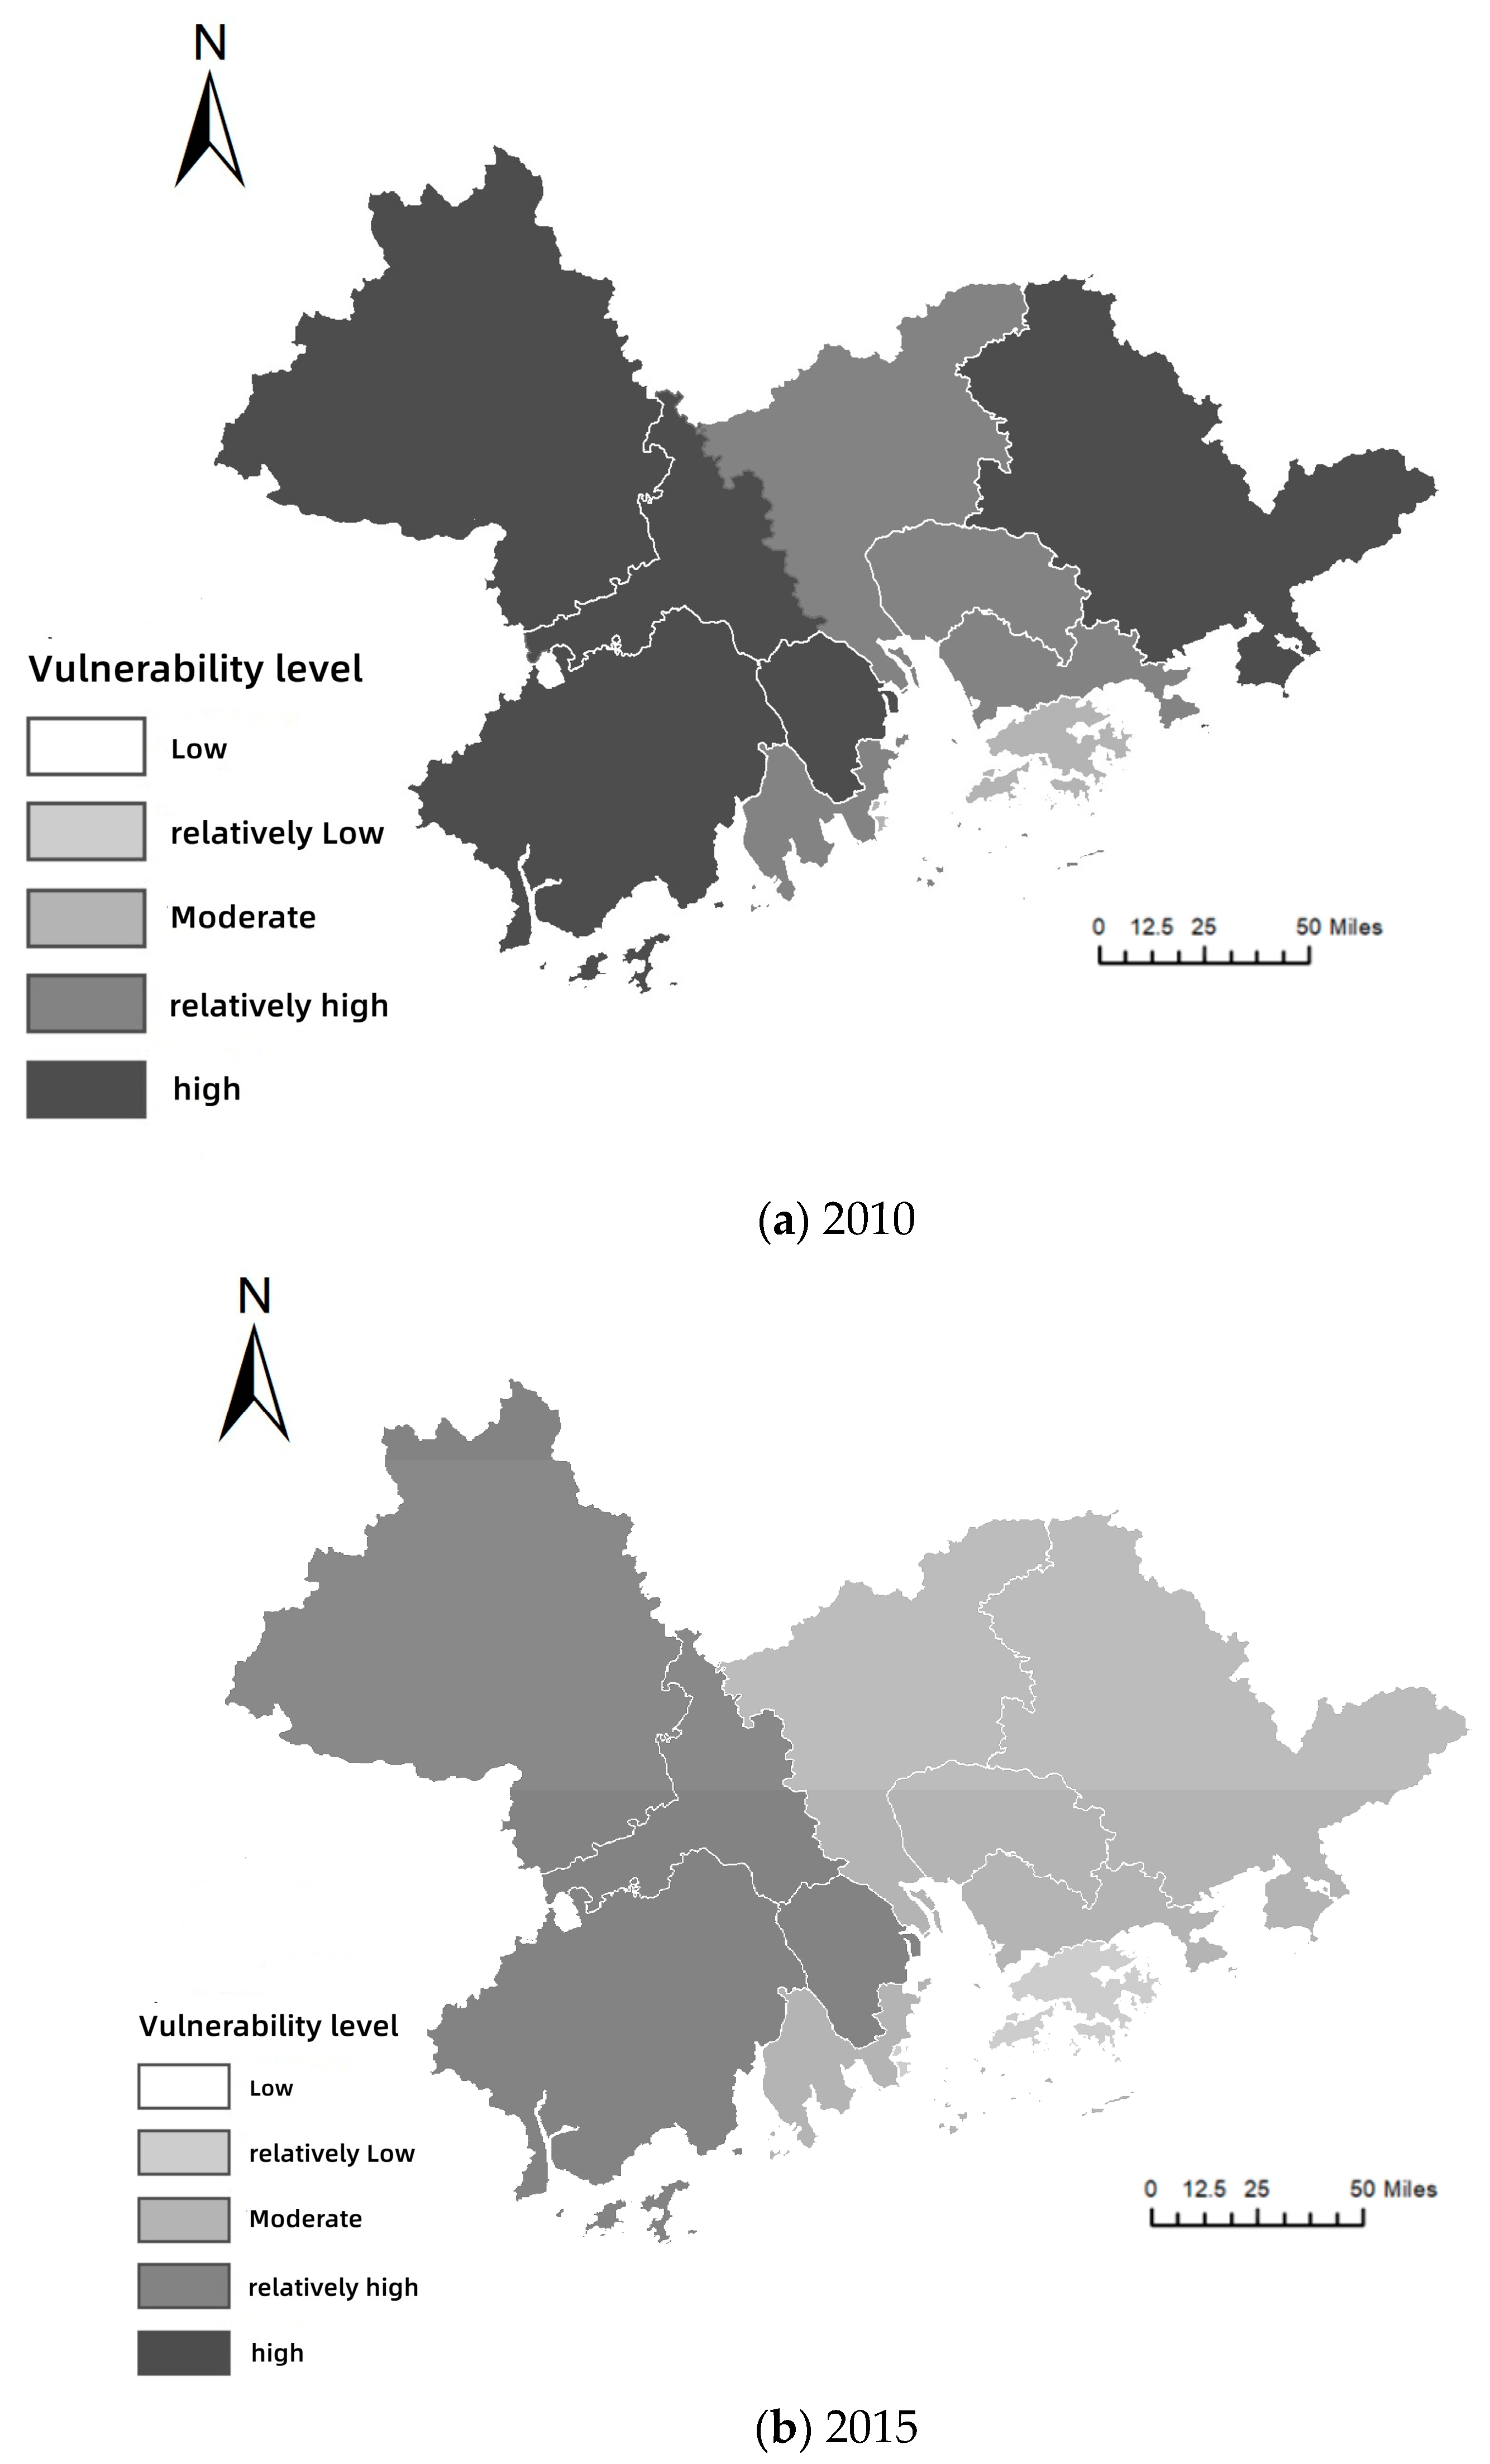
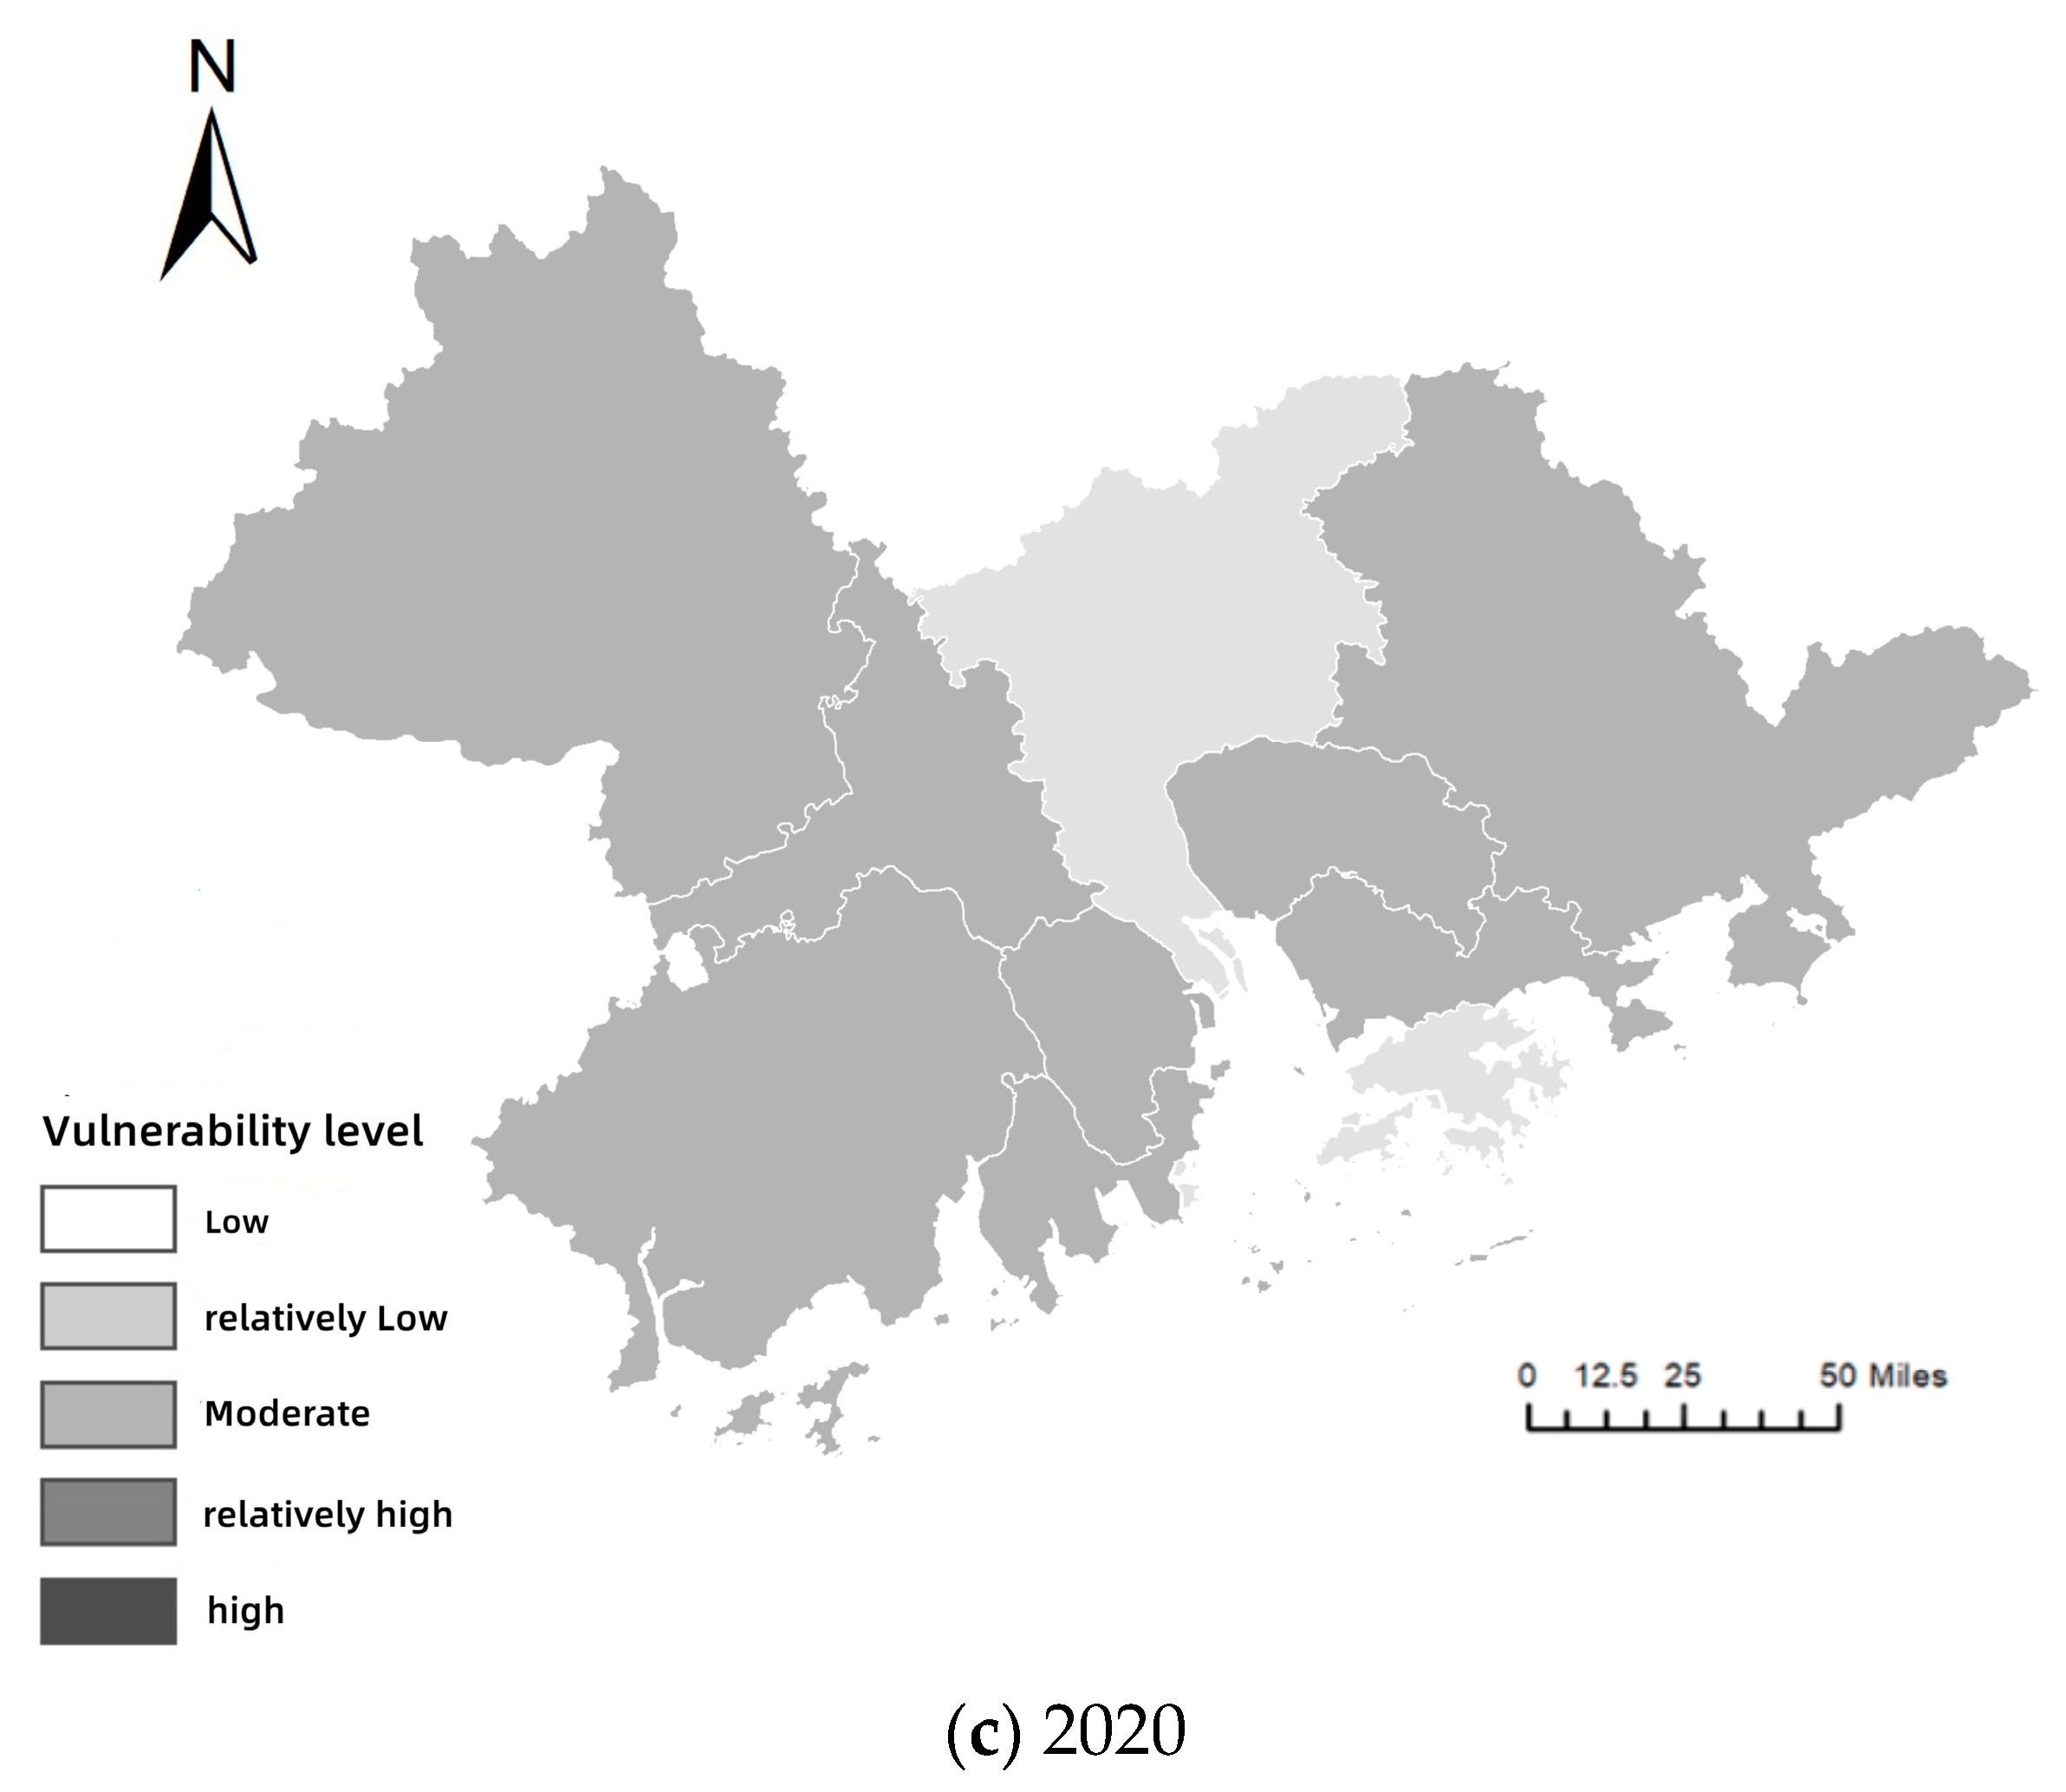
By spatially visualizing the integrative vulnerability indicators of 11 GBA cities in 2010, 2015, and 2020, spatial differences in vulnerability stand out among cities (Figure 3). The overall spatial distribution of vulnerability level types is rather condensed, unfurling the pattern where cities located near the Pearl River Estuary possess relatively lower vulnerability, while cities in the periphery of the Bay Area suffer higher vulnerability. With the passage of time, the vulnerability of 11 GBA cities unfolds a decreasing trend.
In 2010, the SESs in the GBA exhibited high or relatively high vulnerability, except for Hong Kong and Macau, which were in moderate vulnerability. The vulnerability degrees of Huizhou and Foshan were as high as 1.472 and 1.359 due to their speedy economic development, high acid rain frequency, and inferior air quality, while Guangzhou and Shenzhen were at the bottom of the list thanks to their strong adaptive capacity, despite highly developed economies and high exposure and sensitivity indicators.
In 2015, the SES vulnerability of cities faded to a certain extent compared with 2010 owing to the strengthening of ecological land management by local governments, when five cities, Guangzhou, Shenzhen, Zhuhai, Huizhou, and Dongguan, all retreated to moderate vulnerability, and four cities, Foshan, Zhongshan, Jiangmen, and Zhaoqing, also descended from high to relatively higher vulnerability. The Macau region, by virtue of quality ecological environment and high adaptive capacity, had the vulnerability indicator drop to 0.493, making it the first city in the Greater Bay Area with relatively low vulnerability.
In 2020, as a result of the coronavirus pandemic, the first-half economic development of the GBA slowed down, with population flow dwindled, urban ecological environment restored noticeably, and the frequency of acid rain, pm2.5 concentration, number of tourists, and growth rate of secondary and tertiary sectors in each city reduced to different degrees. The SES exposure and sensitivity were reduced to their 10-year lows. The vulnerability of each city in the GBA has been significantly relieved with the improvement of their adaptive capacity, whereas Guangzhou dropped to 0.481, becoming a relatively low-vulnerability city for the first time together with Hong Kong and Macau, while the remaining nine cities diminished to moderate vulnerability compared with 2015, exhibiting a clear city-wise trend of downbeat.
3.3. Vulnerability-Causing Factor Diagnosis of GBA SESs
To explore the major vulnerability-causing factors of the SESs in the GBA, the top two ranked indicators were censored from the results of the indicator obstacle degrees of exposure, sensitivity, and adaptive capacity in each year (Table 2). (1) On the ranking of exposure factors, it is inferable that population density is the most significant potential risk factor affecting the fluctuations of SES exposure. Whereas, with the escalation of rainfall and acid rain in certain years, annual rainfall and acid rain frequency became potential risk factors affecting the rise and fall of SES exposure in 2010, 2011, 2014, and 2016, though their influence was relatively weak. After 2015, tourist number gradually cemented itself as one of the main limiting factors to affect exposure, except that in 2020, influenced by the coronavirus pandemic, tourist numbers in 11 cities fell sharply, giving pm2.5 concentration and acid rain frequency both record lows, and making land use intensity one of the main risk factors in 2020 instead.
(2) On the ranking of sensitivity factors, the GBA is one of the top strongholds for domestic economic development, per-capita gross regional product is always its most significant source of SES risk. Due to booming urban populations of cities, the urbanization indicator also ascended yearly, with urbanization rate turning into an important factor affecting SES sensitivity; however, after 2016, with the GBA formally established, the population growth of each city took a gradual upturn, and governments gave more heed to the management and protection of the ecological environment, making natural population growth rate and decent air quality rate the second most effective sensitivity factors, too.
(3) For adaptive capacity factors’ rankings, per-capita fiscal expenditure is always the prime factor to improve the adaptive capacity of SESs in the GBA, while total investment in fixed assets and per-capita disposable income grew into additional key factors. Governments dispose more and more investment funds in social security construction, ensuring the adaptive capacity of GBA cities to be increasingly stronger.
3.4. Vulnerability-Causing Factors in GBA Cities at Different Points
It is apparent through Table 3 that in the GBA, with one of the country’s most striking economic vibrancies, per-capita fiscal expenditure and per-capita gross regional product have been the main obstacle factors for SES vulnerability of each city. At the same time, the siphon effect brought by the fleeting economic development has continuously pulled in the populations of cities around the Bay Area [46], with the growing population density leading to the increasingly severed vulnerability of Shenzhen, Hong Kong, Dongguan, Guangzhou, and other cities.
In 2010, most GBA cities were plagued by high-frequency acid rain E2, which also ranked among the top three obstacle factors for several cities. As the government and the private sector became more environmentally aware, the frequency of acid rain abated in each city, also cutting the impact on vulnerability and withdrawing from the top obstacles factors over time. On the other hand, acid rain frequency E2 in Zhuhai and Jiangmen still ranked in the top three obstacle factors in 2020, indicating that the acid rain situation in these two cities had not been alleviated and governance still needs reinforcement. Meanwhile, total fixed asset investment A1 also appeared as the obstacle factors of Guangzhou, Shenzhen, Foshan, and Huizhou, whose increment can better facilitate cities to reduce SES vulnerability. Finally, the Macau region depends heavily on tertiary sector development due to its unique gaming industry [47], whose growth rate plummeted to −55.7% as the impact of the coronavirus pandemic hit in 2020 [42], shrinking its number of tourists to 5.89 million and making the growth rate of tertiary sector S2 and the number of tourists E6 its main obstacle factors in 2020, in contrast to other cities.
4. Discussion
Serving as one of China’s top harbors of human activities and highly developed economies, vulnerability is one of the key attributes of SESs in the GBA. In theory, based on the SES theoretical framework and the three-dimensional “exposure-sensitivity-adaptive capacity” of the VSD framework, the paper constructs an SES vulnerability assessment framework for the GBA, providing an effective means to reveal the internal variances and identify the vulnerability-causing factors. In order to reduce the vulnerability of the GBA under complicated circumstances, the following aspects are worthy of consideration: first, strengthen environmental protection, reduce pm2.5 concentration and acid rain frequency, and improve decent air quality rate to help alleviate SES exposure and vulnerability; second, optimize social security environment, increase fixed asset investment and financial expenditure, implement the medical security system, and build up road construction under China’s new normal economy [48] to improve the adaptive capacity of the system.
Nevertheless, due to the complexity of the factors affecting system vulnerability and their interrelationships, as well as the narrow understanding of the concept of vulnerability, further exploration can be conducted in the future in terms of indicator extraction, theoretical cognition, and mechanism analysis. It is of great significance to build more scientific and reasonable SES vulnerability assessment indicators, focusing on the exploration of relationships between the components of vulnerability. The SES vulnerability of the GBA and the unbalanced development in the region hint at the fact that sustainable development of the Bay Area is a long-term and laborious undertaking. In the face of limited statistical data access, the paper merely measured the vulnerability evolution patterns and influencing factors of the GBA starting from 2010, covering a relatively short time span and expecting further research for a longer period of time.
5. Conclusions
Based on the triaxial “exposure-sensitivity-adaptation” pattern of the VSD framework, the paper specializes the GBA as the study area and comprehensively analyzes its vulnerability levels, spatiotemporal evolution, and SES vulnerability factors. Through the construction of a vulnerability assessment indicator system, via the explicit spatial vulnerability indicator calculation model, and vulnerability factor diagnostic model of Frazier et al. (2014) [39], the main conclusions are as follows.
(1) Since 2010, the SES vulnerability of the GBA has shown an overall trend of alleviation. The speeded-up economic development, population movement, and climate change have maintained the exposure and sensitivity indicators of the GBA between 0.6–0.8, in a downward trend. Governments ramped up the total investment in fixed assets and fiscal expenditure, meanwhile increasing per-capita disposable income of residents over time, enabling the improvement of the adaptive capacity of SESs in the GBA yearly. The overall vulnerability of the Bay Area declined to its lowest of 0.556 in a decade, due to the impact of the coronavirus pandemic in 2020.
(2) By spatially visualizing the integrative vulnerability indicators of 11 GBA cities in 2010, 2015, and 2020, we find the vulnerability indicators of all 11 cities to decrease visibly, with three cities, Guangzhou, Hong Kong, and Macau descending from relatively high and moderate vulnerability in 2010, to relatively low vulnerability in 2020, and the other eight cities receded to moderate vulnerability in 2020, too. Spatially speaking, the overall geographical distribution of classified vulnerability levels is rather concentrated, with cities around the Pearl River Estuary relatively less vulnerable.
(3) The potential risks and vulnerability-causing factors of SES vulnerability in the GBA mainly derive from population density , acid rain frequency , number of tourists , and urbanization rate . The augmentation of per-capita fiscal expenditure 3, per-capita gross regional product , and decent air quality rate are the critical ingredients to remedy the vulnerability in the GBA.
(4) In future research, we can consider the relevant content of the ocean, to build a more comprehensive social-ecological system in the Bay Area.
Author Contributions
J.L.: investigation, formal analysis, software, visualization, writing original draft; M.C.: conceptualization, formal analysis, funding, investigation, visualization, writing—review and editing. All authors have read and agreed to the published version of the manuscript.
Funding
This research was funded by National Natural Science Foundation of China-Macao Science and Technology Development Fund (NSFC-FDCT) Joint Project, No.: 4211101006|0011/2021/AFJ, Southern Marine Science and Engineering Guangdong Laboratory (Zhuhai) 2020 Project, No. SML2020SP002. This paper is also funded by Team Fund support of SML.
Institutional Review Board Statement
Not applicable.
Informed Consent Statement
Not applicable.
Data Availability Statement
All relevant data sets in this study are described in the manuscript.
Acknowledgments
We thank the marine conservation and integrated governance interdisciplinary team (MCIGI) for their support and help, and thank all the scholars for their help in the process of writing the paper. We also gratefully acknowledge anonymous reviewers for their valuable time to review papers published in this special issue.
Conflicts of Interest
The authors declare no conflict of interest.
References
- Füssel, H.-M. Vulnerability: A generally applicable conceptual framework for climate change research. Glob. Environ. Chang. 2007, 17, 155–167. [Google Scholar] [CrossRef]
- Füssel, H.-M.; Klein, R.J. Climate Change Vulnerability Assessments: An Evolution of Conceptual Thinking. Clim. Chang. 2006, 75, 301–329. [Google Scholar] [CrossRef]
- Taubenböck, H.; Post, J.; Roth, A.; Zosseder, K.; Strunz, G.; Dech, S. A conceptual vulnerability and risk framework as outline to identify capabilities of remote sensing. Nat. Hazards Earth Syst. Sci. 2008, 8, 409–420. [Google Scholar] [CrossRef]
- Harvey, N.; Nicholls, R. Global sea-level rise and coastal vulnerability. Sustain. Sci. 2008, 3, 5–7. [Google Scholar] [CrossRef]
- Seitzinger, S.P.; Gaffney, O.; Brasseur, G.; Broadgate, W.; Ciais, P.; Claussen, M.; Erisman, J.W.; Kiefer, T.; Lancelot, C.; Monks, P.S.; et al. International Geosphere-Biosphere Programme and Earth system science: Three decades of co-evolution. Anthropocene 2015, 12, 3–16. [Google Scholar] [CrossRef]
- Vallega, A. Urban waterfront facing integrated coastal management. Ocean Coast. Manag. 2001, 44, 379–410. [Google Scholar] [CrossRef]
- Timmermann, P. Vulnerability, resilience and the collapse of society. Environ. Monogr. 1981, 21, 164–173. [Google Scholar]
- Rajesh, S.; Jain, S.; Sharma, P. Inherent vulnerability assessment of rural households based on socio-economic indicators using categorical principal component analysis: A case study of Kimsar region, Uttarakhand. Ecol. Indic. 2018, 85, 93–104. [Google Scholar] [CrossRef]
- Adger, W.N.; Kelly, P.M. Social Vulnerability to Climate Change and the Architecture of Entitlements. Mitig. Adapt. Strat. Glob. Chang. 1999, 4, 253–266. [Google Scholar] [CrossRef]
- Berrouet, L.; Villegas-Palacio, C.; Botero-Fernandez, V. A social vulnerability index to changes in ecosystem services provision at local scale: A methodological approach. Environ. Sci. Policy 2019, 93, 158–171. [Google Scholar] [CrossRef]
- He, Y.; Wang, Y.; Li, Y.; Zhou, Y. Evaluation on regional vulnerability of flood disaster based on improved dea overlapping efficiency model. J. Saf. Sci. Technol. 2016, 12, 5. [Google Scholar]
- Abid, M.; Schilling, J.; Scheffran, J.; Zulfiqar, F. Climate change vulnerability, adaptation and risk perceptions at farm level in Punjab, Pakistan. Sci. Total Environ. 2016, 547, 447–460. [Google Scholar] [CrossRef]
- Ma, H.; Lian, Q.; Lun, Y.; Xi, J. Spatial differentiation of tourism economic system vulnerability based on BP neural network in different provinces of China. Resour. Sci. 2019, 41, 2248–2261. [Google Scholar] [CrossRef]
- Angeon, V.; Bates, S. Reviewing Composite Vulnerability and Resilience Indexes: A Sustainable Approach and Application. World Dev. 2015, 72, 140–162. [Google Scholar] [CrossRef]
- Jia, S.; Guangqiu, H.; Tong, H.; Lu, B. Modeling of cascade propagation of ecosystem vulnerability under the influence of mine dust. Oper. Res. Manag. Sci. 2021, 30, 183. [Google Scholar]
- Qun, W.; Mahua, Y.; Xingzhu, Y.; Zhaoli, Y. Spatio-temporal evolution and impact mechanism of socio-ecological system vulnerability in poor mountainous tourist distinations:taking dabie mountain area as example. Acta Geogr. Sin. 2019, 74, 17. [Google Scholar]
- Ren, G.; Liu, L.; Li, H.; Sun, Q.; Yin, G.; Wan, B. Geographical impact and ecological restoration modes of the spatial differenti-ation of rural social-ecosystem vulnerability: Evidence from qingpu district in shanghai. J. Resour. Ecol. 2021, 12, 849–868. [Google Scholar]
- Liu, M.; Wei, Q. Research on the spatial differentiation of tourism economic system vulnerability in china border areas. Resour. Dev. Mark. 2021, 37, 1108–1114. [Google Scholar]
- Bing, G.; Weihua, K.; Lin, J. Dynamic monitoring of ecological vulnerability in arid desert ecological region of northwest china and the quantitative analysis of its driving forces. J. Nat. Resour. 2018, 33, 13. [Google Scholar]
- Jing, H.; Jingwen, S. Vulnerability assessment and influencing factors analysis of urban flood disaster in yangtze river del-ta city cluster. J. Hohai Univ. 2020, 22, 9. [Google Scholar]
- Meulbroek, C.; Peck, J.; Zhang, J. Bayspeak: Narrating china’s greater bay area. J. Contemp. Asia 2022, 1–29. [Google Scholar] [CrossRef]
- Liao, H.; Shui, H.; Zhou, W.; Ren, C. Vulnerability of Social Ecosystem Based on CiteSpace. J. Sichuan. For. Sci. Technol. 2023, 1, 1–9. [Google Scholar]
- Liu, J.; Dietz, T.; Carpenter, S.R.; Alberti, M.; Folke, C.; Moran, E.; Pell, A.N.; Deadman, P.; Kratz, T.; Lubchenco, J.; et al. Complexity of coupled human and natural sys-tems. Science 2007, 317, 1513–1516. [Google Scholar] [CrossRef] [PubMed]
- Anderies, J.M.; Janssen, M.A.; Ostrom, E. A framework to analyze the robustness of social-ecological systems from an in-stitutional perspective. Ecol. Soc. 2004, 9, 18. [Google Scholar] [CrossRef]
- Noble, M.M.; Harasti, D.; Pittock, J.; Doran, B. Using GIS fuzzy-set modelling to integrate social-ecological data to support overall resilience in marine protected area spatial planning: A case study. Ocean Coast. Manag. 2021, 212, 105745. [Google Scholar] [CrossRef]
- Ostrom, E. A General Framework for Analyzing Sustainability of Social-Ecological Systems. Science 2009, 325, 419–422. [Google Scholar] [CrossRef] [PubMed]
- Lauerburg, R.; Diekmann, R.; Blanz, B.; Gee, K.; Held, H.; Kannen, A.; Möllmann, C.; Probst, W.; Rambo, H.; Cormier, R. So-cio-ecological vulnerability to tipping points: A review of empirical approaches and their use for marine management. Sci. Total Environ. 2020, 705, 135838. [Google Scholar] [CrossRef] [PubMed]
- Nagendra, H.; Ostrom, E. Applying the social-ecological system framework to the diagnosis of urban lake commons in Bangalore, India. Ecol. Soc. 2014, 19, 67. [Google Scholar] [CrossRef]
- Nguyen, T.T.; Bonetti, J.; Rogers, K.; Woodroffe, C.D. Indicator-based assessment of climate-change impacts on coasts: A review of concepts, methodological approaches and vulnerability indices. Ocean Coast. Manag. 2016, 123, 18–43. [Google Scholar] [CrossRef]
- Kim, S.K.; Bennett, M.M.; van Gevelt, T.; Joosse, P. Urban agglomeration worsens spatial disparities in climate adaptation. Sci. Rep. 2021, 11, 8446. [Google Scholar] [CrossRef]
- Chen, M.; Han, L. Driving factors, areas of cooperation and mechanisms for international cooperation in the blue economy of the 21st-century maritime silk road. Strateg. Study Chin. Acad. Eng. 2016, 18, 98–104. [Google Scholar]
- Han, L.; Li, J.; Chen, M. Correlation analysis of china’s marine service industry and suggestions. J. Ocean Univ. China 2010, 1, 28–31. [Google Scholar]
- Lu, W.; Caroline, C.; Maria, B.; Wang, T.; Chen, M.; Kelli, P.; Zhang, X.; Lisa, L.; Elva, E.; Diva, A. Successful blue economy exam-ples with an emphasis on international perspectives. Front. Mar. Sci. 2019, 6, 261. [Google Scholar]
- Turner, B.L., II; Kasperson, R.E.; Matson, P.A.; McCarthy, J.J.; Corell, R.W.; Christensen, L.; Eckley, N.; Kasperson, J.X.; Luers, A.; Martello, M.L.; et al. A framework for vulnerability analysis in sustainability science. Proc. Natl. Acad. Sci. USA 2003, 100, 8074–8079. [Google Scholar] [CrossRef] [PubMed]
- Polsky, C.; Neff, R.; Yarnal, B. Building comparable global change vulnerability assessments: The vulnerability scoping di-agram. Glob. Environ. Chang. 2007, 17, 472–485. [Google Scholar] [CrossRef]
- Yang, J.; Guan, Y.; Li, X.; Xi, J. Urban fringe area ecological vulnerability space-time evolution research: The case of ganjingzi district, dalian. Acta Ecol. Sin 2018, 38, 778–787. [Google Scholar]
- Wang, Y.; Yang, G.; Zhou, L. The vulnerability diagnosis of the pastoral area social-ecological system in northern qilian mountains:a case study on the sunan yugur autonomous county in gansu province. J. Glaciol. Geocryol. 2021, 43, 11. [Google Scholar]
- Chen, J.; Yang, X.; Yin, S.; Wu, K. The vulnerability evolution and simulation of the social-ecological systems in the semi-arid area based on the vsd framework. Acta Geogr. Sin. 2016, 71, 1172–1188. [Google Scholar]
- Frazier, T.G.; Thompson, C.M.; Dezzani, R.J. A framework for the development of the serv model: A spatially explicit resil-ience-vulnerability model. Appl. Geogr. 2014, 51, 158–172. [Google Scholar] [CrossRef]
- Wang, Y.; Zhou, L.; Wei, X. An evaluation index system of vulnerability of the desertification reversion process based on the socio-ecological systems theory. Acta Ecol. Sin. 2018, 38, 829–840. [Google Scholar]
- Fang, C.; Wang, Y.; Fang, J. A comprehensive assessment of urban vulnerability and its spatial differentiation in China. J. Geogr. Sci. 2015, 26, 153–170. [Google Scholar] [CrossRef]
- McCartney, G. The impact of the coronavirus outbreak on Macao. From tourism lockdown to tourism recovery. Curr. Issues Tour. 2020, 24, 2683–2692. [Google Scholar] [CrossRef]
- Conibear, L.; Reddington, C.L.; Silver, B.J.; Chen, Y.; Knote, C.; Arnold, S.R.; Spracklen, D.V. Statistical Emulation of Winter Ambient Fine Particulate Matter Concentrations From Emission Changes in China. Geohealth 2021, 5, e2021GH000391. [Google Scholar] [CrossRef]
- Zacharias, J.; Tang, Y. Restructuring and repositioning Shenzhen, China’s new mega city. Prog. Plan. 2010, 73, 209–249. [Google Scholar] [CrossRef]
- Lawrence, R.Z. Can the Trading System Survive US-China Trade Friction? China World Econ. 2018, 26, 62–82. [Google Scholar] [CrossRef]
- Abbas, Z.; Yang, G.; Zhong, Y.; Zhao, Y. Spatiotemporal Change Analysis and Future Scenario of LULC Using the CA-ANN Approach: A Case Study of the Greater Bay Area, China. Land 2021, 10, 584. [Google Scholar] [CrossRef]
- Simpson, T. LIVE Baccarat calculations: Macau machine gambling and the production of the post-socialist subject. J. Cult. Econ. 2019, 12, 521–538. [Google Scholar] [CrossRef]
- Yu, C.; Xuyang, S.; Qian, Z. Study on the Spatiotemporal Evolution and Influencing Factors of Urban Resilience in the Yellow River Basin. Environ. Res. Public Health 2021, 18, 10231. [Google Scholar]
Figure 1.
The Spatial Scope of the GBA.

Figure 2.
Overall Evolution of SES Vulnerability in the GBA, 2010–2020.

Figure 3.
Spatiotemporal Evolution of SES Vulnerability of Cities in the GBA in 2010, 2015, and 2020.
Figure 3.
Spatiotemporal Evolution of SES Vulnerability of Cities in the GBA in 2010, 2015, and 2020.


Table 1.
Assessment Indicator System of SES Vulnerability in the GBA.
| Target Layer | Dimension Layer | Element Layer | Indicator Layer | Relevance | Weights |
|---|---|---|---|---|---|
| SES Vulnerability Indicator | Exposure | Natural Systems | Annual Rainfall E1 | + | 0.105 |
| Acid Rain Frequency E2 | + | 0.123 | |||
| Number of Typhoon Impacts E3 | + | 0.089 | |||
| PM2.5 Concentration E4 | + | 0.121 | |||
| Vegetation Coverage E5 | − | 0.114 | |||
| Human Activities | Number of Travelers E6 | + | 0.112 | ||
| Population Density E7 | + | 0.147 | |||
| Land Use Intensity E8 | + | 0.103 | |||
| Ratio of Cultivated Land E9 | − | 0.086 | |||
| Sensitivity | Economic Aspects | Secondary Industry Growth Rate S1 | + | 0.134 | |
| Tertiary Sector Growth Rate S2 | + | 0.118 | |||
| Engel Coefficient S3 | + | 0.095 | |||
| Gross Regional Product Per Capita S4 | − | 0.171 | |||
| Social Aspects | Natural Population Growth Rate S5 | + | 0.129 | ||
| Urbanization Rate S6 | + | 0.140 | |||
| Mortality S7 | + | 0.072 | |||
| Excellent Air Quality Rate S8 | − | 0.141 | |||
| Adaptability | Economic Aspects | Total Investment in Fixed Assets A1 | + | 0.125 | |
| Per-Capita Disposable Income A2 | + | 0.103 | |||
| Per-Capita Financial Expenditure A3 | + | 0.141 | |||
| Total Annual Import and Export A4 | + | 0.086 | |||
| Social Aspects | Comprehensive Utilization Rate of Industrial Solid Waste A5 | + | 0.114 | ||
| Number of Public Transportation Vehicles Per 10,000 People A6 | + | 0.107 | |||
| Number of Hospital Beds Per 10,000 People A7 | + | 0.094 | |||
| Number of College Students Per 10,000 People A8 | + | 0.112 | |||
| Road Density A9 | + | 0.118 |
Table 2.
Main Obstacle Factors of SESs in the GBA, 2010–2020.
| Exposure Factors Ranking | Sensitivity Factors Ranking | Adaptive Capacity Factors Ranking | ||||
|---|---|---|---|---|---|---|
| Year | 1 | 2 | 1 | 2 | 1 | 2 |
| 2010 | ||||||
| (18.723) | (14.262) | (15.542) | (10.439) | (15.113) | (9.796) | |
| 2011 | ||||||
| (17.352) | (14.915) | (15.371) | (11.103) | (13.776) | (10.181) | |
| 2012 | ||||||
| (18.535) | (13.974) | (15.117) | (10.722) | (14.557) | (10.040) | |
| 2013 | ||||||
| (18.427 | (12.752 | (14.673) | (11.694) | (14.645) | (9.233) | |
| 2014 | ||||||
| (16.931) | (12.104) | (14.138) | (10.892) | (14.593) | (9.578) | |
| 2015 | ||||||
| (17.269) | (12.931) | (14.294) | (10.407) | (14.446) | (9.081) | |
| 2016 | ||||||
| (14.394) | (14.367) | (15.118) | (10.584) | (14.537) | (10.311) | |
| 2017 | ||||||
| (13.695) | (12.334) | (15.095) | (11.803) | (14.490) | (11.854) | |
| 2018 | ||||||
| (13.092) | (12.104) | (14.351) | (9.396) | (14.177) | (10.309) | |
| 2019 | ||||||
| (12.856) | (12.670) | (14.072) | (10.875) | (13.892) | (11.471) | |
| 2020 | ||||||
| (12.464) | (10.347) | (13.029) | (11.304) | (13.451) | (12.807) | |
Table 3.
Top Three Vulnerability Obstacle Factors of 11 GBA Cities in 2010, 2015, and 2020.
| City | Top 3 Obstacle Factors in 2010 | Top 3 Obstacle Factors in 2015 | Top 3 Obstacle Factor in 2020 | ||||||
|---|---|---|---|---|---|---|---|---|---|
| First Obstacle | Second Obstacle | Third Obstacle | First Obstacle | Second Obstacle | Third Obstacle | First Obstacle | Second Obstacle | Third Obstacle | |
| Guangzhou | A1 | S4 | E2 | A3 | S4 | E7 | A3 | S4 | E7 |
| Shenzhen | S4 | E2 | A2 | S4 | E7 | A1 | E7 | S4 | A1 |
| Zhuhai | S4 | A3 | S6 | A3 | S4 | S6 | S4 | E2 | S6 |
| Foshan | E2 | E7 | S4 | A1 | S4 | E7 | S4 | E7 | A1 |
| Huizhou | S1 | E2 | S8 | A3 | E6 | S4 | S4 | A3 | A1 |
| Dongguan | E7 | S4 | E2 | S4 | E7 | A3 | S4 | E7 | A3 |
| Zhongshan | A3 | E2 | S6 | A3 | S4 | S2 | A3 | S4 | A2 |
| Jiangmen | S2 | S4 | E2 | S4 | E2 | A3 | A3 | S4 | E2 |
| Zhaoqing | S1 | A3 | E2 | A3 | E4 | A1 | A3 | A1 | E4 |
| Hong Kong | S4 | E7 | A3 | S4 | A3 | E7 | A3 | S4 | E7 |
| Macau | S4 | E7 | A3 | S4 | A3 | E6 | A3 | S2 | E6 |
Disclaimer/Publisher’s Note: The statements, opinions and data contained in all publications are solely those of the individual author(s) and contributor(s) and not of MDPI and/or the editor(s). MDPI and/or the editor(s) disclaim responsibility for any injury to people or property resulting from any ideas, methods, instructions or products referred to in the content. |
© 2023 by the authors. Licensee MDPI, Basel, Switzerland. This article is an open access article distributed under the terms and conditions of the Creative Commons Attribution (CC BY) license (https://creativecommons.org/licenses/by/4.0/).
Share and Cite
MDPI and ACS Style
Li, J.; Chen, M. Spatiotemporal Evolution and Influencing Factors of Social-Ecological System Vulnerability in the Guangdong–Hong Kong–Macau Greater Bay Area. Land 2023, 12, 924. https://doi.org/10.3390/land12040924
AMA Style
Li J, Chen M. Spatiotemporal Evolution and Influencing Factors of Social-Ecological System Vulnerability in the Guangdong–Hong Kong–Macau Greater Bay Area. Land. 2023; 12(4):924. https://doi.org/10.3390/land12040924
Chicago/Turabian StyleLi, Jiangyun, and Mingbao Chen. 2023. "Spatiotemporal Evolution and Influencing Factors of Social-Ecological System Vulnerability in the Guangdong–Hong Kong–Macau Greater Bay Area" Land 12, no. 4: 924. https://doi.org/10.3390/land12040924
Note that from the first issue of 2016, this journal uses article numbers instead of page numbers. See further details here.