
Merging Green and Active Transportation Infrastructure towards an Equitable Accessibility to Green Areas: Barcelona Green Axes

1
Escola Tècnica Superior d’Enginyers de Camins, Canals y Ports de Barcelona, Departament d’Enginyeria Civil i Ambiental, Universitat Politècnica de Catalunya, 08034 Barcelona, Spain
2
Escuela de Arquitectura de Toledo, Departamento de Ingeniería Civil y de la Edificación, Universidad de Castilla-La Mancha, 08034 Barcelona, Spain
*
Author to whom correspondence should be addressed.
Land 2023, 12(4), 919; https://doi.org/10.3390/land12040919
Submission received: 15 March 2023
/
Revised: 14 April 2023
/
Accepted: 17 April 2023
/
Published: 19 April 2023
(This article belongs to the Special Issue Constructed Green Areas as a Challenge for Spatial Planning at the Local and Regional Levels)
Abstract
:The UN’s 2030 Sustainable Development Goals (SDGs) call for the provision of universal access to: (a) safe, inclusive, and accessible green and public spaces, and (b) safe, affordable, accessible, and sustainable transport systems for all. The Barcelona green axes plan aims to transform one third of the streets within its 19th century extension grid, increasing the tree cover and the vegetation, adopting sustainable urban drainage systems, limiting motor traffic, and providing a safer and more comfortable environment for pedestrians, cyclists, and other social activities in healthier environments. These transformations become even greater at the intersection of the axes, where former traffic junctions are becoming squares and urban gardens. This study gives an in-depth analysis of the origins of the superblocks plan, the rationale behind the transformation, and the implementation process. The GIS-based analysis shows how the green axes and the new square gardens (a) transform the city’s disconnected urban green areas into a more interconnected green infrastructure system, and (b) significantly increase accessibility to green areas. The study reveals this strategy’s potential to create a city of proximity, improve the well-being of the population, and build a more equitable city, which could be a useful tool for planning and decision making at both city and regional levels.
1. Introduction
1.1. Sustainable Development Goals (SDGs) and Urban Green Infrastructure
The approval in 2015 of the 17 SDGs by the United Nations [1] created a new reference framework of global scope. Aligned with the SDGs, the urban agendas provide, for the first time, an operational framework that tacitly calls for cities to be considered as key places for action in the struggle to achieve a more sustainable society—globally, as with the New Urban Agenda [2], or more locally, as with the EU Urban Agenda [3] and the Spanish Urban Agenda [4].
Urban greenery, and specifically street trees, can help cities achieve some of the SDGs, such as goals 3, 11, and 15—i.e., good health and well-being, sustainable cities and communities, and life on land [5]. Specifically, the development of green spaces can contribute to “promoting mental health and well-being” and “reducing the number of deaths and illnesses from hazardous chemicals and air, water and soil pollution and contamination” (targets 3.4 and 3.9, respectively), “providing universal access to safe, inclusive and accessible, green and public spaces” (target 11.7), and “integrating ecosystem and biodiversity values into national and local planning, development processes, poverty reduction strategies and accounts” (target 15.9). In addition, the incorporation of vegetation in streets, along with other deeper redevelopment operations that take into consideration the water cycle and encourage active travel, can contribute to the achievement of another important goal, namely “providing access to safe, affordable, accessible and sustainable transport systems for all, improving road safety, notably by expanding public transport, with special attention to the needs of those in vulnerable situations, women, children, persons with disabilities and older persons” (target 11.2), given that active modes provide the most sustainable transportation.
The first great urban axes and boulevards of the 19th century industrial city were conceived to perform three main functions: movement, leisure use, and visual experience of natural elements [6]. The arteries of the Cerdá extension plan for Barcelona, the city on which this study focuses, the numerous boulevards of Haussmannian Paris, or the American parkways conceived by Olmsted became prototypes for later generations of urban planners and landscape architects. The latter were “intended to structure new residential neighborhoods and serve as ‘linear’ parks connecting residential areas to larger parks” [7] (p. 84). In retrospect, the realization of ecological values linked to urban green networks can be seen as emergent properties of structures and forms that were conceived, planned, designed, and built for other reasons [8]. However, although the interests and concepts of the 19th century were not the same as today’s, they constitute an essential reference regarding the combination of green infrastructure and sustainable mobility.
The concept of green infrastructure was introduced by Benedict and McMahon as an interconnected network of green spaces that conserves the values and functions of natural ecosystems and provides associated benefits to human populations [9]. Ecological networks were defined by Jongman et al. as systems of nature reserves and their interconnections that make a fragmented natural system coherent, supporting more biological diversity than if unconnected [10]. In fact, there is a perception that ecological networks have specific functions and objectives related to the promotion and enhancement of biodiversity, and to the conservation of wildlife and respective habitats [11].
Today, according to the European Commission, we can understand green infrastructure as “a strategically planned network of natural and semi-natural areas with other environmental features designed and managed to deliver a wide range of ecosystem services. It incorporates green (or blue if aquatic ecosystems are involved) spaces and other physical features in terrestrial (including coastal) and marine areas. On land, Green Infrastructure is present in rural and urban environments” [12] (p. 3). The most common green infrastructure planning principles are connectivity, multi-functionality, multi-scale, integration, diversity, applicability, governance, and continuity [11].
In dense urban contexts, the demand for ecosystem services is high while their supply is very limited. Urban green infrastructure has been identified as a valuable tool for providing these services, as well as increasing the resilience of cities [13]. In fact, green infrastructure has become a planning tool at multiple scales and has been associated with the development of multiple social and environmental benefits [11,14], including those related to people’s health described in the following section.
1.2. Green Areas, Active Mobility, and Public Health in Cities
Cities today face critical social and physical problems in adapting to growing populations, including increased air and noise pollution, inaccessibility of housing, and reduced employment opportunities and available resources; all these directly relate to health [15]. Green infrastructure can be an important part of the solution to many of these problems.
The presence of plants in urban environments has been shown to have psychological and biophysical benefits for humans [8], and daily contact with nature is important for good mental health [5]. In fact, during the COVID-19 pandemic, when people were encouraged to stay indoors, those who had views of trees and green spaces from home experienced lower rates of depression and anxiety [16]. In this context, urban green spaces are considered equigenic environments that can disrupt the typical conversion of socioeconomic inequalities into a greater risk of poor health [17].
Barton proposes a health map designed as a dynamic tool that provides a basis for dialogue and collaboration among professionals (planners, public health, service providers, ecologists, urban designers) and about issues (transportation, air quality, community development, economic development) [18,19]. Each human settlement is understood within its bioregion and the global ecosystem on which it ultimately depends, and broader cultural, economic, and political forces affecting well-being are represented. This model allows analysis of environmental side effects on health, which are often much more significant. For example, the pattern of human activity (travel behavior and destinations) changes. Activity, in turn, affects the local natural environment (air pollution) and the global ecosystem (greenhouse emissions). It also affects local economic efficiency and people’s lifestyle choices (the likelihood of walking or driving). Lifestyle changes may well affect the pattern of social networks. The model can help identify these processes and contribute to sustainability and health impact assessment.
One of the conceptual frameworks for urban health that can help establish these processes proposes that links between urban planning, behaviors, environmental exposures, and health outcomes are key to urban and transportation policies [20]. The relationship between contact with the natural environment and health is mediated by a variety of mechanisms including air quality, physical activity, social contact, stress, and restoration. The mechanisms have several possible modifiers, such as distance to green space, accessibility factors, perceived safety in green spaces, social context, cultural context, gender, age, and socioeconomic status. Better air quality, more social contact, physical activity, and less stress are associated with better health [21,22].
Air pollution is related to the highest rate of respiratory diseases, such as asthma and allergies, among the population [23]. Noise pollution can not only cause damage to the auditory system but can also lead to lack of sleep and mental health problems [24,25]. In the West, combustion engines linked to transportation are the main cause of air and noise pollution. Green infrastructure can mitigate both types of pollution, in addition to making the use of active means of transport more comfortable.
This can further increase the positive effects on health, not only because of the direct benefits derived from physical activity performed by people moving around actively, who can abandon sedentary lifestyles, which are a serious public health problem in most Western countries. Increasing the percentage of people moving on foot, or by public transport, can reduce premature deaths due to environmental conditions [26,27,28]. At the same time contact with green infrastructure decreases mental illnesses such as depression [29,30].
Improving road safety, walkability, and the environmental quality of gathering spaces can not only reduce the risk of traffic injuries but also promote social well-being by encouraging more outdoor interactions, both with the neighborhood and with other residents [31,32]. In addition, improving non-vehicular mobility and increasing the number of pedestrians can effectively reduce road traffic injuries through a “numerical safety” mechanism, in which pedestrians and cyclists outnumber the presence of motor vehicles in an area [33,34].
Among this set of positive effects associated with the improvement of urban green infrastructure, there may, however, be changes in the value of housing, generally increasing due to improvements in neighborhoods and the possible growing desire to live in that environment [35]. The rise in the price of housing and consumer goods in the affected neighborhoods are undesired effects that can lead to the so-called “green gentrification” [36,37], expelling the original neighbors who would be replaced by new residents with higher purchasing power. This could generate neighborhoods that are not accessible to some sectors of the population [38].
1.3. Research Objectives and Case Study
Ildefonso Cerdá’s Project for the Reform and Expansion of the City of Barcelona is mentioned in most histories of 19th century Western urban planning. The urban transformations for the Barcelona 1992 Olympic Games were also important internationally. Since 2016, Barcelona is again receiving international attention for its urban strategies associated with the concept of superilles—superblocks, in English. Newspapers around the world have published news related to Barcelona’s superblocks [39,40,41], while scientific research has been more limited, with some notable exceptions [42,43].
The recent eixos verds—green axes, in English—of the Catalan capital are part of the new Barcelona Superblock strategy and propose the transformation of every third street in the Cerdá extension grid to expand the active mobility network throughout the city, incorporating vegetation and green spaces [44]. These green axes, extended to the entire city of Barcelona (Figure 1), seek to improve citizens’ access to green spaces, prioritize active travel, reduce motor vehicle traffic, and improve citizens’ health by improving environmental quality and facilitating physical activity in daily commuting.
The green axes project in Barcelona is expected to have a positive health impact on the residents of the neighborhoods crossed by the axes, improving physical (e.g., traffic injuries, cardiovascular and respiratory diseases), mental (e.g., depression and anxiety), and social well-being [45,46].
This paper studies and describes the green axes project—its origin, conception, evolution, and initial implementation—and gives an assessment of the expected impact that this major redevelopment of two important central districts of the city of Barcelona will have on the population. The current superblock project evolved from the model undertaken by the Xavier Trías city council in 2013–14 into another model of axes: the version finally adopted in 2018 with the superblock proposal for the Sant Antoni neighborhood in L’Eixample district. The first was based on superblocks, while the version that is being implemented is based on green axes. Following the international competition called New Green Axes—Barcelona Superblock held in 2020–2021, the transformation of 2.8 km of a major longitudinal artery (Consell de Cent street) and three sections of streets perpendicular to it, totaling another 2.8 km, will be completed in 2023 as part of the first phase of the Barcelona Superblock strategic plan.
The goals of this research are multiple. On the one hand, it aims to analyze the origin, development, changes in the approach of government, implementation processes, and the causes and mechanism of formalization of the green axes project, as a combined network of green infrastructure and sustainable mobility, aimed at improving public health. This improvement in environmental conditions is based on the increase in vegetation and space and conditions for active mobility in these axes, and seeks to improve the health of citizens, reducing levels of air and noise pollution, favoring physical activity in daily commuting and in the informal practice of sports in urban environments, and improving accessibility to the city’s green infrastructure. Lastly, there is a quantitative evaluation of the project’s impact on people’s accessibility to green spaces in the two districts where the physical transformations are being carried out, and in the other districts of the city.
2. Materials and Methods
To address the first objectives of this research, an analysis is carried out of the main documents related to the conception, background, origins, transformation of the political discourse, and the urban model in which the current green axes project is framed, including but not limited to: Rueda’s 2002 superblocks proposal for Barcelona [47], the Respira Project [48], the 2014 and 2022 Barcelona urban mobility plans [49,50], the 2016 city government measure on the implementation of the superblocks [51], the most recent 2021 government measure Barcelona Superblock [44], the 2013 Plan of Green Spaces and Biodiversity of Barcelona 2020 [52], and the Barcelona Nature Plan 2021–2030 [53].
As will be seen, there is an evolution from the first superblock model towards networks of streets that are conceived as part of the green and active mobility infrastructure of the city. The analysis begins with the proposal of a network of pedestrian streets to reorganize mobility in 2007 [54] and expands until the ongoing construction of the first green axes, which are the result of an international competition called at the end of 2020, and now are part of the 2021 Barcelona Superblock city strategy [44].
The results of this part of the research are presented under the following headings in the next section: (Section 3.1) A model based on the sustainable city and the paradigm shift to public health, (Section 3.2) From superblocks to green axes: integrating green and active mobility infrastructure, and (Section 3.3) The formalization of the green axes and their connection with the green corridors.
Finally, the expectations of the impact that the green axes project may have on the population in terms of accessibility to green spaces are set out, by comparing the situation prior to the transformation (scenario 0) with two subsequent situations: (scenario 1) the implementation of the green axes in L’Eixample district, where the green axes are initially built and tested, and (scenario 2) the expansion of the green axes towards the neighboring Sant Martí district (Figure 2).
For these three scenarios, the accessibility of the population to green spaces was evaluated based on the distances between the access points to green areas and the surrounding buildings. From the distances measured along the axes of the road network, the number of buildings located less than 15 min away from a green space was established. To measure the impact on the resident population, the residential population data of each block, according to the January 2023 census, was used.
The methods used to characterize each of the three scenarios followed the methodology proposed by the Barcelona Mobility and Infrastructures Office [55], which considers all public green spaces those larger than 0.5 hectares. In accordance with this minimum surface area criterion, this study does not consider as new green spaces the totality of the axes, but only the intersections of two axes and their close surroundings, which constitute areas of 0.5 hectare in surface area (Figure 3).
Following the same methodology, access to green spaces was modeled by points located in the street network. To establish accessibility to green spaces, travel speeds of 2 km/h were considered to include most residents, including those with slower speeds, e.g., children or elders. With these constraints, catchment areas were calculated from the shortest path trees from each green space access point, using travel times of 5, 10 and 15 min. Scenario 0 was constructed from data provided by the Barcelona Department of Mobility and Infrastructure [57], and for scenarios 1 and 2, the Network Analyst module of ArcGIS Pro [58] was used.
The access distances of 5, 10 and 15 min and the minimum green space dimensions adopted are compatible with the standards set by several supra-state agencies. In Europe, the European Environment Agency recommends an accessibility measure to green spaces of 15 min walking distance [59]. The World Health Organization considers spaces of 0.5–1 hectare at 300 m (about 5 min) [60] (p. 31).
Once the accessibility to the green spaces of the different city blocks had been established, based on the distances and times, and taking into consideration the 15 min city proposal [61], the evaluation of the impact on residents was made using 15 min isochrones—i.e., 500 m—and the current population data (January 2023) provided by the Barcelona City Council [62]. To account for the population in the case of blocks not fully included in the 500 m catchment areas, the proportional part was considered according to the area included in the corresponding block. From these calculations, the rise in the population near green areas, as well as the proportion of residents with access to green spaces, was analyzed for each district and for the whole city of Barcelona.
3. Results and Discussion
3.1. A Model Based on the Sustainable City and the Paradigm Shift to Public Health
The superblocks project was promoted by Rueda and the Barcelona Urban Ecology Agency in 2002 [47] and taken up by the Barcelona City Council in 2014, in the Urban Mobility Plan 2013–2018 [49]. The Barcelona Urban Ecology Agency, created in 1999, had picked up on the sustainable cities movement that emerged in Europe from the Aalborg Charter (1994) [63]. During the period 1999–2005, the agency produced a proposal that has clear similarities in its configuration to the 1984 Barcelona basic road network plan (Figure 4, top) [64]. The latter had arisen from the perspective of the construction of the Barcelona ring roads in preparation for the 1992 Olympic Games.
The proposal of the Urban Ecology Agency of Barcelona was based on a basic network structure in which superblocks were made of three-by-three blocks in Cerdá’s city extension. This scheme was based on the criterion that active means of transport would move mainly through the interior streets of the superblocks, where motorized traffic would be prevented to lower noise and pollution levels inside these superblocks. The proposal was based on a binary scheme: the perimeter streets of the superblocks were given over more to motorized transport, while the interior streets were planned as a single shared platform, with priority for active modes, restricting access for motorized vehicles (residents, loading and unloading, emergencies) and favoring the development of stationary activities (Figure 5).
After three decades of socialist mayors in Barcelona, in 2011 there was a change of government in the City Council in favor of the Convergencia i Unió party. The mandate of Xavier Trías (2011–2015), characterized by a neoliberal policy, attempted to create new social networks to replace those consolidated during the previous government of the Socialist Party of Catalonia [65]. Two of the most important urban planning instruments of his mandate were the 2011 Esquema Director de les Portes de Collserola a Barcelona [66], which proposed the connection of the city to the Collserola sierra at sixteen points [67], and the 2012 Pla Buits for the use of twenty urban spaces with territorial and social implications, including new social networks [68]. Along with these proposals, sustainable mobility was also addressed through the Urban Mobility Plan 2013–2018 [49], which, according to the proposal of the Urban Ecology Agency, planned the creation of five hundred superblocks (Figure 4, bottom).
The development of the plan was put into practice through the creation of five superblocks in the so-called pilot areas (Figure 6). The project was approached more with the aim to introduce or transform urban service networks, from a perspective of closing the water, energy, and waste cycles. Urban transformation was approached from a metabolic and self-sufficiency perspective [69]. This methodology included a timid regulation of motor transport, to begin with the superblock of the district of Les Corts. However, during this legislature none of the pilot areas in Cerdá’s gridiron extension were in fact put into effect.
A few years earlier, in 2009, it became evident that more than 3500 people died prematurely each year in the Metropolitan Area of Barcelona exclusively due to poor environmental quality, i.e., not having levels below those proposed by the World Health Organization. This is more deaths than those associated with cancer, coronary heart disease or traffic accidents, and could mean reducing the life expectancy of the population by one year [71].
The European Study of Cohorts for Air Pollution Effects investigated the long-term effects of air pollution exposure on human health in Europe by analyzing the spatial variation of measured NO2 and NOX concentrations between and within 36 areas across Europe. The highest median concentrations were observed in southern Europe, and the lowest in northern Europe. The greatest spatial variation in NO2 was found in the largest European cities, such as London, Paris, Barcelona, and Marseille. The highest concentrations were measured in the Mediterranean area, especially in the agglomerations of Barcelona and Turin [72]. It was confirmed that the city of Barcelona, and especially L’Eixample district, had extreme levels of air pollution.
The initial design density of the Cerdá grid was 250 inhabitants per hectare, but currently densities are double or triple this—500 or 750 inhabitants per hectare, respectively—depending on whether the sector in question includes one of the blocks designated as urban parks. Today, Cerdá’s extension is among the densest urban fabrics in Europe. Although the benefits of urban density have been recognized for over half a century, above certain thresholds, and when motorized transport is prioritized, high densities become detrimental. Density can be positive, but, in Barcelona, health indicators are not—pollution levels, especially so [72].
This residential density and concentration of economic activity in Barcelona’s 19th century limits has been accompanied by the development of car-based mobility, a major consumer of space and a major component of the city’s environmental pollution. The car occupies most of the road space, reaching a use of 60%, when it represents only 25% of the modal distribution. In Barcelona, at the start of the millennium, the density of cars was 6000 per km2, compared to 3000 in Madrid and 1200 in London [73]. This led to high environmental pollution, with serious health consequences, especially in the L’Eixample district [71].
This type of study and evidence spread from the more academic to the public sphere and has had an impact on the political sphere. The concern about pollution and urban health, together with the effects of the 15 M Movement, which emerged on 15 March 2011 in Barcelona and many other Spanish cities, led during the following years to bottom-up civil initiatives and numerous changes of government in the municipal elections of 2015, with commitments made by politicians during the election campaigns [74].
One of these initiatives was the citizen movement Recreant Cruïlles, which took advantage of the opportunities provided by the 2013 Pla Buits to reclaim the use of the streets for the neighbors. For example, in the two neighborhoods of La Esquerra de L’Eixample, the need to integrate new healthy routes with pedestrian and cycling routes in an environment of environmental quality was made clear (Figure 7) [48]. In this way, health was included as a main objective—demanded by citizens—into a road transformation project today, and was proposed, moreover, hand in hand with a network of streets in which active modes of transport would have priority.
In 2015, the municipal elections were won by Barcelona en comú—a new political group led by Ada Colau, who was elected mayor. The first administration (2015–2019), with greater ecological awareness due to the support of social movements, focused initially on the promotion of cycling, and a project to introduce a tramway along the Diagonal Avenue in L’Eixample district to connect the two pre-existing streetcar networks, linking the three western lines and the three eastern lines.
Given the need and commitment to reducing pollution, two parallel strategies were proposed. The first aimed to reduce the presence of vehicles with metropolitan-scale measures such as congestion charges or increased parking prices to discourage private vehicles. The second proposed that at least one out of every three streets should be preferentially pedestrian for pollution levels to be acceptable—given that 70% of pollution comes from mechanized vehicles [75]. The aim was to improve public health, and the actions were linked to mobility.
These social movements were key to bringing proposals for change in mobility from the municipal government [76]. Among these, the previous work of the network of organizations linked to sustainable mobility was essential. The Association for the Promotion of Public Transport proposed the introduction of the tramway along Diagonal Avenue, groups for the promotion of bicycles defended the extension of the network of bicycle lanes, and the neighborhood associations of L’Eixample district proposed priority axes for active modes (Figure 7).
3.2. From Superblocks to Green Axes: Integrating Green and Active Mobility Infrastructure
In the second year of Ada Colau’s first term (2015–2019), the government team addressed the transformation of the superblocks planned by the previous government team more decisively, while promoting a government measure in which the green/civic axes—their name at the time—were superposed onto the three-by-three superblocks (Figure 8) [51].
The first attempts at the transformation of superblocks in this period followed two different strategies—both included in the 2016 superblocks city government measure [51]. The first was implemented in Sant Martí district [77] in Mobility Week in September 2016. A temporary transformation was carried out on a superblock in the Poblenou neighborhood of this district. This institutional tactical urbanistic action mainly used elements of street furniture and painting. Although it was initially presented to the neighbors as temporary, at the last moment it was proposed as being permanent. This improvisation generated opposition from part of the neighborhood and required more than a year to be approved [78], especially due to the contradictions of the project and the lack of consensus with the associative fabric [79].
The second strategy was implemented in the Sant Antoni neighborhood of L’Eixample district. Led by the district council and with the support of the Urban Planning and Urban Ecology Area, a citizen participation process was developed from the beginning of 2017. This action model sought the prior consensus of the organized groups in the neighborhood around a proposal that was then submitted to the Neighborhood Council for approval. This scheme was successfully initiated, taking advantage of the inauguration of the Sant Antoni Market Reform in 2018. The formal proposal would consist of transforming a series of streets and the intersections between them—according to an initial proposal for a network of axes planned for the entire L’Eixample district (Figure 9, top). In these new squares, the continuity of motorized traffic was interrupted, but without modifying the direction of movement of motor vehicles in the city. The solution included permanent structuring actions and others of a provisional nature (Figure 9, bottom) [80].
One of the main arguments for adopting this solution was that the original binary model of Barcelona’s Urban Ecology Agency was difficult to implement. On the one hand, the bus network required round trips to be made on the same or an adjacent parallel street, and loading and unloading operations were unfeasible in the basic mobility network. Furthermore, to achieve a paradigm shift, it was essential to create squares that served as neighborhood centers. The actions in Sant Martí district had shown that, more than just banning cars alone, it was essential to reconquer the street for the neighbors with the neighbors.
The original superblock model, which emphasized three-by-three block enclosures and their interior pedestrian spaces, is gradually giving way to the green axes model, which seems more viable (Figure 10). The latter puts the focus on longitudinal continuity, also enabling the connection with pre-existing green spaces, e.g., Consell de Cent Street linking Joan Miró and Glòries parks and crossing the entire L’Eixample district.
From the management point of view, compared to the reduced scope of the three-by-three superblock (nine blocks), the neighborhood seems to be the minimum unit of action, with a surface area approximately ten times larger (81 blocks). This allows for an organized social fabric and sufficient neighborhood representation and participation. On the other hand, the materialization of the more than five hundred superblocks initially proposed could mean that L’Eixample would lose importance in terms of economic activity and would require a reflection on a city-wide scale in favor of a polycentric structure with peripheral nodes that would gain in importance at the expense of the center.
After the experience of the first term of the Barcelona en comú government (2015–2019), a leap of scale was made in the second currently ongoing period (2019–2023) from the superblock model (which had been implemented in a dispersed manner) to a new comprehensive urban strategy called Superilla Barcelona—Barcelona Superblock, in English [44]. In this model, the green axes model was extended to the Cerdá grid fabric from L’Eixample district to Sant Martí district and, in addition, the sections of several very important arteries were transformed, e.g., a section of the ecological corridor in Pi i Margall Avenue, Meridiana Avenue or Via Laietana. The city strategy changed from being superblock-centered to prioritizing the construction of the green axes, which is indeed one of the main projects of the Barcelona Superblock strategy [81].
The superblocks plan, which was the star proposal of the 2014 Barcelona Mobility Plan 2013–2018 [49], was replaced by the green axes plan in the 2022 mobility plan for 2024–2030 [50]. In the latter, superblocks are only mentioned to refer to past experiments, while the actions and goals for the new period focus on the green axes. The green axes plan has been gaining momentum in recent years and is the basic proposal for the transformation of urban public space in the city’s current strategic plan (Figure 1). After the COVID-19 crisis, since October 2021, this project has been accompanied by many other operations in Barcelona. It brings together cross-city actions to reform Barcelona, make it more resilient, and provide a sustainable response to climate, social, and economic crises [44].
3.3. The Formalization of the Green Axes and Their Connection with the Green Corridors
Following the experience of street transformation associated with superblocks during the period 2015–2019, and after the COVID-19 lockdown, an international ideas competition was held at the end of 2020 to design the first phase of green axes—2.8 km of Consell de Cent street and another 2.8 km distributed among the three streets perpendicular to it—and for the square gardens located at four intersections of Consell de Cent with other green axes (Figure 11).
This scheme, which represented a paradigm shift and a more viable roadmap, involved the integration of transport systems with their networks—public transport, bicycles, pedestrians, and private vehicles (cars, mostly)—within the urban project. It had the ecological perspective of introducing as much vegetation as possible in the least green and most dense part of the city, and connecting it to the network of green spaces. There was also a social aspect, in that it organized the neighborhoods as socio-ecological units around the intersections of the green axes—the square gardens—as a new meeting place for neighbors.
Once the sections and squares were awarded to the winning teams, a technical participation procedure was established to draw up a document describing “the new green axes model” [56]. It established the design criteria for the future green axes and square gardens and stressed the importance of achieving continuity of these throughout the green axes, and emphasizing it at their intersections. The new design is based on three design principles and three levels of action.
The three design principles are: a preference for active modes of travel and social use of public space over a flexible, accessible and inclusive shared space; maximum naturalization, preserving the existing arboreal heritage, adding new trees and shrubs, and modifying the composition of the subsoil—increasing the volume of topsoil and providing a richer, more porous and better draining subsoil; and environmental sustainability, which is committed to reducing the ecological footprint, from construction to maintenance, paying special attention to both the materials used and the role of the street in the urban water cycle.
The transformations are carried out at three levels: subsoil, soil, and aerial. The subsoil is conceived of as environmental infrastructure, ensuring the maximum continuity and quantity of soil for the development of plant species and the filtration of rainwater, using sustainable urban drainage solutions. On the ground, the pavements used, in addition to being arranged to encourage infiltration and the location of trees and plants, will promote a transversal and longitudinal use of the entire width of the street, ensuring universal accessibility for people and the necessary services. It is in the air that the visible part of plant species develop, and this level takes into account where trees and shrubs are placed so as to maximize biodiversity, thermal comfort, and CO2 absorption, along with: artificial lighting respectful of people and other animal species; energy generation through the introduction of solar panels; and the relationship of the street with the uses of the buildings on the first floor (Figure 12).
From the set of criteria developed in the model, it is worth highlighting the details regarding the feasibility of introducing more green space, especially trees, in a dense city environment. In this sense, among the multiple variables to be identified, the following are noteworthy: the evaluation of the available space; the uses that the street must support; the availability of a subsoil free of urban services; and the willingness to maintain the existing trees and to incorporate new trees in a significant way, together with other layers of vegetation, and the improvement of the subsoil.
The available space across a standard street provides a 20 m right of way, which is significantly enlarged in the square gardens up to 54 m. Regarding the availability of land suitable for planting, the approved green axes projects consider two longitudinal strips, immediately parallel to the façades of existing urban services, where it is not possible to intervene in that subsoil. In the rest of the street, the goal is to maximize the green areas, maintaining the existing trees and adding new ones, together with flowerbeds, shrubs, and other autochthonous plants. Additionally, beyond the use of land suitable for planting, according to the 2020 Technical Specifications for the design, execution, and reception of green spaces, the use of structural soil is introduced in the paved areas adjacent to the green flowerbeds, to improve the development of tree roots beyond the wells [83]. The specifications also recommend the partial or total replacement of the soil below the current roadways since its level of compaction is expected to be high. The benefits of the use of structural soil to make compatible the bearing of loads from moving vehicles and the appropriate development of trees have been demonstrated in urban environments [84,85].
As a result, there is a set of limits within which to control the spatial configuration of the green axes to maximize greenery and trees. The asymmetrical distribution favors planting in the sunniest side of the street. Thus, from side to side, there are: a 3.5 m pedestrian safe zone (for urban services below, not suitable for planting); 2 to 5.8 m suitable for planting; a 5.2 m shared space (with structural soil below); 2 to 4 m suitable for planting; and a 3.5 m pedestrian safe zone (for urban services below, not suitable for planting). Evidently, the green strips to be designed are not continuous and their intermittent rhythm is subject to the needs of the future living areas, outdoor dining/bars, and access to buildings (Figure 13).
The green axes and square garden proposals, which won the competition and were developed according to this model, are currently under construction and aim to be completed before the next municipal elections in May 2023. The City Council provides many pictures of the expected outcomes, and states that green areas will be multiplied by ten, moving form a standard of 1% green area on the streets, to an average of 14%. There will be 438 new trees planted in the new green axes (Figure 14) [86].
The character and conditions conceived for the green axes means that, at their intersections, they can be considered as small green areas—more so in the urban expansion area where they are scarce—and as the most fine-grained part of the city’s green infrastructure, allowing the interconnection of larger green areas and access to them by citizens through healthier arteries.
The 2013 Green and Biodiversity Plan of Barcelona (2012–2020) [52] proposes ecological connectors linking the parks of Montjuïc, Ciutadella and the coast with the Collserola sierra through roads more than 20 m wide and corridors extending towards the urban areas (Figure 15), according to the Collserola Gates plan [66]. The municipal plan for green spaces and biodiversity was consistent with the 2010 Barcelona Metropolitan Territorial Plan [87], which proposed a network of ecological connectors to preserve biodiversity and ecosystem services based on the metropolitan study conducted six years earlier for the Barcelona Metropolitan Area, which recommended enhancing territorial mosaics with ecological connectors [88].
A decade later, the ecological connectors have been planned and a more detailed scale of action has been introduced. Thus, the 2021 Nature Plan for Barcelona 2021–2030 seeks a better distribution of greenery, a reinforcement of biodiversity nodes, integration of the greenery of the metropolitan area, and the connection of the green areas through green corridors [53]. The plan explicitly refers to the Barcelona Superblock strategy and the network of green axes and new square gardens “that connect city facilities and urban green spaces” (p. 70), incorporating them as a more fine-grained design to ensure access to greenery in dense areas. The approach is like that proposed in Seattle, which enhances parks and community spaces, extends green axes in the urban fabric, and encourages blue infrastructures linked to water, as well as the promotion of different habitats [89].
3.4. The Impact of Green Axes on the Population’s Access to Green Areas
The previous sections have made it possible to trace the origin, evolution, and perspectives of the current strategy of green axes in the city of Barcelona. As we have seen, these seek to improve the public health of residents, improving environmental conditions and favoring urban lifestyles that facilitate active travel and social interaction. The final part of this study estimates the impact of green axes on accessibility to green spaces—considering the entire population and the conditions of those sectors of the population with limited mobility, e.g., children and seniors.
As described in the research methods, the analysis considers three scenarios (Figure 2): the situation before the implementation of the green axes (scenario 0), the situation after the implementation of the green axes in L’Eixample district planned for 2030 (scenario 1), and the future situation with the expansion of the green axes into the neighboring Sant Martí district (scenario 2). To assess the impact on the resident population, it is essential to know the distribution in the city of Barcelona (Figure 16).
The distribution of residents per block, in the case of the L’Eixample district, allows a simultaneous interpretation of the density, given the clear similarity of size of the blocks. It shows the concentration of the population in L’Eixample district, and especially in the neighborhoods to the left (southwest) and right (northeast). This population distribution, together with the distribution of green areas in the city—in the current and future scenarios (Figure 2)—already allows for a meaningful impact of green axes and new square gardens on the resident population.
The spatial analysis of proximity to green spaces larger than 0.5 hectare in the various scenarios, through the 5, 10, and 15 min isochrones, reveals a significant transformation of the city (Figure 17). The current state suggests that large areas of the city’s urban areas do not currently have any green spaces nearby. This phenomenon is more acute in the urban expansion area where we find the largest such areas in L’Eixample district, but also in Gràcia, Sant Martí and Sant Andreu.
The implementation of the green axes in L’Eixample shows a remarkable expansion of the zones accessible to green areas, which cover almost the entire district and expand into the bordering parts of neighboring districts. This is particularly the case in Gràcia and Sant Martí, where there are still large areas of these districts without access to green space. In the latter, the second planned expansion of the green axes solves the problem. The map shows that, in scenario 2, almost all of Sant Martí’s residents have a park or an urban garden within 500 m.
Combining the spatial location of Barcelona’s residents with the different levels of accessibility to green spaces allows us to evaluate the impact of green axes and square gardens on the population. Table 1 shows, for each district and for the whole city, the number of inhabitants and, for the three scenarios analyzed, the number of residents with access to green spaces, the increase in population with access to green spaces, and the percentage of the population with such access.
L’Eixample and Sant Martí are the most populated of the city’s ten districts—with 269,349 and 241,181 inhabitants, they are also the only two with more than 200,000 people. If we look at the percentage of the population with access to green spaces, L’Eixample (60.6%) shows the lowest levels after Gràcia (37.8%) and the old city, Ciutat Vella (40.7%). Sant Martí (74.0%), is at the next level of access to green areas, somewhat above 70%—as are Horta-Guinardó and Sarrià-Sant Gervasi (both with 73.1%). In the remaining four districts, we can distinguish two groups. In Sants-Montjuïc and Sant Andreu, the percentage of the population with access to nearby green areas is between 80 and 85%, and in Nou Barris and Les Corts, the percentage is ten points higher (90–95%).
The implementation of the 21 km of green axes in L’Eixample planned for 2030 will radically alter the situation of this district. It will give 87,000 more residents access to green space, an increase of 53.6%, which will mean that 93.1% of residents will have a green space nearby. L’Eixample will be the second best positioned district in the city in this respect. The impact of the transformation of these streets and gardens in this district goes beyond its boundaries and improves the conditions of four of its neighboring districts, thanks to the central position of L’Eixample. The increase in the number of neighbors who benefit is significant and quite similar in these four districts (between 8500 and 12,500 more inhabitants), however, in relative terms, the impact is quite different in each one. In Ciutat Vella (+24.2%) and Gràcia (+18.5%), almost half of the residents of both districts now have a green space nearby. In Sants-Montjuïc (+7.9%) and Sant Martí (+4.8%), the effect is more limited in relative terms. Although this means that in the former, more than 90% of residents have a green space nearby, and in the latter almost 80%.
The subsequent expansion of green axes in the district of Sant Martí will mean a significant change in the district itself, where we estimate that 26,427 new residents will be less than 500 m from a green space. This is an increase of +14.8% that will bring 85% of the population of this district close to a green space. However, the model does not foresee any impact on neighboring districts. This is due to several reasons, such as its perimeter location in the city and the configuration of its boundaries with neighboring districts other than L’Eixample, e.g., separated from Ciutat Vella by a park and from Sant Andreu by a railway strip.
For the city of Barcelona as a whole, the implementation of the green axes will increase the number of inhabitants close to green infrastructure by 145,726. A rise of +12.2% will mean that 80.5% of the population will have a green space within 500 m of their home. The huge improvement in L’Eixample—from 60.6% to 93.1%—is more limited in other districts where the percentages are still low. This is particularly acute in Ciutat Vella and Gràcia. Neither the old city nor this other historic settlement include any green areas, and other solutions will have to be sought. These districts, on the other hand, have limited motorized traffic and a more human-scale urban fabric that improves their livability, but access to green spaces for the population will still not be satisfactory. For these districts and for the whole city, improvements will have to be made, both in terms of increasing the number of green axes and access to green spaces in the interior of blocks, improving façades, and green roofs on buildings.
4. Conclusions
This study shows that the popular model of superblocks in the city of Barcelona, initially conceived and usually understood as a model based on enclosures, has evolved towards the green axes analyzed here. These urban arteries will constitute the basic framework of the urban green infrastructure, especially in the densest part of the city, associated with the Ensanche fabric. This network not only connects the pre-existing green areas, but also, at the intersections of the green axes, allows the construction of new square gardens that will be particularly relevant to provide a small green area of proximity to this densely populated central area of the city so lacking in green spaces. The multi-functionality envisaged for the green axes goes beyond their main role within the green infrastructure and active mobility, as they enable other basic urban functions such as those linked to social and commercial activity, and transform the role of the road in the water cycle, integrating sustainable urban drainage systems. They also allow for gatherings that reinforce social inclusion and cohesion, and improve mental health [45].
From the point of view of urban mobility, unlike the superblock model, the new network of green axes seems more viable, as it affects one in three streets—rather than two in three—and is conceived as one of the elements of an urban transport system organized into four networks: the network of green axes itself, with priority for pedestrians, but also with easy access for low-speed cyclists, and the networks of bicycle and bus lanes that run along the other streets, with sufficient capacity for private motorized traffic.
The real impact that these measures will have on the reduction of motorized traffic, on pollution levels and on the health of the population cannot be known. It will be important to study the evolution of these factors as the green axes are implemented. So far, there has been little monitoring of the results of the planned services and functions. In this sense, to be effective, green infrastructure must require frequent investment, management and updates, and the municipality must frequently publish new information about its projects, its objectives, what has been achieved, and what its perspectives are regarding green/blue spaces.
The impact on the population’s access to green spaces is radical in the central districts, and notable throughout the city. Our analysis shows that 12.8% more of Barcelona’s population (146,726 inhabitants) will have a green space less than 500 m away—from 71.8% to 81.6% of the population. In the case of L’Eixample district, with one of the most extreme states of pollution, the number of residents with access to a green space increased from 60.6% to 93.1%. Among the effects on the population, it will also be important to control the possible unwanted effects of green gentrification, which has precedence in Barcelona [90]. However, considering the environmental and health benefits of renaturation projects, it is necessary for cities to continue to invest in improving access and availability of parks in disadvantaged neighborhoods, while implementing green and inclusive anti-displacement policies [91,92].
The study allows the principles of green infrastructure planning to be reviewed for a dense fabric, such as Barcelona’s urban sprawl. The proposal of green axes, with their increased connectivity, besides allowing the migration of certain species, the dispersal of seeds, or even the repopulation of some patches in heterogeneous landscapes; serves mainly as transit and recreation corridors for humans, contributing to the stability of the system. In this way, connectivity aims to create a network of green spaces that can serve both humans and biodiversity.
The green axes aim to increase the benefits of existing green spaces, especially in urban areas where, as in the case of Barcelona’s urban expansion, these are scarce. They are key elements for the connection of different scales of green elements. They connect the local scale of the axes themselves and the square gardens with vegetation elements linked to buildings—façades, roofs or interiors of plots and blocks. They also connect them with elements of a higher scale, such as urban and metropolitan parks, and with various ecological connectors, e.g., Besós and Llobregat Rivers within the limits of the city of Barcelona (Figure 15). The development of a larger green area could be incorporated, such as a linear park on Roma Avenue, by Sants station, and its connection to a green corridor linking the central green axes with the environmental corridors of Rec Comtal and the Llobregat river, considered in the next metropolitan urban plan of Barcelona currently under preparation [93].
Going forward, it will be key to continue the current political momentum to further develop the planned network of the green axes. They will be public spaces with pollution levels that meet EU requirements, but do not reduce the city’s overall pollution levels. It is not clear that the reduction in private vehicles proposed in the mobility plan for 2030 can be met. Both the city climate plan and the 2030 urban agenda set goals that are based on the SDGs, but do not always specify the instruments by which they will be achieved [94,95]. The former is a sum of plans, including the current urban mobility plan, which proposes a 30% reduction in private vehicles by 2030—from 26% to 18% [50]. This target may be too ambitious, especially considering that many of the measures to reduce car use are linked to decisions at the metropolitan scale, outside the competencies of the municipal plan. The Metropolitan Urban Mobility Plan 2019–2024 [96] relegates measures to reduce private vehicle mobility by 30% to beyond 2024. In fact, no precise measures have been proposed with targets to achieve this; it will be difficult for the level of pollution to meet the environmental conditions required by the European Union.
All of this has implications for the stated objectives of improving health associated with air pollution. The Barcelona Urban Agenda 2030 [94] also refers to these plans, although it includes the public health goals set by the Barcelona Public Health Agency regarding environmental pollution [97]. However, in the same way, the health objectives of the latter assume that the objectives of the Urban Mobility Plan are met. In parallel, and at the municipal and metropolitan scale, momentum has been imparted to improving pollution levels with the 2017 metropolitan program of measures against air pollution. However, this is also a series of measures that do not really involve a reduction in the use of private vehicles, which is the main cause. The solution to pollution is on a city-wide scale. On the other hand, the discourse of superblocks according to the scheme of precincts has spread, as is the case of the Barcelona model itself and its over five hundred superblocks, which is difficult to implement [98], or the example of the city of Los Angeles, where assessments of theoretical application scenarios are being made [99]. More reasonable proposals on green axes such as those of the city of Seattle. In the coming years, it will be seen how experiences of the two models—superblocks and green axes—play out. In the case of Barcelona, the perspective for 2030 is that green axes and interior courtyards will be the only spaces that will generate areas with acceptable pollution levels.
Author Contributions
All authors have contributed equally. All authors have read and agreed to the published version of the manuscript.
Funding
This research was partially funded by Ministerio de Ciencia e Innovación of Spain, grant number PID2020-119360RB-100.
Data Availability Statement
Not applicable.
Conflicts of Interest
The authors declare no conflict of interest. The funders had no role in the design of the study; in the collection, analyses, or interpretation of data; in the writing of the manuscript; or in the decision to publish the results.
References
- United Nations. Transforming Our World: The 2030 Agenda for Sustainable Development; United Nations: New York, NY, USA, 2015. [Google Scholar]
- United Nations. New Urban Agenda; United Nations: New York, NY, USA, 2017. [Google Scholar]
- European Commission. Urban Agenda for the EU. The Pact of Amsterdam; European Commission: Amsterdam, The Netherlands, 2016.
- Ministerio de Fomento. Agenda Urbana Española; Gobierno de España: Madrid, Spain, 2019. [Google Scholar]
- Marselle, M.R.; Bowler, D.E.; Watzema, J.; Eichenberg, D.; Kirsten, T.; Bonn, A. Urban Street Tree Biodiversity and Antidepressant Prescriptions. Sci. Rep. 2020, 10, 22445. [Google Scholar] [CrossRef] [PubMed]
- Searns, R.M. The Evolution of Greenways as an Adaptive Urban Landscape Form. Landsc. Urban. Plan. 1995, 33, 65–80. [Google Scholar] [CrossRef]
- Jacobs, A.B.; Macdonald, E.; Rofé, Y.Y. The Boulevard Book: History, Evolution, Design of Multiway Boulevards; The MIT Press: Cambridge, MA, USA, 2002; ISBN 0262100908. [Google Scholar]
- Ignatieva, M.; Stewart, G.H.; Meurk, C. Planning and Design of Ecological Networks in Urban Areas. Landsc. Ecol. Eng. 2011, 7, 17–25. [Google Scholar] [CrossRef]
- Benedict, M.A.; McMahon, E.T. Green Infrastructure: Smart Conservation for the 21st Century. Renew. Resour. J. 2002, 20, 12–17. [Google Scholar]
- Jongman, R.; Pungetti, G. Ecological Networks and Greenways; Jongman, R.H.G., Pungetti, G., Eds.; Cambridge University Press: Cambridge, UK, 2004; ISBN 9780521827768. [Google Scholar]
- Monteiro, R.; Ferreira, J.; Antunes, P. Green Infrastructure Planning Principles: An Integrated Literature Review. Land 2020, 9, 525. [Google Scholar] [CrossRef]
- European Commission. Green Infrastructure (GI)—Enhancing Europe’s Natural Capital Communication from the Commission to the European Parliament, the Council, the European Economic and Social Committee and the Committee of the Regions. 2013. Available online: https://eur-lex.europa.eu/legal-content/EN/TXT/?uri=celex%3A52013DC0249 (accessed on 16 April 2023).
- Van Oijstaeijen, W.; Van Passel, S.; Cools, J. Urban Green Infrastructure: A Review on Valuation Toolkits from an Urban Planning Perspective. J. Env. Manag. 2020, 267, 110603. [Google Scholar] [CrossRef]
- Lafortezza, R.; Davies, C.; Sanesi, G.; Konijnendijk, C. Green Infrastructure as a Tool to Support Spatial Planning in European Urban Regions. IForest 2013, 6, 102–108. [Google Scholar] [CrossRef]
- Vlahov, D.; Freudenberg, N.; Proietti, F.; Ompad, D.; Quinn, A.; Nandi, V.; Galea, S. Urban as a Determinant of Health. J. Urban. Health 2007, 84, 16–26. [Google Scholar] [CrossRef]
- Dzhambov, A.M.; Lercher, P.; Browning, M.H.E.M.; Stoyanov, D.; Petrova, N.; Novakov, S.; Dimitrova, D.D. Does Greenery Experienced Indoors and Outdoors Provide an Escape and Support Mental Health during the COVID-19 Quarantine? Environ. Res. 2021, 196, 110420. [Google Scholar] [CrossRef]
- Mitchell, R.J.; Richardson, E.A.; Shortt, N.K.; Pearce, J.R. Neighborhood Environments and Socioeconomic Inequalities in Mental Well-Being. Am. J. Prev. Med. 2015, 49, 80–84. [Google Scholar] [CrossRef]
- Barton, H. A Health Map for Urban Planners. Built Environ. 2005, 31, 339–355. [Google Scholar] [CrossRef]
- Barton, H.; Grant, M. A Health Map for the Local Human Habitat. J. R. Soc. Promot. Health 2006, 126, 252–253. [Google Scholar] [CrossRef] [PubMed]
- Nieuwenhuijsen, M.J. Urban and Transport Planning, Environmental Exposures and Health-New Concepts, Methods and Tools to Improve Health in Cities. Environ. Health 2016, 15, S38. [Google Scholar] [CrossRef]
- Khreis, H.; May, A.D.; Nieuwenhuijsen, M.J. Health Impacts of Urban Transport Policy Measures: A Guidance Note for Practice. J. Transp. Health 2017, 6, 209–227. [Google Scholar] [CrossRef]
- Hartig, T.; Mitchell, R.; de Vries, S.; Frumkin, H. Nature and Health. Annu. Rev. Public. Health 2014, 35, 207–228. [Google Scholar] [CrossRef] [PubMed]
- Guarnieri, M.; Balmes, J.R. Outdoor Air Pollution and Asthma. Lancet 2014, 383, 1581–1592. [Google Scholar] [CrossRef]
- Goines, L.; Hagler, L. Noise Pollution: A Modern Plague. South. Med. J. 2007, 100, 287–294. [Google Scholar] [CrossRef]
- Stansfeld, S.A.; Matheson, M.P. Noise Pollution: Non-Auditory Effects on Health. Br. Med. Bull. 2003, 68, 243–257. [Google Scholar] [CrossRef]
- Gascon, M.; Marquet, O.; Gràcia-Lavedan, E.; Ambròs, A.; Götschi, T.; de Nazelle, A.; Panis, L.I.; Gerike, R.; Brand, C.; Dons, E.; et al. What Explains Public Transport Use? Evidence from Seven European Cities. Transp. Policy 2020, 99, 362–374. [Google Scholar] [CrossRef]
- Gascon, M.; Götschi, T.; de Nazelle, A.; Gracia, E.; Ambròs, A.; Márquez, S.; Marquet, O.; Avila-Palencia, I.; Brand, C.; Iacorossi, F.; et al. Correlates of Walking for Travel in Seven European Cities: The PASTA Project. Environ. Health Perspect. 2019, 127, 097003. [Google Scholar] [CrossRef]
- Mueller, N.; Rojas-Rueda, D.; Salmon, M.; Martinez, D.; Ambros, A.; Brand, C.; de Nazelle, A.; Dons, E.; Gaupp-Berghausen, M.; Gerike, R.; et al. Health Impact Assessment of Cycling Network Expansions in European Cities. Prev. Med. 2018, 109, 62–70. [Google Scholar] [CrossRef] [PubMed]
- Nieuwenhuijsen, M.J.; Khreis, H.; Triguero-Mas, M.; Gascon, M.; Dadvand, P. Fifty Shades of Green. Epidemiology 2017, 28, 63–71. [Google Scholar] [CrossRef] [PubMed]
- Labib, S.M.; Lindley, S.; Huck, J.J. Spatial Dimensions of the Influence of Urban Green-Blue Spaces on Human Health: A Systematic Review. Environ. Res. 2020, 180, 108869. [Google Scholar] [CrossRef]
- Rydin, Y.; Bleahu, A.; Davies, M.; Dávila, J.D.; Friel, S.; De Grandis, G.; Groce, N.; Hallal, P.C.; Hamilton, I.; Howden-Chapman, P.; et al. Shaping Cities for Health: Complexity and the Planning of Urban Environments in the 21st Century. Lancet 2012, 379, 2079–2108. [Google Scholar] [CrossRef]
- Mehta, V. Lively Streets. J. Plan. Educ. Res. 2007, 27, 165–187. [Google Scholar] [CrossRef]
- Pérez, K.; Olabarria, M.; Rojas-Rueda, D.; Santamariña-Rubio, E.; Borrell, C.; Nieuwenhuijsen, M. The Health and Economic Benefits of Active Transport Policies in Barcelona. J. Transp. Health 2017, 4, 316–324. [Google Scholar] [CrossRef]
- Jacobsen, P.L. Safety in Numbers: More Walkers and Bicyclists, Safer Walking and Bicycling. Inj. Prev. 2003, 9, 205–209. [Google Scholar] [CrossRef]
- Vásquez-Vera, H.; Palència, L.; Magna, I.; Mena, C.; Neira, J.; Borrell, C. The Threat of Home Eviction and Its Effects on Health through the Equity Lens: A Systematic Review. Soc. Sci. Med. 2017, 175, 199–208. [Google Scholar] [CrossRef]
- Lees, L. The Geography of Gentrification. Prog. Hum. Geogr. 2012, 36, 155–171. [Google Scholar] [CrossRef]
- Quinton, J.; Nesbitt, L.; Sax, D. How Well Do We Know Green Gentrification? A Systematic Review of the Methods. Prog. Hum. Geogr. 2022, 46, 960–987. [Google Scholar] [CrossRef]
- Mehdipanah, R.; Manzano, A.; Borrell, C.; Malmusi, D.; Rodriguez-Sanz, M.; Greenhalgh, J.; Muntaner, C.; Pawson, R. Exploring Complex Causal Pathways between Urban Renewal, Health and Health Inequality Using a Theory-Driven Realist Approach. Soc. Sci. Med. 2015, 124, 266–274. [Google Scholar] [CrossRef]
- Bausells, M. Superblocks to the Rescue: Barcelona’s Plan to Give Streets Back to Residents. The Guardian. 17 May 2016. Available online: https://www.theguardian.com/cities/2016/may/17/superblocks-rescue-barcelona-spain-plan-give-streets-back-residents (accessed on 16 April 2023).
- Wen, X. Beijing Improves Conditions for Cyclists. China Daily, 8 February 2023. Available online: https://global.chinadaily.com.cn/a/202302/08/WS63e2daeba31057c47ebad793_5.html(accessed on 16 April 2023).
- Hu, W. What New York Can Learn from Barcelona’s ‘Superblocks’—The New York Times. The New York Times. 30 September 2016. Available online: https://www.nytimes.com/2016/10/02/nyregion/what-new-york-can-learn-from-barcelonas-superblocks.html (accessed on 16 April 2023).
- Eggimann, S. The Potential of Implementing Superblocks for Multifunctional Street Use in Cities. Nat. Sustain. 2022, 5, 406–414. [Google Scholar] [CrossRef] [PubMed]
- Rueda, S. Superblocks for the Design of New Cities and Renovation of Existing Ones: Barcelona’s Case. In Integrating Human Health into Urban and Transport Planning: A Framework; Springer International Publishing: Cham, Switzerland, 2018; pp. 135–153. ISBN 9783319749839. [Google Scholar]
- Ajuntament de Barcelona. Medida de Gobierno. Superilla Barcelona Para Regenerar Barcelona y Sus Barrios; Ajuntament de Barcelona: Barcelona, Spain, 2021; Available online: http://hdl.handle.net/11703/126249 (accessed on 6 March 2023).
- Mehdipanah, R.; Novoa, A.M.; León-Gómez, B.B.; López, M.J.; Palència, L.; Vasquez, H.; Díez, È.; Borrell, C.; Pérez, K. Effects of Superblocks on Health and Health Inequities: A Proposed Evaluation Framework. J. Epidemiol. Community Health 2019, 73, 585–588. [Google Scholar] [CrossRef]
- Palència, L.; León-Gómez, B.B.; Bartoll, X.; Carrere, J.; Díez, E.; Font-Ribera, L.; Gómez, A.; López, M.J.; Marí-Dell’Olmo, M.; Mehdipanah, R.; et al. Study Protocol for the Evaluation of the Health Effects of Superblocks in Barcelona: The “Salut Als Carrers” (Health in the Streets) Project. Int. J. Env. Res. Public. Health 2020, 17, 2956. [Google Scholar] [CrossRef] [PubMed]
- Rueda, S. Barcelona, Ciutat Mediterrània, Compacta i Complexa. Una Visió de Futur Mes Sostenible; Ajuntament de Barcelona: Barcelona, Spain, 2002. [Google Scholar]
- Departament de Territori i sostenibilitat. Generalitat de Catalunya; Centre de Sostenibilitat Territorial (CST); UPC-EXIT IntraScapeLab; Promoció Transport Públic (PTP); Vincles Projecte Respira; Generalitat de Catalunya: Barcelona, Spain, 2013. [Google Scholar]
- Ajuntament de Barcelona. Pla de Mobilitat Urbana de Barcelona (2013–2018); Ajuntament de Barcelona: Barcelona, Spain, 2014. [Google Scholar]
- Gerència d’Àrea d’Ecologia Urbana. Gerència de Mobilitat i Infraestructures Pla de Mobilitat Urbana 2024; Ajuntament de Barcelona: Barcelona, Spain, 2022; Available online: http://hdl.handle.net/11703/128157 (accessed on 6 March 2023).
- Comissió d’Ecologia, Urbanisme i Mobilitat. Mesura de Govern. Omplim de Vida Els Carrers. La Implantació de Les Superilles a Barcelona; Ajuntament de Barcelona: Barcelona, Spain, 2016; Available online: https://bcnroc.ajuntament.barcelona.cat/jspui/bitstream/11703/97356/1/mesuradegovernomplimdevidaelscarrerslaimplantacidelessuperi-160518111846.pdf (accessed on 6 March 2023).
- Medi Ambient i Serveis Urbans. Habitat Urbà Pla Del Verd i de La Biodiversitat de Barcelona 2020; Ajuntament de Barcelona: Barcelona, Spain, 2013. [Google Scholar]
- Gerencia d’Àrea d’Ecologia Urbana. Ajuntament de Barcelona Pla Natura Barcelona 2021–2030; Ajuntament de Barcelona: Barcelona, Spain, 2021. [Google Scholar]
- Herce, M.; Magrinyà, F.; Miró, J. L’espai Urbà de La. Mobilitat; Edicions UPC: Barcelona, Spain, 2007. [Google Scholar]
- Gerència de Mobilitat i Infraestructures; Ajuntament de Barcelona; Barcelona Regional. Diagnosis Del Plan de Resiliencia. ¿Dónde Se Encuentra La Población Con Una Menor Proximidad a Los Espacios Verdes de La Ciudad? Ajuntament de Barcelona: Barcelona, 2020. [Google Scholar]
- Ajuntament de Barcelona. Superilla Barcelona. Model Nous Eixos Verds 2021; Ajuntament de Barcelona: Barcelona, Spain. Available online: https://ajuntament.barcelona.cat/superilles/sites/default/files/model_eixos_verds_web.pdf (accessed on 6 March 2023).
- Open Data BCN Proximity to Public Green Spaces in the City of Barcelona. Available online: https://opendata-ajuntament.barcelona.cat/data/dataset/proximitat-espais-verds (accessed on 27 February 2023).
- Esri ArcGIS Pro Redlands; Environmental Systems Research Institute: Redlands, CA, USA, 2021.
- Barbosa, O.; Tratalos, J.A.; Armsworth, P.R.; Davies, R.G.; Fuller, R.A.; Johnson, P.; Gaston, K.J. Who Benefits from Access to Green Space? A Case Study from Sheffield, UK. Landsc. Urban. Plan. 2007, 83, 187–195. [Google Scholar] [CrossRef]
- Nielsen, H.; Bronwen Player, K.M. Urban Green Spaces and Health. A Review of Evidence; World Health Organization Regional Office for Europe: Copenhagen, Denmark, 2016.
- Moreno, C. Droit de Cité, de La “Ville-Monde” à La “Ville Du Quart d’heure”; Editions de l’Observatoire: Paris, France, 2020. [Google Scholar]
- Open Data BCN Urban Data of the City Blocks in Barcelona. Available online: https://opendata-ajuntament.barcelona.cat/data/en/dataset/taula-map-illa (accessed on 23 February 2023).
- European Conference on Sustainable Cities & Towns. Charter of European Cities & Towns towards Sustainability Consensus Declaration: European Cities & Towns towards Sustainability; European Conference on Sustainable Cities & Towns: Aalborg, Denmark, 1994; Available online: https://sustainablecities.eu/fileadmin/repository/Aalborg_Charter/Aalborg_Charter_English.pdf (accessed on 6 March 2023).
- Ajuntament de Barcelona. Pla de Vies Barcelona: Materials Pel Seminari de Vies; Ajuntament de Barcelona: Barcelona, Spain, 1984. [Google Scholar]
- Kotsila, P.; Anguelovski, I.; Baró, F.; Langemeyer, J.; Sekulova, F.; Connolly, J.J.T. Nature-Based Solutions as Discursive Tools and Contested Practices in Urban Nature’s Neoliberalisation Processes. Environ. Plan. E Nat. Space 2021, 4, 252–274. [Google Scholar] [CrossRef]
- Àrea d’Hàbitat Urbà. Ajuntament de Barcelona Esquema Director de Les Portes de Collserola a Barcelona; Ajuntament de Barcelona: Barcelona, Spain, 2011; Available online: http://hdl.handle.net/11703/84703 (accessed on 6 March 2023).
- Jordi, M. Pla Urbanístic de Les Portes de Collserola; Ajuntament de Barcelona: Barcelona, Spain, 2011. [Google Scholar]
- Magrinyà, F. Plan Buits de Barcelona. In Innovación Social y Políticas Urbanas en España; Subirats, J., García-Bernardos, A., Eds.; Icaria Editorial: Barcelona, Spain, 2015; pp. 307–324. [Google Scholar]
- Guallart, V. The Self-Sufficient City; IAAC + Actar: Barcelona, Spain, 2014. [Google Scholar]
- Martí, G. Una Ciutat Més Humana. La Vanguardia, 15 March 2014. Available online: https://www.lavanguardia.com/mon-barcelona/20140315/54403113839/ciutat-illes-superilles-smart-barris-cohessio.html(accessed on 6 March 2023).
- Pérez, L.; Sunyer, J.; Künzli, N. Estimating the Health and Economic Benefits Associated with Reducing Air Pollution in the Barcelona Metropolitan Area (Spain). Gac. Sanit. 2009, 23, 287–294. [Google Scholar] [CrossRef]
- Cyrys, J.; Eeftens, M.; Heinrich, J.; Ampe, C.; Armengaud, A.; Beelen, R.; Bellander, T.; Beregszaszi, T.; Birk, M.; Cesaroni, G.; et al. Variation of NO2 and NOx Concentrations between and within 36 European Study Areas: Results from the ESCAPE Study. Atmos. Environ. 2012, 62, 374–390. [Google Scholar] [CrossRef]
- Querol, X. Speciation and Origin of PM10 and PM2.5 in Selected European Cities. Atmos. Environ. 2004, 38, 6547–6555. [Google Scholar]
- Subirats, J.; Garcia-Bernardos, A. Innovación Social y Políticas Urbanas En España; Icaria: Barcelona, Spain, 2015. [Google Scholar]
- Pey, J.; Querol, X.; Alastuey, A.; Rodríguez, S.; Putaud, J.P.; Van Dingenen, R. Source Apportionment of Urban Fine and Ultra-Fine Particle Number Concentration in a Western Mediterranean City. Atmos. Environ. 2009, 43, 4407–4415. [Google Scholar] [CrossRef]
- Zografos, C.; Klause, K.A.; Connolly, J.J.T.; Anguelovski, I. The Everyday Politics of Urban Transformational Adaptation: Struggles for Authority and the Barcelona Superblock Project. Cities 2020, 99, 102613. [Google Scholar] [CrossRef]
- Gerència d’Àrea d’Ecologia Urbana. Ajuntament de Barcelona Superilles Barcelona. Available online: https://ajuntament.barcelona.cat/superilles/es/ (accessed on 23 February 2023).
- O’Sullivan, F. Barcelona’s Superblocks Expand, but Face Protests—Bloomberg. Available online: https://www.bloomberg.com/news/articles/2017-01-20/barcelona-s-superblocks-expand-but-face-protests (accessed on 7 March 2023).
- Oliver, A.; Pearl, D.S. Rethinking Sustainability Frameworks in Neighbourhood Projects: A Process-Based Approach. Build. Res. Inf. 2018, 46, 513–527. [Google Scholar] [CrossRef]
- Gerència d’Àrea d’Ecologia Urbana. Ajuntament de Barcelona Pla d’Acció Consensuat per a l’àmbit de Superilles de Sant Antoni; Ajuntament de Barcelona: Barcelona, Spain, 2017. [Google Scholar]
- Ajuntament de Barcelona. Barcelona Superblock. Towards the City We Want; Ajuntament de Barcelona: Barcelona, Spain, 2021. [Google Scholar]
- Ajuntament de Barcelona. 2023 Horizon Action Map. Green Axes and Square Gardens; Ajuntament de Barcelona: Barcelona, Spain, 2023; Available online: https://ajuntament.barcelona.cat/superilles/sites/default/files/mapa_eixample_concurs_web.pdf (accessed on 6 March 2023).
- Ajuntament de Barcelona. Plec de Prescripcions Tècniques per al Disseny, l’execució i La Recepció d’espais Verds; Ajuntament de Barcelona: Barcelona, Spain, 2020. [Google Scholar]
- Ow, L.F.; Ghosh, S. Urban Tree Growth and Their Dependency on Infiltration Rates in Structural Soil and Structural Cells. Urban. Urban. Green. 2017, 26, 41–47. [Google Scholar] [CrossRef]
- Ow, L.F.; Ghosh, S. Growth of Street Trees in Urban Ecosystems: Structural Cells and Structural Soil. J. Urban. Ecol. 2017, 3, jux017. [Google Scholar] [CrossRef]
- Ajuntament de Barcelona. Así Serán Los Nuevos Ejes Verdes y Plazas Del Eixample|Superilles; Ajuntament de Barcelona: Barcelona, Spain. Available online: https://ajuntament.barcelona.cat/superilles/es/content/asi-seran-las-nuevas-plaza-y-ejes-verdes-eixample (accessed on 4 March 2023).
- Generalitat de Catalunya. Pla Territorial Metropolità de Barcelona 2010; Generalitat de Catalunya: Barcelona, Spain, 2010; Available online: https://territori.gencat.cat/ca/01_departament/05_plans/01_planificacio_territorial/plans_territorials_nou/territorials_parcials/ptp_metropolita_de_barcelona/ (accessed on 6 March 2023).
- Forman, R.T.T. Mosaico Territorial Para La Región Metropolitana de Barcelona; Gustavo Gili: Barcelona, Spain, 2004; ISBN 9788425219719. [Google Scholar]
- Rottle, N.; Maryman, B. Open Space Seattle 2100—Green Futures LabGreen Futures Lab; University of Washington: Seattle, WA, USA, 2006; Available online: https://depts.washington.edu/open2100/ (accessed on 6 March 2023).
- Anguelovski, I.; Connolly, J.J.T.; Masip, L.; Pearsall, H. Assessing Green Gentrification in Historically Disenfranchised Neighborhoods: A Longitudinal and Spatial Analysis of Barcelona. Urban. Geogr. 2018, 39, 458–491. [Google Scholar] [CrossRef]
- Triguero-Mas, M.; Anguelovski, I.; Connolly, J.J.T.; Martin, N.; Matheney, A.; Cole, H.V.S.; Pérez-Del-Pulgar, C.; García-Lamarca, M.; Shokry, G.; Argüelles, L.; et al. Exploring Green Gentrification in 28 Global North Cities: The Role of Urban Parks and Other Types of Greenspaces. Environ. Res. Lett. 2022, 17, 104035. [Google Scholar] [CrossRef]
- Oscilowicz, E.; Anguelovski, I.; Triguero-Mas, M.; García-Lamarca, M.; Baró, F.; Cole, H.V.S. Green Justice through Policy and Practice: A Call for Further Research into Tools That Foster Healthy Green Cities for All. Cities Health 2022, 6, 878–893. [Google Scholar] [CrossRef]
- Area Metropolitana de Barcelona. Nova Fase—Metròpolis Barcelona; Area Metropolitana de Barcelona: Barcelona, Spain. Available online: https://urbanisme.amb.cat/nova-fase1 (accessed on 6 March 2023).
- Comissionat d’Agenda Urbana 2030; Ajuntament de Barcelona. L’Agenda 2030 de Barcelona. Fites ODS i Indicadors Clau 2020; Ajuntament de Barcelona: Barcelona, Spain. Available online: https://ajuntament.barcelona.cat/agenda2030/sites/default/files/2021-01/Agenda%202030%20de%20Barcelona.%20Fites%20ODS%20i%20indicadors%20clau_0.pdf (accessed on 6 March 2023).
- Gerència d’Àrea d’Ecologia Urbana. Ajuntament de Barcelona Pla d’acció per l’emergència Climàtica 2030; Ajuntament de Barcelona: Barcelona, Spain, 2021. [Google Scholar]
- Area Metropolitana de Barcelona. Metropolitan Urban Mobility Plan 2019–2024; Synthesis of the Plan Area Metropolitana de Barcelona: Barcelona, Spain, 2020. [Google Scholar]
- Agència de Salut Pública de Barcelona. Avaluació de La Qualitat de l’aire a Barcelona; Agència de Salut Pública: Barcelona, Spain, 2020. [Google Scholar]
- Mueller, N.; Rojas-Rueda, D.; Khreis, H.; Cirach, M.; Andrés, D.; Ballester, J.; Bartoll, X.; Daher, C.; Deluca, A.; Echave, C.; et al. Changing the Urban Design of Cities for Health: The Superblock Model. Environ. Int. 2020, 134, 105132. [Google Scholar] [CrossRef]
- Li, K.; Wilson, J.P. Modeling the Health Benefits of Superblocks across the City of Los Angeles. Appl. Sci. 2023, 13, 2095. [Google Scholar] [CrossRef]
Figure 1.
Green spaces in the city of Barcelona and green axes (dotted green lines) foreseen in the Barcelona Superblock strategy Source: Ajuntament de Barcelona [44].
Figure 1.
Green spaces in the city of Barcelona and green axes (dotted green lines) foreseen in the Barcelona Superblock strategy Source: Ajuntament de Barcelona [44].

Figure 2.
Barcelona districts and green spaces: (top) scenario 0, before the implementation of the green axes; (middle) scenario 1, with the green axes in L’Eixample district; and (bottom) scenario 2, with the green axes in L’Eixample and Sant Martí districts. The crossings between green axes constitute green spaces of 0.5 hectare square gardens that are highlighted in the maps. Source: the authors based on municipal data.

Figure 3.
(Left) Vegetation scheme in the green axes within the usual set of tree vegetation in Barcelona’s urban expansion area. (Right) A 0.5-hectare area at the intersection between green axes Source: the authors, based on Ajuntament de Barcelona [56].
Figure 3.
(Left) Vegetation scheme in the green axes within the usual set of tree vegetation in Barcelona’s urban expansion area. (Right) A 0.5-hectare area at the intersection between green axes Source: the authors, based on Ajuntament de Barcelona [56].

Figure 4.
(Top) The 1984 Road Plan. Source: Ajuntament de Barcelona [64]; (Bottom) Superblocks Plan of 2002 (green areas delimited by white lines) included in the Urban Mobility Plan (2013–2018) Source: Ajuntament de Barcelona [49].

Figure 5.
The homogeneous street network of Cerda’s extension (current 2013 model, model actual) vs. the superblock model proposed in Barcelona Urban Mobility Plan 2013–2018 (superblock model, model Superilles). Source: Ajuntament de Barcelona [49].
Figure 5.
The homogeneous street network of Cerda’s extension (current 2013 model, model actual) vs. the superblock model proposed in Barcelona Urban Mobility Plan 2013–2018 (superblock model, model Superilles). Source: Ajuntament de Barcelona [49].

Figure 6.
Pilot areas (in green) for the implementation of 5 superblocks in Barcelona, according to the Urban Mobility Plan 2013–2018. Source: La Vanguardia [70].
Figure 6.
Pilot areas (in green) for the implementation of 5 superblocks in Barcelona, according to the Urban Mobility Plan 2013–2018. Source: La Vanguardia [70].

Figure 7.
Proposed health routes (dotted red lines) linked to pedestrian and cycling routes (green lines) in the L’Eixample district (highlighted in yellow). The axes were not called green yet, although they were represented in this color. Source: Generalitat de Catalunya [48].
Figure 7.
Proposed health routes (dotted red lines) linked to pedestrian and cycling routes (green lines) in the L’Eixample district (highlighted in yellow). The axes were not called green yet, although they were represented in this color. Source: Generalitat de Catalunya [48].

Figure 8.
Explanatory diagram of the introduction of the green/civic axes on the model of the organization in superblocks of three by three of the homogeneous grid of the urban expansion. Source: Ajuntament de Barcelona [51].
Figure 8.
Explanatory diagram of the introduction of the green/civic axes on the model of the organization in superblocks of three by three of the homogeneous grid of the urban expansion. Source: Ajuntament de Barcelona [51].

Figure 9.
Implementation of the superblocks in the Sant Antoni neighborhood of L’Eixample district of Barcelona. (Top) Proposed system of civic axes (streets highlighted in green) for the entire L’Eixample district. (Bottom) Organization of motorized traffic directions, planned for higher (red lines), medium (orange lines), and lower (green lines) speeds and flows. At the intersection of civic axes (green lines) motorized traffic does not have longitudinal continuity and must turn. Source: Ajuntament de Barcelona [80].

Figure 10.
Diagram showing the change of approach of the Barcelona City Council. From a strategy based on local actions in self-contained superblocks (in light yellow) affecting a portion of a neighborhood, to an implementation through continuous district or city-scale green axes (thick green lines). Source: Ajuntament de Barcelona [81].

Figure 11.
Plan to execute 21 km of green axes in L’Eixample district before 2030. Green axes executed in Sant Antoni in 2018 (dark green), green axes (continuous green lines) and square gardens (red dots) to be built by 2023, and planned green axes (dashed green lines) [82].
Figure 11.
Plan to execute 21 km of green axes in L’Eixample district before 2030. Green axes executed in Sant Antoni in 2018 (dark green), green axes (continuous green lines) and square gardens (red dots) to be built by 2023, and planned green axes (dashed green lines) [82].

Figure 12.
Main actions for the configuration of green axes as green infrastructure and active mobility. In the subsoil, distribution of soil for continuity of roots (bottom-left) and rainwater filtration (bottom-right). On the ground, priority area for active mobility and stationary activities (top-right). At the aerial level, development of trees and other plant species (top-left). Source: Ajuntament de Barcelona [56].

Figure 13.
Typical distribution of spaces in a green axis in a standard 20-m-wide street, including pedestrian safe zones by the buildings (services below), planting areas and shared spaces (with structural soil underneath). Source: Adapted from Ajuntament de Barcelona [56].
Figure 13.
Typical distribution of spaces in a green axis in a standard 20-m-wide street, including pedestrian safe zones by the buildings (services below), planting areas and shared spaces (with structural soil underneath). Source: Adapted from Ajuntament de Barcelona [56].

Figure 14.
Images of the green axis project of Girona street (top) and square garden at the intersection between Consell de Cent and Rocafort (bottom). Source: Ajuntament de Barcelona [86].
Figure 14.
Images of the green axis project of Girona street (top) and square garden at the intersection between Consell de Cent and Rocafort (bottom). Source: Ajuntament de Barcelona [86].

Figure 15.
Green and Biodiversity Plan (2012–2020) showing urban green corridors, green areas and urban fabrics with significant presence of vegetation for private use Source: Ajuntament de Barcelona [52].
Figure 15.
Green and Biodiversity Plan (2012–2020) showing urban green corridors, green areas and urban fabrics with significant presence of vegetation for private use Source: Ajuntament de Barcelona [52].

Figure 16.
Number of inhabitants in Barcelona per block according to the census, and location of green areas of 0.5 hectare. Source: the authors based on data from Open Data BCN [57,62].

Figure 17.
Proximity to green areas in the city of Barcelona, with 5, 10, and 15 min isochrones for a traveling speed of 2 km/h: (top) scenario 0, current situation; (middle) scenario 1, green axes and square gardens in L’Eixample district in 2030; and (bottom) scenario 2, square gardens and green axes extended to Sant Martí district. Source: the authors, based on a map from Open Data BCN [57].


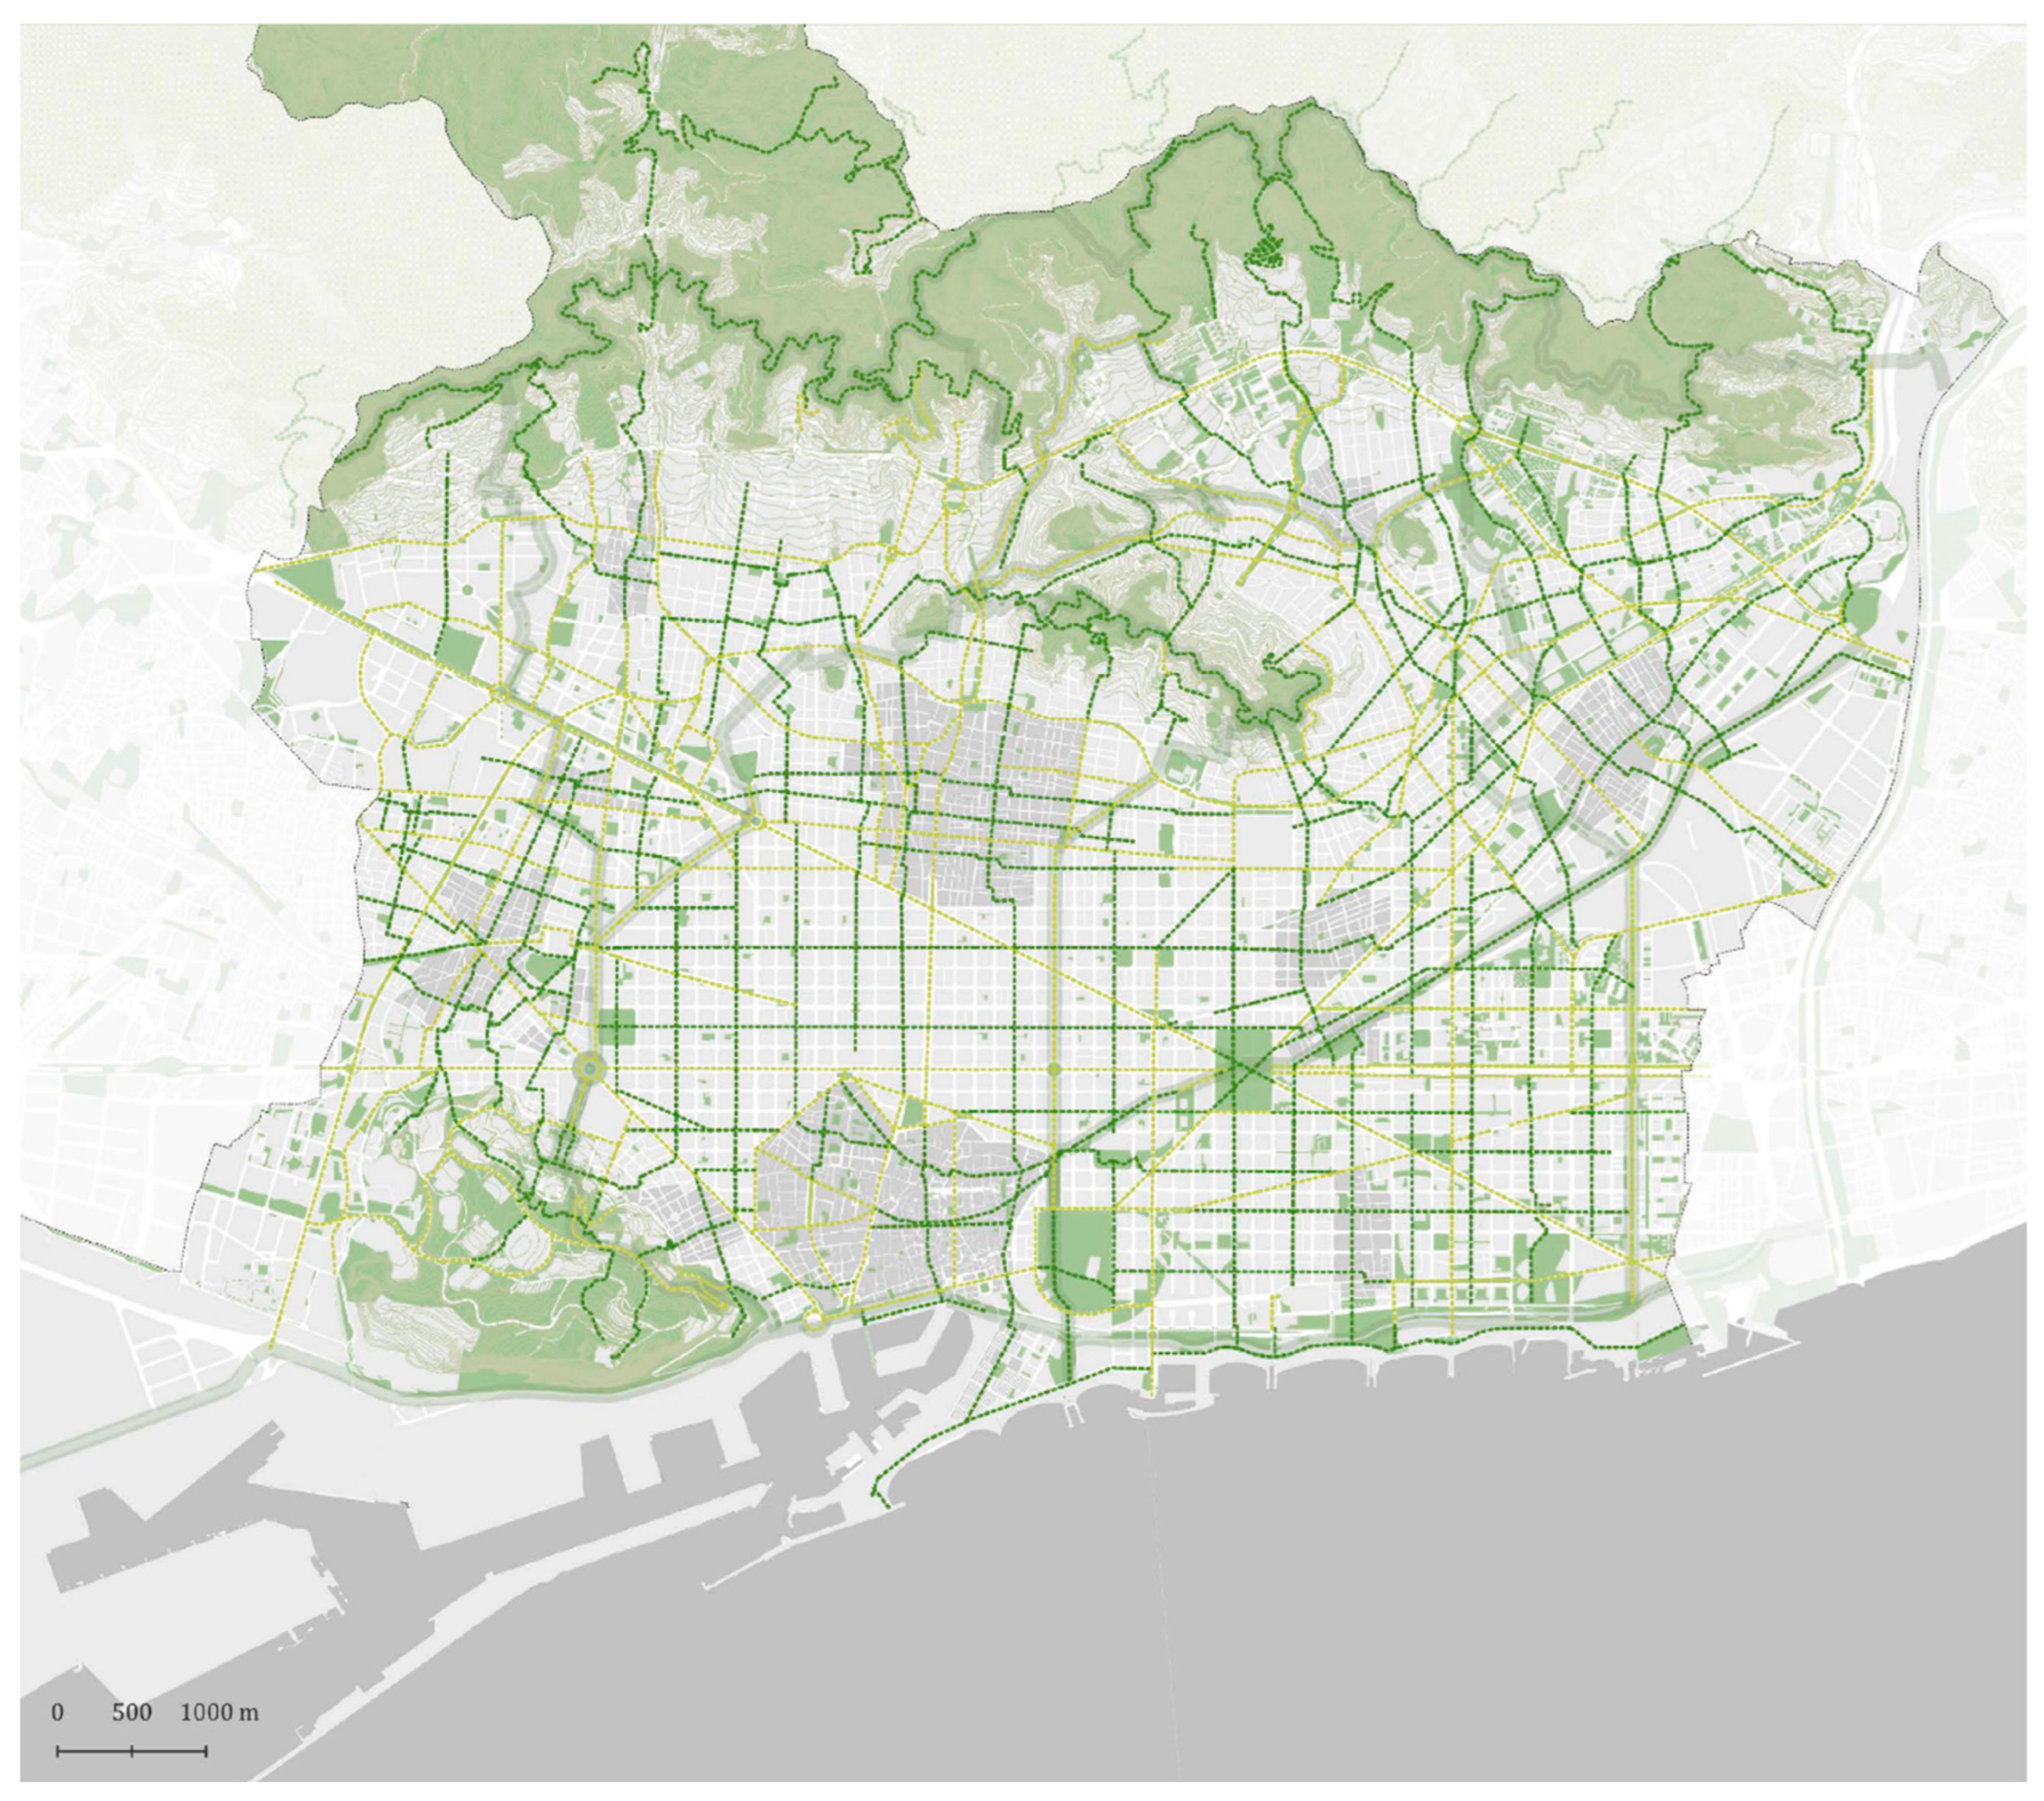
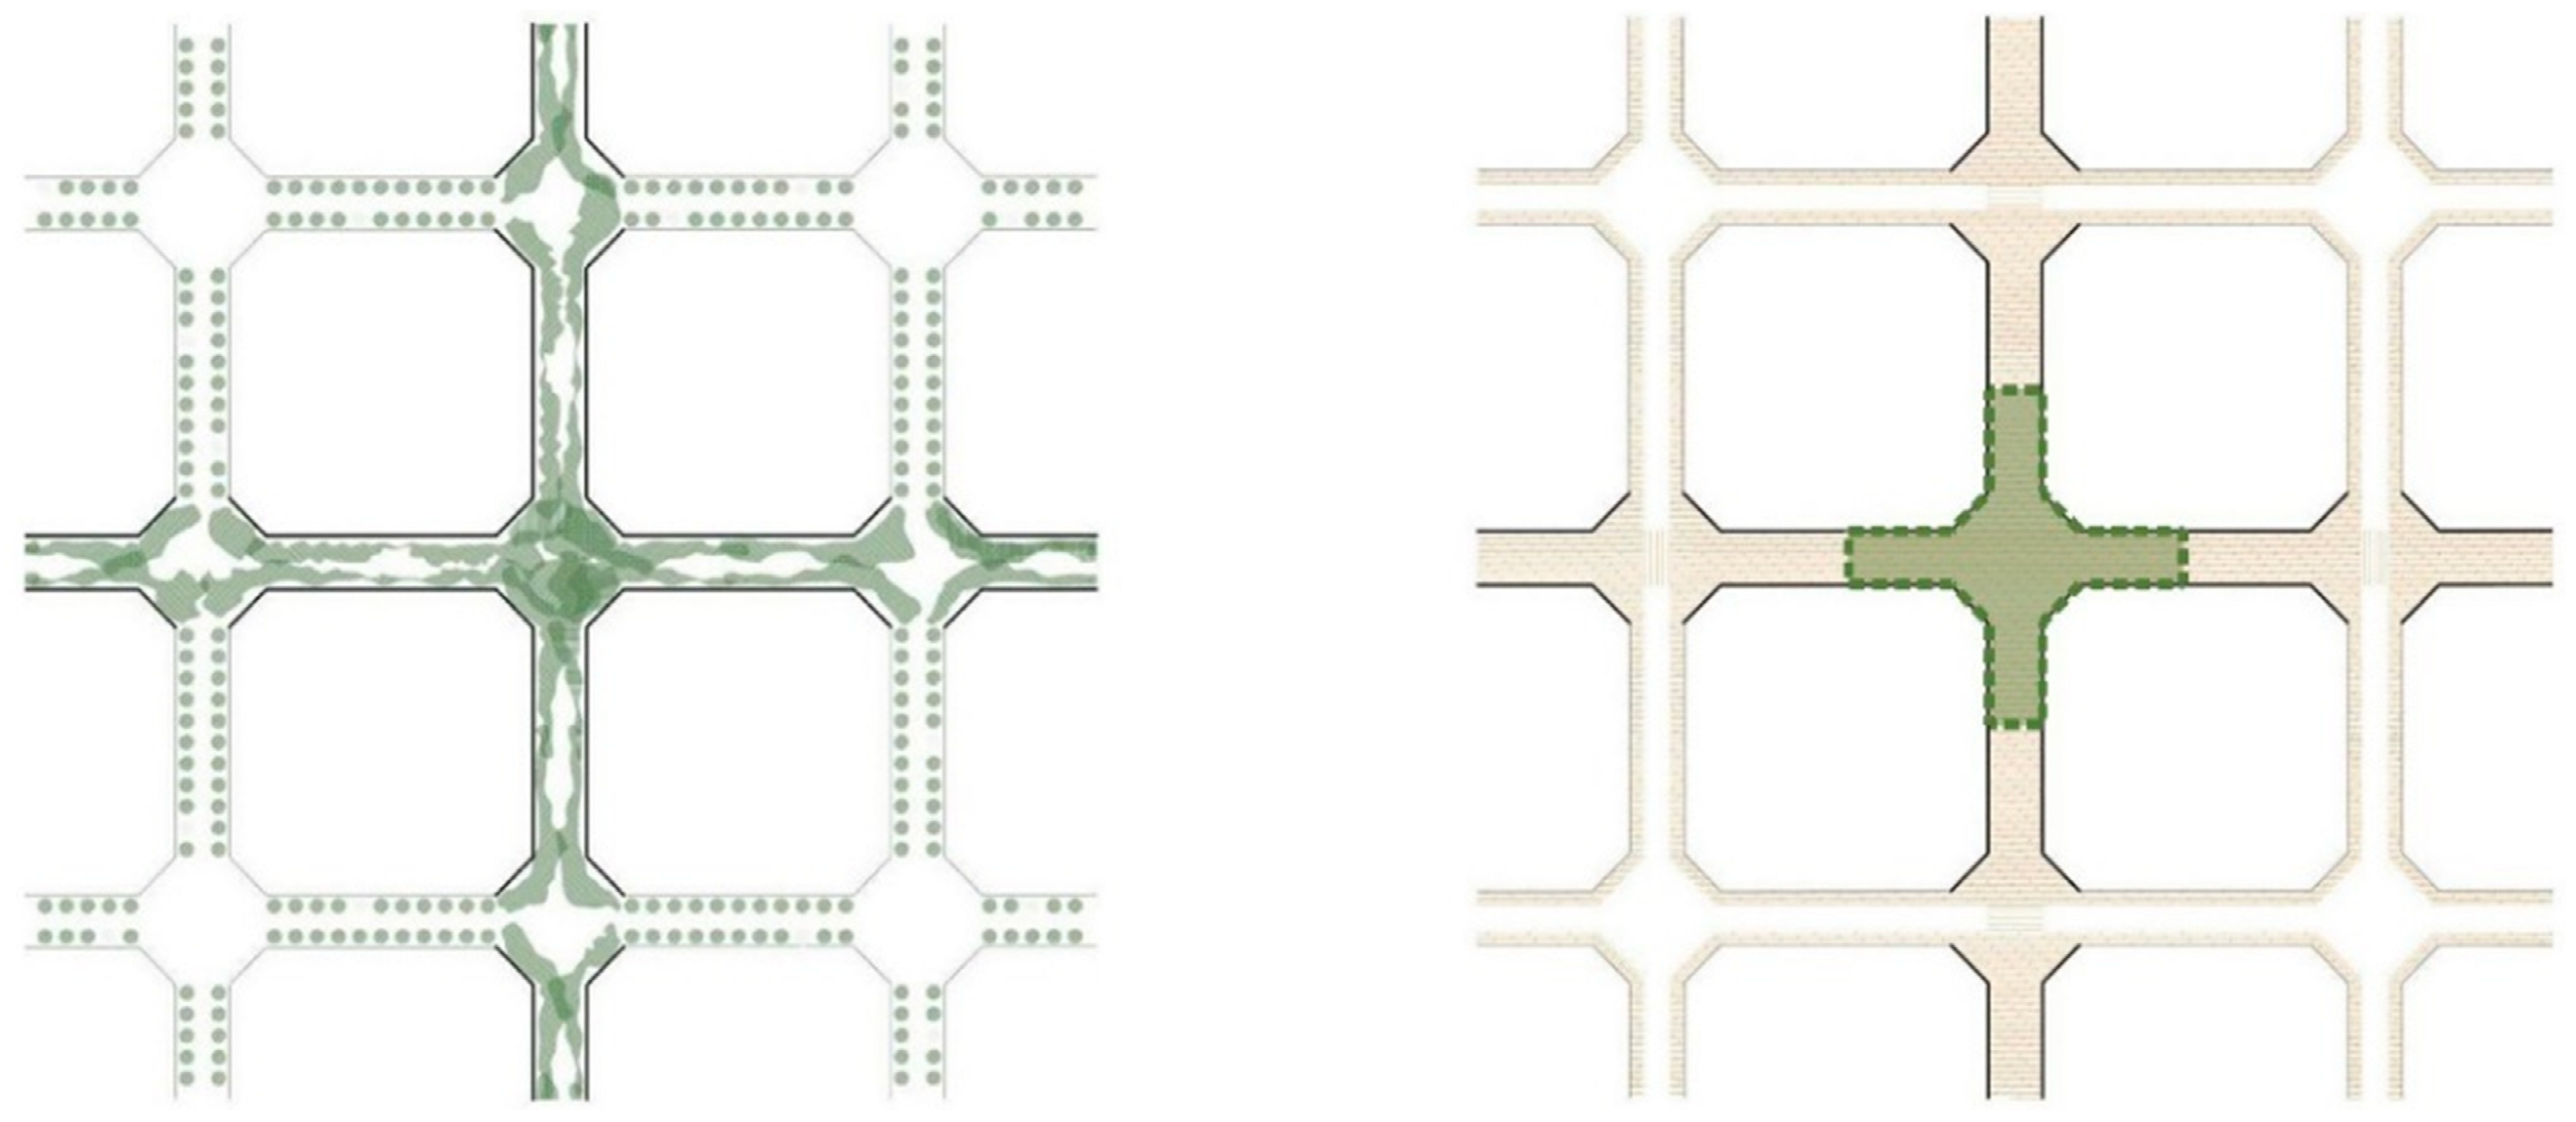
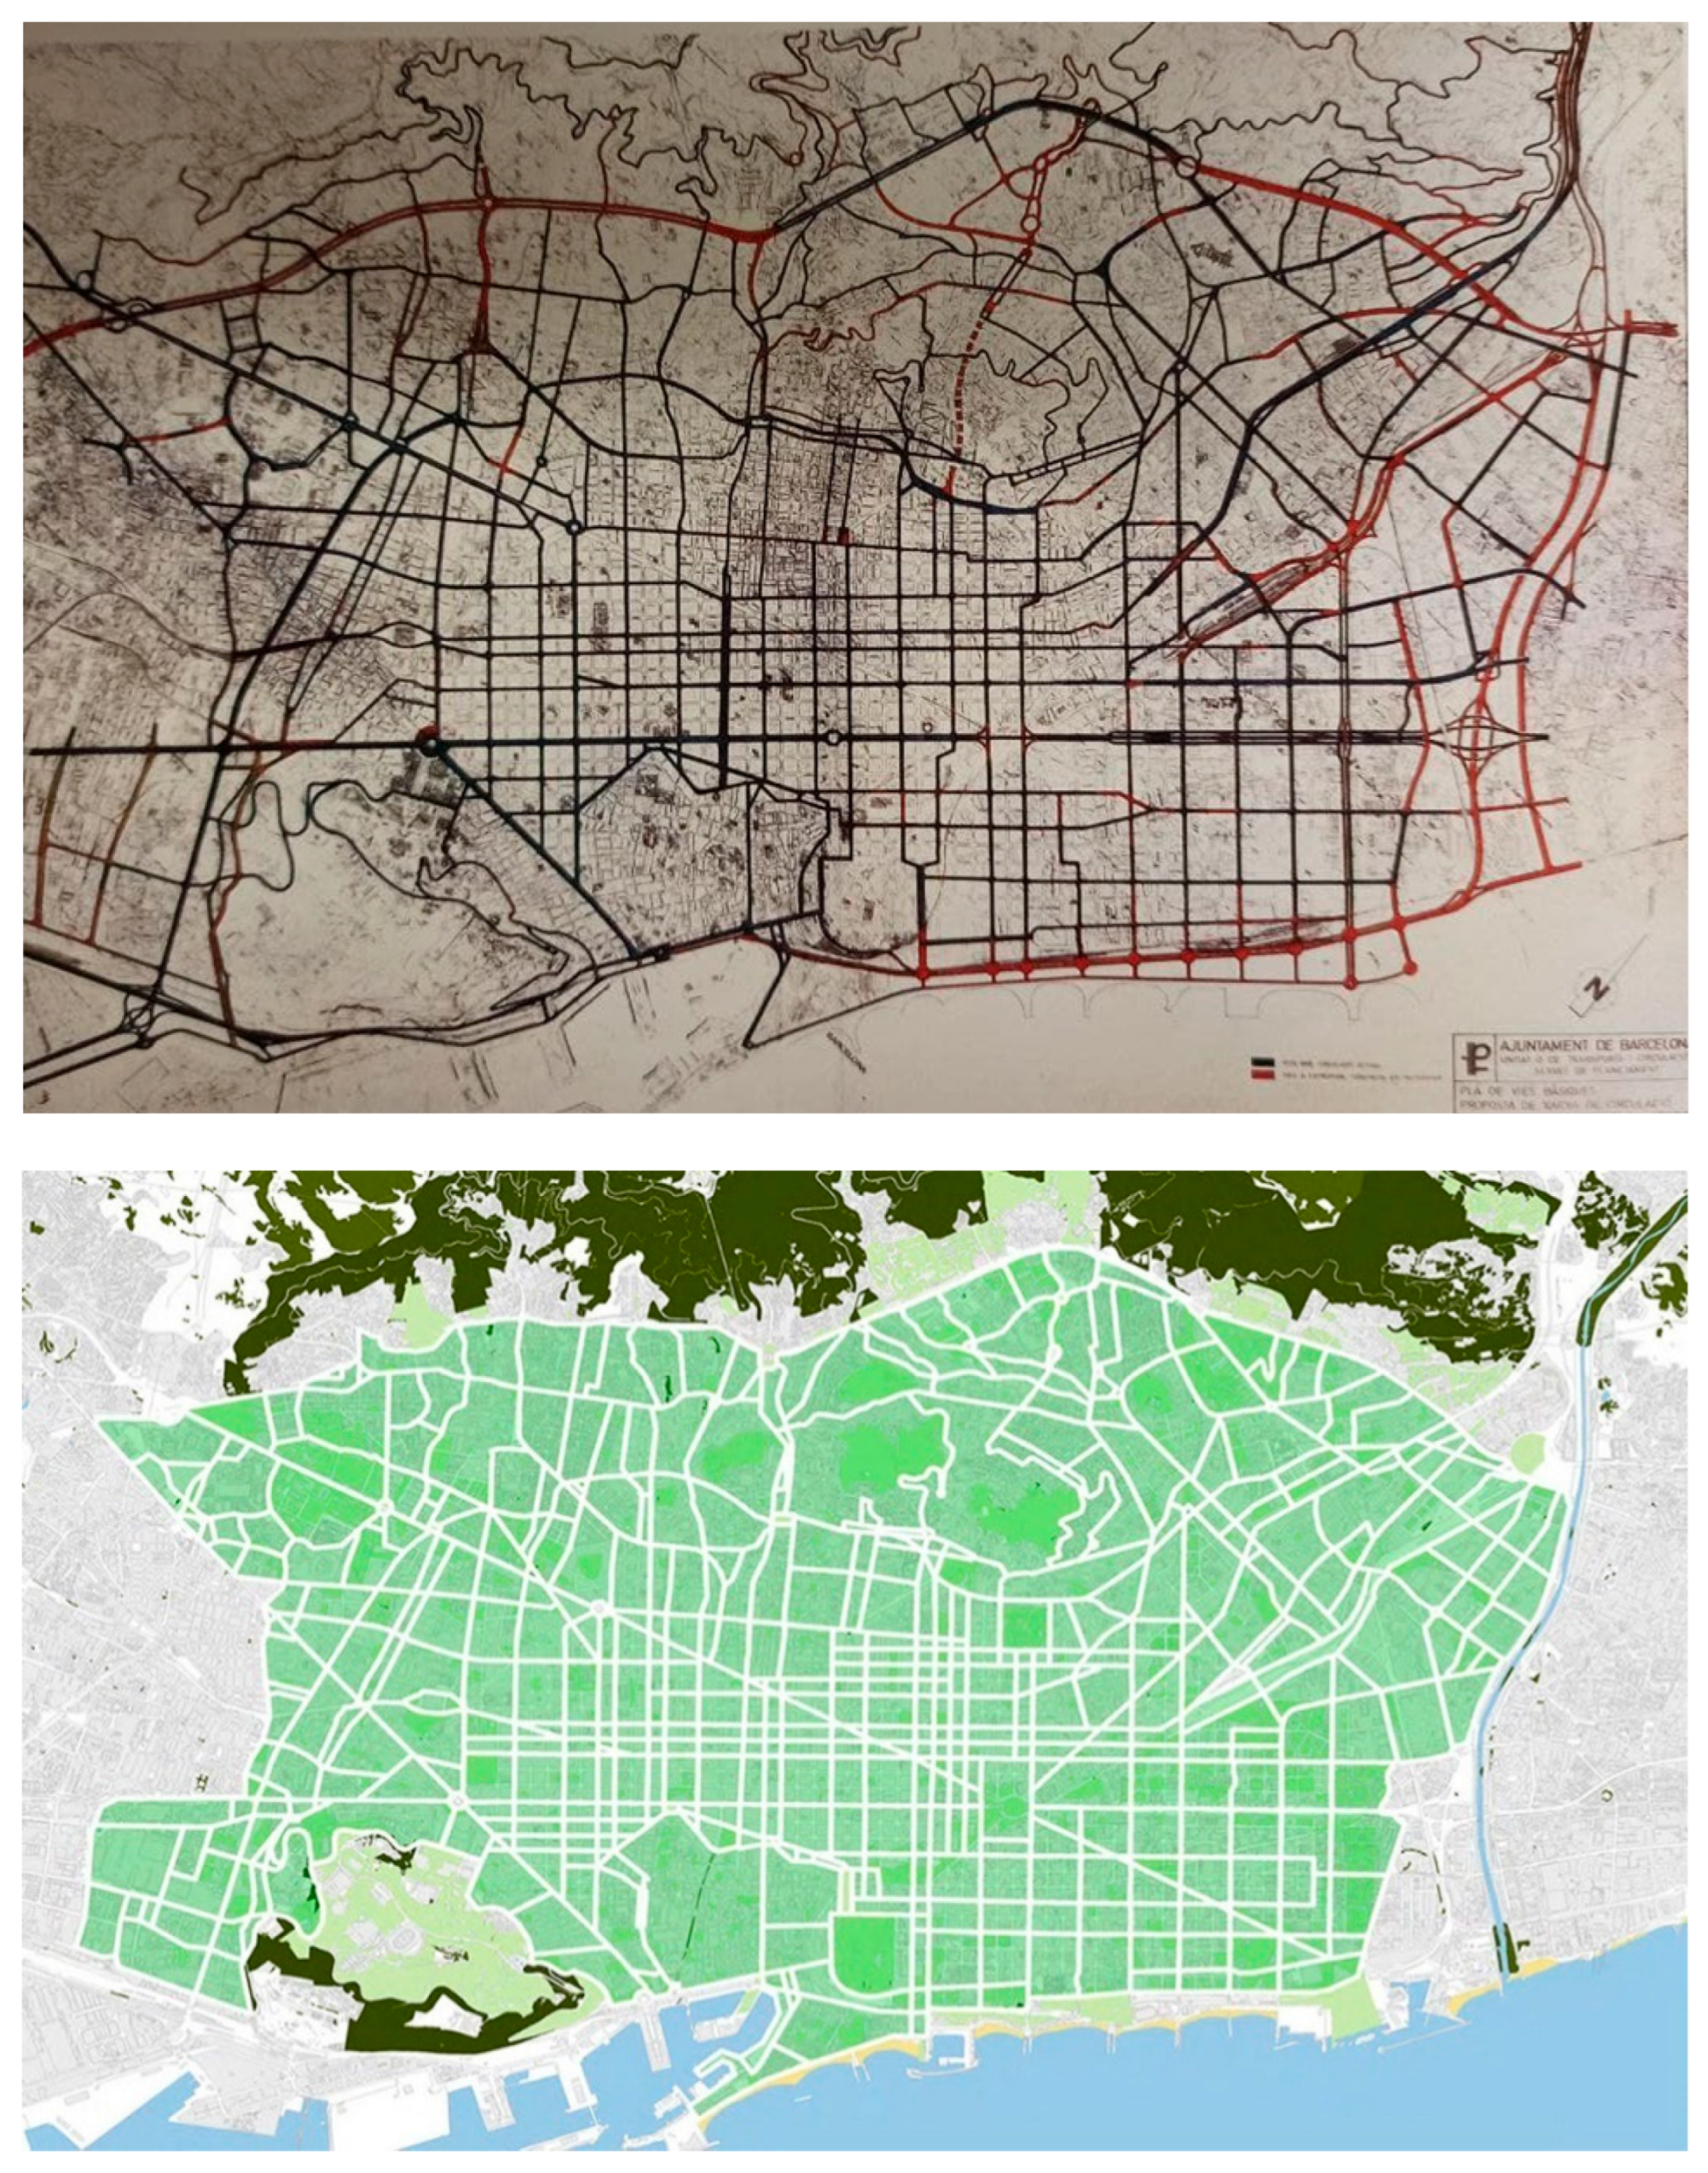
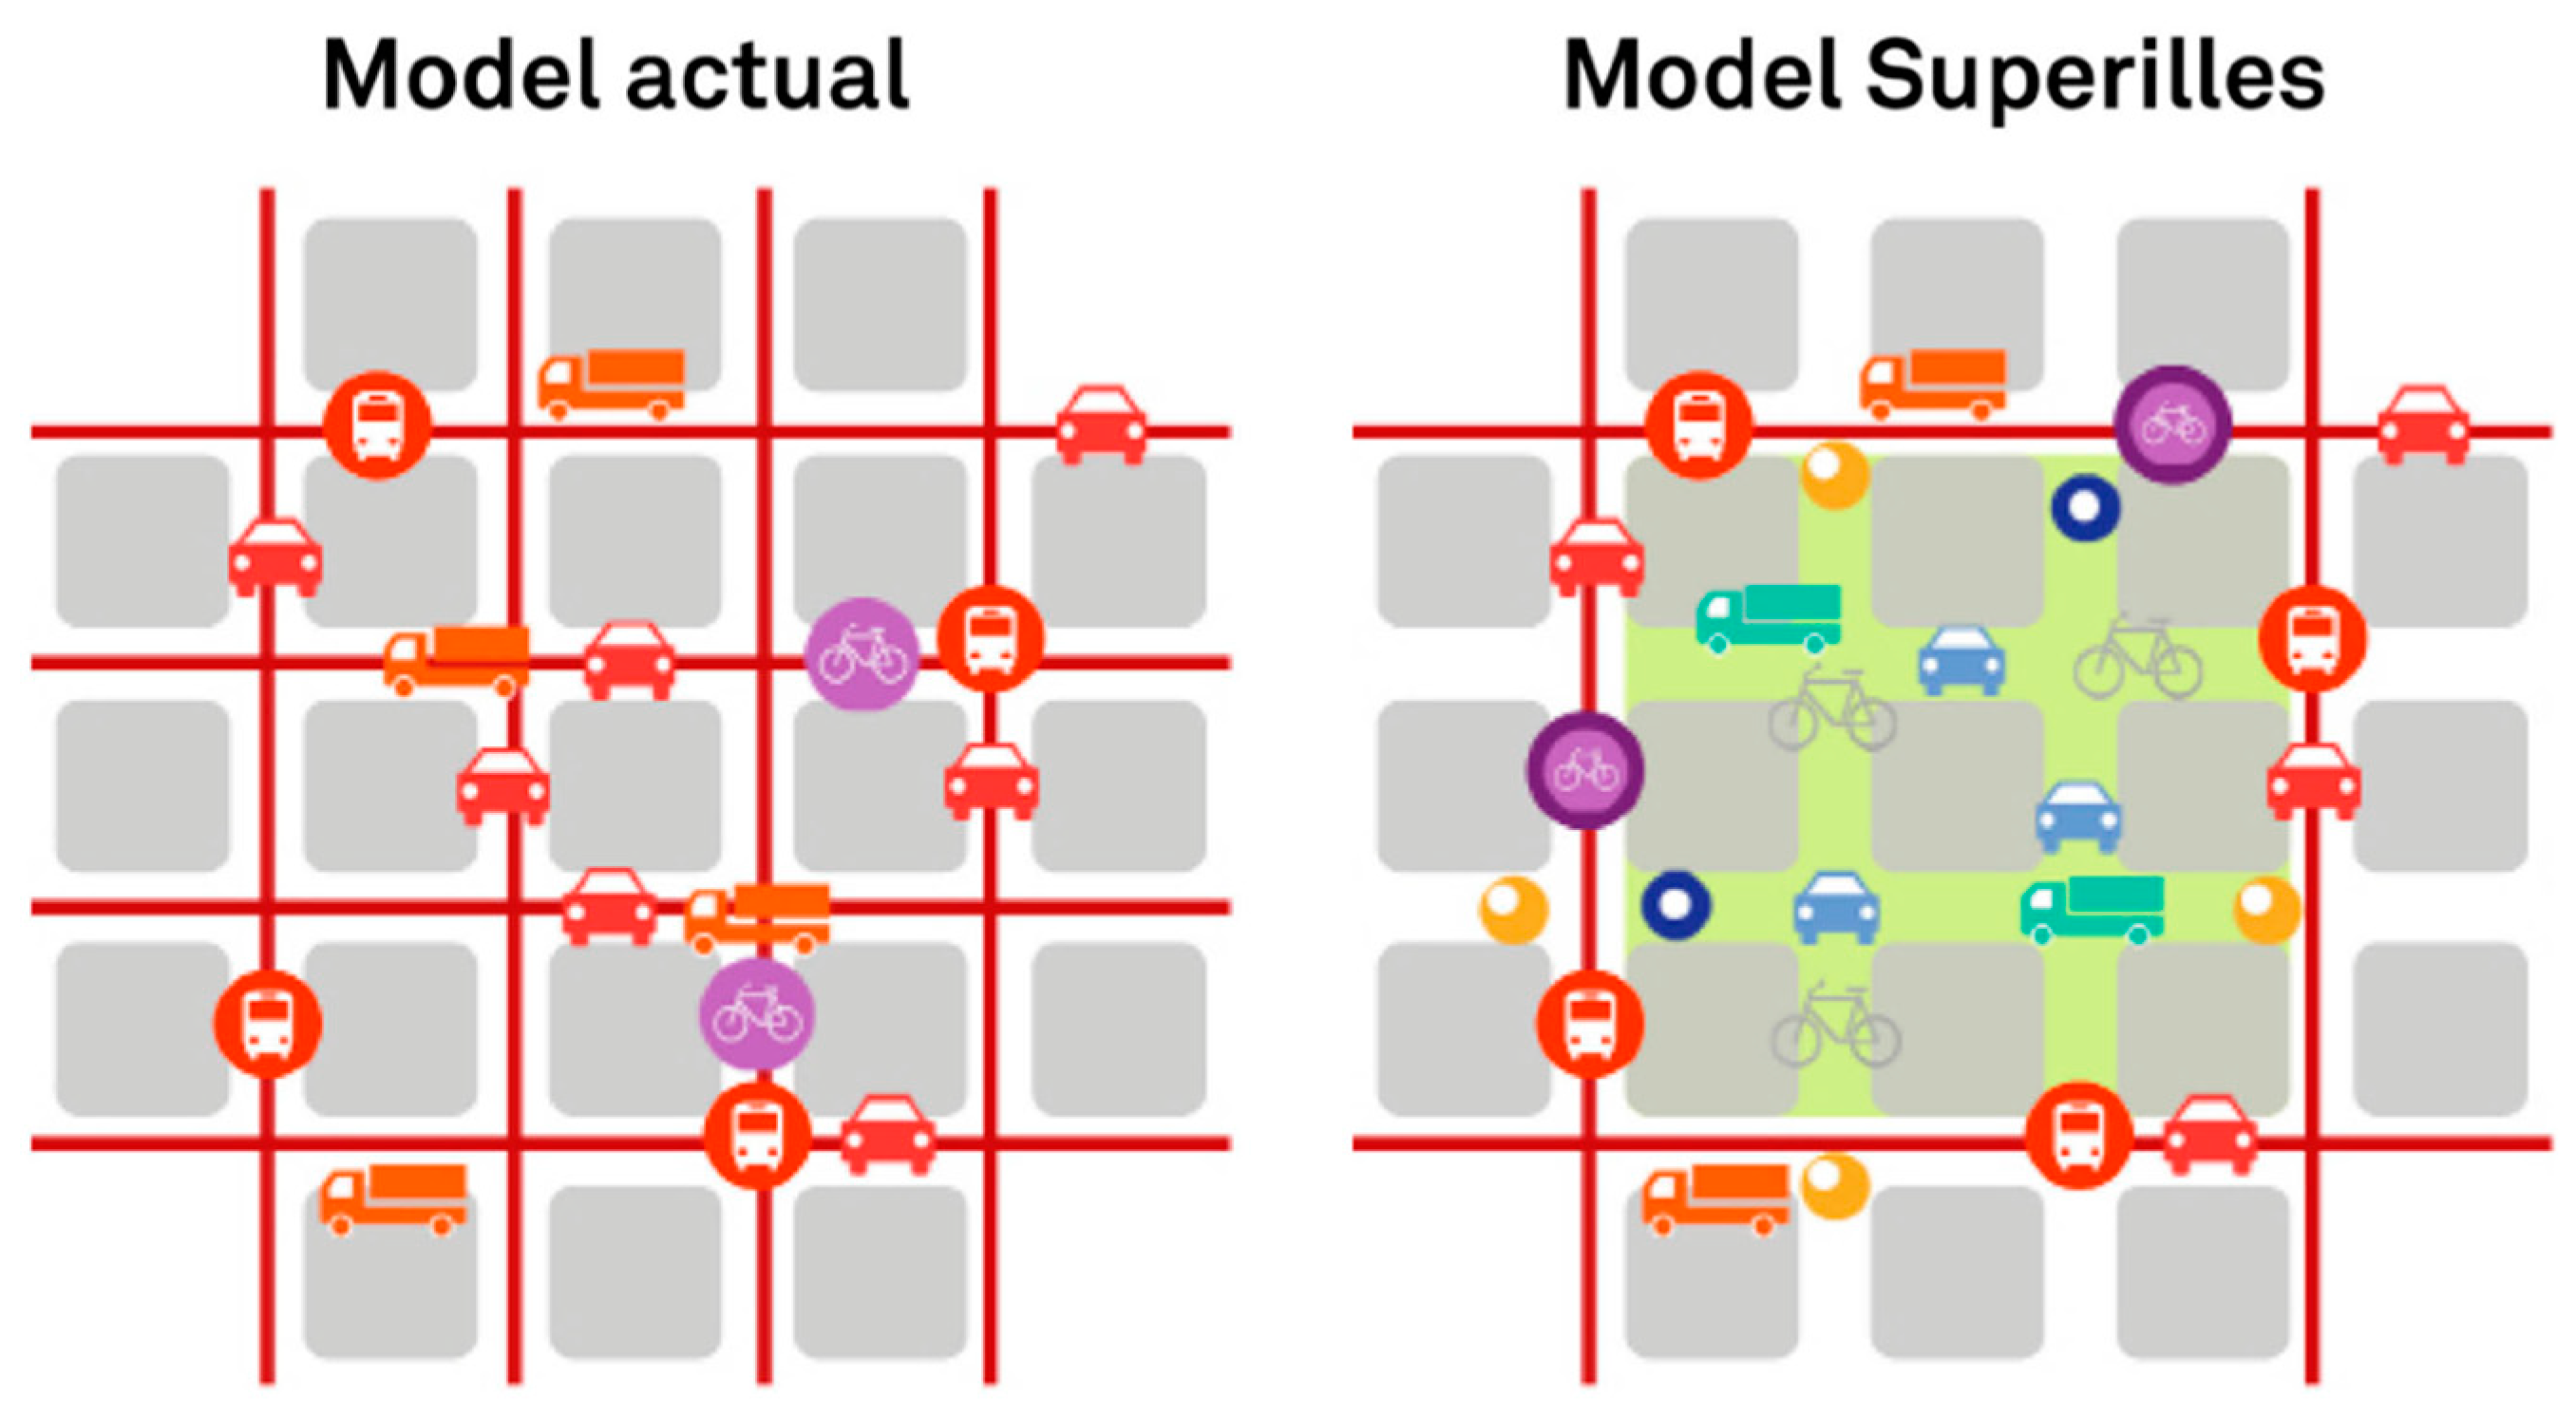
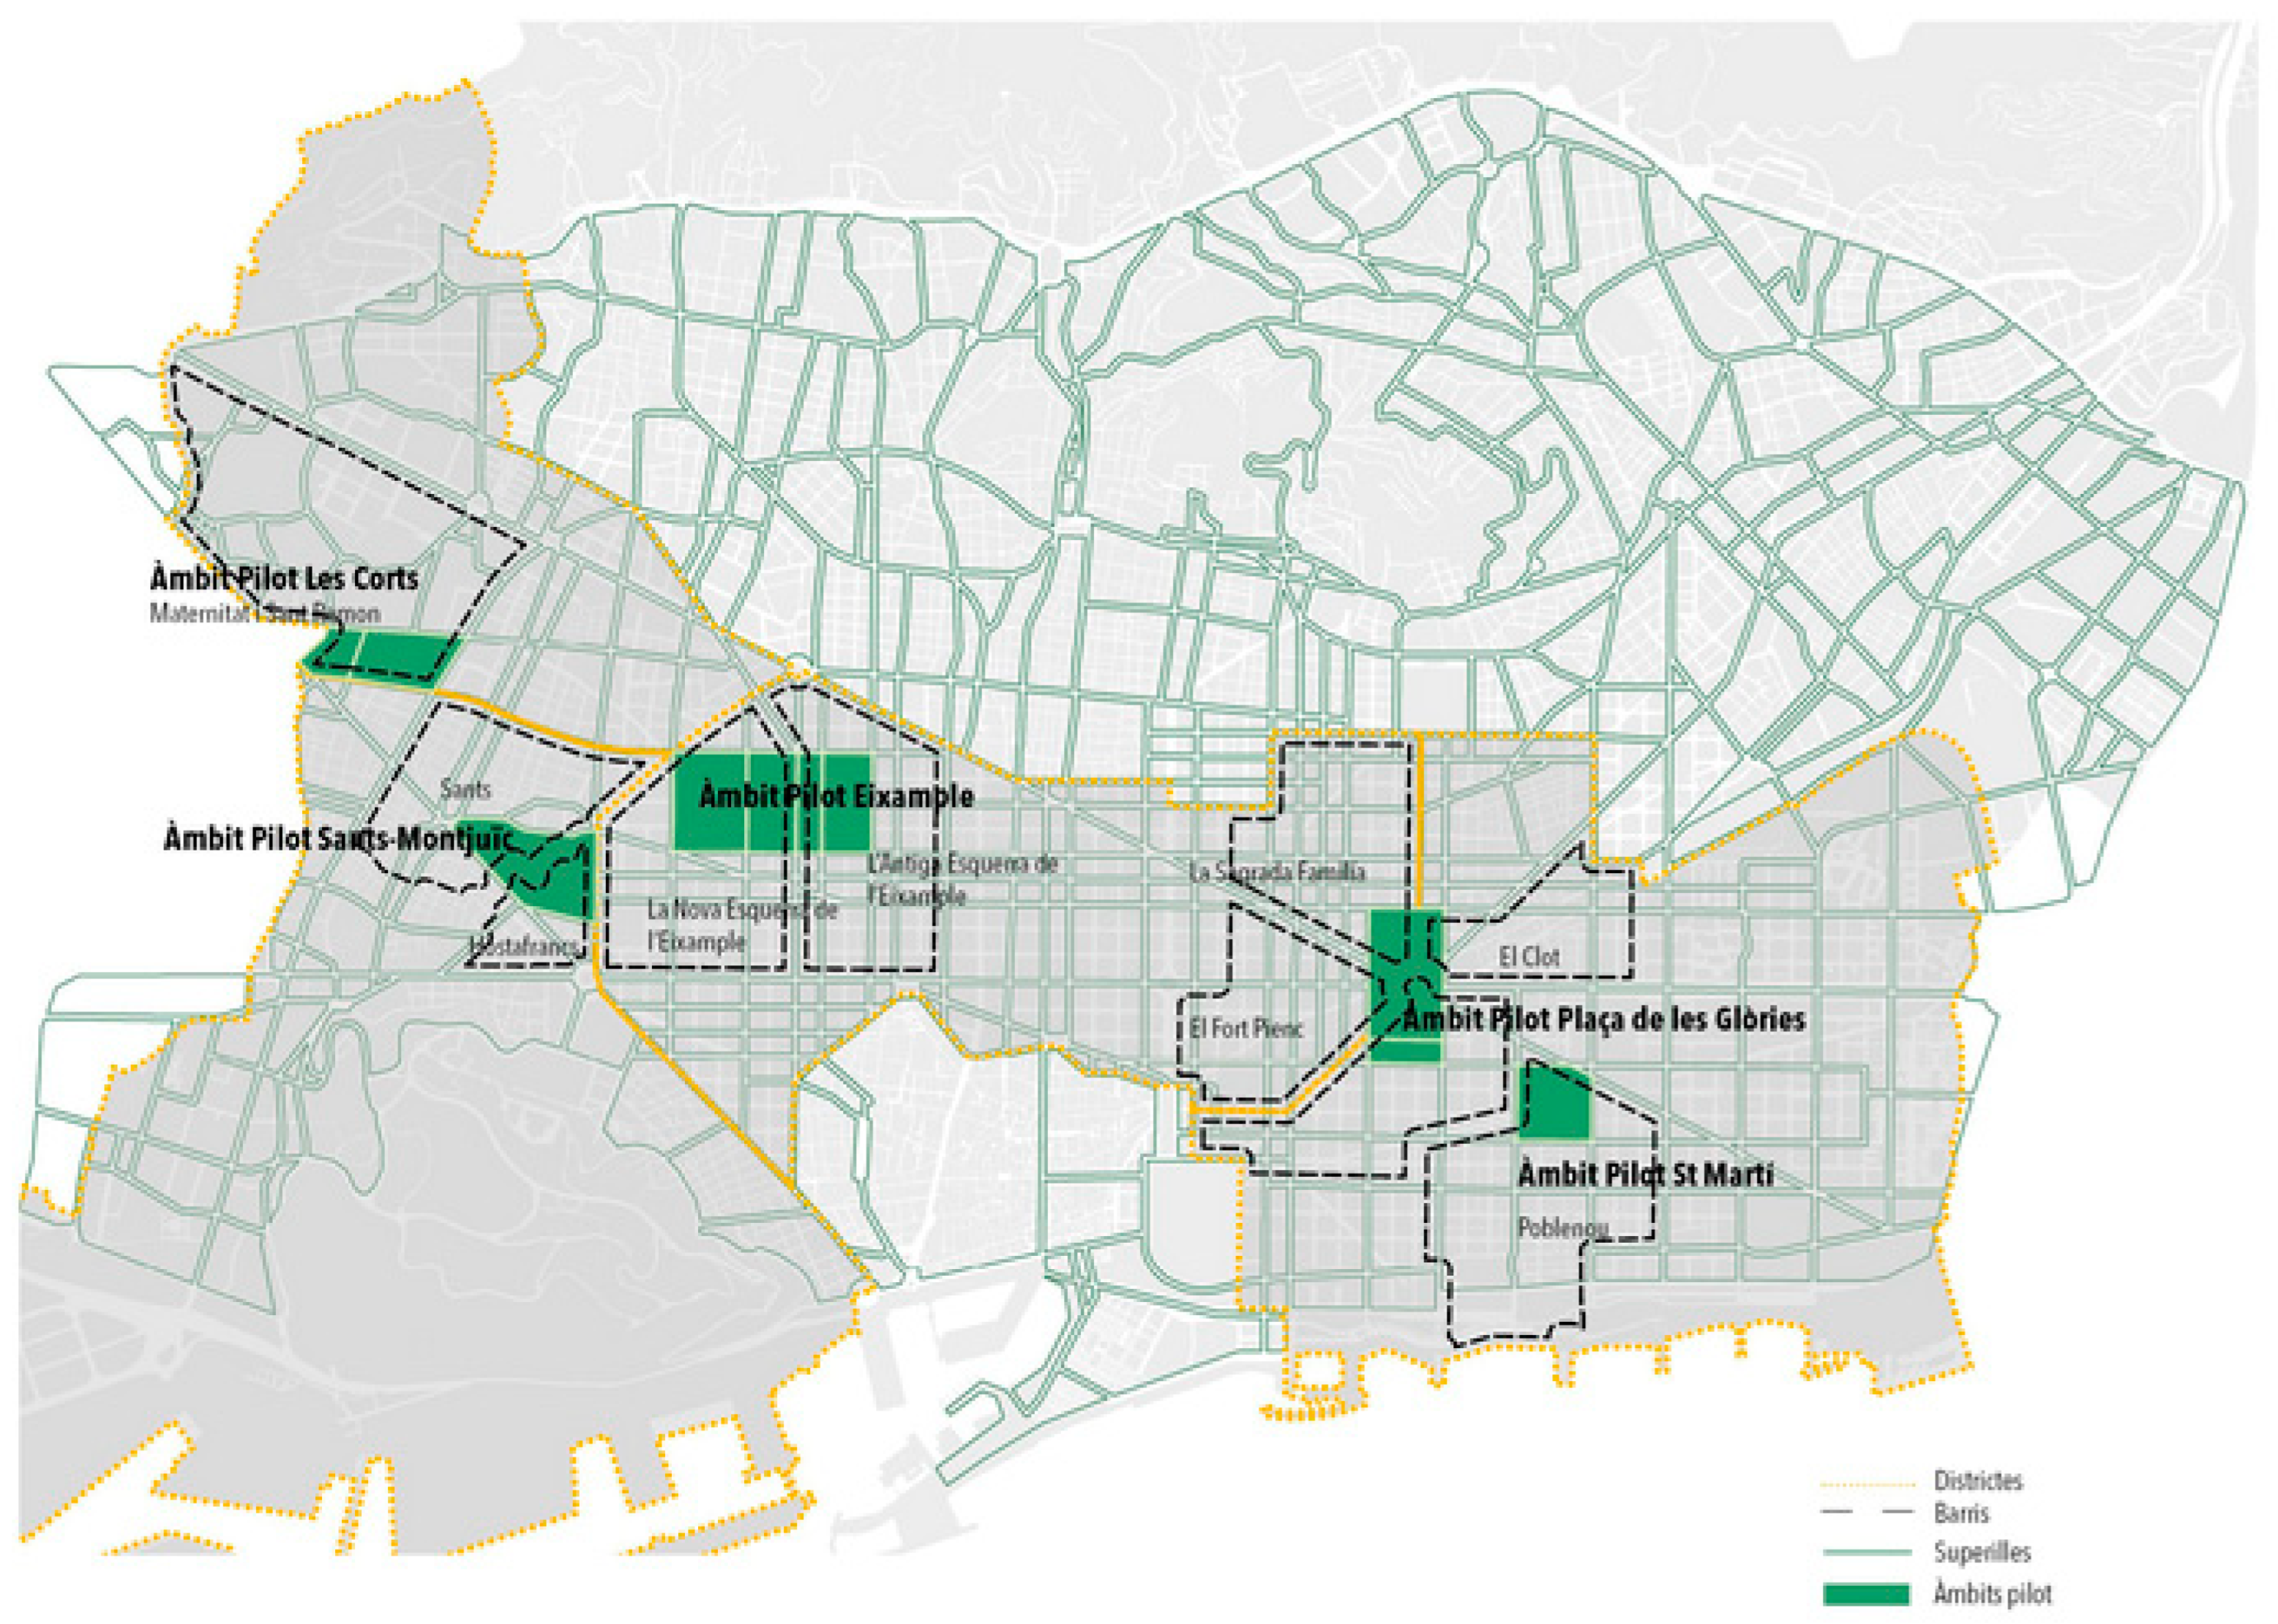
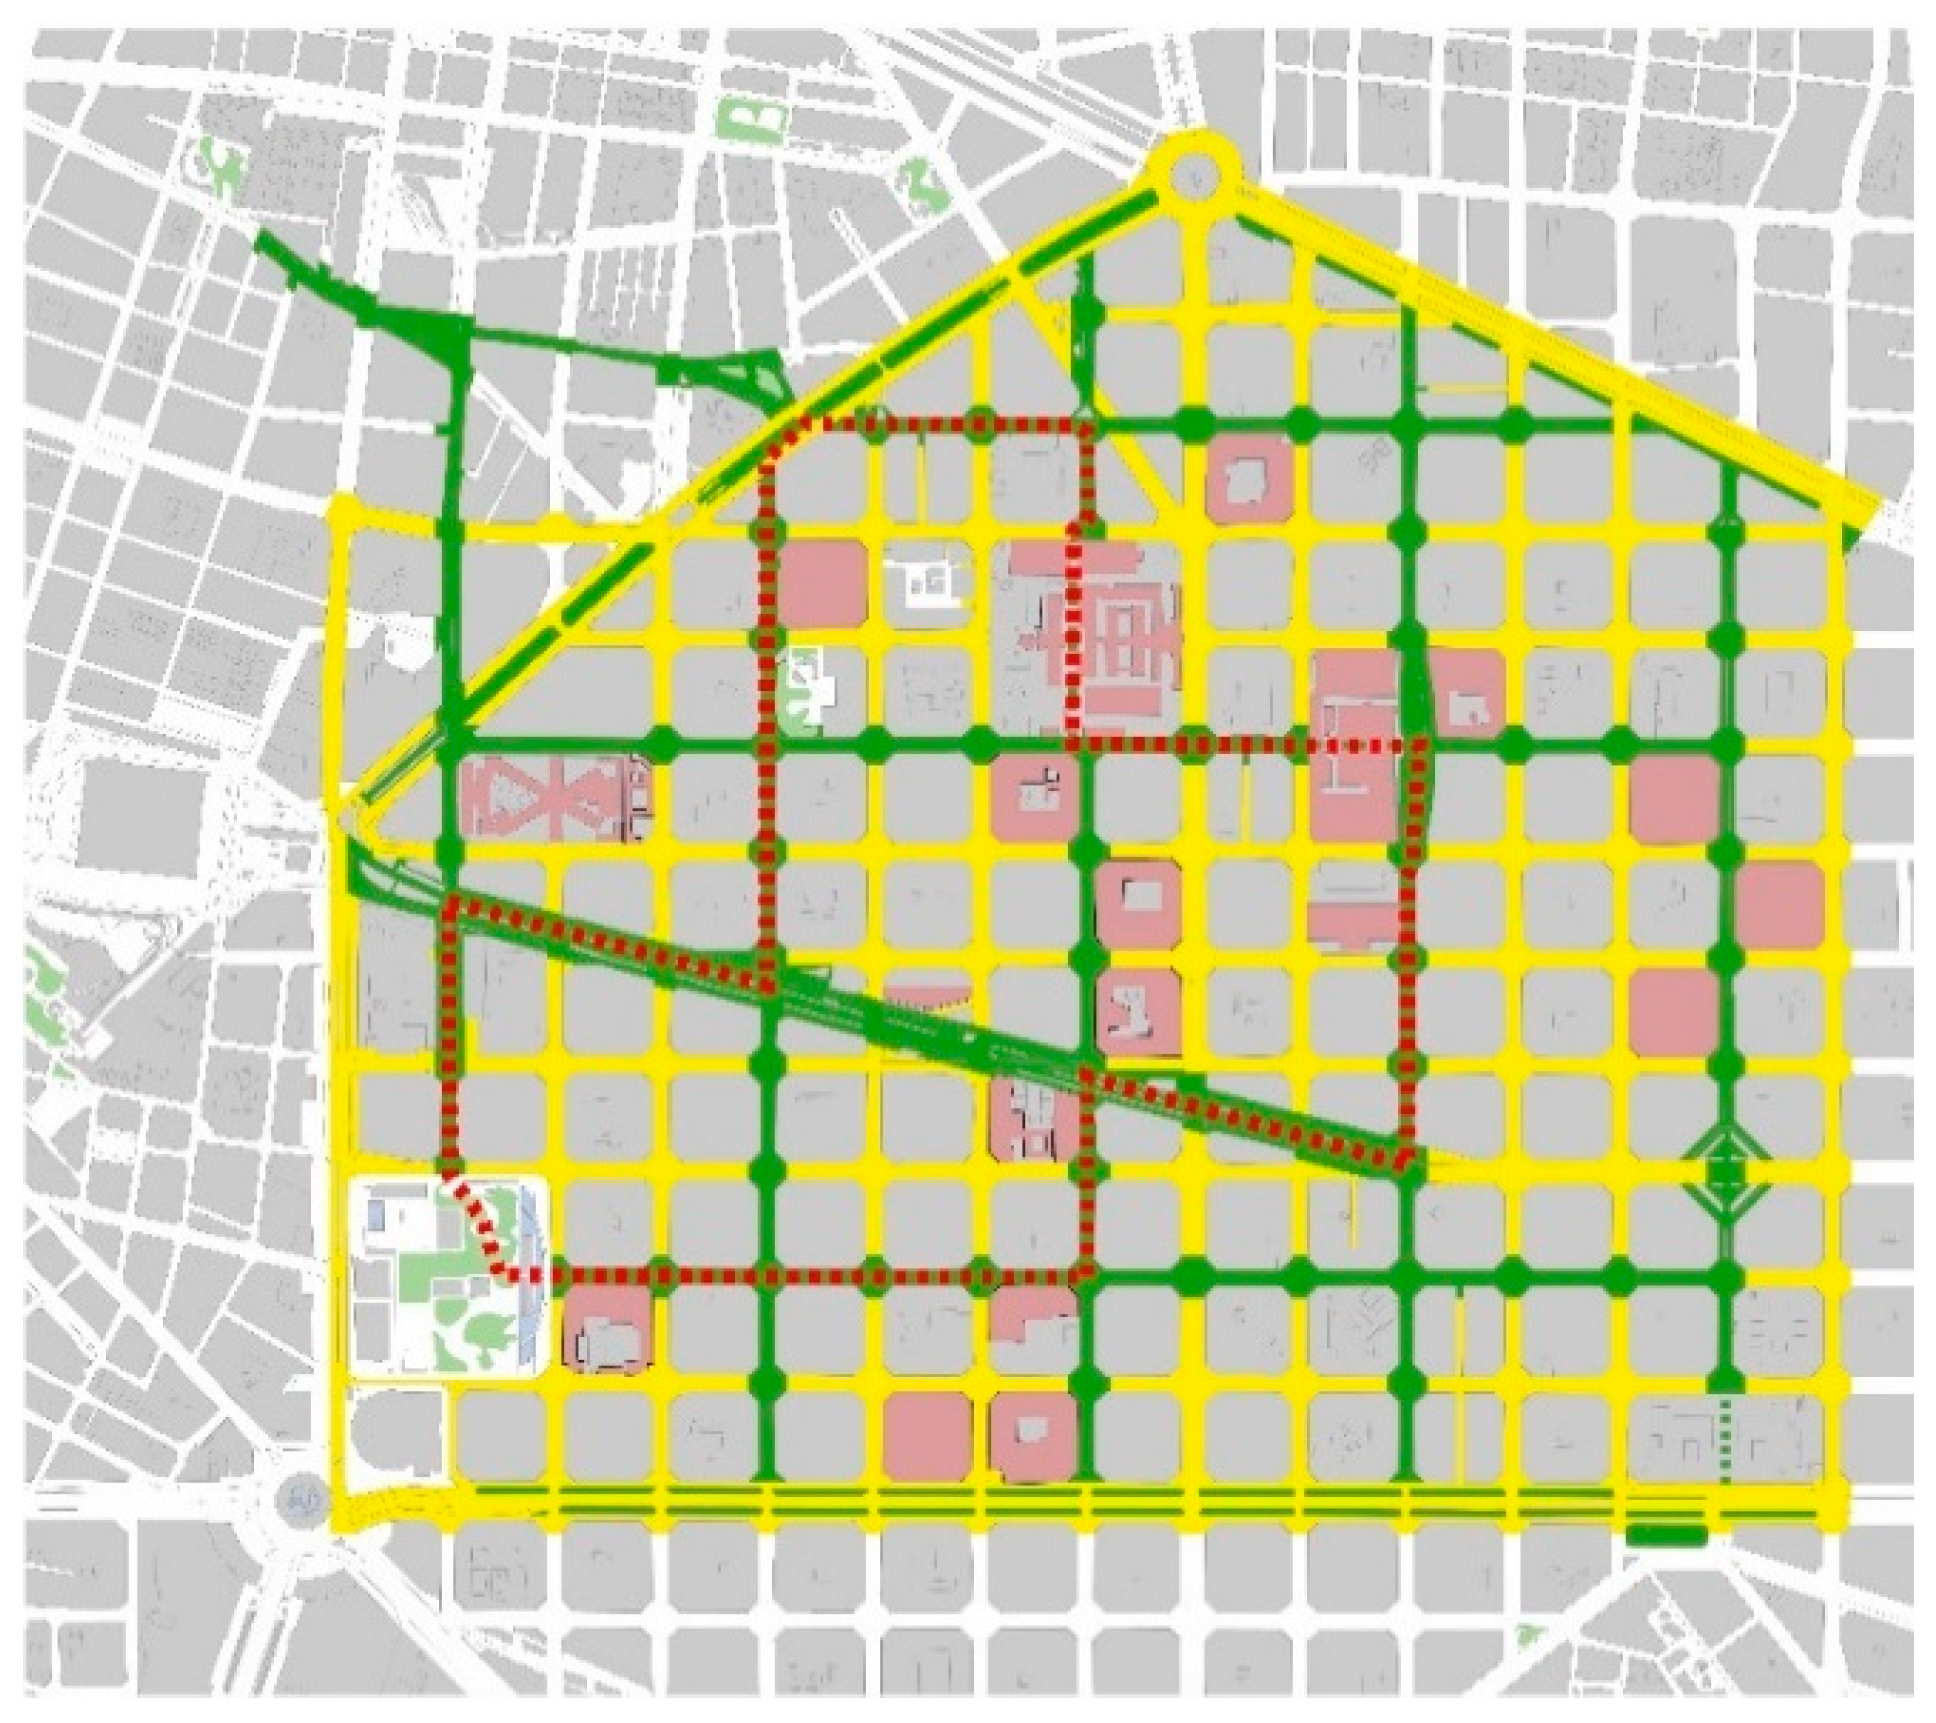
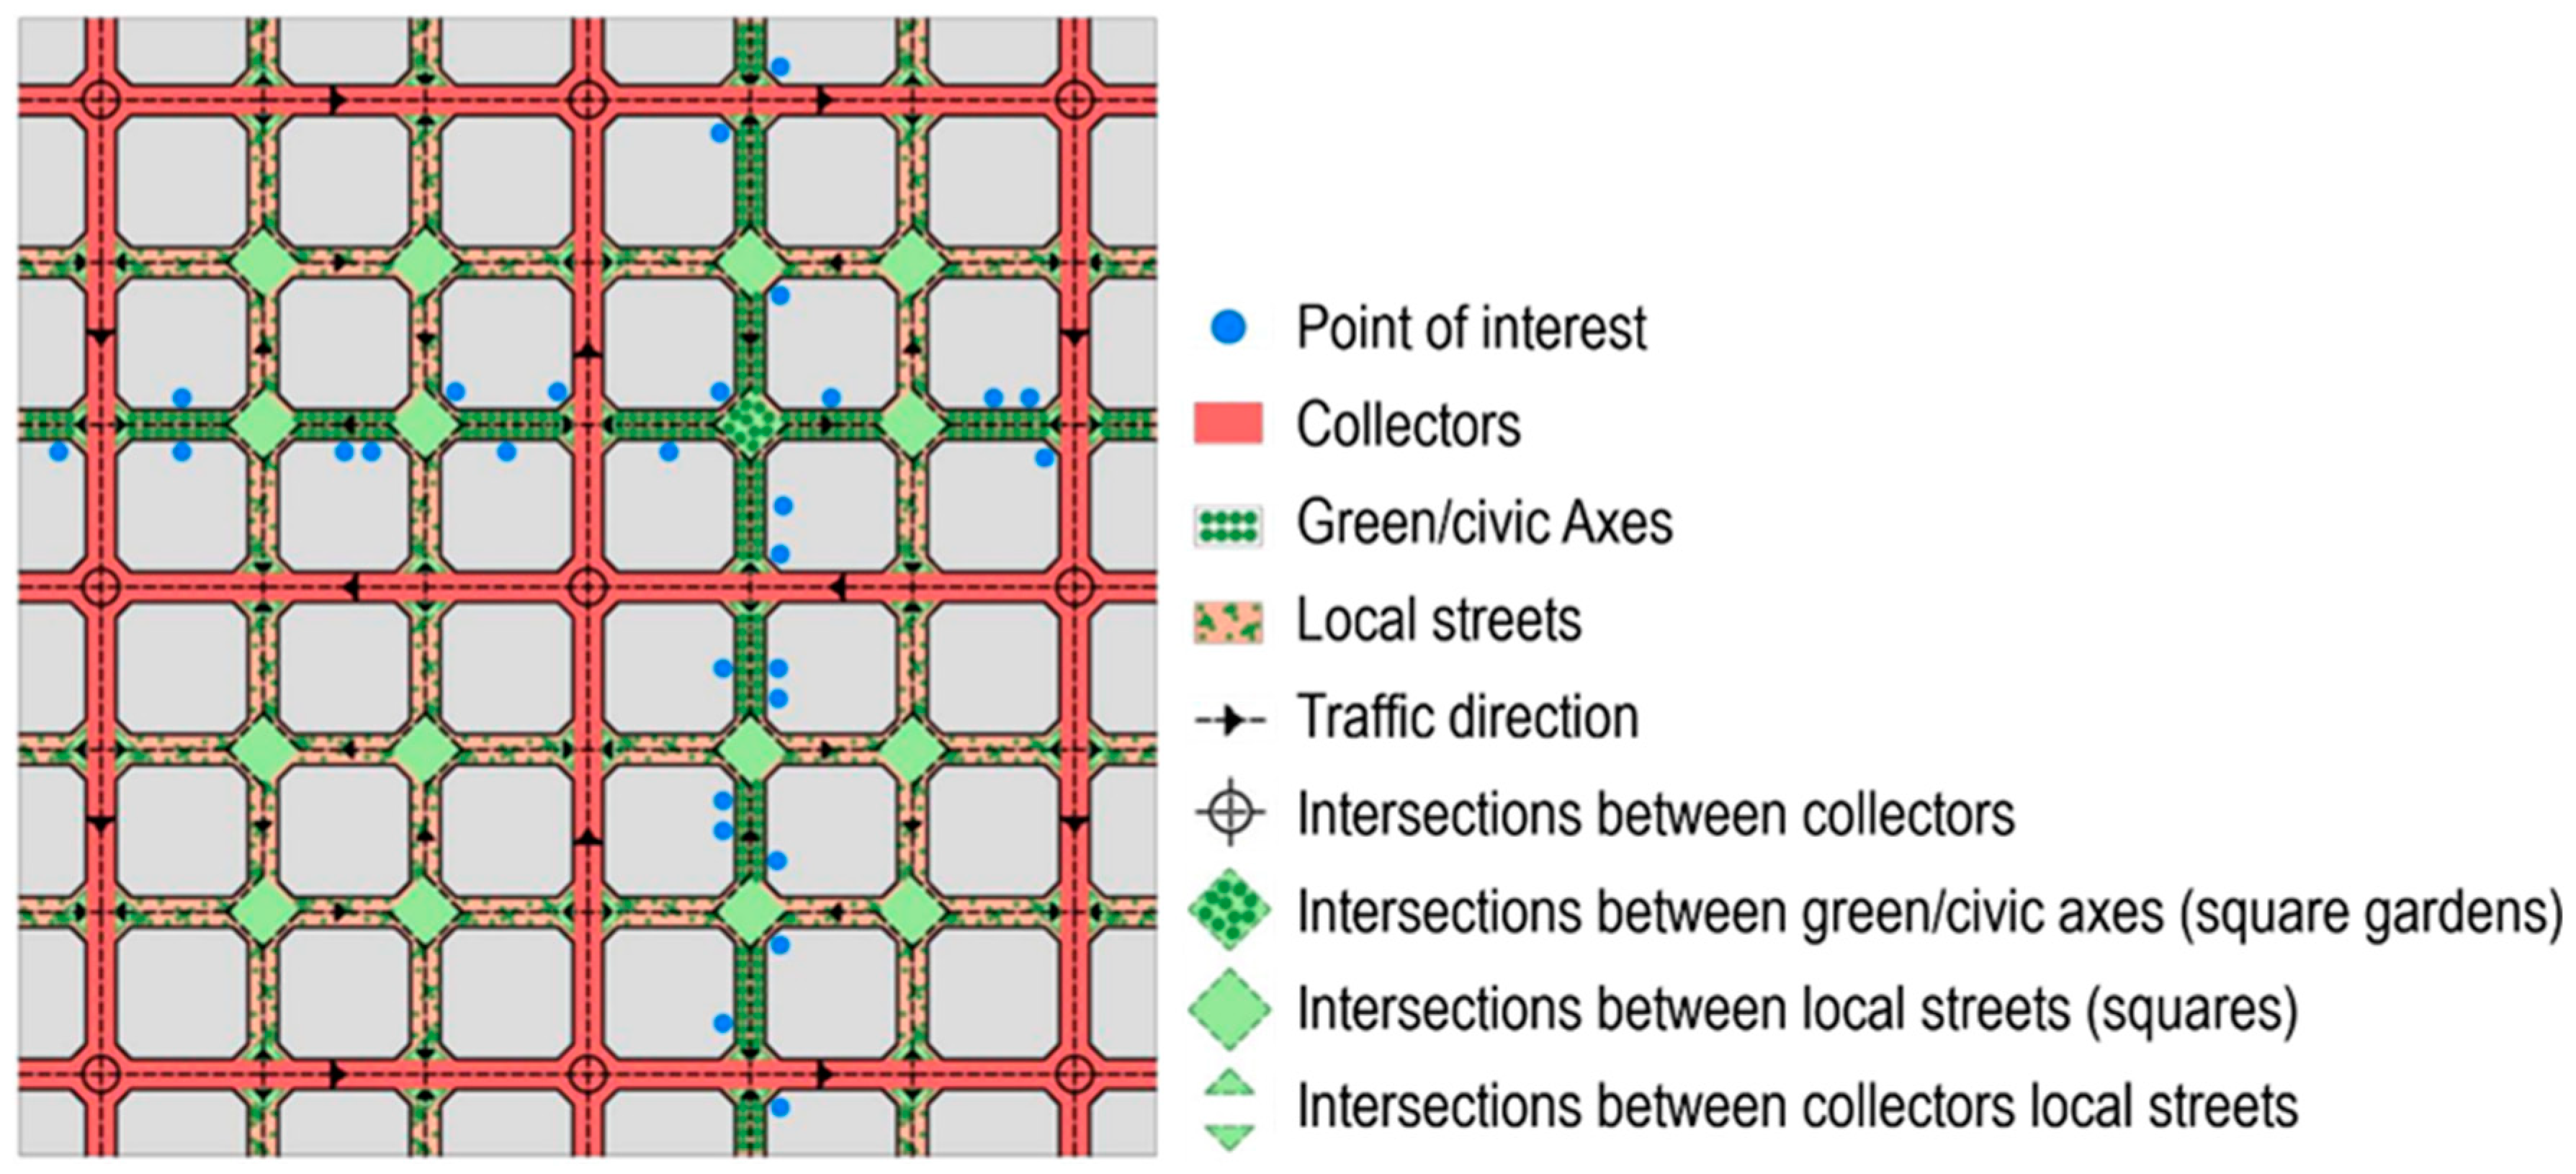
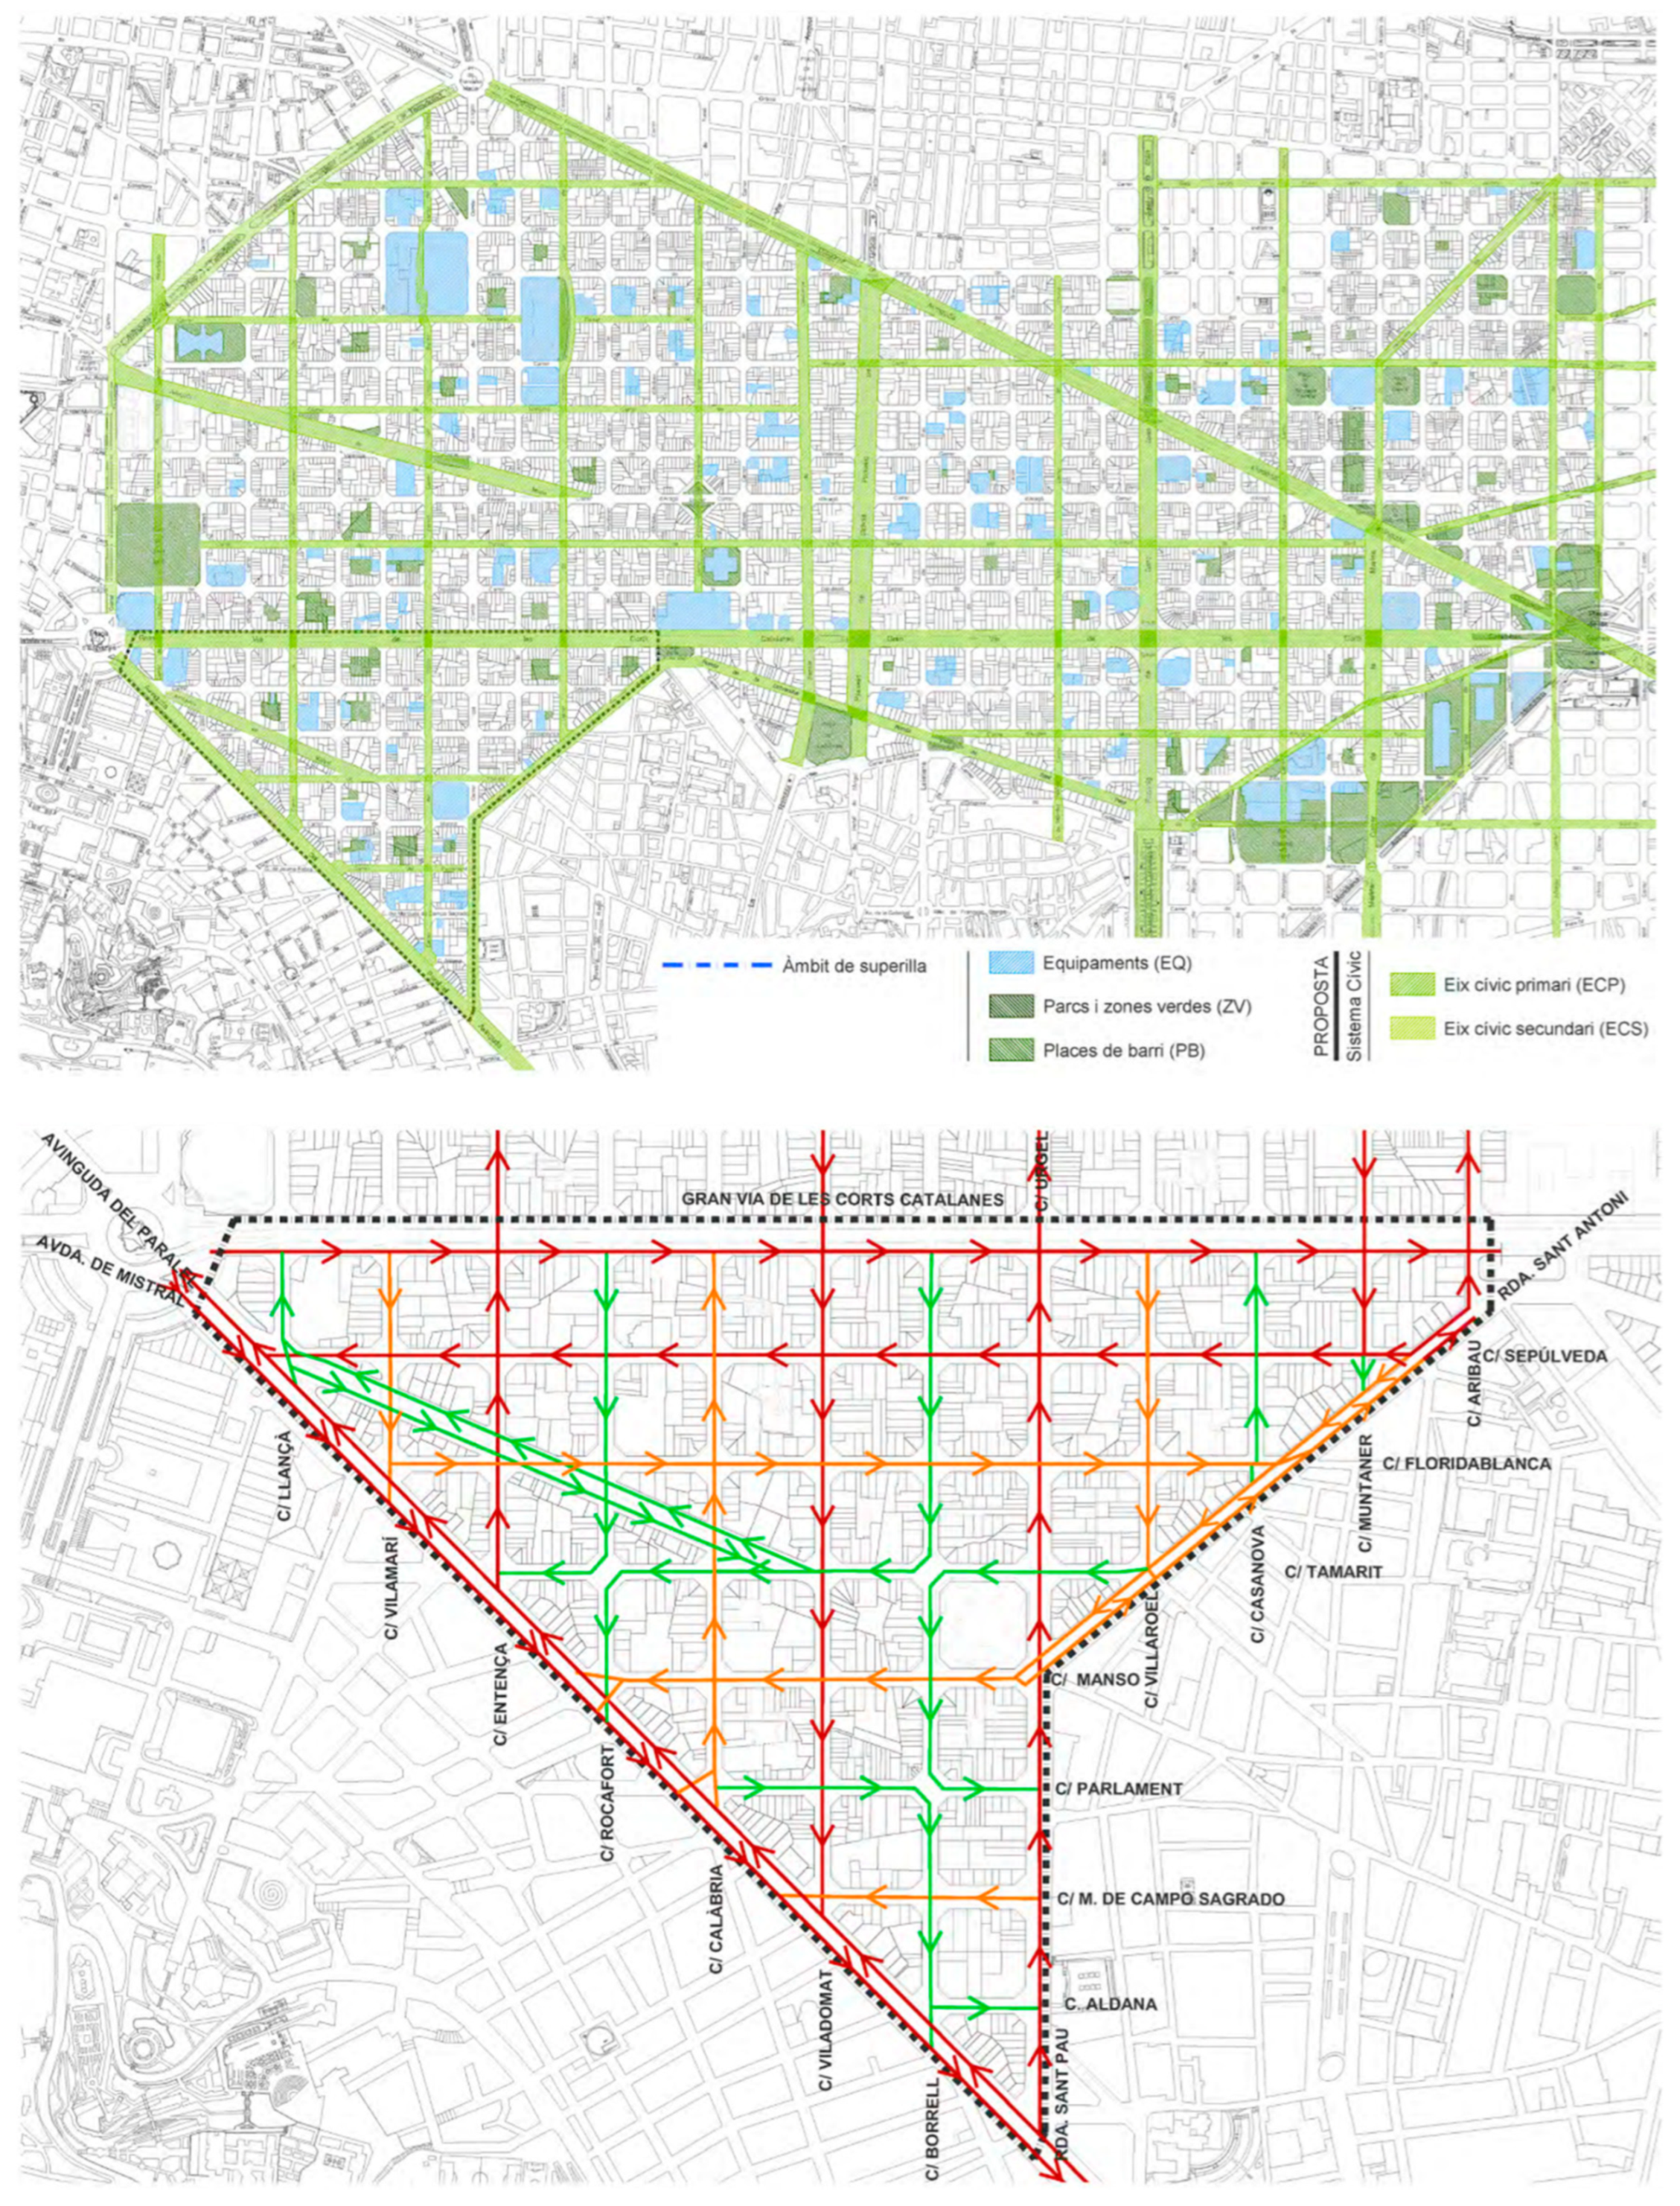
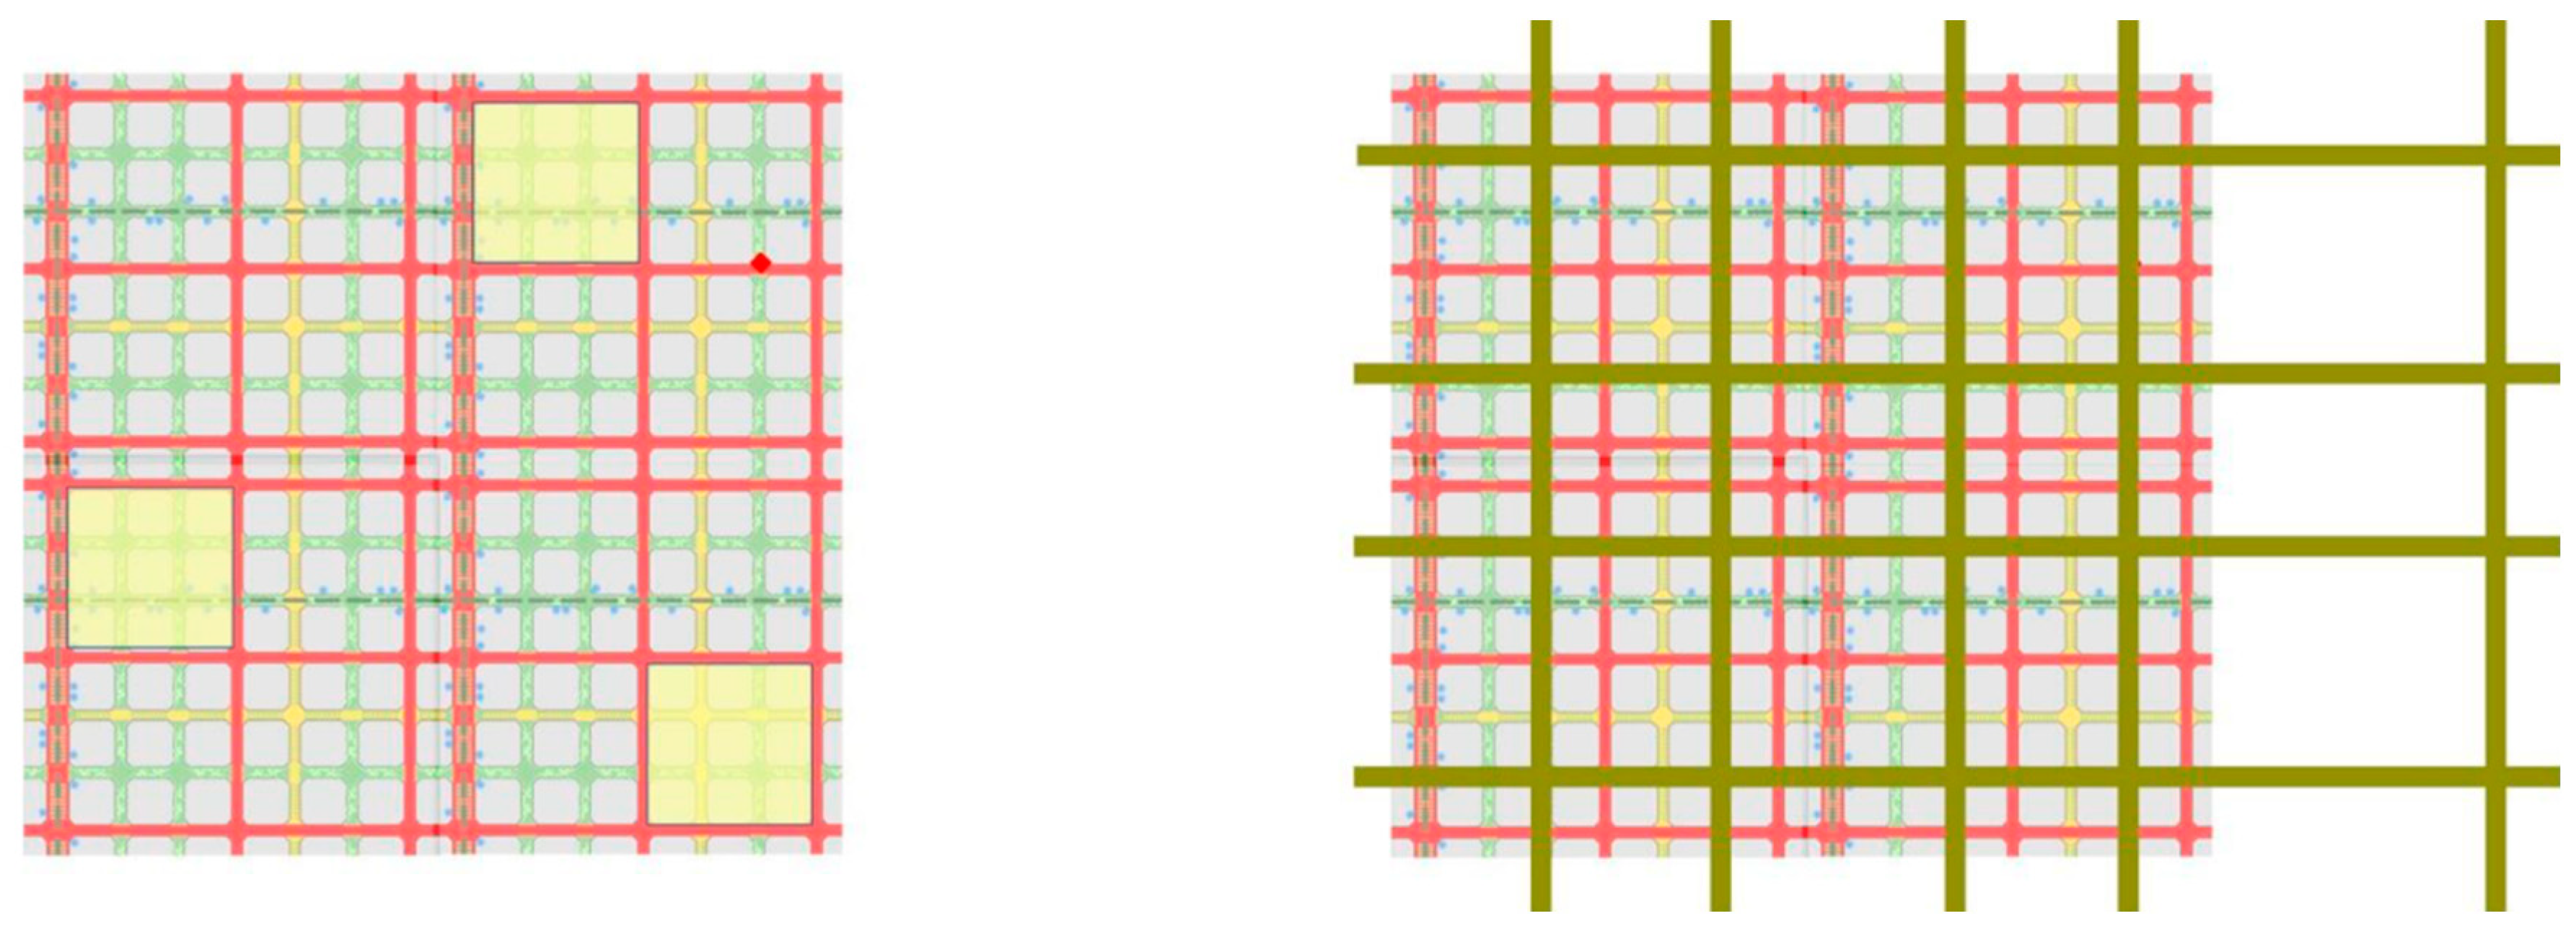
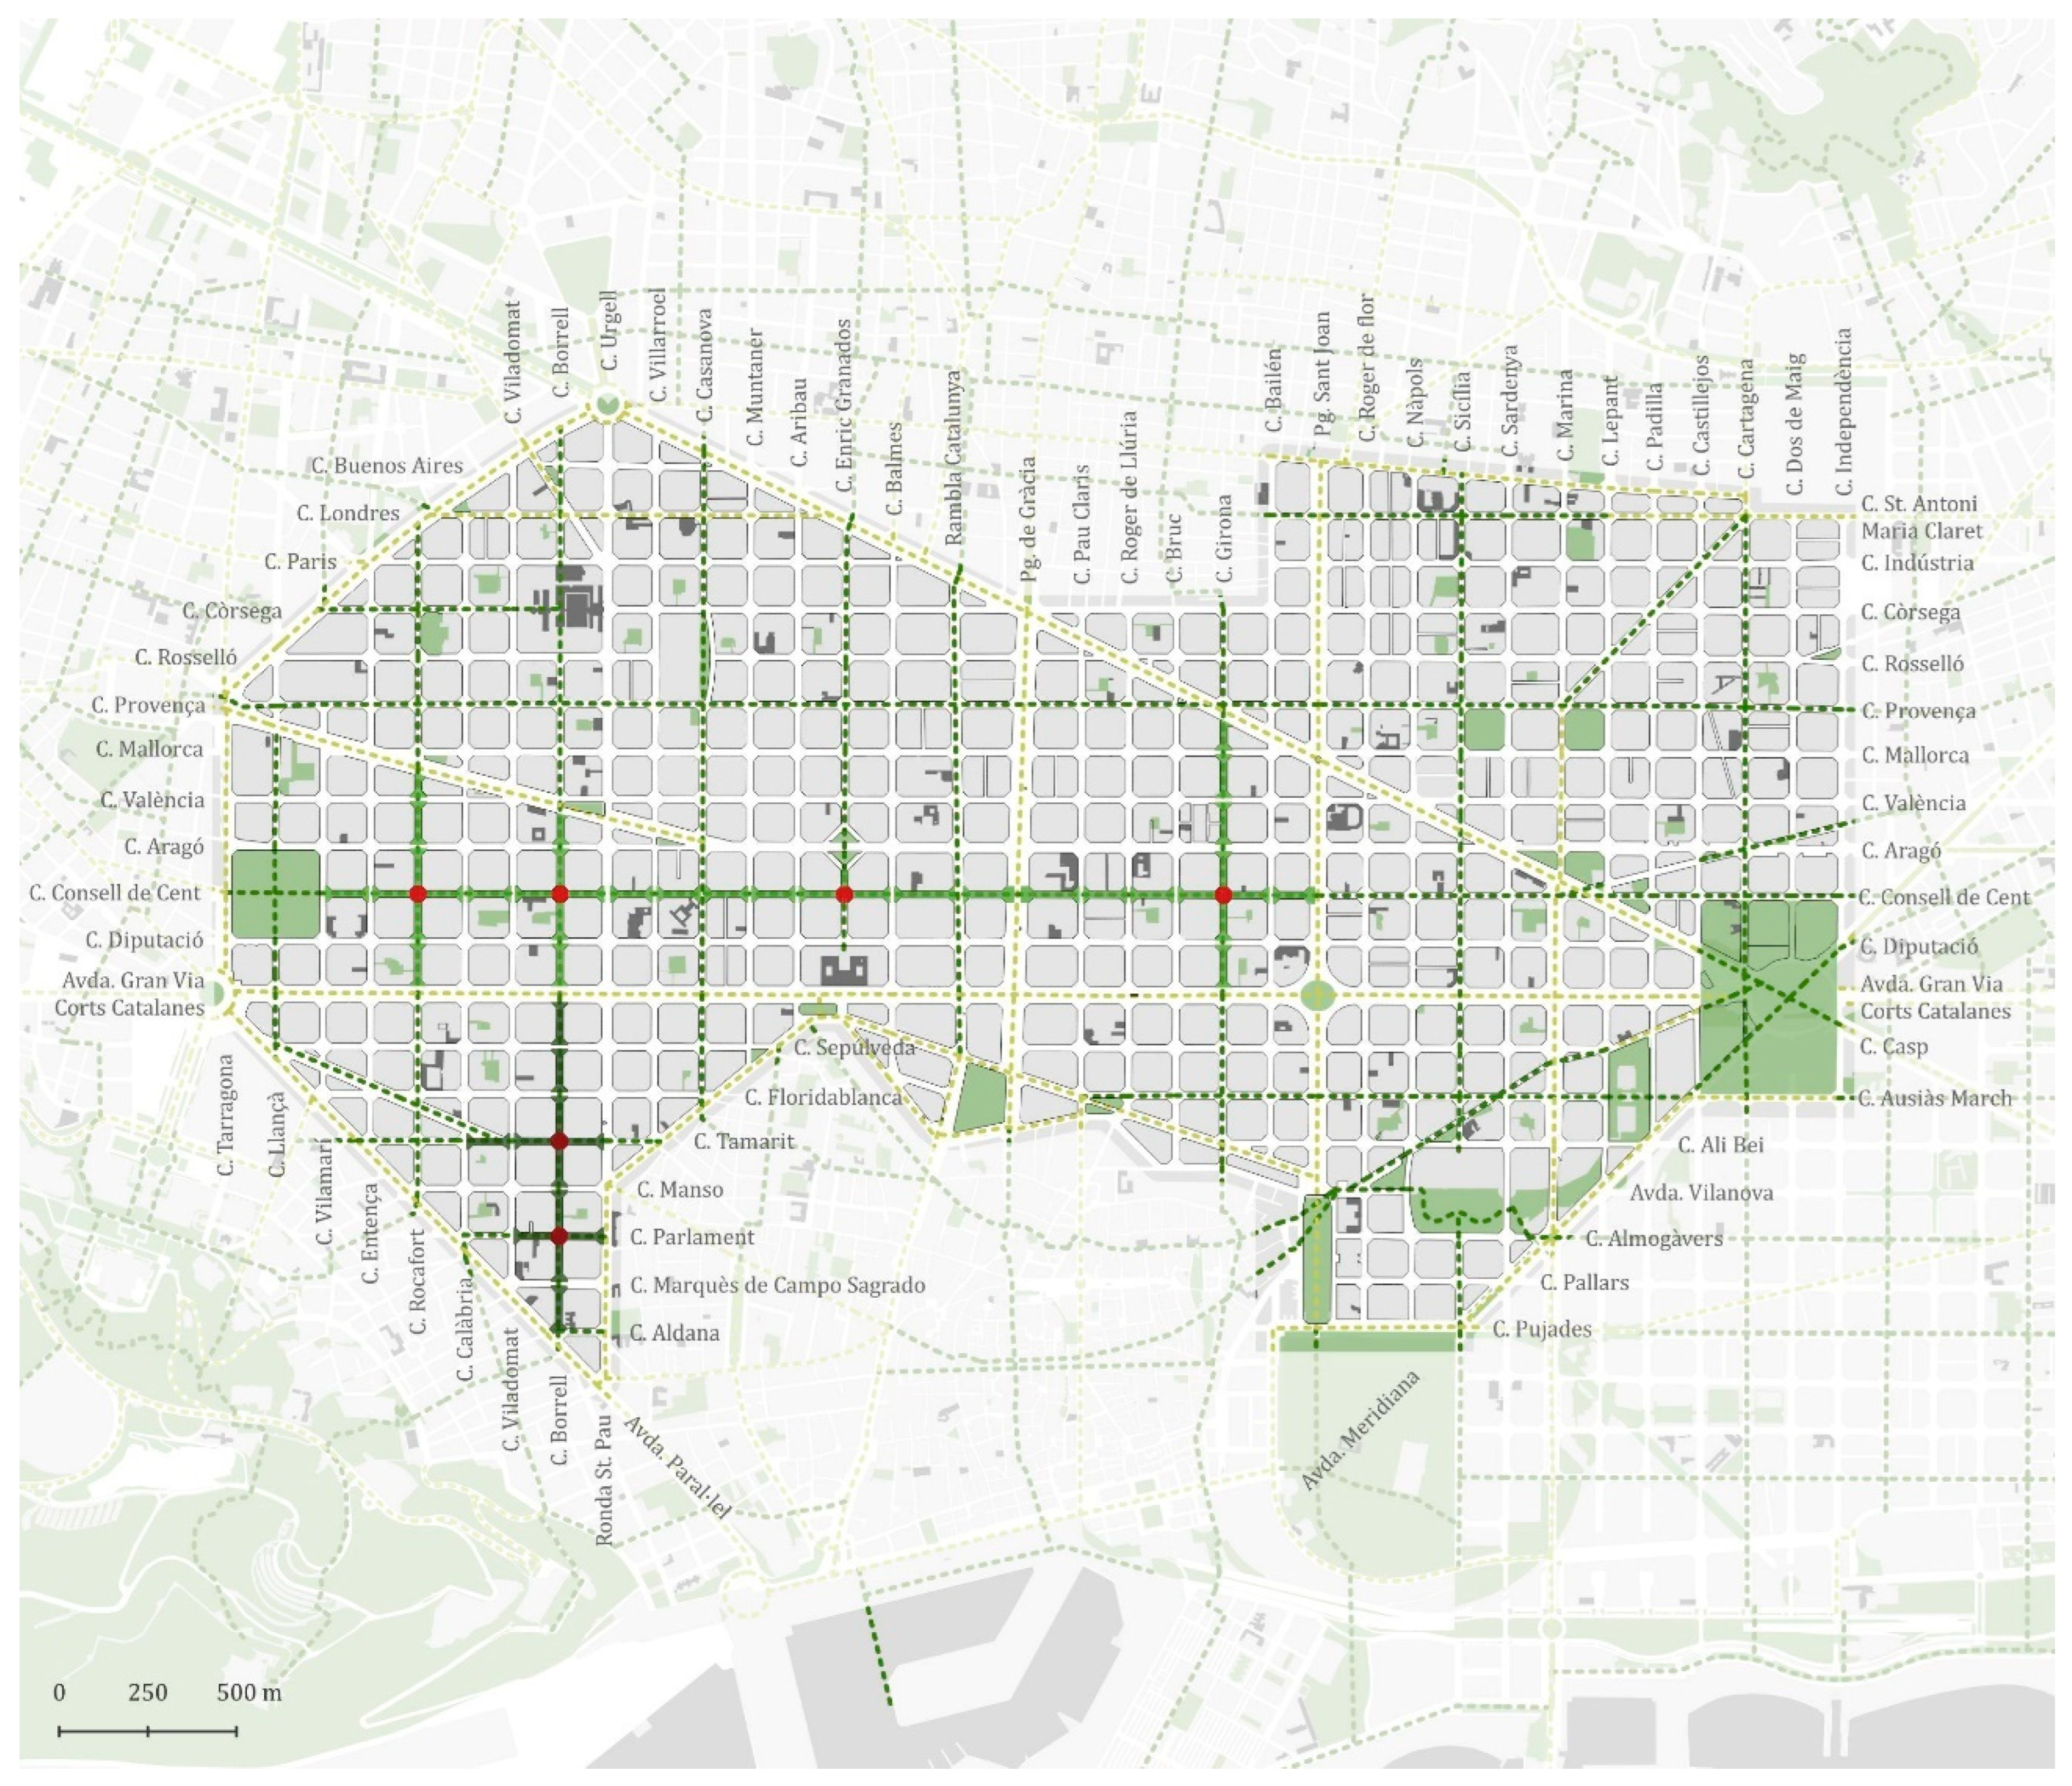
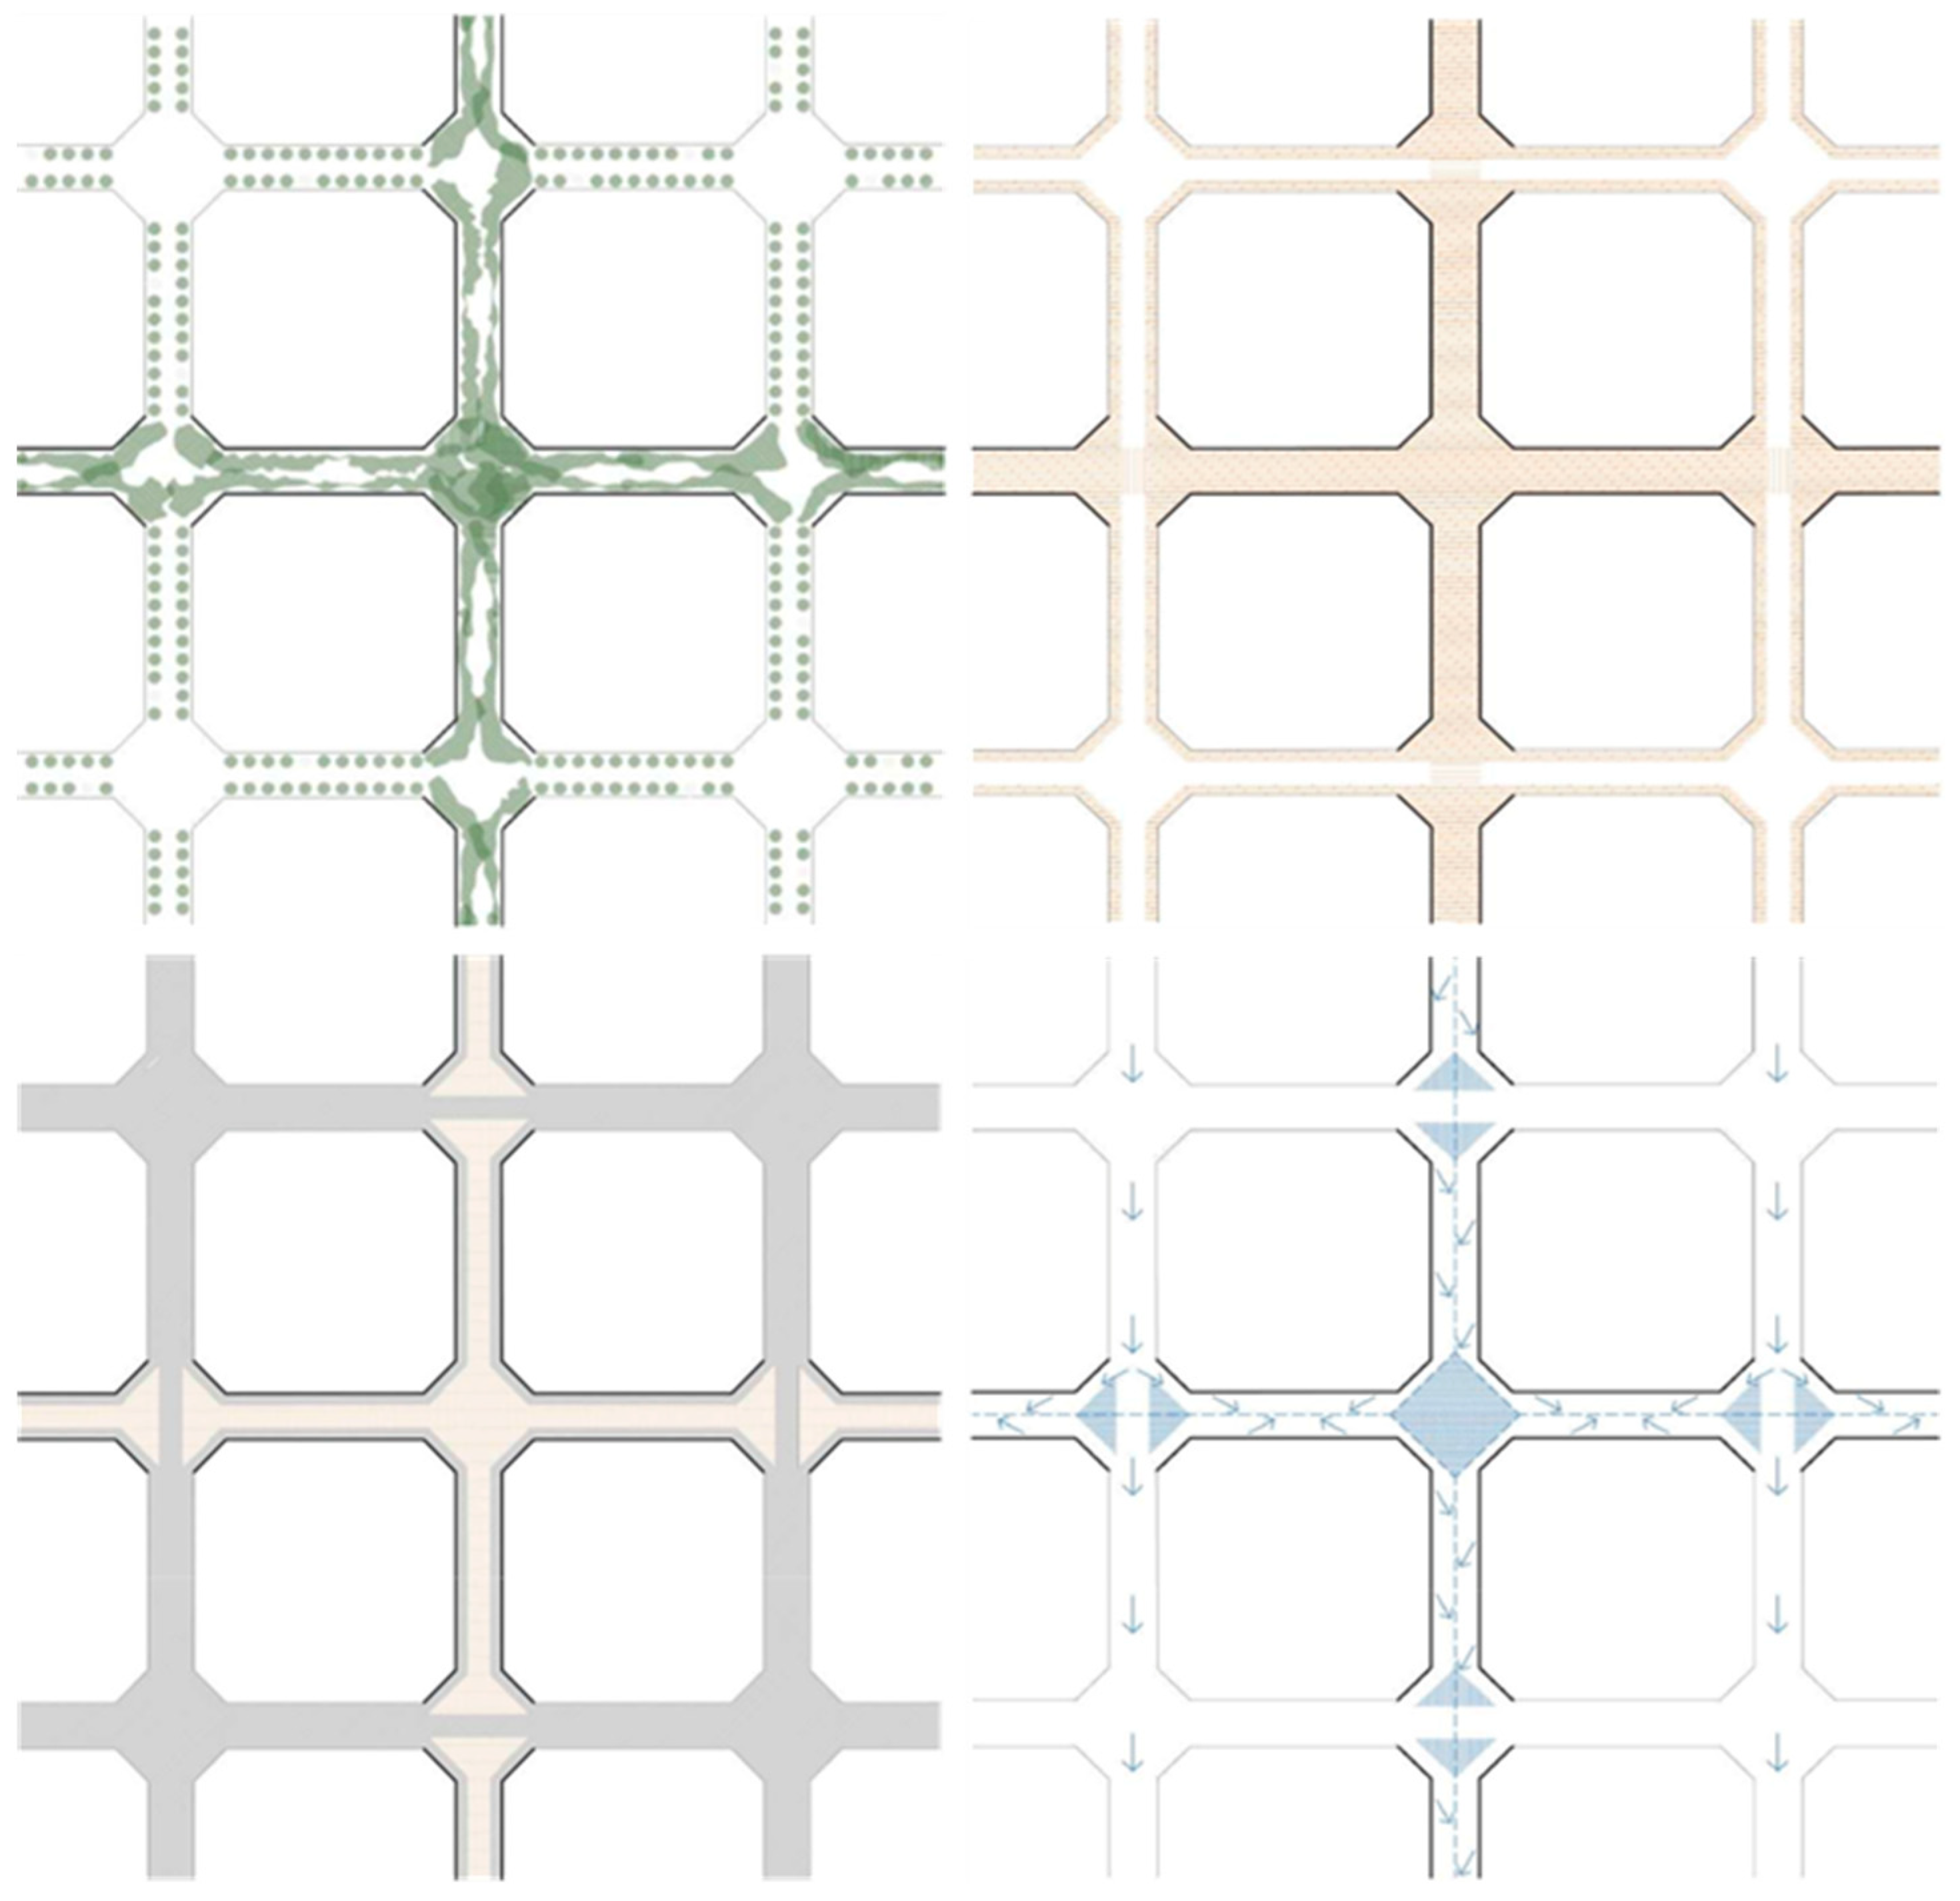
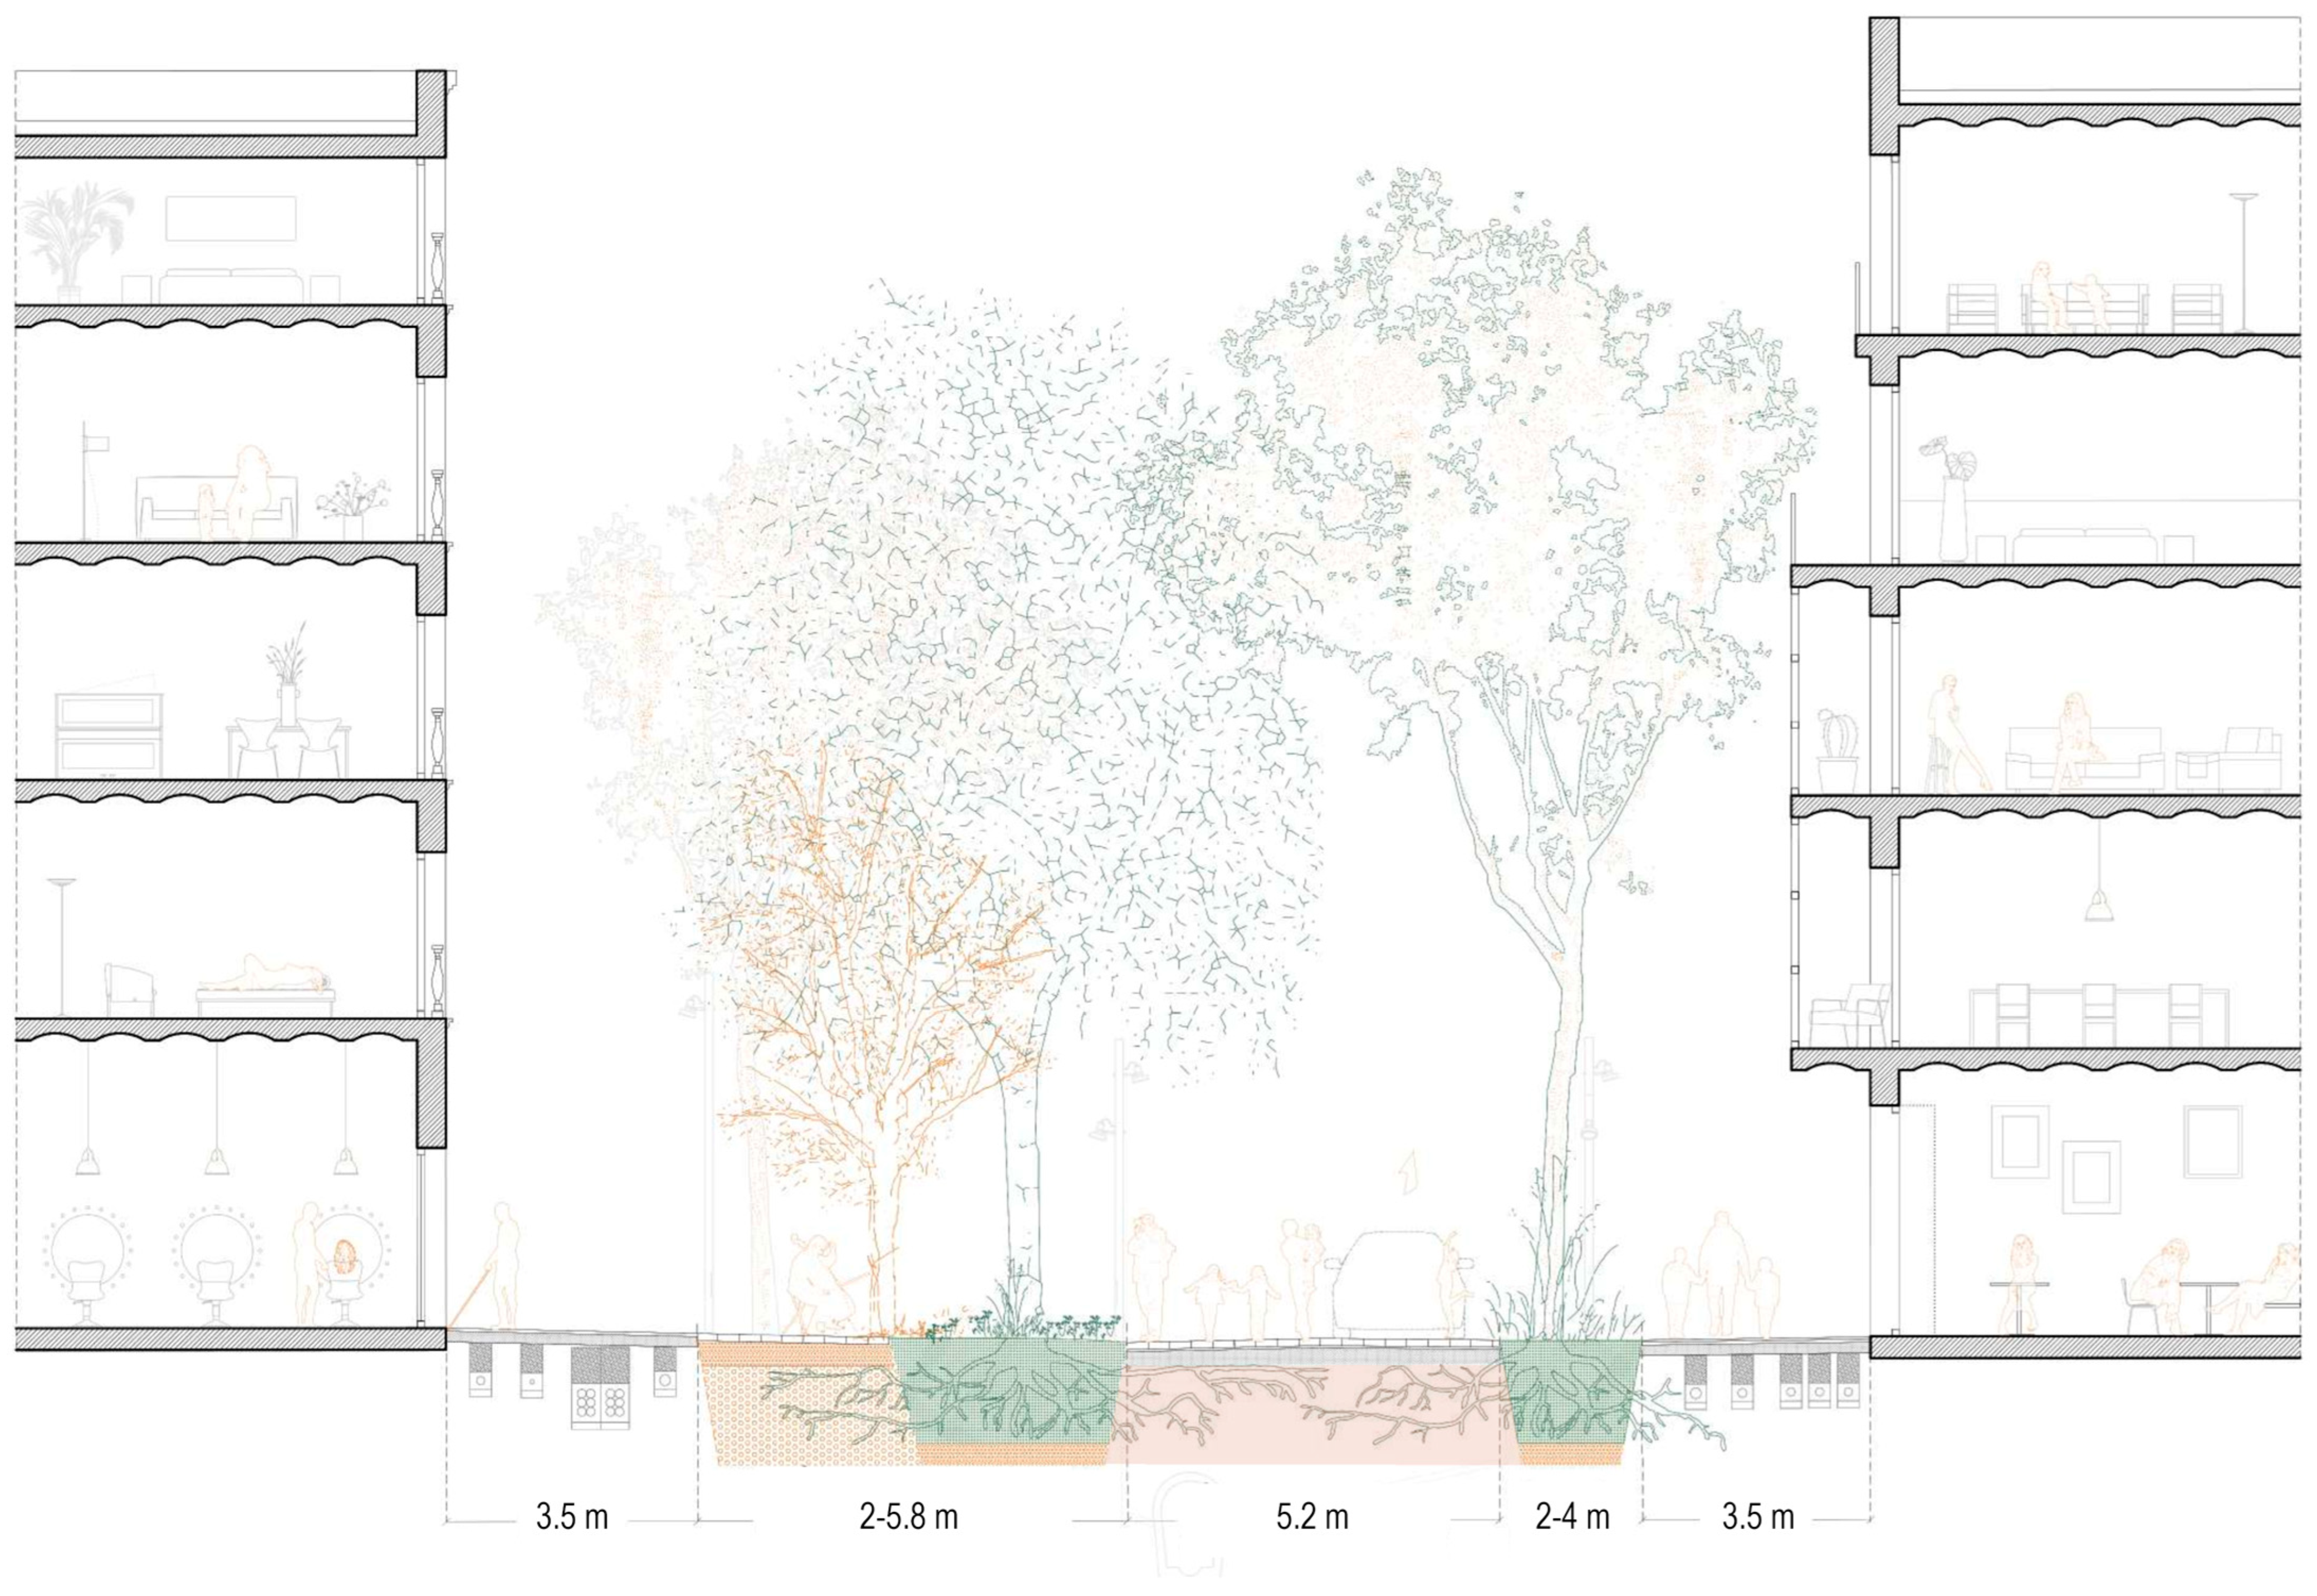
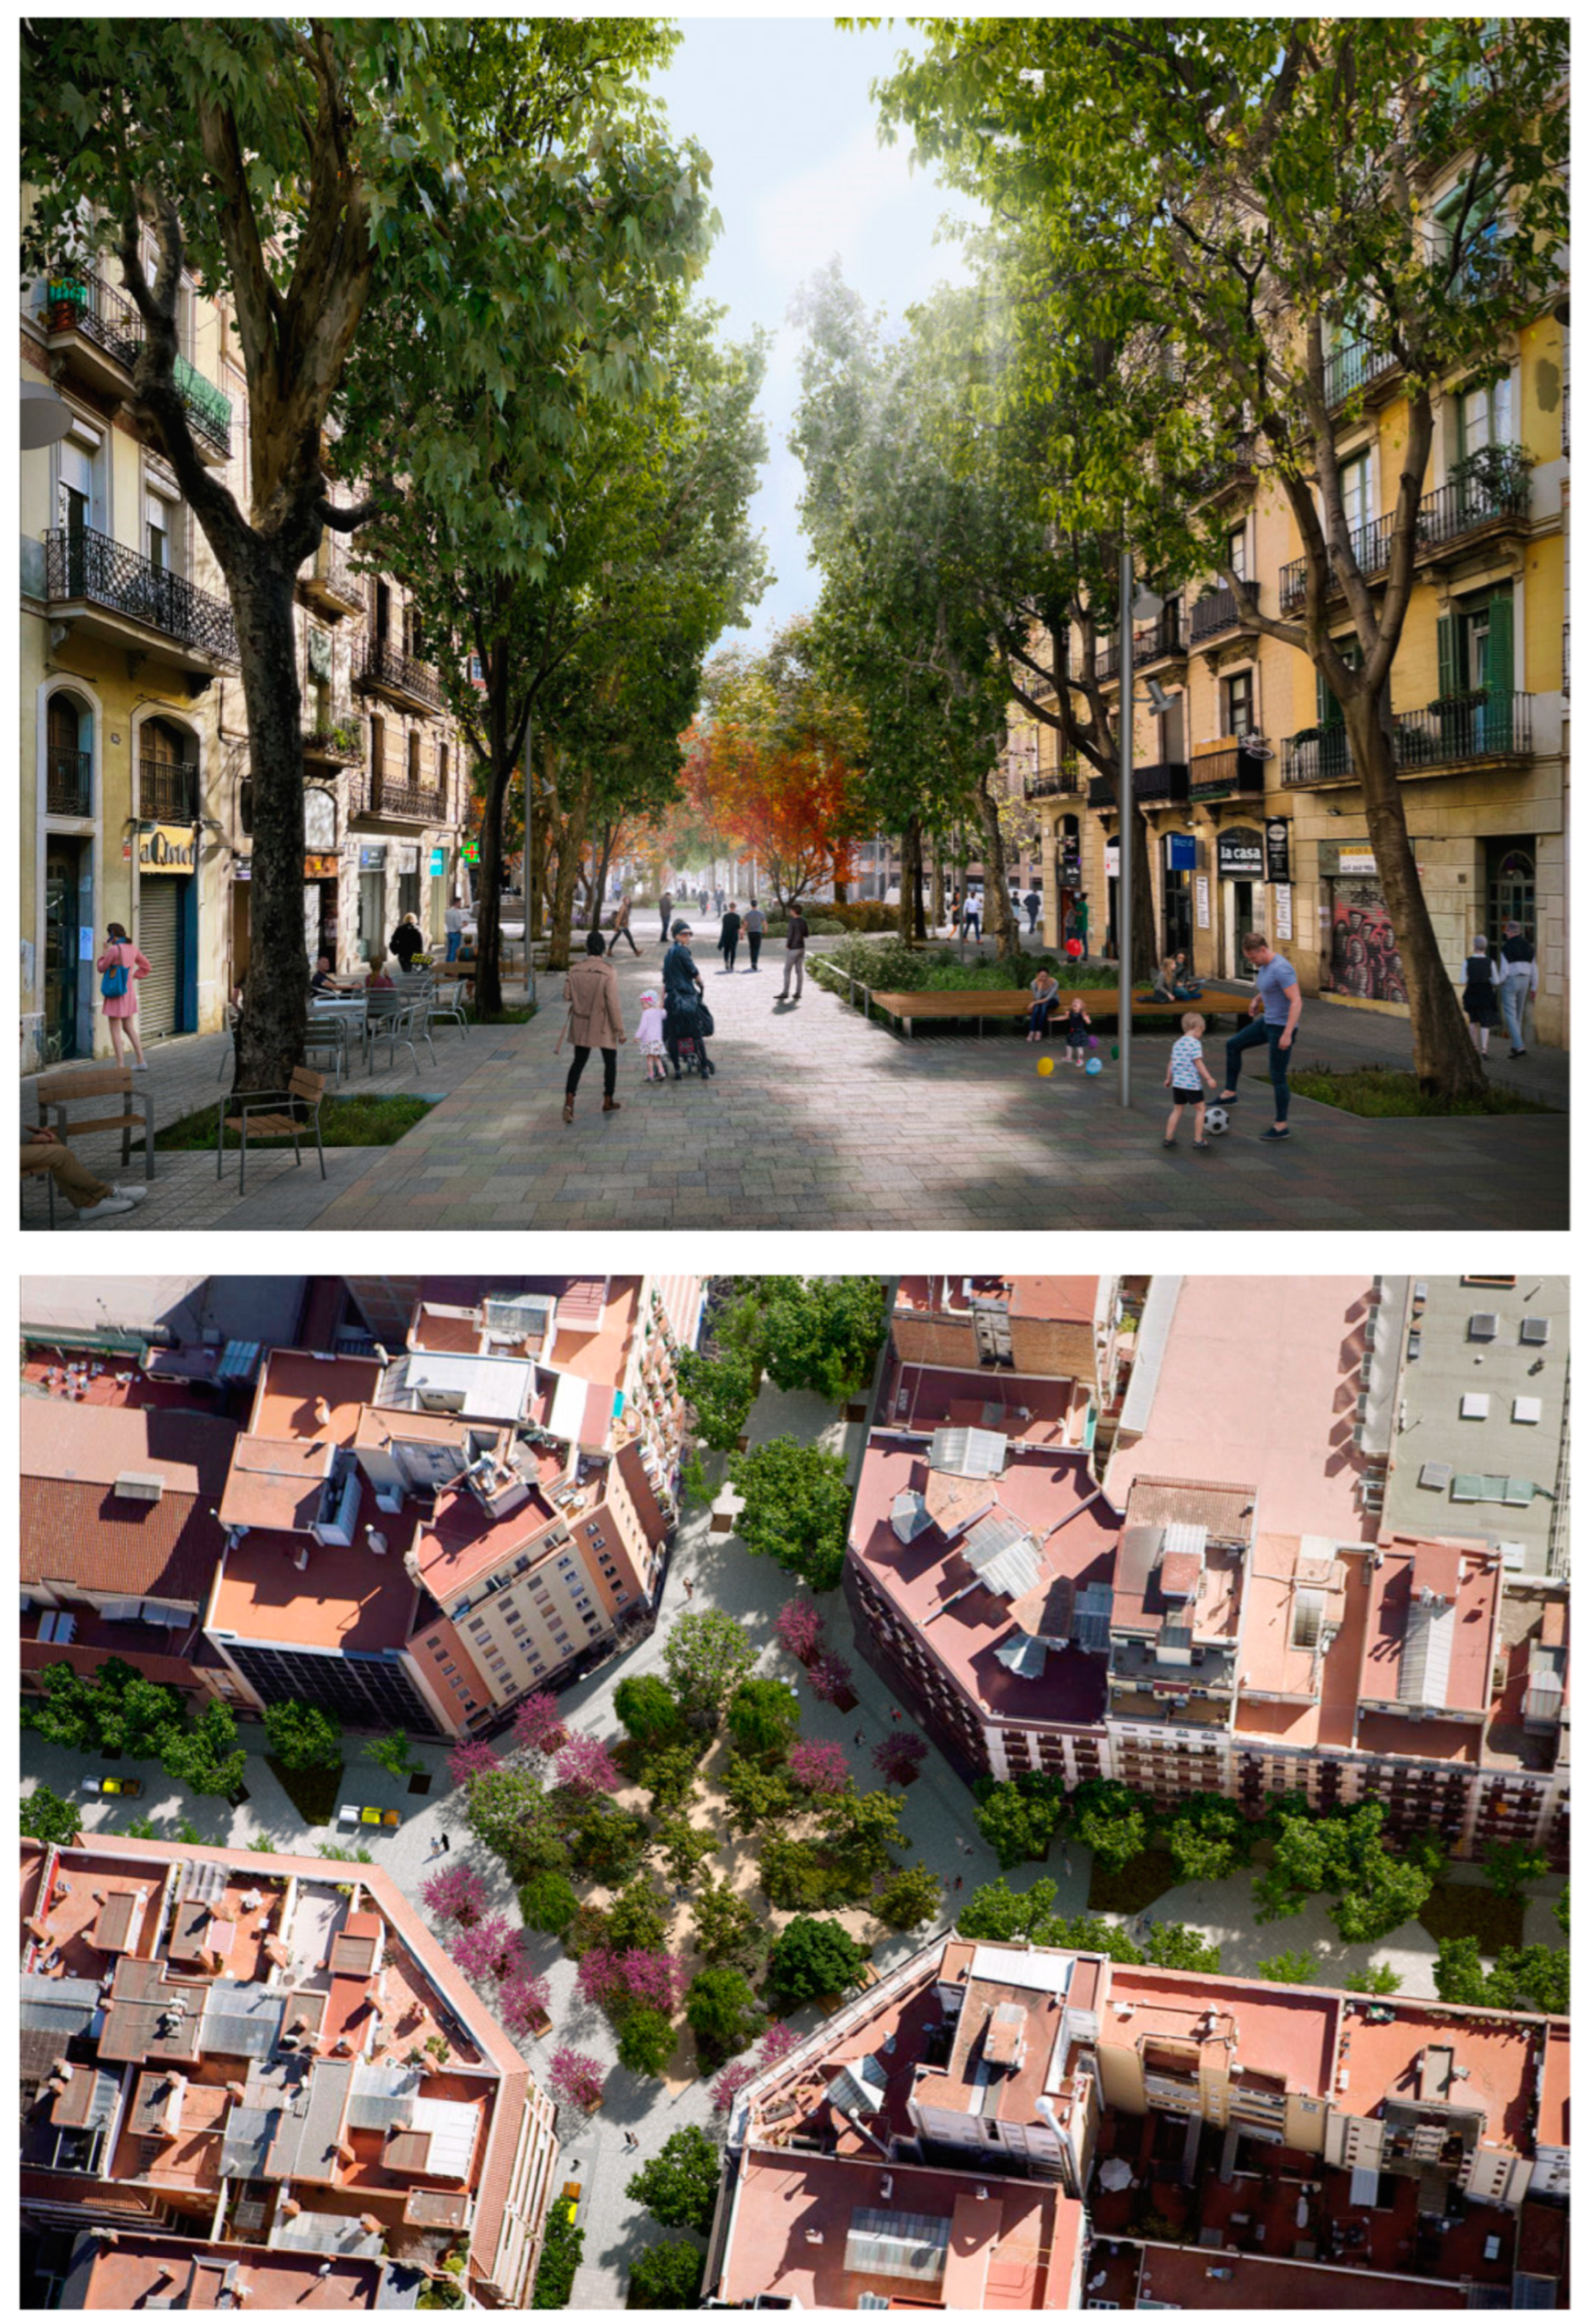
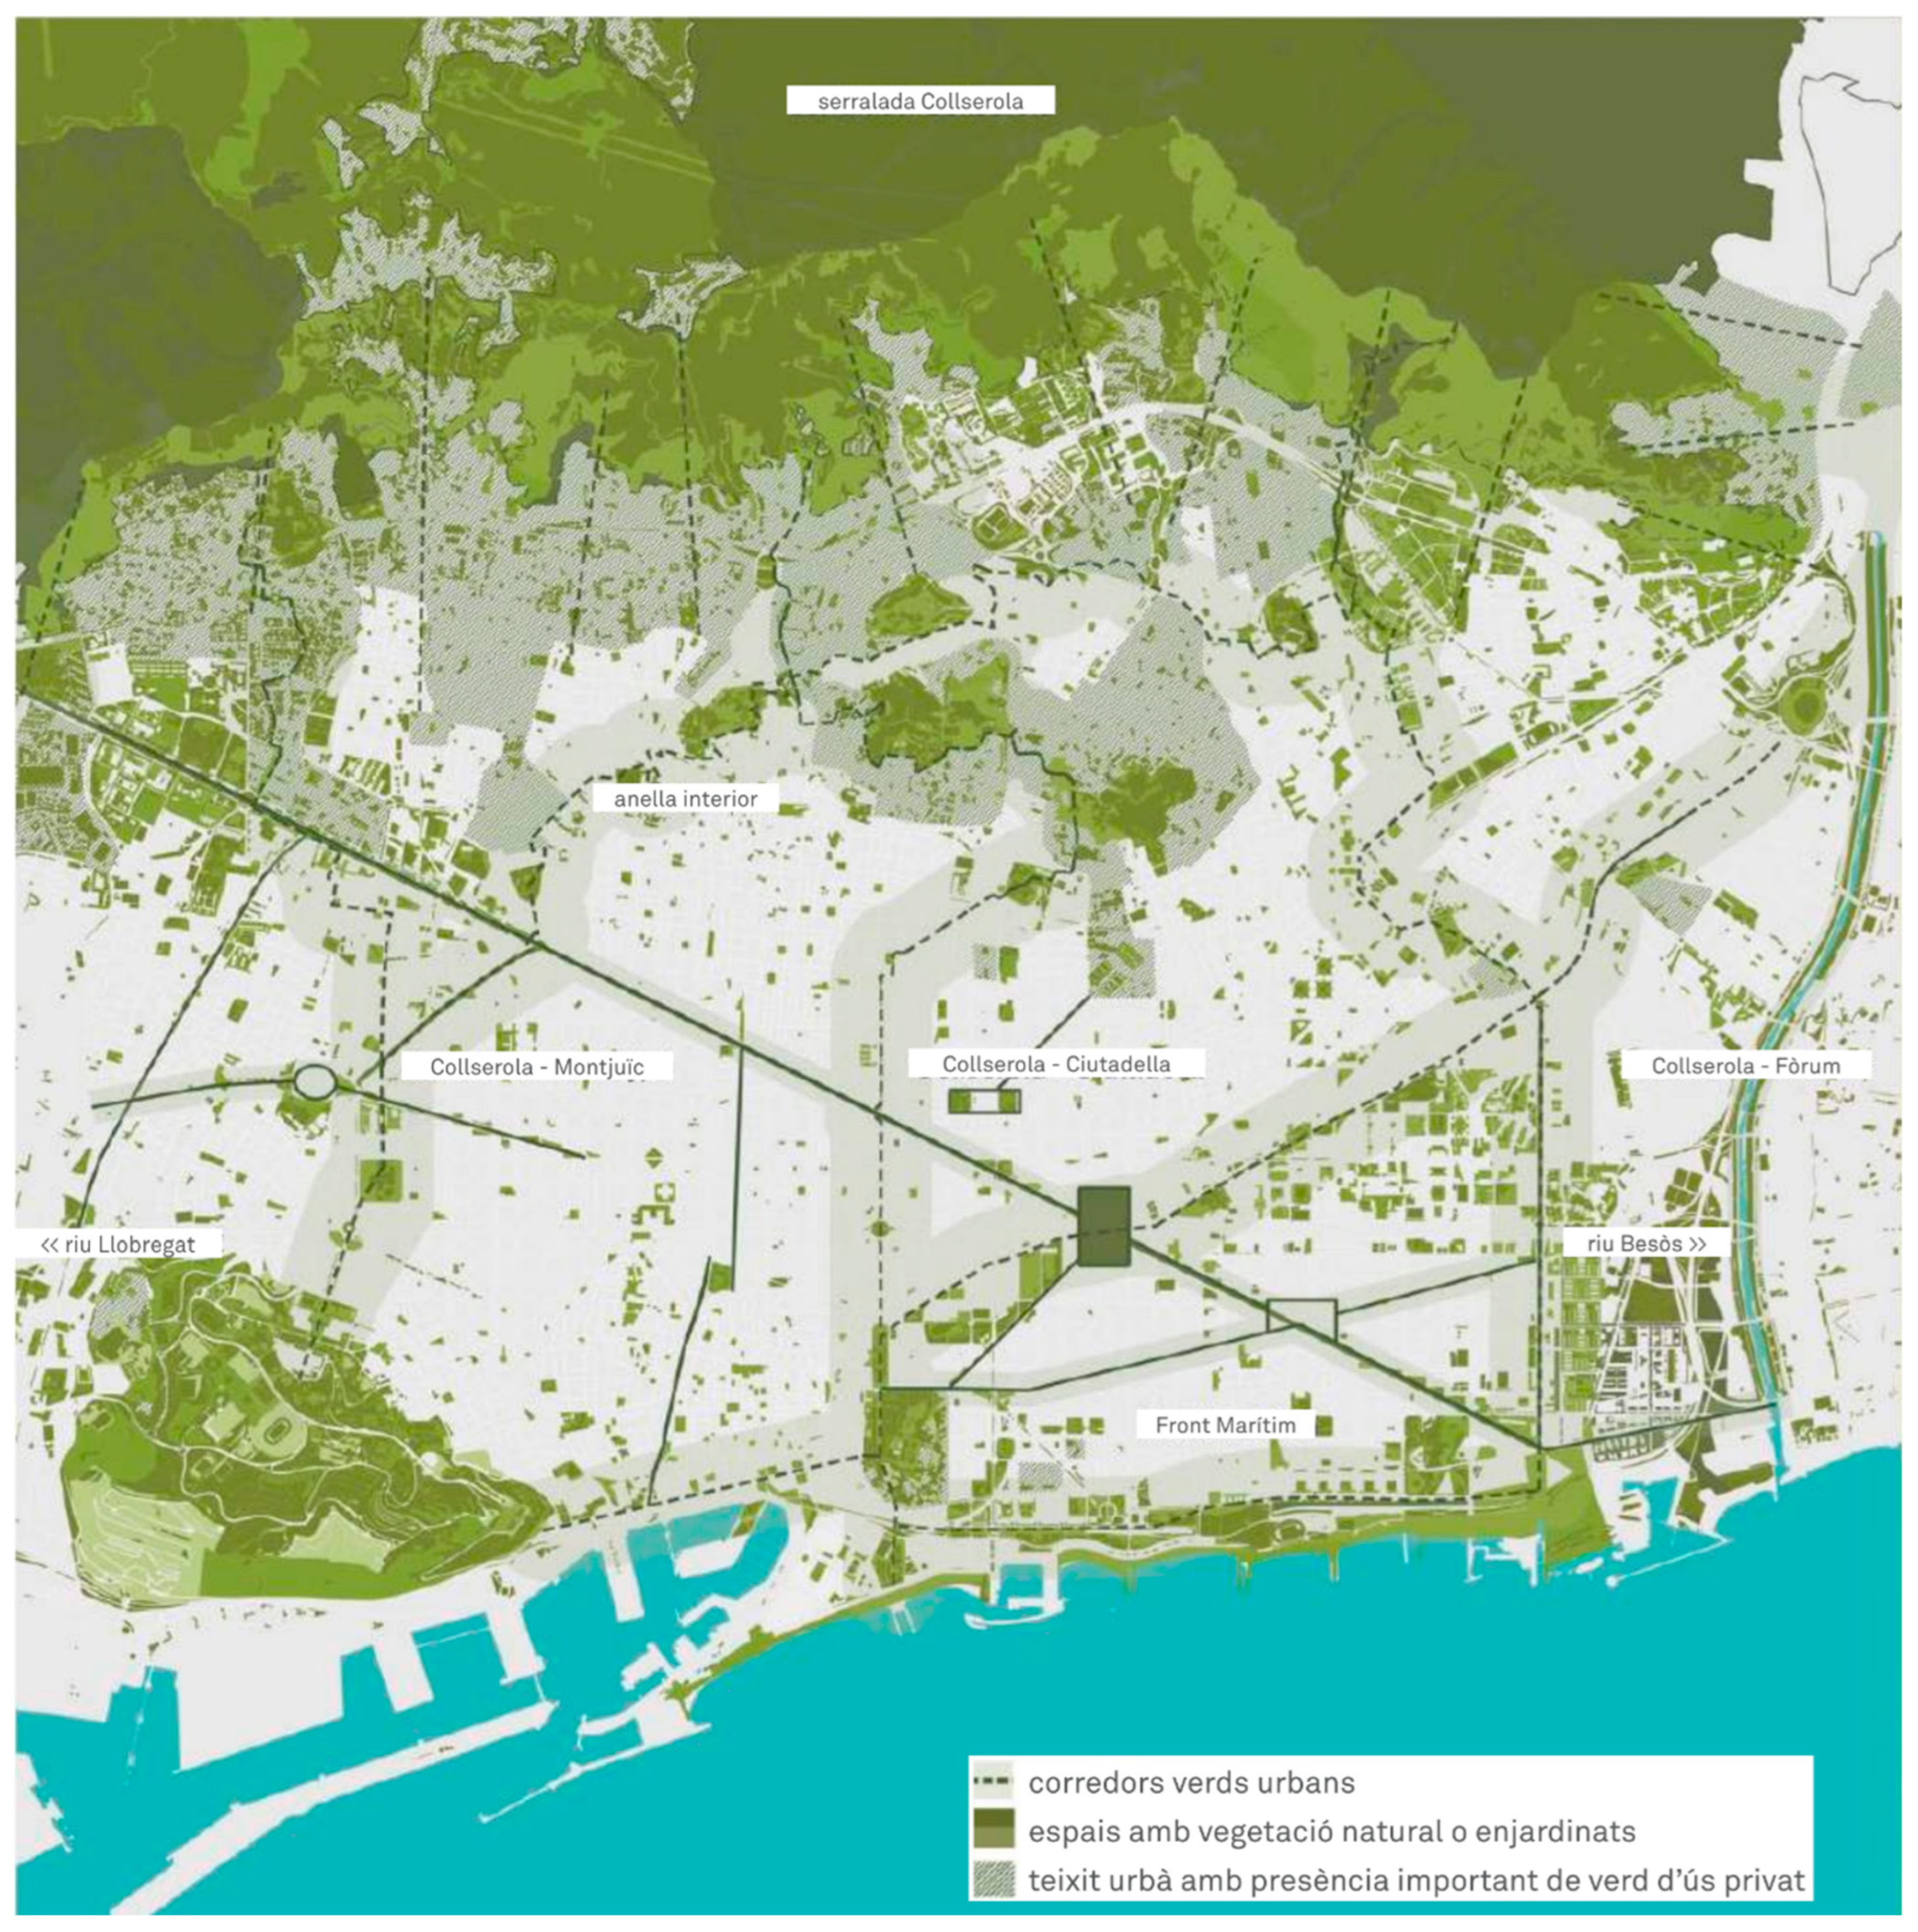
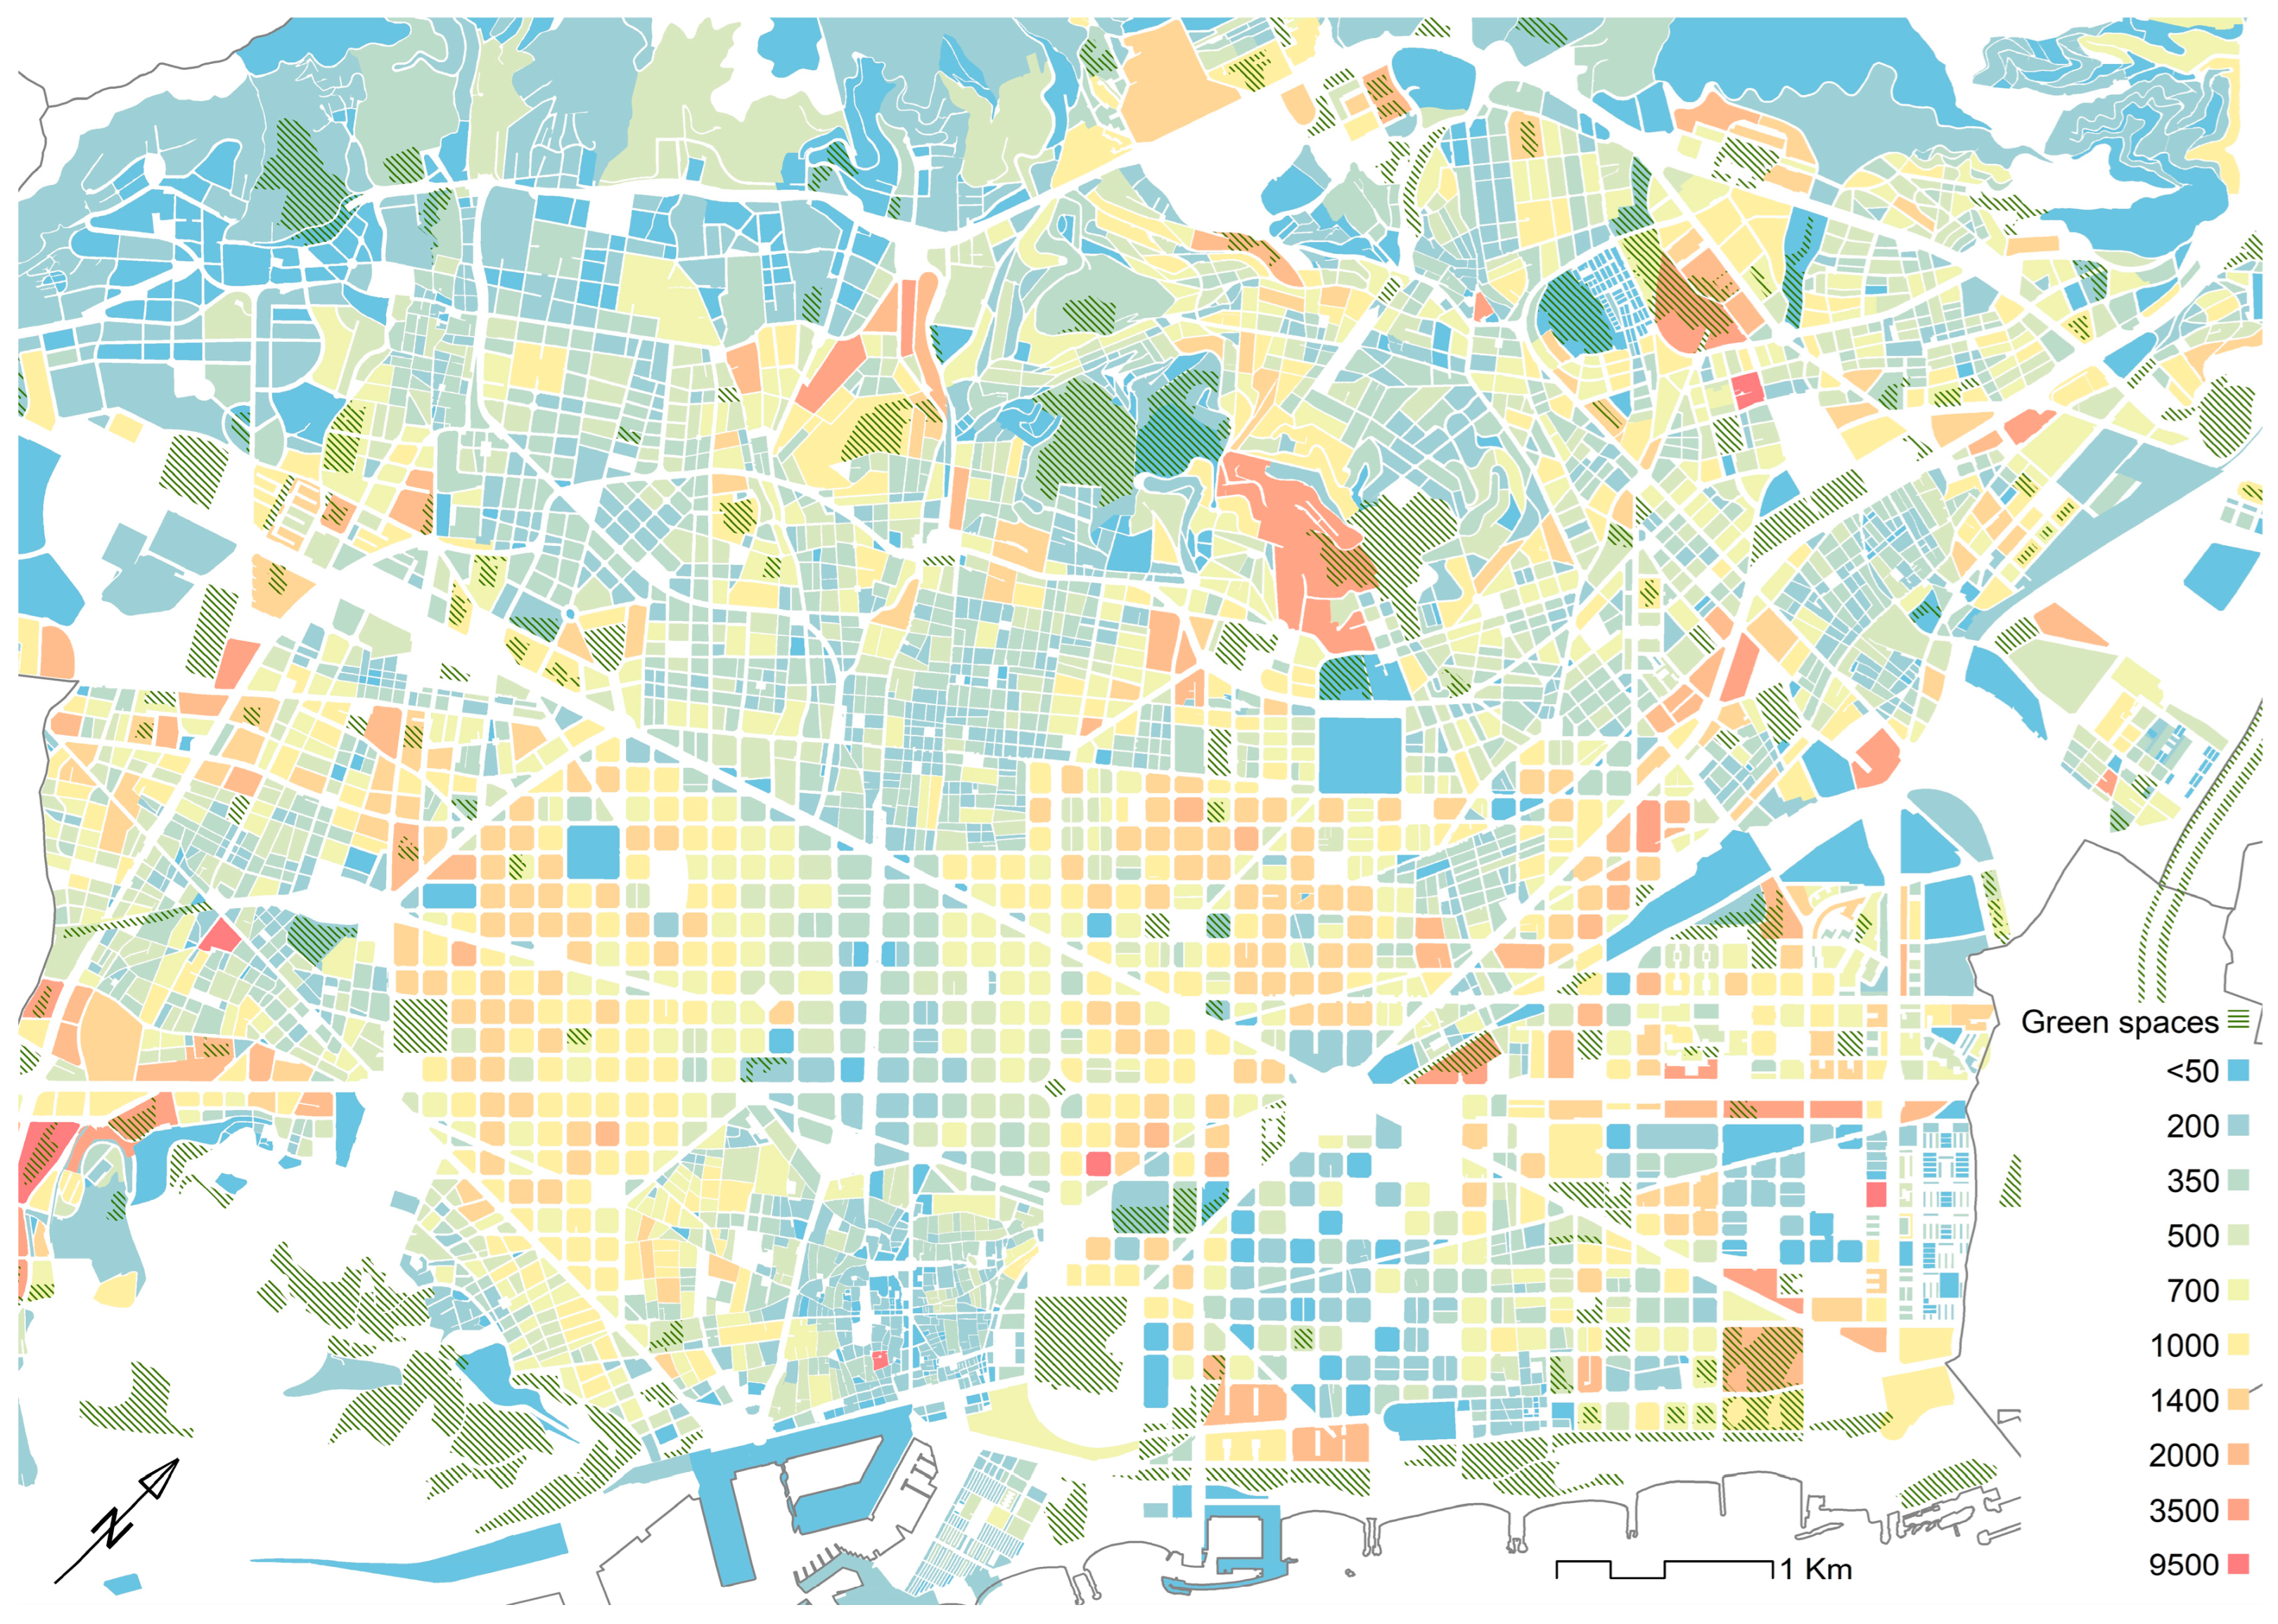
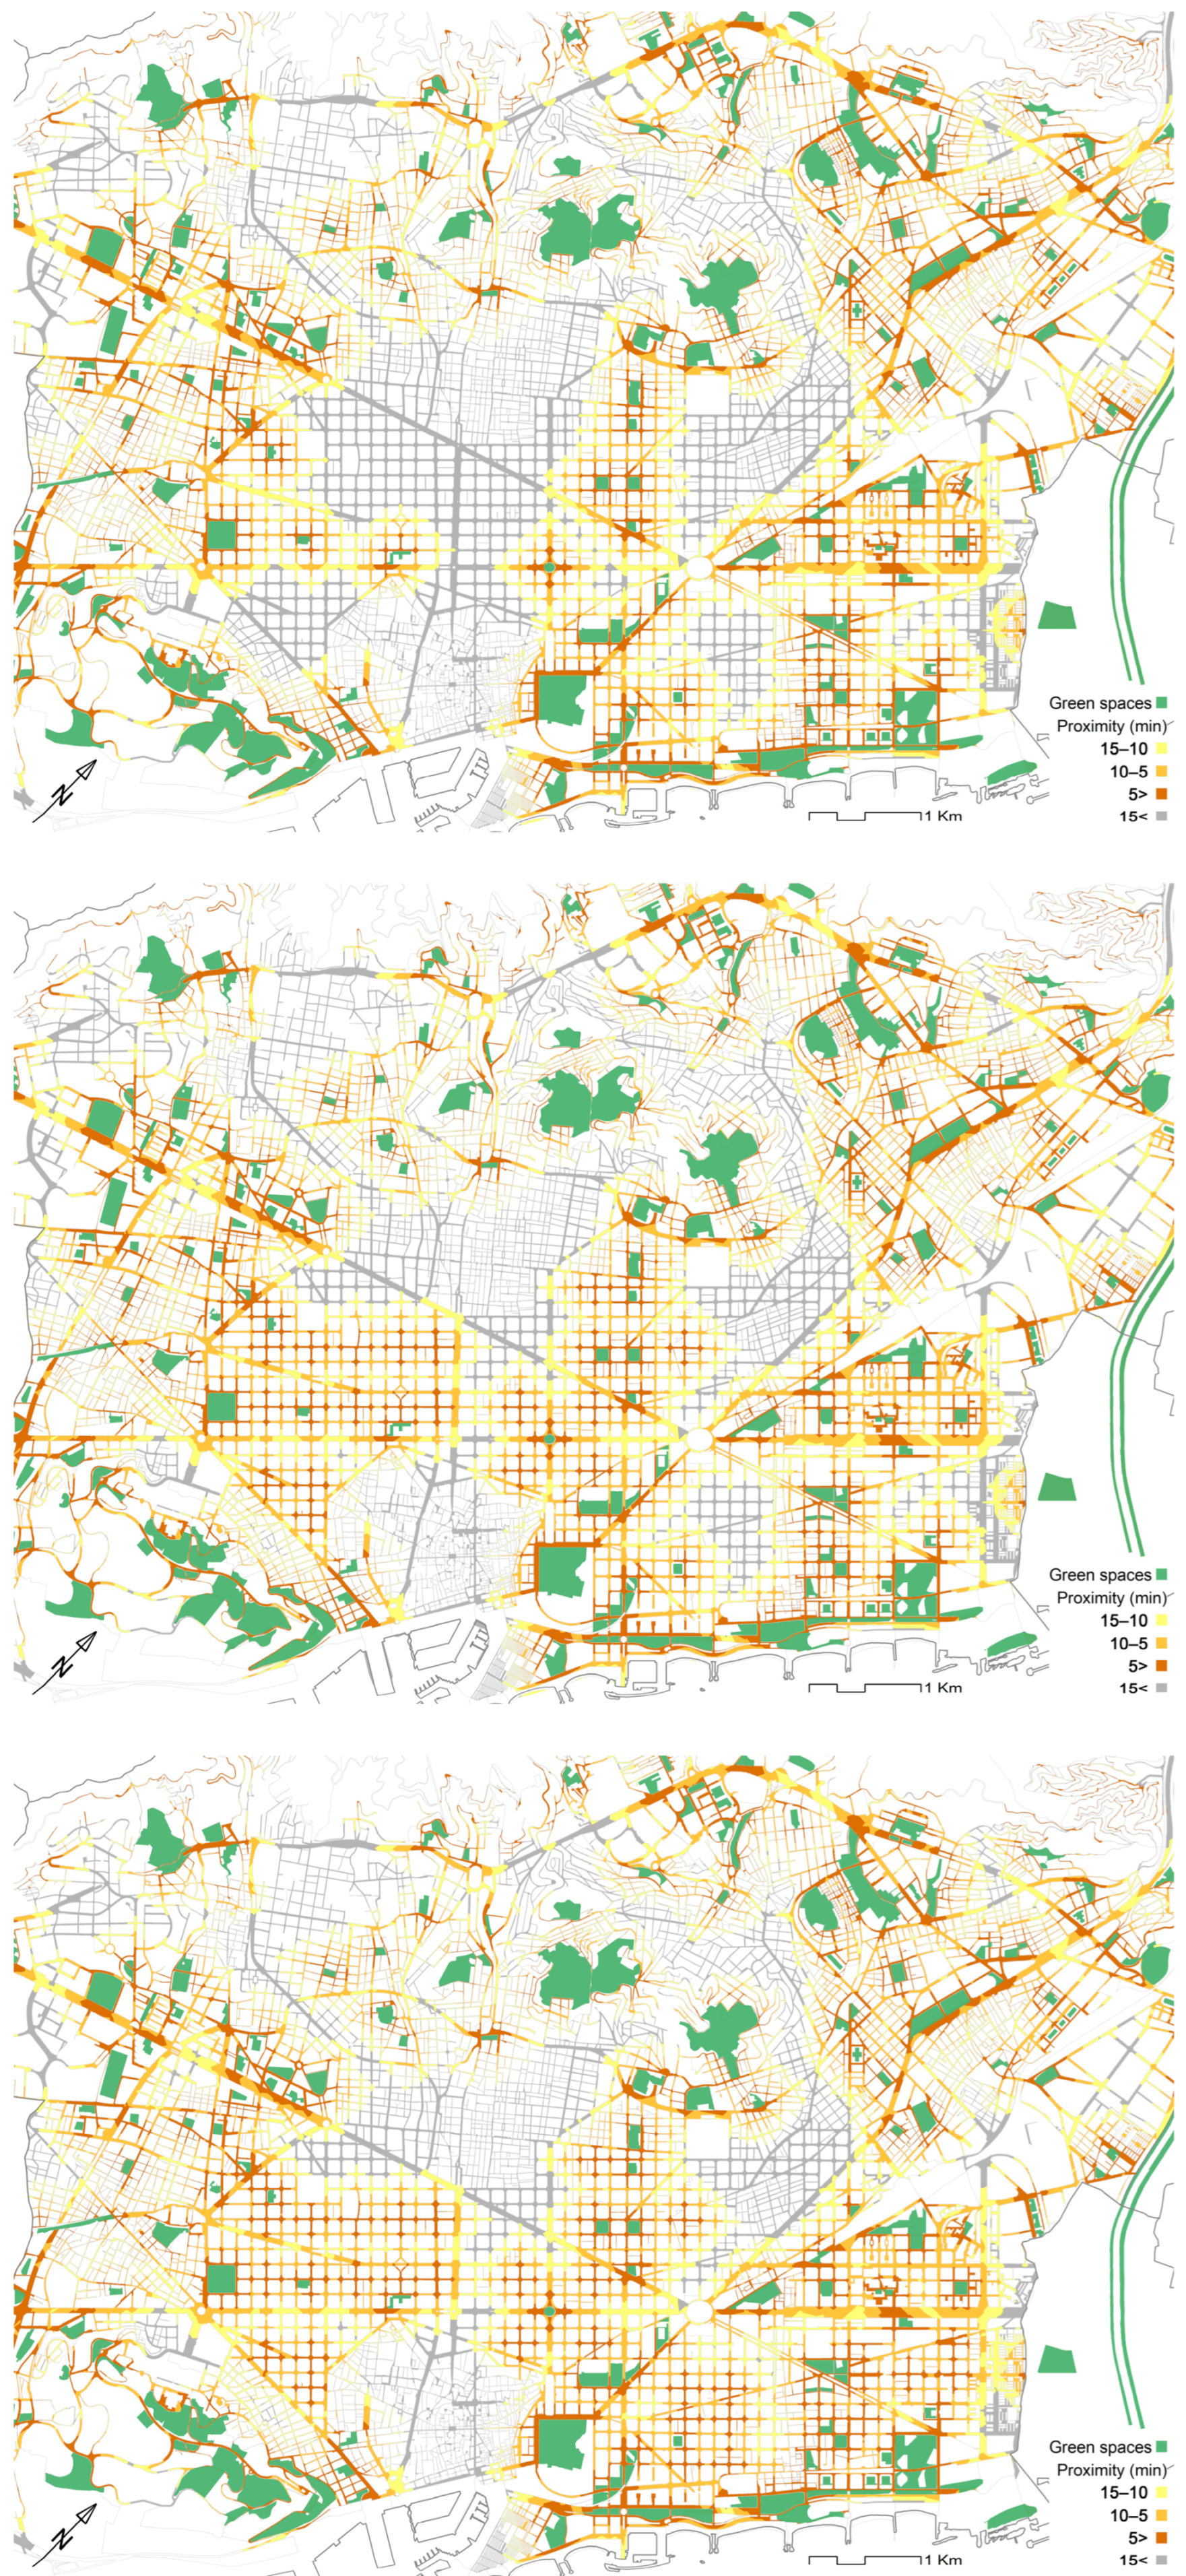
Table 1.
Population with access to green areas in the districts of Barcelona, in the current situation (scenario 0), with the green axes and square gardens implemented in L’Eixample district in 2030 (scenario 1), and with the green axes and square gardens extended to Sant Martí district (scenario 2). Source: the authors with original population data from Open Data BCN [62].
| Districts | Population | Population with Access to Green Areas | Rise * in Access to Green Areas | ||||||||
|---|---|---|---|---|---|---|---|---|---|---|---|
| January 2023 | Scen. 0 | % | Scen. 1 | % | Scen. 2 | % | Scen. 1 | % | Scen. 2 | % | |
| Ciutat Vella | 109,672 | 44,689 | 40.7 | 55,524 | 50.6 | 55,524 | 50.6 | +10,835 | +24.2 | +10,835 | +24.2 |
| L’Eixample | 269,349 | 163,282 | 60.6 | 250,794 | 93.1 | 250,794 | 93.1 | +87,512 | +53.6 | +87,512 | +53.6 |
| Sants-Montjuïc | 187,026 | 156,817 | 83.8 | 169,129 | 90.4 | 169,129 | 90.4 | +12,312 | +7.9 | +12,312 | +7.9 |
| Les Corts | 81,576 | 77,299 | 94.8 | 77,309 | 94.8 | 77,309 | 94.8 | +10 | 0.0 | +10 | 0.0 |
| Sarrià-Sant Gervasi | 149,201 | 109,081 | 73.1 | 109,083 | 73.1 | 109,083 | 73.1 | +2 | 0.0 | +2 | 0.0 |
| Gràcia | 123,276 | 46,637 | 37.8 | 55,265 | 44.8 | 55,265 | 44.8 | +8628 | +18.5 | +8628 | +18.5 |
| Horta-Guinardó | 173,944 | 127,207 | 73.1 | 127,207 | 73.1 | 127,207 | 73.1 | 0 | 0.0 | 0 | 0.0 |
| Nou Barris | 173,552 | 160,660 | 92.6 | 160,660 | 92.6 | 160,660 | 92.6 | 0 | 0.0 | 0 | 0.0 |
| Sant Andreu | 151,537 | 127,503 | 84.1 | 127,503 | 84.1 | 127,503 | 84.1 | 0 | 0.0 | 0 | 0.0 |
| Sant Martí | 241,181 | 178,380 | 74.0 | 186,982 | 77.5 | 204,807 | 84.9 | +8602 | +4.8 | +26,427 | +14.8 |
| Barcelona (city) | 1,660,314 | 1,191,555 | 71.8 | 1,319,456 | 79.5 | 1,337,281 | 80.5 | 127,901 | +10.7 | 145,726 | +12.2 |
* Compared to scenario 0.
Disclaimer/Publisher’s Note: The statements, opinions and data contained in all publications are solely those of the individual author(s) and contributor(s) and not of MDPI and/or the editor(s). MDPI and/or the editor(s) disclaim responsibility for any injury to people or property resulting from any ideas, methods, instructions or products referred to in the content. |
© 2023 by the authors. Licensee MDPI, Basel, Switzerland. This article is an open access article distributed under the terms and conditions of the Creative Commons Attribution (CC BY) license (https://creativecommons.org/licenses/by/4.0/).
Share and Cite
MDPI and ACS Style
Magrinyà, F.; Mercadé-Aloy, J.; Ruiz-Apilánez, B. Merging Green and Active Transportation Infrastructure towards an Equitable Accessibility to Green Areas: Barcelona Green Axes. Land 2023, 12, 919. https://doi.org/10.3390/land12040919
AMA Style
Magrinyà F, Mercadé-Aloy J, Ruiz-Apilánez B. Merging Green and Active Transportation Infrastructure towards an Equitable Accessibility to Green Areas: Barcelona Green Axes. Land. 2023; 12(4):919. https://doi.org/10.3390/land12040919
Chicago/Turabian StyleMagrinyà, Francesc, Josep Mercadé-Aloy, and Borja Ruiz-Apilánez. 2023. "Merging Green and Active Transportation Infrastructure towards an Equitable Accessibility to Green Areas: Barcelona Green Axes" Land 12, no. 4: 919. https://doi.org/10.3390/land12040919
Note that from the first issue of 2016, this journal uses article numbers instead of page numbers. See further details here.