Article

Classification of Rural Relative Poverty Groups and Measurement of the Influence of Land Elements: A Questionnaire-Based Analysis of 23 Poor Counties in China

School of Public Administration and Policy, Renmin University of China, Beijing 100872, China
*
Author to whom correspondence should be addressed.
Land 2023, 12(4), 918; https://doi.org/10.3390/land12040918
Submission received: 23 March 2023 / Revised: 8 April 2023 / Accepted: 17 April 2023 / Published: 19 April 2023

Abstract

:
In 2021, China achieved an all-round victory in the fight against poverty and completed the task of eliminating absolute poverty. However, relative poverty will still exist for a long time. According to the degree of relative poverty, this paper divided rural population into four groups, incapability group, vulnerable group, marginal group and non-relative poverty group, to further explore the differences in specific land elements requirements among different groups. Firstly, ten factors were selected as evaluation indexes, including per capita household income, education level, poverty registration situation, employment situation, critical disease situation, natural disaster frequency situation, etc. By extracting 100 relative poverty group evaluation units as samples, the authors established a decision tree for rural relative poverty group evaluation based on an improved ID3 algorithm. Secondly, we quantified the effect of different land elements. Considering the resource, asset and capital function of land, this paper constructed an ordered logistic model with four groups as classification variables. The result showed that: (1) a better condition of land resource endowment leads to a lower degree of rural relative poverty; however, over-reliance on land increases the risk of relative poverty; (2) except for cultivation income and land transfer income, asset value and capital value of rural land are not evident. Suggestions are put forward: use land elements to build a long-term mechanism for rural relative poverty alleviation; improve the quantity, quality and spatial endowment of rural land resources; optimize the rural land property rights and land acquisition system; realize the market-based mechanism for rural land transfer; and implement the policy of Increase and Decrease Connection of Urban and Rural Construction Land.

1. Introduction

Poverty eradication is a common mission among human beings and one of the greatest challenges that the world needs to face together today [1,2]. The United Nations has put forward the goal of comprehensive poverty eradication in the 2030 Agenda for Sustainable Development (SDGs). In 2021, China achieved a comprehensive victory in the battle against poverty and successfully completed the great task of eradicating absolute poverty. Although the problem of absolute poverty in China has been solved, it does not mean that the problem of poverty in China has ended, but has shifted from absolute poverty to relative poverty [3]. China has entered the “post-poverty alleviation era”, which has raised higher requirements for the establishment of a long-term national poverty alleviation governance system.
Currently, relative poverty is usually considered to be a state in which basic subsistence needs are met but the quality of living is below the basic social standard of living, and in which there is a lack of expanded reproductive capacity or the capacity is relatively weak [4]. Compared with absolute poverty, relative poverty is more complex, with characteristics of universality, fragmentation, multidimensionality, dynamism and being long-term [3,5]. Relative poverty will persist in the future, and it needs to be urgently included as a key research object. There is no uniform definition of poverty. A certain percentage of average income is usually used as a criterion to distinguish relative poverty [6,7,8]. In fact, relative poverty is not only reflected in income, but also in personal ability, education, health and many other factors. As a result, the types of poverty are multidimensional and complex [9,10,11]. To better achieve the goal of poverty eradication, precise identification of the types of poverty group and their actual needs is needed. With regard to the period of poverty transition in China, different scholars have summarized the relative poverty groups that need attention according to the characteristics of relative poverty and the causes of poverty, including vulnerable group (including the elderly, the sick and the disabled), transition poverty group, multidimensional poverty group, developmental poverty group, structural poverty group, the group prone to return to poverty, the marginal poverty group, etc. [3,12,13,14,15,16]. In reality, relative poverty groups may have multiple poverty characteristics superimposed; thus, there are large differences in poverty levels.
Poverty in China is mainly concentrated in rural areas, and rural poverty is one of the most important problems Chinese society faces [17]. According to the standards of national-level poverty counties, there are 832 national-level poverty counties in China, distributed in 22 provinces before they were withdrawn, and the distribution of national-level poverty counties is shown in Figure 1a. As of 2021, the number of China’s rural population is 498.35 million, accounting for 35.28% of the total population of the country. The rural poor in China is mainly concentrated in the central, western and southwestern regions [18]. In the past decades, the Chinese government has taken a series of measures to alleviate rural poverty [18,19], including implementing precise poverty alleviation policies, increasing infrastructure construction in rural areas, etc. Rural poverty problem is affected by many factors, such as the condition of arable land, environmental disasters, and energy poverty [20]. According to the results of China’s third national land survey [21], China’s arable land covers an area of 127,861,900 hectares, and 64% of which is distributed in the northern regions, the distribution of China’s arable land [22] is shown in Figure 1b. Five provinces, including Heilongjiang, Inner Mongolia, Henan, Jilin, and Xinjiang, have large arable land areas, accounting for 40% of the country’s arable land. The quality of arable land is complex, mainly influenced by natural and human factors, and there are certain regional differences [23]. Common environmental disasters in China include earthquakes, flash floods, typhoon disasters, droughts, sand and dust storms, etc., and direct economic losses caused by geological hazards account for more than 20% of the total annual economic losses from natural hazards [24]. In addition, most of the rural poor are engaged in agricultural production and rely mainly on the sale of agricultural products to sustain their livelihoods; however, some rural areas are not easily accessible, and it takes longer and more money for farmers to transport their agricultural products to urban farmers’ markets, which increases the cost of sales and hinders farmers from escaping poverty [25,26].
Land is the most important resource and asset for poor groups, and land policy reform plays an important role in poverty reduction [26,27,28]. Using land elements to combat poverty is an important element of China’s poverty eradication efforts [29,30,31]. The land poverty alleviation policies currently implemented in China can be divided into three main categories, namely land resource policies, land asset policies, and land capital policies [30,32,33,34,35]. Improvements in land resource endowments favor short-term poverty reduction, while improvements in land asset and capital endowments have relatively long-term effects on rural poverty. Land resource poverty alleviation policy directly improves the natural properties of land, improves the quantity and quality of land resources through agricultural land improvement, construction land improvement and ecological land improvement [17,34], improves the agricultural production and living conditions in poor areas, and alleviates the problem of deep poverty; the land asset poverty alleviation policy is mainly reflected in the quantitative guarantee of land resources, through the confirmation of the right to use collective construction land and the right to use residential bases, improving land property rights in poor areas, regulating land trading market, guaranteeing the right of farmers to income from land assets, and raising the income level of poor farmers; land capital poverty alleviation policies mainly optimize the allocation mechanism of land factors and promote the capital financing of land resources, and the main ways include the transfer of land contract management rights, mortgage of land management rights, balance of arable land, and increase and decrease linkage of urban and rural construction land, etc.
Most of the current studies on land poverty alleviation focus on centralized, large-scale input poverty alleviation models, mechanisms and effects for poor areas [28,36,37]. The target of poverty alleviation is mainly the region rather than the population, ignoring the different specific needs of the poverty target for land, and it is unable to provide effective suggestions for implementing precise poverty alleviation policies or improving the quality of land poverty alleviation. Moreover, land poverty alleviation is mostly oriented towards absolute poverty and generally ignores relative poverty groups which present more complex and fragmented poverty characteristics than absolute poverty. Different types of relative poverty group have different functional needs for land, and their relative poverty levels may be influenced by different degrees from land elements. Most of the studies on relative poverty groups also rely only on a surface analysis of the characteristics of poverty, and do not realize the precise identification and classification of relative poverty groups, which is difficult to match the scattered, multidimensional and dynamic differences in poverty characteristics of different relative poverty groups. To achieve precise governance of relative poverty, precise identification of relatively poor groups at the individual level should be accomplished.
In conclusion, the existing studies lack mechanistic analysis of the role of land elements in the governance of rural relative poverty groups, especially based on different types of land elements. On the one hand, there is an impact of different types of land elements on the division of rural relative poverty groups; on the other hand, the endowment of different types of land factors affects the degree of relative poverty. However, the role of different types of land elements has not received sufficient attention in relevant studies, which only treat land as a unified whole, and the distinction of poverty reduction effects among resource, asset and capital endowments of land elements is not clear. Therefore, it is necessary to study the specific effects of three land elements on different relatively poor groups. In the future, to use the land factor to combat relative poverty, we must first realize the precise identification of relative poverty groups, and then, on this basis, reconceptualize what exactly is the new role of land for relative poverty.
The objectives of this paper are: first, to classify the relative poverty groups in rural China into four categories, namely the incapability group, vulnerable group, the marginal group and non-relative poverty group; second, to analyze the influence of three land element endowments, namely land resources, land assets, and land capital, on different rural relative poverty groups. This study uses farm household research data from national poverty-stricken counties (before exit) in China to construct an evaluation model of rural relative poverty groups. Then, we quantify the differentiation effects of three types of land elements: resource, asset and capital, through regression analysis and marginal effects analysis, to provide theoretical reference and practical basis for using land elements to solve relative poverty problem.
The subsequent sections of the paper are organized as follows: Section 2 is the theoretical framework and research hypothesis, analyzing the problem of identifying relative poverty groups in rural China and the influence of land elements on relative poverty groups, and putting forward the research hypothesis; Section 3 is the research design and variable selection, constructing a decision tree evaluation model of relative poverty groups in rural areas, classifying relative poverty groups into four categories, and constructing an econometric model of the differentiating influence of land elements; Section 4 is the empirical study, using the decision tree model to classify and evaluate the relative poverty groups, and using the multivariate ordered logistic model to analyze the differentiation impact of land factors on the relative poverty groups; Section 5 is the discussion of the study; Section 6 is the main conclusions and policy recommendations of the study.

2. Theoretical Analysis and Research Hypothesis

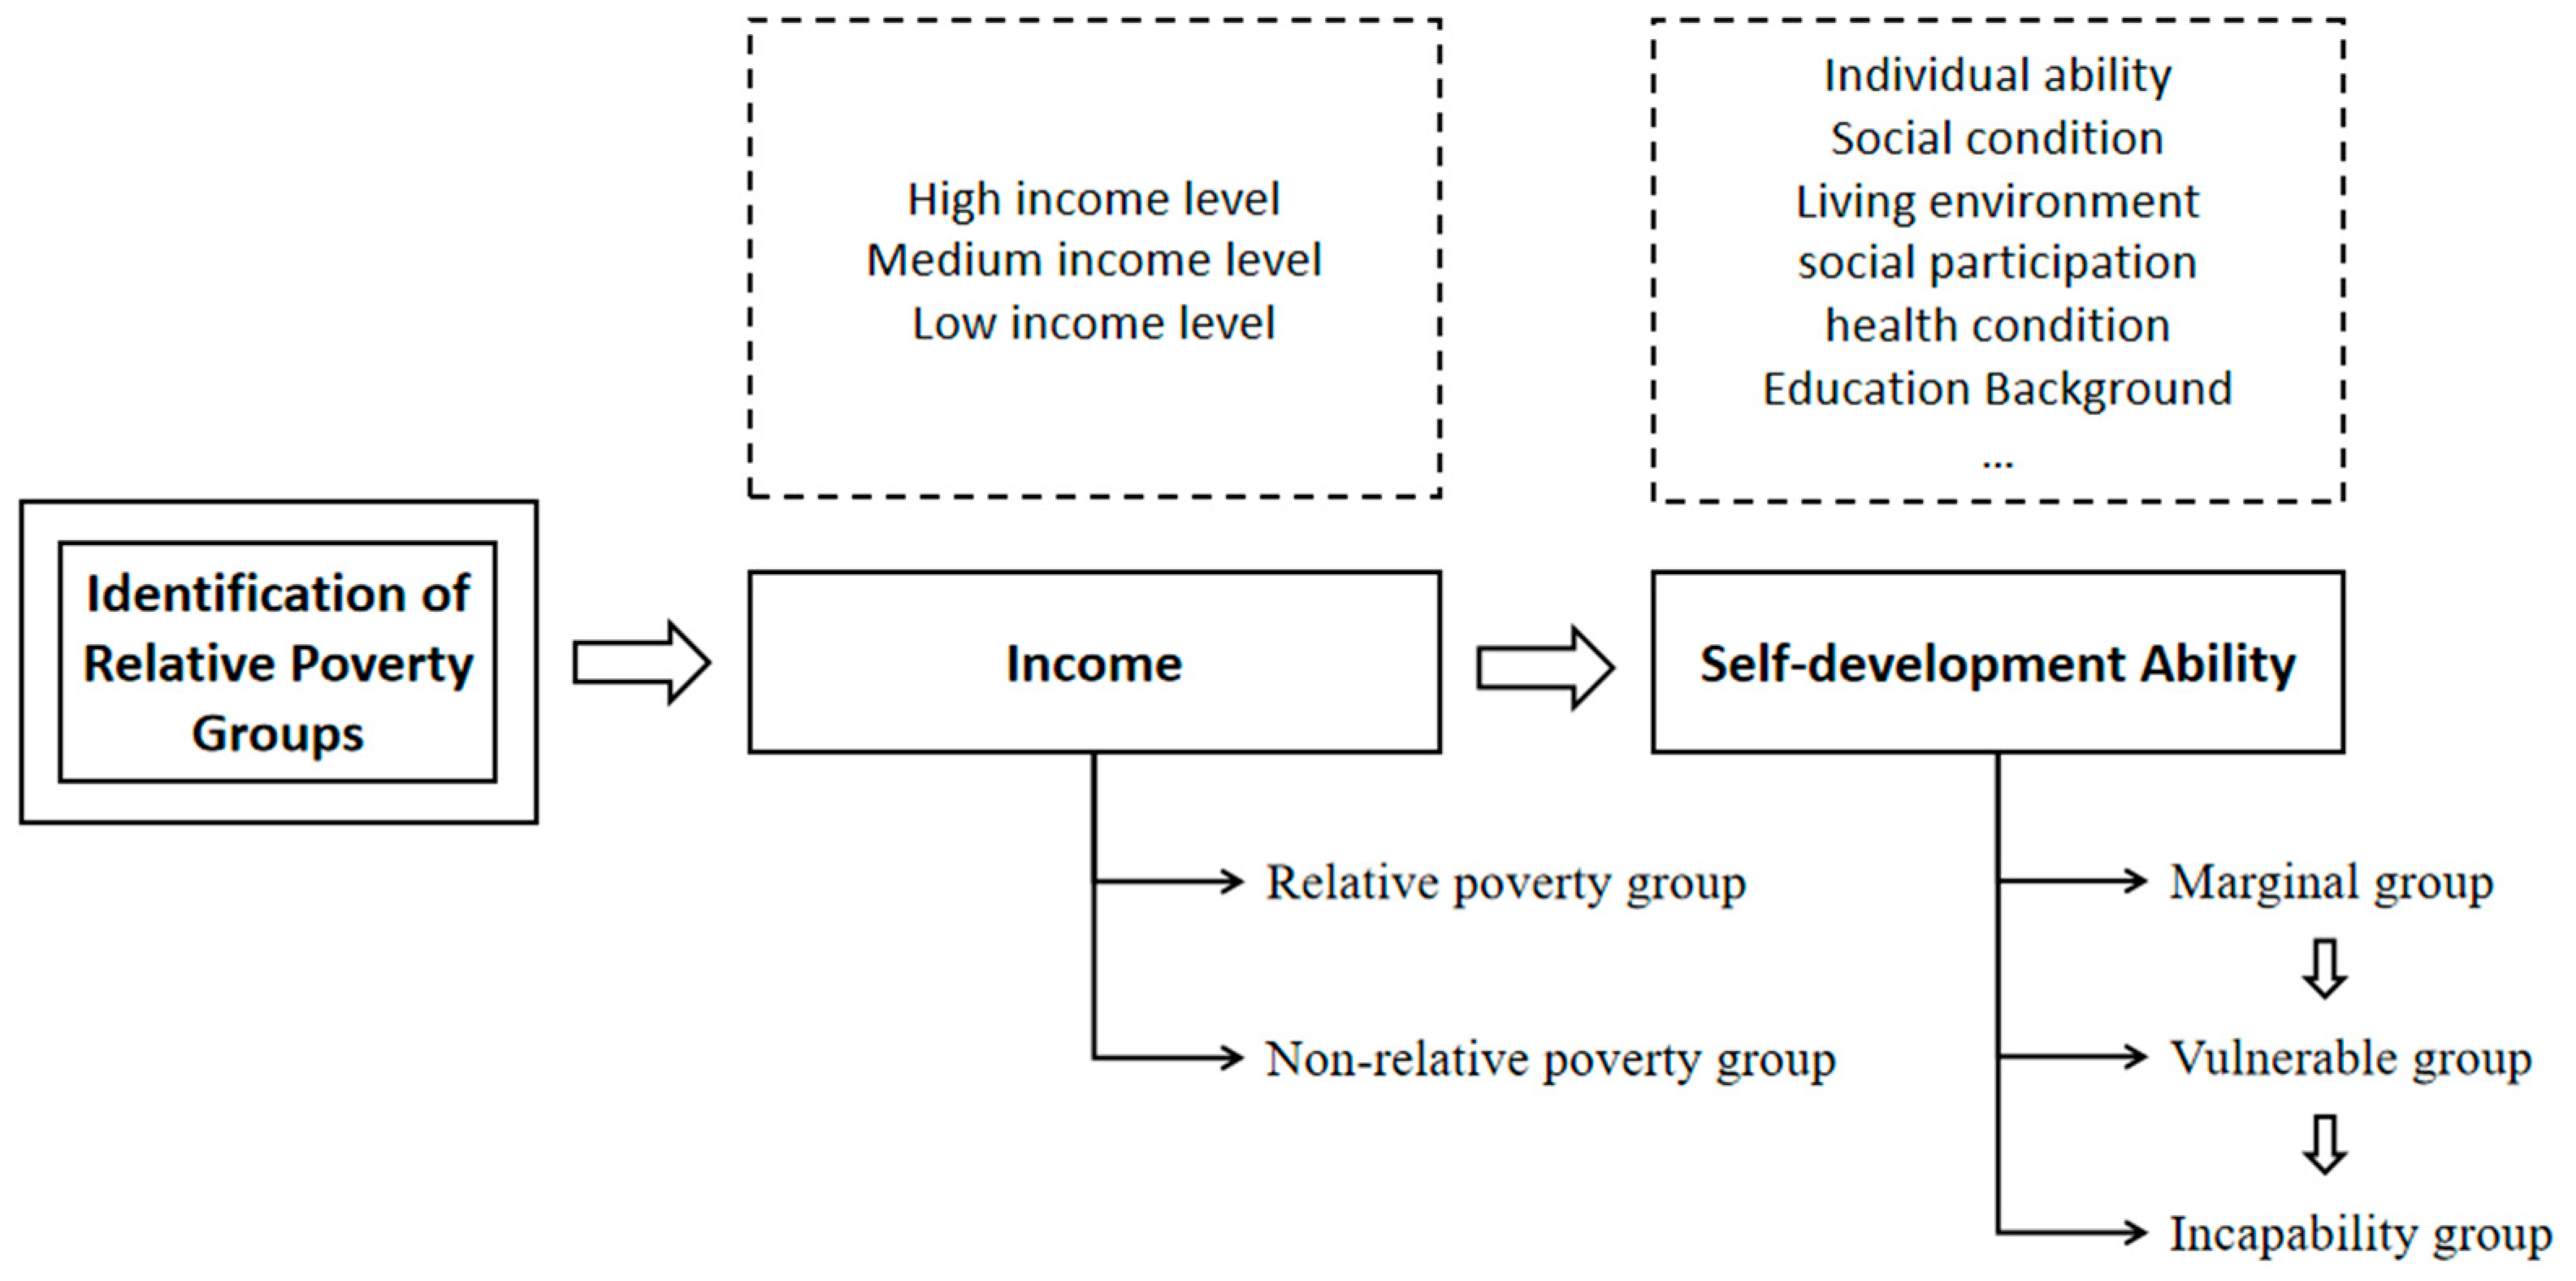
2.1. Rural Relative Poverty Group Identification: Based on Poverty Deprivation Perspective

Relative poverty is a state of poverty which is more complex and difficult to define. Absolute poverty can usually be defined by being below a certain income level [38]; however, for the definition of relative poverty, it is necessary to consider higher-level needs in addition to income status. Townsend, a British scholar, was the first to conduct systematic research on relative poverty and first proposed the definition of the concept of relative poverty, arguing that relative poverty is not only reflected in a person’s low-income level, but also in the lack of social resources, viability and social rights, and that these people are usually excluded and marginalized by society and fall into poverty [39]. On this basis, he proposed the concept of “poverty deprivation” to reflect the degree of relative poverty of poor groups. In identifying and measuring relative poverty, we should not only consider whether the income level can meet the basic needs of survival, but also take into account more social factors, including individual ability, social conditions, living environment, social participation and other aspects [8,40,41,42,43,44]. The United Nations Development Programme defined the relative poverty criteria in 2010, proposing a system of indicators with three dimensions: health status, education acquisition and life quality. Relative poverty groups are relatively deprived due to a lack of the above social resources and have higher vulnerability to poverty [45,46]. Income levels are vulnerable to risks or shocks that can lead to poverty, either temporarily or chronically, depending on the level of deprivation. Amartya Sen further develops the concept of capability deprivation based on poverty deprivation, arguing that there may be viable capability deprivation in relative poverty, i.e., the relative poverty group may lack the ability to obtain the basic resources for survival and development, and thus cannot escape the poverty situation through their own efforts [47].
Therefore, a relative poverty group has the characteristics of low-income level, high vulnerability and weak viability, etc. When identifying the relative poverty group in rural areas, we should firstly judge whether they belong to the poverty range according to their income level, so as to distinguish the relative poverty group from the non-relative poverty group; secondly, we should analyze their own development ability such as their health status, education acquisition and social participation, and judge whether there is a poverty deprivation status; finally, we should further judge the relative poverty level according to the actual deprivation status. Based on the actual situation of rural poverty in China, this paper divides the rural relative poverty groups into the following three categories (Figure 2): incapability group, vulnerable group and marginal group; in addition, there is a progressive relationship between the three groups in terms of poverty. The incapability group refers to the group with loss of labor capacity including the old, weak, sick and disabled, with low income level, poverty vulnerability and lack of feasible ability; the vulnerable group refers to the group whose income level has been removed from the absolute poverty standard, but with a high possibility of returning to poverty due to the existence of various risks and weakness of their own development capacity, with low income level, poverty vulnerability but with certain feasible ability; the marginal group refers to the group that has not been included in the poor households before, but with a relatively weak development capacity of their own and needs to be included in relative poverty, with low income level, low poverty vulnerability and certain feasible ability.

2.2. Analysis of the Impact of Land Elements on Rural Relative Poverty Groups

Land is one of the main and most direct factors of production and living for rural people, with three functions: resource, asset and capital, and is the most important source of economic income for most rural people. Poverty caused by land factors can be summarized into three types, namely land resource-based, land asset-based and land capital-based poverty [38,48,49].
The key to the ability of land as a factor of production is that land is a natural resource, and its resourcefulness is mainly reflected in the material state of land, including factors such as land area, land fertility, ground slope, soil thickness, degree of concentration, infrastructure conditions and environmental conditions. Poverty of rural populations is often associated with fragile natural resource endowments [50]. The causes of land resource-based poverty include poor land resource endowment, fragile ecological environment, and frequent geological disasters [51,52,53]. Farmers earn income by growing and selling food crops or cash crops. The natural resource endowment of land determines the scale, output and efficiency of land production. For example, the larger the area of land, the higher the yield of farmers planted, the higher the income earned, and the lower the risk of poverty; the quality of land affects the yield and quality of crops, which indirectly affects the income level of farmers; water infrastructure affects the irrigation capacity of farmers, and the lack of water infrastructure reduces the efficiency of agricultural production, leading to a reduction in farmers’ income and increasing the risk of poverty. If farmers have better land resource endowment conditions, then the corresponding production costs are lower, production efficiency is higher, and they can obtain higher economic returns and lower degree of relative poverty; conversely, poorer land resource endowment conditions will affect the scale and cost benefits of agricultural production and increase farmers’ poverty vulnerability [22].
Therefore, we propose Hypothesis 1:
Hypothesis 1 (H1). 
There is a significant effect of land resource element on the division of rural relative poverty groups, and the better the condition of land resource endowment, the lower the relative poverty degree of farmers.
On the basis of natural resources, land can be occupied and used as a property, thus giving rise to ownership and use rights to land (land ownership in China is divided into state land ownership and collective land ownership), and income from land can be earned by owning or using it [54,55]. Providing access to land for the poor is good for poverty reduction [29,56,57]. Homestead is the land necessary for rural residents’ housing and living [58], which has a direct impact on farmers’ living and poverty situation, and sufficient homestead area can provide farmers with the guarantee of basic living needs and reduce the risk of poverty. Compensation income from land acquisition refers to the economic compensation paid to farmers after the government expropriates their land, which can increase farmers’ income and alleviate their poverty situation [59]. Farming income directly affects farmers’ poverty situation, and the higher the farming income received by farmers, the lower the poverty level of farmers. The causes of land asset-based poverty include two aspects: on the one hand, the property rights of agricultural land and residential bases in rural areas are not clear enough, and land asset attributes are not reflected, so that farmers cannot obtain due economic compensation when facing infringement problems such as land expropriation and forced demolition; on the other hand, the value of land assets owned by farmers is low, and it is difficult for farmers to obtain a higher income from land asset-based income. Under the premise that the asset nature of land is manifest, land assets can bring certain economic benefits to land owners and users [60], including cultivation income obtained through the use of land and economic compensation obtained from land expropriation, etc. The more land assets farmers own, the higher the economic benefits that can be translated, and the corresponding poverty level should be lower.
Therefore, we propose Hypothesis 2:
Hypothesis 2 (H2). 
There is a significant effect of land asset element on the division of rural relative poverty groups, and the higher the value of land assets, the lower the relative poverty degree of farmers.
When land is put on the market as an asset or when inputs are made to the land, the land will form value-added, the former in the form of lease or transfer of land tenure relationship, the latter in the form of capital, labor or technical inputs. At this time, the asset nature of the land is transformed into the capital nature, and the capitalization of land is conducive to alleviating the problem of rural poverty [49]. Common land capital factors include land transfer income, agricultural land operation input, land dividend income, and compensation for Increase and Decrease Connection of Urban and Rural Construction Land. Land transfer refers to the transfer of land use rights from farmers who have contracted land management rights to other farmers or economic organizations, which is conducive to revitalizing idle and inefficiently utilized land, improving the efficiency of land resource allocation and utilization, enabling farmers to obtain the benefits brought by the market premium of land resources, and mortgage loans for land use rights can break the dilemma of difficult rural financing which can increase farmers’ business income [35,61,62,63]. Farmers’ operation inputs to agricultural land, such as purchasing seeds, improving agricultural infrastructure, irrigation, fertilization, pest control, improving agricultural infrastructure, paying labor costs, etc. Adequate operation inputs for agricultural land can promote industrialized agriculture, improve agricultural production efficiency, and increase farmers’ income from land management [64,65]. Land dividend income refers to the surplus construction land used by the village to build a factory or transferred, leased or valued as shares to others for building a factory, and the annual dividends to villagers, which is a reliable economic source and can reduce the risk of poverty of farmers [66]. Compensation for Increase and Decrease Connection of Urban and Rural Construction Land means that according to the policy, the abandoned land and redundant homesteads in the village are vacated and reclaimed as arable land, and the surplus construction land index can be provided to the town, giving a certain compensation to the village and farmers [67], which can increase farmers’ incomes.
Therefore, we propose Hypothesis 3:
Hypothesis 3 (H3). 
There is a significant effect of the land capital element on the division of rural relative poverty groups, and the higher the value of land capital, the lower the relative poverty degree of farmers.

3. Study Design and Variable Selection

3.1. Research Methodology

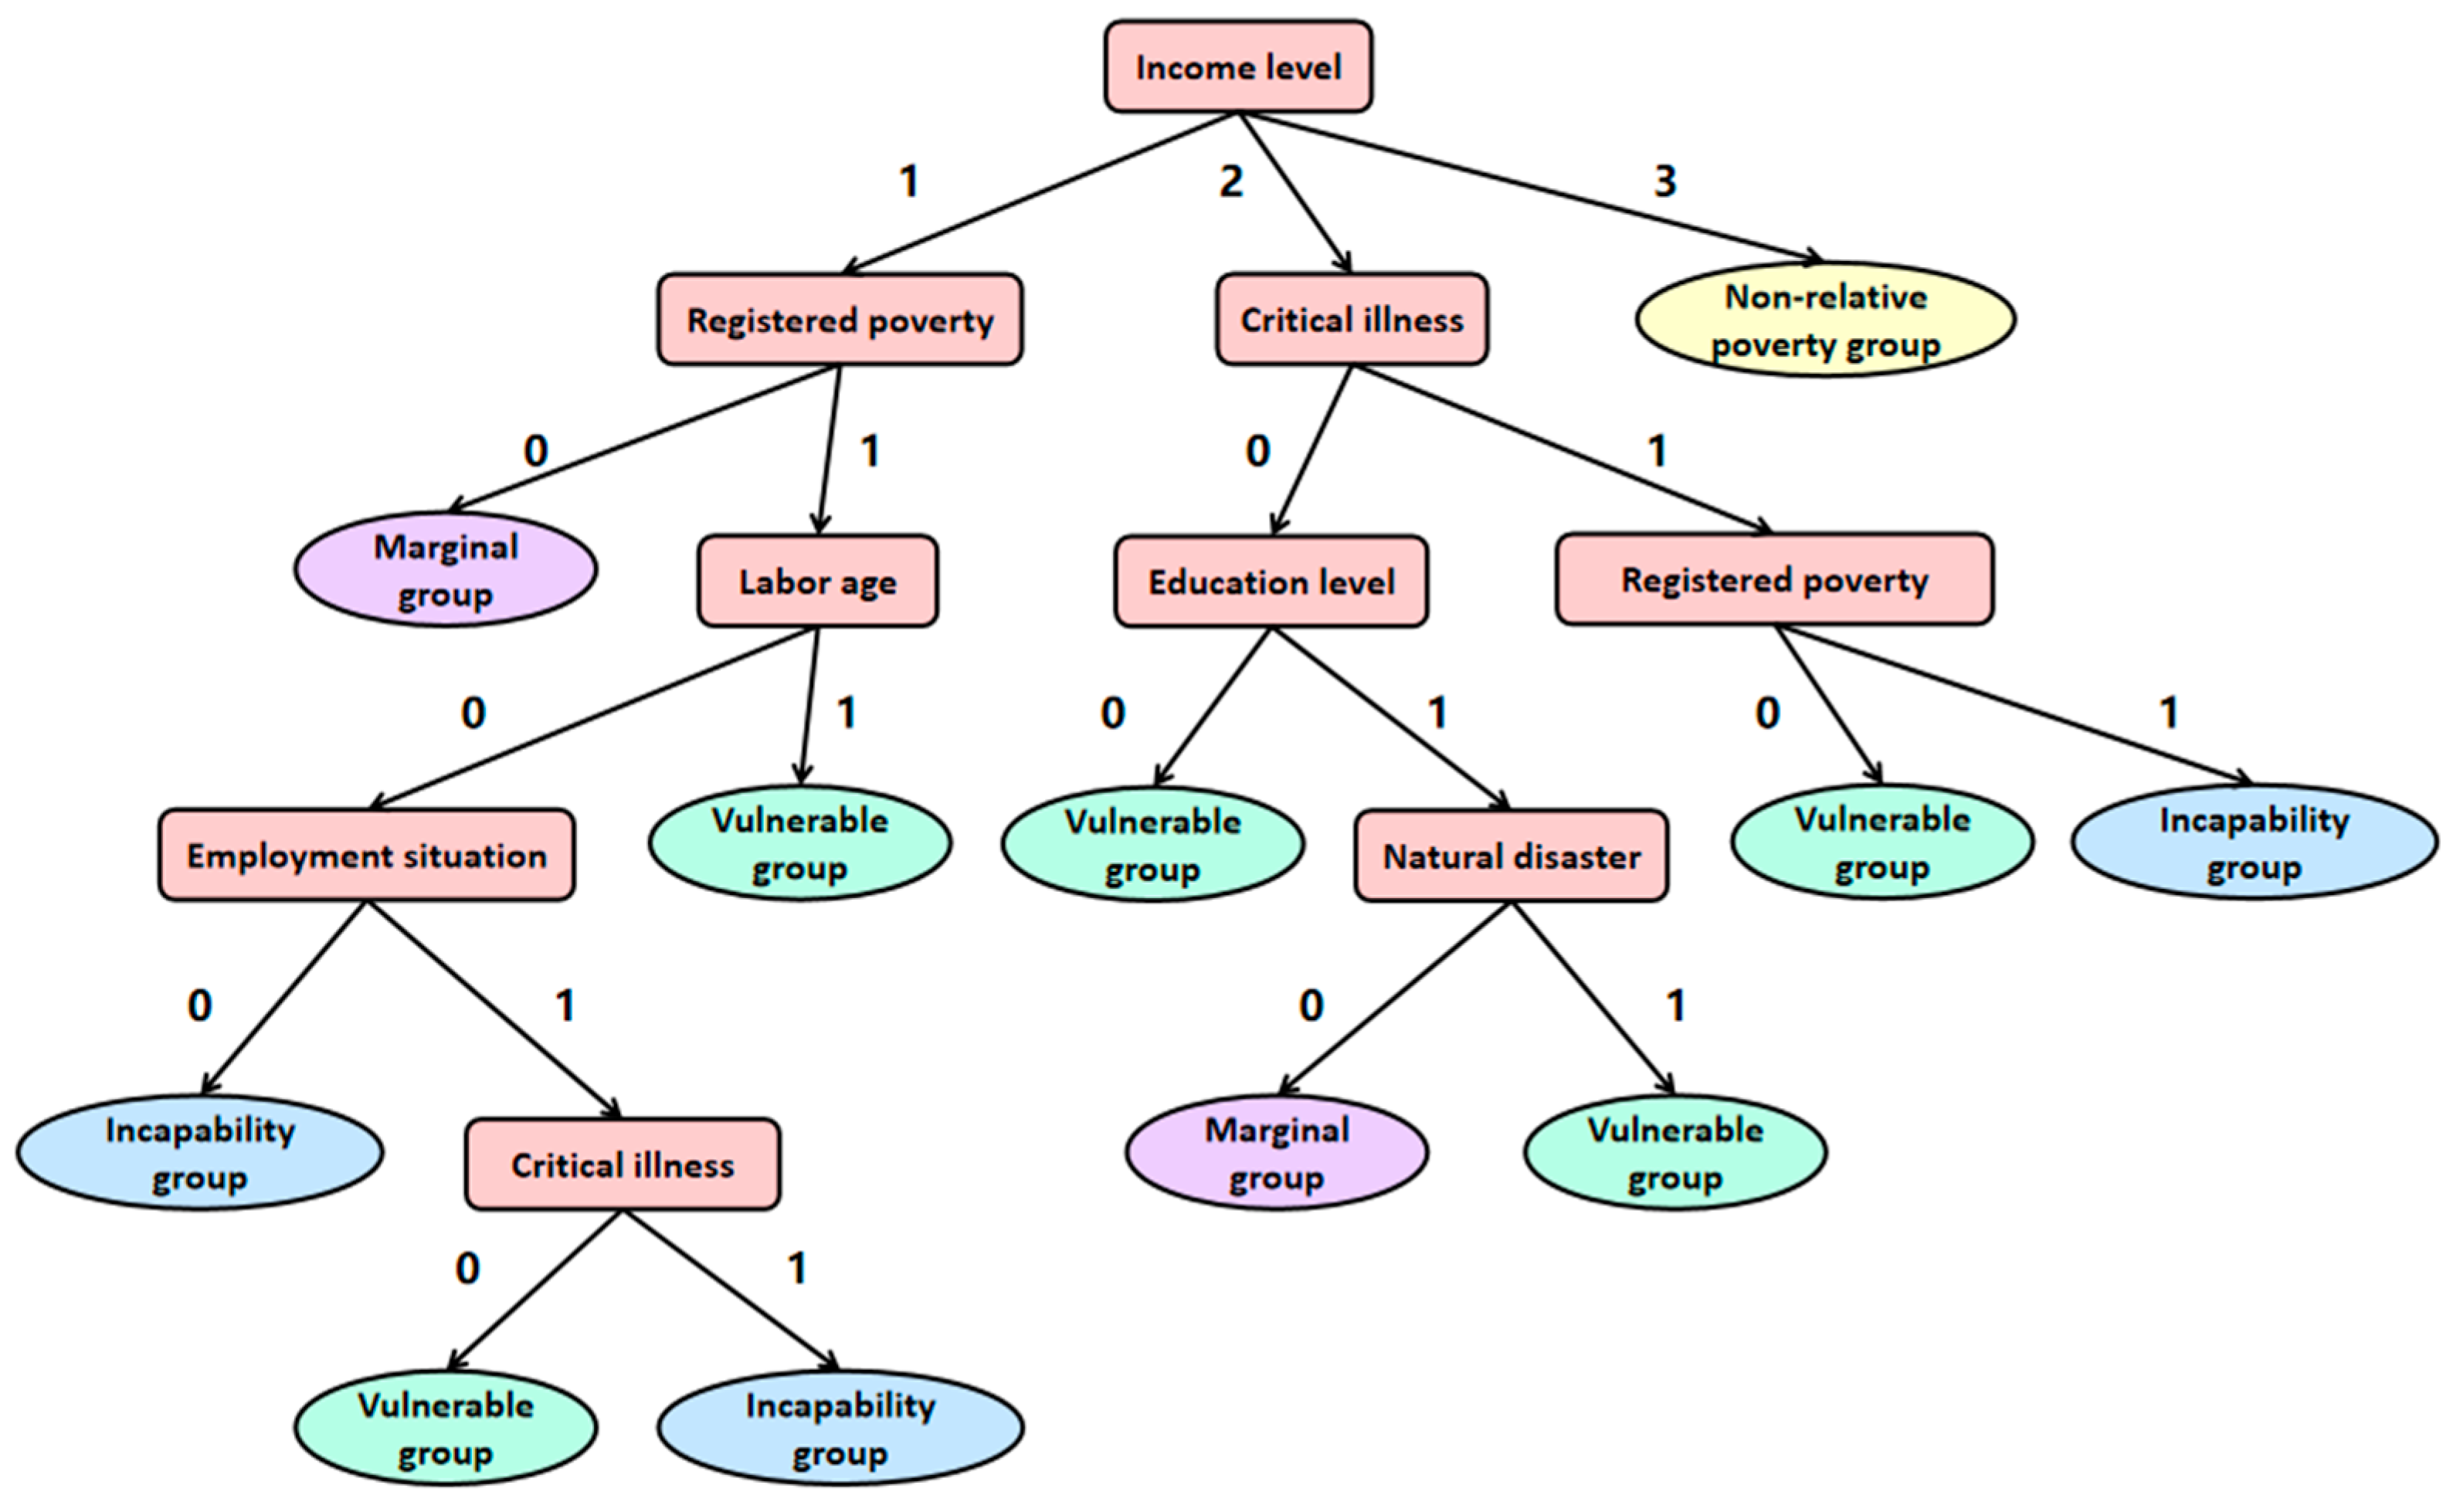
3.1.1. Classification Decision Tree Model Based on Improved ID3 Algorithm

In order to classify the rural relative poverty groups, this study uses a classification decision tree model, which is improved by introducing the affiliation function method in fuzzy mathematics based on the use of ID3 algorithm, and categorizes the samples based on data attributes according to the decision tree rules. Firstly, the dataset is created using the sample data, the information entropy is calculated, the dataset is divided according to the conditional attributes, and the decision tree is constructed recursively; secondly, the algorithm is tested, i.e., the decision tree is used to classify the sample data and generate a decision tree in the form of a dictionary; finally, the decision tree is visualized.
Decision tree is a common classification method. The classification decision tree model has a tree-like structure and includes two constituents, nodes and directed edges. To classify with a decision tree, i.e., starting from the topmost root node, a conditional feature or attribute of the sample set is tested, and the samples are divided according to the results of the test, divided into the corresponding child nodes, recursively, and finally reach the leaf nodes, i.e., each sample is assigned to the corresponding category. The ID3 algorithm is a common decision tree algorithm. The specific approach is to take the root node as the starting point, calculate the information gain of the features in the dataset, obtain the feature with the largest information gain value, use it as the current node feature, create several child nodes according to the value of the feature, and recurse the child nodes until all features are selected or the information gain values of the remaining features are small.
Relative poverty is multidimensional, and with reference to the research on relative poverty criteria and multidimensional poverty measurement [68,69,70,71,72], indicators such as income level, employment status, skill training status, social insurance status, poverty registration status, working age status, education level, critical diseases, natural disasters and life quality are selected as the conditional attributes of the decision tree model for rural relative poverty group evaluation, i.e., the rural relative poverty group evaluation model’s index system. In total, 100 rural populations were selected as the sample set (Table 1), and the decision tree classification model of relative poverty group evaluation was generated using Python software.

3.1.2. Multivariate Ordered Logistic Model

In this paper, a multivariate ordered logistic model was used to analyze the effect of land elements on the differentiation of rural relative poverty groups. A multivariate ordered logistic model is used to study the relationship of the independent variable X on the dependent variable Y, where the dependent variable Y is required to be definite class data and ordered, usually with a small number of categories. Since the dependent variable (i.e., the type of rural relative poverty group) in this paper is a discrete ordered categorical variable, an ordered logistic model was used for regression analysis, and the model was specified as follows.
P ( t y p e = j x i ) = 1 1 + e ( α + β x i )
in the formula: x i denotes the i th indicator variable, t y p e is the actual observed value, and a potential implicit variable L i is introduced, as follows.
Li = βXi + εi
in the formula: i denotes a particular rural population sample; L i denotes the relative poverty group type of the i th rural population; X i = ( x i 1 , x i 2 , , x i n ) denotes a vector of a set of explanatory variables that affect the classification of the rural population into relative poverty groups; β = ( β 0 , β 1 , , β n ) denotes the parameter vector to be estimated; ε i denotes the residual term. Assuming that the relative poverty of the rural population is t y p e i , the relationship between T Y P E i and L i is as follows.
t y p e i = 1 ,     0 L i < λ 1 2 , λ 1 L i < λ 2 3 , λ 2 L i < λ 3 4 , L i λ 3
in the formula, λ i is the critical point of change in relative poverty level. Then, when given X i , the probability of the dependent variable T Y P E i for different values is as follows.
p r o b ( T Y P E i = 1 ) = F ( λ 1 β X i ) p r o b ( T Y P E i = 2 ) = F ( λ 2 β X i ) F ( λ 1 β X i ) p r o b ( T Y P E i = 3 ) = F ( λ 3 β X i ) F ( λ 2 β X i ) p r o b ( T Y P E i = 4 ) = 1 F ( λ 3 β X i )
in the formula, F ( ) denotes the distribution function.
To further analyze the degree of influence of land elements on the classification of relative poverty group types, this paper uses marginal effect, i.e., the marginal effect of the independent variable X i on the probability of different values of the dependent variable T Y P E i . The specific expression is as follows.
p r o b ( T Y P E i = 1 ) / X i = β i f ( λ 1 β X i ) p r o b ( T Y P E i = 2 ) / X i = β i [ f ( λ 2 β X i ) f ( λ 1 β X i ) ] p r o b ( T Y P E i = 3 ) / X i = β i [ f ( λ 3 β X i ) f ( λ 2 β X i ) ] p r o b ( T Y P E i = 4 ) / X i = β i f ( λ 3 β X i )
in the formula, f ( ) denotes the density function.

3.2. Variables and Data Descriptions

3.2.1. Variable Selection

Dependent Variable Selection

The explanatory variable in this paper is the type of rural relative poverty group. The types of rural relative poverty group include the incapability group, the vulnerable group, the marginal group and the non-relative poverty group. According to the decision tree evaluation model of rural relative poverty group made in the previous section, the samples were classified into the corresponding relative poverty group types according to the decision tree rules.

Independent Variable Selection

1.
Core independent variables
The core independent variables are the land elements, including land resource element, land asset element and land capital element. Land resource element includes factors such as contracted arable land area, contracted arable land quality, arable land ground slope, agricultural productive infrastructure, spatial distribution and geological disaster; land asset element includes factors such as homestead area, land acquisition compensation income, and cultivation income; land capital element includes factors such as agricultural land operation input, land work time, land transfer income, land dividend income, and compensation for Increase and Decrease Connection of Urban and Rural Construction Land. The meanings, assignment rules and descriptive statistics of core variables are shown in Table 2.
2.
Control variables
In addition to the land element, there are many factors that influence the classification of relative poverty rural groups. In this paper, a total of six variables were selected, including other income, gender, poverty registration, labor age, education, critical disease, number of family members, cultivation of food crops and cultivation of cash crops. The meanings, assignment rules and descriptive statistics of the control variables are shown in Table 2.

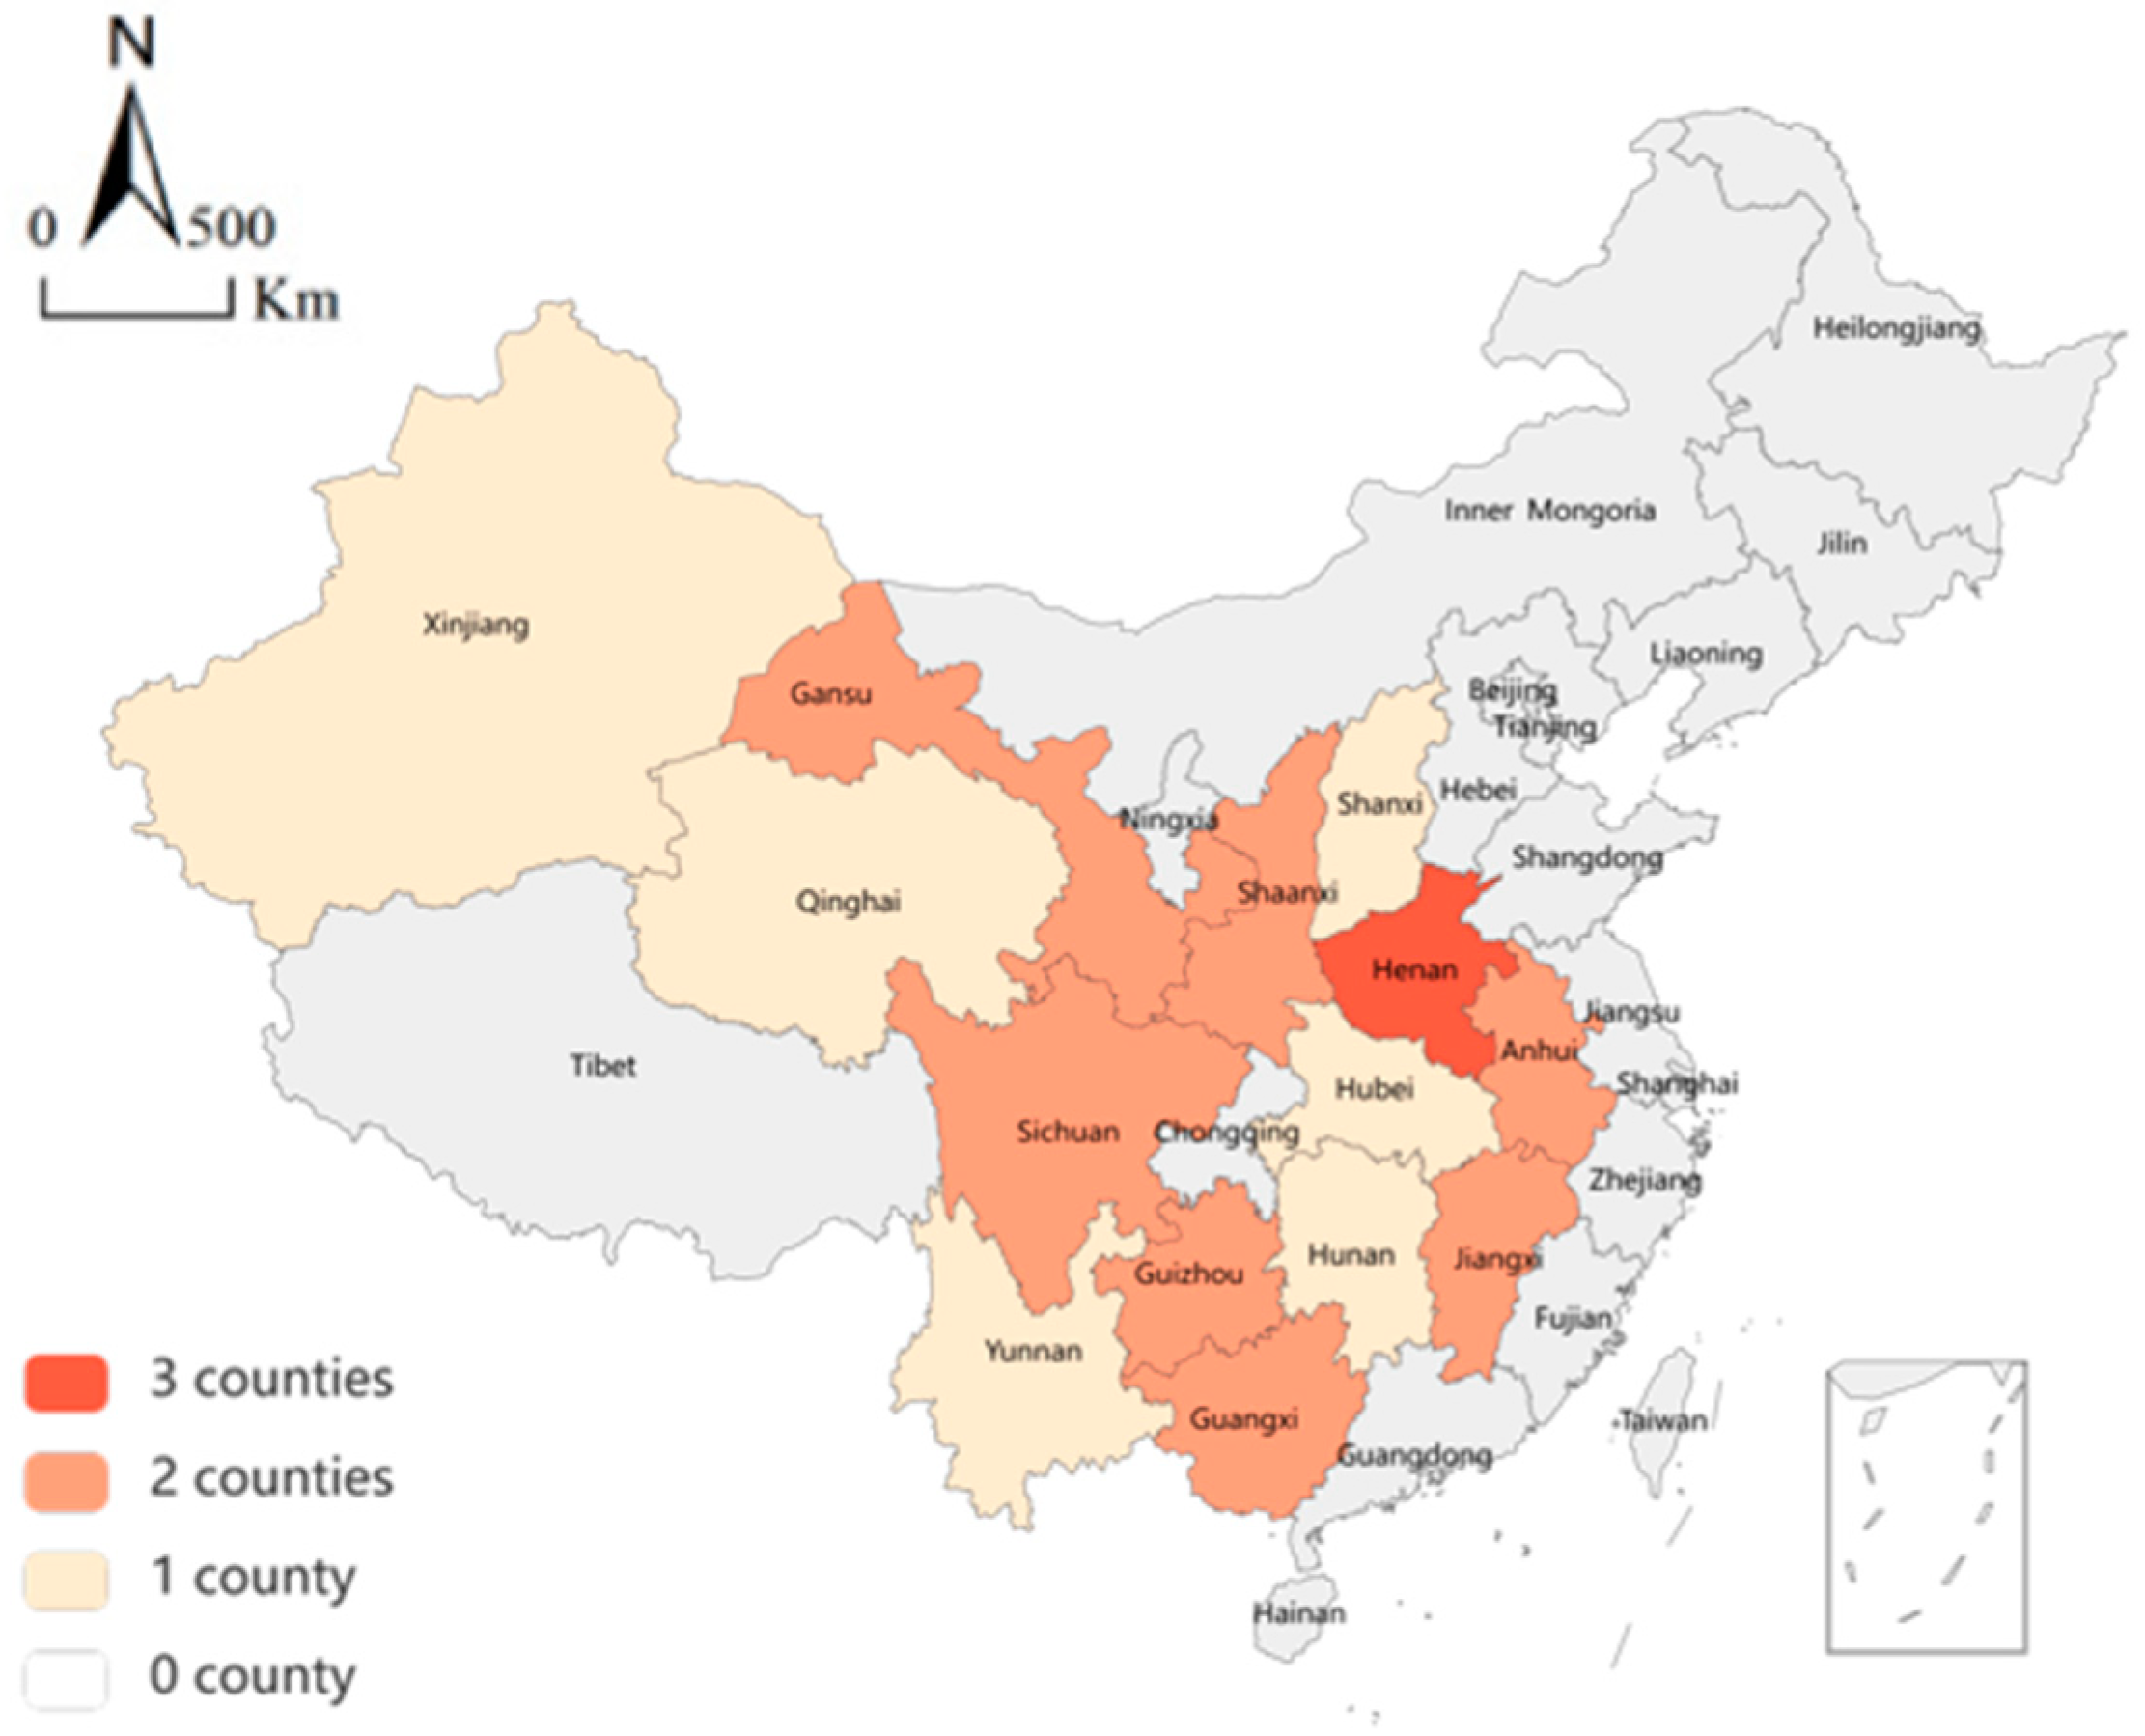
3.2.2. Data Sources and Descriptive Analysis

The sample data used in this paper were obtained from primary data obtained from January to February 2021. First, the poor farmers in 832 national-level poor counties (before withdrawal) in 22 provinces according to the standards of national-level poor counties established in China were taken as the total sample. Second, to ensure that the selected sample is sufficiently representative, the stratified multi-stage probability sampling method was used to select 23 national-level poor counties for the study (see Figure 3); 1–2 townships were selected from each poor county, and from each township, a number of farmers were randomly sampled, and interviews and questionnaires were conducted by researchers. After eliminating invalid sample data, the final sample size obtained was 618.
The sample data were screened for validity, and 560 valid samples were obtained, with an effective rate of 93.23%. The decision tree classification model was applied to the classification evaluation of the relative poverty group of all samples in this paper, and the classification results of all samples were obtained. Among them, the sample size of the incapability group is 29, accounting for 5.18%; the sample size of the vulnerable group is 98, accounting for 17.50%; the sample size of the marginal group is 77, accounting for 13.75%; the sample size of the non-relative poverty group is 356, accounting for 63.57%. The proportion of each group in the classification results is consistent with the actual relative poverty situation in rural areas. There were more male respondents, a total of 380, accounting for 67.86%, and 180 female respondents, accounting for 32.14%. The educational level of the respondents was low, with 61.61% having elementary school education or less. The percentage of the sample who had received skills training was 21.42%. The sample size of those who had poverty registration was 309, accounting for 55%. The sample size of those who purchased social insurance was 461, accounting for 82.1%. The average number of family members was 4, the maximum was 12, and the minimum was 1. The average contracted arable land area of the respondents was 5.64 mu, with the highest contracted 206.5 mu and the lowest no contracted arable land.

4. Empirical Results

4.1. Classification of Rural Relative Poverty Groups

The generated decision tree classification model for rural relative poverty group evaluation is shown in Figure 4, with a tree depth of 6 and a number of nodes of 11. The generated decision tree classification model is applied to the relative poverty group classification evaluation of all samples in this paper, and the sample data are first sorted according to the classification rules of the decision tree; then, the attribute data of the samples are put into the model for classification to determine the relative poverty group classification of each sample, and the final results obtained were collated to obtain the classification results of all samples.

4.2. Influence of Land Elements on Rural Relative Poverty Groups

4.2.1. Estimation Results and Interpretation

This paper conducted an ordered logistic regression analysis on the rural population relative poverty group sample. According to the results of the goodness-of-fit test of the model, the goodness-of-fit Pseudo r-squared of the rural relative poverty group model was 0.535 with a significance of 0.000, which concluded that the overall fit of the model was good and further ordered logistic regression analysis could be conducted. The regression results are shown in Table 3.
1.
Resource-based factors
Contracted arable land area (CLA) and geological disaster (GD) have significant negative effects on relative poverty group level, indicating that the larger the contracted arable land area, the higher the frequency of geological disaster in the village, and the higher the relative poverty level. The reason for this is that the larger the area of farmland contracted by poor farmers, the greater their subsistence dependence on the land and the greater the risk of poverty they face; geological disaster is one of the critical causes of poverty return, and geological disaster can destroy farmers’ productive capital and livelihood resources, thus deepening their poverty level. Contracted arable land quality (CLQ), agricultural productive infrastructure (API), and spatial distribution (SD) have significant positive effects on relative poverty group level, indicating that the higher the quality of farmland contracted by farmers, the possession of agricultural productive infrastructure, and the more scattered and regular the spatial distribution of farmland, the lower the level of relative poverty. The reason is that land quality, spatial distribution and agricultural productive infrastructure directly affect the productive capacity of land, and the more productive the land is, the more farmers can escape from the relative poverty situation. The effect of ground slope (GS) of arable land on relative poverty group level is not significant. The reason is that the ground slope of the vast majority of cultivated land is small, there are fewer cases where ground slope affects land work, and the ground slope factor has less influence on relative poverty.
2.
Asset-based factors
Land acquisition compensation income (LAI) has a significant negative effect on relative poverty group level, indicating that the more land farmers are expropriated, the higher the risk of relative poverty. The reason is that land expropriation causes poor farmers to lose their land, which is accompanied by a reduction in stable income and insecurity of long-term livelihoods, and a greater risk of falling into deep relative poverty. Cultivation income (CI) has a significant positive effect on relative poverty group level, indicating that the higher the cultivation income of farmers, the lower the degree of relative poverty. The reason is that cultivation income is one of the main incomes of farmers, and the higher the cultivation income, the higher the overall income of farmers and the relatively higher the living standard, the lower the relative poverty level. The effect of homestead area (HA) on the level of relative poverty group is not significant. The reason is that, for a long time, the rule of homestead is that one house per household, the area is limited, and the homestead cannot be transferred. What farmers enjoy is only the right to use, and they cannot earn income by buying, selling and transferring homestead; therefore, it has little effect on the relative poverty level of farmers.
3.
Capital-based factors
Land transfer income (LTI) has a significant positive effect on relative poverty group level, indicating that the higher the farmers’ land transfer income, the lower the relative poverty level. The reason is that farmers may have a lower utilization rate of the land they contracted due to reasons such as going out to work or losing labor capacity. Transferring idle land through transhumance can earn more income and help farmers eradicate relative poverty. The effects of agricultural land operation input (ALI), land work time (TIME_LW), land dividend income (DI), and compensation for increase and decrease connection of urban and rural construction land (IDC) on relative poverty group level are not significant. The reason is that farmers’ inputs for agricultural land operation and average daily land work time are relatively average, which are necessary inputs and have no effect on relative poverty; at present, due to the constraints of policies and markets, it is difficult to reflect the marketization of rural land resources, and there are fewer cases of land price shares and construction land index trading, and fewer farmers receive land dividends and compensation for linkage increase and decrease connection of urban and rural construction land. However, due to the decentralized contracting of rural land, there is less possibility to trade through cross-regional construction land with increase and decrease connection and arable land protection index, and the impact on relative poverty is smaller.
4.
Control variables
Other income (INC_OTHER) and education (EDUCATION) have a significant positive effect on the relative poverty group level, indicating that the higher the income other than land, the higher the educational attainment, and the lower the relative poverty level. The reason is that income directly affects farmers’ living standard, and the higher the income, the higher the living standard and the lower the relative poverty level; there is a positive relationship between education level and survival and development ability, and the higher the education level received, the stronger the survival and development ability possessed, the lower the poverty vulnerability of farmers and the lower the relative poverty level. Poverty registration (PR) has a significant negative effect on the relative poverty group level, indicating that the higher the relative poverty risk of poor households with poverty registration. The reason is that the poor households with poverty registration are the group that meet the national rural poverty alleviation standards, generally have lower income, relatively poorer housing, education, and health, and have higher poverty vulnerability and higher risk of relative poverty. The effects of gender (GENDER), labor age (LABORAGE), critical disease (ILLNESS), number of family members (FAMILY_NUMBER), cultivation of food crops (FOOD_CROP) and cultivation of cash crops (CASH_CROP) on the relative poverty group level are not significant.

4.2.2. Marginal Effect Analysis

Table 3 reflects the significance of the effects of different factors on the relative poverty of the rural population, but does not accurately reflect the extent of the effects of the above indicators on the relative poverty. Therefore, this paper further analyzes the differences in the effects of different indicators by calculating marginal effects, as shown in Table 4.
As can be seen from Table 4, for the resource-based factors, each increase in contracted arable land area (CLA) by 1 unit (mu) increases the probability of the dependent variable taking TPYE = 2 (vulnerable group) by 0.1%, decreases the probability of taking TYPE = 4 (non-relative poverty group) by 0.2%, and changes in the probability of taking TYPE = 1 (incapability group) and TYPE = 3 (marginal group) can be negligible. For each unit increase in contracted arable land quality (CLQ), the probability of the dependent variable taking TYPE = 1 (incapability group) decreased by 1.5%, the probability of taking TPYE = 2 (vulnerable group) decreased by 6.2%, the probability of taking TYPE = 3 (marginal group) decreased by 2.0%, and the probability of taking TYPE = 4 (non-relative poverty group) increased by 9.6%. For each unit increase in agricultural productive infrastructure (API), the probability of the dependent variable taking TYPE = 1 (incapability group) decreased by 1.3%, the probability of taking TPYE = 2 (vulnerable group) decreased by 5.5%, the probability of taking TYPE = 3 (marginal group) decreased by 1.8%, and the probability of taking TYPE = 4 (non-relative poverty group) increased by 8.7%. For each unit increase in spatial distribution status (SD), the probability of the dependent variable taking TYPE = 1 (incapability group) decreased by 0.8%, the probability of taking TPYE = 2 (vulnerable group) decreased by 3.2%, the probability of taking TYPE = 3 (marginal group) decreased by 1.0%, and the probability of taking TYPE = 4 (non-relative poverty group) increased by 5.0%. For each unit increase in geological disaster (GD), the probability of the dependent variable taking TYPE = 1 (incapability group) increases by 1.4%, the probability of taking TPYE = 2 (vulnerable group) increases by 6.1%, the probability of taking TYPE = 3 (marginal group) increases by 2.0%, and the probability of taking TYPE = 4 (non-relative poverty group) decreases by 9.5%.
For asset-based factors, for each unit increase in cultivation income (CI), the probability of the dependent variable taking TYPE = 1 (incapability group) decreased by 1.5%, the probability of taking TPYE = 2 (vulnerable group) decreased by 6.3%, the probability of taking TYPE = 3 (marginal group) decreased by 2.0%, and the probability of taking TYPE = 4 (non-relative poverty group) increased by 9.8%. The probability change in land acquisition compensation income (LAI) on the value of the dependent variable TYPE taken is negligible.
For capital-based factors, the probability change in land transfer income (LTI) on the value of the dependent variable TYPE is negligible.
The marginal effects of land factor indicators that have significant effects on the degree of relative poverty, in descending order, are cultivation income (CI), contracted arable land quality (CLQ), geological disaster (GD), agricultural productive infrastructure (API), spatial distribution (SD), contracted arable land area (CLA), land transfer income (LTI), and land acquisition compensation income (LAI). It can be observed that the greatest influence on the degree of relative poverty is the land asset factor, which is dominated by cultivation income, followed by the land resource factor, which affects land output, and the land capital factor has no significant influence on relative rural poverty. The reason is that farmers’ main source of income is growing agricultural products, and cultivation income has the greatest impact on farmers’ poverty level; land resource element factors such as arable land quality, geological disaster, agricultural productive infrastructure, and spatial distribution affect land production capacity, i.e., the ability to convert land resources into money, and also have an impact on farmers’ poverty level; while land capital element factors are not visible for the time being and have a smaller impact on farmers’ poverty level.

5. Discussion

5.1. Advantages of Using Decision Tree Classification Model

At present, the multidimensional poverty index, which is more commonly used for relative poverty identification, can only measure the incidence and depth of relative poverty [73,74], and cannot further distinguish relative poverty types. Most studies on the classification of relative poverty groups stay at the level of conceptual definition and generalize from the macro level based on poverty characteristics, without scientific division at the individual level. This paper uses the ID3 algorithm in machine learning to construct a decision tree classification model to achieve the identification of relative poverty types at the individual level. The decision tree classification model develops classification rules through sample learning, which does not rely on empirical knowledge, mines the classification rules with high accuracy, and can process data containing more conditional attributes, and the classification results of decision tree are more objective and reasonable compared with other classification methods. The ID3 algorithm is one of the classical classification algorithms of decision trees, which is widely used, and its objective is to calculate the information entropy and information gain of attributes, and select the attributes with the maximum information gain value to recursively complete the establishment of each node of the decision tree, so as to achieve the inductive classification of data. The ID3 algorithm uses all current training samples in each step of the search, which greatly reduces the sensitivity to individual training sample errors. In addition, the decision tree model has good interpretability and can be visualized to facilitate the observation and analysis of the underlying classification mechanism.

5.2. The Value of the Land Elements in Relative Poverty Governance

Land is the main property of poor farmers, and poor farmers have a strong reliance on land. However, due to the limitations of capital and technology, land elements can hardly provide poor farmers with stable production and livelihood security, making them in relative poverty. If we can identify the impact of different land elements on relative poverty groups, we can realize precise poverty alleviation in the subsequent work and help farmers remove themselves from relative poverty. Therefore, land elements play a very important role in relative poverty governance.
The results of this paper show that land elements have significant effects on the classification of rural relative poverty groups, mainly focusing on land resource conditions, cultivation income and land transfer. Improving land resource endowment is conducive to alleviating farmers’ relative poverty, especially improving land resource factors such as the area of arable land and quality of arable land, which directly affect land production capacity; the stronger the land production capacity, the more cultivation income farmers can obtain, the more economic income land can bring to farmers, and the lower the relative poverty of farmers. There are differences in the efficiency of environmental governance in different regions [75]. Land capital mobility is conducive to poverty reduction [76,77]. Through the flow of land use rights and pooling of land as shares, farmers can obtain stable land transfer income and land dividends, which can increase farmers’ economic income and help them get out of relative poverty [78]. However, from the research results, land transfer income has an impact on farmers’ relative poverty but to a lesser extent, probably because the rural land transaction market is not yet complete, and the barrier is large, scope is small and value is not high in land transfer, and farmers cannot enjoy the benefits from the market-based premium of land resources. The relationship between most land capital factors and the poverty level of relative poverty groups is not significant, such as agricultural land operation inputs, land dividend income, and compensation for increase and decrease connection of urban and rural construction, etc. The main reason is that the asset and capital attributes of land have long been neglected in rural areas of China [49], the vitality of land capitalization is insufficient, farmers’ operation inputs for agricultural land are low, agricultural production efficiency is low, and the scale and specialization of production cannot be realized. The way to realize cross-regional capitalization of land, such as increase and decrease connection of urban and rural construction land, cannot be carried out, and farmers do not receive corresponding land compensation. All of the above problems make it difficult for farmers to obtain high capital income from land.
It can be observed that there is still much room for farmers to obtain economic benefits from land, and the value of the land elements in relative poverty governance should be valued; in addition, how to use the land elements for poverty reduction needs to be further discussed in subsequent studies.

5.3. Land Function Classification: Resource, Asset, Capital

Land can be the material basis for human survival and social development because it has multiple functional attributes. This paper focuses on the impact of land elements on relative poverty rural groups, which requires attention to human activities on land, including physical measures or economic behaviors made by humans on land, and economic feedback from land to humans, and therefore requires classification of land functions from the perspective of the interaction between humans and land. In the interaction between people and land, the nature of land is reflected as resource attributes, asset attributes and capital attributes [49]; therefore, this paper classifies land functions into three categories, namely resource function, asset function and capital function. Farmers cannot produce and live without land, and the basis of land as a means of production and life is the natural resource attribute of land; farmers can contract rural collective land and conduct economic activities on the land to grow food crops or cash crops; on the basis of the natural resource attribute, land can be possessed and used as a kind of property, while farmers can sell crops on the land to obtain economic income, and when land and houses are expropriated and demolished, farmers can also receive corresponding economic compensation; therefore, the asset attribute of land can bring farmers certain economic income; farmers can irrigate, fertilize, remove insects and other inputs to the land, and then obtain higher economic returns, or they can transfer their land operation rights and obtain transfer income through leasing, shareholding, mortgage, etc. Therefore, land also has capital attribute. Any deficiencies in land resource, asset and capital links can be the cause of farmers’ poverty. The differentiating effects of land elements on relative poverty rural groups are analyzed from the perspective of all three. Based on the results, targeted suggestions are made.
There are other theories of land function classification in academic circles, and the common classification methods include: (1) classifying land function into production function, bearing function, resource function and social function from the perspective of land management; (2) classifying land function into five functions of nurturing, bearing, storage, landscape and asset from the perspective of land economy; (3) classifying land function into ecological function, production function and life function from the perspective of land system. The advantage of dividing land functions into three categories of resources, assets and capital is that it is conducive to providing policy recommendations for precise poverty alleviation in rural relative poverty from the land element level. Land resources, assets and capital elements have different impacts on poverty, and different poverty groups have different needs for land elements. The endowment optimizations of the three kinds of land element have different effects on poverty reduction in rural poverty. The previous crude poverty alleviation policies no longer meet the complex requirements of the relative poverty problem. Land poverty alleviation policies should adjust the structure of poverty alleviation policies in a timely manner according to the actual situation and poverty relief needs of different poverty groups. Through precise input and precise management, appropriate land poverty alleviation methods should be selected for precise poverty alleviation, so as to improve the quality of poverty alleviation. In addition, land functions can also be classified into two dimensions: time and space, and subsequent studies can be considered from these aspects.

6. Main Conclusions and Policy Recommendations

Based on research data from national-level poor counties (before exit) in China, this paper firstly constructed a method for evaluating rural relative poverty groups based on an improved decision tree model, and secondly, used an ordered logistic model based on the classification of relative poverty groups to further explore the differentiation effects of land elements with different functional attributes on rural relative poverty groups, including land resource element, land asset element and land capital element.
Through the study, it was found that: First, the rural population can be classified, according to the degree of relative poverty from heavy to light, into four groups: incapability group, vulnerable group, marginal group and non-relative poverty group. Second, land resource element has a significant impact on the classification of rural relative poverty groups. The better the condition of land resource endowment, which is reflected in the higher quality of contracted arable land, equipped with agricultural productive infrastructure, scattered and regular spatial distribution, and the lower frequency of geological disasters, the lower the degree of rural relative poverty, which verifies hypothesis one. However, over-reliance on land increases the risk of rural relative poverty. Third, among the asset-based land factors, only cultivation income has a significant effect on the classification of rural relative poverty groups, and it has the largest effect among all land factors, which verifies hypothesis two. The effects of other asset-based factors, such as homestead area and compensation income from land acquisition, are not reflected because the rural land ownership subject is not yet visible. Fourth, among the capital-based land factors, only land transfer income has a significant impact on the classification of rural relative poverty groups, but to a lesser extent relative to other factors, which verifies hypothesis three. The value of rural land capital is not well represented.
Based on the above conclusions, the following policy recommendations are proposed: First, focus on rural relative poverty groups, and use land elements to help classify and build a long-term mechanism for rural relative poverty governance based on the characteristics of different types of rural relative poverty groups, so as to promote an effective solution to the poverty problem in China. Second, through land improvement methods such as farmland consolidation, environment government and disaster prevention and control, improve the quantity, quality and spatial endowment of rural land resources, and establish a perfect agricultural modernization system, thereby improving farmers’ agricultural production efficiency and reducing the vulnerability of rural population to poverty due to natural disasters. Third, promote the reform of the rural land system, improve rural land property rights, clarify the way to confirm the rights of land assets, guarantee the property rights of farmers to agricultural land and rural homestead, encourage the withdrawal of idle homesteads with compensation, improve the rural land acquisition system and procedures, and improve the property endowment of rural land. Fourth, establish an effective rural land transfer market, encourage farmers to transfer idle agricultural land, improve the policy of Increase and Decrease Connection of Urban and Rural Construction Land, and give full play to the capital value of rural land so that farmers can gain more income.

Author Contributions

K.H.: Questionnaire design; data processing and analysis; Writing original draft. F.X.: Leading practice research; writing—review and editing, supervision; project administration, funding acquisition. All authors have read and agreed to the published version of the manuscript.

Funding

The authors gratefully acknowledge the funding support from the National Natural Science Foundation of China (Grant No. 72074217). And the paper is also supported by the Fundamental Research Funds for the Central Universities, and the Research Funds of Renmin University of China (23XNA005).

Data Availability Statement

Not applicable.

Conflicts of Interest

The authors declare no conflict of interest. The funders had no role in the design of the study; in the collection, analyses, or interpretation of data; in the writing of the manuscript; or in the decision to publish the results.

References

  1. Sewell, S.J.; Desai, S.A.; Mutsaa, E.; Lottering, R.T. A comparative study of community perceptions regarding the role of roads as a poverty alleviation strategy in rural areas. J. Rural Stud. 2019, 71, 73–84. [Google Scholar] [CrossRef]
  2. Malerba, D. Poverty alleviation and local environmental degradation: An empirical analysis in Colombia. World Dev. 2020, 127, 104776. [Google Scholar] [CrossRef]
  3. Sun, J.; Xia, T. China’s poverty alleviation strategy and the delineation of the relative poverty line after 2020: An analysis based on theory, policy and empirical data. China Rural Econ. 2019, 418, 98–113. [Google Scholar]
  4. Sen, A. Development as Freedom: An India Perspective. Indian J. Ind. Relat. 2006, 42, 157–169. [Google Scholar]
  5. Aguilar, G.R.; Sumner, A. Who are the world’s poor? A new profile of global multidimensional poverty. World Dev. 2020, 126, 104716. [Google Scholar] [CrossRef]
  6. Zheng, B. Statistical inference for poverty measures with relative poverty lines. J. Econom. 2001, 101, 337–356. [Google Scholar] [CrossRef]
  7. Fuchs, V. Redefining poverty and redistributing income. Public Interest 1967, 8, 88. [Google Scholar]
  8. Ravallion, M.; Chen, S. Global poverty measurement when relative income matters. J. Public Econ. 2019, 177, 104046. [Google Scholar] [CrossRef]
  9. Gamboa, G.; Mingorría, S.; Scheidel, A. The meaning of poverty matters: Trade-offs in poverty reduction programmes. Ecol. Econ. 2020, 169, 106450. [Google Scholar] [CrossRef]
  10. Wimer, C.; Nam, J.; Garfinkel, I.; Kaushal, N.; Waldfogel, J.; Fox, L. Young adult poverty in historical perspective: The role of policy supports and early labor market experiences. Soc. Sci. Res. 2019, 86, 102390. [Google Scholar] [CrossRef]
  11. Skoufias, E.; Diamond, A.; Vinha, K.; Gill, M.; Dellepiane, M. Estimating poverty rates in subnational populations of interest: An assessment of the Simple Poverty Scorecard. World Dev. 2020, 129, 104887. [Google Scholar] [CrossRef]
  12. Ye, X.; Yin, H. From Eliminating Absolute Poverty to Alleviating Relative Poverty: China’s History of Poverty Reduction and Poverty Reduction Strategies after 2020. Reform 2019, 310, 5–15. [Google Scholar]
  13. Xing, C.; Li, X. Relative Poverty and the Construction of Poverty Governance Mechanism in the New Era. Reform 2019, 310, 16–25. [Google Scholar]
  14. Wang, G.; He, L. Tackling Relative Poverty in China: Identification Standards and Coordinated Governance. J. Xinjiang Norm. Univ. Ed. Philos. Soc. Sci. 2021, 42, 100–111. [Google Scholar]
  15. Gao, Q.; Kong, X. On Relative Poverty and Measures to Cope with It. J. Xinjiang Norm. Univ. Ed. Philos. Soc. Sci. 2020, 41, 120–128+2. [Google Scholar]
  16. Sun, J.; Zhang, Q. The Criteria for Measuring Relative Poverty in Post-2020 China: Experience, Practice and Theory. J. Xinjiang Norm. Univ. Ed. Philos. Soc. Sci. 2021, 4, 79–91+2. [Google Scholar]
  17. Zhou, Y.; Guo, Y.; Liu, Y.; Wu, W.; Li, Y. Targeted poverty alleviation and land policy innovation: Some practice and policy implications from China. Land Use Policy 2018, 74, 53–65. [Google Scholar] [CrossRef]
  18. Liu, Y.; Liu, J.; Zhou, Y. Spatio-temporal patterns of rural poverty in China and targeted poverty alleviation strategies. J. Rural Stud. 2017, 52, 66–75. [Google Scholar] [CrossRef]
  19. Liu, M.; Feng, X.; Wang, S.; Qiu, H. China’s poverty alleviation over the last 40 years: Successes and challenges. Aust. J. Agric. Resour. Econ. 2020, 64, 209–228. [Google Scholar] [CrossRef]
  20. Xia, S.; Yang, Y.; Qian, X.; Xu, X. Spatiotemporal Interaction and Socioeconomic Determinants of Rural Energy Poverty in China. Int. J. Environ. Res. Public Health 2022, 19, 10851. [Google Scholar] [CrossRef] [PubMed]
  21. The Third National Land Survey Main Data Bulletin. Available online: https://www.mnr.gov.cn/dt/ywbb/202108/t20210826_2678340.html (accessed on 26 August 2021).
  22. Zhou, Y.; Zhong, Z.; Cheng, G. Cultivated land loss and construction land expansion in China: Evidence from national land surveys in 1996, 2009 and 2019. Land Use Policy 2023, 125, 106496. [Google Scholar] [CrossRef]
  23. Ren, W.; Zhang, Z.; Wang, Y.; Xue, B.; Chen, X. Measuring regional eco-efficiency in China (2003–2016): A “Full World” perspective and network data envelopment analysis. Int. J. Environ. Res. Public Health 2020, 17, 3456. [Google Scholar] [CrossRef] [PubMed]
  24. Zhou, N.Q.; Zhao, S. Urbanization process and induced environmental geological hazards in China. Nat. Hazards 2013, 67, 797–810. [Google Scholar] [CrossRef]
  25. Weng, Y.; Zeng, Y.; Lin, W. Do rural highways narrow Chinese farmers’ income gap among provinces? J. Integr. Agric. 2021, 20, 905–914. [Google Scholar] [CrossRef]
  26. Zhu, C.; Zhou, Z.; Ma, G.; Yin, L. Spatial differentiation of the impact of transport accessibility on the multidimensional poverty of rural households in karst mountain areas. Environ. Dev. Sustain. 2022, 24, 3863–3883. [Google Scholar] [CrossRef]
  27. Besley, T.; Burgess, R. Land reform, poverty reduction, and growth: Evidence from India. Q. J. Econ. 2000, 115, 389–430. [Google Scholar] [CrossRef]
  28. Li, Y.; Li, Y.; Karácsonyi, D.; Liu, Z.; Wang, Y.; Wang, J. Spatio-temporal pattern and driving forces of construction land change in a poverty-stricken county of China and implications for poverty-alleviation-oriented land use policies. Land Use Policy 2020, 91, 104267. [Google Scholar] [CrossRef]
  29. Deininger, K.W. Land Policies for Growth and Poverty Reduction; World Bank Publications: Washington DC, USA, 2003; ISBN 0-8213-5071-4. [Google Scholar]
  30. Zhou, Y.; Guo, L.; Liu, Y. Land consolidation boosting poverty alleviation in China: Theory and practice. Land Use Policy 2019, 82, 339–348. [Google Scholar] [CrossRef]
  31. Liu, Y.; Li, Y. Revitalize the world’s countryside. Nature 2017, 548, 275–277. [Google Scholar] [CrossRef]
  32. Zhang, D.; Wang, W.; Zhou, W.; Zhang, X.; Zuo, J. The effect on poverty alleviation and income increase of rural land consolidation in different models: A China study. Land Use Policy 2020, 99, 104989. [Google Scholar] [CrossRef]
  33. Zhong, W.; Zhong, C.; Ma, C. Analysis of the Poverty Reduction Effect of Land and its Realization Path: Based on the Perspective of “Trinity” Property of Land Resources. Rural Econ. 2018, 433, 47–52. [Google Scholar]
  34. Cheng, X.; Chen, J.; Jiang, S.; Dai, Y.; Shuai, C.; Li, W.; Kang, X. The impact of rural land consolidation on household poverty alleviation: The moderating effects of human capital endowment. Land Use Policy 2021, 109, 105692. [Google Scholar] [CrossRef]
  35. Ye, J. Land Transfer and the Pursuit of Agricultural Modernization in China. J. Agrar. Chang. 2015, 15, 314–337. [Google Scholar] [CrossRef]
  36. Liu, Y.; Wang, Y. Rural land engineering and poverty alleviation: Lessons from typical regions in China. J. Geogr. Sci. 2019, 29, 643–657. [Google Scholar] [CrossRef]
  37. Liu, Y. Introduction to land use and rural sustainability in China. Land Use Policy 2018, 74, 1–4. [Google Scholar] [CrossRef]
  38. Foster, J.E. Absolute versus relative poverty. Am. Econ. Rev. 1998, 88, 335–341. [Google Scholar]
  39. Townsend, P. Poverty in the United Kingdom: A Survey of Household Resources and Standards of Living; University of California Press: Berkeley, CA, USA, 1979. [Google Scholar]
  40. Benjamin, D.; Brandt, L.; Glewwe, P.; Li, G. Markets, Human Capital and Inequality: Evidence from Rural China. In Inequality around the World; Freeman, R.B., Ed.; International Economic Association Series; Palgrave Macmillan: London, UK, 2002; pp. 87–127. [Google Scholar]
  41. Chambers, R. Poverty and livelihoods: Whose reality counts? Environ. Urban. 1995, 7, 173–204. [Google Scholar] [CrossRef]
  42. Alkire, S.; Roche, J.M.; Vaz, A. Changes over time in multidimensional poverty: Methodology and results for 34 countries. World Dev. 2017, 94, 232–249. [Google Scholar] [CrossRef]
  43. Labar, K.; Bresson, F. A multidimensional analysis of poverty in China from 1991 to 2006. China Econ. Rev. 2011, 22, 646–668. [Google Scholar] [CrossRef]
  44. Liu, Y.; Xu, Y. A geographic identification of multidimensional poverty in rural China under the framework of sustainable livelihoods analysis. Appl. Geogr. 2016, 73, 62–76. [Google Scholar] [CrossRef]
  45. Ward, P.S. Transient poverty, poverty dynamics, and vulnerability to poverty: An empirical analysis using a balanced panel from rural China. World Dev. 2016, 78, 541–553. [Google Scholar] [CrossRef] [PubMed]
  46. McCulloch, N.; Calandrino, M. Vulnerability and chronic poverty in rural Sichuan. World Dev. 2003, 31, 611–628. [Google Scholar] [CrossRef]
  47. Sen, A.; Dreze, J. The Amartya Sen and Jean Drèze Omnibus: (Comprising) Poverty and Famines; Hunger and Public Action; and India: Economic Development and Social Opportunity; Oxford University Press: New York, NY, USA, 1999. [Google Scholar]
  48. Yan, J. Analysis of the mechanism and effect of land policy on poverty alleviation. China Land 2017, 11, 12–15. [Google Scholar]
  49. Guo, Y.; Liu, Y. Poverty alleviation through land assetization and its implications for rural revitalization in China. Land Use Policy 2021, 105, 105418. [Google Scholar] [CrossRef]
  50. Barbier, E.B. Poverty, development, and environment. Environ. Dev. Econ. 2010, 15, 635–660. [Google Scholar] [CrossRef]
  51. Dasgupta, S.; Deichmann, U.; Meisner, C.; Wheeler, D. Where is the poverty–environment nexus? Evidence from Cambodia, Lao PDR, and Vietnam. World Dev. 2005, 33, 617–638. [Google Scholar] [CrossRef]
  52. Xu, W.; Xu, F.; Liu, Y.; Zhang, D. Assessment of rural ecological environment development in China’s moderately developed areas: A case study of Xinxiang, Henan province. Environ. Monit. Assess. 2021, 193, 801. [Google Scholar] [CrossRef] [PubMed]
  53. Zhang, Y.; Guo, X. The Dilemma and Path of Rural Environmental Governance in China: From the Perspective of a Community with a Shared Future. Int. J. Environ. Res. Public Health 2023, 20, 1446. [Google Scholar] [CrossRef]
  54. Bu, D.; Liao, Y. Land property rights and rural enterprise growth: Evidence from land titling reform in China. J. Dev. Econ. 2022, 157, 102853. [Google Scholar] [CrossRef]
  55. Deinlnger, K.; Binswanger, H. The evolution of the World Bank’s land policy: Principles, experience, and future challenges. World Bank Res. Obs. 1999, 14, 247–276. [Google Scholar] [CrossRef]
  56. Galiani, S.; Schargrodsky, E. Property rights for the poor: Effects of land titling. J. Public Econ. 2010, 94, 700–729. [Google Scholar] [CrossRef]
  57. Meinzen-Dick, R.; Quisumbing, A.; Doss, C.; Theis, S. Women’s land rights as a pathway to poverty reduction: Framework and review of available evidence. Agric. Syst. 2019, 172, 72–82. [Google Scholar] [CrossRef]
  58. Peng, C.S.; Fan, Z.Y. The analysis of the rural homesteads withdrawal willingness and its influencing factors based on the empirical research of 1413 farmers from 6 counties in Anhui Province. Comp. Econ. Soc. Syst. 2012, 2, 154–162. [Google Scholar]
  59. Hui EC, M.; Bao, H.J.; Zhang, X.L. The policy and praxis of compensation for land expropriations in China: An appraisal from the perspective of social exclusion. Land Use Policy 2013, 32, 309–316. [Google Scholar] [CrossRef]
  60. Lawry, S.; Samii, C.; Hall, R.; Leopold, A.; Hornby, D.; Mtero, F. The impact of land property rights interventions on investment and agricultural productivity in developing countries: A systematic review. J. Dev. Eff. 2017, 9, 61–81. [Google Scholar] [CrossRef]
  61. Varga, M. Poverty reduction through land transfers? The World Bank’s titling reforms and the making of “subsistence” agriculture. World Dev. 2020, 135, 105058. [Google Scholar] [CrossRef]
  62. Zhang, L.; Feng, S.; Heerink, N.; Qu, F.; Kuyvenhoven, A. How do land rental markets affect household income? Evidence from rural Jiangsu, PR China. Land Use Policy 2018, 74, 151–165. [Google Scholar] [CrossRef]
  63. Wang, Z.; Yang, M.; Zhang, Z.; Li, Y.; Wen, C. The Impact of Land Transfer on Vulnerability as Expected Poverty in the Perspective of Farm Household Heterogeneity: An Empirical Study Based on 4608 Farm Households in China. Land 2022, 11, 1995. [Google Scholar] [CrossRef]
  64. Song, J.; Geng, L.; Fahad, S. Agricultural factor endowment differences and relative poverty nexus: An analysis of macroeconomic and social determinants. Environ. Sci. Pollut. Res. 2022, 29, 52984–52994. [Google Scholar] [CrossRef]
  65. Gao, L.; Sun, D.; Huang, J. Impact of land tenure policy on agricultural investments in China: Evidence from a panel data study. China Econ. Rev. 2017, 45, 244–252. [Google Scholar] [CrossRef]
  66. Ren, Y.; Bian, Y.; He, T. Characterizing the land shareholding cooperative: A case study of Shanglin village in Jiangsu, China. Sustainability 2017, 9, 1175. [Google Scholar] [CrossRef]
  67. Huang, Y.; Zhang, C.; Liu, W. Who drives the formation and adoption of the “increasing versus decreasing balance policy”?—Evidence from a policy process analysis. Land Use Policy 2019, 80, 175–184. [Google Scholar] [CrossRef]
  68. Deutsch, J.; Silber, J. Measuring multidimensional poverty: An empirical comparison of various approaches. Rev. Income Wealth 2005, 51, 145–174. [Google Scholar] [CrossRef]
  69. Bourguignon, F.; Chakravarty, S.R. The measurement of multidimensional poverty. J. Econ. Inequal. 2003, 1, 25–49. [Google Scholar] [CrossRef]
  70. Alkire, S.; Roche, J.M.; Seth, S.; Sumner, A. Identifying the poorest people and groups: Strategies using the global multidimensional poverty index. J. Int. Dev. 2015, 27, 362–387. [Google Scholar] [CrossRef]
  71. Guo, J.; Qu, S.; Zhu, T. Estimating China’s relative and multidimensional poverty: Evidence from micro-level data of 6145 rural households. World Dev. Perspect. 2022, 26, 100402. [Google Scholar] [CrossRef]
  72. Bossert, W.; Chakravarty, S.R.; D’Ambrosio, C. Multidimensional poverty and material deprivation with discrete data. Rev. Income Wealth 2013, 59, 29–43. [Google Scholar] [CrossRef]
  73. Alkire, S.; Foster, J. Counting and multidimensional poverty measurement. J. Public Econ. 2011, 95, 476–487. [Google Scholar] [CrossRef]
  74. Nájera Catalán, H.E.; Gordon, D. The importance of reliability and construct validity in multidimensional poverty measurement: An illustration using the Multidimensional Poverty Index for Latin America (MPI-LA). J. Dev. Stud. 2020, 56, 1763–1783. [Google Scholar] [CrossRef]
  75. Qian, M.; Cheng, Z.; Wang, Z.; Qi, D. What affects rural ecological environment governance efficiency? Evidence from China. Int. J. Environ. Res. Public Health 2022, 19, 5925. [Google Scholar] [CrossRef] [PubMed]
  76. Wang, W.; Lan, Y.; Wang, X. Impact of livelihood capital endowment on poverty alleviation of households under rural land consolidation. Land Use Policy 2021, 109, 105608. [Google Scholar] [CrossRef]
  77. Zhang, D.; Yang, M.; Wang, Z. Resources or Capital?—The Quality Improvement Mechanism of Precision Poverty Alleviation by Land Elements. Land 2022, 11, 1874. [Google Scholar] [CrossRef]
  78. Li, C.; Jiao, Y.; Sun, T.; Liu, A. Alleviating multi-dimensional poverty through land transfer: Evidence from poverty-stricken villages in China. China Econ. Rev. 2021, 69, 101670. [Google Scholar] [CrossRef]
Figure 1. (a) Distribution of national poverty-stricken counties in China; (b) Distribution of arable land in China (note: this figure is from the article produced by Zhou Y, Zhong Z, Cheng G).
Land 12 00918 g001
Figure 2. Identification of relative poverty groups.
Land 12 00918 g002
Figure 3. Distribution of sample poor counties.
Land 12 00918 g003
Figure 4. Schematic diagram of relative poverty group evaluation decision tree.
Land 12 00918 g004
Table 1. Sample dataset for evaluation of relative poverty groups (partially).
Sample
Number
Condition AttributeGroup Type
Income LevelEmployment SituationSkill TrainingSocial InsuranceRegistered PovertyLabor AgeEducation LevelCritical IllnessNatural DisasterLife Quality
1MediumYesYesYesNoYesMedium/HighNoLowLowMarginal group
2HighYesNoYesNoNoMedium/HighNoMedium/HighLowNon-relative poverty group
3HighYesYesNoNoYesMedium/HighNoLowMedium/
High
Non-relative poverty group
4HighYesYesYesNoYesLowNoLowLowNon-relative poverty group
5MediumNoNoYesYesNoLowYesLowLowIncapability group
6HighYesYesNoNoYesMedium/HighNoLowLowNon-relative poverty group
7LowYesNoYesYesNoLowYesMedium/HighLowIncapability group
8HighYesNoYesYesNoMedium/HighNoLowLowNon-relative poverty group
9MediumNoNoYesYesNoLowYesLowLowIncapability group
10MediumYesNoYesNoYesLowYesLowMedium/
High
Incapability group
11HighYesYesYesNoYesLowYesMedium/HighLowNon-relative poverty group
12HighYesYesYesYesYesLowNoLowLowNon-relative poverty group
13LowYesNoYesYesNoLowNoMedium/HighLowVulnerable group
14HighYesNoYesYesNoLowNoMedium/HighLowNon-relative poverty group
15HighYesYesYesYesYesLowNoLowMedium/
High
Non-relative poverty group
Table 2. Variable meanings and assignment rules.
VariableVariable NameVariable DescriptionAssignment RuleAverage ValueExpected Direction
Dependent variableRelative Poverty Group Type (TYPE)including the incapability group, vulnerable group, the marginal group and the non-relative poverty groupIncapability group = 1; vulnerable group = 2; marginal group = 3; non-relative poverty group = 43.357
ResourceContracted Arable Land Area (CLA)the area of arable land contracted by farmersContracted arable land area / mu5.634+
Contracted Arable Land Quality (CLQ)fertility condition of arable land contracted by farmersPoor = 1, Medium = 2, Fertile = 32.052+
Arable Land Ground Slope (GS)average slope of arable land contracted by farmers<2° = 1; 2~6° = 2; 7~15° = 3; 16~25° = 4; >25° = 51.752-
Agricultural Productive Infrastructure (API)including roads (field ridges), water conservancy (ditches), agricultural machinery service institutions, agricultural sales outlets, agricultural technology service institutions and other agricultural facilities.Yes = 1; No = 00.75-
Spatial Distribution (SD)dispersion and regularity of arable landScattered and irregular = 1; scattered but regular = 2; concentrated but irregular = 3; concentrated and regular = 42.731+
Geological Disaster (GD)including landslides, debris flows, ground subsidence, earthquakes, volcanic eruptions, etc.None = 1; Once every few years = 2; Once a year = 3; Several times a year = 41.891-
AssetHomestead Area (HA)rural farmers occupy and use the land owned by the collective as a residential baseHomestead area/m268.417+
Land Acquisition Compensation Income (LAI)when the land acquisition department acquires the village’s land or individual’s contracted land or flowing land, the compensation cost given to the acquired person, including land compensation fee, seedling compensation fee, attachment compensation fee and settlement subsidy feeAverage annual compensation income from land acquisition in the past five years (CNY)369.894+
Cultivation Income (CI)all income from the main and by-products of food crops, cash crops and other agricultural cropsAverage annual cultivation income in the past five years (CNY), take as logarithm8.516+
CapitalAgricultural Land Operation Input (ALI)including the cost of irrigation, pesticides and fertilizers, hired labor, machinery, etc.Agricultural land operation input (CNY), taken as logarithm7.348+
Land Work Time (TIME_LW)time spent in land workAverage daily land work time (hours)5.842+
Land Transfer Income (LTI)income from the transfer of land use rights from farmers who have contracted land management rights to other farmers or economic organizationsAverage annual income from land transfer (CNY)266.265+
Land Dividend Income (DI)village uses the extra construction land to build a factory or transfers, leases, or gives shares to others for building factories, and gives the villagers dividends every yearLand dividend income (CNY)55.972+
Compensation for Increase and Decrease Connection of Urban and Rural Construction Land (IDC)vacate abandoned land and redundant homesteads in the village and reclaim them as arable land, and the excess construction land index can be taken to the city for use, with certain compensation to the village and farmersAverage annual compensation for increase and decrease connection of urban and rural construction land in the past five years (CNY)56.058+
Control variablesOther Income (INC_OTHER)income in addition to the aboveHousehold income per capita (excluding land income) (CNY), taking as logarithm8.692+
Gender (GENDER)gender of the farmerMale = 1; Female = 00.679+
Poverty Registration (PR)poor rural households that have completed approval, recorded the poverty level of poor households, established a poverty file, and obtained a poverty cardYes = 1; No = 00.552+
Labor Age (LABORAGE)comply with the legal requirements of the labor age rangeMale less than 60 years old or female less than 55 years old, yes = 1; no = 00.600 +
Education (EDUCATION)level of education receivedElementary school and above = 1; Elementary school and below = 00.384+
Critical Disease (ILLNESS)diseases such as malignant tumors, cardiogenic diseases, brain and neurological diseases, or serious internal organ diseasesYes = 1; No = 00.270 -
Family Number (FAMILY_NUMBER)number of members of the familyYes = 1; No = 04.043+
Food Crop (FOOD_CROP)food crops include wheat, rice, corn, potatoes, etc.Yes = 1; No = 00.316-
Cash Crop (CASH_CROP)cash crops include cotton, hemp, rape, peanuts, tobacco, tea, mint, coffee, etc.Yes = 1; No = 00.666-
Table 3. Results of relative poverty groups ordered logistic regression model.
TYPECoef.St.Err.t-Valuep-Value[95% ConfInterval]Sig
CLA−0.0220.011−1.960.05−0.0440*
CLQ1.2840.3643.5300.5711.997***
GS−0.0440.217−0.200.839−0.470.382
API1.0940.4832.260.0240.1472.041**
SD0.7010.1983.5500.3131.088***
GD−1.2610.335−3.770−1.917−0.606***
HA0.0040.0041.060.289−0.0040.013
LAI00−2.190.028−0.0010**
CI1.410.2994.7200.8251.996***
ALI−0.1620.279−0.580.562−0.7090.385
TIME_LW0.0490.0880.560.576−0.1230.221
LTI0.0020.0012.920.0040.0010.004***
DI0.0010.0010.750.455−0.0010.002
IDC0.0010.0011.360.17400.002
INC_OTHER2.4940.3267.6601.8563.132***
GENDER0.1620.5050.320.748−0.8281.152
RP−1.4460.558−2.590.01−2.54−0.353***
LABORAGE−0.6010.468−1.280.199−1.5170.316
EDUCATION0.8830.3332.650.0080.231.536***
ILLNESS−0.2350.572−0.410.68−1.3560.885
FAMILY_NUMBER−0.1040.147−0.710.479−0.3930.184
FOOD_CROP−0.0400.431−0.090.927−0.8840.805
CASH_CROP1.1930.7611.570.117−0.2992.686
cut126.9684.128--18.87835.058
cut233.0324.548--24.11941.945
cut335.0994.683--25.92144.278
Note: ***, **, * denote significant at the 1%, 5%, and 10% levels, respectively.
Table 4. Marginal effects.
VariableTYPE = 1TYPE = 2TYPE = 3TYPE = 4
Coefficientp > zCoefficientp > zCoefficientp > zCoefficientp > z
CLA0.000 0.083 (*)0.001 0.054 (*)0.000 0.052 (*)−0.002 0.042 (**)
CLQ−0.013 0.011 (**)−0.060 0.000 (***)−0.023 0.022 (**)0.095 0.000 (***)
GS0.000 0.839 0.002 0.838 0.001 0.840 −0.003 0.839
API−0.0110.037 (**)−0.0510.027 (**)−0.0190.036 (**)0.0810.018 (**)
SD−0.007 0.008 (***)−0.032 0.000 (***)−0.012 0.010 (***)0.052 0.000 (***)
GD0.013 0.009 (***)0.058 0.000 (***)0.022 0.005 (***)−0.094 0.000 (***)
HA0.000 0.315 0.000 0.289 0.000 0.293 0.000 0.285
LAI0.000 0.055 (*)0.000 0.025 (**)0.000 0.072 (*)0.000 0.026 (**)
CI−0.015 0.003 (***)−0.065 0.000 (***)−0.025 0.007 (***)0.105 0.000 (***)
ALI0.002 0.570 0.007 0.560 0.003 0.574 −0.012 0.562
TIME_LW−0.001 0.577 −0.002 0.579 −0.001 0.562 0.004 0.573
LTI0.000 0.018 (**)0.000 0.003 (***)0.000 0.029 (**)0.00 0.003 (***)
DI0.000 0.457 0.000 0.456 0.000 0.460 0.000 0.453
IDC0.000 0.198 0.000 0.166 0.000 0.228 0.000 0.173
INC_OTHER−0.026 0.000 (***)−0.116 0.000 (***)−0.044 0.001 (***)0.185 0.000 (***)
GENDER−0.002 0.749 −0.008 0.747 −0.003 0.754 0.012 0.749
RP0.015 0.019 (**)0.067 0.011 (**)0.025 0.037 (**)−0.107 0.008 (***)
LABORAGE0.006 0.214 0.028 0.192 0.011 0.238 −0.045 0.194
EDUCATION−0.009 0.020 (**)−0.041 0.010 (***)−0.016 0.017 (**)0.066 0.005 (***)
ILLNESS0.002 0.683 0.011 0.679 0.004 0.690 −0.017 0.681
FAMILY_NUMBER0.0010.4790.0050.4730.0020.519−0.0080.482
FOOD_CROP0.000 0.9270.0020.9270.0010.927−0.0030.927
CASH_CROP−0.0120.119−0.0550.119−0.0210.1860.0890.121
Note: ***, ** and * indicate significant at the 1%, 5% and 10% levels, respectively.
Disclaimer/Publisher’s Note: The statements, opinions and data contained in all publications are solely those of the individual author(s) and contributor(s) and not of MDPI and/or the editor(s). MDPI and/or the editor(s) disclaim responsibility for any injury to people or property resulting from any ideas, methods, instructions or products referred to in the content.

