

Multi-Scenario Land Use Simulation and Land Use Conflict Assessment Based on the CLUMondo Model: A Case Study of Liyang, China
Abstract
:1. Introduction
2. Materials and Methods
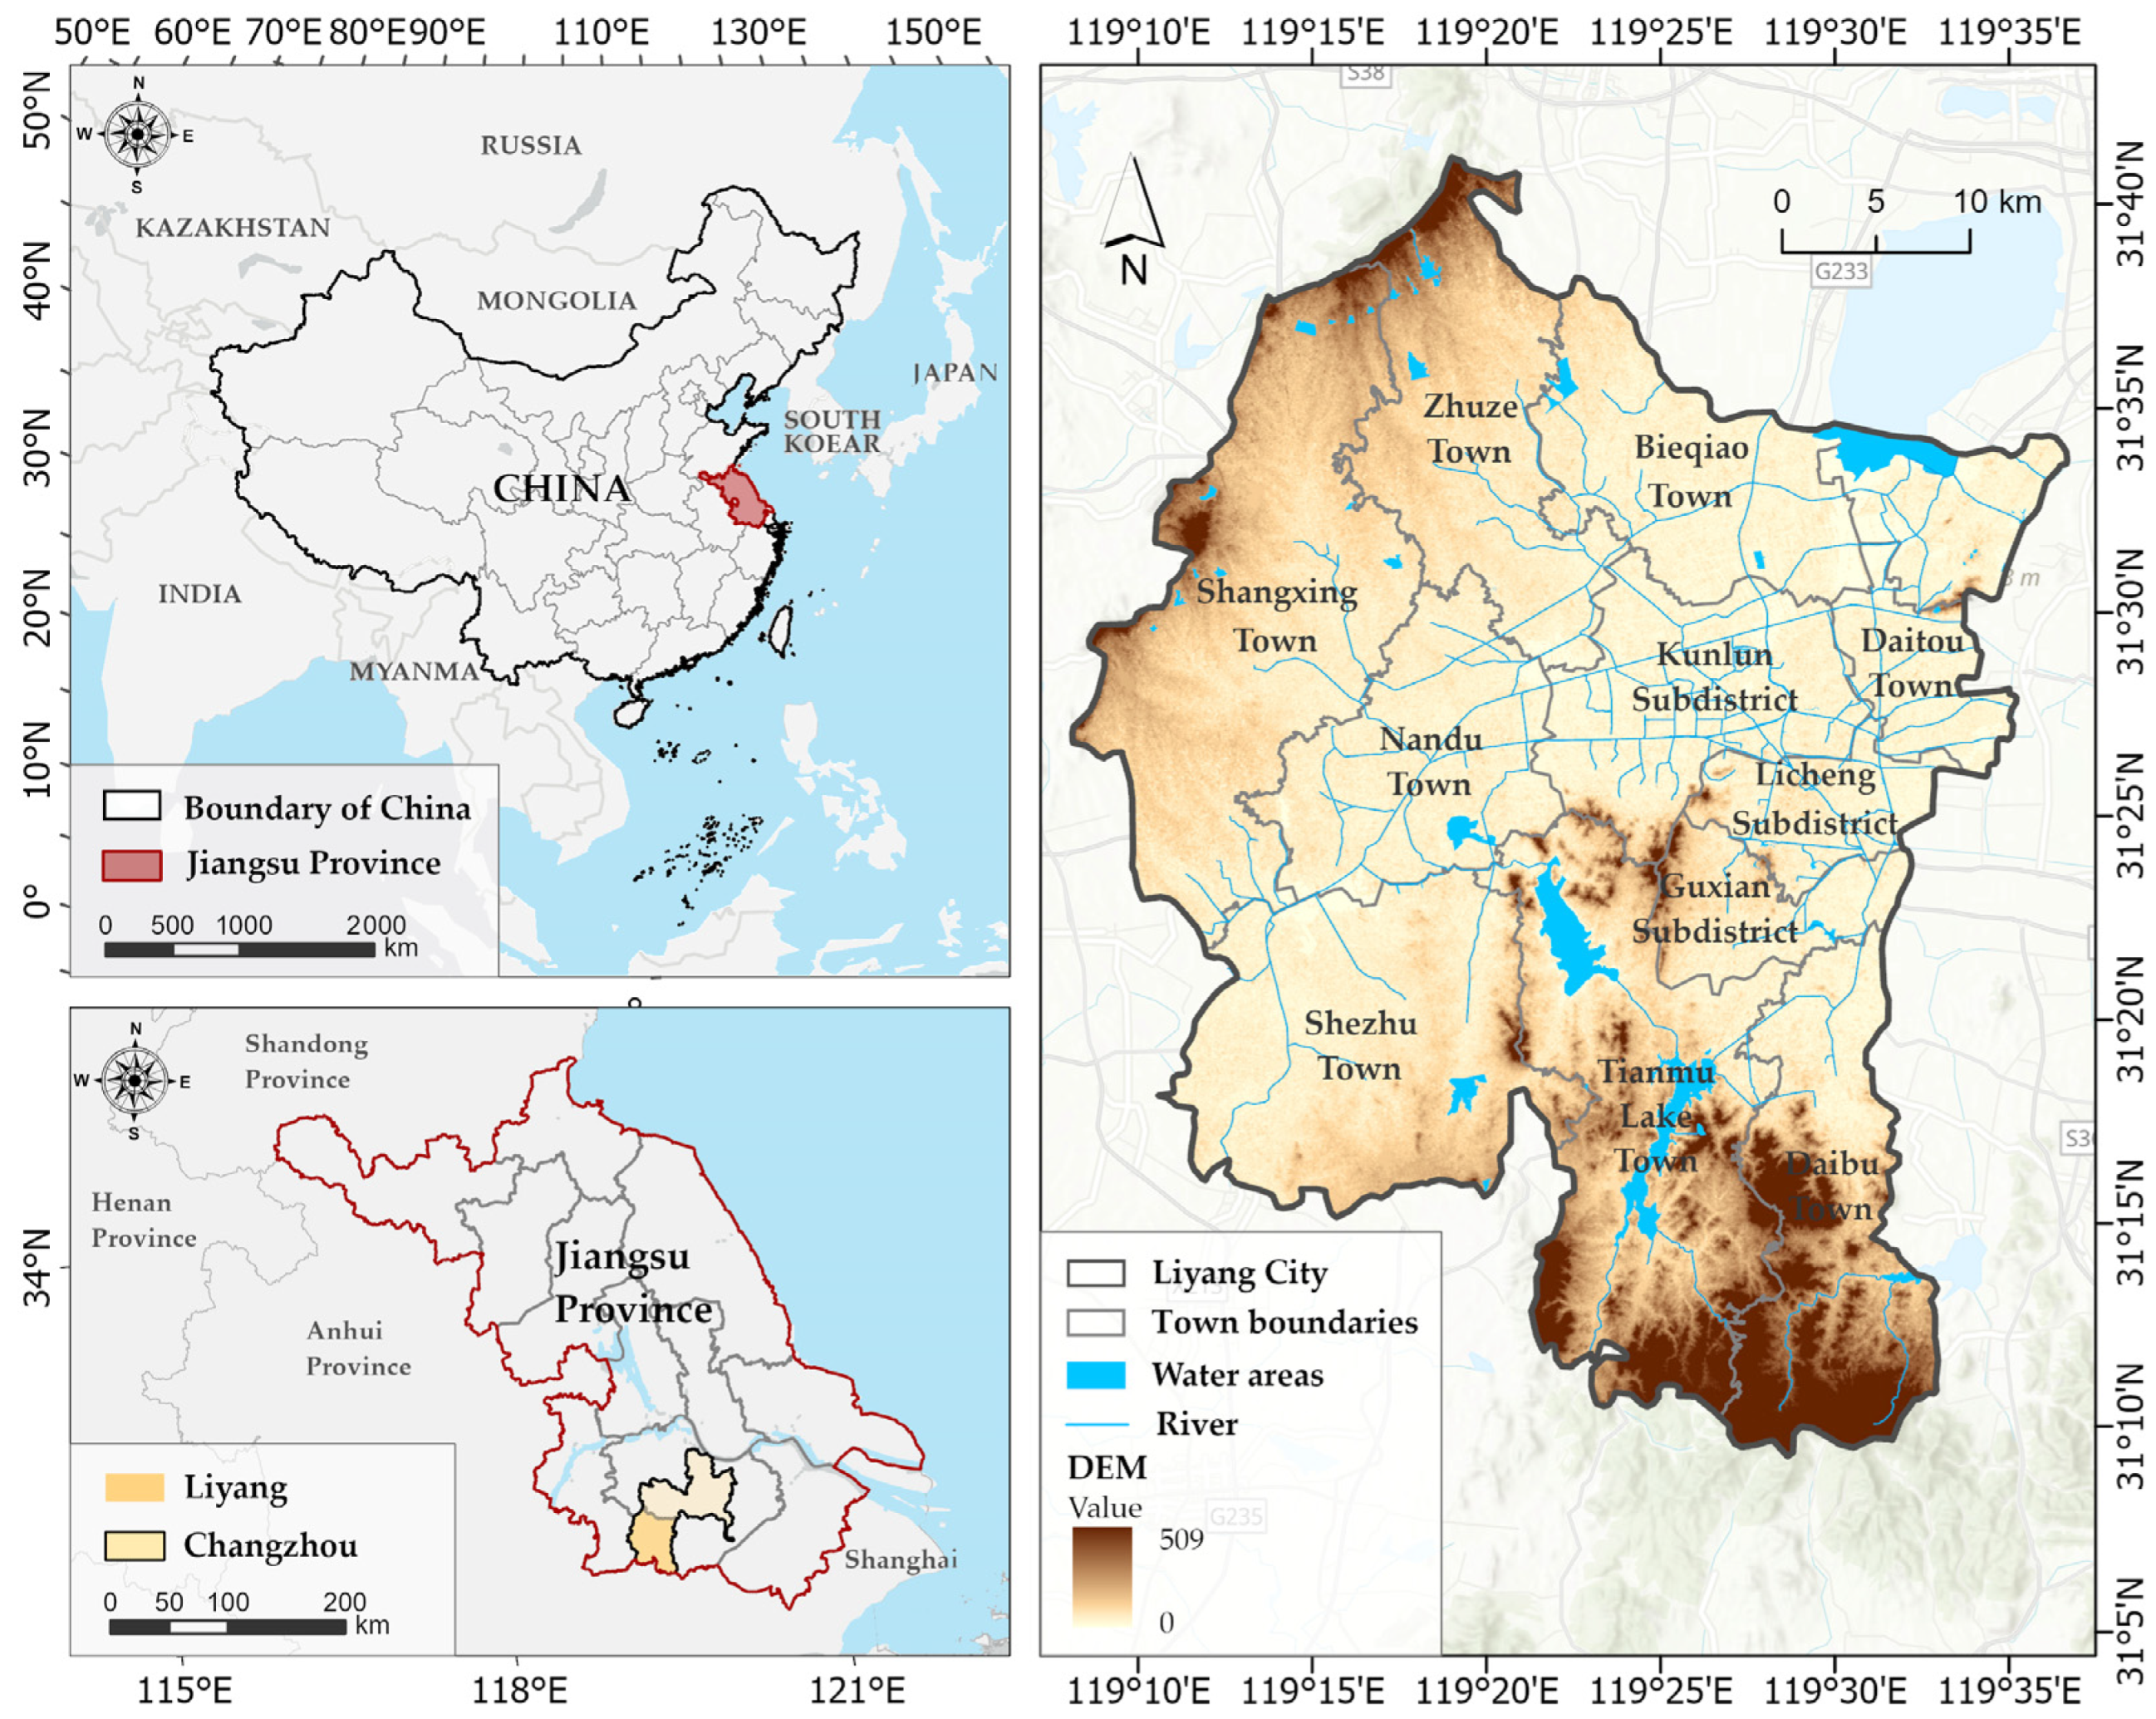
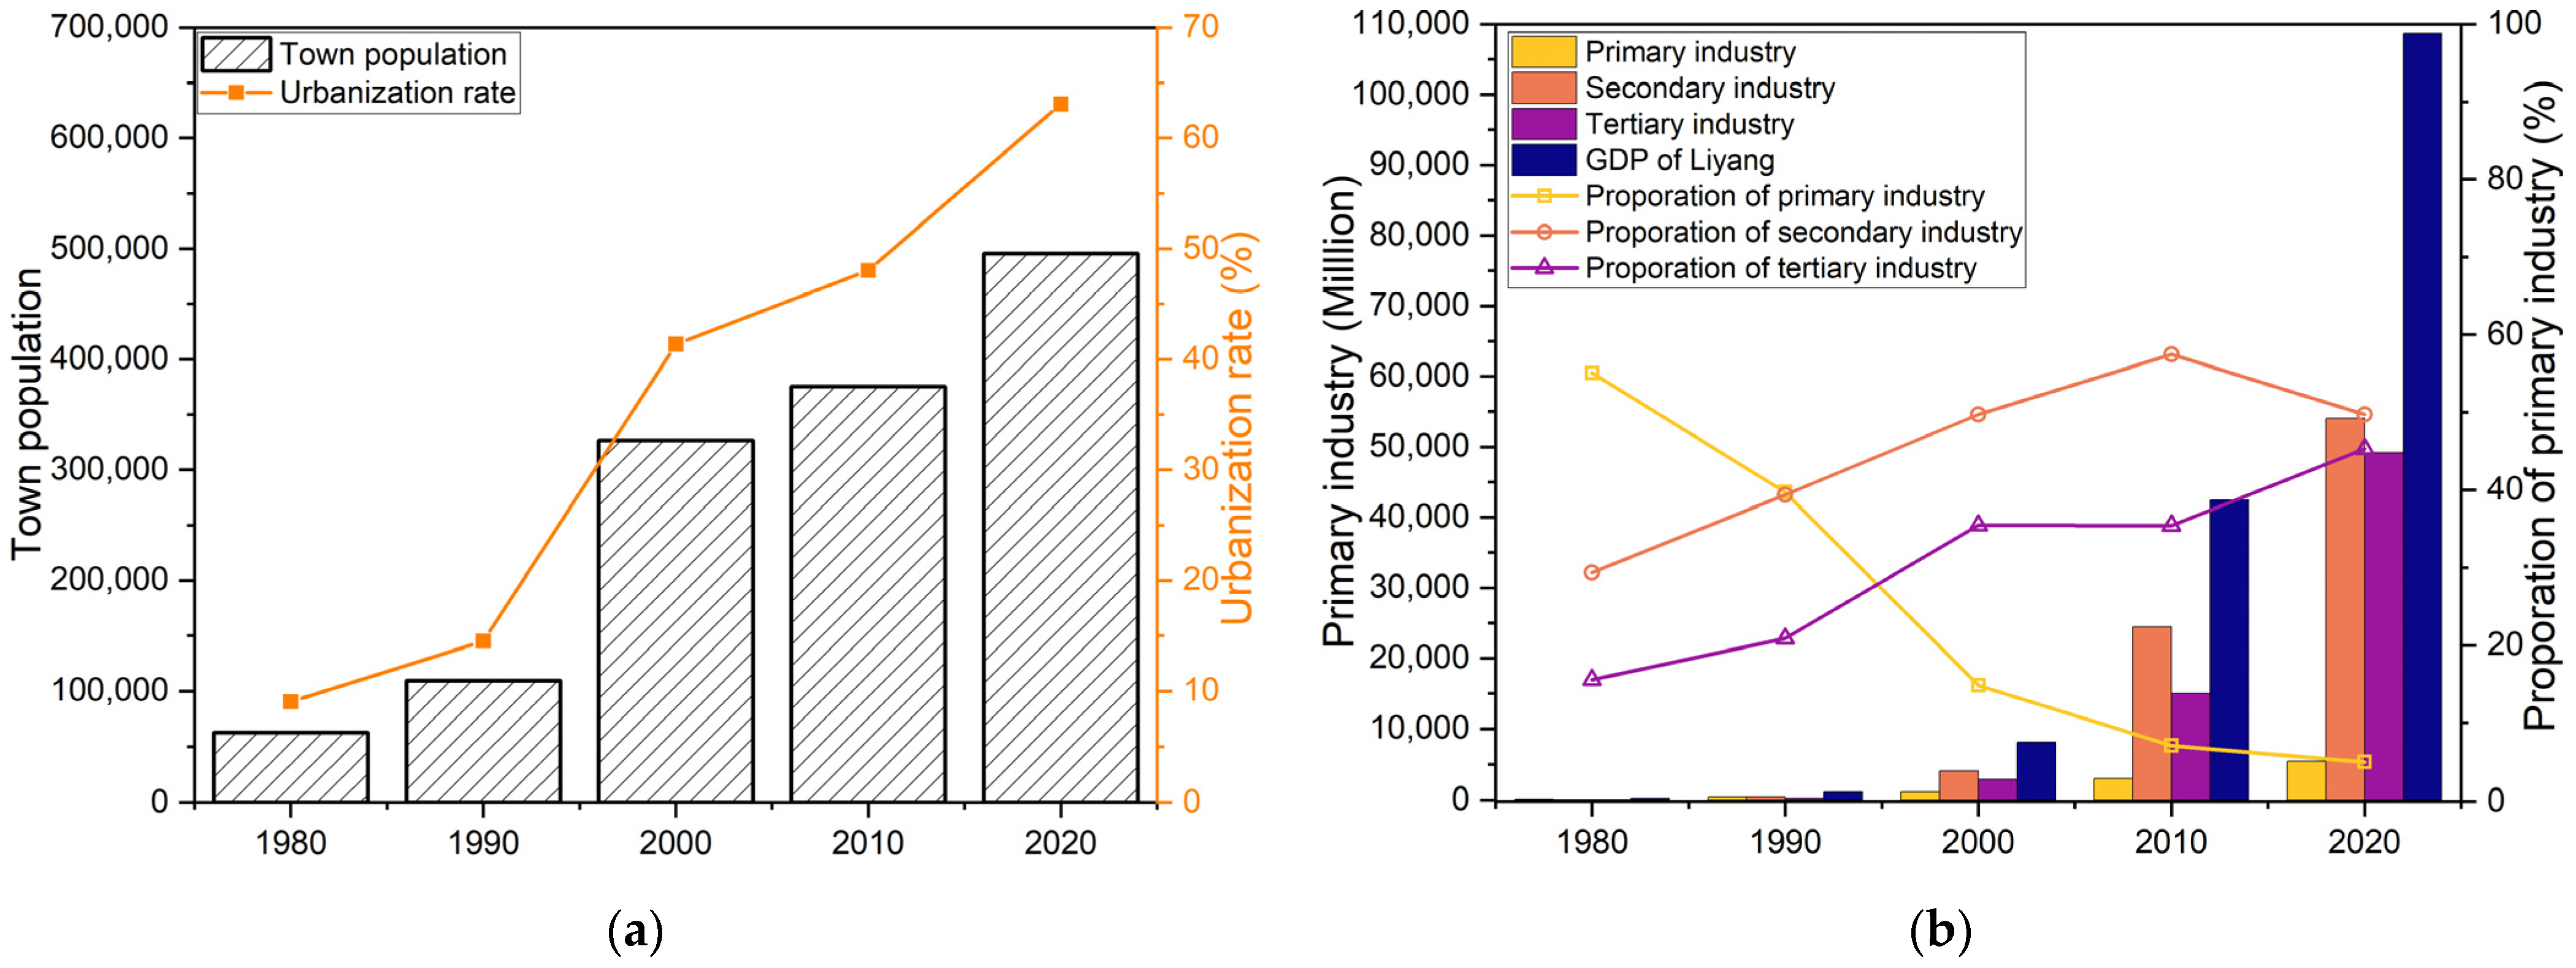
2.1. Study Area
2.2. Data Sources and Processing
2.3. Methods
2.3.1. Dynamic Degree of Land Use
2.3.2. Land Use Conflict Assessment Model
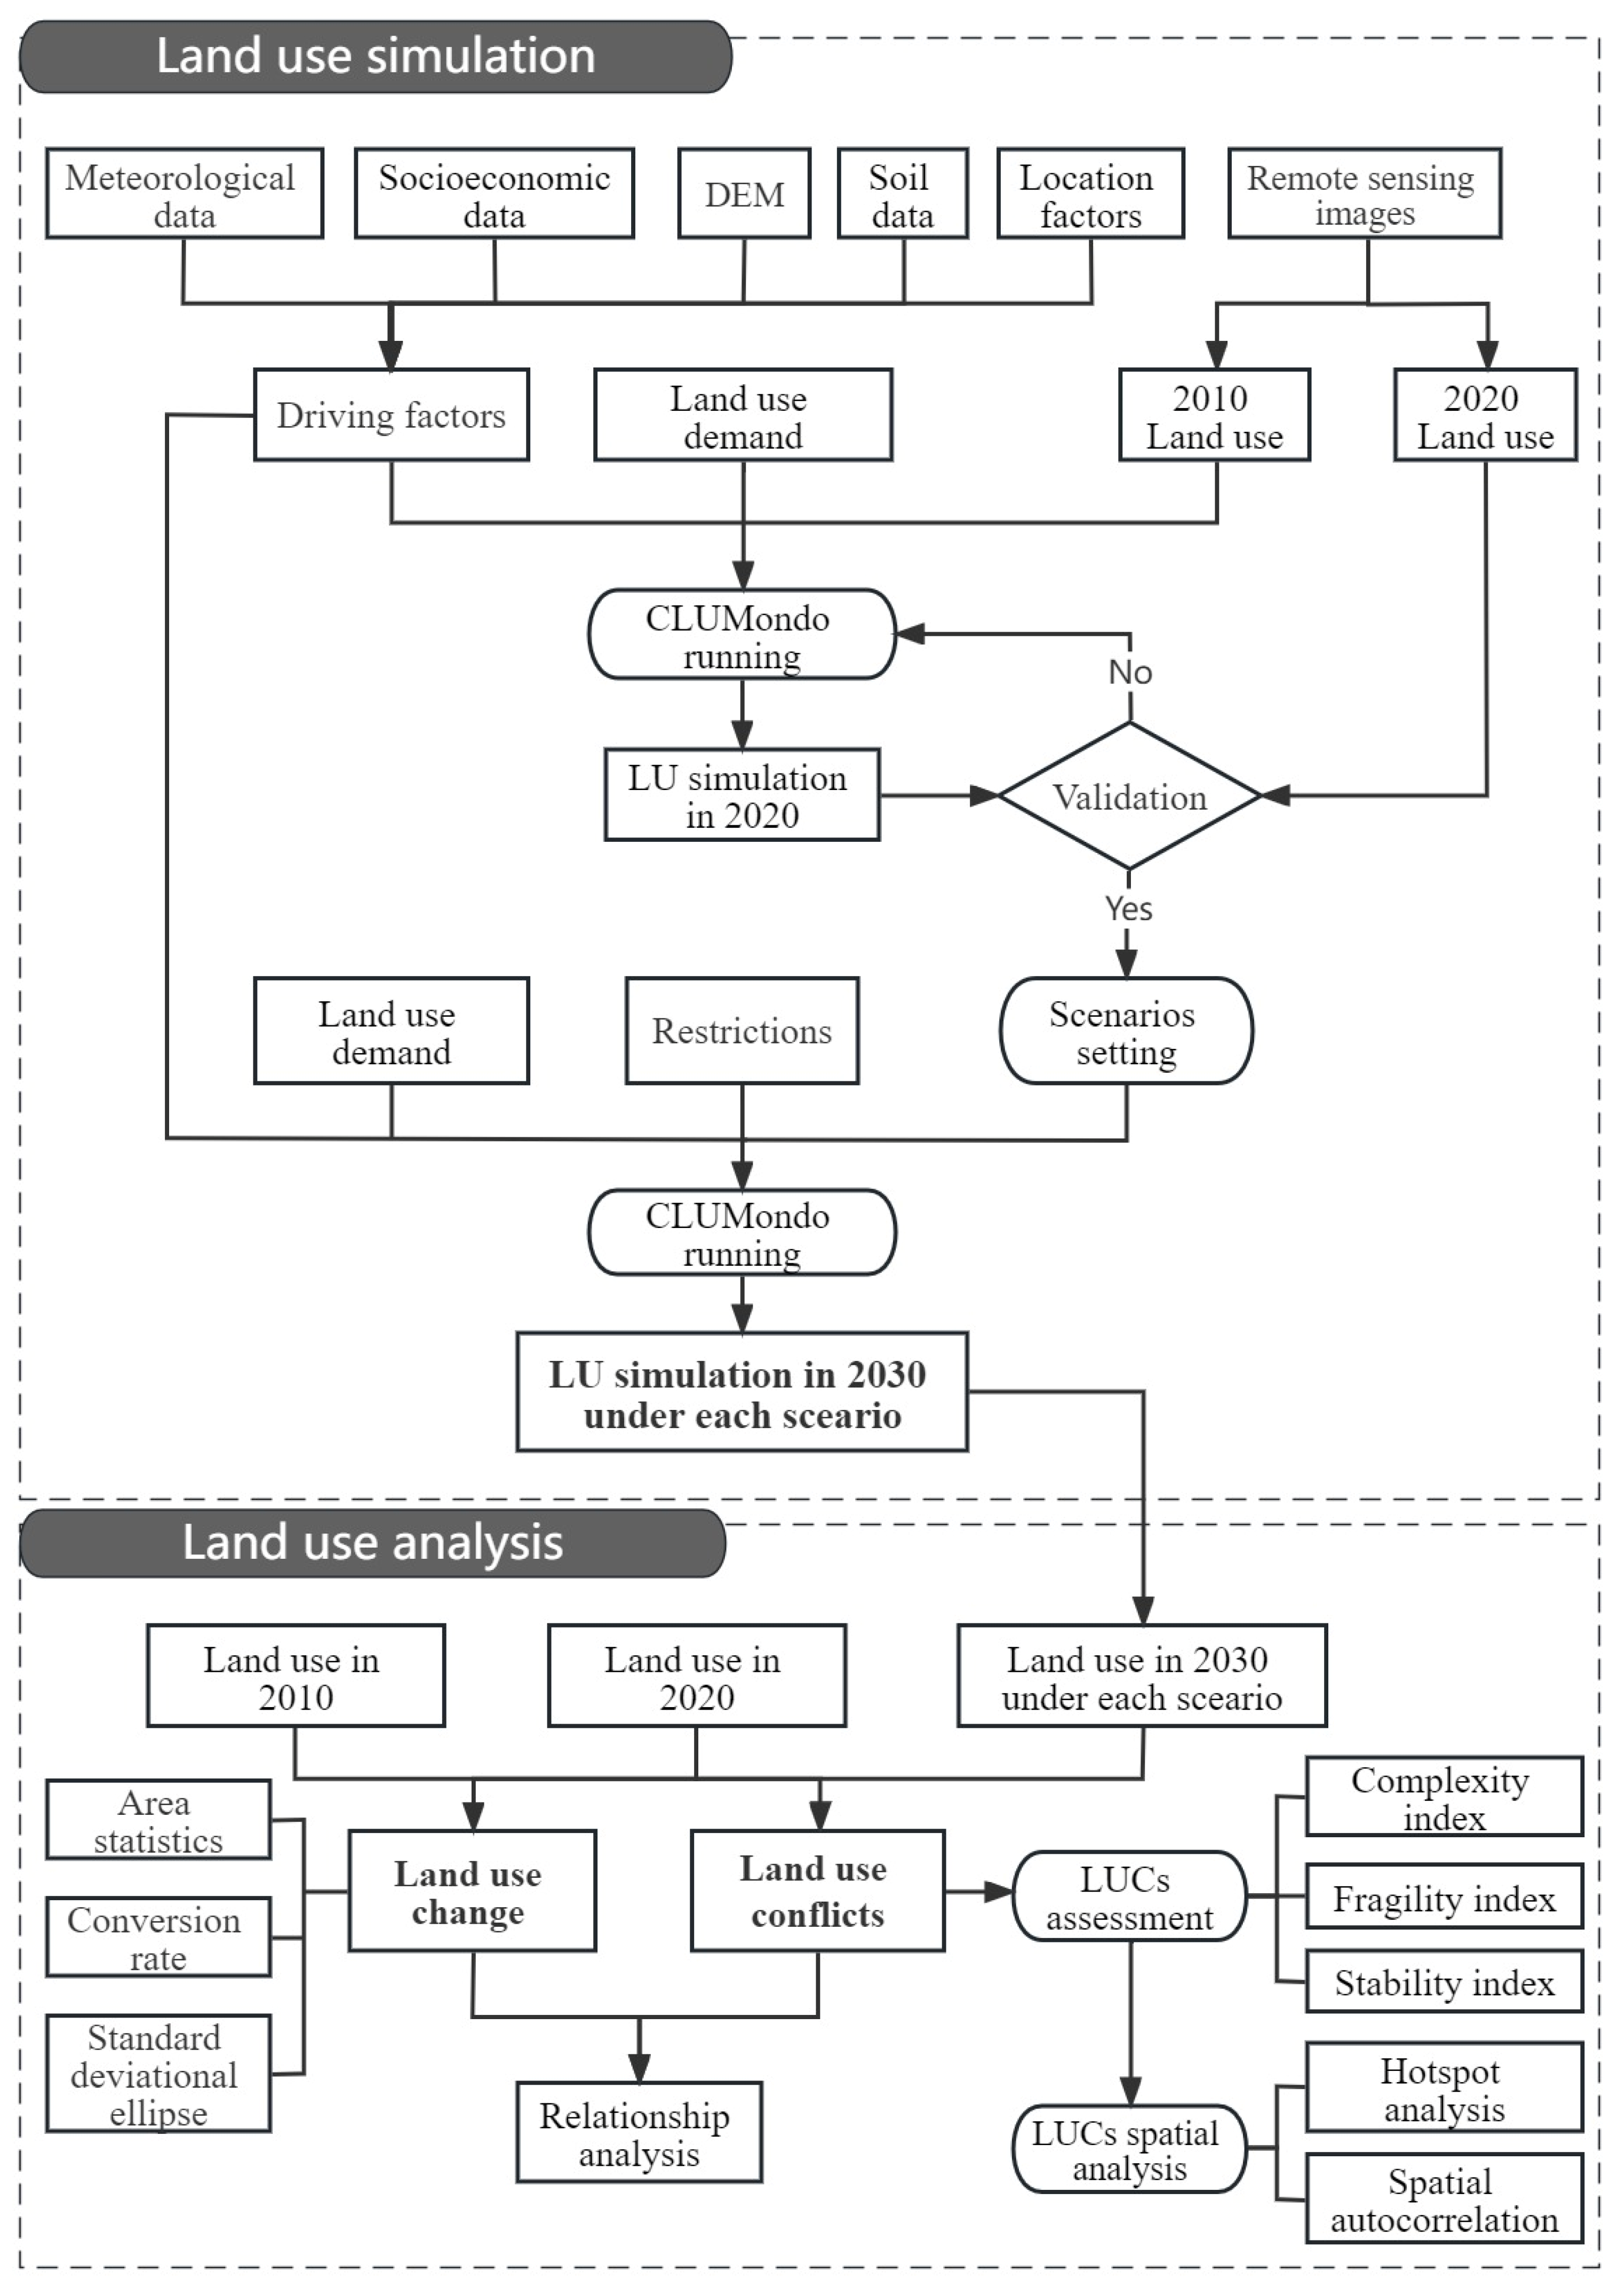
2.3.3. Simulation of Future Land Use
- Scenario settings
- 2.
- Parameter setting for CLUMondo model
- 3.
- Model validation
2.3.4. Spatial Autocorrelation Analysis
3. Results
3.1. Validation of CLUMondo Model
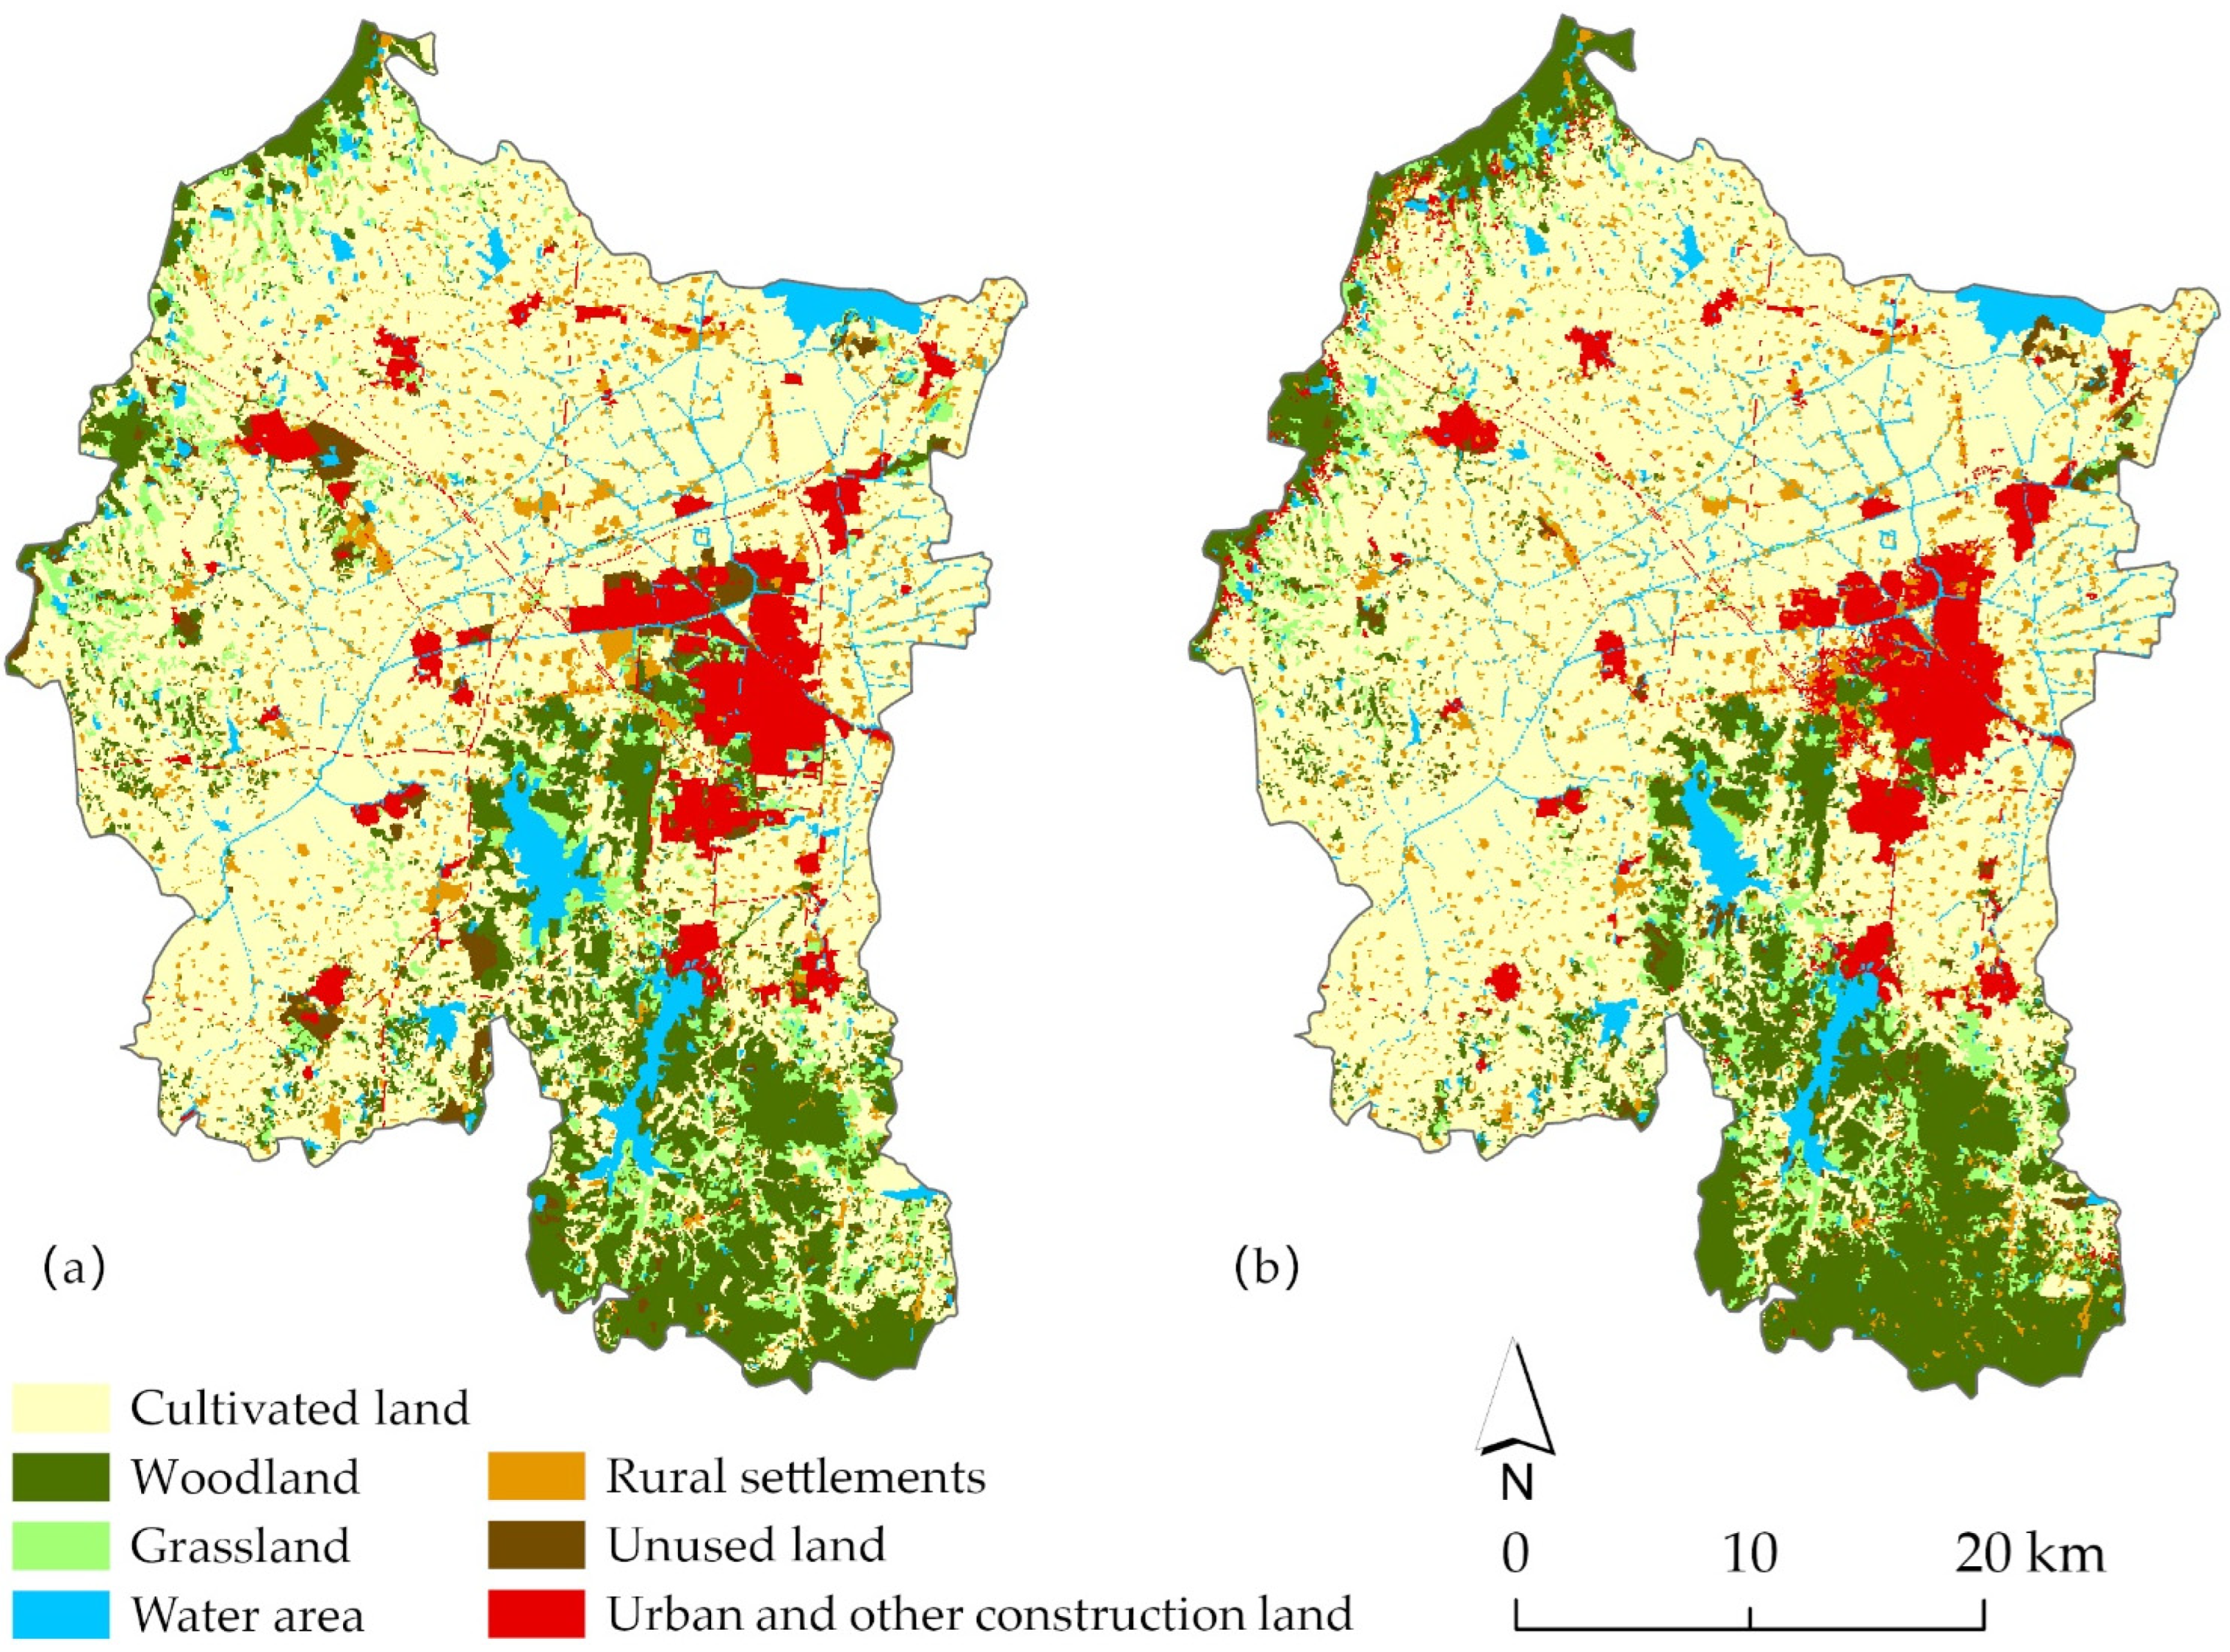
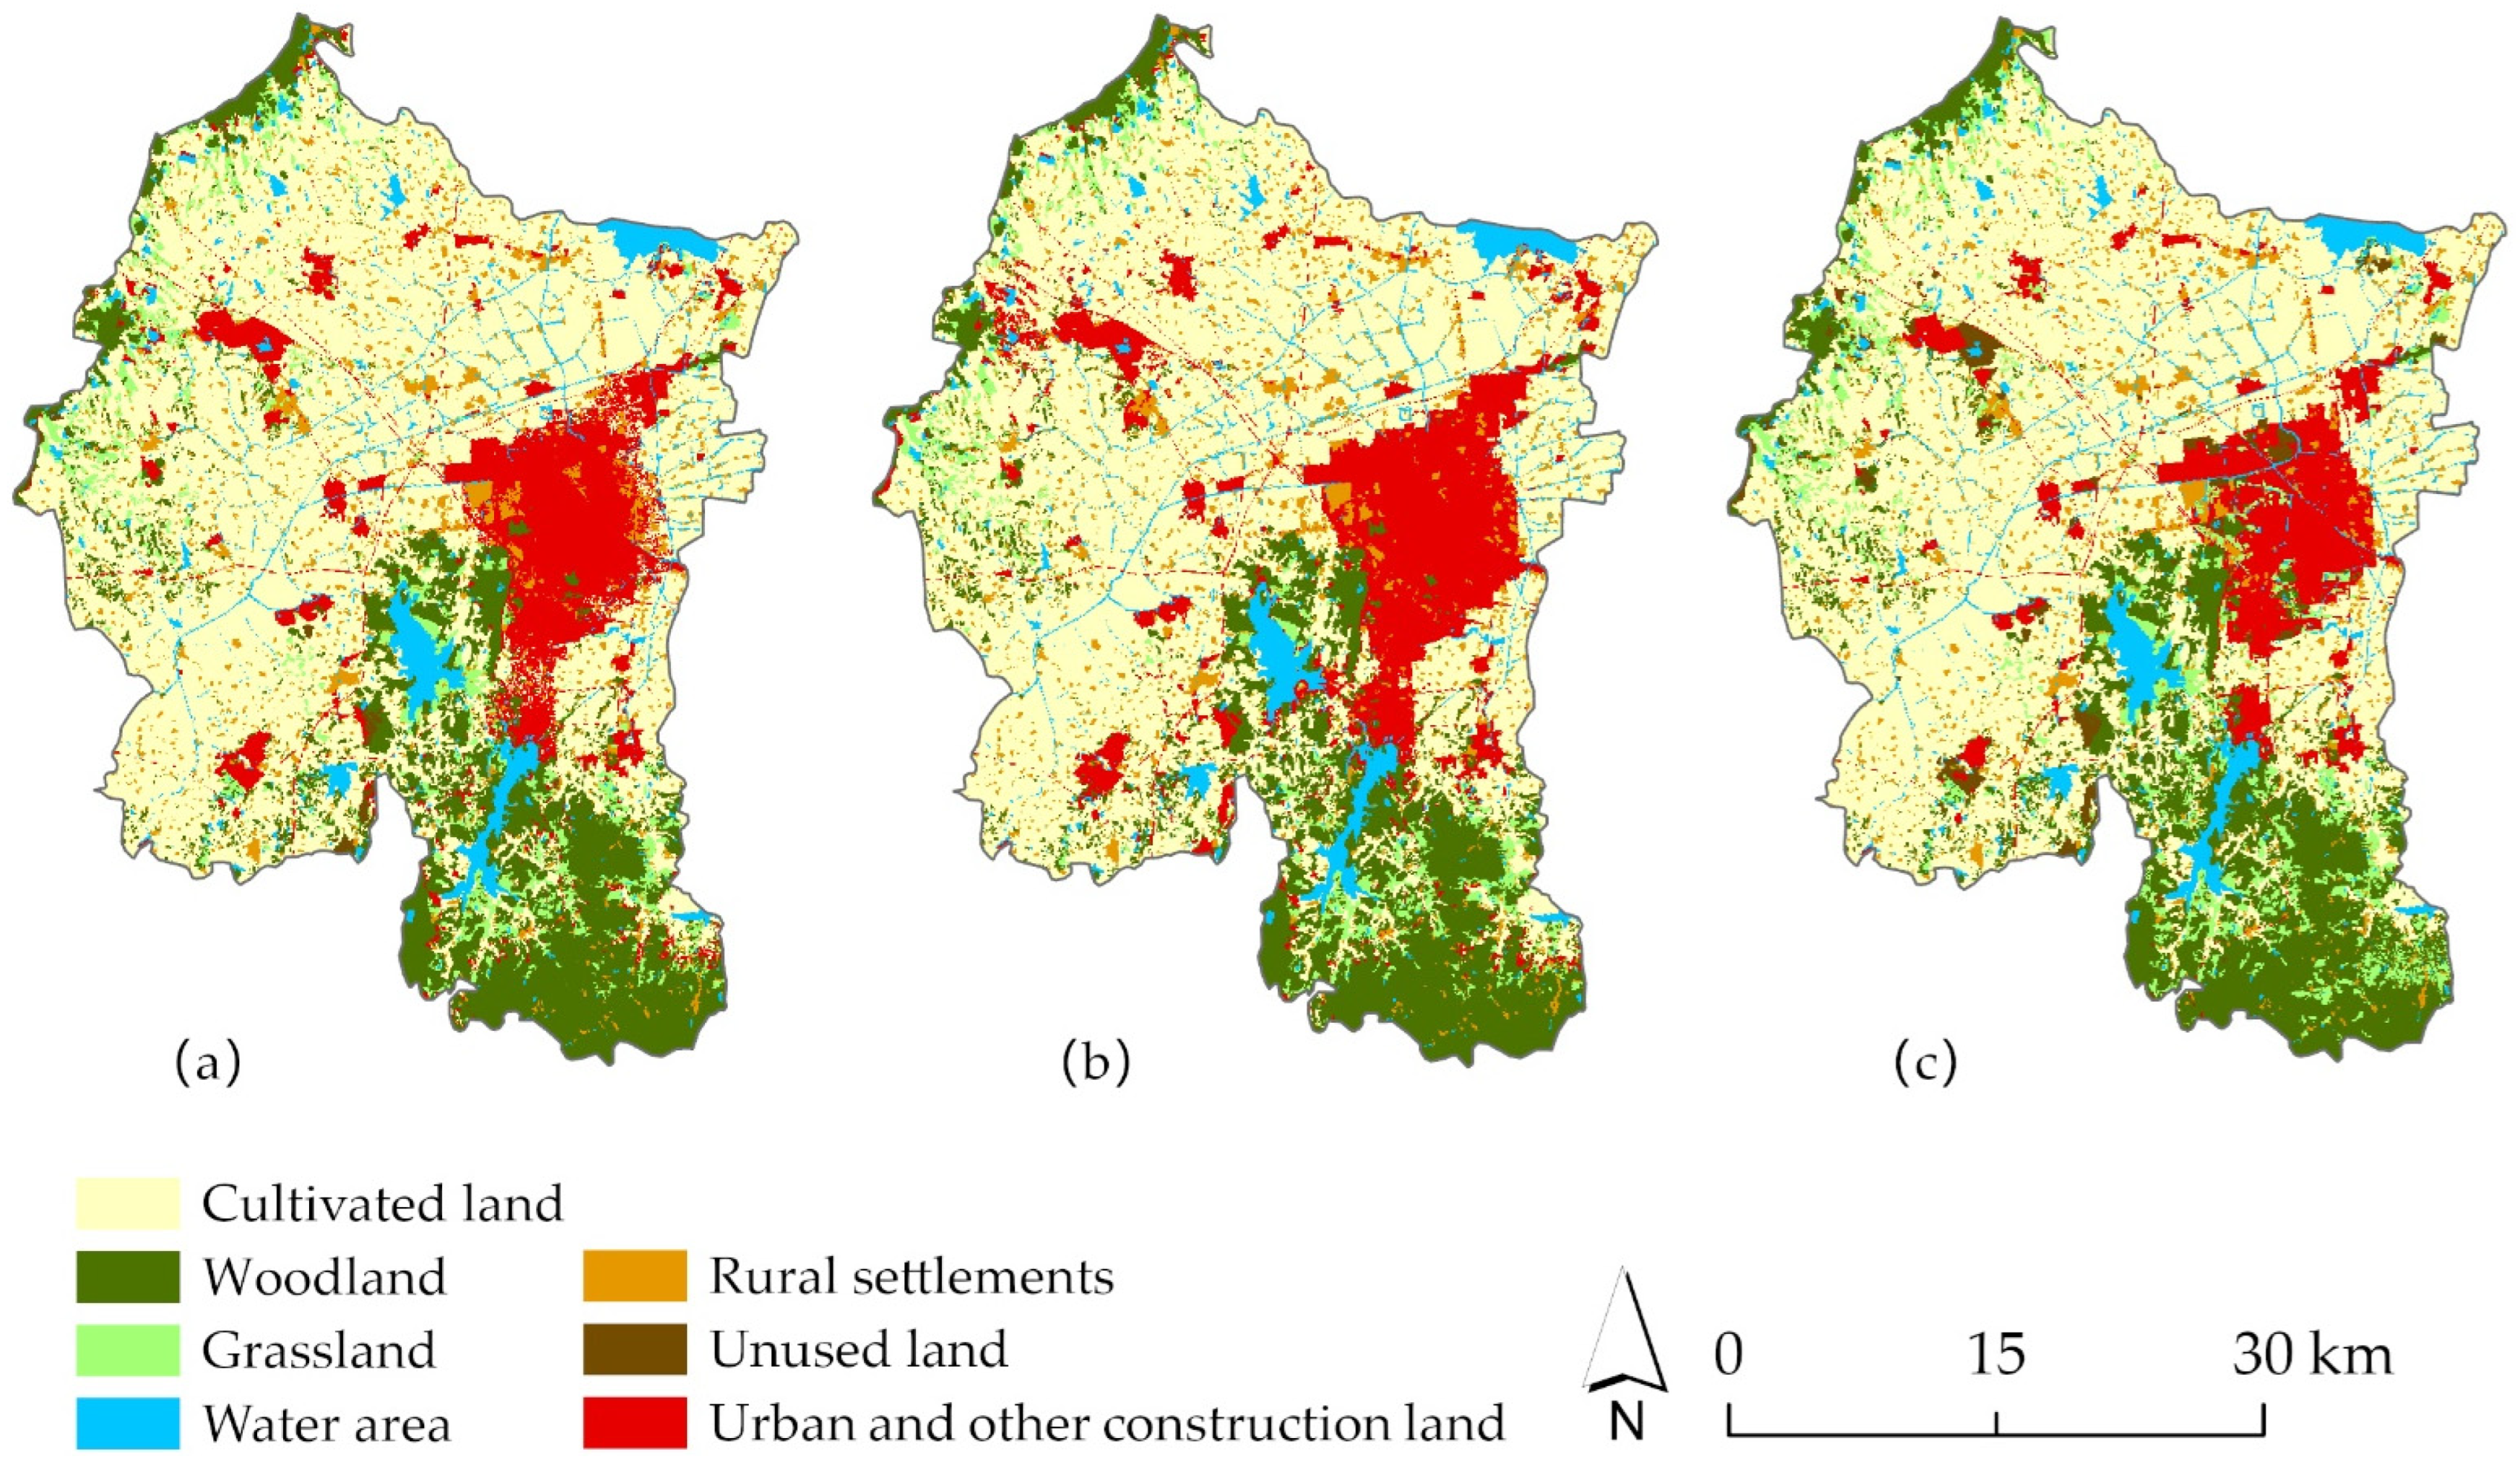
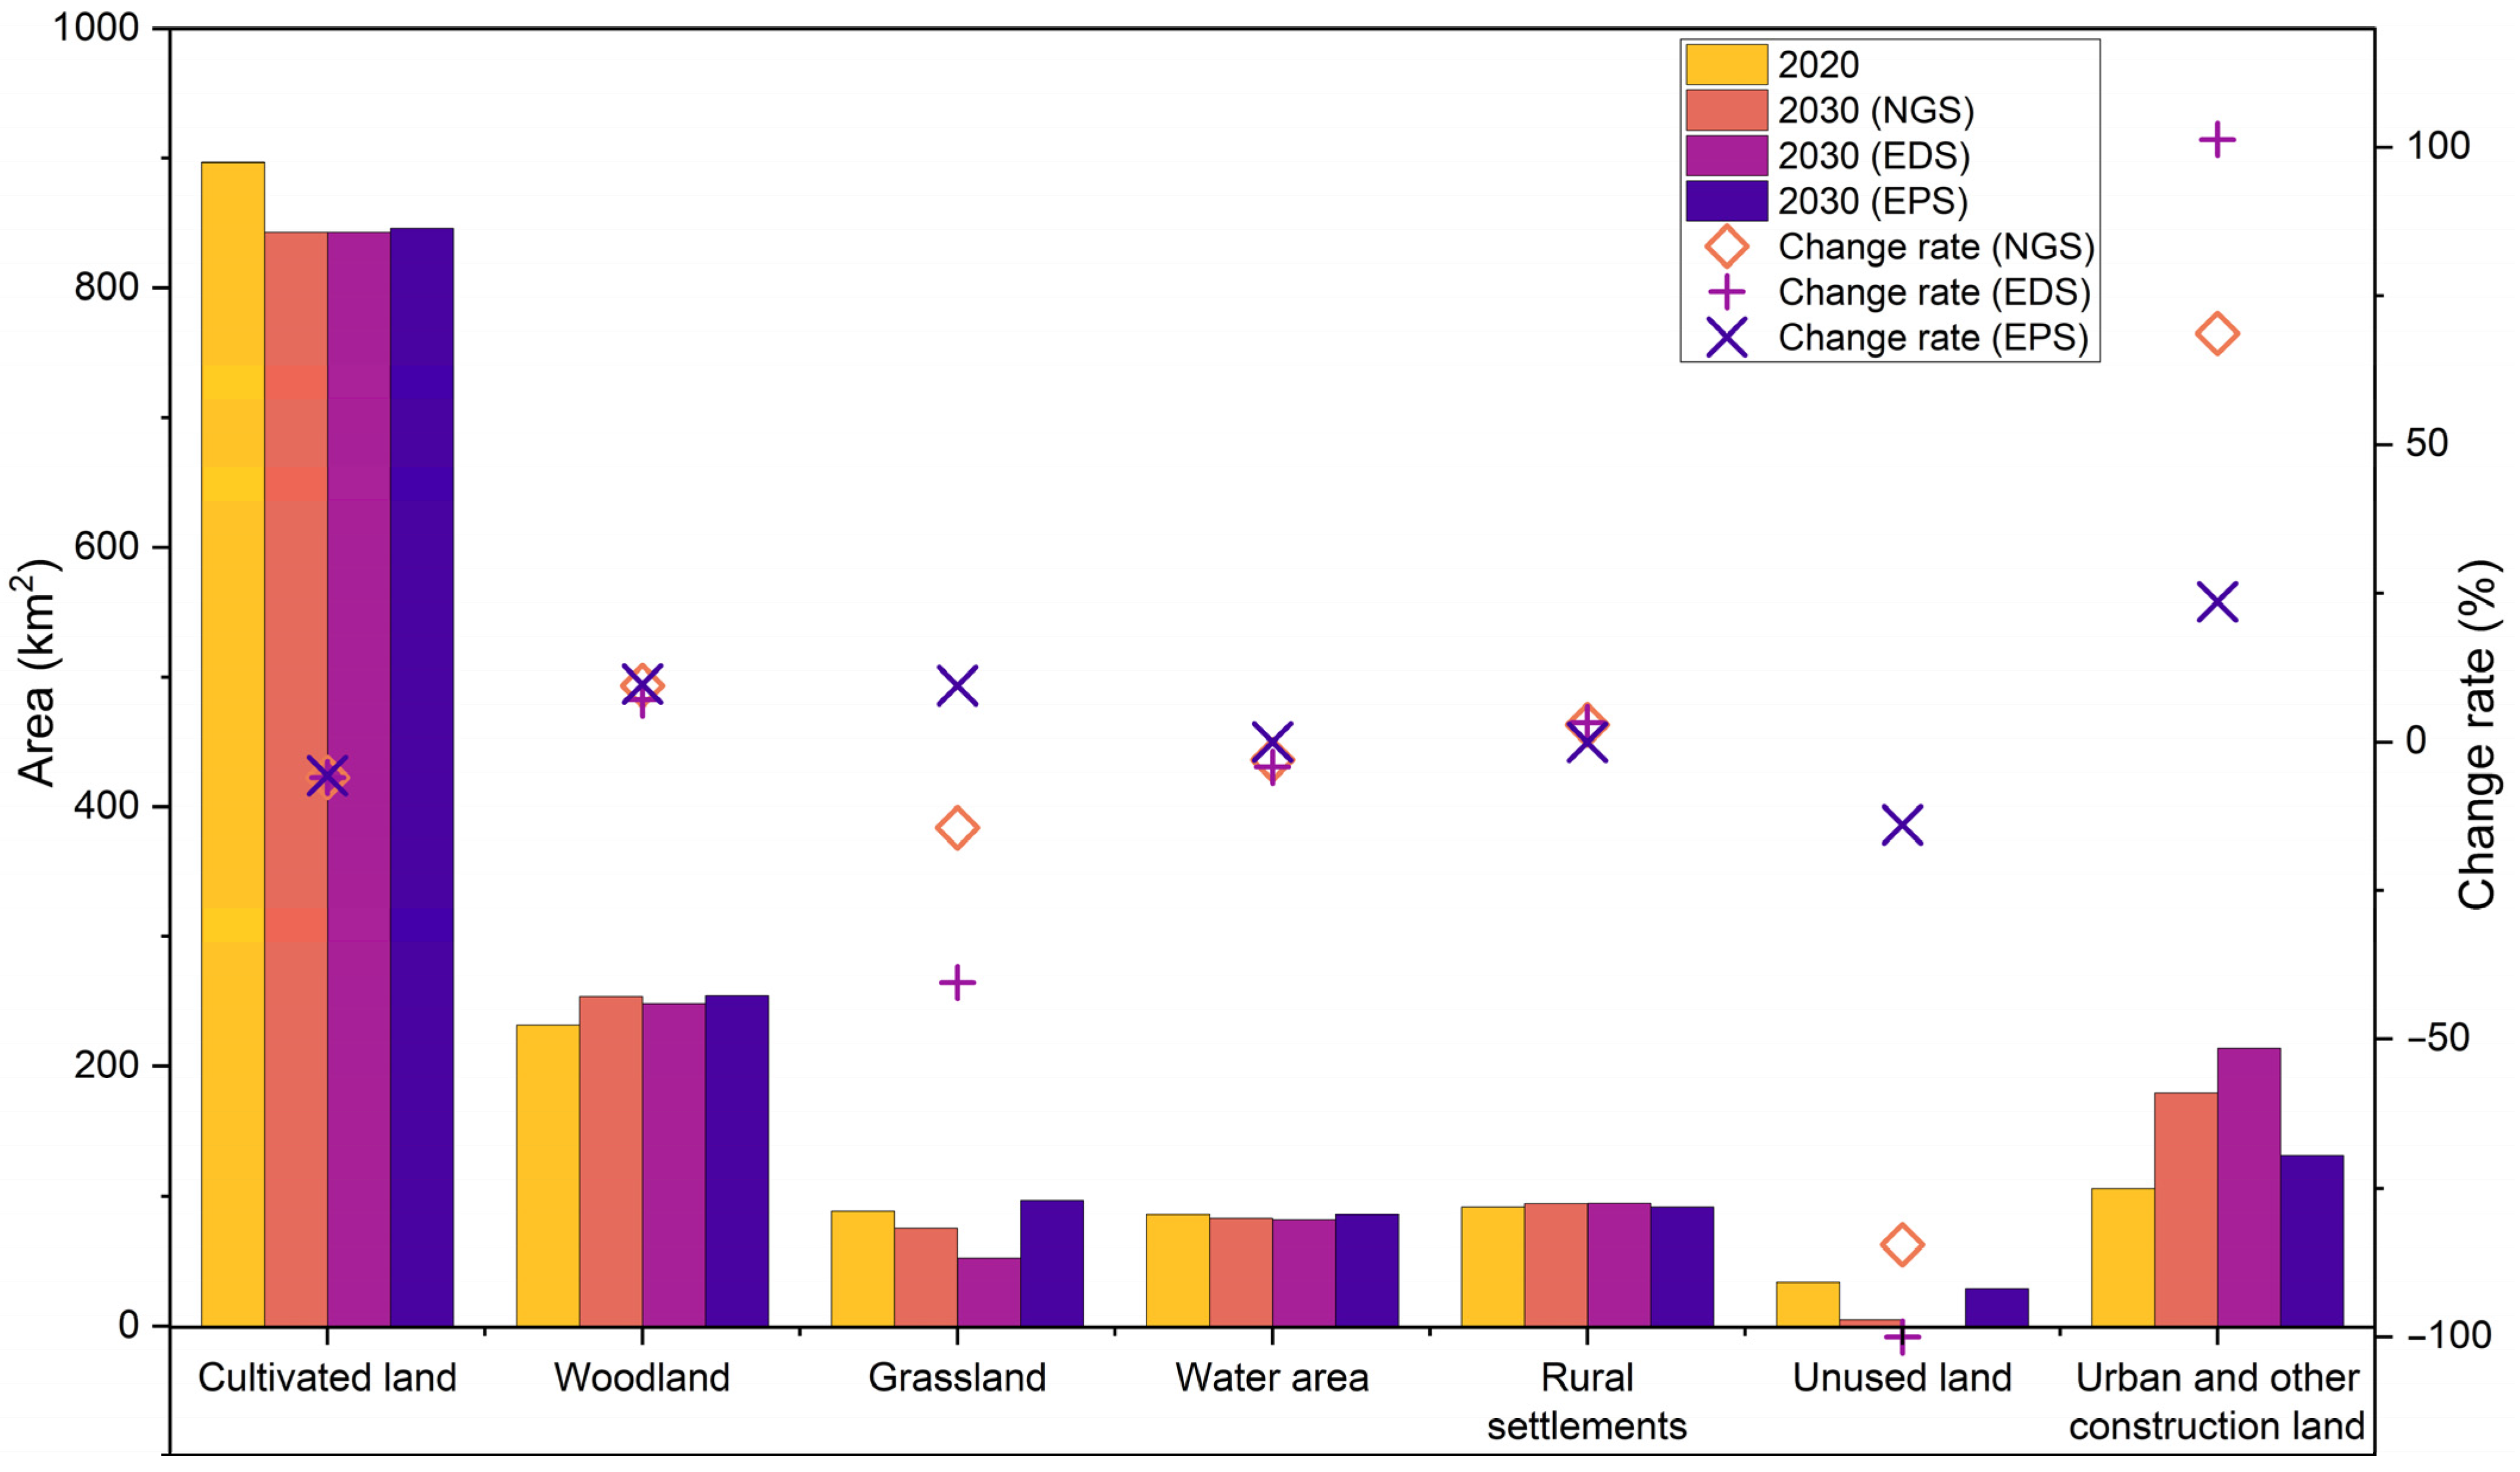
3.2. Simulation Results of Future Land Use
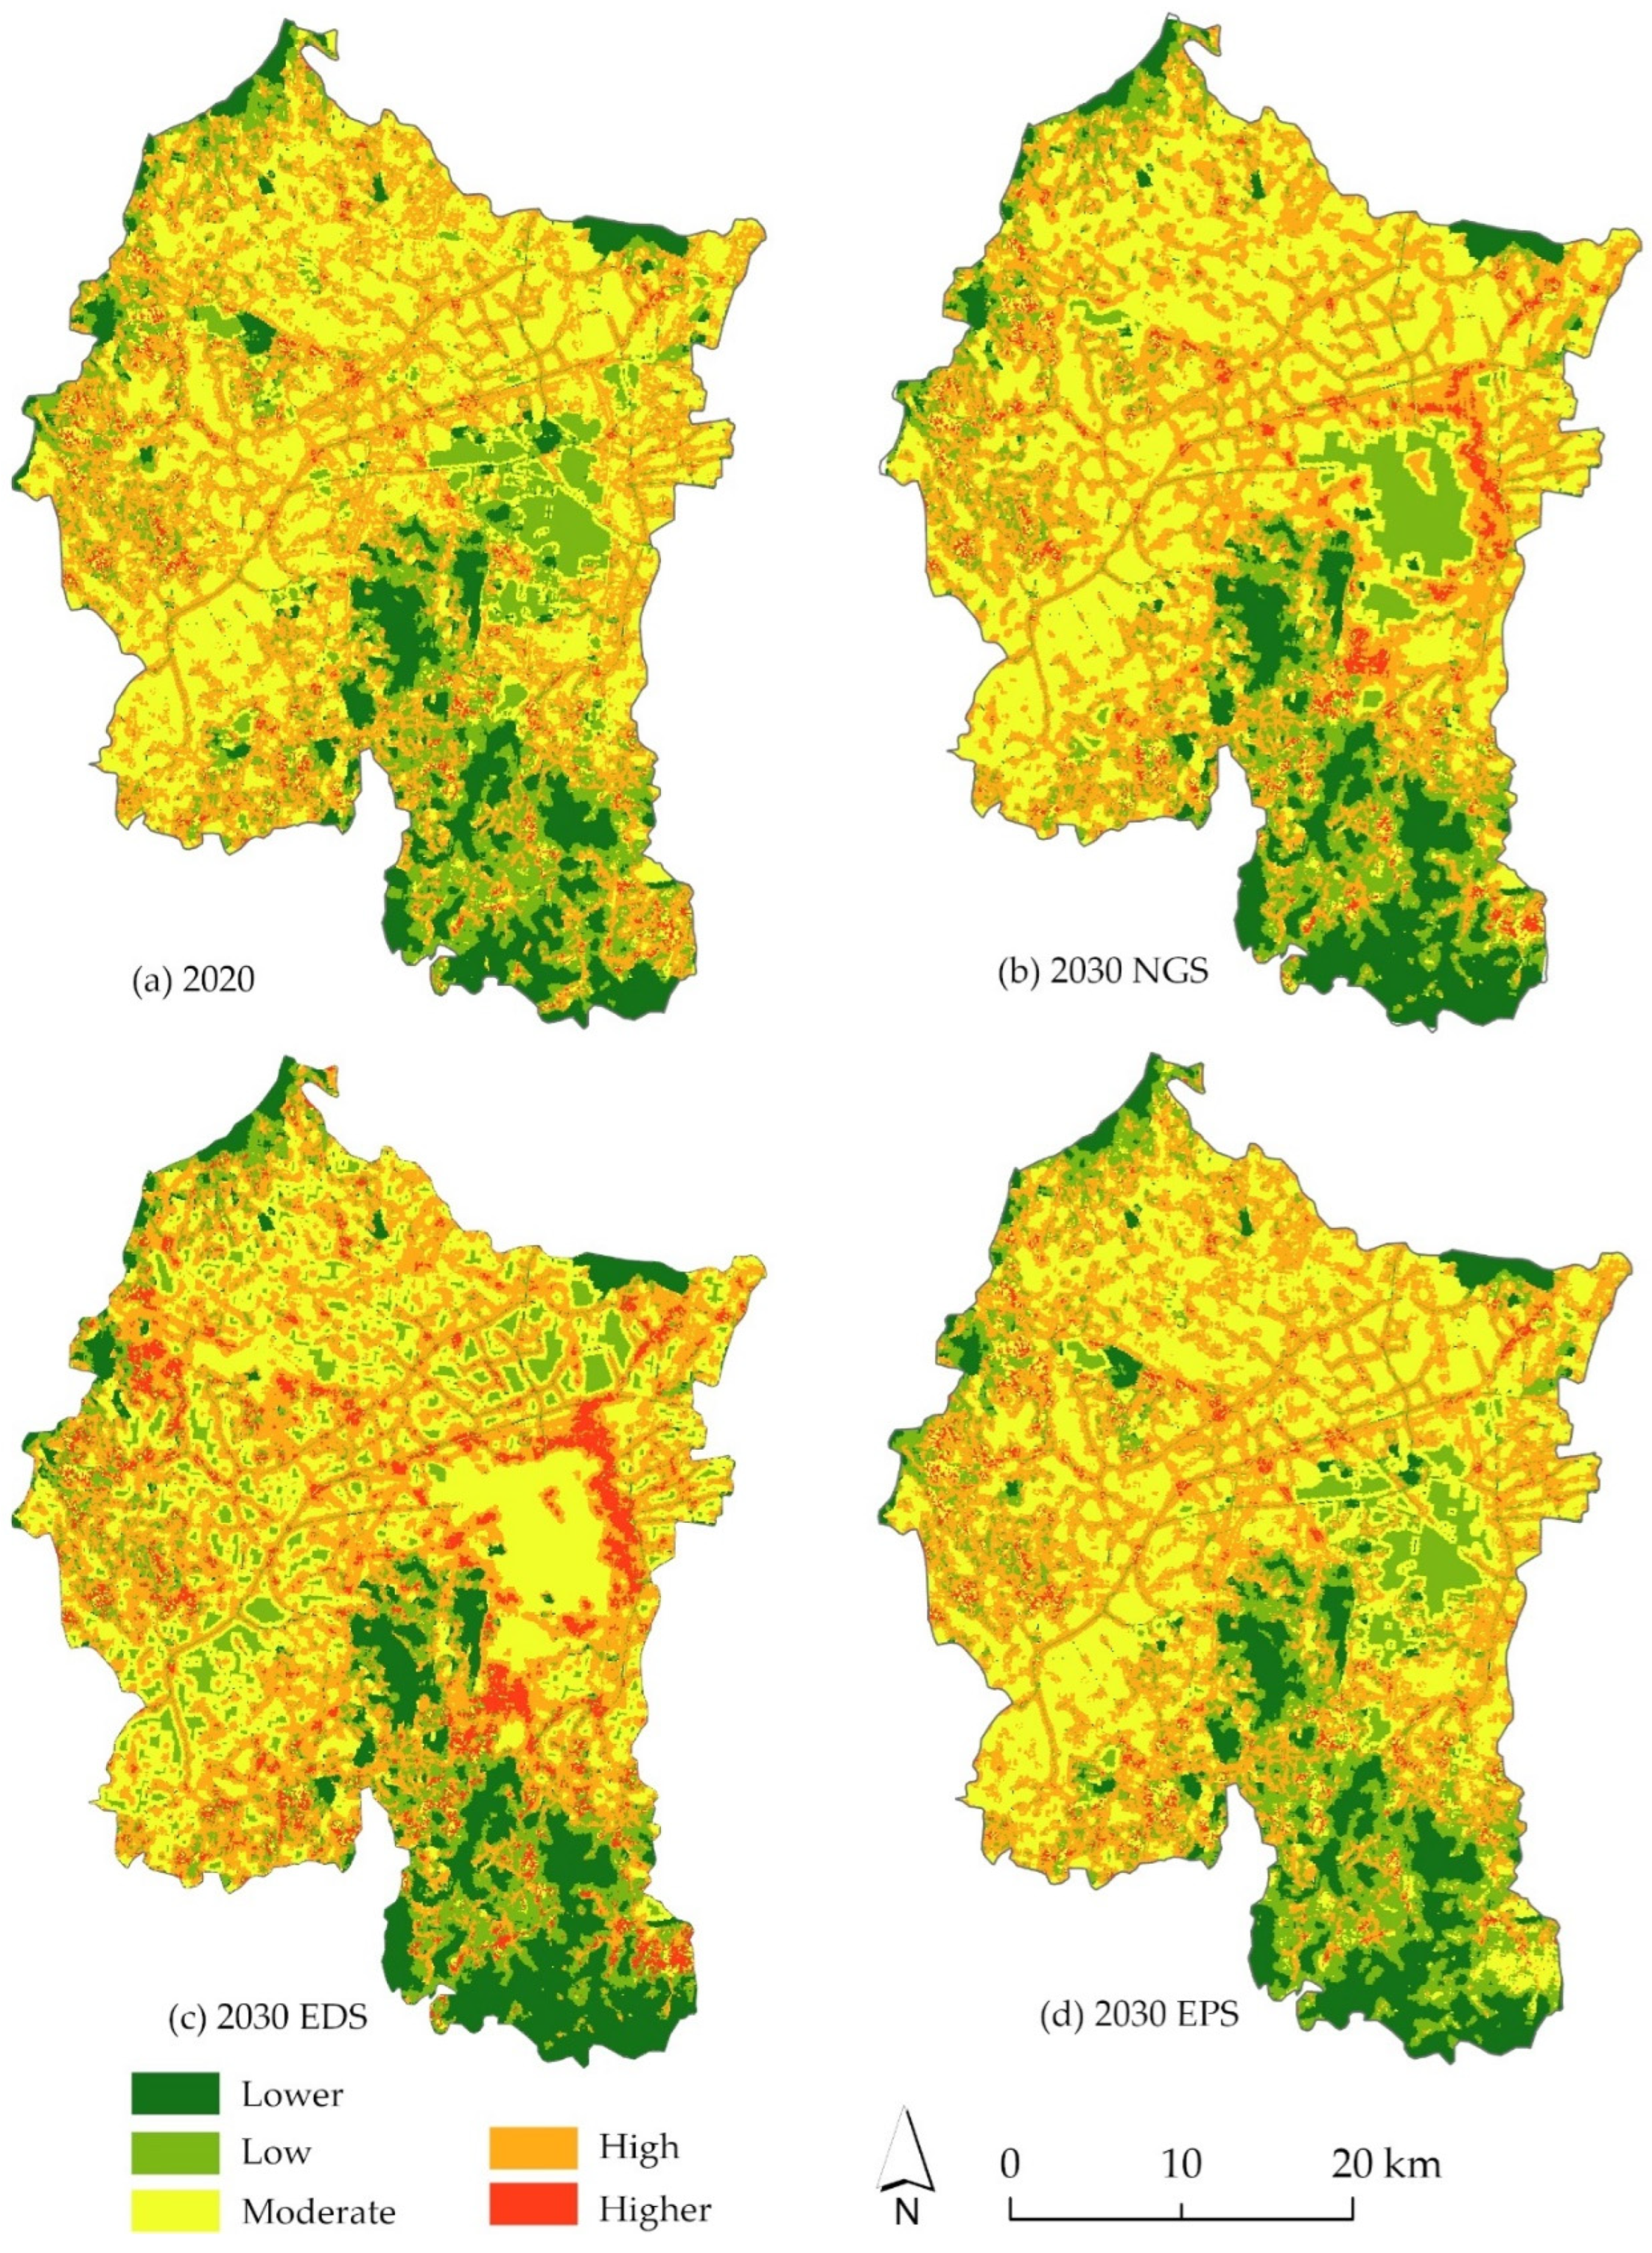
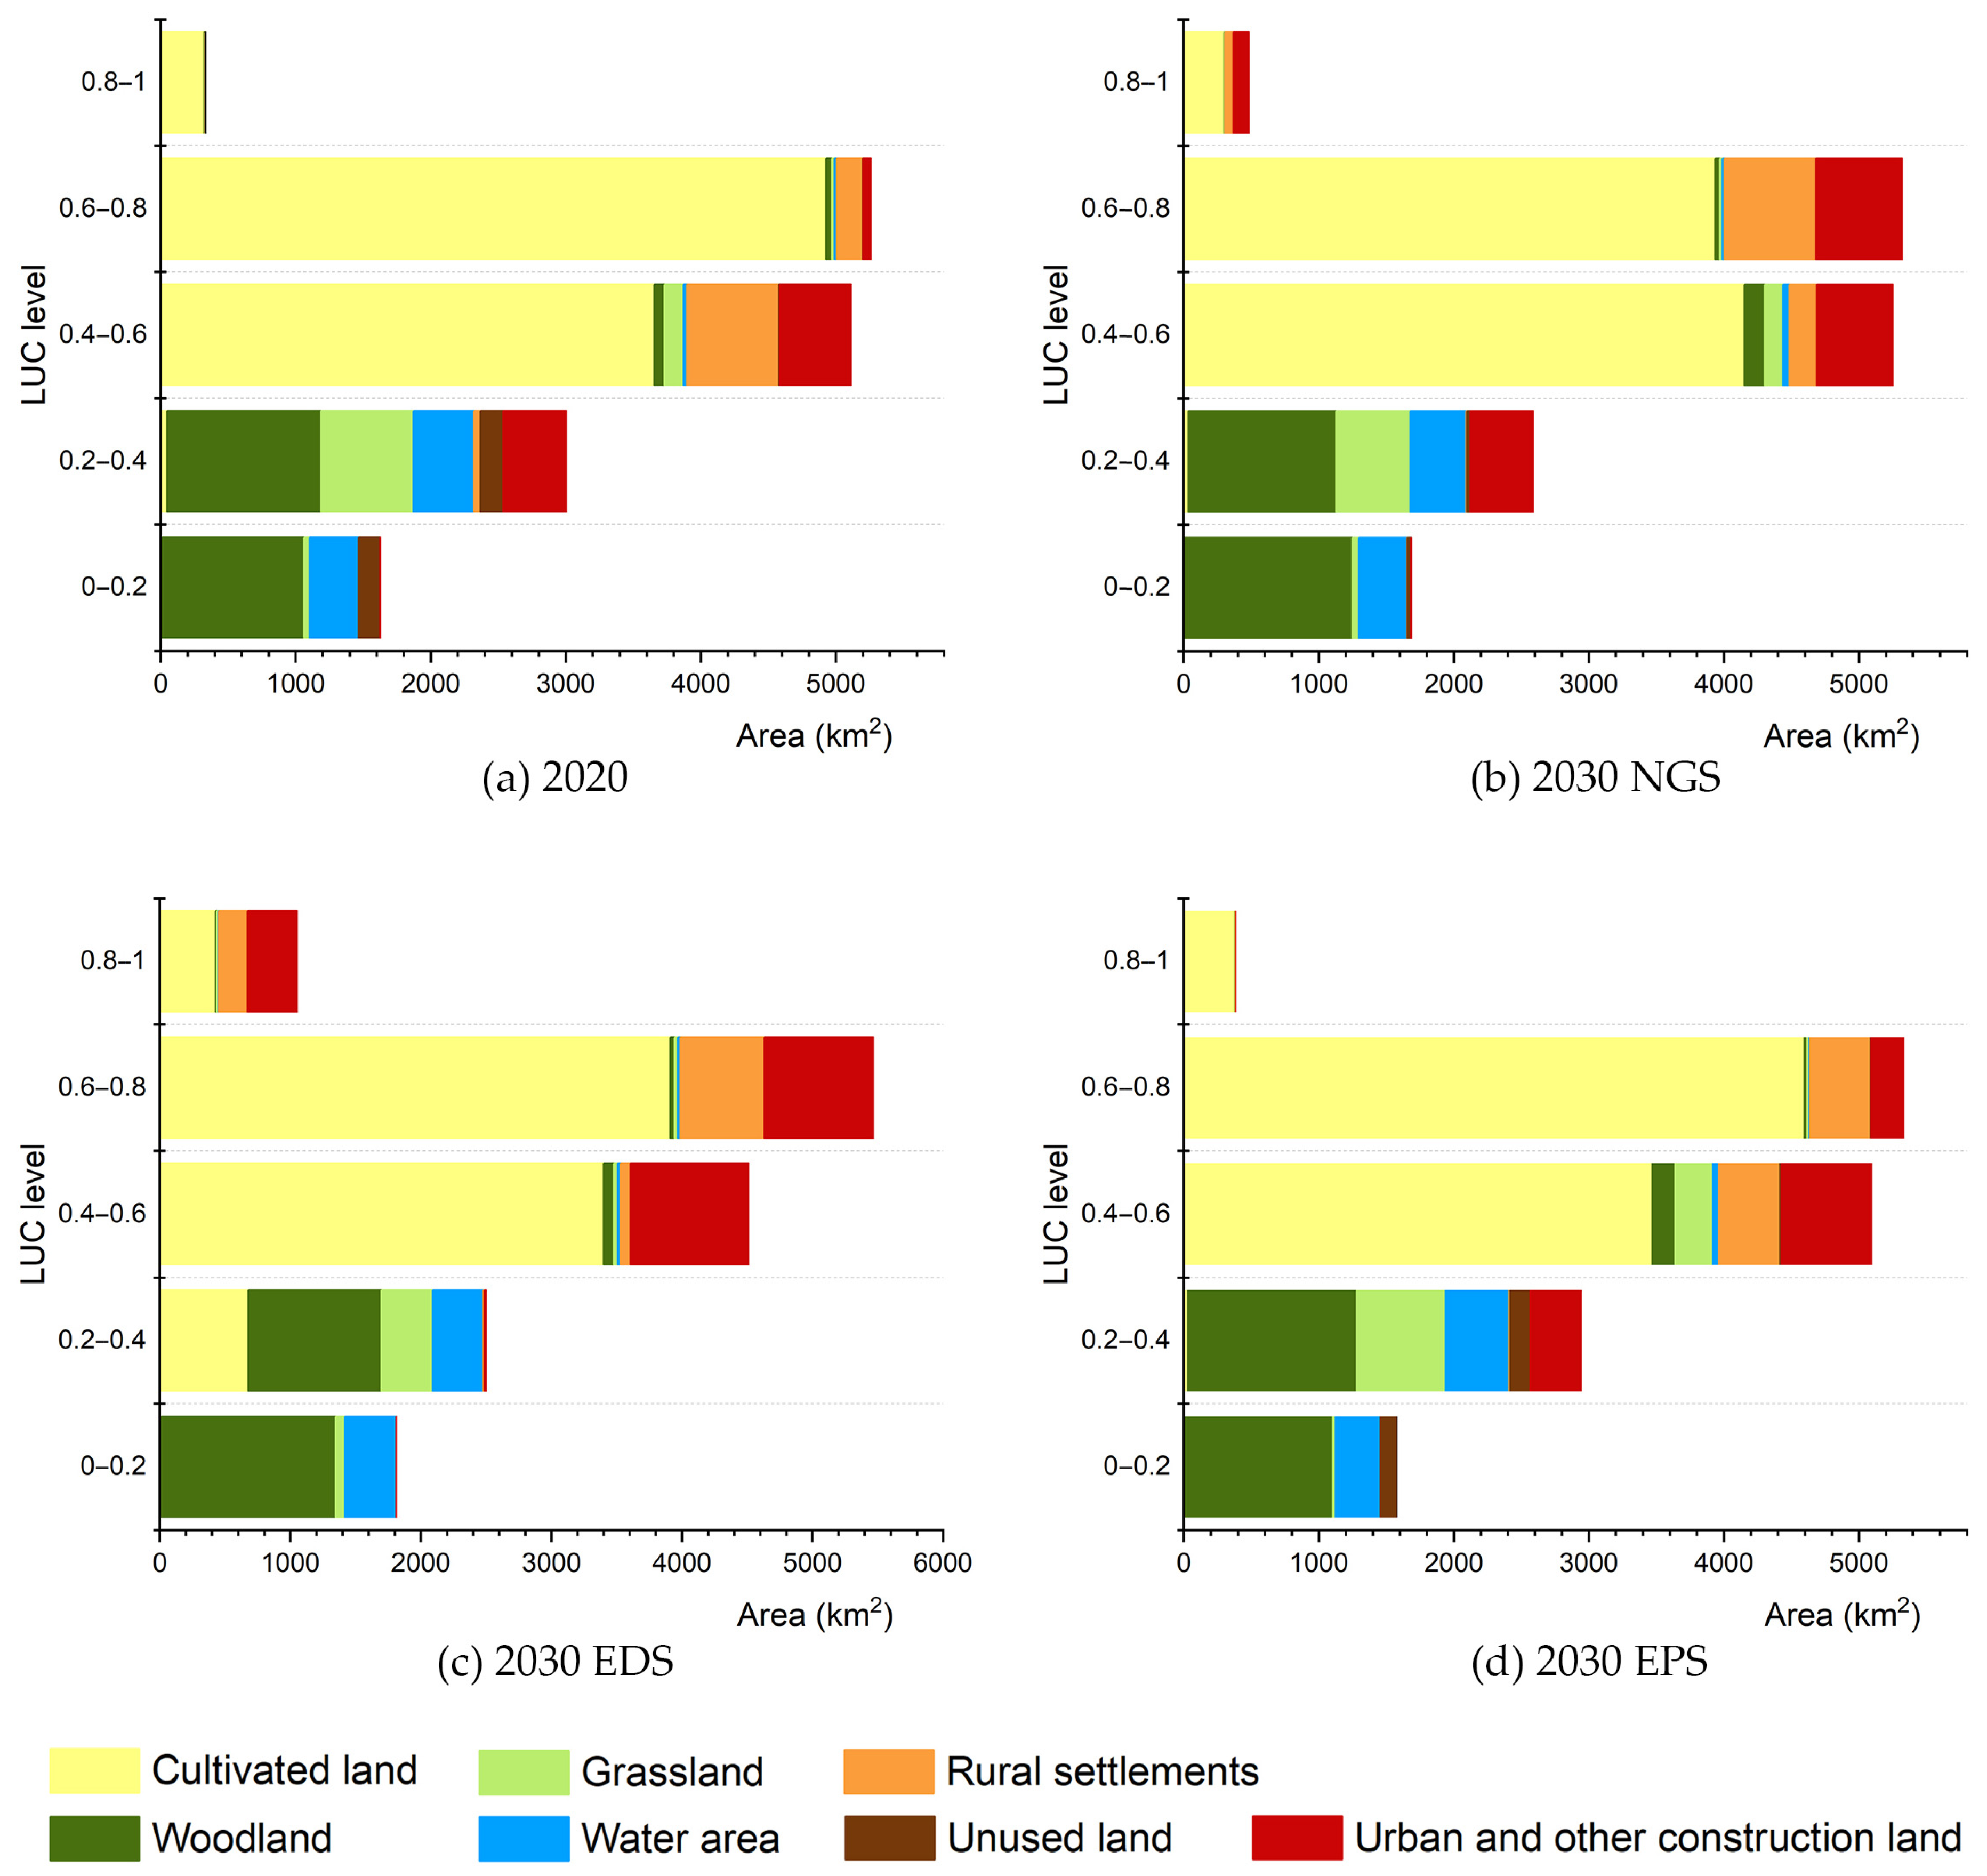
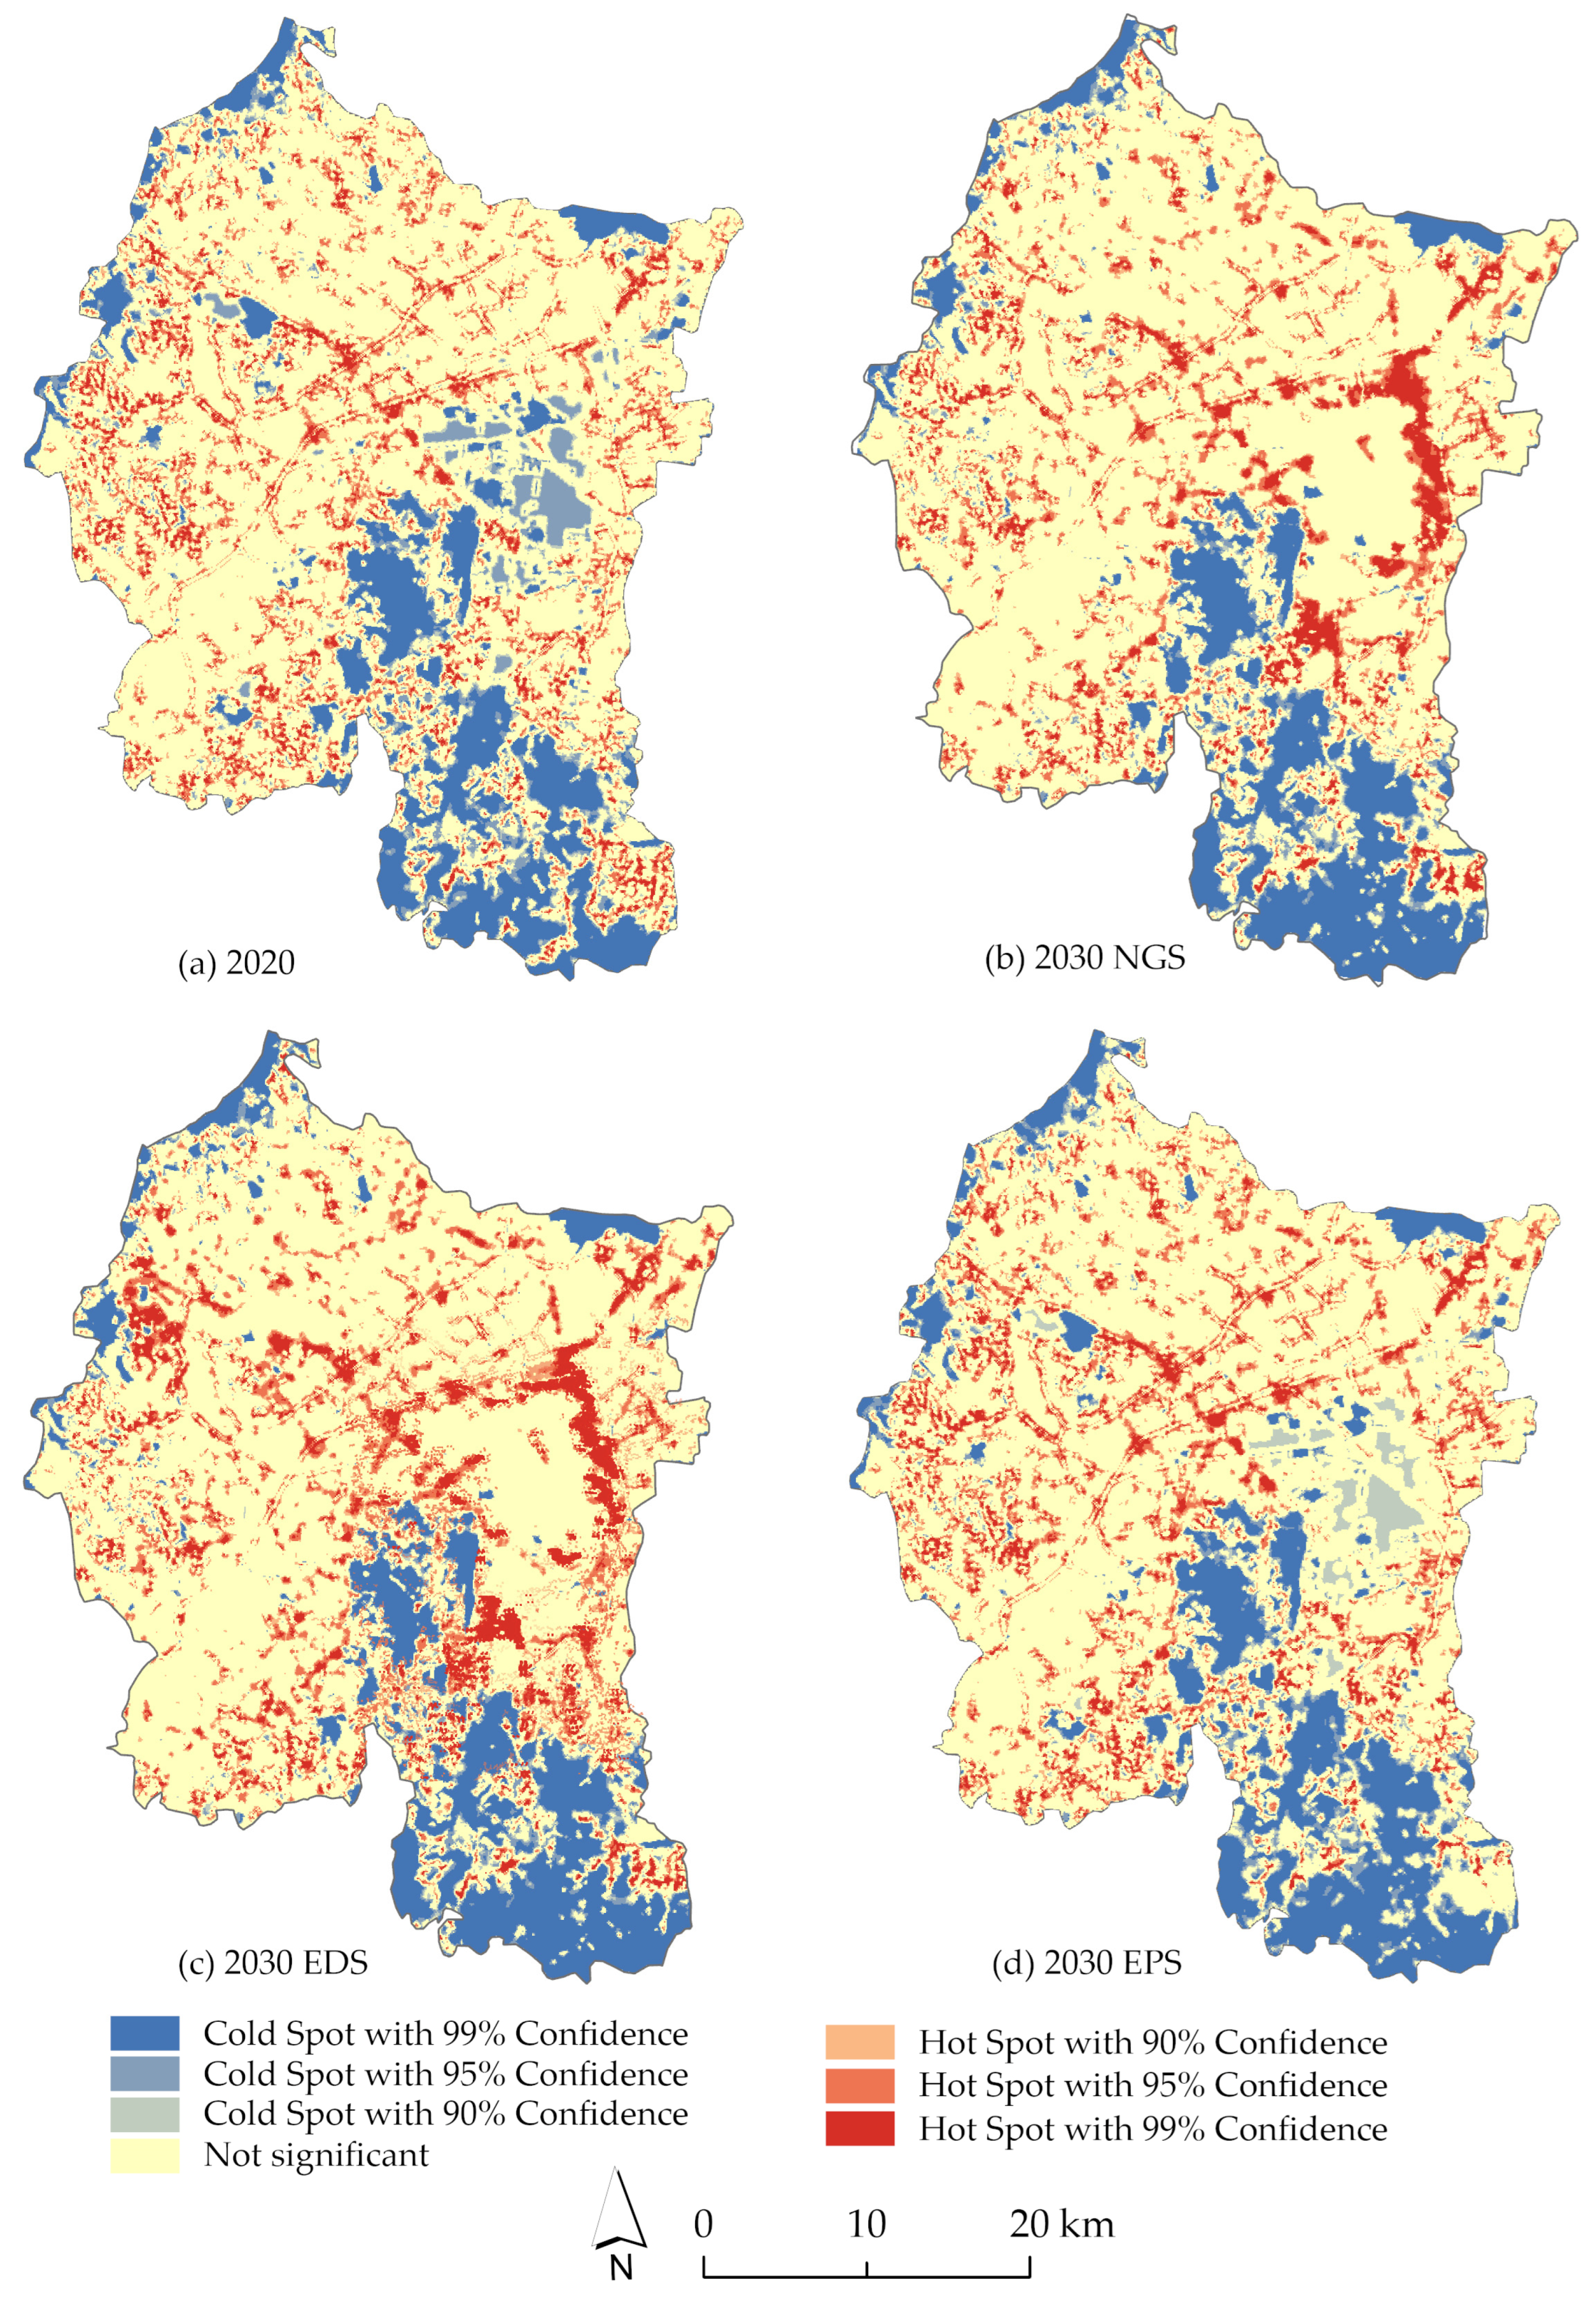
3.3. Characteristics of Land Use Conflicts
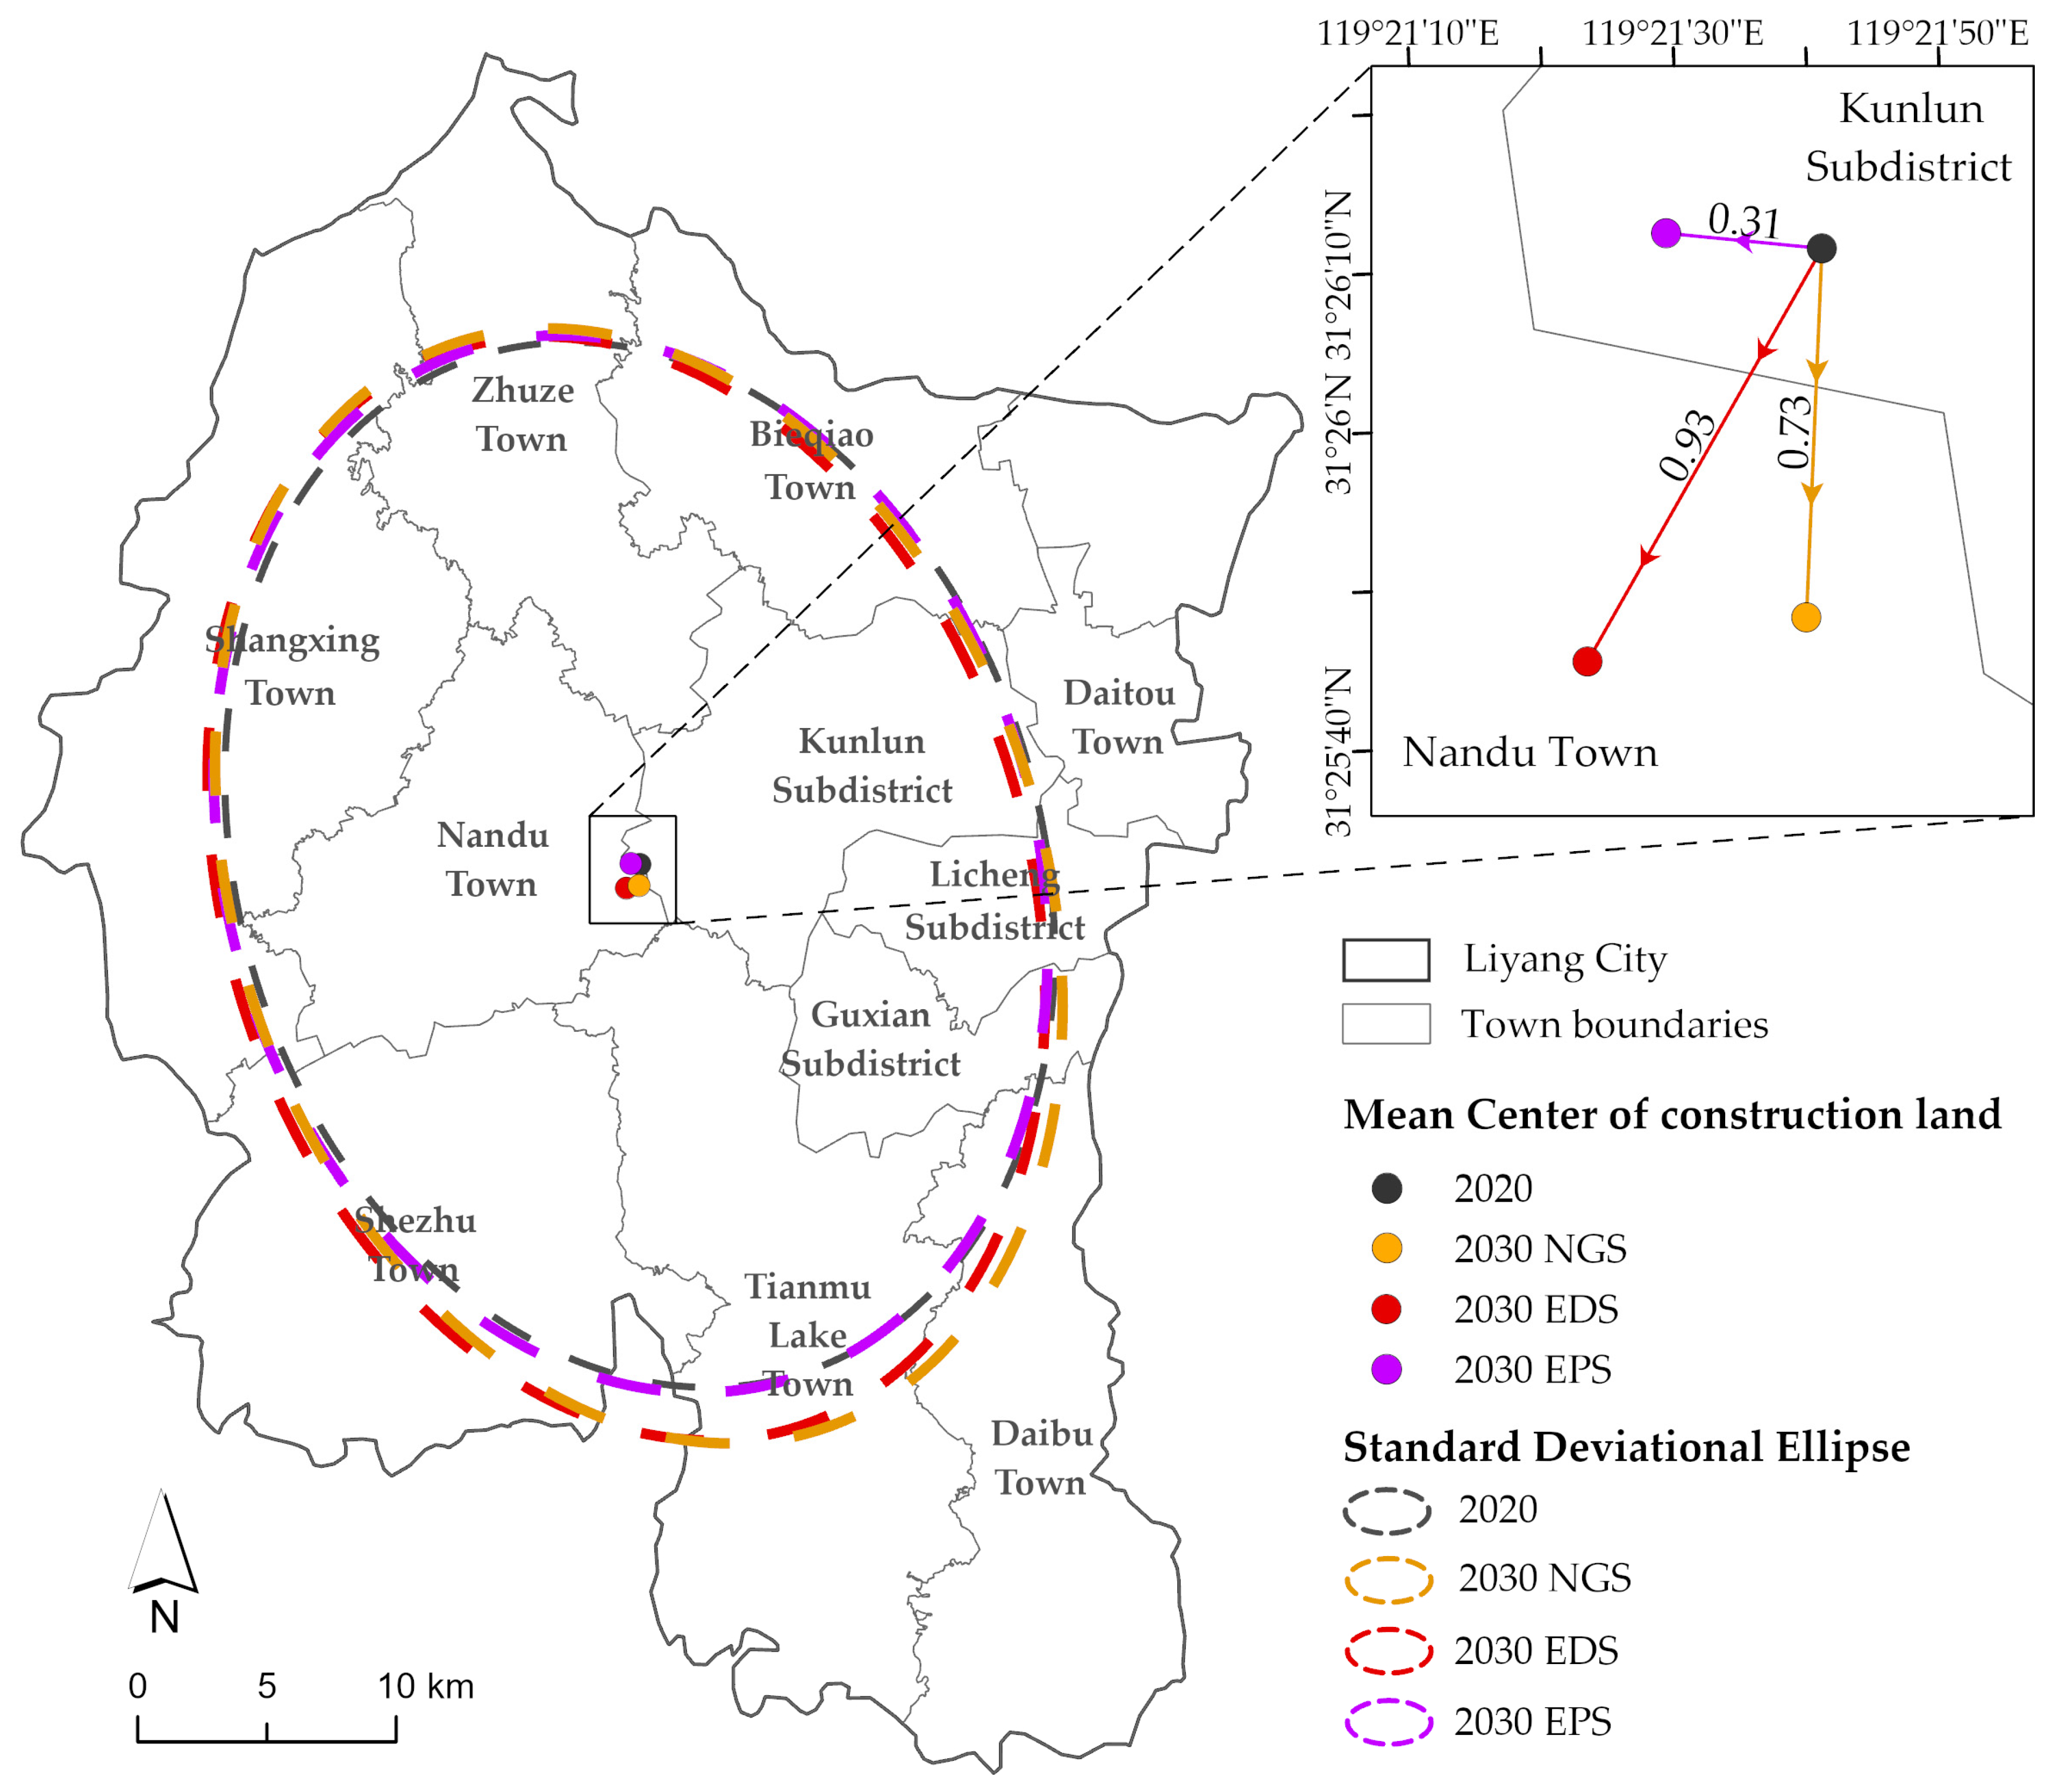
3.4. Comparison among the Three Scenarios
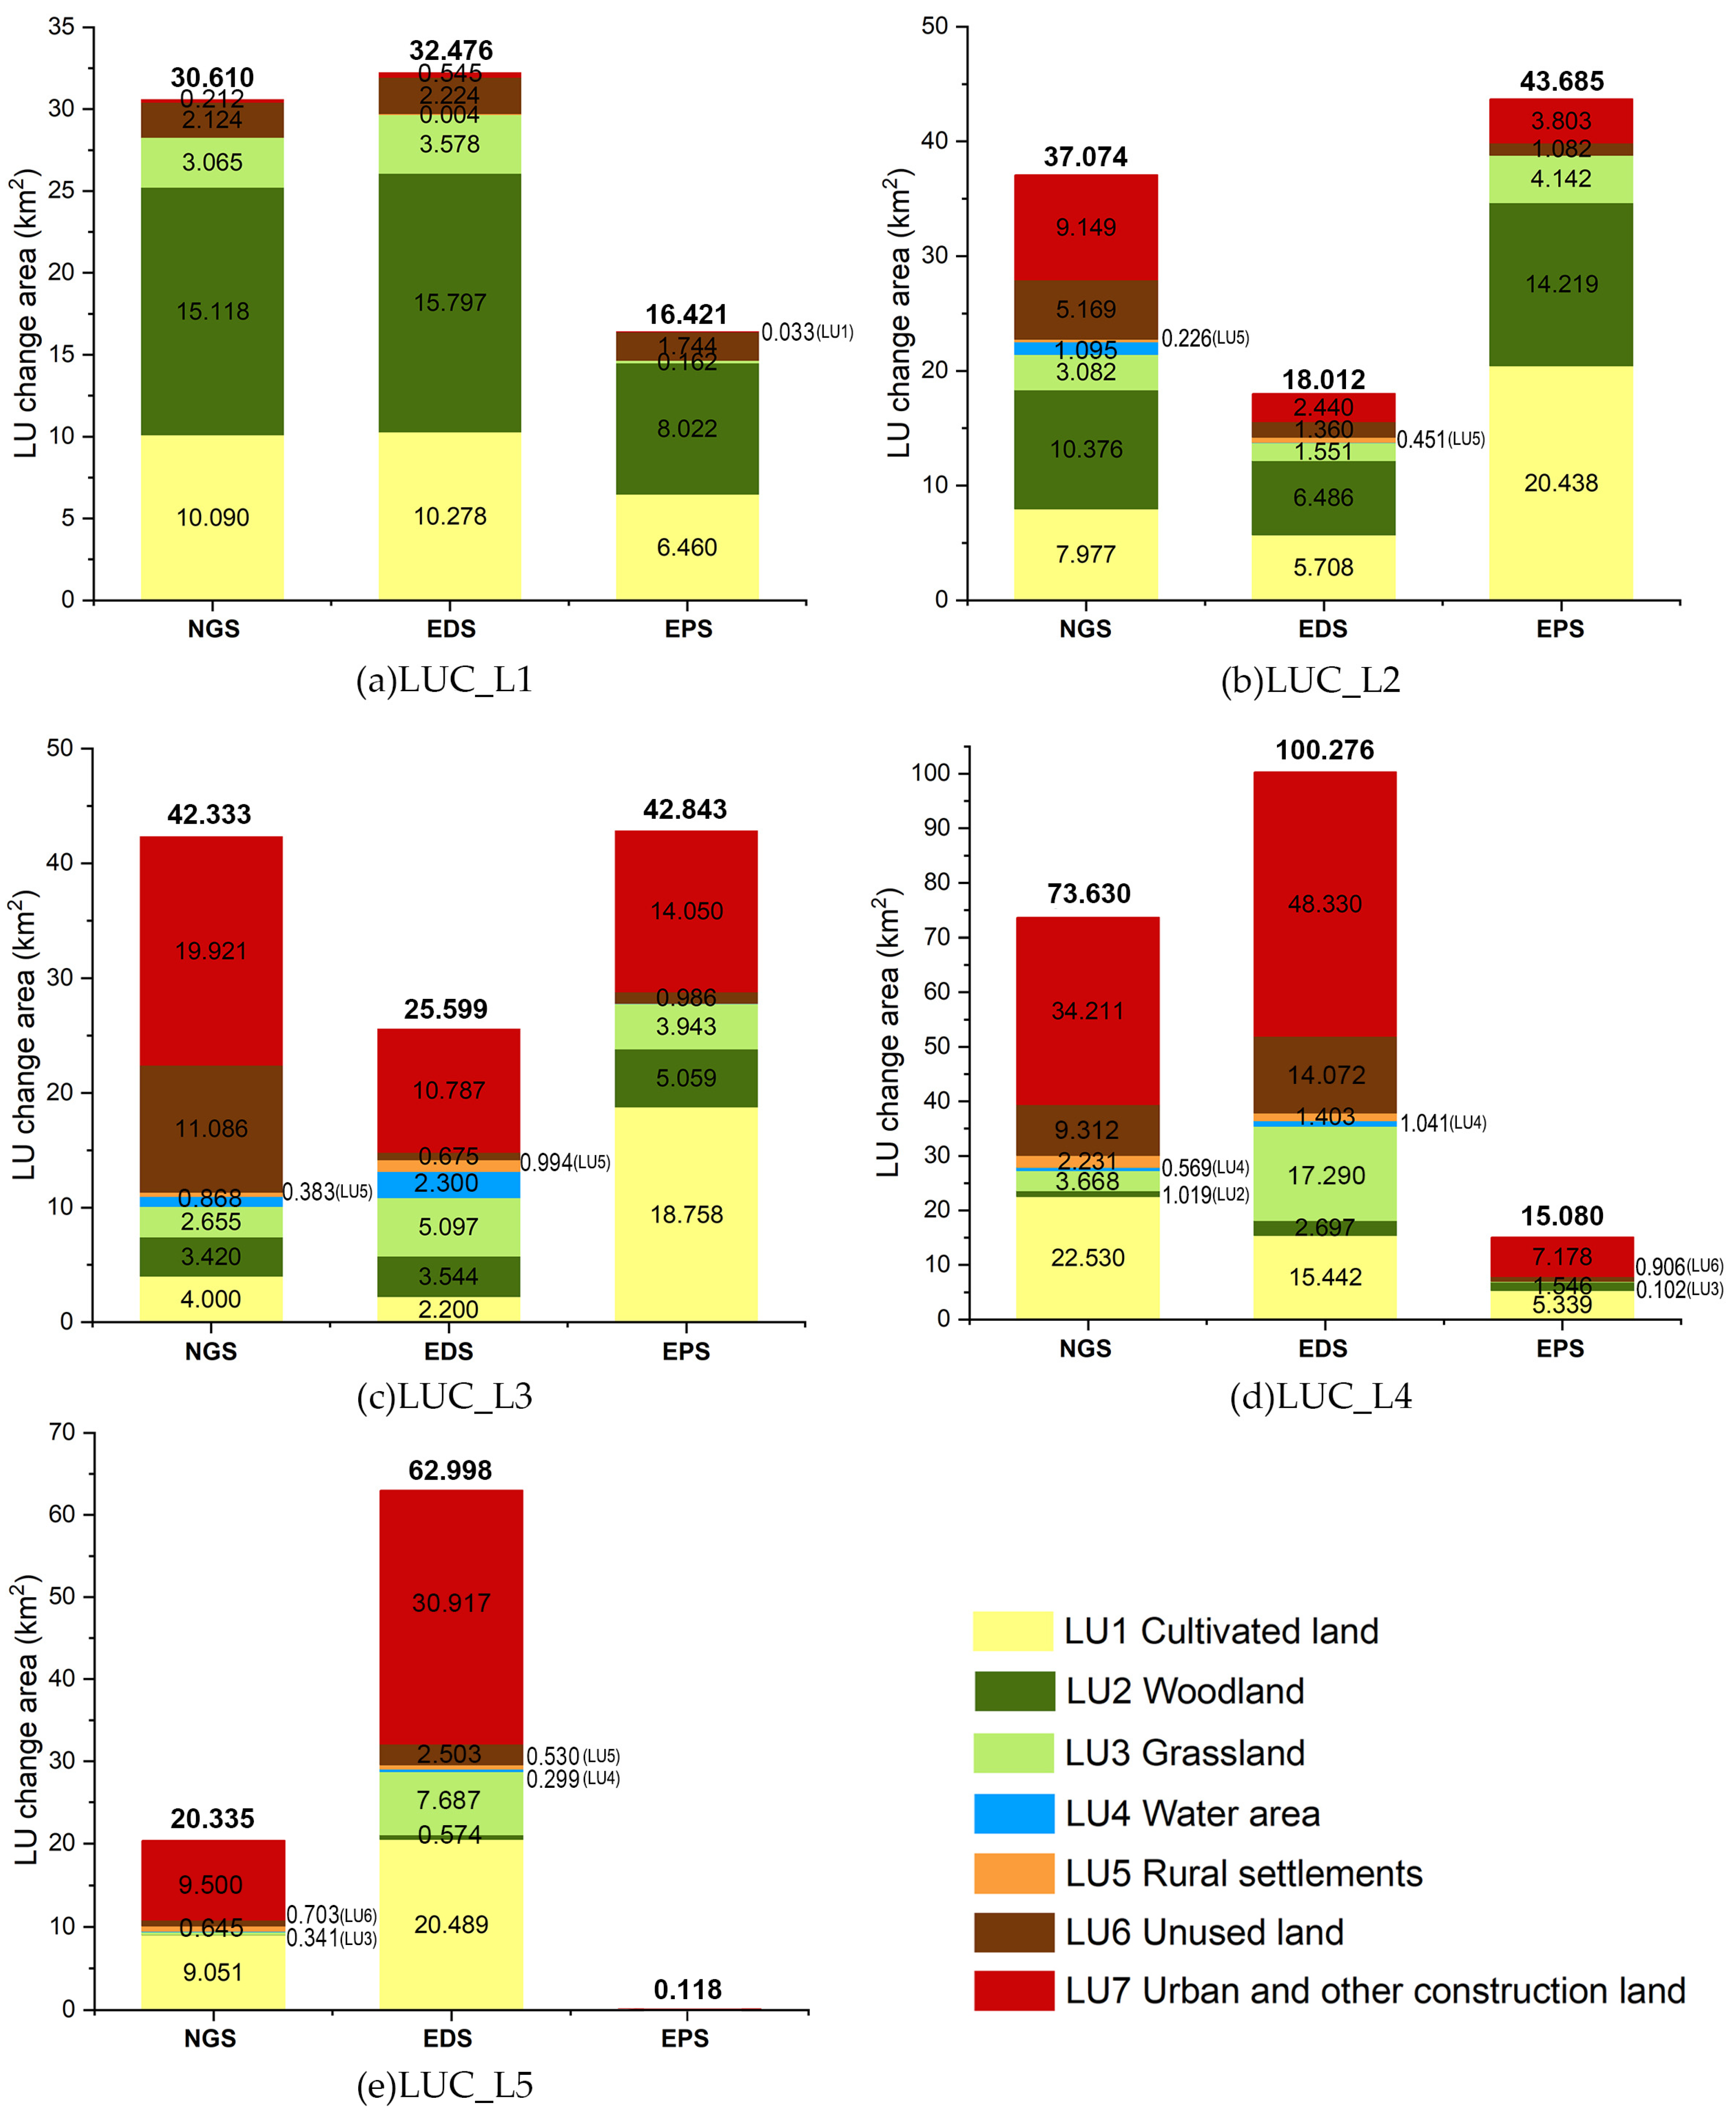
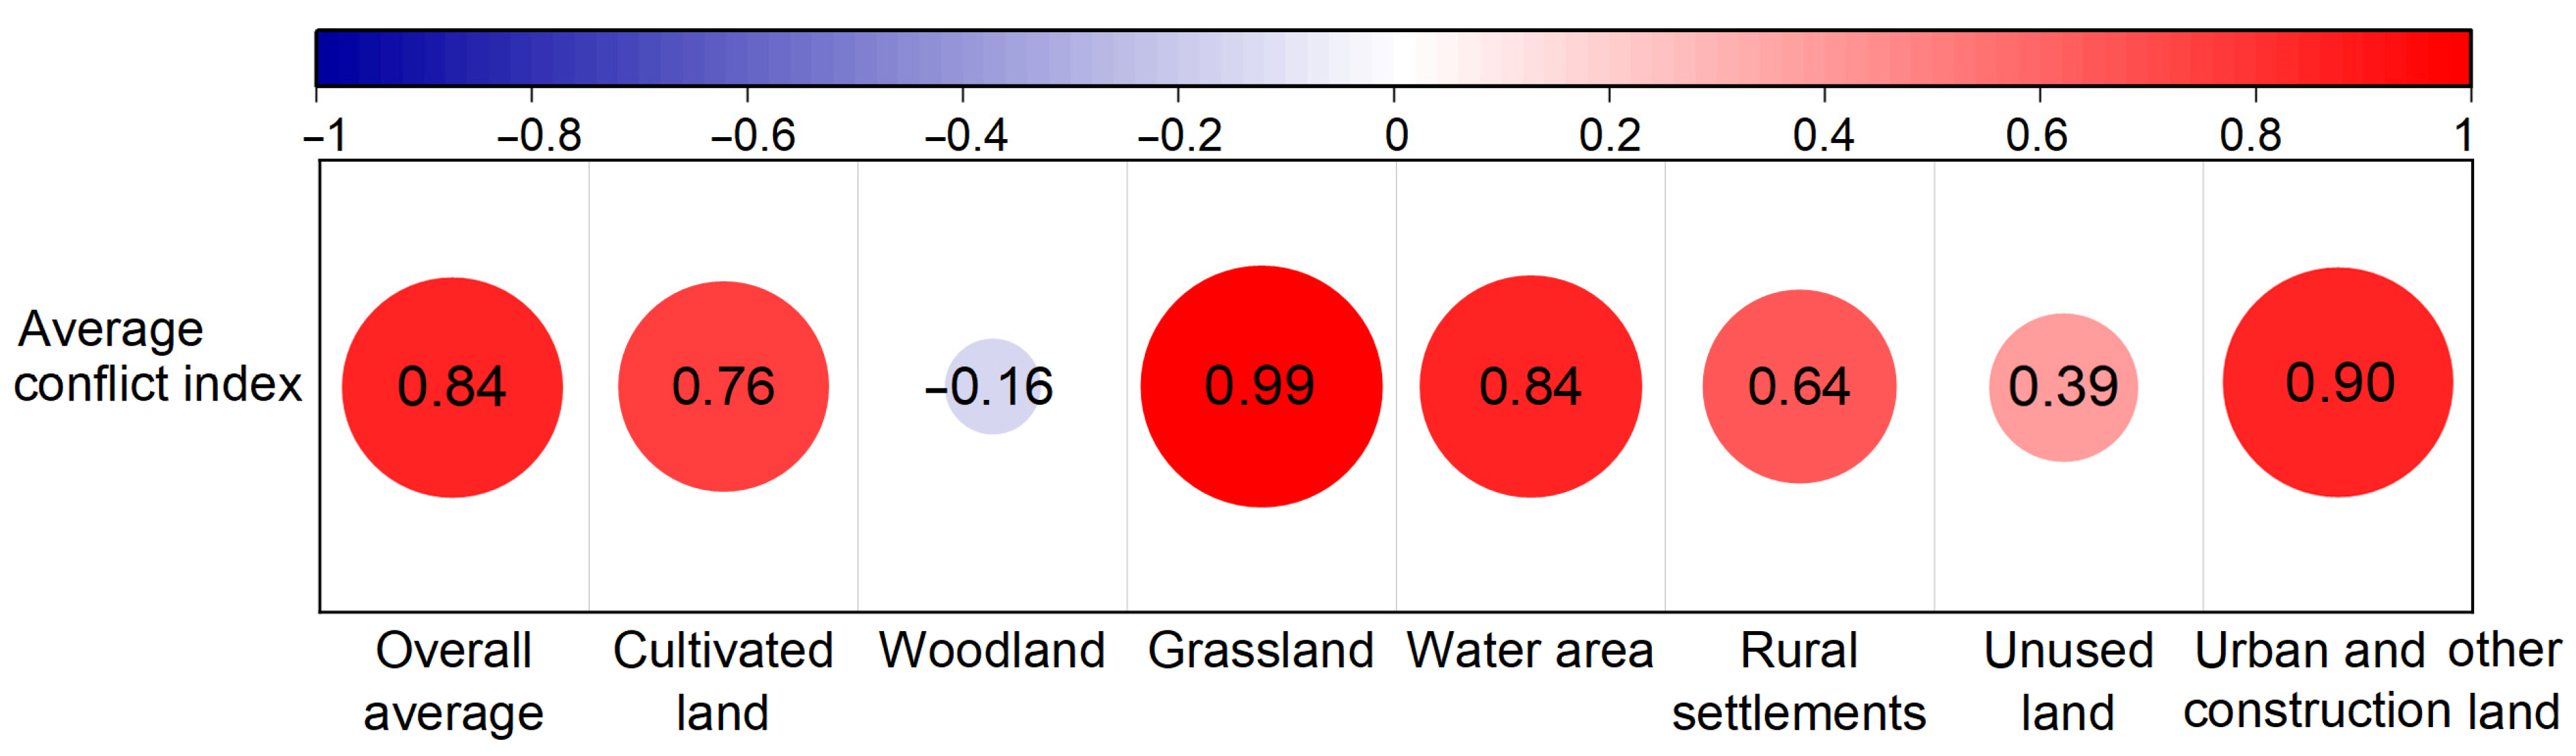
3.5. Relationship between Land Use Conflicts and Land Use Change
4. Discussion
4.1. Practical Implications for Land Use
4.2. Methodological Advantages
4.3. Limitations and Future Directions
5. Conclusions
Supplementary Materials
Author Contributions
Funding
Data Availability Statement
Acknowledgments
Conflicts of Interest
References
- Zuo, Q.; Zhou, Y.; Wang, L.; Li, Q.; Liu, J. Impacts of future land use changes on land use conflicts based on multiple scenarios in the central mountain region, China. Ecol. Indic. 2022, 137, 108743. [Google Scholar] [CrossRef]
- Fan, S.; Cheng, C.; Liu, Y.; Zhang, H.; Yu, R. Review and prospect on land use/cover research in China. Areal Res. Dev. 2017, 36, 94–101. [Google Scholar]
- Wang, Y.; Dai, Y.; Jia, C.; Tan, Y.; Sun, M.; Li, H. Spatiotemporal change analysis of land use/cover in Xuzhou from 2010 to 2020. Terr. Nat. Rec. Study 2023, 1, 35–39. [Google Scholar]
- Steo, K.C.; Guneralp, B.; Hutyra, L.R. Global forecasts of urban expansion to 2030 and direct impacts on biodiversity and carbon pools. Proc. Natl. Acad. Sci. USA 2012, 109, 16083–16088. [Google Scholar] [CrossRef] [PubMed]
- Bai, E.; Xue, B. A review of influences of land use and land cover change on ecosystems. Chin. J. Plant Ecol. 2022, 44, 543–552. [Google Scholar]
- United Nations. Agenda 21. Available online: https://sdgs.un.org/publications/agenda21 (accessed on 17 March 2023).
- Turner, B.L.; Skole, D.; Sanderson, S.; Fischer, G.; Fresco, L.; Leemans, R. Land use and land-cover change: Science/research plan. In Proceedings of the International Geosphere-Biosphere Program Secretariat, Stockholm, Sweden, 1 January 1995. [Google Scholar]
- Ojima, D.; Moran, E.; McConnell, W.; Smith, M.S.; Laumann, G.; Morais, J.; Young, B. Global Land Project: Science Plan and Implementation Strategy; IGBP Report No. 53/IHDP Report No. 19; IGBP Secretariat: Stockholm, Sweden, 2005. [Google Scholar]
- Global LAND Programme. Available online: https://glp.earth/ (accessed on 17 March 2023).
- Turner, B.L.; Lambin, E.F.; Reeberg, A. Land Change Science Special Feature: The emergence of land change science for global environmental change and sustainability. Proc. Natl. Acad. Sci. USA 2007, 104, 20666–20671. [Google Scholar] [CrossRef]
- Lambin, E.F.; Turner, B.L.; Geist, H.J.; Agbola, S.B.; Angelsen, A.; Bruce, J.W.; Coomes, O.T.; Dirzo, R.; Fischer, G.; Folke, C.; et al. The causes of land-use and land-cover change: Moving beyond the myths. Glob. Environ. Chang. 2001, 11, 261–269. [Google Scholar] [CrossRef]
- Wolff, S.; Schrammeijer, E.A.; Schulp, C.J.E.; Verburg, P.H. Meeting Global Land Restoration and Protection Targets: What Would the World Look Like in 2050. Glob. Environ. Chang. 2018, 52, 259–272. [Google Scholar] [CrossRef]
- Xie, Y.; Gao, P.; Ye, S.; Shen, S.; Zhang, X. Review and prospect of land change simulation model CLUMondo. Geomat. World 2022, 29, 7–12. [Google Scholar]
- Qiao, Z.; Jiang, Y.; He, T.; Lu, Y.; Xu, X.; Yang, J. Land use change simulation: Progress, challenges, and prospects. Acta Ecol. Sin. 2022, 42, 5165–5176. [Google Scholar]
- Ren, Y.; Lu, Y.; Comber, A.; Fu, B.; Harris, P.; Wu, L. Spatially explicit simulation of land use/land cover changes: Current coverage and future prospects. Earth-Sci. Rev. 2019, 190, 398–415. [Google Scholar] [CrossRef]
- Nie, X.; Lu, B.; Chen, Z.; Yang, Y.; Chen, S.; Chen, Z.; Wang, H. Increase or decrease? Integrating the CLUMondo and InVEST models to assess the impact of the implementation of the Major Function Oriented Zone planning on carbon storage. Ecol. Indic. 2020, 118, 106708. [Google Scholar] [CrossRef]
- Chang, Y. The Simulation and Trend Prediction of Sandy Land Change in Alxa Area Based on CLUMondo Model. Master’s Thesis, Lanzhou Jiaotong University, Lanzhou, China, 20 April 2021. [Google Scholar]
- Liu, X.; Zhang, Z.; Li, M.; Fu, Y.; Hui, Y. Spatial conflict simulation of land-use based on human-land-landscape elements intercoordination: A case study in Tianjin, China. Environ. Monit. Assess. 2022, 194, 317. [Google Scholar] [CrossRef]
- Hui, E.C.M.; Bao, H. The logic behind conflicts in land acquisitions in contemporary China: A framework based upon game theory. Land Use Policy 2013, 30, 373–380. [Google Scholar] [CrossRef]
- Zhang, J.; Chen, Y.; Zhu, C.; Huang, B.; Gan, M. Identification of Potential Land-Use Conflicts between Agricultural and Ecological Space in an Ecologically Fragile Area of Southeastern China. Land 2021, 10, 1011. [Google Scholar] [CrossRef]
- Kim, I.; Arnhold, S. Mapping environmental land use conflict potentials and ecosystem services in agricultural watersheds. Sci. Total Environ. 2018, 630, 827–838. [Google Scholar] [CrossRef]
- Kang, Z.; Wang, S.; Xu, L.; Yang, F.; Zhang, S. Suitability assessment of urban land use in Dalian, China using PNN and GIS. Nat. Hazards 2021, 106, 913–936. [Google Scholar] [CrossRef]
- Ioja, C.; Nita, M.; Vanau, G.O.; Onose, D.A.; Garvilidis, A.A. Using multi-criteria analysis for the identification of spatial land-use conflicts in the Bucharest Metropolitan Area. Ecol. Indic. 2014, 42, 112–121. [Google Scholar] [CrossRef]
- Brown, G.; Raymond, C.M. Methods for identifying land use conflict potential using participatory mapping. Landsc. Urban Plan. 2014, 122, 196–208. [Google Scholar] [CrossRef]
- Zhang, H.; Zeng, Y.; Jin, X.; Shu, B.; Zhou, Y.; Yang, X. Simulating multi-objective land use optimization allocation using multi-agent system—A case study in Changsha, China. Ecol. Modell. 2016, 320, 334–337. [Google Scholar] [CrossRef]
- Chen, Y.; Xie, B.; Zhong, D.; Wu, L.; Zhang, A. Predictive simulation of ecological space based on a particle swarm optimization-Markov composite model: A case study for Chang-Zhu-Tan urban agglomerations. Acta Ecol. Sin. 2018, 38, 55–64. [Google Scholar]
- Wang, T.; Cao, J.; Zhao, Y.; Han, L.; Liu, Z. Evaluation of land ecosystem health in Shaanxi Province, Northwest China based on PSR model. Chin. J. Appl. Ecol. 2021, 32, 1563–1572. [Google Scholar]
- Meng, B. Analysis and Optimization Strategy Territorial of Space Function in Yibin. Ph.D. Thesis, University of Chinese Academy of Sciences, Beijing, China, September 2020. [Google Scholar]
- Li, C.; Wu, J. Land use transformation and eco-environmental effects based on production-living-ecological spatial synergy: Evidence from Shaanxi Province, China. Environ. Sci. Pollut. Res. 2022, 29, 41492–41504. [Google Scholar] [CrossRef] [PubMed]
- Omrani, H.; Parmentier, B.; Helbich, M.; Pijanowski, B. The land transformation model-cluster framework: Applying k-means and the Spark computing environment for large scale land change analytics. Environ. Model. Softw. 2019, 111, 182–191. [Google Scholar] [CrossRef]
- Domingo, D.; Palka, G.; Hersperger, A.M. Effect of zoning plans on urban land-use change: A multi-scenario simulation for supporting sustainable urban growth. Sustain. Cities Soc. 2021, 69, 102833. [Google Scholar] [CrossRef]
- Bacau, S.; Domingo, D.; Palka, G.; Pellissier, L.; Kienast, F. Integrating strategic planning intentions into land-change simulations: Designing and assessing scenarios for Bucharest. Sustain. Cities Soc. 2021, 76, 103446. [Google Scholar] [CrossRef]
- Aburas, M.M.; Ho, Y.M.; Ramli, M.F.; Ash’aari, Z.H. The simulation and prediction of spatio-temporal urban growth trends using cellular automata models: A review. Int. J. Appl. Earth Obs. 2016, 52, 380–389. [Google Scholar] [CrossRef]
- Arunyawat, S.; Shrestha, R.P. Simulating future land use and ecosystem services in Northern Thailand. J. Land Use Sci. 2018, 13, 145–165. [Google Scholar] [CrossRef]
- Jin, G.; Deng, X.; Chu, X.; Wang, Y. Optimization of land-use management for ecosystem service improvement: A review. Phys. Chem. Earth 2017, 101, 70–77. [Google Scholar] [CrossRef]
- Steinhausser, R.; Siebert, R.; Steinfuhrer, A.; Hellmich, M. National and regional land-use conflicts in Germany from the perspective of stakeholders. Land Use Policy 2016, 49, 183–194. [Google Scholar] [CrossRef]
- Xie, Z.; Ma, Z.; Liu, J. Conflicts in Land Use in Marine Protected Areas: The Case of the Yellow River Delta, China. J. Coastal Res. 2014, 30, 1307–1314. [Google Scholar] [CrossRef]
- Song, J.; Meng, J.; Zhu, L.; Cheng, H. Spatial-temporal pattern of land use conflict in China and its multilevel driving mechanisms. Sci. Total Environ. 2021, 801, 149697. [Google Scholar]
- Torre, A.; Melot, R.; Magsi, H.; Bossuet, L.; Cadoret, A.; Caron, A.; Darly, S.; Jeanneaux, P.; Kirat, T.; Pham, H.V.; et al. Identifying and measuring land-use and proximity conflicts: Methods and identification. SpringerPlus 2014, 3, 85. [Google Scholar] [CrossRef] [PubMed]
- Cui, J.; Kong, X.; Chen, J.; Sun, J.; Zhu, Y. Spatially Explicit Evaluation and Driving Factor Identification of Land Use Conflict in Yangtze River Economic Belt. Land 2021, 10, 43. [Google Scholar] [CrossRef]
- Yu, L.; Cai, Y. Research on spatial regulation of land use planning and coordinated development of regional economy: An analytical framework. J. Nat. Resour. 2017, 32, 1445–1456. [Google Scholar]
- Zou, L.; Liu, Y.; Wang, Y. Research progress and prospect of land-use conflicts in China. Prog. Geogr. 2020, 39, 298–309. [Google Scholar] [CrossRef]
- Pontius, R.G.; Huang, J.; Jiang, W.; Khallaghi, S.; Lin, Y.; Liu, J.; Quan, B.; Ye, S. Rules to Write Mathematics to Clarify Metrics Such as the Land Use Dynamic Degrees. Landsc. Ecol. 2017, 32, 2249–2260. [Google Scholar] [CrossRef]
- Yang, K.; Wang, X.; Zhao, P.; Liu, X.; Zhang, Y. The Study of Driving Forces of Land Use Transformation in the Pearl River Delta during 1990 to 2010. In Proceedings of the 2nd International Workshop on Renewable Energy and Development, Guilin, China, 20 April 2018. [Google Scholar]
- Li, P.; Zuo, D.; Xu, Z.; Zhang, R.; Han, Y.; Sun, W.; Sun, W.; Pang, B.; Ban, C.; Kan, G.; et al. Dynamic changes of land use/cover and landscape pattern in a typical alpine river basin of the Qinghai-Tibet Plateau, China. Land Degrad. Dev. 2021, 32, 4327–4339. [Google Scholar] [CrossRef]
- Meng, J.; Jiang, S.; Laba, Z.; Zhang, W. The Spatial and Temporal Analysis of Land Use Conflict in the Middle Reaches of the Heihe River Based on Landscape Pattern. Chin. Geogr. Sci. 2020, 40, 1553–1562. [Google Scholar]
- Qiu, G.; Wang, Y.; Guo, S.; Niu, Q.; Qin, L.; Zhu, D.; Gong, Y. Assessment and Spatial-Temporal Evolution Analysis of Land Use Conflict within Urban Spatial Zoning: Case of the Su-Xi-Chang Region. Sustainability 2022, 14, 2286. [Google Scholar] [CrossRef]
- Xiao, P.; Xu, J.; Zhao, C. Conflict Identification and Zoning Optimization of “Production-Living-Ecological” Space. Int. J. Environ. Res. Public Health 2022, 19, 7990. [Google Scholar] [CrossRef] [PubMed]
- Chen, S.; Ai, D.; Fu, Y. Spatial conflict measurement and influencing factors based on ecological security. J. China Agric. Univ. 2020, 25, 141–150. [Google Scholar]
- Chen, Z.; Feng, X.; Hong, Z.; Li, Y. Calculation and analysis of spatial conflicts in land use of Nanchang city. Areal Res. Dev. 2020, 39, 150–155. [Google Scholar]
- Zhao, X.; Tang, F.; Zhang, P.; Hu, B.; Xu, L. Dynamic simulation and characteristic analysis of county production-living ecological spatial conflicts based on CLUE-S mode. Acta Ecol. Sin. 2019, 39, 5879–5908. [Google Scholar]
- Verburg, P. The CLUMondo Land Use Change Model: Manual and Exercises. Institute for Environmental Studies, Amsterdam, Netherlands. December 2015. Available online: https://www.environmentalgeography.nl/site/ (accessed on 17 March 2023).
- Yin, L.; Dai, E.; Xie, G.; Zhang, B. Effects of Land-Use Intensity and Land Management Policies on Evolution of Regional Land System: A Case Study in the Hengduan Mountain Region. Land 2021, 10, 5. [Google Scholar] [CrossRef]
- Rahman, M.T.U.; Tabassum, F.; Rasheduzzaman, M.; Saba, H.; Sarkar, L.; Ferdous, J.; Uddin, S.Z.; Islam, A.Z.M.Z. Temporal dynamics of land use/land cover change and its prediction using CA-ANN model for southwestern coastal Bangladesh. Environ. Monit. Assess. 2017, 189, 11. [Google Scholar] [CrossRef]
- Guo, R.; Lu, B.; Chen, K. Dynamic simulation of multi-scenario land use change based on CLU-Mondo model: A case study of coastal cities in Guangxi. Remot. Sens. Land Resour. 2020, 32, 176–183. [Google Scholar]
- Liyang Introduces the “14th Five-Year” Territorial Tourism Development Plan. Available online: http://www.liyang.gov.cn/index.php?c=phone&a=show&id=168037&catid=40409 (accessed on 4 April 2023).
- Notice of Liyang Government Office on Printing and Issuing the “Special Planning Work Plan for Liyang Master Plan (2016–2030)”. Available online: http://www.liyang.gov.cn/html/czly/2018/OPEHQFEM_0216/5690.html (accessed on 4 April 2023).
- Liyang Territorial Spatial Master Plan (2021–2035) (Draft) Public Notice. Available online: http://www.liyang.gov.cn//html/czly/2022/NDKMAMKM_1221/30553.html (accessed on 4 April 2023).
- Wang, C.; Yu, C.; Chen, T.; Feng, Z.; Hu, Y.; Wu, K. Can the establishment of ecological security patterns improve ecological protection? An example of Nanchang, China. Sci. Total Environ. 2020, 740, 140051. [Google Scholar] [CrossRef]
- Zhu, W.; Gao, Y.; Zhang, H.; Liu, L. Optimization of the land use pattern in Horqin Sandy Land by using the CLUMondo model and Bayesian belief network. Sci. Total Environ. 2020, 739, 139929. [Google Scholar] [CrossRef]
- Van Asselen, S.; Verburg, P.H. Land cover change or land-use intensification: Simulating land system change with a global-scale land change model. Glob. Chang. Biol. 2013, 32, 2249–2260. [Google Scholar] [CrossRef]
- Ornetsmuller, C.; Verburg, P.H.; Heinimann, A. Scenarios of land system change in the Lao PDR: Transitions in response to alternative demands on goods and services provided by the land. Appl. Geogr. 2016, 75, 1–11. [Google Scholar] [CrossRef]
- Malek, Z.; Verburg, P.H.; Geijzendorffer, I.R.; Bondeau, A.; Cramer, W. Global change effects on land management in the Mediterranean region. Global Environ. Chang. 2018, 50, 238–254. [Google Scholar] [CrossRef]
- Chen, C.I.; Huang, S.J. The necessary and sufficient condition for GM (1,1) grey prediction model. Appl. Math. Comput. 2013, 219, 6152–6162. [Google Scholar] [CrossRef]
- Fan, X.; Cheng, Y.; Tan, F.; Zhao, T. Construction and Optimization of the Ecological Security Pattern in Liyang, China. Land 2022, 11, 1641. [Google Scholar] [CrossRef]
- Monserud, R.A.; Leemans, R. Comparing global vegetation maps with the Kappa-statistic. Ecol. Model. 1992, 62, 275–293. [Google Scholar] [CrossRef]
- Liu, M.; Hu, Y.; Chang, Y.; He, H.; Bu, R. Analysis of temporal predicting abilities for the CLUE-S land use model. Acta Ecol. Sin. 2009, 29, 6110–6119. [Google Scholar]
- Li, W.; Zhu, C.; Wang, H.; Xu, B. Multi-scale spatial autocorrelation analysis of cultivated land quality in Zhejiang province. Trans. Chin. Soc. Agric. Eng. 2016, 32, 239–245. [Google Scholar]
- Cressie, N.; Kang, E.L. Hot enough for you? A spatial exploratory and inferential analysis of North American climate-change projections. Math. Geosci. 2016, 48, 107–121. [Google Scholar] [CrossRef]
- Liu, Y.; Li, Y.; Yi, X.; Cheng, X. Spatial evolution of land use intensity and landscape pattern response of the typical basins in Guizhou Province, China. Ying Yong Sheng Tai Xue Bao J. Appl. Ecol. 2017, 28, 3691–3702. [Google Scholar]
- Zhou, D.; Lin, Z.; Lim, S.H. Spatial characteristics and risk factor identification for land use spatial conflicts in a rapid urbanization region in China. Environ. Monit. Assess. 2019, 191, 677. [Google Scholar] [CrossRef]


| Category | Data | Unit | Year | Data Source |
|---|---|---|---|---|
| Land use | Remote-sensing images | - | 2010, 2020 | United States Geological Survey (USGS) |
| Land use maps | class | 2010, 2020 | Interpreted from remote-sensing images | |
| Topographic | DEM | m | 2010, 2020 | Geospatial Data Cloud |
| Slope | ° | 2010, 2020 | Extracted from DEM data | |
| Aspect | - | 2010, 2020 | ||
| Meteorological | Annual total precipitation | mm | 2010, 2020 | China Meteorological Data Service Centre |
| Annual average temperature | °C | 2010, 2020 | ||
| Soil | Soil water content | m3 | 2010, 2020 | National Tibetan Plateau Data Center |
| Soil salinity | % | 2010, 2020 | World Soil Information (ISRIC) | |
| Position | Distance to major rivers | km | 2010, 2020 | OpenStreetMap |
| Distance to main traffic | km | 2010, 2020 | ||
| Distance to township centers | km | 2010, 2020 | ||
| Socio-economic | Population density | people/km2 | 2010, 2020 | Statistical Yearbook of Liyang City |
| Per capita GDP | 104 yuan | 2010, 2020 | ||
| Fixed assets investment | 108 yuan | 2010, 2020 | ||
| Nighttime light | - | 2010, 2020 | National Tibetan Plateau Data Center |
| Conflict Level | Conflict Index Range | Area Ratio (%) | |||
|---|---|---|---|---|---|
| 2020 | 2030 | ||||
| NGS | EDS | EPS | |||
| Lower | 0–0.2 | 10.61 | 11.00 | 11.82 | 10.30 |
| Low | 0.2–0.4 | 19.59 | 16.90 | 16.30 | 19.19 |
| Moderate | 0.4–0.6 | 33.33 | 34.27 | 29.39 | 33.22 |
| High | 0.6–0.8 | 34.30 | 34.69 | 35.63 | 34.78 |
| Higher | 0.8–1 | 2.16 | 3.15 | 6.86 | 2.52 |
| Average conflict index | 0.492 | 0.500 | 0.508 | 0.498 | |
| Spatial Autocorrelation | 2020 | 2030 | ||
|---|---|---|---|---|
| NGS | EDS | EPS | ||
| Moran’s I | 0.76 | 0.874 | 0.884 | 0.866 |
| z-score | 466.102 | 536.148 | 541.98 | 531.312 |
| p-value | 0.000 | 0.000 | 0.000 | 0.000 |
| Scenarios | Comprehensive Dynamic Degree | |||||||
|---|---|---|---|---|---|---|---|---|
| Overall Average | Cultivated Land | Woodland | Grassland | Water Area | Rural Settlements | Unused Land | Urban and Other Construction Land | |
| NGS | 1.329 | 0.598 | 1.297 | 1.446 | 0.300 | 0.379 | 8.386 | 6.864 |
| EDS | 1.559 | 0.603 | 1.256 | 3.974 | 0.425 | 0.373 | 6.154 | 8.748 |
| EPS | 0.770 | 0.569 | 1.246 | 0.943 | 0.002 | 0.005 | 1.393 | 2.359 |
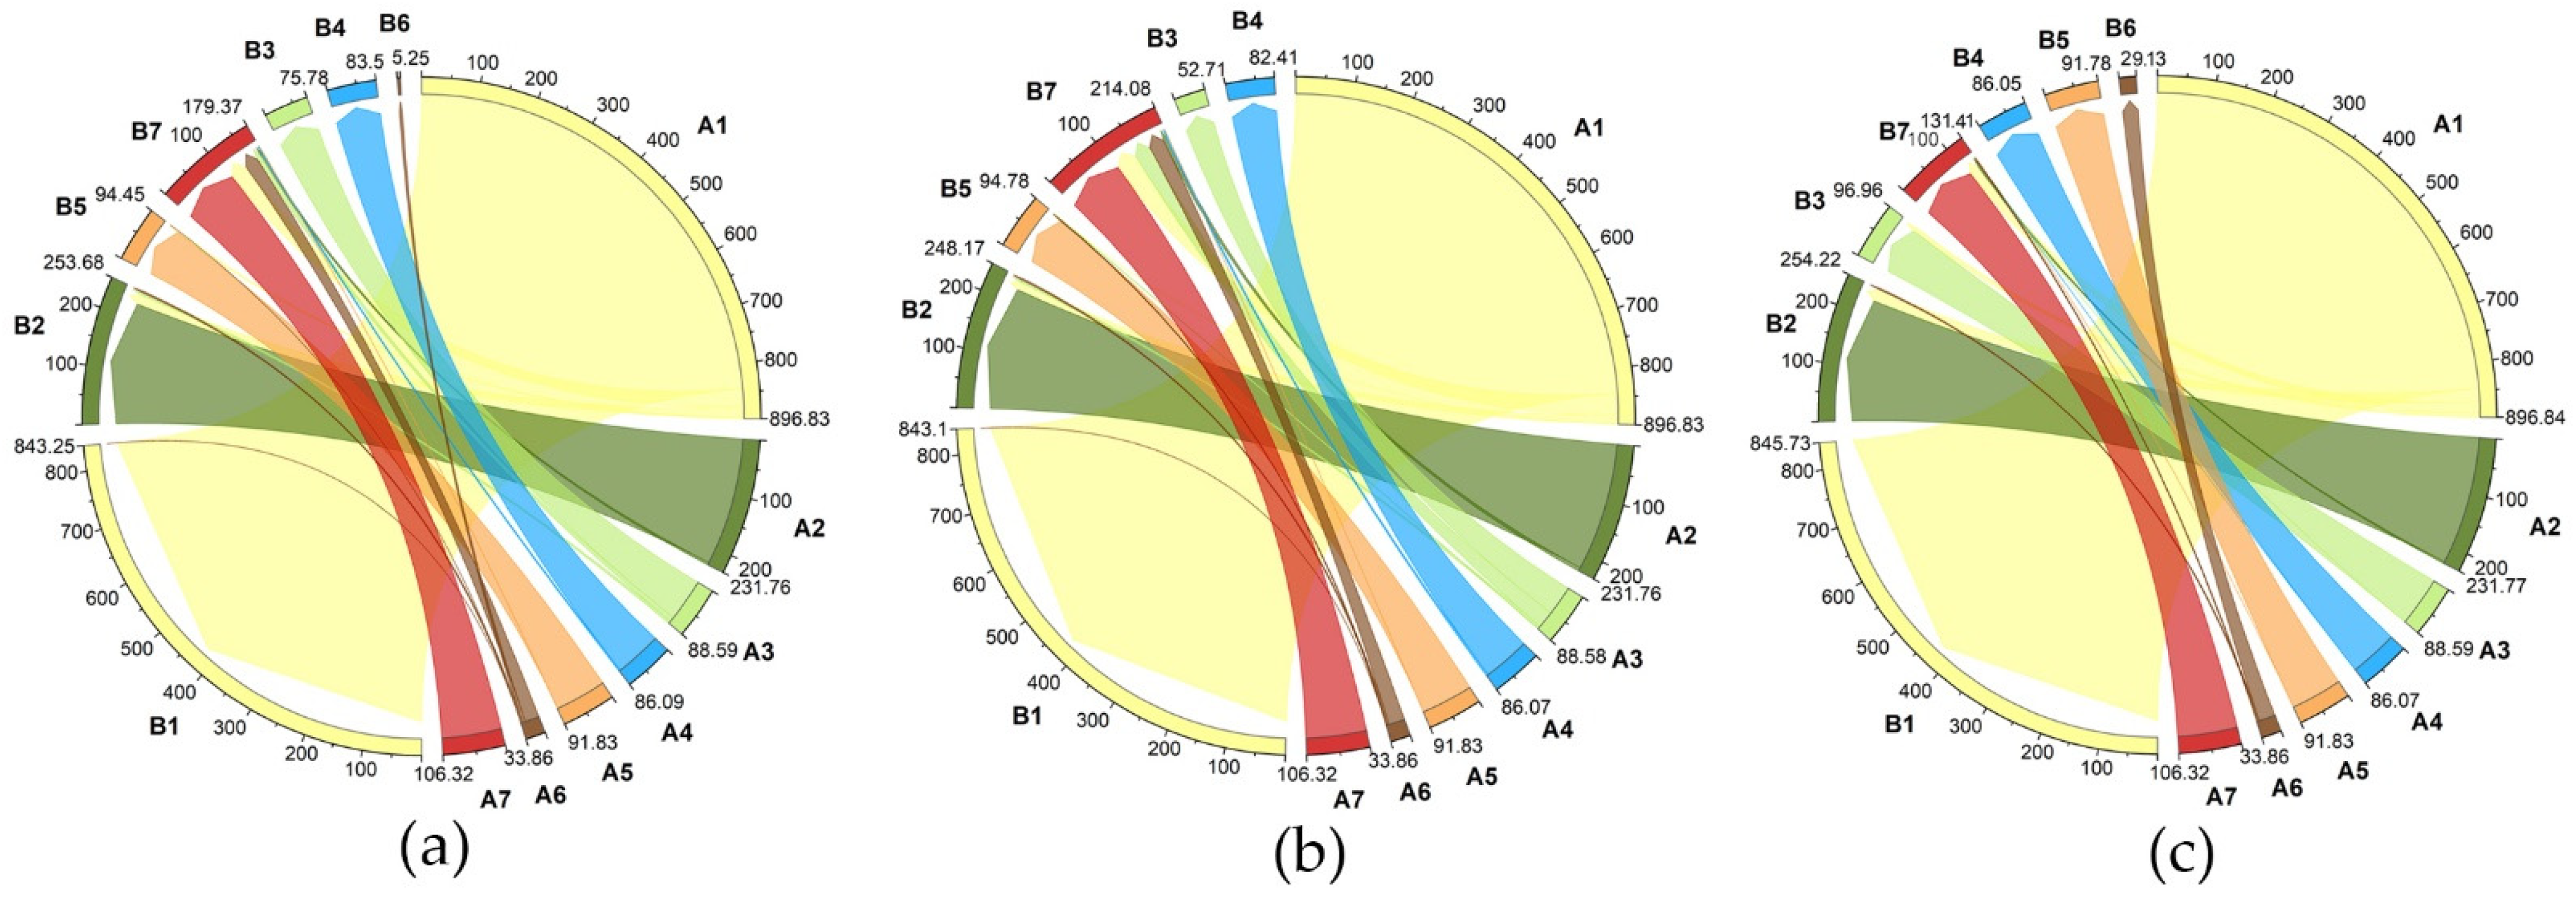
| Year | Scenario | X Distance (km) | Y Distance (km) | Rotation (°) | Ellipticity | Area (km2) | Central Deviation Distance (km) |
|---|---|---|---|---|---|---|---|
| 2020 | 13.78 | 18.36 | 156.27 | 0.249 | 794.85 | ||
| 2030 | NGS | 13.85 | 19.72 | 155.09 | 0.300 | 857.71 | 0.31 |
| EDS | 13.79 | 19.45 | 156.30 | 0.291 | 842.41 | 0.93 | |
| EPS | 13.88 | 18.55 | 157.00 | 0.251 | 808.73 | 0.73 |
| Land-Use Conflict Level | NGS | EDS | EPS | ||||
|---|---|---|---|---|---|---|---|
| LU Conversion Area (km2) | Ratio (%) | LU Conversion Area (km2) | Ratio (%) | LU Conversion Area (km2) | Ratio (%) | ||
| L1 | Lower | 30.61 | 15.01 | 32.48 | 13.57 | 16.42 | 13.90 |
| L2 | Low | 37.07 | 18.17 | 18.01 | 7.52 | 43.68 | 36.97 |
| L3 | Moderate | 42.33 | 20.75 | 25.60 | 10.70 | 42.84 | 36.26 |
| L4 | High | 73.63 | 36.10 | 100.27 | 41.89 | 15.08 | 12.77 |
| L5 | Higher | 20.34 | 9.97 | 63.00 | 26.32 | 0.12 | 0.10 |
| SUM | 203.98 | 100 | 239.36 | 100 | 118.14 | 100 | |
Disclaimer/Publisher’s Note: The statements, opinions and data contained in all publications are solely those of the individual author(s) and contributor(s) and not of MDPI and/or the editor(s). MDPI and/or the editor(s) disclaim responsibility for any injury to people or property resulting from any ideas, methods, instructions or products referred to in the content. |
© 2023 by the authors. Licensee MDPI, Basel, Switzerland. This article is an open access article distributed under the terms and conditions of the Creative Commons Attribution (CC BY) license (https://creativecommons.org/licenses/by/4.0/).
Share and Cite
Fan, X.; Cheng, Y.; Li, Y. Multi-Scenario Land Use Simulation and Land Use Conflict Assessment Based on the CLUMondo Model: A Case Study of Liyang, China. Land 2023, 12, 917. https://doi.org/10.3390/land12040917
Fan X, Cheng Y, Li Y. Multi-Scenario Land Use Simulation and Land Use Conflict Assessment Based on the CLUMondo Model: A Case Study of Liyang, China. Land. 2023; 12(4):917. https://doi.org/10.3390/land12040917
Chicago/Turabian StyleFan, Xiangnan, Yuning Cheng, and Yicheng Li. 2023. "Multi-Scenario Land Use Simulation and Land Use Conflict Assessment Based on the CLUMondo Model: A Case Study of Liyang, China" Land 12, no. 4: 917. https://doi.org/10.3390/land12040917