Article

Leading or Constraining? Development of New-Type Urbanization under Economic Growth Targets

School of Economics, Minzu University of China, Beijing 100081, China
*
Author to whom correspondence should be addressed.
Land 2023, 12(4), 916; https://doi.org/10.3390/land12040916
Submission received: 14 March 2023 / Revised: 12 April 2023 / Accepted: 18 April 2023 / Published: 19 April 2023
(This article belongs to the Special Issue Urban Regeneration and Local Development)

Abstract

:
As an overarching goal, economic growth targets have a strong leading and constraining effect on the behavior of local governments. China’s new-type urbanization strategy emphasizes balanced development across population, economic, social, space, ecological and income-gap dimensions and relies on multifaceted government policies. Therefore, setting reasonable economic growth targets has an important impact on the process of new-type urbanization. This paper uses panel data from 30 provinces between 2005 and 2020 to empirically examine the impact of economic growth targets on the new-type urbanization process. The results reveal an inverted U-shaped relationship between economic growth targets and new-type urbanization, with public expenditure and land finance acting as a mediator and a moderator through fiscal expenditure. The mechanisms of influence are as follows: economic growth target—infrastructure construction, regional innovation, energy structure, and financial development—population development, economic quality, ecological civilization, and income gap—new-type urbanization. Heterogeneity analysis shows that the inverted U-shaped relationship is significantly present in the western and central regions of China and before 2014. This paper not only clearly illustrates the institutional mechanism of urbanization in China but also highlights its government-led and “land-for-security” approach, which has important implications for urbanization in other regions of the world.

1. Introduction

Urbanization and regional economic development are mutually reinforcing [1,2] and represent a necessary path for developing countries. As the world’s largest developing country, China has achieved remarkable progress in promoting urbanization. Since the implementation of the reform and opening-up policy, China’s urbanization rate has rapidly increased. China took only 15 years to achieve a leap in its urbanization rate from 30% to 50%, which is much shorter than the time required for developed countries to achieve the same degree of growth, such as 40 years in the United States and 20 years in Japan [3]. The enormous labor force and consumer potential released by urbanization have also supported the country’s high-speed economic growth.
The success of China’s urbanization is largely attributed to the top-down urbanization model driven by the government [4]. In contrast to the market-driven approach adopted in Europe and the United States, Chinese local governments have employed various means to concentrate economic resources and guide rural-to-urban migration, such as establishing development zones and building infrastructure. This unique approach not only has allowed China to avoid the development trap that has plagued many African countries [5] but also has provided valuable experience for underdeveloped countries and regions in Africa, Asia, and South America in terms of promoting urbanization and regional economic development.
Despite these positive results, the government-led urbanization model has also resulted in numerous problems, including low energy efficiency [6], environmental pollution [7,8], urban sprawl [9], inadequate public services [10], and non-inclusive economic growth [3]. Addressing these issues and transitioning from a focus on “high speed” to “high quality” development is crucial both for China and for other countries and regions worldwide. By learning from China’s successes and challenges in its urbanization process, other developing countries can strive for more inclusive, sustainable, and healthy urban development.
Starting from March 2014, the Chinese government implemented the “National New-Type Urbanization Plan (2014–2020)”, which proposed the concept of “new-type urbanization.” This approach emphasizes the coordinated development of the population, economy, society, and ecology with a focus on people, emphasizing livelihoods, quality, and sustainability. This marks a shift in China’s urbanization from the traditional path of land expansion and population migration to a new practice that is people-oriented, resource-intensive, and scientifically planned and that seeks to achieve coordinated urban–rural development [11]. Furthermore, aiming toward the goal of “basically achieving socialist modernization by 2030”, China’s “14th Five-Year Plan for National Economic and Social Development and the Long-Range Objectives Through the Year 2035” also explicitly states that from 2021 to 2030, China will continue to deepen the implementation of new urbanization and promote high-quality urban development.
Promoting new-type urbanization has emerged as a key focus in regional and urban economic research. Scholars have conducted empirical studies on the factors that influence the level of new-type urbanization development from a variety of perspectives, including industry [12], investment [13,14], technology [15,16], and political incentives, such as fiscal decentralization [17,18]. However, compared with traditional urbanization, new-type urbanization requires a more balanced consideration of multiple dimensions, including the population, economy, society, and ecology. This means that there is a competitive relationship among different aspects when allocating resources. For example, economic indicators may take priority over social and ecological indicators in the short term. In China’s top-down government-led urbanization model, this relationship may be magnified or coordinated by different preferences of local governments. To clarify this relationship, the decision-making mechanisms of local governments and the performance of new-type urbanization should be incorporated into a unified analytical framework.
As is well known, China has a hierarchical management system in which superior governments largely determine the appointment, dismissal, and promotion of subordinate officials. Empirical studies have shown that there may be multiple dimensions to assessing performance standards. Among them, GDP growth rate, which is easy to quantify, serves as the main indicator for assessing officials’ performance [19]. It serves not only as a standard for superior government to evaluate local performance, but also as a “capability signal” that local officials send to their superiors. The setting of the annual GDP growth rate target in the government’s work report has been a key factor driving and influencing China’s economic development since the reform and opening-up policy. In principle, governments at all levels determine economic growth targets based on historical GDP data, empirical trend extrapolation, macroeconomic forecasting, or estimates of potential growth rates. However, in reality, local governments often “add weight” to the target based on superior government goals when setting economic growth targets, motivated by the desire to demonstrate their performance and achieve promotion [
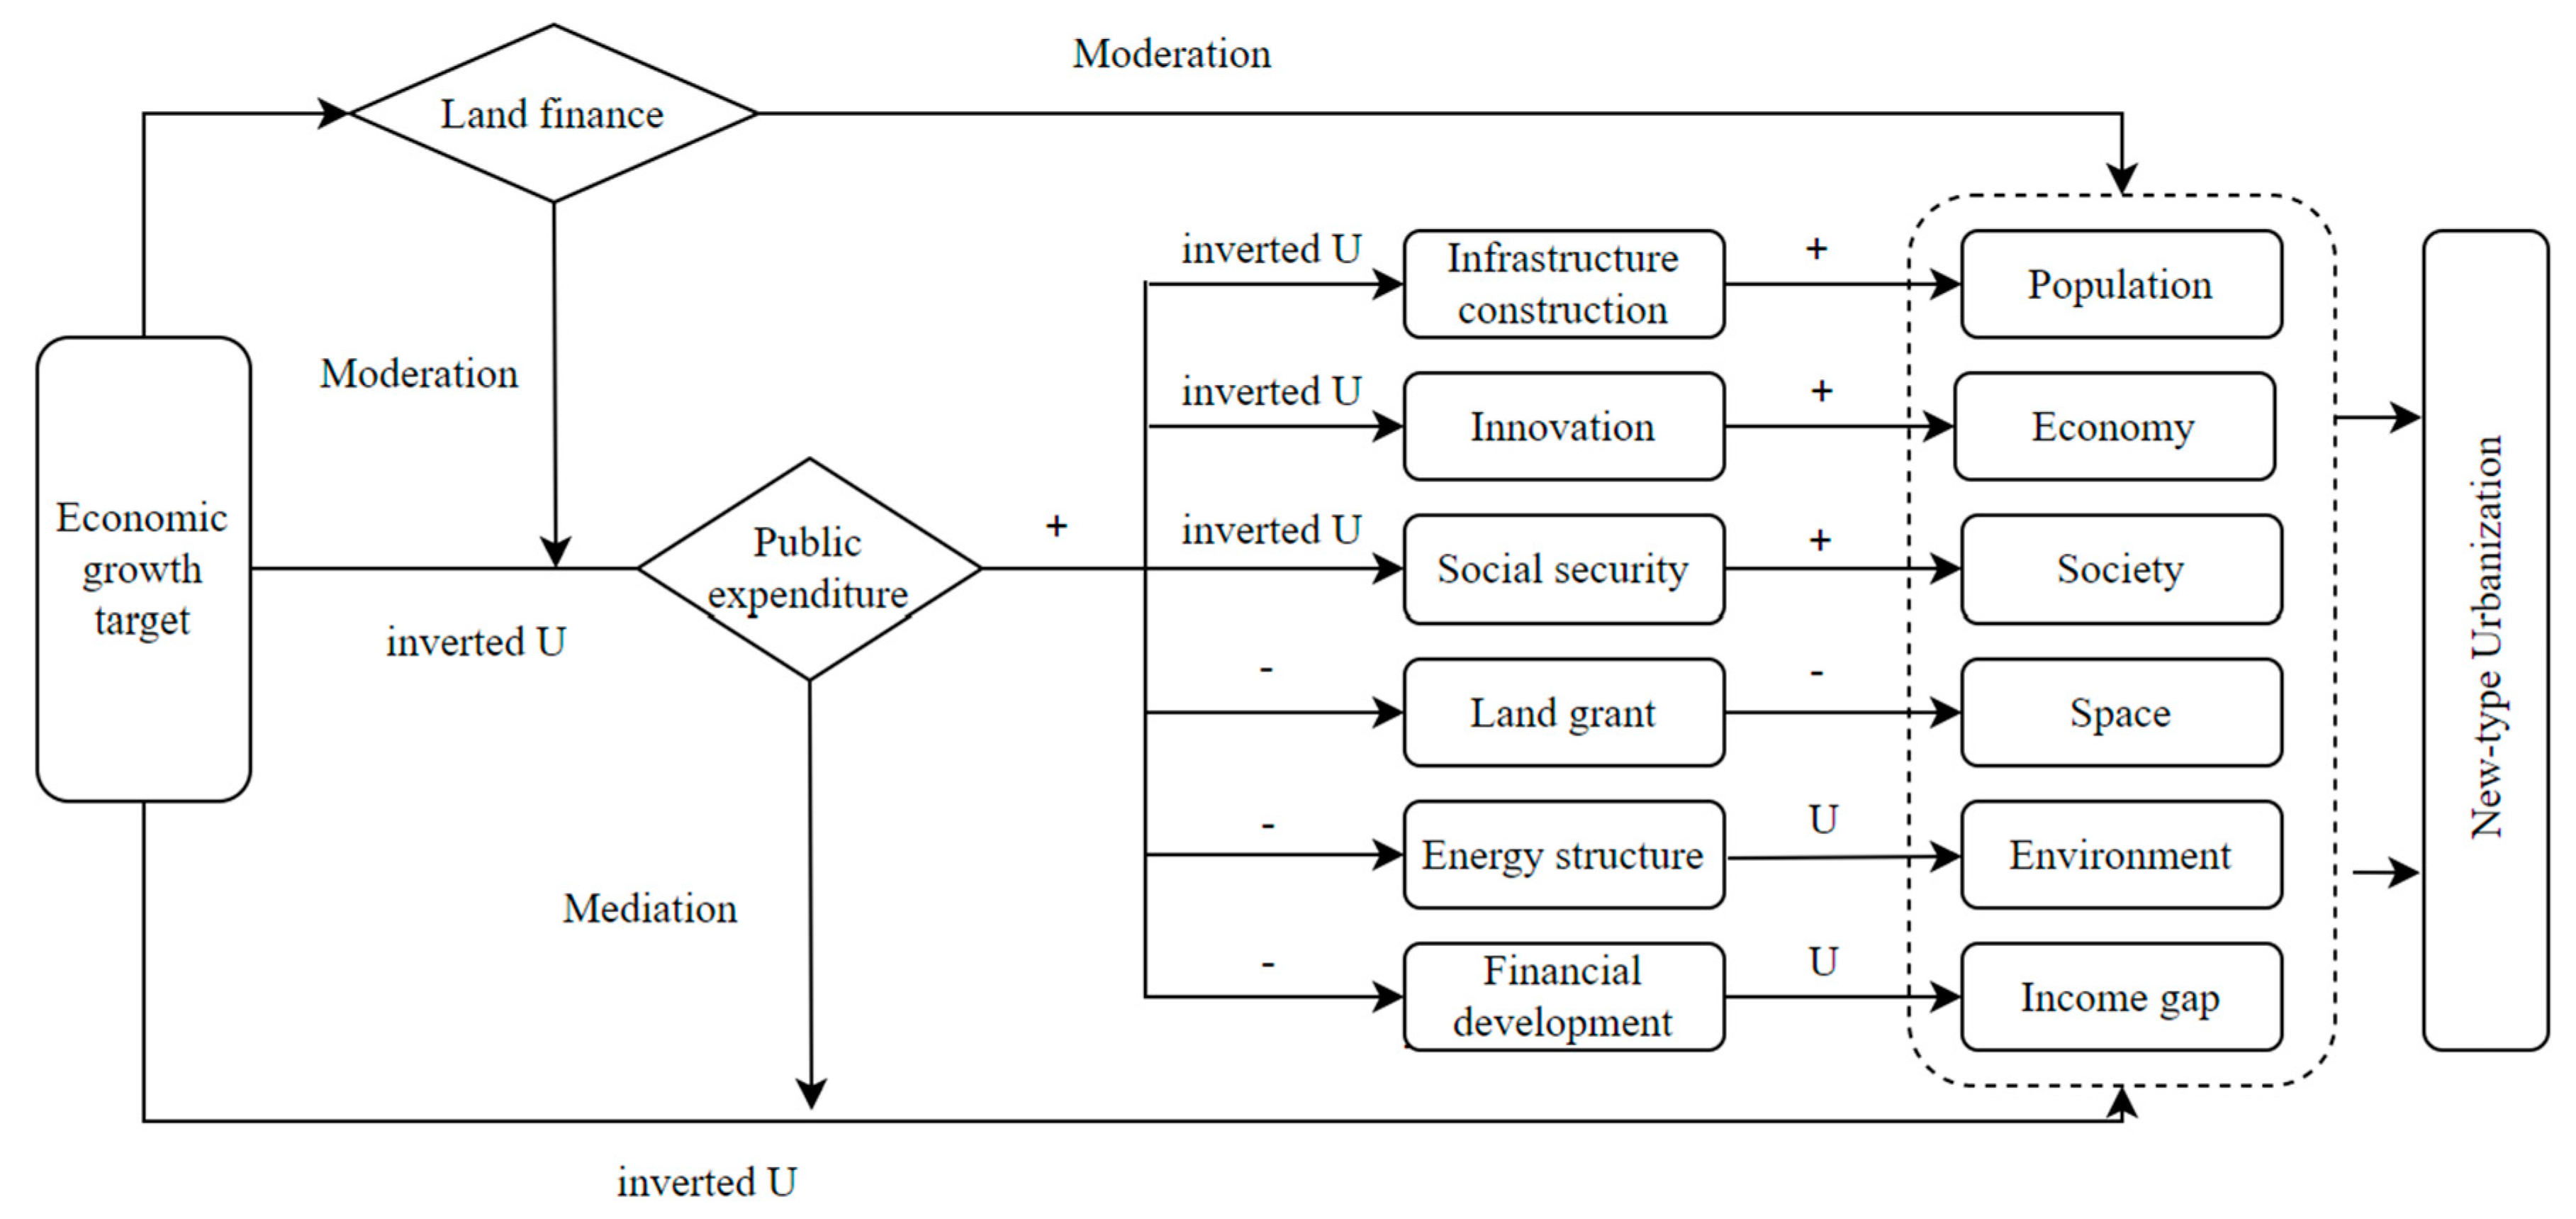
20]. When the target deviates from the actual endowments of the region, local governments will face great pressure in promoting economic growth and will inevitably invest more resources. This will lead to a significant reduction in resource allocation in areas such as ecological protection and people’s livelihood construction that conflict with economic growth, causing imbalanced resource allocation. This not only damages the quality of economic development, but also ignores investment in people’s livelihoods, distorts government public financial expenditures, and thus affects the level of new-type urbanization.
Within the mechanism through which the setting of economic growth targets affects the development level of new urbanization, land transfer plays a critical regulatory role. On the one hand, land transfers represent a significant source of fiscal revenue for local governments, which can contribute to improving their investment in infrastructure construction and advancing urbanization. On the other hand, extensive land expansion can also result in urban sprawl, serious resource mismatch, and environmental pollution, thereby compromising the quality of urbanization [21]. From the perspective of fiscal expenditure, exploring the effectiveness of land transfer can help clarify the mechanisms through which typical local government behaviors influence the relationship between economic growth and new urbanization.
This paper thus constructs a development indicator system for new-type urbanization from six aspects: population development, the quality of the economy, society’s quality of life, space intensification, environmental protection, and urban–rural integration. Using panel data from 30 provinces in China from 2005 to 2020, the study explores the impact of economic growth targets on the level of new-type urbanization in different regions and analyzes the pathways through which economic growth targets affect new-type urbanization in each of the six dimensions.
The possible contributions of this paper are as follows: first, it proposes a unified research framework for exploring the nonlinear relationship between economic growth targets and the level of new urbanization development, which expands the research perspective on the institutional aspect of new urbanization construction. Second, it regards public expenditure as a key bridge for the interaction between the two and introduces local land finance as a moderating variable to explore the mechanism of the effect of economic growth targets and new urbanization from the perspective of fiscal expenditure. Third, to further investigate the mechanism of the effect of economic growth targets and new urbanization, this paper explores the relationship between the six dimensions of new urbanization and economic growth targets and systematically analyzes the influencing mechanisms, refining the research on the way of promoting urbanization from the government intervention perspective. This not only expands our understanding of China’s institutional mechanisms but also provides theoretical recommendations for promoting the productive and livable urbanization process in other countries around the globe from the perspectives of target management and public expenditure.
The rest of this paper is structured as follows: Section 2 provides a literature review and theoretical framework. Section 3 presents the econometric model and data description. Section 4 discusses the empirical results and analysis. Section 5 concludes with policy recommendations.

2. Literature Review and Hypothesis

2.1. Literature Review

Unlike traditional urbanization that focuses on population and land, the new-type urbanization is a new path that achieves high-quality economic development and promotes common prosperity, reflecting the quality aspect of urbanization. Given that the urbanization process in China is government-led and the behavior of local governments is constrained by central institutional incentives, local government incentives may affect the urbanization process by changing and constraining government behavior. In the literature on local government incentives and new-type urbanization, scholars have almost exclusively explored the impact mechanism from the perspective of fiscal decentralization. Therefore, this paper briefly reviews the research on the impact of fiscal decentralization on new-type urbanization because the impact mechanism has important implications for exploring the relationship between economic growth targets and new-type urbanization.
The relationship between fiscal decentralization and the development level of new urbanization is closely related, but there is no consensus in the academic community on how the two interact. Some scholars consider that fiscal decentralization has a significant promoting effect on new urbanization and that its mechanism is influenced by the government’s resource control situation [17] and fiscal pressure [18]. Yang and Qiu (2019) found that the degree of fiscal decentralization and the level of new urbanization have an inverted U-shaped relationship and studied its mechanism [22]. Ding (2020) posited that the impact of fiscal decentralization on new urbanization is uncertain. Increasing the level of fiscal decentralization is important for urban infrastructure construction, but it has a negative impact on improving the supply of public services [23].
Although Qian and Weingast (1997) attributed China’s strong government incentives to fiscal decentralization [24], Zhou (2007) argued that the pursuit of economic growth is the most fundamental and long-term source of incentives for local governments [25]. This is reflected in the clear annual economic growth targets set by higher-level governments, which both constrain and stimulate the subjective initiatives of lower-level governments, emphasizing economic construction at all levels of government. Furthermore, peer governments refer to and compete with each other in setting economic growth targets, leading to a “yardstick competition” and “promotion tournament” effect [26], further driving incentives. This approach has been widely adopted in 49 countries and regions as a macroeconomic management system and a means of promoting economic growth [27]. China has successfully maintained high-speed economic growth for nearly 30 years since the reform and opening-up period, largely attributed to the establishment and implementation of economic growth targets. Xu et al. (2018) found that economic growth targets drive actual economic growth and increase the contribution of capital and investment rates [28]. Liu et al. (2019) conducted empirical tests on urban samples, revealing that for every 1% increase in economic growth targets, regional investment significantly increased by approximately 0.44% [29]. Huang et al. (2015) studied foreign investment and found that for every 1% increase in economic growth targets, the level of foreign investment utilization in the region increased by approximately 0.34 percentage points. Thus, the role of economic growth targets in promoting “quantity” and “speed” growth cannot be underestimated [30].
Since 2010, China has entered a “new normal” stage of development, shifting from pursuing high-speed economic growth to high-quality development. As a result, economic research has started to shift its focus from “speed” to “quality” when examining the impact of economic growth targets on various development qualities. However, drawbacks of economic growth targets have become apparent. Xu et al. (2018) found that for every 1% increase in economic growth target, there is a 1% decline in economic development quality when studying different policy tools [28]. The methods of setting economic growth targets, such as the “layer by layer” and “hard constraint” methods, have distorted public spending [31], inhibited the upgrading of the local service industry structure [32], and slowed the improvement of total factor productivity [33]. In the “new normal” stage, economic structure optimization and upgrading require a shift from factor-driven and investment-driven growth to innovation-driven growth. However, Wang et al. (2021) found an inverted U-shaped curve relationship between economic growth targets and regional innovation. That is, when the economic growth target exceeds a certain value, it significantly inhibits regional innovation [34]. Additionally, because economic growth targets use GDP growth rate as a single performance measurement standard, local governments have pursued a “short, flat, and fast” development model, leading to radical urbanization [35]. When government pressure increases, environmental protection is often neglected, leading to a U-shaped relationship between economic growth targets and environmental pollution [36], enterprise environmental protection investment [37], and regional energy consumption scale and structure [27].
Both fiscal decentralization and economic growth targets are just types of government incentive mechanisms and have only an indirect effect on the development of new-type urbanization. The direct effect still needs to be achieved through specific government actions. A large number of research results have shown that the government can promote the development of new urbanization by increasing investment in scientific and technological innovation [15], attracting foreign investment [13], and promoting local industrial agglomeration [38]. However, attention should be paid to the degree of government intervention, and the government should play its role in improving the degree of marketization [39].

2.2. Theoretical Hypothesis

2.2.1. Economic Growth Targets and New-Type Urbanization

The establishment of an economic growth target during a specific period can motivate local governments to introduce a series of policies and support resources aimed at promoting economic growth. When the target is set within a reasonable range, local governments can gain a sense of control and confidence in achieving the economic growth target. After formulating corresponding policy measures, they can listen to various policy recommendations from higher authorities, actively carry out livelihood construction, focus on investment in technology innovation, ecological environment protection, and human capital, increase fiscal expenditure on people’s livelihoods, and shift their focus to long-term economic development processes, thereby promoting sustainable economic development. Additionally, the attention given to long-term development allows the government to play a more significant role in promoting market self-regulation, correspondingly reducing the level of government intervention. At this point, as the economic growth target increases, the leading role of the market will gradually become prominent [40], and the construction and development of the population, economy, and ecological environment will advance in tandem, improving the level of new urbanization development. In this way, the growth target becomes a positive driving force.
When the economic growth target is too high compared with normal trends, however, the driving force will become pressure, which directly affects local officials who are subject to promotion performance assessments. To achieve significant economic growth within the year, on the one hand, the government will focus its efforts on changes in GDP and neglect long-term construction in ecology and livelihoods, sacrificing the quality of urbanization in pursuit of quantitative economic growth. On the other hand, to achieve the target within a year, the government will inevitably adopt short-term and quick-effect government intervention measures, such as continuously increasing the input of production factors and issuing stronger economic policies. As the target is raised, the government will increase its level of intervention, ultimately resulting in excessive land development [9], a low utilization rate of corporate production capacity [41], and crowding out of investment in the corporate environment [37], among other issues. These consequences will ultimately reduce the level of new urbanization development in terms of population, economy, ecological environment, urban–rural disparities, and other aspects. On the basis of this, this article proposes the following:
Hypothesis 1.
There is a nonlinear inverted U-shaped relationship between economic growth targets and the level of new-type urbanization.

2.2.2. Economic Growth Targets, Public Fiscal Expenditure, and New-Type Urbanization

Public expenditures cover a wide range of areas, including education, science and technology, social security, and environmental protection. As a crucial instrument for local governments to pursue regional development, public expenditures play a direct role in promoting the level of new-type urbanization [42]. Setting economic growth targets within a reasonable range can boost local governments’ economic development initiatives, encouraging them to mobilize various resources and methods to achieve development. As the completion of these goals is relatively easy, local governments are more adept at promoting economic sustainability while focusing on political policy incentives beyond GDP, such as the “dual carbon” plan, technological innovation, and the construction of people’s livelihoods to showcase their achievements to higher authorities. To fully develop the economy, local governments inevitably increase total government spending while maintaining a reasonable expenditure structure. Public financial spending will increase together with constructive spending to promote new-type urbanization development.
When economic growth targets continue to increase and exceed a reasonable threshold, development momentum, however, turns into pressure. Local governments may then begin to pursue short-term economic interests, continuously increasing constructive fiscal spending to expand investment and production capacity, neglecting people’s livelihood development, and squeezing out public expenditures. This phenomenon may lead to investment distortion [9] and inefficient resource allocation, hindering the development of new-type urbanization. Therefore, local governments should exercise caution when increasing economic growth targets and strive to maintain a balance between economic development and public expenditures to achieve sustainable new-type urbanization.
Hypothesis 2.
Public expenditures play a mediating role in the inverted U-shaped relationship between economic growth goals and the level of new-type urbanization development.

2.2.3. Economic Growth Targets, Land Finance, and New-Type Urbanization

The relationship between land finance and urbanization has been a topic of debate in academic circles. On the one hand, some scholars argue that large-scale land transfers by local governments accelerate land urbanization [43] but can also create imbalances between the population and land area, resulting in problems such as “ghost cities” and urban sprawl. Additionally, the imbalanced price structure of land can inflate the semi-urbanization rate [44], which damages the sustainability of urban development [9,45]. On the other hand, some scholars have acknowledged the positive role of land finance in urbanization from the perspective of public expenditure. For example, Lin and Yi (2011) have argued that land finance increases public financial expenditure, thus promoting land urbanization in Jiangsu Province in China from a political economy perspective [46]. Similarly, Lu et al. (2019) have found that while land finance generally increases semi-urbanization, it can also weaken the effect of half-urbanization by raising public expenditure [47].
In this paper, we consider the role of land finance in the relationship between economic growth targets and new-type urbanization, which depends on the balance between its contribution to new-type urbanization through public expenditure and the harm caused by the distortion of the population-land relationship, as well as the magnitude of the various dimensions of new-type urbanization indicators. If the level of new-type urbanization brought about by land finance through public expenditure is too high compared with the structural imbalances that it causes, then land finance will have a negative effect on the inverted U-shaped relationship between economic growth targets and new-type urbanization. The inflection point will shift to a higher target level, the curve will flatten, and the negative effect will be delayed. Conversely, if the level of new-type urbanization brought about by land finance through public expenditure is low compared with the structural imbalances that it causes, then land finance will have a positive effect. It will shift the inflection point to a lower target level, the curve will flatten, and the negative effect will occur earlier. On the basis of this, the following two possible hypotheses are proposed:
Hypothesis 3.
Land finance negatively moderates the inverted U-shaped relationship between economic growth targets and new-type urbanization by increasing public expenditure, delaying the negative impact to a higher target level.
Hypothesis 4.
Land finance positively moderates the inverted U-shaped relationship between economic growth targets and new-type urbanization, bringing forward the negative impact to a lower target level.

2.2.4. Pathway Mechanisms

The impact of economic growth targets on new-type urbanization may be realized through the six dimensions of new-type urbanization, and their relationship needs to be further tested. Meanwhile, the various expenditures related to public spending, such as science, education, culture, health, social security, and environmental protection, need to be implemented through specific construction measures. This study investigates the pathways and mechanisms of their impact within this framework.
The following is a translation of the text into academic English using “new-type urbanization” and “economic growth targets” for the corresponding Chinese terms.
Economic growth targets and population development: The construction of infrastructure and public services is an important driving force for promoting population migration to cities [48,49]. An increase in economic growth targets within a reasonable range may stimulate local governments to be more proactive in infrastructure and public service development, improve transportation, and raise the levels of healthcare and education, thereby attracting rural and even out-of-province residents to migrate inward and improve population development. However, when the pressure to achieve economic growth targets is too great, investments in infrastructure and public services may be deferred or reduced in the short term, hindering population development.
Economic growth targets and economic quality: Innovation is an important engine for improving the quality of regional economic development. As economic growth targets increase, governments may increase subsidies and investment in corporate innovation to enhance the core competitiveness of their regions. However, when economic growth targets reach a certain limit, further increases may make governments subservient to GDP growth, leading them to adopt “quick and dirty” economic development strategies and gradually abandon long-term development methods such as technological innovation.
Economic growth targets and people’s livelihoods: Social security is a fundamental project in urban construction that enhances citizens’ social welfare and raises their living standards. When economic growth targets are relatively low, local governments may pay more attention to the sustainable development of people’s livelihoods and social development, which also maintains their political reputation. Governments will prioritize the improvement of social security and employment protection, thereby raising people’s living standards. However, when economic growth targets are set too high, social security may be neglected, and people’s living standards may not be sustained.
Economic growth targets and spatial intensification: As economic growth targets increase, local governments are bound to use land transfers to increase revenue and carry out economic development. However, large-scale land transfers can directly lead to an imbalance between population and land area, resulting in urban sprawl, which is unfavorable for spatial intensification development.
Economic growth targets and ecological civilization: Energy structure reflects the use of clean and highly polluting energy in a region, and optimizing energy structure is conducive to ecological civilization progress. An increase in economic growth targets may cause governments to neglect the adjustment of energy structure, thereby affecting regional environmental levels.
Economic growth targets and rural–urban integration: Finance, as a manifestation of science and technology in public expenditure, has an important influence on rural–urban integration. In the primary stage of financial development, financial resources tend to concentrate in cities, leading to an increasing gap in technology, capital, and other resources between urban and rural areas, reducing rural–urban integration. However, as financial levels improve, financial resources begin to spread from cities to rural areas, narrowing the urban–rural gap and increasing integration [50]. An increase in economic growth targets may reduce a company’s total factor productivity and financial technology innovation, thereby inhibiting financial development.
The research framework of this article is illustrated in Figure 1:

3. Materials & Methods

3.1. Model Settings

3.1.1. Benchmark Model

To test the nonlinear relationship between economic growth targets and the level of new-type urbanization, this study refers to Chai (2022) [27] and establishes the following model:
n u r b i t = β 0 + β 1 t a r g e t i t + β 2 t a r g e t i t 2 + φ X i t + γ i + λ t + ε i t
where nurbit, targetit, and Xit represent the level of new-type urbanization, economic growth targets, and other control variables of province i in year t, respectively. γi and λt are province fixed effects and year fixed effects, respectively, and εit is the random disturbance term. When β2 < 0, there is an inverted U-shaped relationship between the two. Notably, owing to the large differences in sample data values, this paper takes the logarithmic form of the variables for regression.

3.1.2. Mediation Effect Model

This paper refers to MacKinnon (2000) [51] to test the mediating effect of public expenditure between economic growth targets and the level of new-type urbanization. The model is set as follows:
M i t = θ 0 + θ 1 t a r g e t i t + θ 2 t a r g e t i t 2 + φ X i t + γ i + λ t + ε i t
n u r b i t = θ 0 + θ 1 t a r g e t i t + θ 2 t a r g e t i t 2 + θ 3 M i t + φ X i t + γ i + λ t + ε i t
where Mit is the intermediate variable of government intervention, and the intermediate variable model consists of Equations (2) and (3). Equation (3) tests the effect of economic growth targets on the intermediate variable, while Equation (4) tests the effect of economic growth targets and the intermediate variable on new-type urbanization. There are two forms of the inverted U-shaped mediating effect model, and the other form is as follows:
M i t = η 0 + η 1 t a r g e t i t + φ X i t + γ i + λ t + ε i t
n u r b i t = η 0 + η 1 t a r g e t i t + η 2 t a r g e t i t 2 + η 3 M i t + η 4 M i t + φ X i t + γ i + λ t + ε i t
There is a nonlinear relationship between the intermediate variable and the dependent variable.

3.1.3. Moderate Effect Model

To further investigate the impact of economic growth targets on the level of new-type urbanization and to examine the moderating effect of land finance on the overall relationship as well as the effect of public financial expenditure, the following interaction term between land finance and economic growth targets and its square are added to models (2) and (3):
p e x p i t = α 0 + α 1 t a r g e t i t + α 2 t a r g e t i t 2 + α 3 t a r g e t i t × r _ p r i c e i t + α 4 t a r g e t i t 2 × r _ p r i c e i t + φ X i t + γ i + λ t + ε i t
n u r b i t = α 0 + α 1 t a r g e t i t + α 2 t a r g e t i t 2 + α 3 t a r g e t i t × r p r i c e i t + α 4 t a r g e t i t 2 × r p r i c e i t + α 5 p e x p i t + φ X i t + γ i + λ t + ε i t
The variable r_priceit represents land finance. Haans et al. (2016) [52] stated that when α4 > 0, the moderating effect makes the original inverted U-shaped curve flatter, indicating a negative moderating effect. When α1α4−α2α3 > 0, the inflection point shifts to the right.

3.2. Description of Variables

3.2.1. Explanatory Variable: The Development Level of New Urbanization

On the basis of the theoretical connotation of new-type urbanization as human-centered, synergistic, inclusive, and sustainable, the new-type urbanization development level system established in this paper contains 27 indicators in six dimensions, as shown in Table 1: population development, quality of the economy, ecological civilization, people’s quality of life, spatial intensification, and urban–rural integration.
Population development: The urbanization rate shows the process of rural labor force concentrating in cities, and the proportion of urban resident population rises. The urban unemployment rate is both a consideration for the transfer of the rural population to cities and a measure of the substantive results of urbanization based on the employment rate, and the rural labor force must achieve employment after transfer to be considered urbanized. Gradually, the quality of the population is improved as the rural population is exposed to the educational resources in the cities, and the number of students in higher education per 100,000 population is used as an evaluation of the quality of the population.
Economic quality: Urbanization and economic development mutually interact and promote each other. In addition to GDP per capita, which measures economic growth, industrial restructuring, and fixed asset investment are important tools to promote economic construction and improve the quality of economic development.
Social life: The quality of people’s lives is the direct manifestation of the “people-oriented” concept of new urbanization. The construction and protection level of regional public services is the key to reflecting whether the rural migrant population is truly integrated into the city. As the degree of social humanity increases, it becomes more attractive to the rural population, and people’s sense of belonging becomes stronger.
Spatial intensification: The construction of new urbanization requires a scientific and compact spatial pattern. It means increasing the urban land area at the same time as the urbanization rate of the population rises so as to realize the balanced development of urban and rural areas. The built-up area, paved road area per capita, and population density reflect the spatial layout of urbanization.
Ecological civilization: The degree of ecological civilization reflects the sustainable development level of the new urbanization, and handling pollution and environment-friendly construction are two important criteria for evaluating the ecological livability of an area. In terms of pollution control, the pollution-free treatment rate of urban sewage and domestic garbage and sulfur dioxide emissions are selected, and for ecological protection, the area of green space in parks and the greening coverage of built-up areas are effective statistical factors.
Urban-rural integration: Urban-rural integration is a comprehensive, coordinated, and fair view of development, which emphasizes urban-rural equality to solve the dual-structure problem. This paper selects two indicators to evaluate the degree of urban–rural integration: the ratio of the income level of urban and rural residents and the ratio of the consumption level of urban and rural residents.
This paper adopts the entropy weighting method to calculate the weights of the indicators. The entropy method is an objective assignment method in the specific use of the process; according to the dispersion of the data of each indicator, the entropy weight of each indicator is calculated using the information entropy so as to obtain a more objective indicator weight. To a certain extent, it circumvents the bias of subjective factors.
To eliminate the influence brought by the index scale and unit, standardized dimensionless processing is carried out first. The specific steps are as follows.
For the indexes with larger entropy weights indicating a higher development level of new urbanization, the positive index calculation formula is used for processing, as in Equation (8).
X i t = x i j m i n x i j m a x x i j m i n x i j       i = 1 , 2 , , m ; j = 1 , 2 , , n
When a larger entropy weight of the indicator indicates a lower level of new urbanization development, the negative indicator calculation formula is used for processing, as in Equation (9).
X i t = m a x x i j x i j m a x x i j m i n x i j       i = 1 , 2 , , m ; j = 1 , 2 , , n
Calculate the weight of the indicator value of the j indicator in the i year.
r i j = X i j i = 1 m X i j    
Calculate the entropy value of the j indicator.
e j = 1 l n m i = 1 m X i j × l n X i j  
Calculate the coefficient of variability of the j indicator.
g j = 1 e j    
Calculate the weight of the j indicator.
ω j = g i j = 1 n g i    
The final composite score of each indicator Si.
S i = j = 1 n ω j X i j  

3.2.2. Explanatory Variables

Core explanatory variable: Following Chai (2022) [27], this study obtained economic growth targets from the annual government work reports released in January each year by 30 provinces in China.
Mediating and moderating variables: This study selected the sum of six categories of government public expenditures, including science, education, culture, health, social security and employment, and environmental protection, as measures of government public financial expenditure. The proportion of land transfer prices to government fiscal revenue was used as a measure of land finance.
Control variables: This study introduced control variables from the aspects of trade, financial development, regional innovation, infrastructure construction, energy structure, and wages. The ratio of total import and export trade volume to regional GDP was used as the trade factor (trade), the proportion of financial value-added to GDP was used as the local financial development level (fc), the number of patents per capita was used to measure regional innovation (ppat), traffic density was used to measure infrastructure construction (inf), the proportion of coal consumption to primary energy consumption was used as the energy structure (ES), and average employee wages were used as income status (wage).

3.2.3. Data Source and Description

The present study uses panel data from 30 provinces in China from 2005 to 2020. The variables are mainly obtained from government work reports, including the “China Statistical Yearbook”, “China Environmental Statistical Yearbook”, and other sources. Owing to changes in statistical methods, public fiscal expenditure data for the period from 2007 to 2020 were used, while land transfer data were obtained from the Land Market Network and aggregated at the provincial level. Missing data were imputed using linear interpolation and mean value methods. Descriptive statistics for all variables are presented in Table 2.
Using the aforementioned indicators and entropy weighting method to obtain data, this study presents the development level of new urbanization in 2005, 2010, 2015, and 2020 in a visual form to observe changes and distribution characteristics. The results are shown in Figure 2.
From 2005 to 2020, the overall level of new-type urbanization gradually increased, with the new-type urbanization development level of the 30 provinces reaching above 0.3 in 2020. The regional distribution of the new-type urbanization level is also very evident, with Beijing, Tianjin, and the coastal provinces in eastern China maintaining a relatively high level of new-type urbanization development, while the provinces in central and western China have been developing more slowly and have always lagged behind the southeastern coastal areas. This visualization result provides a theoretical basis for the subsequent analysis of regional and temporal heterogeneity.

4. Results

4.1. Baseline Regression Result

Table 3 presents the baseline regression results of the relationship between economic growth targets and the new-type urbanization development level. The first column of Table 3 reports the results without control variables but controlling for province and time effects. The coefficient of the first-order term of economic growth targets is significantly positive at the 1% level, whereas the coefficient of the second-order term is significantly negative at the 1% level. Columns (2)–(4) gradually add control variables while controlling for province and time effects. The coefficients of the first- and second-order terms are still significantly different from zero at the 1% level, indicating a nonlinear inverted U-shaped relationship between economic growth targets and the new-type urbanization development level. Thus, hypothesis 1 is supported, indicating that the effect of economic growth targets on new-type urbanization is first to promote and then to inhibit. The inflection point is X1 = −α1/2α2 = 11.94. It was found that 13.5% of the economic growth targets are above 11.94, and these provinces are mostly located in the central and western regions. Therefore, most of the economic growth targets currently formulated in China are in the promotion stage of new-type urbanization.

4.2. Mechanism Analysis

4.2.1. Mediating and Moderating Effect

The inverted U-shaped relationship between economic growth targets and the level of new-type urbanization is directly related to government behavior, which intervenes in economic development by allocating different fiscal expenditures. Table 4 presents the mediating effects of public expenditure on this relationship in models (2) and (3). In model (2), which examines the effect of economic growth targets on public expenditure, the first-order coefficient is significantly positive at the 1% level, while the second-order coefficient is significantly negative at the 5% level. This suggests an “initial promotion, then suppression” inverted U-shaped relationship between economic growth targets and public expenditure. Column (2) examines the relationship between public expenditure and new-type urbanization and finds that public expenditure promotes the development of new-type urbanization and is significant at the 1% level. This indicates that public expenditure plays a partial mediating role in the inverted U-shaped relationship between economic growth targets and the level of new-type urbanization, as higher economic growth targets lead to increased government expenditure on people’s livelihoods, which promotes the development of new-type urbanization but eventually results in a decline in its level. Therefore, hypothesis 2 is verified.
The regulatory effect of land finance in the first stage of mediation was examined, and after adding the cross-product terms of land and targets and their quadratic terms, the first- and second-order terms of economic growth targets on public expenditure passed the significance test at 1%, still showing an inverted U-shaped relationship. The coefficient of the square cross-product term between land finance and economic growth targets is significantly positive, indicating that the negative regulatory effect of government competition on the inverted U-shaped relationship between economic growth targets and new-type urbanization is significant, and the inverted U-shaped curve becomes flatter. According to the inflection point displacement discrimination, α1α4 − α2α3 > 0, indicating that the inflection point shifts to the right, the existence of land finance makes the reduction effect of economic growth targets on public expenditure occur at a higher level of economic growth target. As a moderated mediation model, land finance plays a negative regulatory role in the relationship between economic growth targets and new-type urbanization, making the overall inflection point shift to the right and the inhibitory effect of economic growth targets on new-type urbanization occurs at a higher level of economic growth target. This indicates that the positive impact of land finance through public expenditure outweighs its negative effects, such as land expansion. Thus, Hypothesis 3 is confirmed.
To visually demonstrate the moderating effect of the moderator variable on the inverted U-shaped relationship in the first stage of the mediation model, this study presents a quadratic function plot showing the shape and position of the inverted U-shaped curve at two levels of land finance, high and low (selected at the 25th and 75th percentiles, respectively), as shown in Figure 3.
The above figure shows that as land transfer income increases, the turning point of the curve occurs at a higher economic growth target and a higher level of public expenditure. This indicates that through increasing financial revenue and expenditure, land finance also raises the level of public expenditure, causing the inhibitory effect of economic growth targets on public expenditure to occur at higher target levels.

4.2.2. The Pathway of Economic Growth Targets on New-Type Urbanization

On the basis of theoretical analysis and research hypotheses, this paper further examines the paths through which economic growth targets affect new-type urbanization from six aspects: population development, quality of the economy, people’s livelihoods, spatial intensification, ecological civilization, and urban–rural integration, and explores the specific impacts of economic growth targets on these six dimensions. Table 5 reports the effects of economic growth targets on each component.
The above models all include control variables that control for provincial and time effects. It can be found that in the dimensions of population development, quality of the economy, ecological civilization, and urban–rural coordination, there are significant positive coefficients for the linear term and significant negative coefficients for the quadratic term, indicating that there is an inverted U-shaped relationship between economic growth targets and the above four dimensions. However, the regression results of economic growth targets on people’s livelihoods and spatial intensification are not significant, which is not consistent with the above hypothesis. Subsequent path analysis will not discuss the mediating mechanism in the dimensions of people’s livelihoods and spatial intensification.
Path analysis indicates that the economic growth target mainly affects the new urbanization through four aspects: population development, economic quality, ecological civilization, and urban-rural coordination. When the economic growth target is raised within a reasonable range, the reasons for the improvement in population development, economic quality, ecological construction, and urban-rural coordination may come from two aspects. First, the means by which local governments promote economic growth include various aspects, such as increasing the urbanization rate, adopting green technologies, and narrowing the urban-rural gap. These means promote the development of the other three dimensions while enhancing the economy. Second, from the perspective of multiple political achievements, when officials estimate that strong incentive targets, such as GDP growth rates, can be achieved, they may allocate their efforts to other political achievements. Some aspects of population development, ecological construction, and urban-rural coordination may be the government’s goals. However, when the economic growth target is set too high, the government overly focuses on short-term economic growth, which squeezes out resources from the other three aspects and also constrains the improvement of economic quality. Overall, there is actually a resource competition rather than a coordinated development relationship between economic growth and population development, economic quality, ecological construction, and urban-rural coordination. The reason why there is no significant effect on people’s lives and space intensity may be due to insufficient incentives from the central government in these two aspects, which results in officials not paying attention to their development compared to other aspects, or there is no coordinated development or resource competition between economic growth and these two aspects. This provides evidence and inspiration for the relationship and trade-offs among various indicators of new urbanization.

4.2.3. The Pathway Mechanism Analysis

Columns (1) and (2) in Table 6 show the mediating effect of infrastructure investment on population development. The coefficient of the first-order term of economic growth targets is significantly positive at the 5% level, while the coefficient of the second-order term is significantly negative at the 10% level in Column (1), indicating that an increase in economic growth targets initially leads to an increase and then a decrease in infrastructure investment. In Column (2), infrastructure investment significantly promotes population development at the 1% level. Columns (3) and (4) show the mediating effect of regional innovation on the quality of the economy. The coefficient of the first-order term of economic growth targets is significantly positive at the 1% level, while the coefficient of the second-order term is significantly negative at the 1% level in Column (3), indicating that a rise in economic growth targets initially leads to an increase and then a decrease in innovation investment. In Column (4), regional innovation significantly promotes economic quality at the 1% level. Columns (5) and (6) show the mediating effect of energy structure adjustment on environmental protection. Economic growth targets suppress energy structure adjustment at the 1% level in Column (5), while the coefficients of the first-order and second-order terms of energy structure adjustment are significantly positive at the 1% level in Column (6), indicating a U-shaped relationship between energy structure adjustment and environmental protection. Columns (7) and (8) show the mediating effect of financial development on urban–rural coordination. Economic growth targets significantly suppress financial development at the 1% level in Column (7), while the coefficient of the second-order term of financial development is significantly positive at the 1% level, indicating a U-shaped relationship between financial development and urban–rural coordination.
The results indicate that although local governments have certain discretion in governing local affairs, their behavior is constrained by the incentives set by the central government. The impact of economic growth targets on government behavior also reveals a “crowding-out effect” of the pursuit of economic growth by local governments on measures such as energy structure adjustment, financial development (which reflects the degree of regional marketization to some extent), and other related measures. With regard to infrastructure construction and regional innovation, within a reasonable range, pursuing economic growth goals can have a promoting effect. However, beyond a certain limit, the government will reduce investment in measures that have slow effectiveness, such as infrastructure and innovation incentives, and allocate more resources to promote economic growth.

4.3. Heterogeneity Analysis

4.3.1. Time Heterogeneity

In 2014, the Chinese economy entered the “new normal” phase, and the central government began to consciously lower its economic growth targets. On the one hand, the size of the Chinese economy had reached a certain scale and its growth had undergone structural deceleration, making it no longer realistic to pursue high growth rates. On the other hand, the central government gradually became aware of the drawbacks of rapid growth and began to transition from high-speed economic growth to high-quality development. At the same time, the concept of “new urbanization” was officially proposed in that year, and local officials responded to the call, striving to stand out and set an example in the movement of new-type urbanization construction in order to achieve promotion. Therefore, this paper takes 2014 as a time node and conducts empirical research on the data from 2005 to 2013 and from 2014 to 2020.
Table 7, Column (1) and (2) indicate that the effect of economic growth targets on new-type urbanization exhibits time heterogeneity. Prior to 2014, the impact of economic growth targets on new-type urbanization followed an inverted U-shaped curve, while after 2014, economic growth targets promoted the improvement of the level of new-type urbanization. This suggests that the relationship between the two factors changes with the evolution of central policies and priorities. Before 2014, economic growth was the core task, so GDP growth rate had a stronger incentive effect. Local officials often set higher growth targets to showcase their personal abilities, which led to excessive concentration of local government resources on a single indicator, causing the level of new-type urbanization construction to increase first and then decrease with the increase of economic growth targets. After 2014, high-quality development became the core task, and economic growth targets remained within a reasonable range. Local officials have been steadily promoting coordinated development in various areas of the region, thus ensuring the high-level development of new-type urbanization involving multi-dimensional efforts.

4.3.2. Regional Heterogeneity

The data suggest that the central and western regions of China have higher actual economic growth rates and growth targets compared to the eastern region. This is mainly due to the inclination of national regional development policies, acceleration in absorbing foreign investment, and concentration of advanced manufacturing industries, which are reflected in the GDP growth rate. However, the eastern developed regions may slow down their economic growth targets strategically due to the central government’s preference for adjusting the regional economic structure towards underdeveloped areas, resulting in the phenomenon of higher growth targets in the west and lower targets in the east. Therefore, this paper divides China into three regions: east, central, and west, and conducts empirical research on the relationship between economic growth targets and new-type urbanization.
Table 7, Columns (3)–(5) show that the effect of economic growth targets on new-type urbanization has regional heterogeneity. In the eastern region, economic growth targets have a significant promoting effect on the level of new-type urbanization; in the central and western regions, the inverse U-shaped relationship remains, with promotion followed by suppression. This may be due to differences in regional economic development levels, where local governments at similar economic levels compete with each other. The task of underdeveloped regions in central and western China is to improve the economic level and narrow the regional economic gap. Therefore, the competition among local governments is focused on the GDP growth rate to showcase their political achievements. On the other hand, as the pioneers and demonstration areas of China’s development, the eastern region should undertake the staged task of high-quality national development, simultaneously promoting the development of people’s livelihoods, ecology, and other aspects while ensuring a certain level of economic growth. At this time, the competition for political achievements will be more reflected in other areas beyond economic growth.
This inference is also validated by the path analysis of the eastern region presented in Table 8. In the eastern region, economic growth targets have a significant promoting effect on the local ecology and people’s livelihoods, indicating that after a certain level of economic development is achieved, local governments will pay more attention to the governance of non-economic affairs in the region. Although this emphasis may be attributed to the decisions and choices of local governments to some extent, it is mainly due to the issuance and incentive setting of non-economic policies by the central government.

4.4. Robustness Analysis

4.4.1. Regression with a Single Indicator as the Dependent Variable

As multidimensional indicators may suffer from problems such as multicollinearity, endogeneity, and masking of causal relationships between variables in causal analysis, this paper adopts a single indicator to represent the robustness test of the new urbanization results. Regardless of whether the pilot work of new urbanization progresses vigorously or the connotation of urbanization continues to enrich, it ultimately reflects the rural residents’ migration to cities. Moreover, although China’s urbanization is mainly driven by the government, residents still have the right to “vote with their feet”. As the level of urban economic development improves, public infrastructure is optimized, and the public welfare system is improved, rural residents will spontaneously choose to migrate to cities [53]. Therefore, this paper selects population urbanization (urb), which measures the ratio of the number of urban residents to the total population of the region, as a single dimension measure of the new urbanization. The benchmark results and mechanism test results are shown in Table 9:

4.4.2. Robustness Test

This paper employed the variable substitution method to test the robustness of the model by introducing the lagged economic growth targets. The results of the test, as shown in Table 10, indicate that the significant results of the first- and second-order terms of the new-type urbanization level and its six dimensions remain the same after the variable substitution, demonstrating the robustness of the model.

4.4.3. Endogeneity Test

The endogeneity problem arises for two reasons: first, the explanatory variable and the dependent variable are mutually causal; and second, important explanatory variables are omitted. In this study, the government formulates corresponding growth targets based on the recent economic development status of the region, while the new-type urbanization development level involves multiple dimensions. When the government sets targets, it may also consider a certain factor of new-type urbanization, causing mutual causality between the two and resulting in the endogeneity problem.
Due to the fact that the formulation of economic growth targets in a given year is based on the previous year’s targets and the actual GDP growth rate, but the previous year’s economic growth targets and the actual GDP growth rate are not affected by the level of new-type urbanization in that year, it conforms to the setting of instrumental variables. Therefore, following the approach of Xu et al. (2018) [28], this study selects the lagged economic growth target and the lagged actual economic growth rate as instrumental variables and conducts two-stage least squares regression to re-examine the baseline results. As shown in Table 11 the results indicate that the first- and second-order terms of the economic growth target and the effect of public expenditure on new-type urbanization are still significant after introducing the instrumental variables and pass the significance test at the 1% level, indicating that the mediation effect model still holds.

5. Conclusions

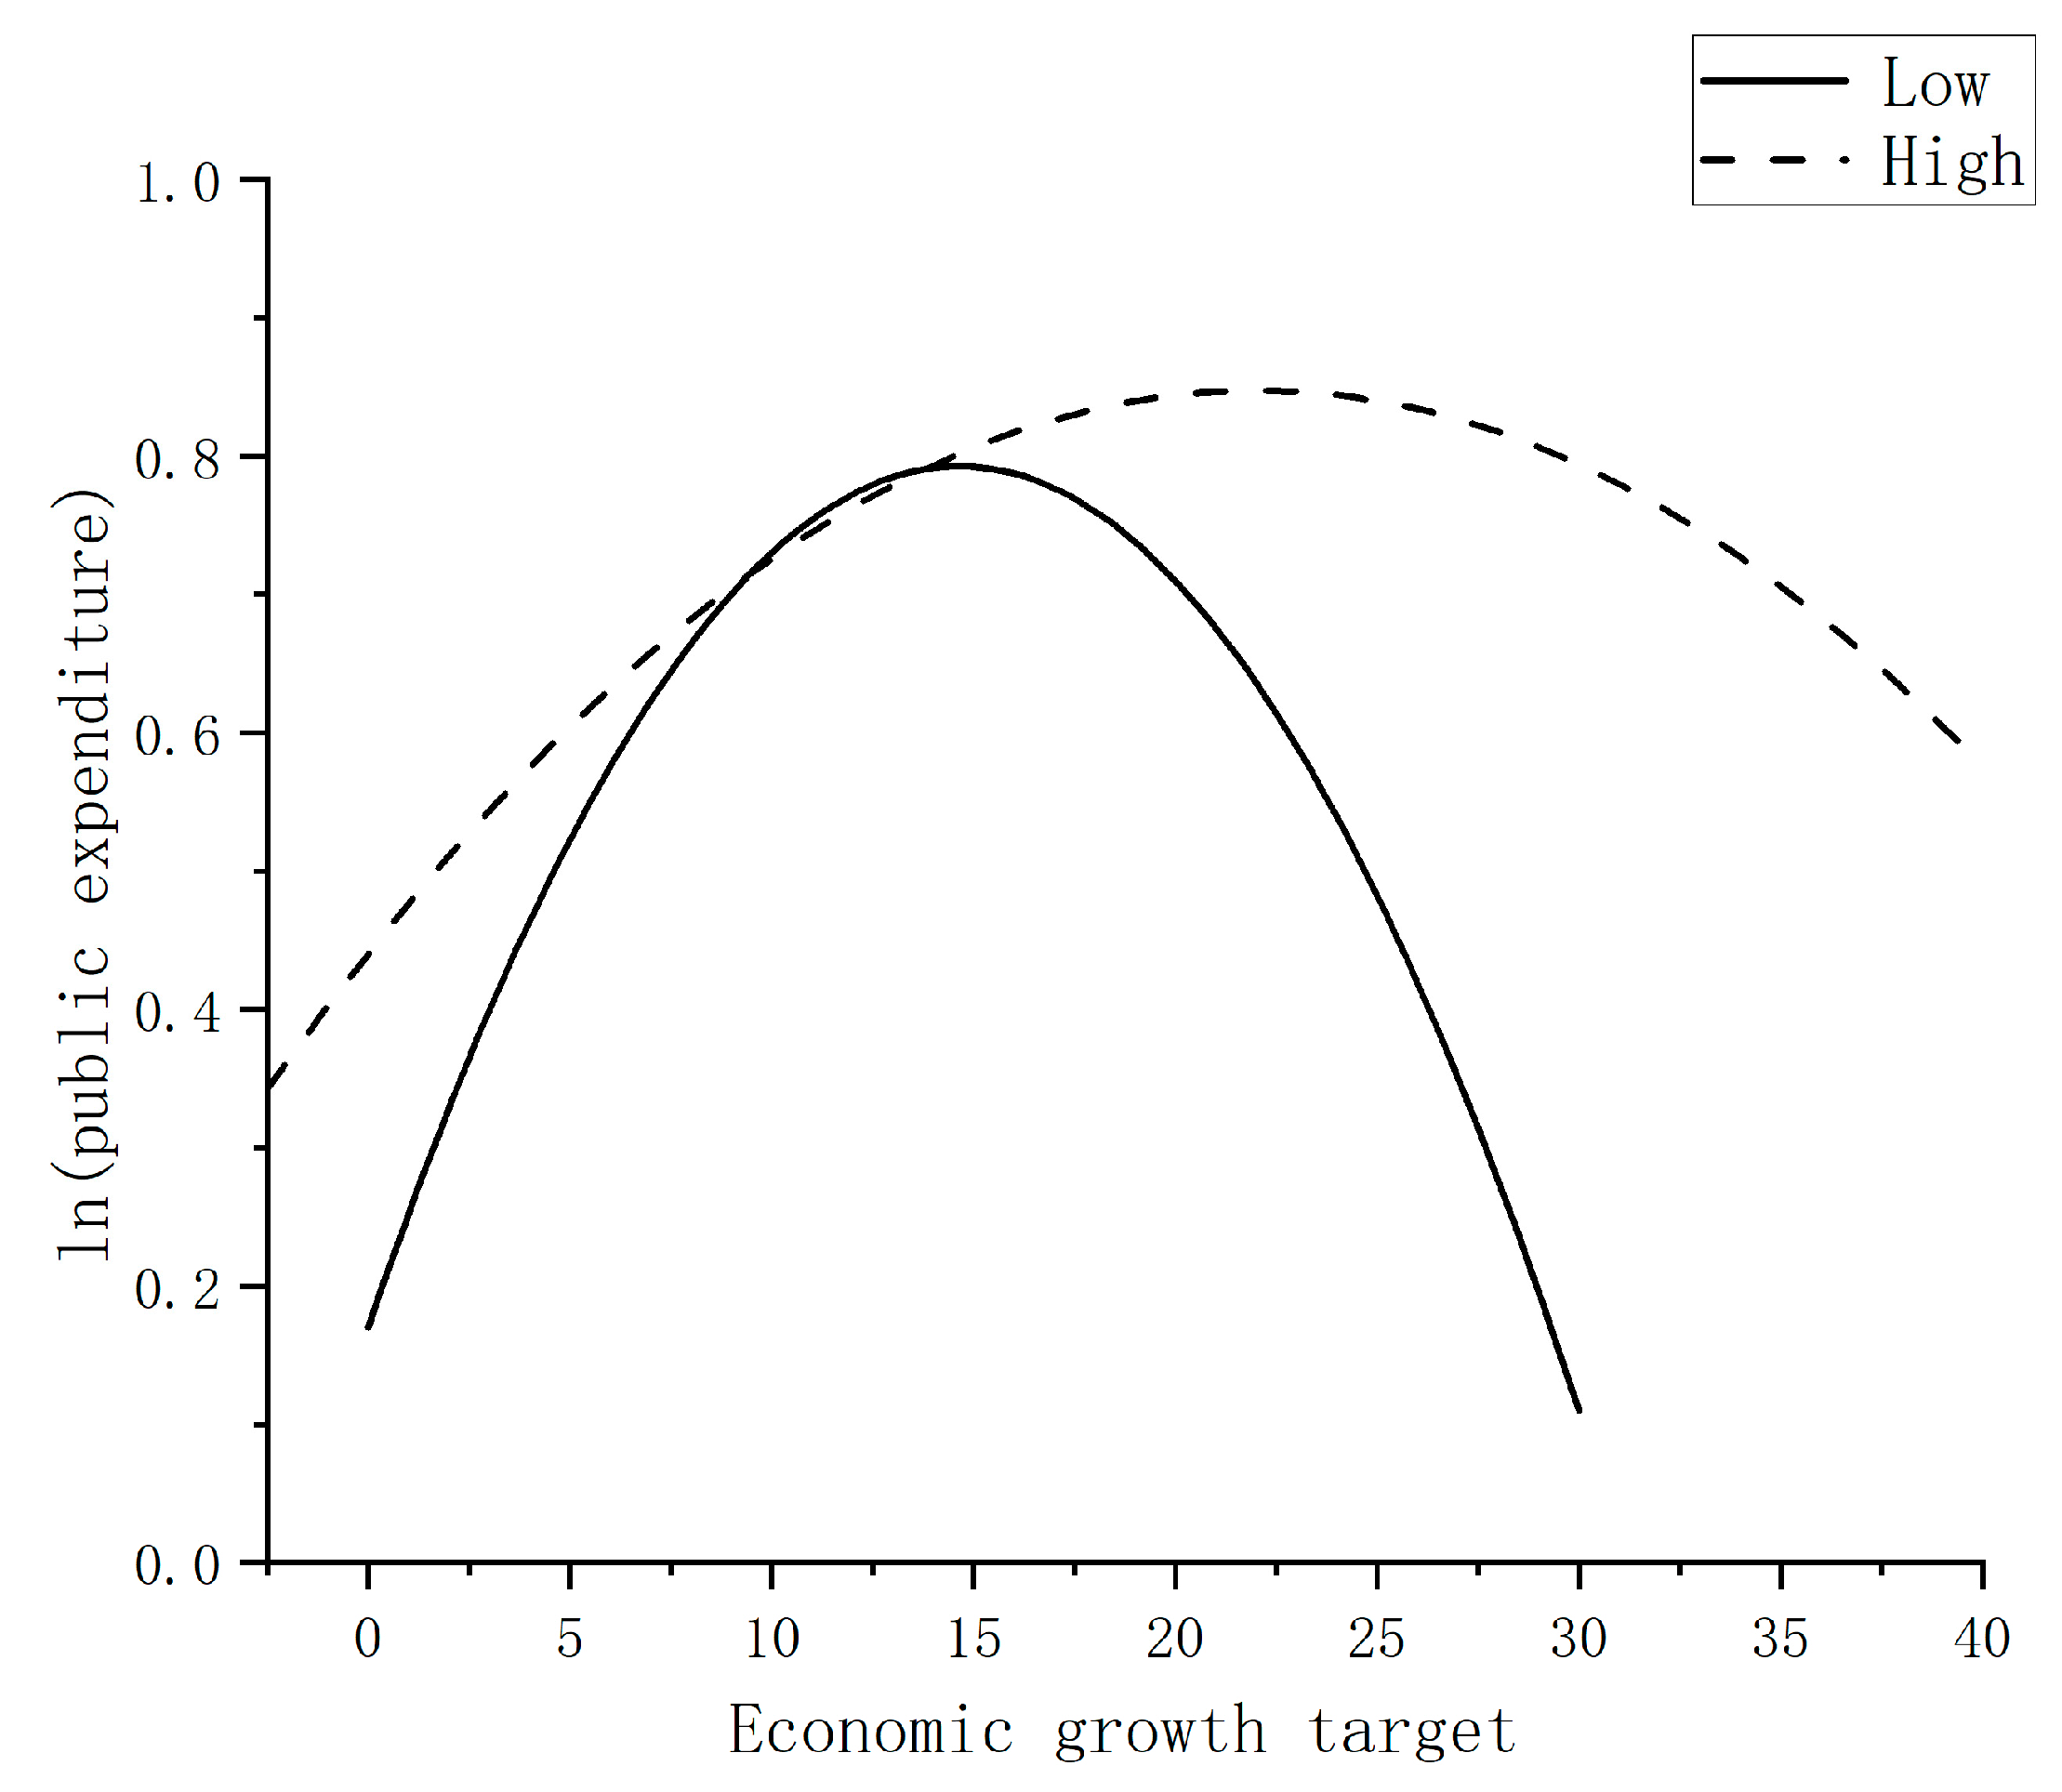
We use panel data from 30 provinces in China from 2005 to 2020 to investigate the role of economic growth targets in guiding and constraining new urbanization. The main findings are as follows: first, there is an inverted U-shaped relationship between economic growth targets and new urbanization. As the economic growth targets increase, new urbanization first increases and then decreases. Second, public expenditure plays a mediating role in the relationship between economic growth targets and new urbanization, as economic growth targets affect new urbanization through the inverted U-shaped relationship with public expenditure and the positive effect of government intervention on new urbanization. Land use, however, regulates the effect of public expenditure and causes the inflection point to occur at a lower level of economic growth target. Furthermore, the study examined the pathways through which economic growth targets affect new urbanization and found that economic growth targets affect new urbanization through infrastructure construction, population development, regional innovation, energy structure improvement, and financial development. We also explored the regional and temporal heterogeneity of the results and found that the inverted U-shaped relationship between economic growth targets and new-type urbanization was evident in the central and western regions before 2014 but not after 2012, while in the eastern region and after 2014, economic growth targets had a promoting effect.
Our study reveals both the positive and negative effects of economic growth targets on urbanization and the quality of economic development in China, providing a better understanding of China’s institutional mechanisms. The use of economic growth targets as a measure of local officials’ performance evaluation by the central government has increased the enthusiasm of local governments to develop the economy. However, the intensifying competition among officials for promotion has led to a focus on short-term profit-seeking behavior, neglecting long-term livelihood construction and hindering sustainable development. Despite these challenges, the “land-for-security” urbanization promotion method and China’s government-led model have an important significance as referents for underdeveloped regions seeking to break away from low-productivity traps and achieve balanced urbanization.
Meanwhile, the article also provides insights for goal management in regional development strategies that involve multiple dimensions such as “new-type urbanization.” Path analysis shows that there may be a certain resource competition between economic growth and population development, economic quality, ecological civilization, and rural-urban integration, with smaller relationships with people’s livelihoods and spatial intensification. Therefore, the central government needs to control the economically led growth targets within a reasonable range to enable local governments to take into account multiple dimensions and achieve rational allocation of resources. For aspects of people’s livelihoods and spatial intensification, which may not be affected by economic growth targets, the central government may introduce corresponding goals and incentive measures to ensure the balanced development of new-type urbanization in all dimensions.
The implications of China’s urbanization experience for other countries, especially underdeveloped nations, cannot be overlooked. The positive role of land finance in promoting new-type urbanization through public expenditure, coupled with the potential negative effects of imbalances in the population–land relationship, provides a valuable lesson for other nations seeking to achieve balanced urbanization. Similarly, the challenges faced by China’s economic growth targets and their impact on sustainable development highlight the importance of considering the long-term effects of policy decisions. As such, the lessons learned from China’s urbanization can help guide other countries toward a more sustainable path of urban development.

Author Contributions

Conceptualization, B.D. and F.Z.; methodology, B.D.; writing—original draft preparation, B.D.; writing—review and editing, F.Z. All authors have read and agreed to the published version of the manuscript.

Funding

National Key R&D Program of China (2022YFC3800705); Youth Innovation Promotion Association of Chinese Academy of Sciences (Grant No. 2020424).

Data Availability Statement

The publicly available sources for the data used in this study have been described in the article; for other data, please contact the corresponding author based on reasonable grounds.

Acknowledgments

Yu Chen: a student of the School of Economics, Minzu University of China, is gratefully acknowledged for his assistance in the calculation of the entropy weight method.

Conflicts of Interest

The authors declare no conflict of interest.

References

  1. Lucas, R. On the mechanics of economic development. J. Monet. Econ. 1988, 22, 3–42. [Google Scholar] [CrossRef]
  2. Bertinelli, L.; Black, D. Urbanization and growth. J. Urban Econ. 2004, 56, 80–96. [Google Scholar] [CrossRef]
  3. Guan, X.; Wei, H.; Lu, S.; Dai, Q.; Su, H.J. Assessment on the urbanization strategy in China: Achievements, challenges and reflections. Habitat Int. 2018, 71, 97–109. [Google Scholar] [CrossRef]
  4. Li, Q.; Chen, Y.; Liu, J.M. Research on the “Promotion Mode” of China’s Urbanization. Soc. Sci. China 2012, 7, 82–100, 204, 205. [Google Scholar]
  5. Collier, P. African urbanization: An analytic policy guide. Oxf. Rev. Econ. Policy 2017, 33, 405–437. [Google Scholar] [CrossRef]
  6. Al-Mulali, U.; Fereidouni, H.G.; Lee, J.Y.M.; Sab, C.N.B.C. Exploring the relationship between urbanization, energy consumption, and CO2 emission in MENA countries. Renew. Sustain. Energ. Rev. 2013, 23, 107–112. [Google Scholar] [CrossRef]
  7. Zhang, N.; Yu, K.; Chen, Z. How does urbanization affect carbon dioxide emissions? A cross-country panel data analysis. Energ. Policy 2017, 107, 678–687. [Google Scholar] [CrossRef]
  8. Wang, S.; Gao, S.; Li, S.; Feng, K. Strategizing the relation between urbanization and air pollution: Empirical evidence from global countries. J. Clean. Prod. 2020, 243, 118615. [Google Scholar] [CrossRef]
  9. Zhang, Y.; Mao, W.; Zhang, B. Distortion of government behaviour under target constraints: Economic growth target and urban sprawl in China. Cities 2022, 131, 104009. [Google Scholar] [CrossRef]
  10. Ong, L.H. State-led urbanization in China: Skyscrapers, land revenue and “concentrated villages”. China Q. 2014, 217, 162–179. [Google Scholar] [CrossRef]
  11. Chen, M.; Liu, W.; Lu, D. Challenges and the way forward in China’s new-type urbanization. Land Use Policy 2016, 55, 334–339. [Google Scholar] [CrossRef]
  12. Han, X.; Xia, X.; Zhao, M.; Xu, K.; Li, X. Synergistic Effects between Financial Development and Improvements in New-type Urbanization: Evidence from China. Emerg. Mark. Financ. Trade 2020, 56, 2055–2072. [Google Scholar] [CrossRef]
  13. Wu, W.; Zhao, K. Dynamic interaction between foreign direct investment and the new urbanization in China. J. Hous. Built Environ. 2019, 34, 1107–1124. [Google Scholar] [CrossRef]
  14. Zhang, F.; Chung, C.K.L.; Yin, Z. Green infrastructure for China’s new urbanization: A case study of greenway development in Maanshan. Urban Stud. 2020, 57, 508–524. [Google Scholar] [CrossRef]
  15. Shang, J.; Wang, Z.; Li, L.; Chen, Y.; Li, P. A study on the correlation between technology innovation and the new-type urbanization in Shaanxi province. Technol. Forecast. Soc. Chang. 2018, 135, 266–273. [Google Scholar] [CrossRef]
  16. Chen, L.; Zhong, C.; Li, C. Research on the Impact of the Digital Economy on China’s New-Type Urbanization: Based on Spatial and Mediation Models. Sustainability 2022, 14, 14843. [Google Scholar] [CrossRef]
  17. Yang, Z.H.; Li, H. Does fiscal decentralization promote new urbanization? Econ. Issues 2021, 3, 32–40. [Google Scholar]
  18. Hu, L.N.; Xue, Y.; Sun, Q. The impact and mechanism of fiscal decentralization on new urbanization: A test of moderated mediation and threshold effects. Econ. Syst. Reform. 2020, 5, 144–150. [Google Scholar]
  19. Shen, C. Is Economic Performance the Most Critical Indicator for the Promotion of Government Officials? Empirical Research Based on 26 Years of Panel Data from Economic Special Zones. Chin. Public Admin. 2019, 12, 109–114. [Google Scholar]
  20. Li, X.; Liu, C.; Weng, X.; Zhou, L.-A. Target Setting in Tournaments: Theory and Evidence from China. Econ. J. 2019, 129, 2888–2915. [Google Scholar] [CrossRef]
  21. Woodworth, M.D.; Wallace, J.L. Seeing ghosts: Parsing China’s “ghost city” controversy. Urban Geogr. 2017, 38, 1270–1281. [Google Scholar] [CrossRef]
  22. Yang, Z.A.; Qiu, G.Q. Fiscal decentralization and new urbanization: Linear or inverted “U”? J. Yunnan Univ. Financ. Econ. 2019, 35, 3–11. [Google Scholar]
  23. Ding, J.H. Fiscal decentralization and new urbanization: An empirical study based on the perspective of public service supply. J. Shanghai Admin. Inst. 2020, 21, 86–96. [Google Scholar]
  24. Qian, Y.; Weingast, B.R. Federalism as a commitment to reserving market incentives. J. Econ. Perspect. 1997, 11, 83–92. [Google Scholar] [CrossRef]
  25. Zhou, L.A. Research on the promotion tournament model of Chinese local officials. Econ. Res. 2007, 7, 36–50. [Google Scholar]
  26. Liu, Y.; Yang, H.S.; Xu, X.X. Characteristics and influencing factors of China’s economic growth target system. World Econ. 2021, 44, 30–53. [Google Scholar]
  27. Chai, J.; Wu, H.; Hao, Y. Planned economic growth and controlled energy demand: How do regional growth targets affect energy consumption in China? Technol. Forecast. Soc. Chang. 2022, 185, 122068. [Google Scholar] [CrossRef]
  28. Xu, X.; Li, S.; Wang, X.; Bi, Q. Choosing China’s economic growth target: Putting an end to the “collapse theory” with high-quality development. World Econ. 2018, 41, 3–25. [Google Scholar]
  29. Liu, S.; Wang, X.; Huang, L. Does economic growth target drive investment? Theoretical analysis and empirical evidence based on a sample of prefecture-level cities from 2001 to 2016. Financ. Res. 2019, 8, 1–19. [Google Scholar]
  30. Huang, L.; Wang, Z.; Wang, X. The impact and mechanism of local economic growth targets on foreign direct investment. Int. Trade Econ. Explor. 2021, 37, 51–66. [Google Scholar]
  31. Liu, D.; Xu, C.; Yu, Y.; Rong, K.; Zhang, J. Economic growth target, distortion of public expenditure and business cycle in China. China Econ. Rev. 2020, 63, 101373. [Google Scholar] [CrossRef]
  32. Yu, Y.; Pan, Y. The mystery of China’s high-speed economic growth and the lagging upgrade of the service industry: An explanation based on the perspective of local economic growth targets. Econ. Res. J. 2019, 54, 150–165. [Google Scholar]
  33. Yu, Y.; Liu, D.; Gong, Y. Moderation is key: Local economic growth targets and total factor productivity. Manag. World 2019, 35, 26–42, 202. [Google Scholar]
  34. Wang, X.; Liu, S.; Huang, L. Economic growth pressure and regional innovation: Empirical evidence from economic growth target setting. China Econ. Q. 2021, 21, 1147–1166. [Google Scholar]
  35. Huang, L.; Wang, X.; Liu, S. Economic growth targets and radical urbanization: Evidence from nighttime light data. World Econ. 2021, 44, 97–122. [Google Scholar]
  36. Chai, J.; Hao, Y.; Wu, H.; Yang, Y. Do constraints created by economic growth targets benefit sustainable development? Evidence from China. Bus. Strateg. Environ. 2021, 30, 4188–4205. [Google Scholar] [CrossRef]
  37. Zhong, Q.; Wen, H.; Lee, C.C. How does economic growth target affect corporate environmental investment? Environ. Impact Assess. Rev. 2022, 95, 106799. [Google Scholar] [CrossRef]
  38. Wu, X.; Huang, Y.; Gao, J. Impact of industrial agglomeration on new-type urbanization: Evidence from Pearl River Delta urban agglomeration of China. Int. Rev. Econ. Financ. 2022, 77, 312–325. [Google Scholar] [CrossRef]
  39. Guo, J.; Yu, Z.; Ma, Z.; Xu, D.; Cao, S. What factors have driven urbanization in China? Environ. Dev. Sustain. 2022, 24, 6508–6526. [Google Scholar] [CrossRef]
  40. Li, S.J.; Xu, X.X. Target-led growth. Econ. Res. J. 2021, 21, 1571–1590. [Google Scholar]
  41. Chen, J.; Chen, X.; Hou, Q.; Hu, M. Haste doesn’t bring success: Top-down amplification of economic growth targets and enterprise overcapacity. J. Corp. Financ. 2021, 70, 102059. [Google Scholar] [CrossRef]
  42. Lin, J.F. The Costs of Urbanization in Developing Countries. Econ. Dev. Cult. Chang. 1982, 30, 625–648. [Google Scholar] [CrossRef]
  43. Lin, Y.E.; Wu, A.M. Urbanization, Land Development, and Land Financing: Evidence from Chinese Cities. J. Urban Aff. 2014, 36 (Suppl. S1), 354–368. [Google Scholar]
  44. Zhou, J.; Yu, X.; Jin, X.; Mao, N. Government Competition, Land Supply Structure and Semi-Urbanization in China. Land 2021, 10, 1371. [Google Scholar] [CrossRef]
  45. Zheng, H.; Wang, X.; Cao, S. The land finance model jeopardizes China’s sustainable development. Habitat Int. 2014, 44, 130–136. [Google Scholar] [CrossRef]
  46. Lin, G.C.S.; Yi, F. Urbanization of Capital or Capitalization on Urban Land? Land Development and Local Public Finance in Urbanizing China. Urban Geogr. 2011, 32, 50–79. [Google Scholar] [CrossRef]
  47. Lu, J.; Li, B.; Li, H. The influence of land finance and public service supply on peri-urbanization: Evidence from the counties in China. Habitat Int. 2019, 92, 102039. [Google Scholar] [CrossRef]
  48. Li, C.; Song, Y.; Chen, Y. Infrastructure Development and Urbanization in China. In China’s Urbanization and Socioeconomic Impact; Springer: Singapore, 2017; pp. 91–107. [Google Scholar]
  49. Chen, M.; Ye, C.; Lu, D.; Sui, Y.; Guo, S. Cognition and construction of the theoretical connotations of new urbanization with Chinese characteristics. J. Geogr. Sci. 2019, 29, 1681–1698. [Google Scholar] [CrossRef]
  50. Greenwood, J.; Jovanovic, B. Financial development, growth, and the distribution of income. J. Political Econ. 1990, 98, 1076–1107. [Google Scholar] [CrossRef]
  51. MacKinnon, D.P.; Krull, J.L.; Lockwood, C.M. Equivalence of the mediation, confounding and suppression effect. Prev. Sci. 2000, 1, 173–181. [Google Scholar] [CrossRef]
  52. Haans, R.F.J.; Pieters, C.; He, Z.L. Thinking about U: Theorizing and testing U- and inverted U-shaped relationships in strategy research. Strateg. Manag. J. 2016, 37, 1177–1195. [Google Scholar] [CrossRef]
  53. Gu, C. Urbanization: Processes and driving forces. Sci. China Earth Sci. 2019, 62, 1351–1360. [Google Scholar] [CrossRef]
Figure 1. Research framework.
Land 12 00916 g001
Figure 2. Development level of new-type urbanization.
Land 12 00916 g002
Figure 3. Moderating effect of land finance on public expenditure.
Land 12 00916 g003
Table 1. New urbanization development level index system.
TargetDimensionIndexDirection
New-type urbanization levelPopulation developmentUrbanization rate+
Unemployment rate
Number of students enrolled in higher education per 100,000 population+
Economic qualityPer GDP+
Share of secondary and tertiary industries in GDP+
Fixed asset investment per capita+
Social lifeUrban disposable income per capita+
Share of education spending in GDP+
Number of health technicians per 1000 population+
Number of beds in medical and health institutions per 1000 population+
Public transport vehicles per 10,000 people+
Public toilets per 10,000 people+
Library collection of 100 people+
Urban pension insurance coverage rate+
Urban unemployment insurance penetration rate+
Urban water access rate+
Urban gas penetration rate+
Space intensificationBuilt-up area+
Urban population density+
Paved road area per capita+
Ecological civilizationUrban wastewater treatment rate+
Green space per capita+
Greening coverage of built-up areas+
Pollution-free domestic waste disposal rate+
Industrial sulfur dioxide emissions
Income gapIncome ratio between urban and rural residents
Expenditure ratio of urban and rural residents
Table 2. Descriptive statistics of variables.
VariablesObsMeanStd. DevMinMax
nurb4800.2880.0990.0890.633
target4809.2272.0453.80015.000
pexp4201855.5231362.883101.3478981.460
r_price4801.45011.4140.000212.268
trade48028.82432.5730.711166.816
fc4805.7633.2340.60719.910
ppat4808.18911.5540.14574.383
inf48089.26851.0434.267222.542
ES4800.9520.4100.0252.461
wage4805.0182.7580.73917.818
Table 3. Impact of economic growth targets on the level of urbanization development.
VariablesNurb
(1)(2)(3)(4)
target0.0241 ***0.0207 ***0.0196 ***0.0191 ***
(7.848)(6.728)(6.607)(6.396)
target2−0.0011 ***−0.0009 ***−0.0009 ***−0.0008 ***
(−6.957)(−5.913)(−5.873)(−5.721)
lntrade 0.0056 **0.0075 ***0.0078 ***
(2.380)(3.317)(3.432)
fc −0.0029 ***−0.0032 ***−0.0032 ***
(−4.136)(−4.809)(−4.735)
ppat 0.0006 ***0.0007 ***
(5.416)(5.697)
lninf 0.0351 ***0.0351 ***
(5.220)(5.226)
ES 0.0064
(1.165)
lnwage 0.0175 *
(1.653)
_cons0.0417 ***0.0514 ***−0.0713 **−0.0802 ***
(2.589)(2.835)(−2.491)(−2.718)
Year FEYesYesYesYes
Province FEYesYesYesYes
N480480480480
R-sq0.96950.97110.97370.9739
t-statistics in parentheses. * p < 0.1, ** p < 0.05, *** p < 0.01.
Table 4. Mediating and moderating effects.
VariablesLnpexpNurbLnpexpNurb
(2)(3)(6)(7)
target0.0586 ***0.0129 ***0.1147 ***0.0202 ***
(3.605)(4.823)(5.784)(5.916)
target2−0.0017 **−0.0006 ***−0.0042 ***−0.0009 ***
(−2.151)(−4.758)(−4.428)(−5.854)
lnpexp 0.0523 *** 0.0436 ***
(6.215) (5.055)
c.target#c.r_price −0.1061 ***−0.0127 ***
(−4.930)(−3.456)
c.target2#c.r_price 0.0046 ***0.0005 ***
(4.863)(3.423)
r_price 0.6134 ***0.0731 ***
(4.996)(3.490)
_cons3.6731 ***−0.2848 ***3.4410 ***−0.2812 ***
(14.067)(−5.442)(13.398)(−5.433)
ControlsYesYesYesYes
Year FEYesYesYesYes
Province FEYesYesYesYes
N420420420420
R-sq0.98890.97680.98970.9777
t-statistics in parentheses. ** p < 0.05, *** p < 0.01.
Table 5. Impact of economic growth targets on the six dimensions of new urbanization.
VariablesPopuEcoSocSpaceEnviGap
target0.0254 ***0.0574 ***0.0056−0.00130.0282 **0.0504 ***
(4.065)(7.387)(1.505)(−0.846)(2.407)(3.769)
target2−0.0010 ***−0.0028 ***−0.0002 −0.0012 **−0.0019 ***
(−3.383)(−7.319)(−0.889) (−2.093)(−2.893)
_cons−0.1519 **−0.2014 ***−0.05220.2061 ***−0.1583−0.6052 ***
(−2.463)(−2.621)(−1.422)(2.876)(−1.369)(−4.580)
ControlsYesYesYesYesYesYes
Year FEYesYesYesYesYesYes
Province FEYesYesYesYesYesYes
N480480480480480480
R-sq0.81890.95790.88600.79730.90820.8555
t-statistics in parentheses. ** p < 0.05, *** p < 0.01.
Table 6. Pathway mechanism.
VariablesLninfPopuLnppatEcolnESEnviLnfcGap
(1)(2)(3)(4)(5)(6)(7)(8)
target0.0433 **0.0254 ***0.2669 ***0.0574 ***−0.0267 ***0.0284 **−0.0255 ***0.0552 ***
(2.028)(4.065)(4.637)(7.387)(−3.212)(2.432)(−3.099)(4.190)
target2−0.0017 *−0.0010 ***−0.0127 ***−0.0028 *** −0.0012 ** −0.0022 ***
(−1.666)(−3.383)(−4.491)(−7.319) (−2.149) (−3.328)
ppat−0.0052 ***−0.0018 *** 0.0041 ***−0.0156 ***−0.0025 ***−0.0088 ***−0.0042 ***
(−6.363)(−7.065) (13.063)(−9.587)(−5.105)(−5.286)(−7.503)
lninf 0.0587 ***0.6800 ***0.01910.10640.0661 **−0.04130.1912 ***
(4.182)(5.491)(1.091)(1.110)(2.511)(−0.441)(6.424)
lnES 0.1059 ***
(4.717)
lnES2 0.0269 ***
(4.583)
lnfc −0.0960 ***
(−3.276)
lnfc2 0.0323 ***
(3.068)
_cons3.3472 ***−0.1519 **−4.2384 ***−0.2014 ***−0.0325−0.05421.2503 ***−0.5981 ***
(24.343)(−2.463)(−7.912)(−2.621)(−0.088)(−0.484)(3.378)(−4.615)
ControlsYesYesYesYesYesYesYesYes
Year FEYesYesYesYesYesYesYesYes
Province FEYesYesYesYesYesYesYesYes
N480480480480480480480480
R-sq0.87380.81890.94460.95790.34740.90840.83160.8590
t-statistics in parentheses. * p < 0.1, ** p < 0.05, *** p < 0.01.
Table 7. Regional and time heterogeneity.
VariablesYear < 2014Year ≥ 2014EastMiddleWest
(1)(2)(3)(4)(5)
target0.0210 ***0.0016 *0.0068 ***0.0189 ***0.0146 ***
(2.806)(1.746)(4.878)(2.918)(4.006)
target2−0.0008 ** −0.0009 ***−0.0007 ***
(−2.439) (−2.660)(−4.396)
_cons−0.08630.13530.11350.1128 **−0.0579
(−1.652)(1.553)(1.454)(2.092)(−1.344)
ControlsYesYesYesYesYes
Year FEYesYesYesYesYes
Province FEYesYesYesYesYes
N270210176128176
R-sq0.94510.93920.97280.99070.9871
* t-statistics in parentheses. * p < 0.1, ** p < 0.05, *** p < 0.01.
Table 8. Path analysis of the eastern region.
VariablesPopuEcoSocSpaceEnviGap
target0.0362 **0.0609 ***0.0093 ***0.00350.0191 ***0.1029 ***
(2.100)(3.088)(4.907)(1.053)(4.179)(3.699)
target2−0.0020 **−0.0030 *** −0.0059 ***
(−2.271)(−3.010) (−4.120)
_cons0.19590.6845 ***−0.2510 **0.3042−0.1736−0.2062
(1.019)(3.115)(−2.365)(1.636)(−0.681)(−0.665)
ControlsYesYesYesYesYesYes
Year FEYesYesYesYesYesYes
Province FEYesYesYesYesYesYes
N176176176176176176
R-sq0.74830.96920.87610.84100.90100.7877
t-statistics in parentheses. * p < 0.1, ** p < 0.05, *** p < 0.01. * Since the results of the central and western regions are consistent with the overall results, they are not presented in the article.
Table 9. Regression with a single indicator as the dependent variable.
VariablesUrbLnt_ExpUrbLnt_ExpUrb
(1)(2)(3)(4)(5)
target2.0263 ***0.0586 ***1.1210 ***0.1147 ***2.3425 ***
(4.909)(3.605)(2.879)(5.784)(4.728)
target2−0.0851 ***−0.0017 **−0.0508 ***−0.0042 ***−0.1043 ***
(−4.203)(−2.151)(−2.656)(−4.428)(−4.454)
lnt_exp 7.2145 *** 5.7916 ***
(5.887) (4.634)
c.target#c.r_price −0.1061 ***−2.1056 ***
(−4.930)(−3.961)
c.target2#c.r_price 0.0046 ***0.0913 ***
(4.863)(3.928)
r_price 0.6134 ***12.1260 ***
(4.996)(3.996)
ControlsYesYesYesYesYes
Year FEYesYesYesYesYes
Province FEYesYesYesYesYes
_cons12.9710 ***3.6731 ***−14.5281 *3.4410 ***−14.0345 *
(3.179)(14.067)(−1.907)(13.398)(−1.872)
N480420420420420
R-sq0.93000.98890.93350.98970.9367
t-statistics in parentheses. * p < 0.1, ** p < 0.05, *** p < 0.01.
Table 10. Robustness test.
VariablesNurbPopuEcoSocSpaceEnviGap
L.target0.0247 ***0.0259 ***0.0847 ***0.0046−0.00210.0299 **0.0480 ***
(7.362)(3.507)(9.590)(1.085)(−1.461)(2.278)(3.154)
L.target2−0.0011 ***−0.0010 ***−0.0039 ***−0.0002 −0.0012 **−0.0015 **
(−6.712)(−2.802)(−9.166)(−0.775) (−1.976)(−2.109)
_cons−0.1172 ***−0.1306−0.4013 ***−0.1868 ***0.3691 ***0.6486 ***−1.2408 ***
(−2.844)(−1.442)(−3.702)(−3.555)(3.651)(4.028)(−6.636)
ControlsYesYesYesYesYesYesYes
Year FEYesYesYesYesYesYesYes
Province FEYesYesYesYesYesYesYes
N450450450450450450450
R-sq0.97520.80480.96020.89130.80020.90650.8675
t-statistics in parentheses. ** p < 0.05, *** p < 0.01.
Table 11. Endogeneity test.
VariablesNurbLnpexpNurb
(1)(2)(3)
target0.0376 ***0.1145 ***0.0313 ***
(7.760)(4.217)(6.500)
target2−0.0017 ***−0.0040 ***−0.0015 ***
(−7.463)(−3.010)(−6.689)
lnpexp 0.0440 ***
(4.776)
_cons0.02893.1011 ***−0.0830
(0.527)(9.468)(−1.358)
ControlsYesYesYes
Year FEYesYesYes
Province FEYesYesYes
N450420420
R-sq0.98550.99410.9878
t-statistics in parentheses. *** p < 0.01.
Disclaimer/Publisher’s Note: The statements, opinions and data contained in all publications are solely those of the individual author(s) and contributor(s) and not of MDPI and/or the editor(s). MDPI and/or the editor(s) disclaim responsibility for any injury to people or property resulting from any ideas, methods, instructions or products referred to in the content.

