
Sustainability Consequences of Making Land Change Decisions Based on Current Climatology in the Brazilian Cerrados


Department of Geography and the Environment, University of Texas at Austin, 305 E. 23rd St., A3100, Austin, TX 78712, USA
*
Author to whom correspondence should be addressed.
†
These authors contributed equally to this work.
Land 2023, 12(4), 914; https://doi.org/10.3390/land12040914
Submission received: 14 February 2023
/
Revised: 7 April 2023
/
Accepted: 14 April 2023
/
Published: 19 April 2023
(This article belongs to the Special Issue Global Savanna Variation in Form and Function: Theory & Practice)
Abstract
:Brazil is one of the largest suppliers of commodities in the world, partly due to the agricultural expansion in the Brazilian savannas (also known as Cerrado) that began in the 1970s. However, as areas with better soil and climate for agriculture become scarce, farmers have been advancing to the ecotone between the savanna and xeric shrubland, where precipitation is less reliable for rainfed agriculture. The expected increase in temperature will lead to extended drought periods, with negative consequences for surface and groundwater resources. This study explores the hazards associated with making land-use decisions based on current climatology in regions where projected increases in temperature and reductions in water availability are anticipated to pose significant challenges to rainfed agriculture in the Brazilian Cerrado biome. We modeled future farmland expansion and how that matches with future climate change predictions (2016–2046). According to our estimates, at least 129 thousand km2 of cropland and 418 thousand km2 of pastures will be added in places with projected higher annual temperatures ranging from 26–30 °C. This is equivalent to ~60% of the current agricultural areas, and a novel agro-climatology will emerge for the Cerrado biome. Therefore, we discuss the agro-environmental policies that are pushing and pulling farmland expansion in the Cerrado. For instance, payments for environmental services could support the conservation of native vegetation on private land in regions with the highest temperature increases and deforestation risks. Moreover, in areas with expected reduced water yields, such as in the western Cerrado, the protection of riparian vegetation and strict regulation of water use could mitigate future risks to agriculture.
1. Introduction
In Brazil, agricultural production has increased from 391 million tons in 1990 to more than 1105 million tons in 2020 [1]. This enormous growth in production can be predominantly attributed to the expansion of cropland into the Brazilian savannas, also known as the Cerrado. This biome is one of the most biodiverse in the world and is considered a priority for environmental conservation [2]. However, between 1990 and 2020, approximately 22 million hectares of native vegetation were converted to agriculture in this region [3]. This expansion makes the Cerrado the fastest-growing agricultural region in the world [4]. This growth has continued even during periods of economic instability in Brazil and the COVID-19 pandemic. Since the 2010s, Brazil has become the main soy-exporting region in the world, in large part due to technological advances and reliance on rainfed double-cropping due to a prolonged rainy season [5]. Capitalized farmers can reap two and sometimes three harvests through irrigation with center-pivot systems that rely on both surface water and groundwater [6]. This dependence on irrigation is often associated with local conflicts and water shortages [7,8], and periodic droughts pose a significant threat to farmers, increasing the likelihood of crop failure [9,10]. Given the variety of climatic conditions for agriculture, it is worth assessing whether this continuous agricultural expansion in the Cerrado will result in a scenario of increased risk for this capital-intensive type of farming.
Current farmland expansion in the Cerrado tends to occupy marginal environments that are vulnerable to rainfall shortages and where the temperature is projected to increase in the next few decades [11,12,13]. The expected increases in temperature will extend the drought periods in the Cerrado [10] and are likely to increase the demand for irrigation and put more pressure on surface and groundwater resources [13]. According to Brazil‘s National Water Agency [6], For instance, from 2000 to 2017, the areas irrigated by central pivots grew by 182% between 2000 and 2017, from 433,107 ha to 1,222,409 ha. Additionally, scholars believe that this substantial increase in irrigated areas is likely an underestimation of the actual total irrigated area [13]. Despite the potential risks associated with agricultural expansion in the Cerrado biome, there is limited evidence to suggest that this growth will fizzle in the next few decades. For instance, the Brazilian Ministry of Agriculture projects an increase in soy area of ~24% from 2022 to 2032, or 10 million ha of new croplands, of which 6.8 Mha will be in the Cerrado [14]. This growth will be largely concentrated in the ecotone between the Cerrado and the Caatinga. The Caatinga biome is a semi-arid environment that is characterized by periodic droughts, including some that are extreme, resulting in significant losses of rainfed crops in the past decade [15]. Concurrently, recent studies have modeled the impact of land clearing on water scarcity and other ecosystem services (e.g., water availability) in the Cerrado [13,16,17,18]. As global climate change projections of higher temperatures come to fruition [11], it is important to assess future land-use change for landscape management to avoid exposing farmers to unnecessary risks and creating environmental damage through land clearing that will bring little economic return [19].
This manuscript contributes to the growing body of literature on the potential hazards associated with expanding farmlands into areas that are unsuitable for rainfed agriculture in light of anticipated future changes in temperature and rainfall patterns. This study aims to address the following questions: In the Cerrado region, where will land-use changes occur in the future if farmers ignore climate change projections and make decisions based on the current climatology? Furthermore, if these areas are converted to other land uses, what proportion of the land will be affected by factors such as higher temperatures, lower precipitation, and water scarcity? In other words, we explore future land change dynamics related to climate projections for temperature and precipitation, from 2016 to 2046, with concerns about the future sustainability of agriculture in the region. To accomplish that, we first built a land change model (LCM) based on the weights of evidence (WoE) statistical approach with land cover data from 2001 to 2016. This LCM considers proximate causes (agriculture expansion, distance to roads), underlying causes (GDP, population density, protected areas), and environmental endowments (slope and suitability for annual crops) as part of a set of predictive variables. Additionally, we compare the LCM outputs with the available maps of projected temperature [20] and potential changes in water balance estimates. Finally, we provide a brief discussion of the current agro-environmental policies that are creating push-and-pull incentives for farmland expansion in the region and how these policies could be modified to account for the unsuitability of water-dependent agriculture under changing climate conditions. In this paper, our goal is to understand how future climate conditions will differ from current climate conditions and what corresponding impacts may arise for farmland expansion.
Study Area and Background
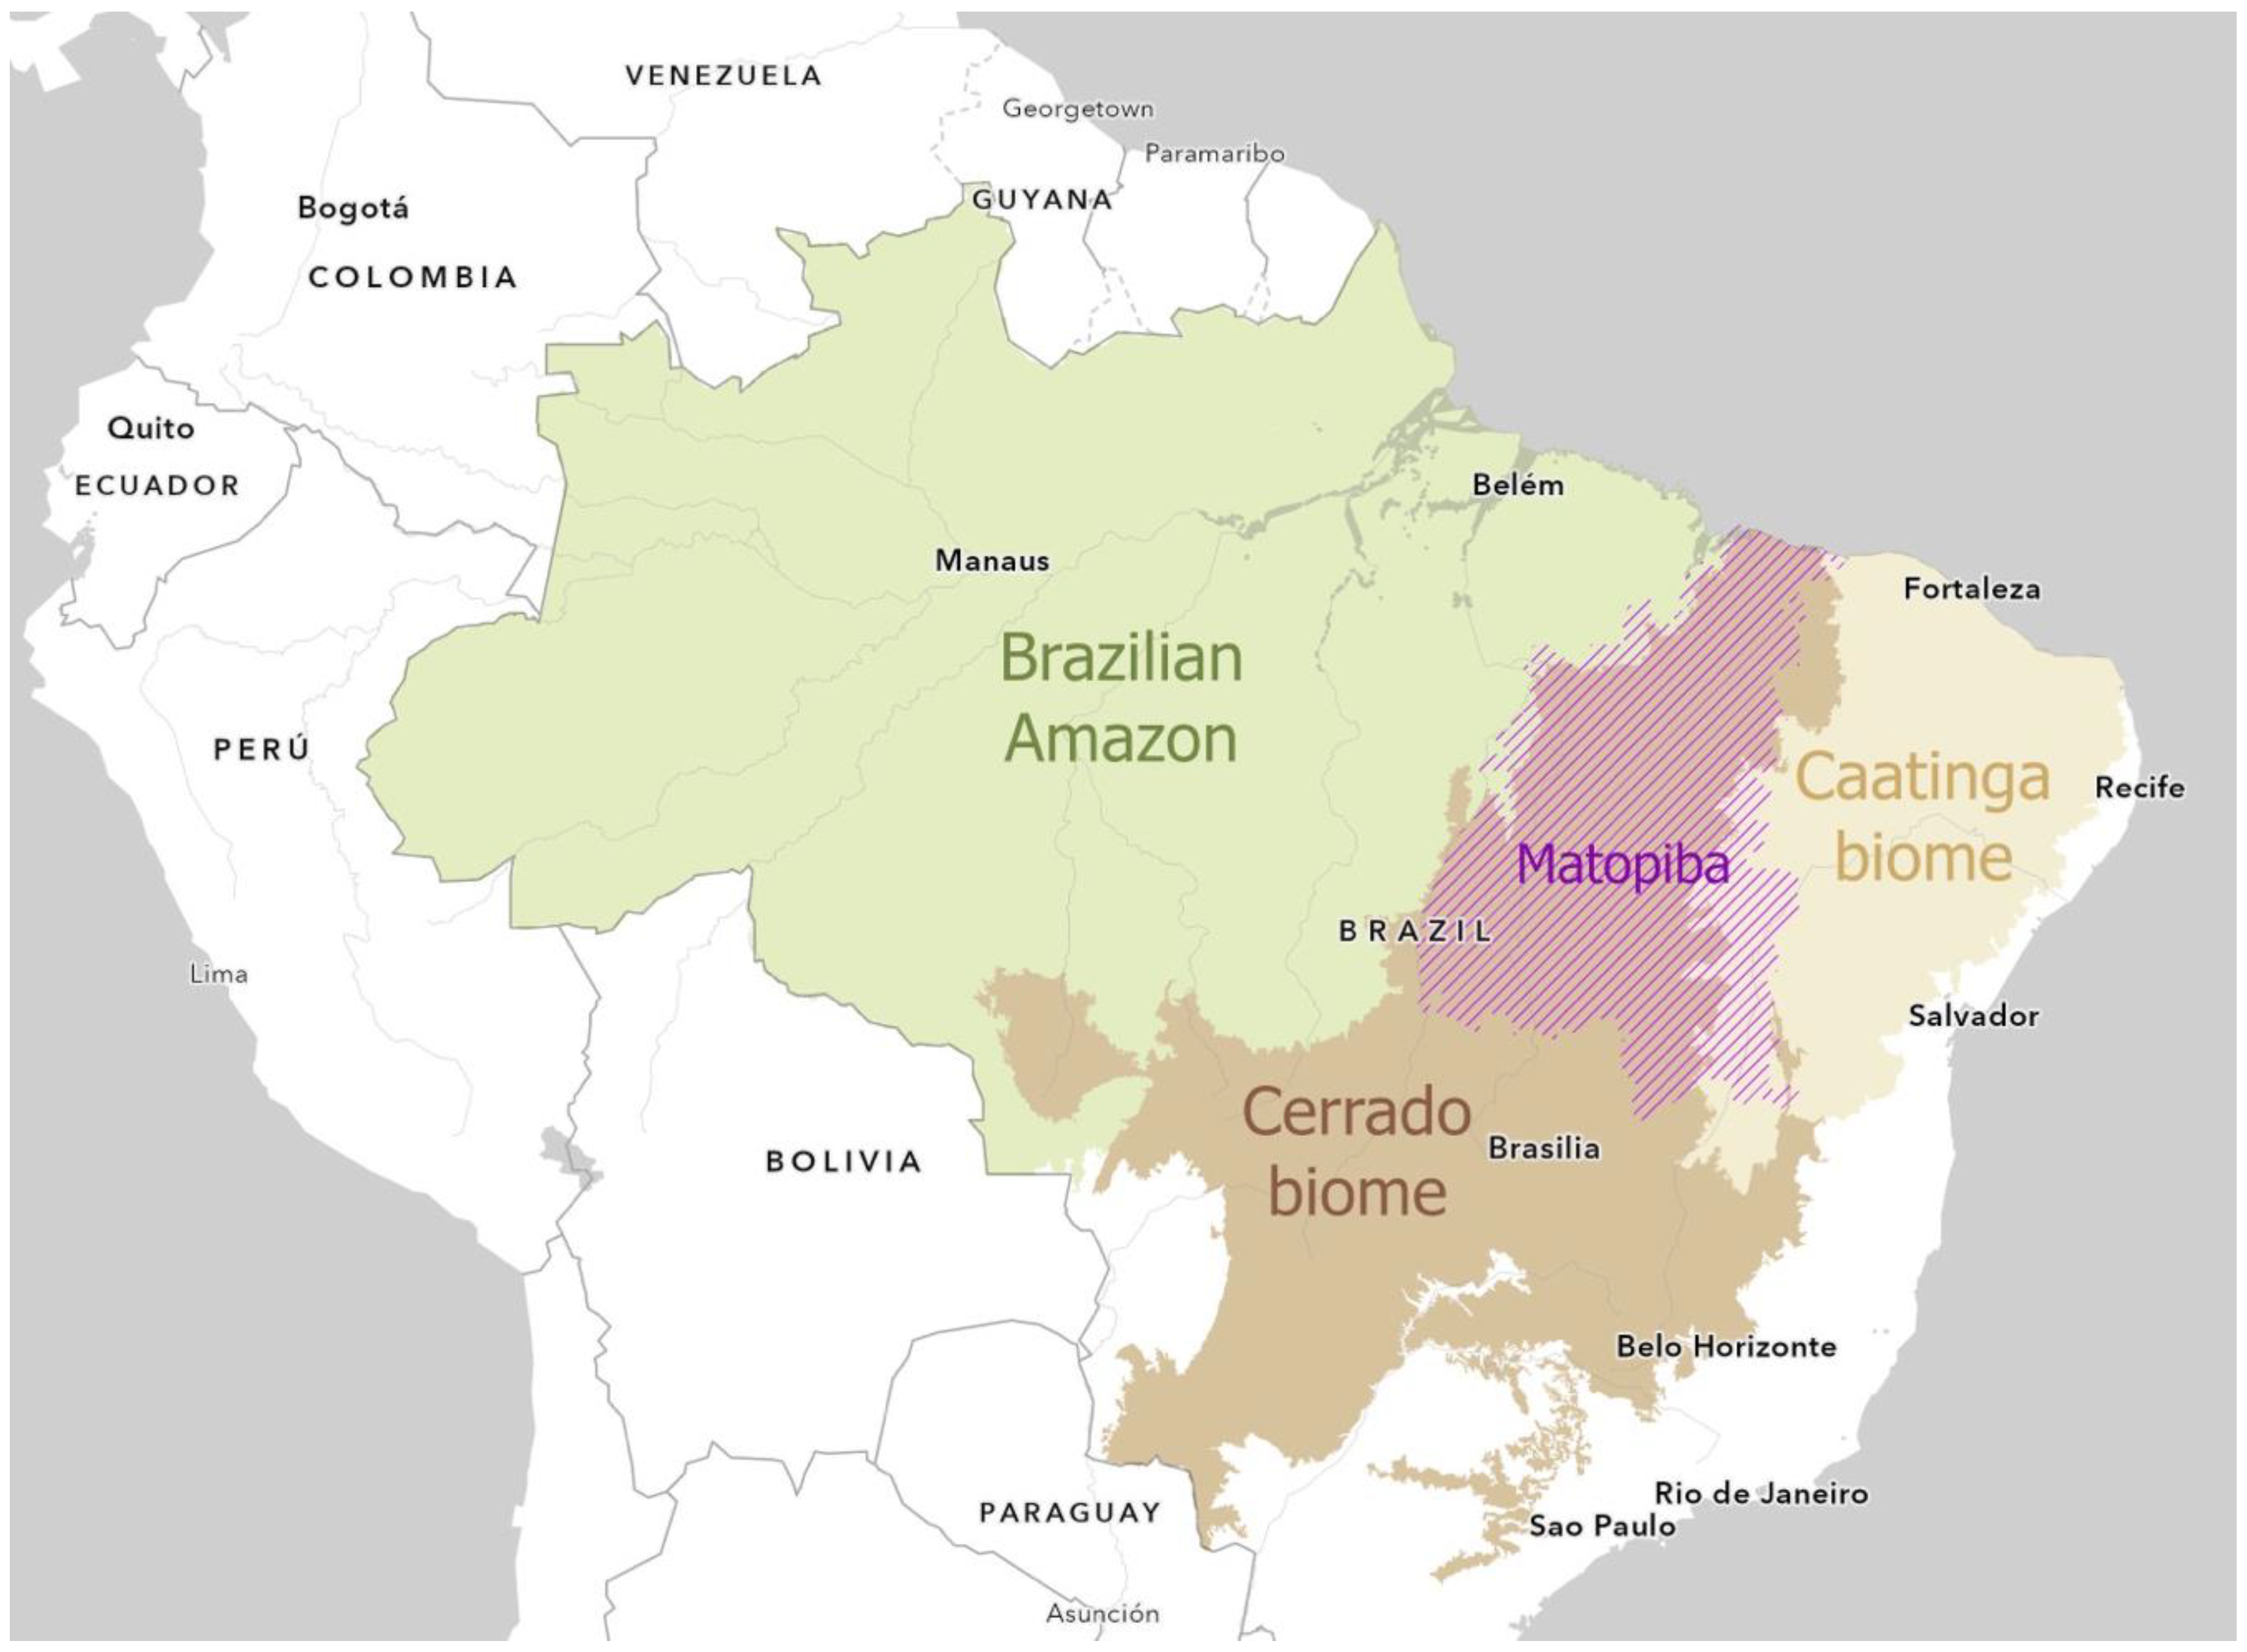
This research focuses on the Cerrado biome, an area of 2 million km2 and the second-largest biome in South America after Amazonia (Figure 1). The Cerrado is characterized by pronounced dry and wet seasons. Rainfed agriculture is practiced from September to April, and this rainy period concentrates 80% of the total annual precipitation that ranges from 900 mm at the semi-arid Caatinga ecotone to the east to 2000 mm in the Amazonian ecotone to the west [21]. Despite the low fertility and high acidity of its soils [22], since 1960 this biome has undergone an intensive occupation process and now accounts for more than half of the grain production in Brazil [23,24,25].
The modernization and expansion of Brazilian agriculture can be attributed to two main factors. The first is the public policy of the 1960s and 1970s, which focused on developing the country through import substitution. The second is the development of technologies for managing soil fertilization in the tropics, which allowed for the expansion of soy cultivation in the savannas of the Cerrado biome. The main technological innovation that enables annual crops in the Cerrado included the development of better-adapted seeds (more recently developed seeds include genetically modified organisms), new soil management techniques that included acidity correction using limestone, and the use of chemical fertilization with phosphorus, potassium, and nitrogen (Embrapa, 2020). To advance these technologies, the government invested heavily in agricultural research for tropical climates, through the creation of the Brazilian Agricultural Research Enterprise (Embrapa, in the Portuguese acronym), and several infrastructure investments aimed at occupying the hinterlands of Brazil. The introduction and expansion of soybean cultivation in the Cerrado symbolize the agricultural revolution of the 1970s and the power of capital in ‘creating natural conditions’ for farming [23]. The large-scale adoption of these technologies launched Brazil as a major supplier of agricultural commodities in the international market.
With most of the Cerrado closer to São Paulo, the major industrial and commercial hub in Brazil, already occupied by the early 1990s, farmland expansion advanced to the transition areas between the Cerrado and Amazonia, such as Mato Grosso state, and more recently to the Matopiba (an acronym for the states of Maranhão, Tocantins, Piauí, and Bahia) (Figure 1).
2. Methods
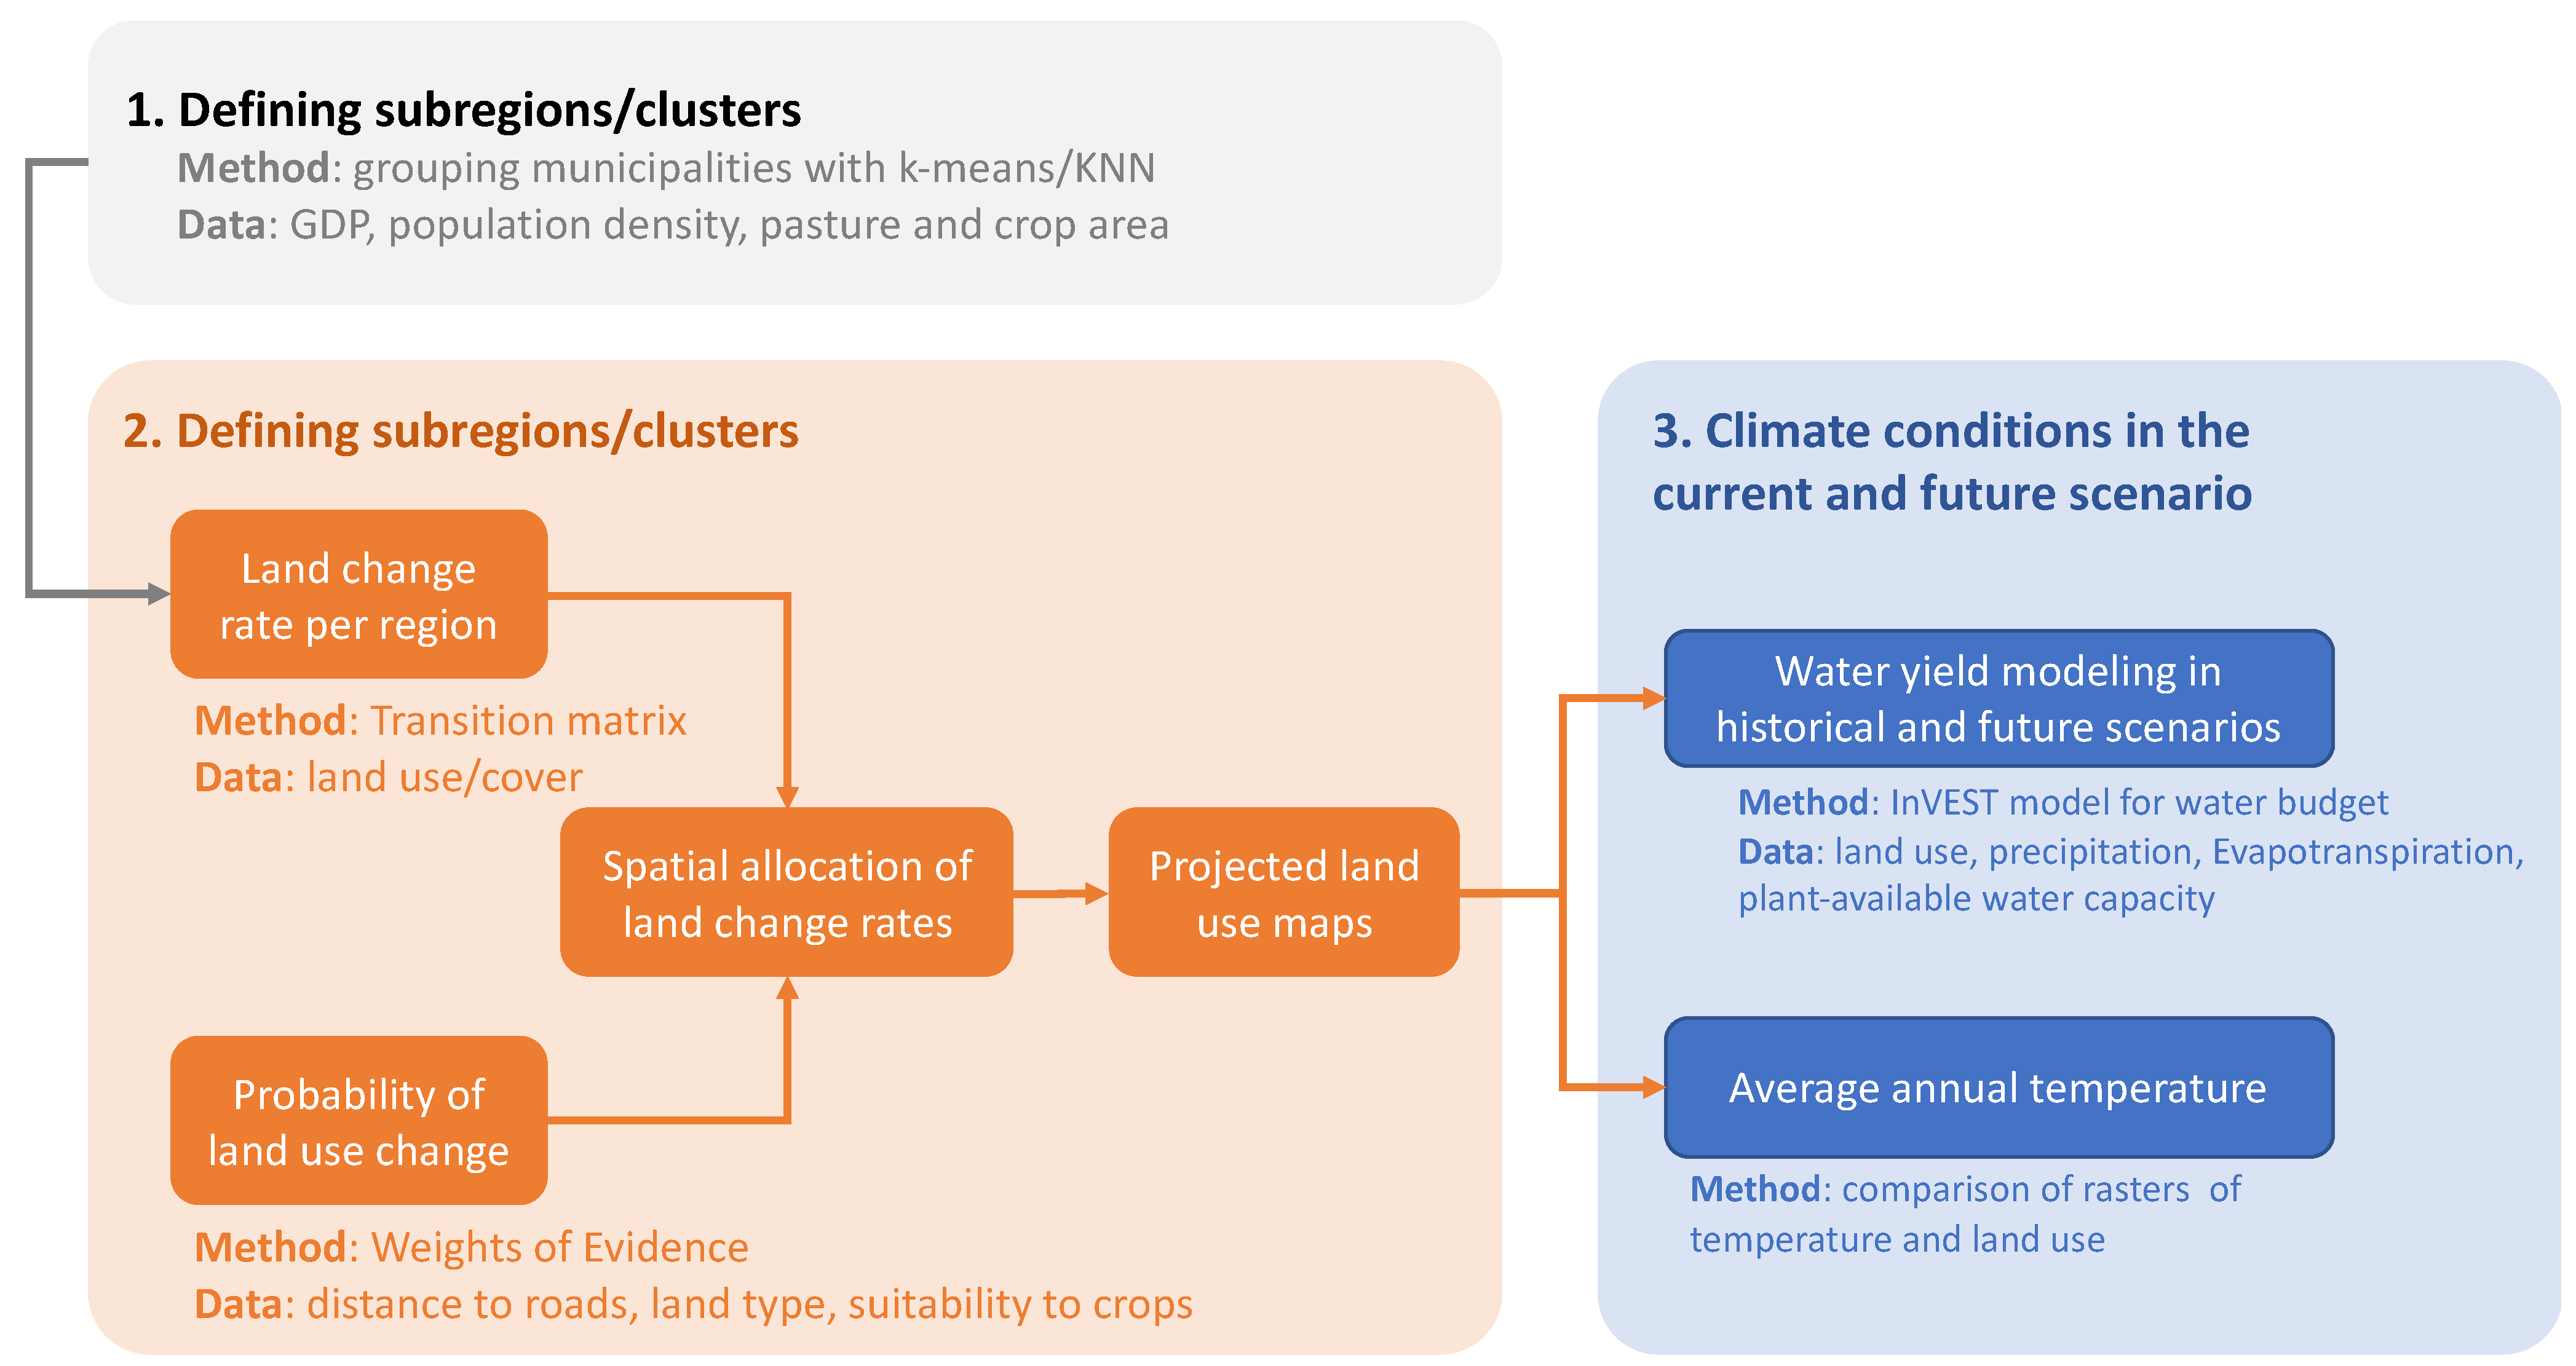
Our analytical framework combines land change modeling and ecosystem service (water yield) estimates for historical (1980–2010) and projected (2016–2046) scenarios of land use and climate conditions. First, we regionalize our analysis by defining clusters of municipalities with similar socioeconomic conditions (i.e., GDP and population density) to calculate the rates of land change for each sub-region. Second, we simulate future land use by allocating land change rates using the weight of evidence (WoE) method in the Dinamica EGO software [27]. Third, we used the InVEST software [28] to estimate changes in water yield distribution under current and future climate scenarios. We compare current and future temperature envelopes for agricultural areas and the impacts on water production. As seen in Figure 2, our analytical framework is based on Silva’s approach [29]. The following sections will provide details on the datasets used and the modeling approach for each step.
2.1. Datasets
2.1.1. Spatial Data
The land cover data were obtained from the Mapbiomas Project [3]. This project mapped annual changes in land cover since 1985 for all Brazilian territories using Landsat images with 30 m resolution. Based on a sample of 75,000 pixel locations, the Mapbiomas dataset accuracy ranges from 73% to 95% in the biomes of South America [3]. We aggregated the seventeen classes of land use and cover in Mapbiomas into five more general classes: native vegetation, pastureland, cropland, water, and others (a combination of urban, mangrove, non-observed, and other). For the “native vegetation” class, we grouped the original classes of native forest and native non-forest vegetation. For the “pasture” class, we grouped the classes pasture and agricultural mosaic (most of this latter classification is natural pasture according to the Mapbiomas’ experts (personal communication). The “crops” class is the equivalent homonym in Mapbiomas. The class “other” included urban areas, mining areas, and other non-vegetated land covers. The land change modeling explained in Section 2.3 below combined the land cover maps with other explanatory variables: distance to roads, protected areas, slope, and suitability for annual crops. The polygons delineating the boundaries of the 1388 municipalities within the Cerrado and the spatial extent delineation of the Cerrado biome were obtained from the Brazilian Institute of Geography and Statistics [30,31]. All geographical information was processed in ArcGIS and R software, using the South American Coordinate Reference System SIRGAS 2000 datum. Table 1 summarizes the spatially explicit data.
2.1.2. Climate Scenarios Data
Historical and future climatic data were provided by the TerraClimate Project [20] and include the average annual temperature (Celsius), annual potential evapotranspiration (mm), and annual precipitation (mm). These were produced using high-resolution models from the WorldClim dataset. The historical average values of climate (temperature, evapotranspiration, and precipitation) data are from the 1981–2010 period. Meanwhile, the projections are between 2016 and 2046 for the warming scenarios of 2 °C and 4 °C. The +2 °C results of our analysis can be interpreted as the best-case scenario for the region, based on the Representative Concentration Pathways (RCP 2.6) that require the world to start reducing greenhouse gases (GHG) emissions by 2020 and achieve zero emissions by 2100 [33]. Still, RCP2.6 assumes a constant growth emission in land use, similar to our assumption of constant land-use transitions. Meanwhile, the scenario of +4 °C can be associated with the extreme scenario of inequality described in the IPCC report. The TerraClimate project combined multiple general circulation models (GCMs) to create a high-resolution dataset that is more representative of observed climate conditions than any single GCM. TerraClimate relies mostly on the Coupled Model Intercomparison Project Phase 5 (CMIP5) due to the availability of data for the relevant period (1958–2015) and their ability to capture key climate variables of interest, such as temperature and precipitation. Figures S2 and S3 in the Supplementary Materials depict the climate variables’ patterns in the Cerrado.
2.2. Subregions for Land Change Modeling
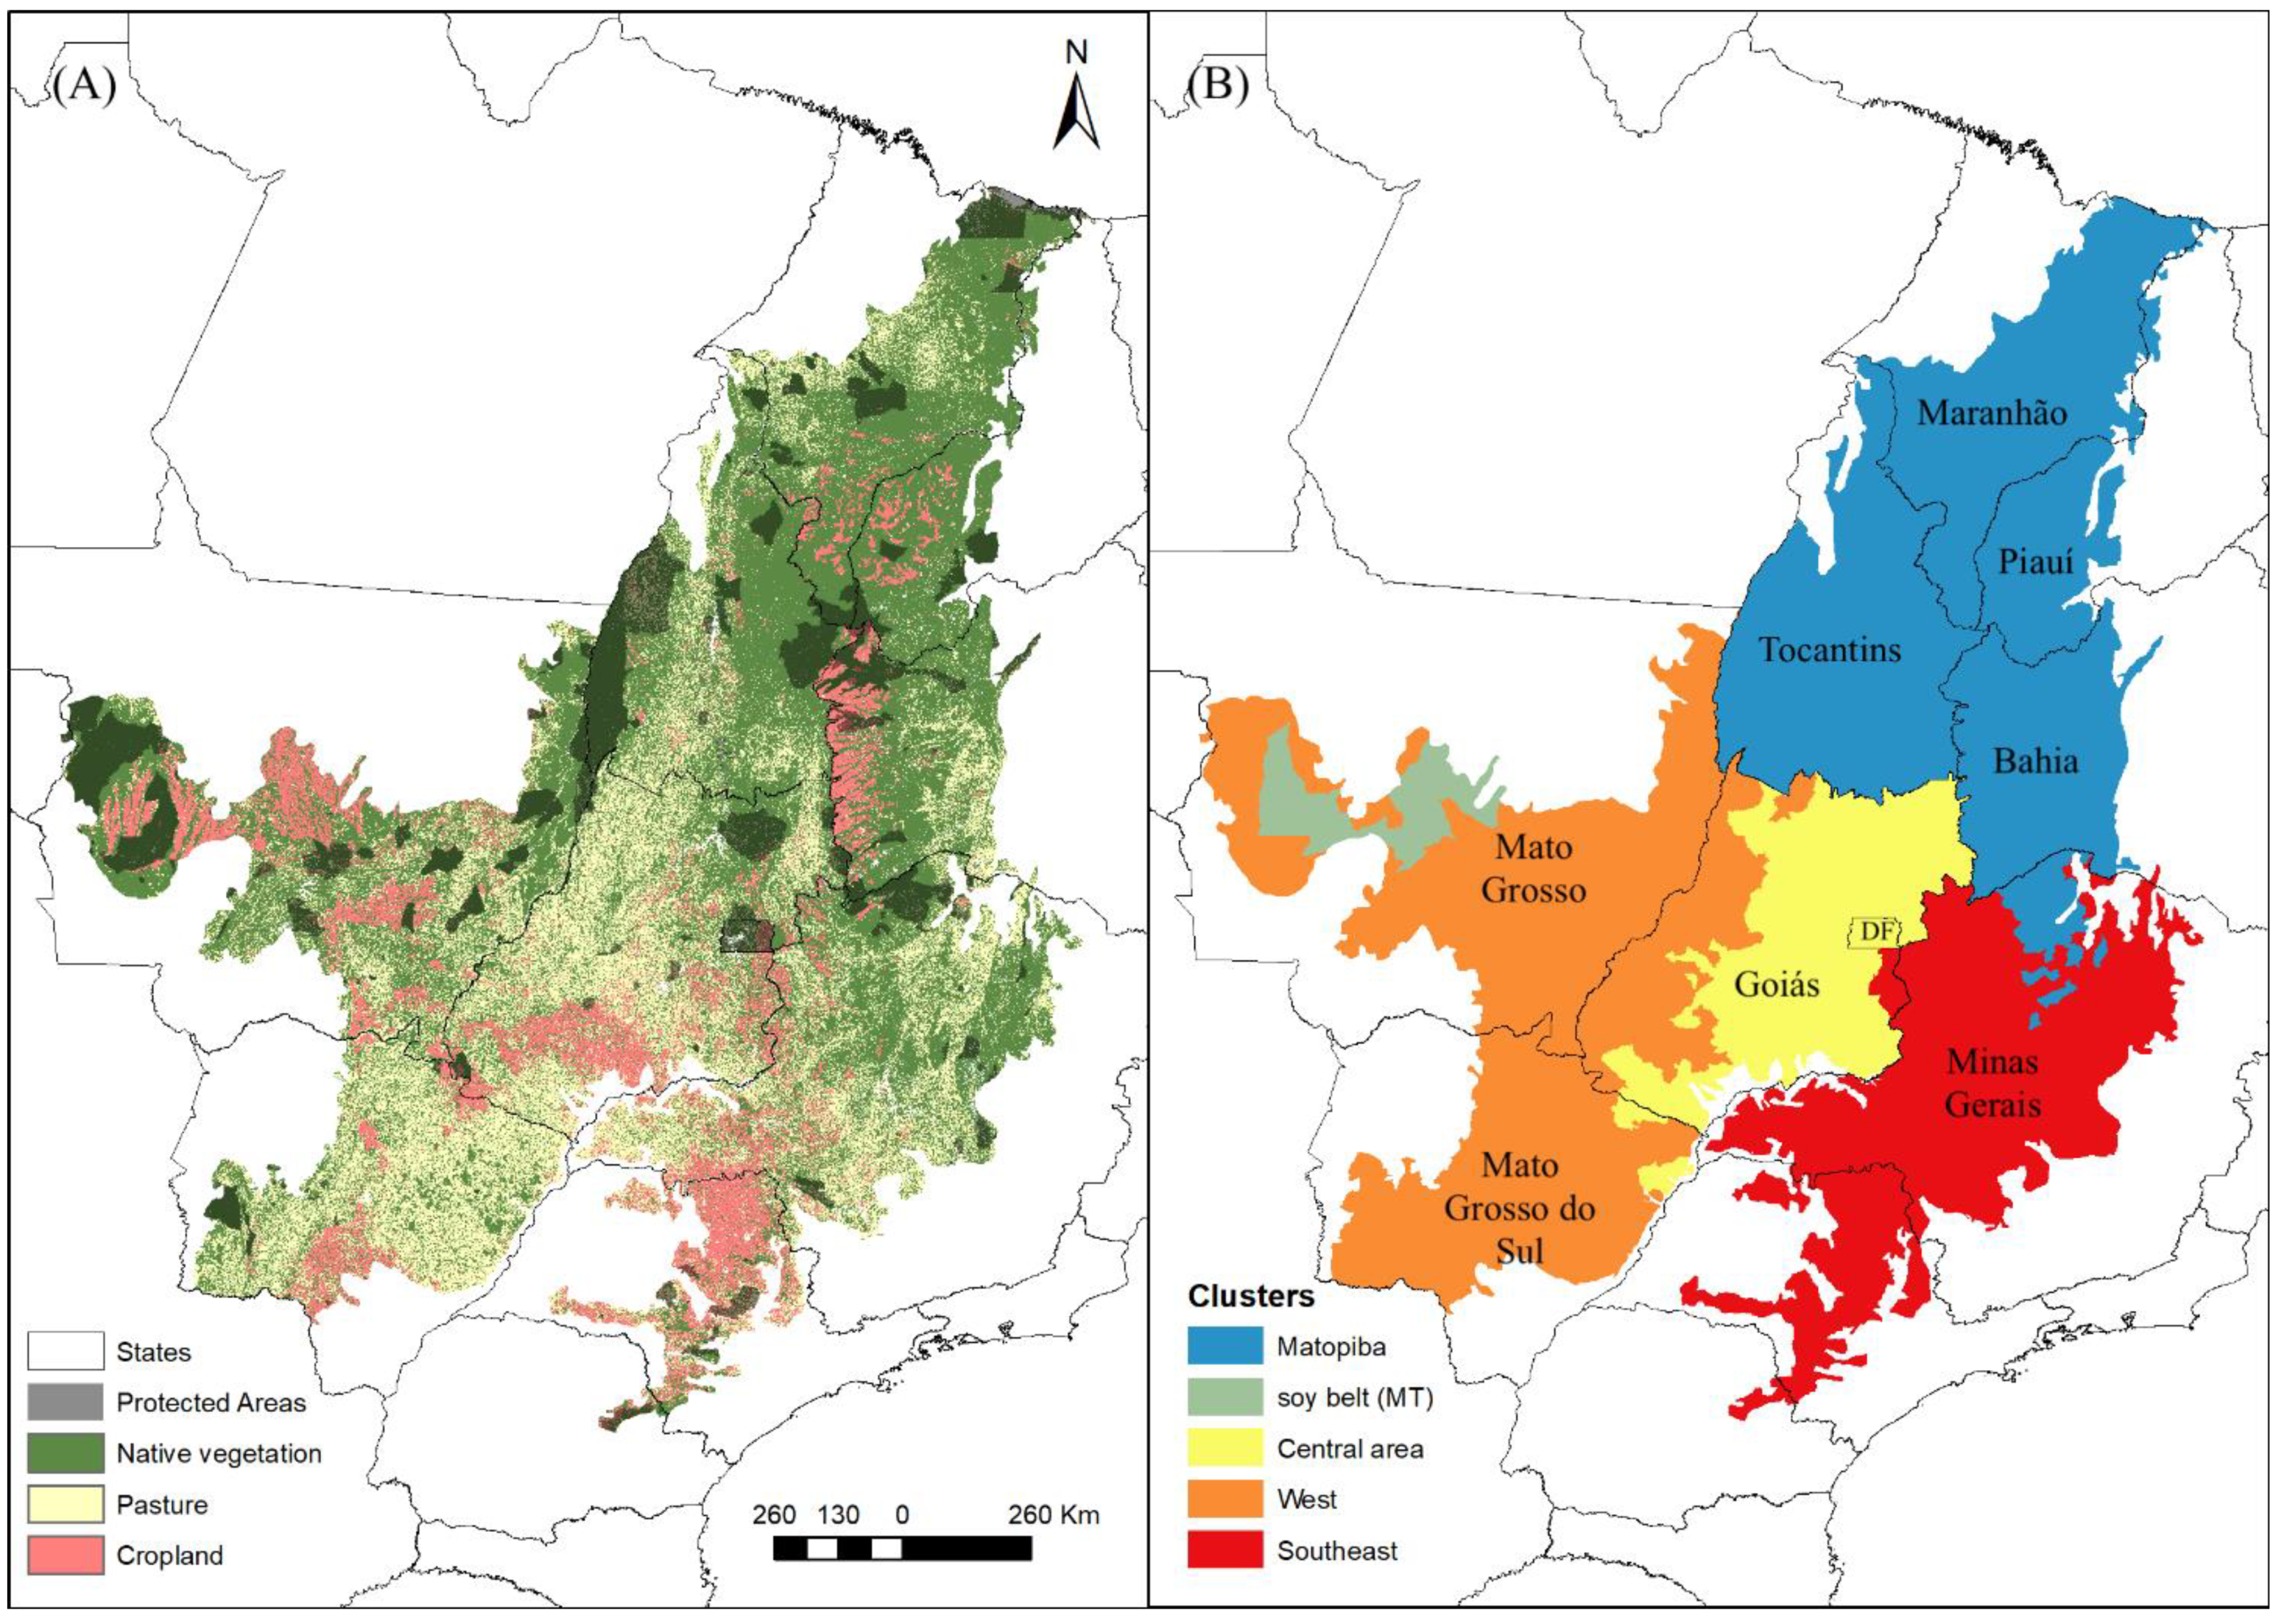
The Cerrado biome is spatially heterogeneous due to its extension and varied socioeconomic dynamics and edaphic-climatic conditions. Therefore, we modeled land change for each subregion separately to estimate the effects of different local contexts underlying the causes of land change. This partitioning increased accuracy when compared to the Cerrado-wide model (Figure S1, Tables S2 and S3 in the Supplementary Materials). Based on empirical observations, we identified the subregions (Figure 3):
- Southeast Cerrado: This is the older agricultural region mainly occupied by sugarcane and pastures with a strong connection to São Paulo and the Brazilian southeast region, which is the most economically developed region of Brazil.
- Western Cerrado (i.e., Mato Grosso State): The expanding agricultural frontier region since 1980, with high clearing rates of denser Cerrado vegetation to pasturelands and increasing cropland conversion over pastures. Just north of this region, but outside our study area, is the Amazon rainforest.
- Matopiba (an acronym for the states of Maranhão, Tocantins, Piauí, and Bahia): This is the northeastern portion of the Cerrado, in the ecotone with the semi-arid Caatinga region; it is a recent agricultural frontier, with the increasing conversion of native vegetation to cropland since the 2000s and infrastructure to export commodities through ports in northeastern Brazil.
- Central Cerrado: This region is mostly pastureland and does not have pronounced agricultural land uses yet.
- The Brazilian soy belt: This region in the state of Mato Grosso contains most of the Brazilian soy production and the presence of international traders in the ecotone with the Amazon rainforest.
These regions differ in terms of their occupation processes, edaphic–climatic conditions, population density, urbanization level, GDP composition, and landscape dynamics. We defined the geographical limits of these clusters by applying a k-means analysis in ArcGIS software. The k-means analysis considered the GDP, agricultural land (areas of pasture and crop), and population density (persons/km2), as described in Table 2. We applied a spatial weight matrix using the K-nearest neighbor (KNN) for the resulting groups to be spatially proximal (or contiguous). The KNN approach is a spatial weight matrix that defines relationships based on proximity; it selects the K-nearest points to each location and defines their relationship based on distance, under the assumption of spatial autocorrelation. Preliminary clustering analyses indicated seven optimal groupings for the municipalities; however, three of them were individual municipalities that we decided to merge with adjacent subregions, yielding the five subregions used in the land modeling. For instance, Brasilia (Brazil’s capital) was classified as a unique subregion, probably due to its high GDP, but it is located in the Central region. Figure 3 shows the final clusters of land change modeling. These subregions are important to better contextualize the results and correlate the risks of future climate change with regional economic characteristics.
We ran the Dinamica EGO land change model using three different groupings for comparison—for each municipality, for each subregion, and the Cerrado as a whole. The accuracy between the actual 2016 land cover and its modeled output (Section 2.3) is superior when each subregion is modeled separately within Dinamica EGO. Therefore, we opted to report the results at this scale. In Supplementary Materials Tables S2 and S3, we show the results using the other two groupings. This multi-scale comparison validates our assumption that regional clusters are the ideal scale of analysis for this application because they better capture the regional specificities of land change.
2.3. Land Change Modeling
Based on the land change trends and bioeconomic variables (Table 1 and Table 2), we projected the annual land conversion for the 2016–2046 period using the weight of evidence method (WoE) in the software Dinamica EGO. This timeframe was chosen because it matches the TerraClimate projection estimates for the scenario of a 2 °C temperature increase. The model simulates land cover changes with spatially explicit outputs using a two-pronged approach: (i) The rates of annual agricultural expansion for pasture, cropland, and vegetation regrowth are calculated according to a transition matrix for the baseline period (i.e., 2001 to 2016); (ii) land change by category is allocated spatially by using the estimates based on weights of evidence [36]. In addition to the land change rates for a business as usual (BAU) scenario (period of 2001–2016), we calculated an alternative scenario based on the higher land clearing rates of 2019–2022. This scenario represents an extreme case where crops and pasturelands grow well above average for the whole period. The transition matrix and rates of annual agricultural expansion and regrowth are based on the land use/cover map from the Mapbiomas project [3]. The WoE for spatial allocation considers the distance to agricultural areas and other independent variables (e.g., distance to roads, protected areas, slope, and suitability for crops). Section 2.1 details the model’s variables, and Figure 2 summarizes the overall modeling approach.
WoE is a Bayesian statistical inference method that calculates probabilities of land change conditional on the presence or absence of a certain factor (e.g., soil type) [37]. The WoE breaks continuous variables into binary categories (e.g., distance to roads is converted into a series of buffer distance bins). In addition to predicting the baseline, Dinamica EGO projects the future probability of land change based on the baseline trajectory. Furthermore, it also calculates the goodness of fitness statistics to validate the models built. This software assumes stationarity, meaning that the underlying processes that drove land change in the baseline period do not change over time and that the relationship between the variables remains unchanged in the future.
To obtain the future landscape patterns of land use as close as possible to the observed land cover map, Dinamica EGO has a toolbox that changes the patch size by expanding or contracting land conversion to avoid the so-called salt-and-pepper pattern. This toolbox groups land change into contiguous cells, resulting in landscapes and fragmentation patterns that are more realistic [27]. According to the National Institute of Space Research’s deforestation data [38], the average patch size of vegetation loss in the Cerrado is 0.16 km2, and the standard deviation is ~0.90 km2. To select which variables to include in the model, we applied Cramer’s V test to assess the spatial correlation between the variables. All variables showed a low correlation among themselves (<0.4 in all cases), an indication that no redundant variable was used to explain the land change (see the results in the Supplementary Materials).
Finally, validation was performed for the 2001–2016 period using a fuzzy similarity index [39], meaning a comparison of the land modeled with the actual land cover. The fuzzy similarity calculates a score from 0 to 1 that represents how closely the neighborhood (i.e., group of contiguous cells) around each cell on the two maps match, instead of accounting for the exact match pixel-by-pixel. Spatial models are assessed in the context of neighborhoods because even maps without an exact match on a pixel-by-pixel basis can show a similar pattern in comparison to the observed land cover if the prediction is within the neighborhood of the actual land cover. Dinamica EGO validation uses multiple window sizes to compare neighboring values by checking the location of the expected pixel category [40]. A similarity index of one means a perfect center cell match between the actual land use map and the modeled map. In this study, we compared the minimum values of similarity in the windows of 1 × 1, 3 × 3, 5 × 5, 7 × 7, 9 × 9, 11 × 11, and 13 × 13.
2.4. Water Yield Modeling
We estimated the current and future water yield in the software InVEST [28], based on the IPCC climate projections available in the TerraClimate Project [20]. The model calculates the amount of water yield for each watershed based on the inflows (precipitation) and outflows (evapotranspiration and infiltration into the soil) of the water budget. The InVEST water yield model does not consider groundwater inflows and only calculates surface flow. We calculated the water yield for the historical scenario of 1981–2010 and for the scenarios of a 2 °C and 4 °C temperature increase. To estimate historical and future water yield, we used the respective input rasters for precipitation and evapotranspiration (i.e., historical and projected), while holding everything else constant (i.e., planting available water content (PAWC), elevation (DEM), and root restricting depth). The difference between the future and current climates is represented by the predicted change in water yield. Table 3 summarizes the input variables of the water yield model.
3. Results
3.1. Past and Future Land Use Change
The area of native vegetation and pasture decreased from 2001 to 2016, while the cropland area doubled in size (Table 4). The land cover transition matrix (Table 4) indicates that 38% (86,388 km2) of the cropland in 2016 was pasture in 2001, and 13% (30,634 km2) was a result of a direct change from native vegetation. Meanwhile, most pastureland expansions occurred over native vegetation during the same period (84,193 km2). The main trends for all subregions are vegetation regrowth on pasturelands and land clearing of native vegetation for pasture, as well as a pasture-to-crops land change in the soy belt. The results of regrowth are consistent with increasing land abandonment/regrowth as reported in the literature [45]. In short, the expansion of cropland over pasture is the largest change between land uses, although native vegetation clearing still occurs mainly for pasture.
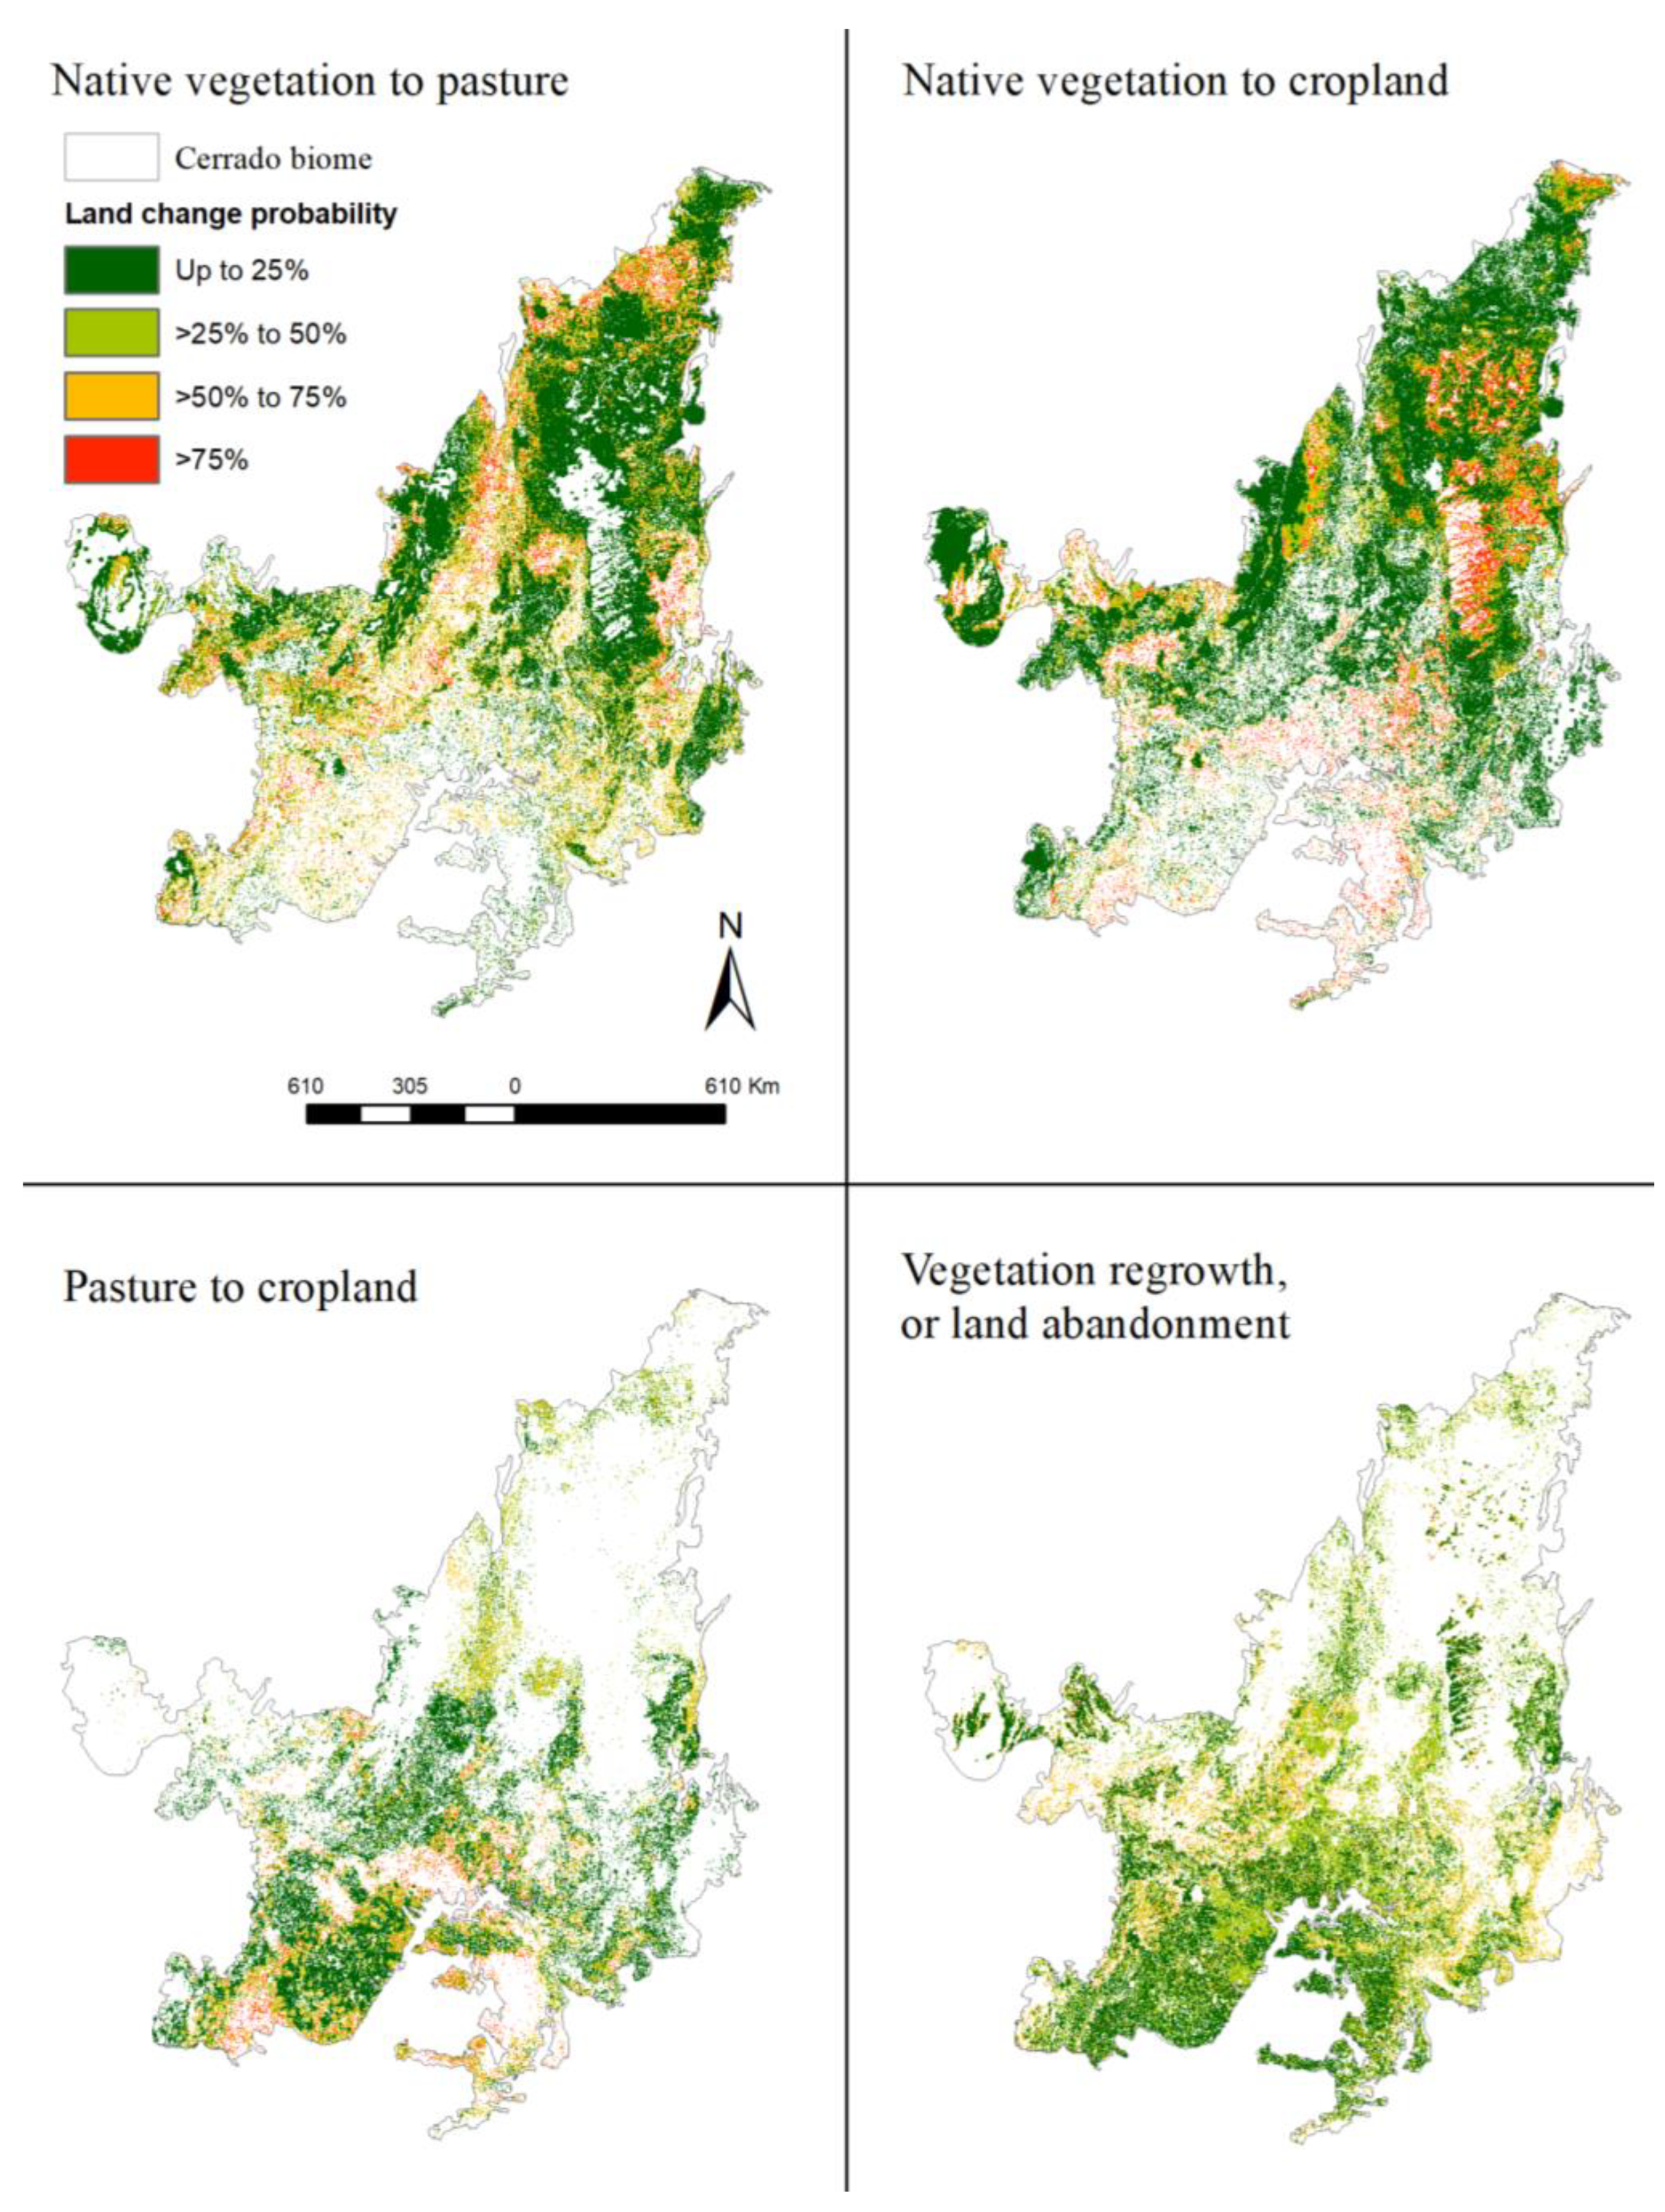
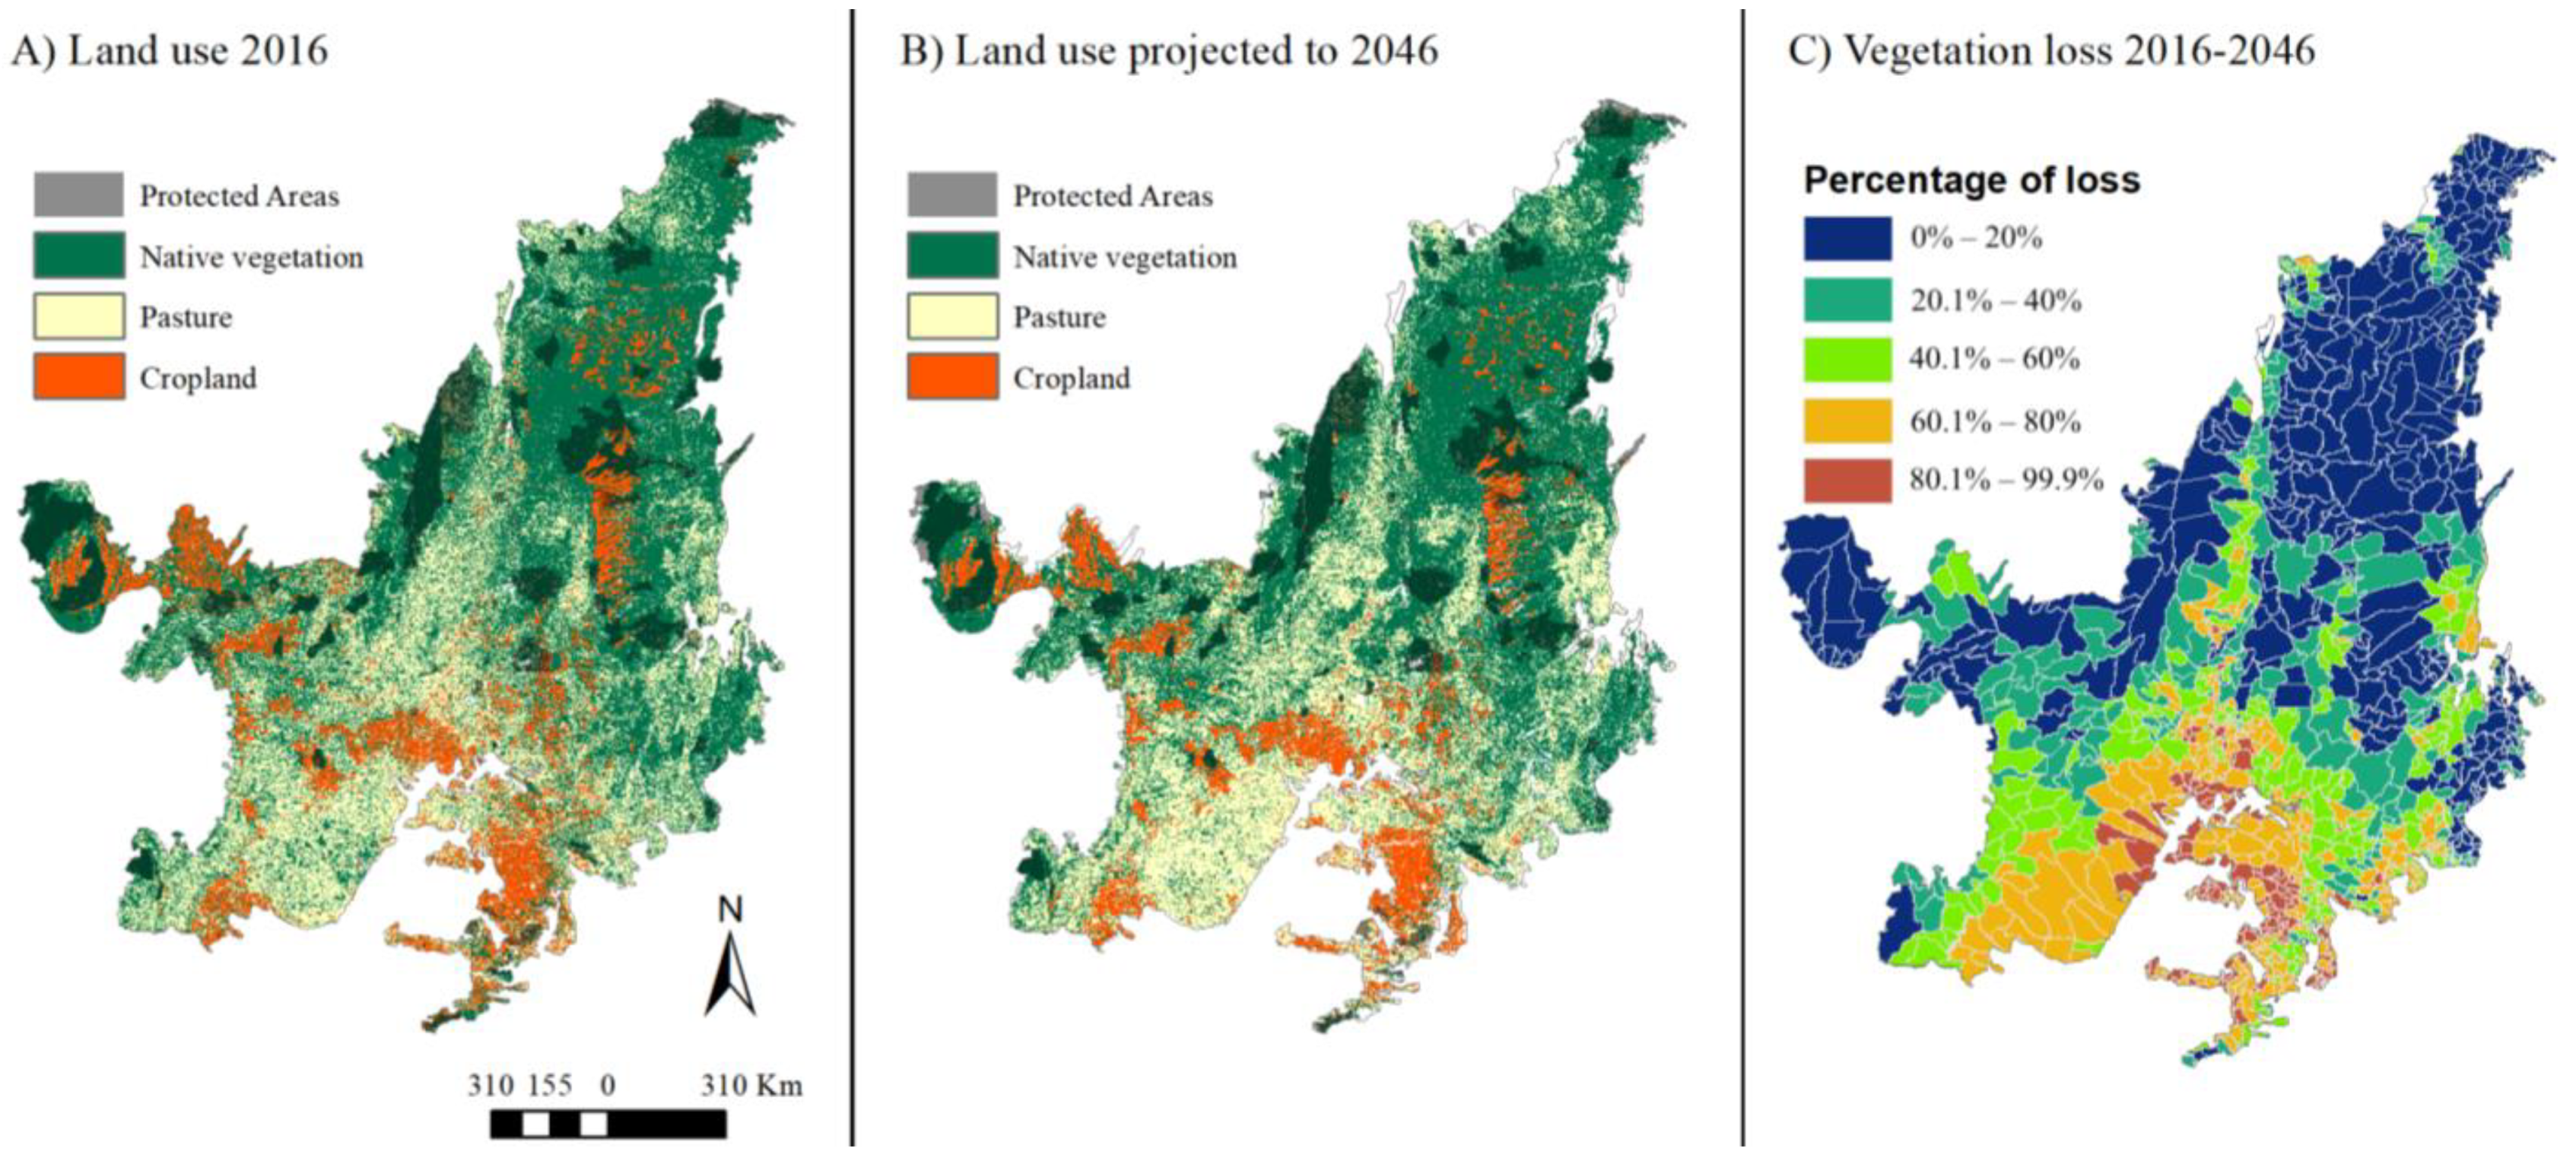
As for future projections of land change, our model estimated 74 thousand km2 of native vegetation loss and 181 thousand km2 of crop area increases from 2016 to 2046 (Table 5). The model indicated a pasture decrease of 108 thousand km2 because a portion of land clearing will regrow back to secondary vegetation and pasture-to-crop conversion will maintain its historical trend. We estimate an average addition of ~10 thousand km2 per year of new croplands, a number very similar to the official government projection of ~11 thousand km2 per year for soybeans and sugar cane in the Cerrado [46]. We ran an alternative scenario that uses the larger conversion rates observed during 2019–2022 to project land change into the future and obtained similar results: ~2000 km2 more vegetation loss than business as usual, and an additional ~3000 km2 of pastures up to 2046. The probability map of land change for 2046 indicates that cropland expansion will be concentrated in the north (i.e., the Matopiba region), while regrowth and pasture-to-crop conversion will occur in the southern parts of the biome (Figure 4 and Figure 5).
The models performed relatively well according to the error assessment for the 2001–2016 period. Our model predicts 1.17 million km2 of agricultural area (crops and pasture) against the observed one million thousand km2. The modeled landscape has 87% similarity with the land use of 2016 (Figure S1) in a window of 7 × 7 pixels, according to the maximum fuzzy similarity index. This level of accuracy gets lower or higher depending on the window size. The land change transition probability matrix used by Dinamica Ego to forecast future change can be found in Table S1 in the Supplementary Materials.
3.2. Future Temperature and Land Use Change
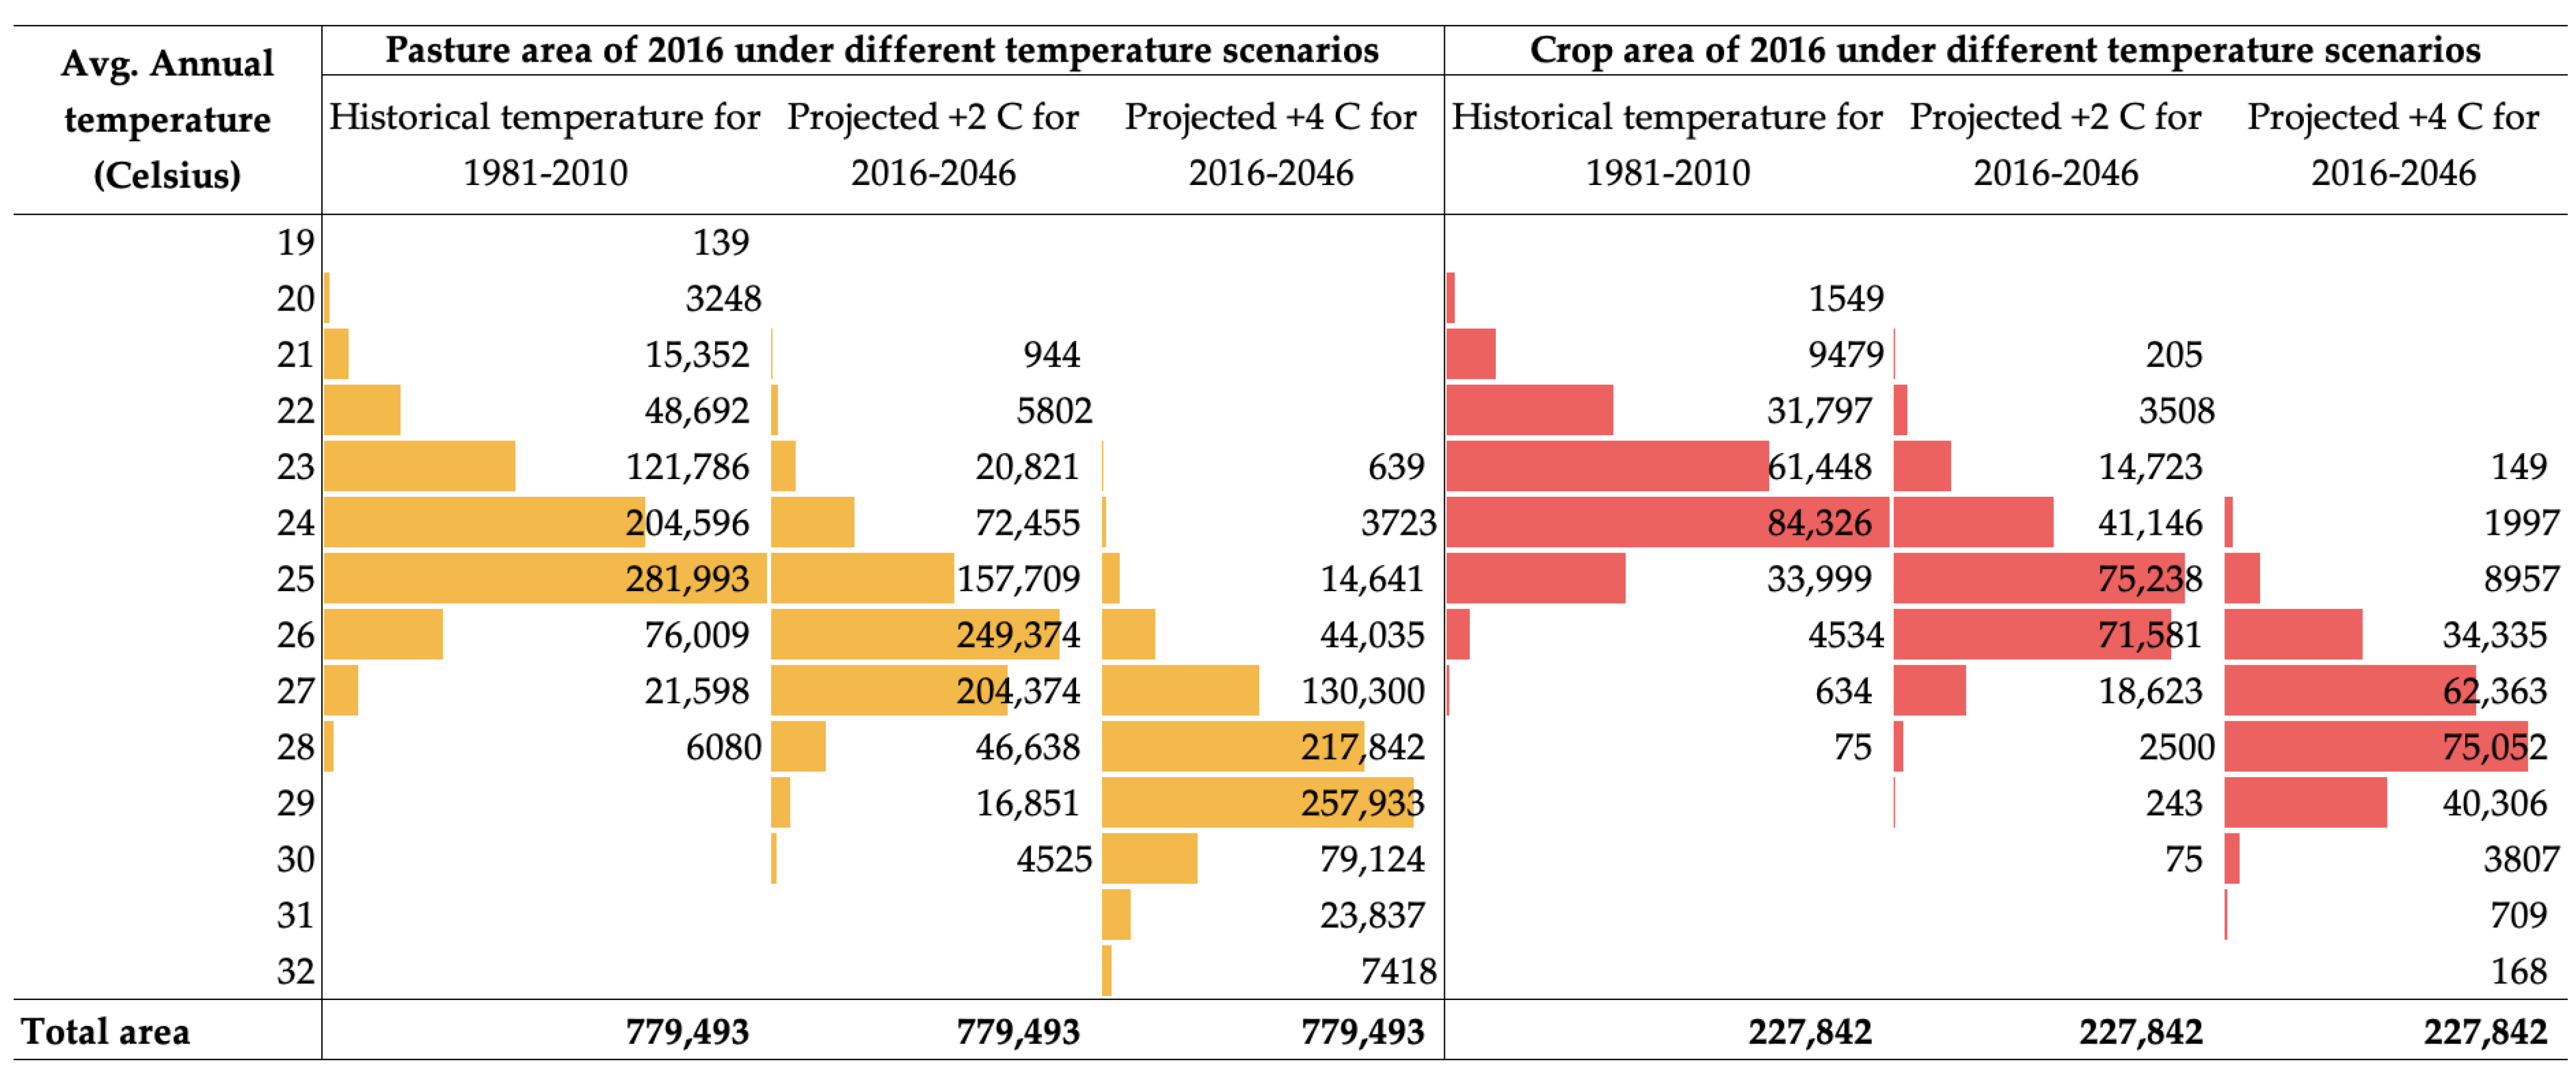
The projected increase in temperature by 2046 corresponds to the zones of higher probability of land change for pasture and cropland, both in the northern Cerrado biome (Figure 4). Figure 6 compares the current distribution of pasture areas and croplands over intervals of current temperature and the future projection of climatology in the baseline year of 2016. In the conservative scenario, we estimated an additional 129 thousand km2 of crops and ~418 thousand km2 of pastures located in places with two degrees Celsius of warming and average annual temperatures ranging from 26–30 °C. This is equivalent to ~60% of the current agricultural areas. The agricultural areas in temperatures above 28 °C do not currently exist, but will comprise ~27 thousand km2 in the conservative scenario of +2 °C, constituting a novel agro-climatology for the Cerrado.
3.3. Water Yield
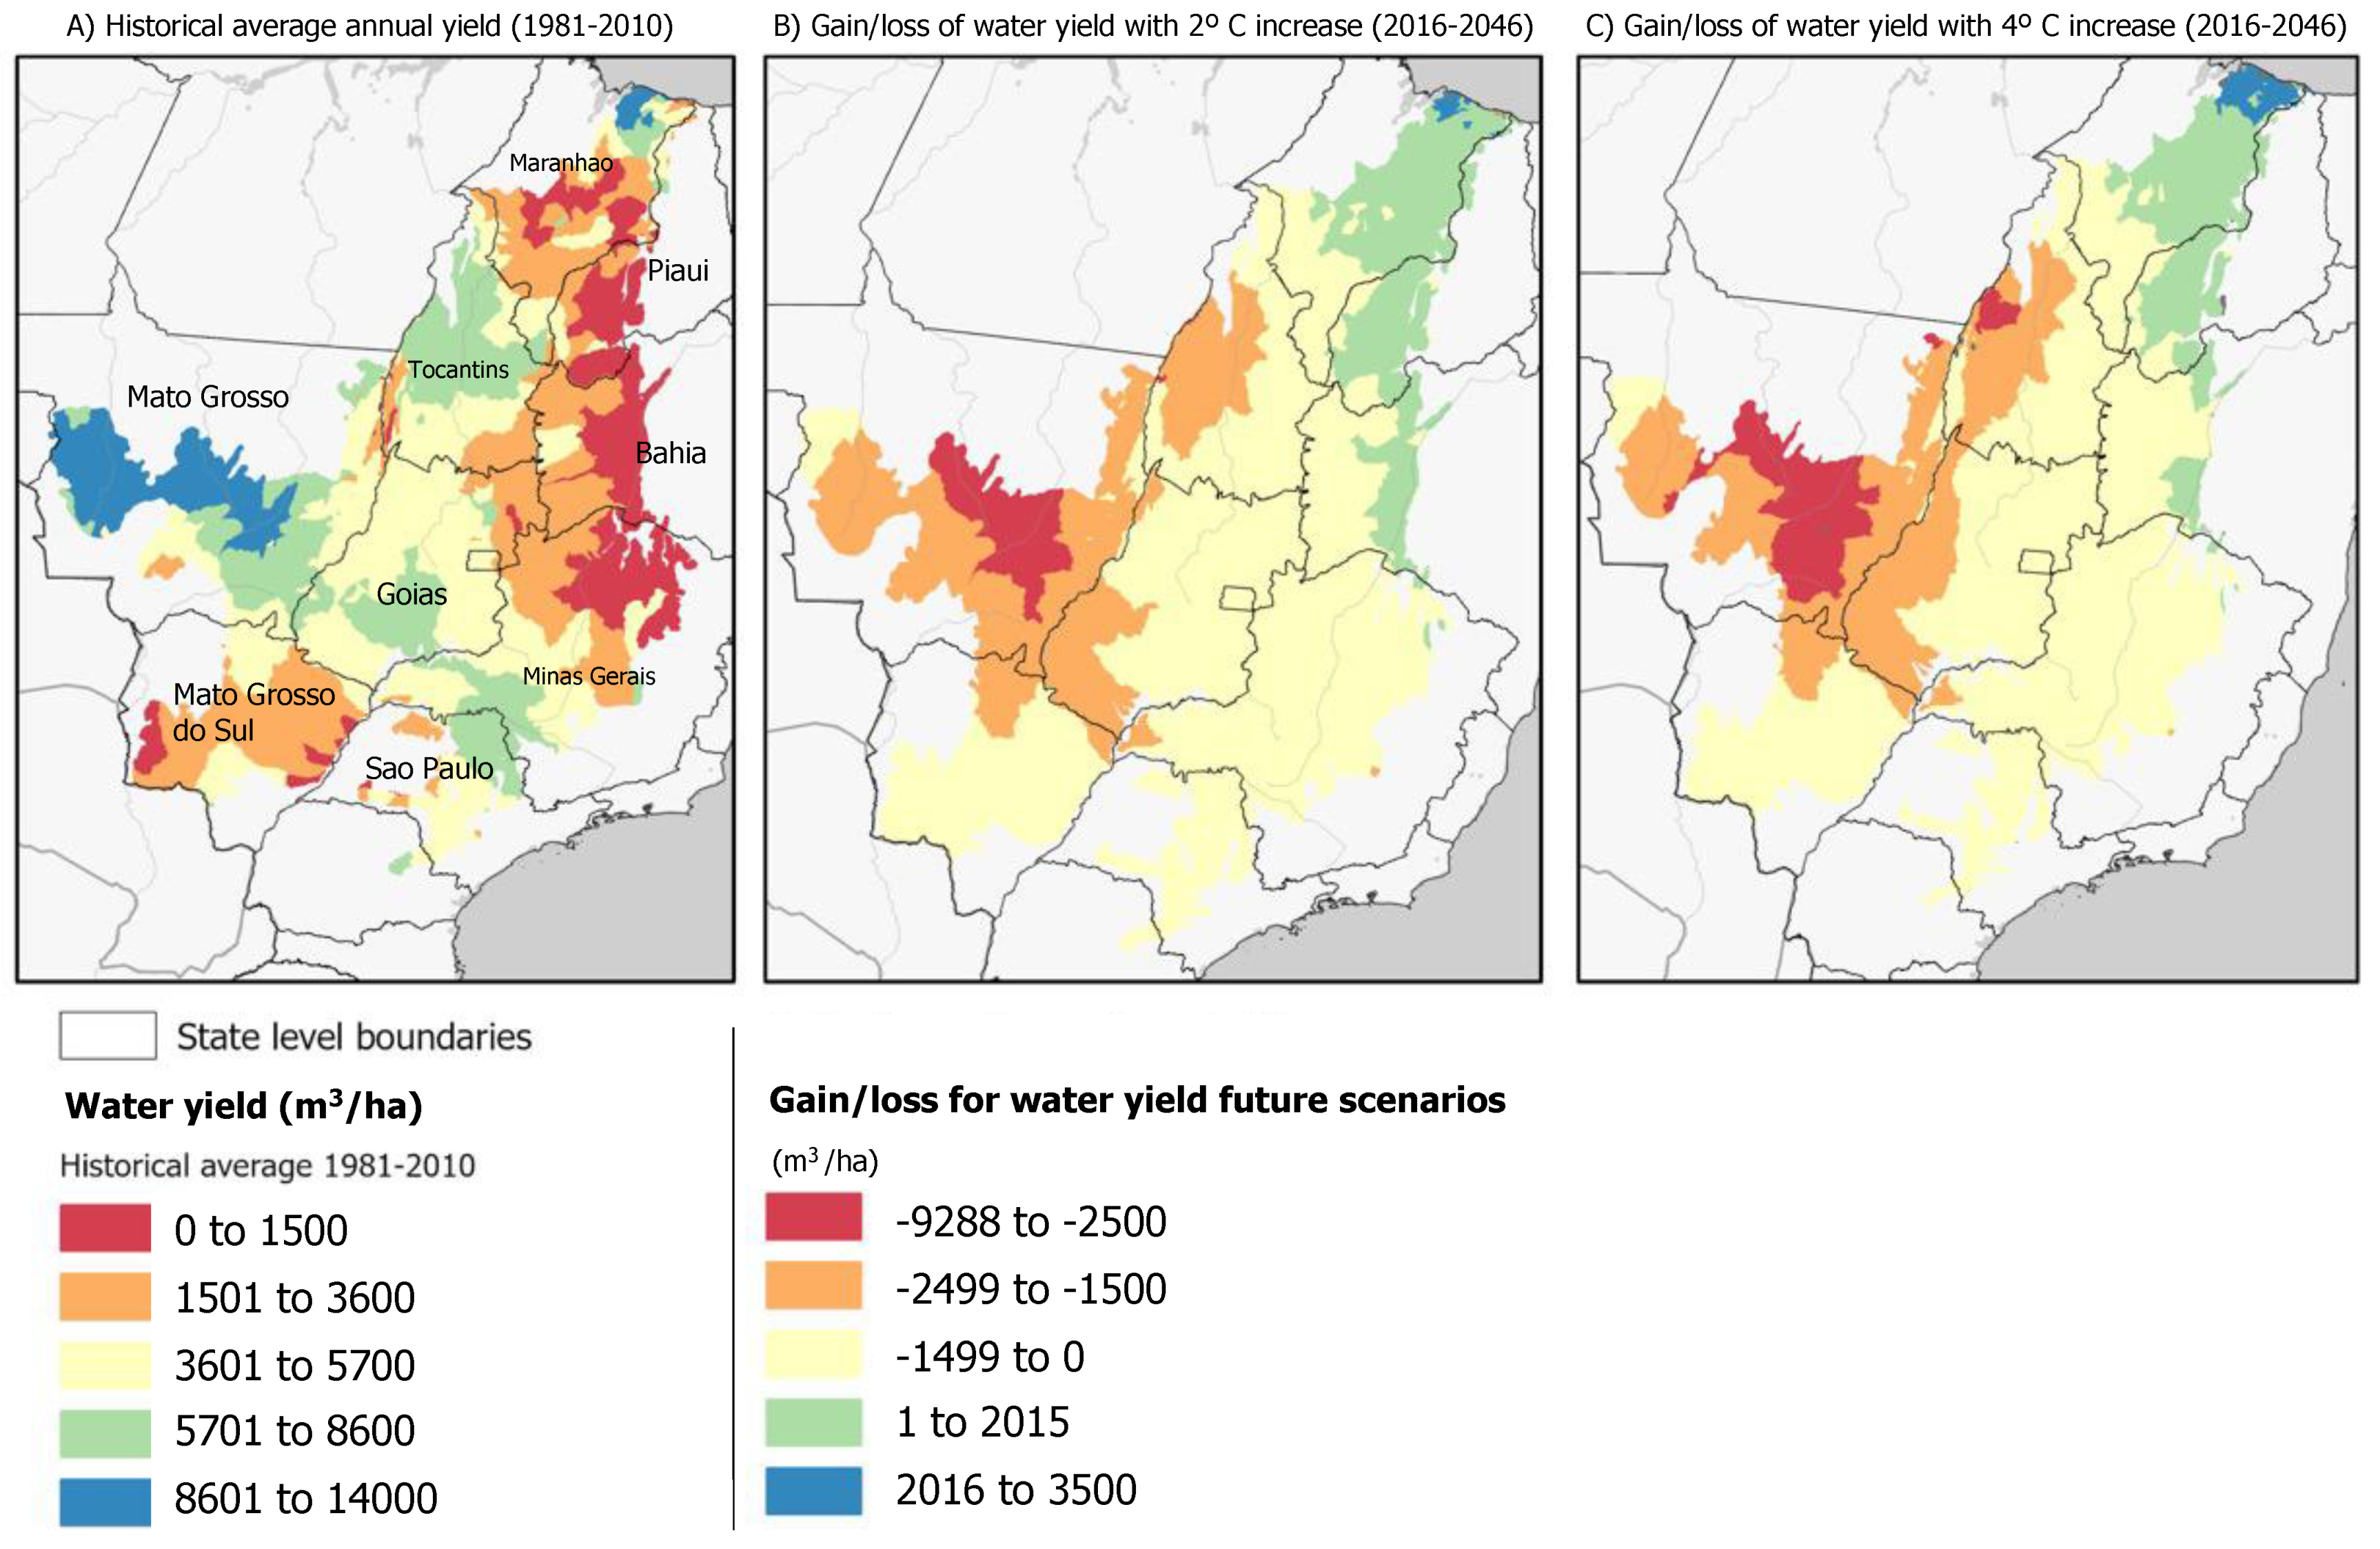
The combination of farmland expansion and higher temperatures will result in an adverse scenario for the water balance of crops. Currently, Mato Grosso state has the highest historical water yield in the study area (Figure 7) due to the higher rainfall levels that characterize this part of the Cerrado just south of the Amazon. Our results, however, indicated that a scenario of a 2 °C increase in temperature will affect this region the most. We estimate that new agricultural land will expand in areas with severely reduced water availability, particularly in Mato Grosso. According to our model, most land clearing (581,000 km2) will occur in places with reduced water production (up to −1500 m3/ha per year), and some of these areas are already vulnerable to drought, such as those along the eastern part of the biome (i.e., the states of Minas Gerais and Bahia).
4. Discussion
The results of our land change model indicate an expansion of croplands in the northern parts of the Cerrado (lower latitudes) and of pasturelands spread across the biome. The expansion of cropland and pastureland into these areas of higher temperatures is problematic because several studies suggest that higher temperatures will cause a reduction in agricultural productivity in tropical regions [47,48,49,50]. Indeed, the reduced water balance and precipitation in the Amazon–Cerrado ecotone impacts maize, soybean, and other annual crop yields because a minimum precipitation threshold of ~1700 mm/year is required for double cropping [51]. In addition to crop losses, higher temperatures may decrease regional GDP and shift crop suitability ranges [52] as we predicted higher temperatures in ~60% of agricultural areas. Soybean farming will be the main activity affected since it currently corresponds to half of the total agricultural production in the region and is the main crop planted in the agricultural frontiers of the Matopiba and Mato Grosso.
The expansion of crops over pasturelands in the Southeast region is likely due to the much higher profitability of crops and the proximity to the many ports and processing facilities located in the states of São Paulo and Minas Gerais. However, new roads linking the Cerrado to ports in northern Brazil will lower the costs of transportation and promote crop expansion over pastures. Indeed, we observed a strong soy expansion over pastures in the soy belt of the Mato Grosso and Matopiba regions. Moreover, we expect a net pastureland loss caused by the conversion of pasture to crops, indicating that most new pasturelands have been short-lived. Indeed, we found that 60% of pastures are converted to crops within 5 years after deforestation (Table S4).
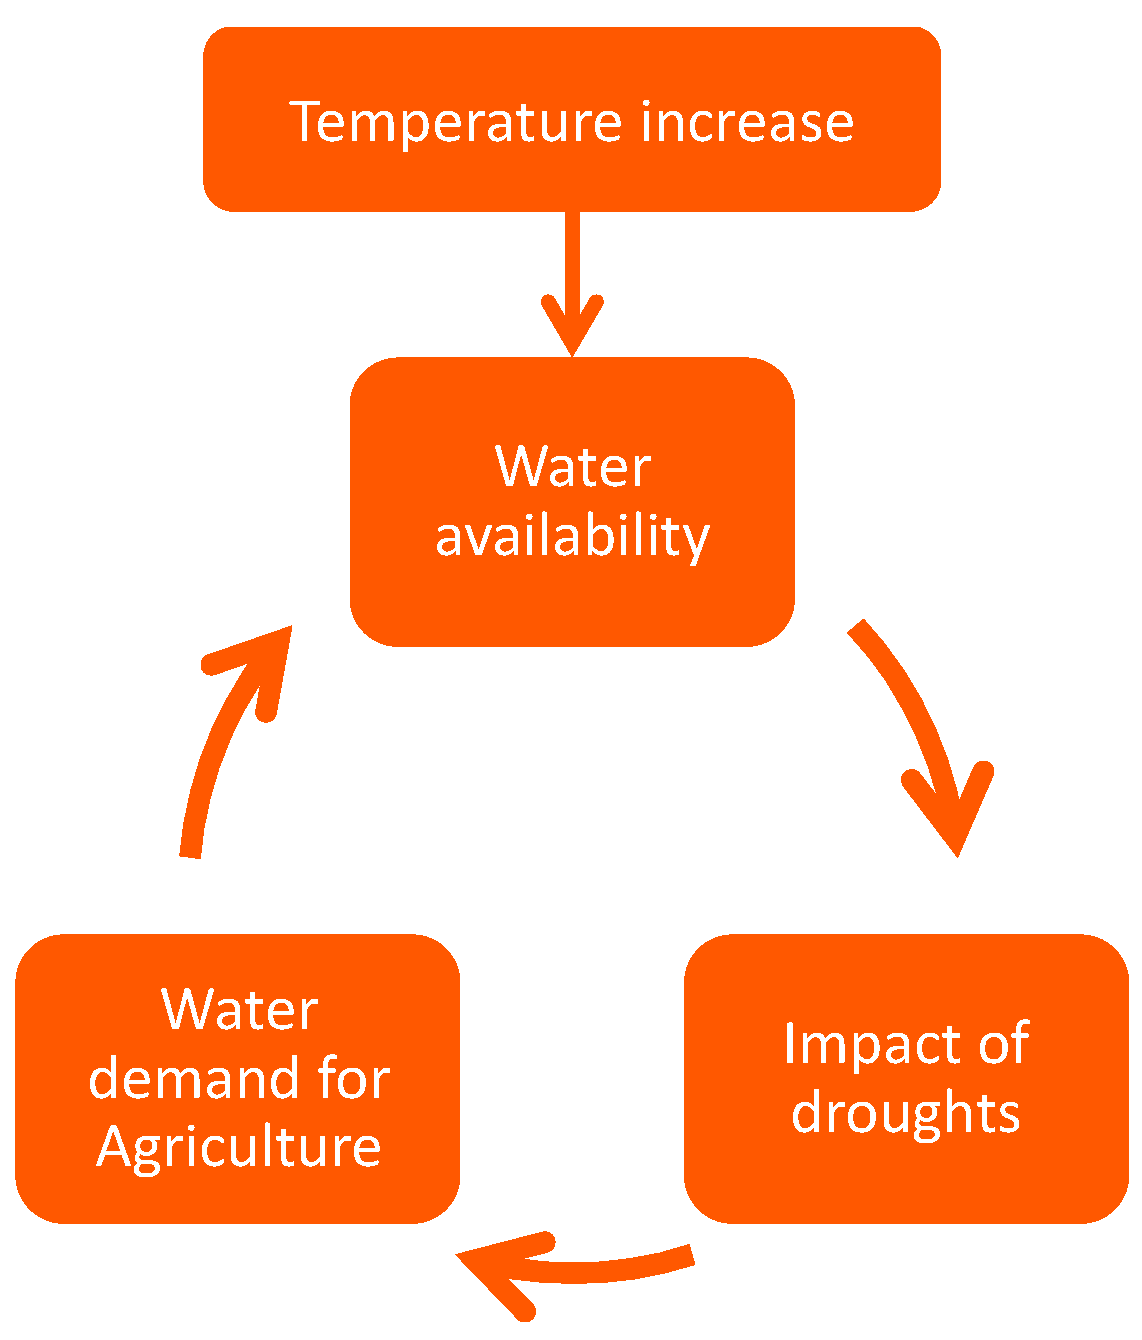
If cropland expansion and temperature and precipitation predictions come to fruition in the future, irrigated agriculture will likely continue to expand in the Cerrado. Our results indicate that most of the loss in water yield (approximately 9300 m3/ha/year) will take place in Mato Grosso state, the leading grain producer in Brazil. Nevertheless, rising temperatures also increase evaporation, which reduces the availability of surface water for irrigation (Figure 7 and Figure 8). Recent studies in the Cerrado have found similar risks of water scarcity for agriculture caused by rising temperatures and land clearing [8,16,51]. A warmer climate will likely increase the magnitude of the problems already described in this work, with a significant impact on agricultural yield. Therefore, new water management strategies and more efficient irrigation technologies will be required in the next decade to avoid losses in agricultural production and productivity [19]. Thus, we must question whether it is worth continuing this expansion under a scenario where risks from crop losses are likely to increase. This rationale also indicates the need for land management policies to mitigate the negative effects of rising temperatures in the Cerrado biome. The challenge is enormous and will also require the active participation of the private sector. We suggest that a combination of conservation policies, compensation for avoided land clearing, and agricultural intensification is necessary to meet these challenges.
Our land change model’s results are in agreement with other recent studies. For instance, our projected land change rates are consistent with those found by Monteiro et al. [53], who estimated 302 thousand km2 of new agricultural areas between 2012 and 2050. Strassburg et al. [19] also projected similar results, with ~202 thousand km2 of land change in a business-as-usual scenario for the period of 2012 to 2050. Furthermore, Ferreira et al. [54] and Lima et al. [55] found the same critical regions at risk of vegetation loss in the northern (Matopiba) and western (Mato Grosso) parts of the Cerrado. However, our approach is different in a few aspects; for instance, we considered competing land uses between pasture and crops and the regrowth of secondary vegetation. Strassburg et al. [19] mention the importance of regrowth/restoration, and our work captures this dynamic explicitly in the model as a transition between land uses.
A few caveats are worth recognizing. General models such as ours do not capture the dynamics that take place as a result of local government and politics. In particular, we did not assess how private sector commitments to halt deforestation (i.e., the soy moratorium) in the Amazon could be expanded to the Cerrado to avoid leakage and increase its overall effectiveness, thereby reducing deforestation [56,57]. Moreover, commodity exports and political stability are relevant factors for the advance of land clearing in tropical areas [58] and affect land change in other biomes in South America, such as the Chaco [4,59]. Still, the growing demand for agricultural commodities resisted recent shocks in logistics and inputs caused by the pandemics and the Ukraine-Russia war. Hence, if the economic underlying causes of land change persist for the following decades, the pace of land conversions in the Cerrado will continue as we predicted.
What strategies could be implemented to move the agricultural sector towards a more sustainable future and away from short-sighted land use decisions? First, the creation of new protected areas (PAs) is the main strategy to halt farmland expansion in areas with increasing climatic risk for crop yield that are important suppliers of ecosystem services [19]. According to our land change model, protected areas lower the probability of vegetation loss in all subregions, but the status of protection remains fragile. For instance, protected areas cover a meager ~8% of the Cerrado, in comparison to 46% of the Amazon [26]. Compounding matters further, most of the Cerrado lands are already under private ownership (~85% of the total area, including 49 Mha of native vegetation, according to the Brazilian Rural Environmental Registry), with little public land left for the creation of new protected areas [60]. Although private protected areas cannot be compared to or substituted for public PAs due to their smaller and more fragmented pattern, these remaining fragments of vegetation (Figure 5) can be relevant to the overall landscape connectivity and protection of water resources. This is especially true for riparian forests and those that protect the headwaters of watersheds [13]. Hence, the engagement and participation of private landowners will be crucial for the protection of the remaining Cerrado vegetation.
Second, a complementary approach to public protected areas would be to pay landowners for the ecosystem services provided and to avoid deforestation in private areas, based on the opportunity cost of the land or the acquisition of private properties for conservation purposes. This is a well-known approach used by The Nature Conservancy in many places [61]. According to Brazilian law, the legal instrument for permanent protection of these areas would be the creation of private reserves of natural heritage (RRPN, in the Portuguese acronym). To cover the opportunity cost of preservation, a private agreement could be made to offset emissions from a third party, create carbon credits, or pay for the protection of riparian forests and headwaters [62] to finance the protection of these areas. In this case, the incentive could be paid in annual installments at a discount rate of 3–7% corresponding to the annual leasing value of land or as a lump sum equal to the market land price [63]. A payment for native vegetation conservation on private lands would be more efficient in pasture areas because the opportunity costs are lower due to the low profitability of this activity. Likewise, Feltran-Barbieri and Feres [64] found that limiting ranching expansion would not limit the increase in production necessary to meet the demand for beef and dairy because there is a potential to increase productivity (i.e., heads/hectare) on 100 Mha degraded pastures in suitable areas. Though the benefits of ecosystem services are still uncertain (i.e., extreme heat regulation) and may be less than the land value in regions such as Mato Grosso where farm profitability is high [12]. In any case, it is economically more feasible to prioritize areas with lower opportunity costs.
5. Conclusions
Our study examined the dangers of making land use decisions based on current climatology in places where temperature and reduced water availability are projected to become issues for rainfed agriculture in the Brazilian Cerrado biome. According to our estimates, at least 129 thousand km2 of cropland and 418 thousand km2 of pastures will be created in places with projected higher annual temperatures. For the consolidated areas where agriculture is highly profitable, cropland will likely continue its expansion over pastures. However, new agricultural areas in temperatures above 28 °C will likely comprise ~27 thousand km2 in the conservative scenario of +2 °C, constituting a novel agro-climatology for the Cerrado. Consequently, future agricultural areas will face a severe reduction in water yield. We estimate that the Mato Grosso and Matopiba regions, both main producers of soybeans, will be affected by reductions in surface water yield. Our models project that water yields in Mato Grosso will decrease by ~9300 m3/ha/year. Thus, land change trends in the Cerrado combined with scenarios of rising temperatures and reduced availability of water will put more pressure on water resources and increase reliance on irrigation. According to the models, the regrowth of native vegetation is a strong trend in land change, maybe due to land clearing in areas not suitable for agriculture. Therefore, public policies can guide the restoration and incentivize the recovery of these cleared areas, particularly those that are important for water resources and ecosystem functions, such as riparian forests and natural springs.
We recommend strategies to mitigate the impacts of farmland expansion over environments that are likely to become drier in the Cerrado biome, e.g., support pasture intensification, protection of riparian vegetation around rivers, and a financial mechanism to compensate for the opportunity cost of not clearing the land on private properties. For current agricultural land uses, cattle ranching will have to rely on smaller areas in the future by adopting semi-intensive systems whereby the last stage of fattening uses byproducts of the agricultural sector such as cotton seeds and corn husks, among others. This could be scaled up through landscape planning, with public policies and market incentives. For instance, payments for environmental services could support the conservation of native vegetation on private land in regions with the highest temperature increase and deforestation risk. Moreover, in areas with expected reduced water yields, such as in the western Cerrado, the protection of riparian vegetation and strict water use regulation could mitigate future agriculture risks. A combination of enforcement and conservation policies is necessary to mitigate the risk of farmland expansion into areas vulnerable to future temperature increases and reduced water availability.
Supplementary Materials
The following supporting information can be downloaded at: https://www.mdpi.com/article/10.3390/land12040914/s1, Table S1: Results of annual transition probabilities matrix by land cover and subregion. Source: Author’s analysis in Dinamica EGO; Table S2: Similarity between land use simulation and current land use for Cerrado in 2016, without subregional models; Table S3: Similarity between land use simulation and current land use for Cerrado in 2016, with subregions at the municipal level; Table S4: Pasture persistence (turnover): timeframe that deforested areas to pasture turn into cropland in the Cerrado biome, from 2001 to 2016; Table S5: Cramer’s V test to assess the spatial correlation between the variables; Figure S1: Similarity between land use simulation and current land use for Cerrado in 2016, with subregions at cluster level. Source: Author’s analysis in Dinamica EGO; Figure S2: Precipitation (mm/year) for historical and future climate scenarios. Source: adapted from Terraclimate Project (Abatzoglou et al., 2018); Figure S3: Potential evapotranspiration (PET, in mm/year) for historical and future climate scenarios. Source: adapted from Terraclimate Project (Abatzoglou et al., 2018).
Author Contributions
Conceptualization, D.S.S. and E.Y.A.; Methodology, D.S.S.; Formal analysis, D.S.S. and E.Y.A.; Investigation, D.S.S.; Data curation, D.S.S.; Writing—original draft, D.S.S. and E.Y.A.; Writing—review & editing, D.S.S. and E.Y.A.; Visualization, D.S.S.; Project administration, D.S.S. All authors have read and agreed to the published version of the manuscript.
Funding
This research received no external funding.
Data Availability Statement
The data presented in this study are available upon request to the corresponding author.
Conflicts of Interest
The authors declare no conflict of interest.
References
- Food and Agriculture Organization of the United Nations (FAO). Crops and Livestock Products. 2022. Available online: https://www.fao.org/faostat (accessed on 5 November 2022).
- Mittermeier, R.A.; Turner, W.R.; Larsen, F.W.; Brooks, T.M.; Gascon, C. Global Biodiversity Conservation: The Critical Role of Hotspots. In Biodiversity Hotspots; Zachos, F.E., Habel, J., Eds.; Springer: Berlin/Heidelberg, Germany, 2011; pp. 3–22. [Google Scholar] [CrossRef]
- Souza, C.M., Jr.; Shimbo, J.Z.; Rosa, M.R.; Parente, L.L.; Alencar, A.A.; Rudorff, B.F.T.; Hasenack, H.; Matsumoto, M.; Ferreira, L.G.; Souza-Filho, P.W.M.; et al. Reconstructing Three Decades of Land Use and Land Cover Changes in Brazilian Biomes with Landsat Archive and Earth Engine. Remote Sens. 2020, 12, 2735. [Google Scholar] [CrossRef]
- Graesser, J.; Aide, T.M.; Grau, H.R.; Ramankutty, N. Cropland/Pastureland Dynamics and the Slowdown of Deforestation in Latin America. Environ. Res. Lett. 2015, 10, 034017. [Google Scholar] [CrossRef]
- Graesser, J.; Ramankutty, N.; Coomes, O.T. Increasing Expansion of Large-Scale Crop Production onto Deforested Land in Sub-Andean South America. Environ. Res. Lett. 2018, 13, 084021. [Google Scholar] [CrossRef]
- ANA & Embrapa. Levantamento da Agricultura Irrigada por Pivôs Centrais no Brasil (1985–2017). Gov.br. Available online: https://www.snirh.gov.br (accessed on 2 February 2020).
- Maneta, M.P.; Torres, M.; Wallender, W.W.; Vosti, S.; Kirby, M.; Bassoi, L.H.; Rodrigues, L.N. Water Demand and Flows in the São Francisco River Basin (Brazil) with Increased Irrigation. Agric. Water Manag. 2009, 96, 1191–1200. [Google Scholar] [CrossRef]
- Pousa, R.; Costa, M.H.; Pimenta, F.M.; Fontes, V.C.; de Brito, V.F.A.; Castro, M. Climate Change and Intense Irrigation Growth in Western Bahia, Brazil: The Urgent Need for Hydroclimatic Monitoring. Water 2019, 11, 933. [Google Scholar] [CrossRef]
- Cunha, A.P.M.A.; Zeri, M.; Deusdará Leal, K.; Costa, L.; Cuartas, L.A.; Marengo, J.A.; Tomasella, J.; Vieira, R.M.; Barbosa, A.A.; Cunningham, C.; et al. Extreme Drought Events over Brazil from 2011 to 2019. Atmosphere 2019, 10, 642. [Google Scholar] [CrossRef]
- Pires, G.F.; Abrahão, G.M.; Brumatti, L.M.; Oliveira, L.J.C.; Costa, M.H.; Liddicoat, S.; Kato, E.; Ladle, R.J. Increased Climate Risk in Brazilian Double Cropping Agriculture Systems: Implications for Land Use in Northern Brazil. Agric. For. Meteorol. 2016, 228–229, 286–298. [Google Scholar] [CrossRef]
- IPCC. Climate Change and Land. Available online: https://www.ipcc.ch/srccl/ (accessed on 2 February 2020).
- Flach, R.; Abrahão, G.; Bryant, B.; Scarabello, M.; Soterroni, A.C.; Ramos, F.M.; Valin, H.; Obersteiner, M.; Cohn, A.S. Conserving the Cerrado and Amazon Biomes of Brazil Protects the Soy Economy from Damaging Warming. World Dev. 2021, 146, 105582. [Google Scholar] [CrossRef]
- Latrubesse, E.M.; Arima, E.; Ferreira, M.E.; Nogueira, S.H.; Wittmann, F.; Dias, M.S.; Dagosta, F.C.P.; Bayer, M. Fostering Water Resource Governance and Conservation in the Brazilian Cerrado Biome. Conserv. Sci. Pract. 2019, 1, e77. [Google Scholar] [CrossRef]
- Brasil. Projeções do Agronegócio: Brasil 2021/22 a 2031/32. Available online: https://www.gov.br/agricultura/pt-br/assuntos/politica-agricola/todas-publicacoes-de-politica-agricola/projecoes-do-agronegocio/projecoes-do-agronegocio-2021-2022-a-2031-2032/view (accessed on 12 July 2021).
- Brito, S.S.B.; Cunha, A.P.M.A.; Cunningham, C.C.; Alvalá, R.C.; Marengo, J.A.; Carvalho, M.A. Frequency, Duration and Severity of Drought in the Semiarid Northeast Brazil Region: Frequency, duration and severity of drought in the brazilian semiarid. Int. J. Climatol. 2018, 38, 517–529. [Google Scholar] [CrossRef]
- Leite-Filho, A.T.; Soares-Filho, B.S.; Davis, J.L.; Abrahão, G.M.; Börner, J. Deforestation Reduces Rainfall and Agricultural Revenues in the Brazilian Amazon. Nat. Commun. 2021, 12, 2591. [Google Scholar] [CrossRef]
- Coe, M.T.; Latrubesse, E.M.; Ferreira, M.E.; Amsler, M.L. The Effects of Deforestation and Climate Variability on the Streamflow of the Araguaia River, Brazil. Biogeochemistry 2011, 105, 119–131. [Google Scholar] [CrossRef]
- Strassburg, B.B.N.; Barros, F.S.M.; Crouzeilles, R.; Iribarrem, A.; dos Santos, J.S.; Silva, D.; Sansevero, J.B.B.; Alves-Pinto, H.N.; Feltran-Barbieri, R.; Latawiec, A.E. The Role of Natural Regeneration to Ecosystem Services Provision and Habitat Availability: A Case Study in the Brazilian Atlantic Forest. Biotropica 2016, 48, 890–899. [Google Scholar] [CrossRef]
- Strassburg, B.B.N.; Brooks, T.; Feltran-Barbieri, R.; Iribarrem, A.; Crouzeilles, R.; Loyola, R.; Latawiec, A.E.; Oliveira Filho, F.J.B.; Scaramuzza, C.A.d.M.; Scarano, F.R.; et al. Moment of Truth for the Cerrado Hotspot. Nat. Ecol. Evol. 2017, 1, 99. [Google Scholar] [CrossRef]
- Abatzoglou, J.T.; Dobrowski, S.Z.; Parks, S.A.; Hegewisch, K.C. TerraClimate, a High-Resolution Global Dataset of Monthly Climate and Climatic Water Balance from 1958–2015. Sci. Data 2018, 5, 170191. [Google Scholar] [CrossRef]
- Embrapa. Dinâmica Agrícola no Cerrado: Análises e Projeções. Available online: https://www.embrapa.br/en/busca-de-publicacoes/-/publicacao/1124106/dinamica-agricola-no-cerrado-analises-e-projecoes (accessed on 2 February 2020).
- Yamada, T. TheCerradoof Brazil: A Success Story of Production on Acid Soils. Soil Sci. Plant Nutr. 2005, 51, 617–620. [Google Scholar] [CrossRef]
- Brum, A.J. Modernização da Agricultura: Trigo e Soja; FIDENE, Fundação de Integração, Desenvolvimento e Educação do Noroeste do Estado: Rio de Janeiro, Brasil, 1988. [Google Scholar]
- Pires, M.O. ‘Cerrado’, Old and New Agricultural Frontiers. Braz. Polit. Sci. Rev. 2020, 14, e0004. [Google Scholar] [CrossRef]
- Brazilian Institute of Geographic and Economical Research (IBGE). Produção Agrícola e Pecuária Municipal; IBGE: Rio de Janeiro, Brazil, 2018. Available online: https://sidra.ibge.gov.br/pesquisa/pam/tabelas (accessed on 2 September 2022).
- Brasil. Mapa Temático e Dados Geoestatísticos das Unidades de Conservação Federais. Ministerio do Meio Ambiente (MMA). Available online: https://www.gov.br/icmbio/pt-br/assuntos/dados_geoespaciais/mapa-tematico-e-dados-geoestatisticos-das-unidades-de-conservacao-federais (accessed on 2 February 2020).
- Soares-Filho, B.S.; Coutinho Cerqueira, G.; Lopes Pennachin, C. Dinamica—A Stochastic Cellular Automata Model Designed to Simulate the Landscape Dynamics in an Amazonian Colonization Frontier. Ecol. Modell. 2002, 154, 217–235. [Google Scholar] [CrossRef]
- Sharp, R.; Tallis, H.T.; Ricketts, T.; Guerry, A.D.; Wood, S.A.; Chaplin-Kramer, R.; Nelson, E.; Ennaanay, D.; Wolny, S.; Olwero, N.; et al. The Natural Capital Project: InVEST User’s Guide. Available online: https://naturalcapitalproject.stanford.edu (accessed on 2 September 2022).
- Silva, D.S. Farmland Expansion and Temperature Fluctuations in Dry Areas of the Cerrado Biome; The University of Texas at Austin: Austin, TX, USA, 2021. [Google Scholar] [CrossRef]
- Brazilian Institute of Geographic and Economical Research (IBGE). Polígonos dos Biomas Brasileiros. INDE—Catálogo de Metadados Geográficos. Available online: http://www.metadados.inde.gov.br/geonetwork/srv/por/metadata.show?id=75177&currTab=simple (accessed on 2 September 2022).
- Brazilian Institute of Geographic and Economical Research (IBGE). Polígonos dos Municípios Brasileiros. Available online: http://ftp://geoftp.ibge.gov.br/organizacao_do_territorio/malhas_territoriais/malhas_municipais/municipio_2017/Brasil/BR/ (accessed on 2 September 2022).
- Fischer, G.; Nachtergaele, F.; Prieler, S.; Velthuizen, H.T.; Verelst, L.V.; Wiberg, D.; IIASA/FAO. Global Agro-ecological Zones (GAEZ v3.0)—Crops suitability. IIASA. Available online: http://www.fao.org/nr/gaez/about-data-portal/agricultural-suitability-and-potential-yields/en/ (accessed on 2 February 2020).
- van Vuuren, D.P.; Stehfest, E.; den Elzen, M.G.J.; Kram, T.; van Vliet, J.; Deetman, S.; Isaac, M.; Klein Goldewijk, K.; Hof, A.; Mendoza Beltran, A.; et al. RCP2.6: Exploring the Possibility to Keep Global Mean Temperature Increase below 2 °C. Clim. Chang. 2011, 109, 95–116. [Google Scholar] [CrossRef]
- Brazilian Institute of Geographic and Economical Research (IBGE). Estimativas de População. Instituto Brasileiro de Geografia e Estatística. Available online: https://www.ibge.gov.br/estatisticas/sociais/populacao/9103-estimativas-de-populacao.html (accessed on 2 February 2020).
- Brazilian Institute of Geographic and Economical Research (IBGE). Produto Interno Bruto dos Municípios. IBGE, CONTAS NACIONAIS. Available online: https://www.ibge.gov.br/estatisticas/economicas/contas-nacionais/9088-produto-interno-bruto-dos-municipios.html (accessed on 2 February 2020).
- Bonham-Carter, G. Geographic Information Systems for Geoscientists: Modelling with GIS; Pergamon: Amsterdam, The Netherlands, 1994. [Google Scholar]
- Agterberg, F.P. Combining Indicator Patterns in Weights of Evidence Modeling for Resource Evaluation. Nat. Resour. Res. 1992, 1, 39–50. [Google Scholar] [CrossRef]
- National Institute of Space Research (INPE). Projeto PRODES—Monitoramento da Floresta Amazônica Brasileira por Satélite. Available online: http://www.obt.inpe.br/prodes/index.php (accessed on 2 February 2020).
- Hagen, A. Fuzzy Set Approach to Assessing Similarity of Categorical Maps. Geogr. Inf. Syst. 2003, 17, 235–249. [Google Scholar] [CrossRef]
- Almeida, C.M.; Gleriani, J.M.; Castejon, E.F.; Soares-Filho, B.S. Using Neural Networks and Cellular Automata for Modelling Intra-urban Land-use Dynamics. Geogr. Inf. Syst. 2008, 22, 943–963. [Google Scholar] [CrossRef]
- Hengl, T.; Mendes de Jesus, J.; Heuvelink, G.B.M.; Ruiperez Gonzalez, M.; Kilibarda, M.; Blagotić, A.; Shangguan, W.; Wright, M.N.; Geng, X.; Bauer-Marschallinger, B.; et al. SoilGrids250m: Global Gridded Soil Information Based on Machine Learning. PLoS ONE 2017, 12, e0169748. [Google Scholar] [CrossRef] [PubMed]
- Saxton, K.E.; Willey, P.H. The SPAW model for Agricultural Field and Pond Hydrologic Simulation. USDA. Available online: https://www.ars.usda.gov/research/software/download/?softwareid=492 (accessed on 2 February 2020).
- Nachtergaele, F.; Velthuizen, H.V.; Verelst, L.; Wiberg, D. Harmonized World Soil Database (HWSD). Food and Agriculture Organization of the United Nations. Available online: https://library.wur.nl/WebQuery/wurpubs/500737 (accessed on 2 February 2020).
- Agência Nacional de Águas (ANA). Bacias Hidrográficas Ottocodificadas (Níveis Otto 1–7). Catálogo de Metadados da ANA. Available online: https://metadados.snirh.gov.br/geonetwork/srv/api/records/b228d007-6d68-46e5-b30d-a1e191b2b21f (accessed on 2 February 2020).
- Silva Junior, C.H.L.; Heinrich, V.H.A.; Freire, A.T.G.; Broggio, I.S.; Rosan, T.M.; Doblas, J.; Anderson, L.O.; Rousseau, G.X.; Shimabukuro, Y.E.; Silva, C.A.; et al. Benchmark Maps of 33 Years of Secondary Forest Age for Brazil. Sci. Data 2020, 7, 269. [Google Scholar] [CrossRef] [PubMed]
- Brasil. Mapas e Bases dos Modos de Transportes. Ministério da Infraestrutura. Available online: https://www.gov.br/infraestrutura/pt-br/assuntos/dados-de-transportes/bit/bit-mapas (accessed on 2 February 2020).
- Silva, D.S.; Arima, E.Y.; dos Reis, T.N.P.; Rattis, L. Temperature Effect on Brazilian Soybean Yields, and Farmers’ Responses. Int. J. Agric. Sustain. 2023, 21, 2173370. [Google Scholar] [CrossRef]
- Ortiz-Bobea, A.; Ault, T.R.; Carrillo, C.M.; Chambers, R.G.; Lobell, D.B. Anthropogenic Climate Change Has Slowed Global Agricultural Productivity Growth. Nat. Clim. Chang. 2021, 11, 306–312. [Google Scholar] [CrossRef]
- Lobell, D.B.; Schlenker, W.; Costa-Roberts, J. Climate Trends and Global Crop Production since 1980. Science 2011, 333, 616–620. [Google Scholar] [CrossRef]
- Sloat, L.L.; Davis, S.J.; Gerber, J.S.; Moore, F.C.; Ray, D.K.; West, P.C.; Mueller, N.D. Climate Adaptation by Crop Migration. Nat. Commun. 2020, 11, 1243. [Google Scholar] [CrossRef]
- Spangler, K.R.; Lynch, A.H.; Spera, S.A. Precipitation Drivers of Cropping Frequency in the Brazilian Cerrado: Evidence and Implications for Decision-Making. Weather Clim. Soc. 2017, 9, 201–213. [Google Scholar] [CrossRef]
- Assad, E.D.; Pinto, H.S.; Nassar, A.; Harfuch, L.; Freitas, S.; Farinelli, B.; Lundell, M.; Bachion, L.C.; Fernandes, C.M. Impactos das Mudanças Climáticas na Produção Agrícola Brasileira. World Bank. Available online: https://documents.worldbank.org/pt/publication/documents-reports/documentdetail/364151468237586291/brasil-impactos-das-mudanças-climáticas-na-%20produção-agr%C3%ADcola-brasileira (accessed on 4 April 2021).
- Monteiro, L.M.; Brum, F.T.; Pressey, R.L.; Morellato, L.P.C.; Soares-Filho, B.; Lima-Ribeiro, M.S.; Loyola, R. Evaluating the Impact of Future Actions in Minimizing Vegetation Loss from Land Conversion in the Brazilian Cerrado under Climate Change. Biodivers. Conserv. 2020, 29, 1701–1722. [Google Scholar] [CrossRef]
- Ferreira, M.E.; Ferreira, L.G., Jr.; Miziara, F.; Soares-Filho, B.S. Modeling Landscape Dynamics in the Central Brazilian Savanna Biome: Future Scenarios and Perspectives for Conservation. J. Land Use Sci. 2013, 8, 403–421. [Google Scholar] [CrossRef]
- Lima, T.; Carvalho Ribeiro, S.; Soares-Filho, B. Integrating Econometric and Spatially Explicit Dynamic Models to Simulate Land Use Transitions in the Cerrado Biome. In Geomatic Approaches for Modeling Land Change Scenarios; Springer International Publishing: Cham, Switzerland, 2018; pp. 399–417. [Google Scholar]
- Garrett, R.D.; Levy, S.; Carlson, K.M.; Gardner, T.A.; Godar, J.; Clapp, J.; Dauvergne, P.; Heilmayr, R.; le Polain de Waroux, Y.; Ayre, B.; et al. Criteria for Effective Zero-Deforestation Commitments. Glob. Environ. Chang. 2019, 54, 135–147. [Google Scholar] [CrossRef]
- Bastos Lima, M.G.; Persson, U.M. Commodity-Centric Landscape Governance as a Double-Edged Sword: The Case of Soy and the Cerrado Working Group in Brazil. Front. For. Glob. Chang. 2020, 3, 27. [Google Scholar] [CrossRef]
- Barbier, E.B. The Economics of Tropical Deforestation and Land Use: An Introduction to the Special Issue. Land Econ. 2001, 77, 155. [Google Scholar] [CrossRef]
- Gasparri, N.I.; Grau, H.R. Deforestation and Fragmentation of Chaco Dry Forest in NW Argentina (1972–2007). For. Ecol. Manag. 2009, 258, 913–921. [Google Scholar] [CrossRef]
- Ministério do Meio Ambiente (MMA). Sistema de Cadastro Ambiental Rural (CAR). Database from Serviço Florestal Brasileiro. Available online: https://www.car.gov.br/publico/imoveis/index (accessed on 22 May 2022).
- Gerber, J.-D.; Rissman, A.R. Land-Conservation Strategies: The Dynamic Relationship between Acquisition and Land-Use Planning. Environ. Plan. A 2012, 44, 1836–1855. [Google Scholar] [CrossRef]
- Viani, R.A.G.; Bracale, H.; Taffarello, D. Lessons Learned from the Water Producer Project in the Atlantic Forest, Brazil. Forests 2019, 10, 1031. [Google Scholar] [CrossRef]
- Latawiec, A.E.; Strassburg, B.B.N.; Silva, D.; Alves-Pinto, H.N.; Feltran-Barbieri, R.; Castro, A.; Iribarrem, A.; Rangel, M.C.; Kalif, K.A.B.; Gardner, T.; et al. Improving Land Management in Brazil: A Perspective from Producers. Agric. Ecosyst. Environ. 2017, 240, 276–286. [Google Scholar] [CrossRef]
- Feltran-Barbieri, R.; Féres, J.G. Degraded Pastures in Brazil: Improving Livestock Production and Forest Restoration. R. Soc. Open Sci. 2021, 8, 201854. [Google Scholar] [CrossRef] [PubMed]
Figure 1.
Brazilian Amazon and Cerrado biomes in South America. Source: Brasil [26].
Figure 1.
Brazilian Amazon and Cerrado biomes in South America. Source: Brasil [26].

Figure 2.
The analytical framework of this study.

Figure 3.
Cerrado land use (2016) on the left, and subregions for land modeling on the right side. Source: (A) Mapbiomas [3] and Brazil [26], and (B) the author’s analysis.

Figure 4.
Probability of land change in 2046. Source: author’s analysis in Dinamica EGO.

Figure 5.
(A) Land use (2016), (B) land change simulation (2046) within the Cerrado, and (C) projected vegetation loss (2016–2046) at the municipal level. Source: Mapbiomas and the author’s analysis in Dinamica EGO.
Figure 5.
(A) Land use (2016), (B) land change simulation (2046) within the Cerrado, and (C) projected vegetation loss (2016–2046) at the municipal level. Source: Mapbiomas and the author’s analysis in Dinamica EGO.

Figure 6.
Distribution of agricultural area (km2) on current and projected land use and average temperature. Source: LCM and TerraClimate temperature projections.
Figure 6.
Distribution of agricultural area (km2) on current and projected land use and average temperature. Source: LCM and TerraClimate temperature projections.

Figure 7.
Water yield (m3/ha per year) estimates for (A) the historical scenario and (B) additionality with a 2 °C increase and (C) a 4 °C increase. Source: water yield modeling in the software InVEST.
Figure 7.
Water yield (m3/ha per year) estimates for (A) the historical scenario and (B) additionality with a 2 °C increase and (C) a 4 °C increase. Source: water yield modeling in the software InVEST.

Figure 8.
The feedback loop of increasing temperature and available water for agriculture.


Table 1.
Spatial data description for land change modeling.
| Variable | Description and Procedures | Source |
|---|---|---|
| Land use/cover | Annual land use/cover, based on Landsat images, 30 m resolution | Mapbiomas Project [3] |
| Roads | Polylines of existing roads in Brazil clipped to Cerrado and used to calculate a raster of distances to roads | Ministry of Infrastructure [31] |
| Protected Areas | Polygons of Protected Areas, including indigenous land, parks, and other set-aside areas for conservation. | Ministry of Environment [26] |
| Slope | Estimates of slope in percentage, 30 m resolution | Geological Service of Brazil [30] |
| Suitability for rainfed crops | Raster with nine categories of suitability for crops, according to soil and climate | FAO/GAEZ [32] |
| Matopiba | Soy Belt | Central Area | Western | Southeast | Total for Cerrado | |
|---|---|---|---|---|---|---|
| the year 2016 | ||||||
| GDP (BRL currency) | 122,399,863 | 21,264,910 | 391,751,655 | 187,815,050 | 810,490,154 | 1,533,721,632 |
| Total population | 8,510,555 | 271,934 | 8,929,537 | 5,398,667 | 23,439,741 | 46,550,434 |
| Population density (person/km2) | 17 | 5 | 61 | 8 | 91 | 54 |
| Pasture (ha) | 14,080,822 | 357,324 | 9,867,015 | 30,491,629 | 13,401,512 | 68,198,302 |
| Cropland (ha) | 5,696,811 | 4,630,154 | 3,760,074 | 13,358,148 | 9,928,908 | 37,374,095 |
| Native vegetation (ha) | 70,198,750 | 4,069,766 | 9,909,120 | 55,717,127 | 19,847,909 | 159,742,673 |
| the year 2001 | ||||||
| GDP (BRL currency) | 16,133,402 | 1,917,149 | 56,456,329 | 23,312,219 | 171,104,708 | 268,923,807 |
| Total population | 7,080,592 | 128,355 | 6,664,906 | 4,280,237 | 19,817,473 | 37,971,563 |
| Population density (person/km2) | 15 | 2 | 44 | 7 | 75 | 44 |
| Pasture (ha) | 11,755,970 | 404,599 | 12,527,722 | 32,574,281 | 24,068,868 | 81,331,440 |
| Cropland (ha) | 1,469,094 | 2,129,127 | 1,758,879 | 4,721,833 | 4,789,848 | 14,868,781 |
| Native vegetation (ha) | 15,340,797 | 306,894 | 11,251,002 | 31,392,753 | 19,703,744 | 77,995,189 |
Table 3.
Data for InVEST’s water yield model.
| Variable | Description and Source |
|---|---|
| Root restricting layer depth (mm) | Raster provided by Hengl et al. [41] |
| Precipitation (mm) | Historical (1981–2010) and future scenarios (2 °C increase) from the TerraClimate Project [20] |
| Annual Evapotranspiration (mm) | |
| Plant Available Water Content (PAWC) | A raster with the fraction of water in the soil that is available for plants’ use (from 0 to 1). Calculated in the software offered by the U.S. Department of Agriculture (USDA) [42], using the soil texture (percentage of clay, sand, and silt) from FAO [43]. |
| Land use/cover | Annual land use/cover, based on Landsat images, 30 m resolution [3] |
| Watershed polygons | Polygons are classified by the National Agency of Water (ANA, in the Portuguese acronym) according to the Pfafstetter Coding System. We used level 4 due to the similarity with the municipality’s area for management [44] |
| Biophysical table | Indicates the vegetation class in the land use/cover raster, the maximum root depth for vegetated land use classes (mm), and the plant evapotranspiration coefficient (Kc), according to the InVEST user guide. |
Table 4.
Land cover transition area matrix (km2) from 2001 to 2016, in Cerrado. Source: Elaborated with data from Mapbiomas [3].
Table 4.
Land cover transition area matrix (km2) from 2001 to 2016, in Cerrado. Source: Elaborated with data from Mapbiomas [3].
| 2016 | Total in 2001 | ||||
|---|---|---|---|---|---|
| Native Vegetation | Pasture | Cropland | |||
| 2001 | Native vegetation | 893,039.38 | 84,193.27 | 30,634.73 | 1,007,867.37 |
| Pasture | 24,155.22 | 689,192.30 | 86,388.01 | 799,735.53 | |
| Cropland | 485.24 | 6107.35 | 110,819.20 | 117,411.79 | |
| Total in 2016 | 917,679.84 | 779,492.92 | 227,841.94 | ||
Table 5.
Results of the land change modeling (km2) for the projected land cover transition from 2016 to 2046.
Table 5.
Results of the land change modeling (km2) for the projected land cover transition from 2016 to 2046.
| 2046 | Total in 2016 | ||||
|---|---|---|---|---|---|
| Native Vegetation | Pasture | Cropland | |||
| 2016 | Native vegetation | 611,097 | 58,612 | 82,864 | 752,573 |
| Pasture | 63,600 | 479,787 | 107,347 | 650,734 | |
| Cropland | 4077 | 4252 | 513,379 | 521,708 | |
| Total in 2046 | 678,774 | 542,651 | 703,589 | ||
Disclaimer/Publisher’s Note: The statements, opinions and data contained in all publications are solely those of the individual author(s) and contributor(s) and not of MDPI and/or the editor(s). MDPI and/or the editor(s) disclaim responsibility for any injury to people or property resulting from any ideas, methods, instructions or products referred to in the content. |
© 2023 by the authors. Licensee MDPI, Basel, Switzerland. This article is an open access article distributed under the terms and conditions of the Creative Commons Attribution (CC BY) license (https://creativecommons.org/licenses/by/4.0/).
Share and Cite
MDPI and ACS Style
Silva, D.S.; Arima, E.Y. Sustainability Consequences of Making Land Change Decisions Based on Current Climatology in the Brazilian Cerrados. Land 2023, 12, 914. https://doi.org/10.3390/land12040914
AMA Style
Silva DS, Arima EY. Sustainability Consequences of Making Land Change Decisions Based on Current Climatology in the Brazilian Cerrados. Land. 2023; 12(4):914. https://doi.org/10.3390/land12040914
Chicago/Turabian StyleSilva, Daniel S., and Eugenio Y. Arima. 2023. "Sustainability Consequences of Making Land Change Decisions Based on Current Climatology in the Brazilian Cerrados" Land 12, no. 4: 914. https://doi.org/10.3390/land12040914
Note that from the first issue of 2016, this journal uses article numbers instead of page numbers. See further details here.