Article

Assessment and Prediction of Landscape Ecological Risk from Land Use Change in Xinjiang, China

1
School of Economics and Management, University of Chinese Academy of Sciences, Beijing 100190, China
2
Natural Resources Bureau of Xinjiang Production and Construction Corps, Urumqi 830000, China
3
Key Laboratory of Land Surface Pattern and Simulation, Institute of Geographic Sciences and Natural Resources Research, Chinese Academy of Sciences, Beijing 100101, China
4
Hebei Collaborative Innovation Center for Urban-Rural Integration Development, Shijiazhuang 050061, China
*
Author to whom correspondence should be addressed.
Land 2023, 12(4), 895; https://doi.org/10.3390/land12040895
Submission received: 26 March 2023 / Revised: 11 April 2023 / Accepted: 12 April 2023 / Published: 16 April 2023

Abstract

:
Land use change has significant impacts on the regional and global environment; thus, in-depth research on the associated ecological risks is necessary for promoting ecological restoration and sustainable development. Xinjiang, China, is characterized by a fragile ecological environment, and this study aimed to predict the land use change in the region in 2030 under different scenarios, including natural development, ecological conservation, and urban development, by using the PLUS model based on land use data from 2000, 2010, and 2020. Based on the landscape structure of regional ecosystems, we developed a comprehensive ecological risk assessment framework by utilizing a combination of landscape disturbance index, vulnerability index, and loss index. This framework allowed us to evaluate the spatiotemporal patterns and variations of landscape ecological risks under different scenarios in 2030. The study results indicate the following: (1) During the period from 2000 to 2020, the primary landscape type in Xinjiang was unused land. However, significant changes were observed in the area of cultivated land, mainly due to the conversion of grassland and construction land. The expansion of construction land during the urbanization process resulted in a decline in ecological landscapes, such as grassland, thereby weakening the ecosystem’s stability. (2) Under different simulation scenarios, the urban development scenario primarily led to the conversion of unused land into construction land, which is beneficial for economic development. On the other hand, the ecological conservation scenario resulted in a modest increase in construction land and a transformation of unused land into forest and grassland, which aligns with the principles of sustainable development. (3) Different scenarios in 2030 result in varying degrees of changes in each landscape type in Xinjiang, with the spatial distribution characteristics of landscape ecological risks remaining similar to those observed in 2020. Notably, under the urban development scenario, the area of lowest and medium risk areas decreases significantly while the area of higher and highest risk areas increases substantially. Conversely, under the ecological conservation scenario, the area of the lowest risk areas experiences a more significant increase. (4) Overall, the spatial differences in the ecological risk of Xinjiang’s landscape are significant, with HH and LL clustering types predominating and presenting a polarization pattern. The distribution pattern is low in the north and high in the central and southern parts of the study area.

1. Introduction

Land use/land cover change (LUCC) has a significant impact on regional ecological environmental changes and even global environmental changes [1]. With the advancement of technology and the accelerating process of urbanization, the contradiction between land supply and demand is becoming increasingly prominent. Irrational land use can have negative impacts on the sustainable development of ecological, social, and economic systems, leading to a range of problems such as low land resource utilization efficiency, soil erosion, land degradation, and reduced biodiversity. This greatly increases the ecological risks and threatens the stability of ecosystems [2,3,4,5]. With the aggravation of ecological environmental problems, LUCC and ecological environment protection have become one of the world’s hot issues. Land use change has a significant impact on the function, structure, and quality of ecosystems [6]. Therefore, it is urgently necessary to conduct in-depth research on the ecological risks caused by land use change, promote ecological restoration and sustainable development, and provide strong scientific evidence for the study of the harmonious relationship between human behavior and the ecological environment in the future [7].
Risk assessment began in 1980. Initially, scholars conducted risk research on the toxicity and human health effects of chemical pollutants. It subsequently expanded to include the evaluation of the management of various chemical pollutants and the potential for environmental pollution incidents. Ultimately, the scope of risk assessment broadened to encompass the evaluation of ecological risks resulting from human activities. In 1992, the Environmental Protection Agency (EPA) defined ecological risk assessment as the process of evaluating the potential adverse ecological effects resulting from one or more external factors [8]. This framework was subsequently expanded and modified to form the basic guidelines for current risk assessment [9]. Since the 1990s, the increasing prominence of ecological and environmental issues has shifted attention from human health assessment to ecological risk assessment, with the risk receptors expanding from individuals to populations, communities, and entire ecosystems [2,10]. During the 1990s and early 21st century, the ecological risk assessment system underwent a continuous process of improvement and maturation. As a result, the field of ecological risk assessment gradually expanded, and it became increasingly apparent that regional ecological risk assessment must be integrated with considerations of the economy, society, and culture to fully realize its potential in informing management decisions.
Land use change can have direct or indirect impacts on regional natural ecological systems such as soil, atmosphere, and water environment, leading to various ecological risks [11,12]. With the rapid development of “3S” (GPS, RS, GIS) technology, ecological risk assessment based on land use change has been widely applied [13]. Currently, simulating land use change scenarios and predicting the distribution of ecological risks under different situations are beneficial for establishing an ecological risk warning system and accurately and effectively controlling ecological risks. It has become one of the research hotspots for ecological risks of land use change. For example, Zhou et al. used the Markov model and landscape indicators to analyze and construct an ecological risk assessment model, revealing the impact of land use change on ecological risk in the typical resource-based city of Huaibei, China [14]. In order to make the simulation results more objective and comprehensive, some scholars used the gray Markov model to construct the CLUE-S model to simulate three spatial patterns of land types in the eastern Tibetan Plateau and explore three different scenarios under ecological risk status [15]. Xu et al. proposed a Markov-FLUS composite model for land use simulation to predict land use change under natural growth and ecological conservation scenarios [16].
There are two main methods for assessing ecological risks. The first is the ecological risk assessment system based on the “pressure-receptor-response” model and failure mechanisms [17]. This ecological risk assessment system consists of risk source intensity, receptor exposure, and risk effects, and the assessment method is the Relative Risk Model (RRM). This assessment system focuses on pressure sources and habitats of concern in the study area. For example, Guo et al. used RRM to evaluate regional land ecological risks in Daye, a mining city in China [18]. Based on the different ecological risk characteristics of sub-regions, corresponding focuses were proposed for the evaluation and management process. However, this model is more suitable for large-scale regions that need to focus on multiple pressure sources, and is commonly used to assess ecological risks of specific pressures or disturbances, with certain limitations. The second method of ecological risk assessment is based on deviation from the optimal model, which considers the entire system as a receptor. This method is commonly used to evaluate ecological risks in the entire region based on land use changes. For example, Liang et al. proposed a new ecological risk assessment framework for land use change based on the classic framework of disaster risk assessment [19]. They simulated and predicted the possibilities of future land use changes and the resulting hazards in ecologically fragile areas of the Qinghai–Tibet Plateau. When conducting comparative analyses of different time series in the same study area, it is difficult to obtain RRM evaluation data and completely unified evaluation standards. Therefore, based on the support of landscape ecology theory, the landscape loss model based on land use change can both quantitatively describe landscape structure [20,21] and explain the evolution mechanism of landscape ecological risks from the perspective of spatial pattern changes. This model has become an important tool for analyzing and revealing the spatiotemporal characteristics of landscape ecological risks.
Currently, existing models for assessing ecological risk have some limitations, such as accuracy defects and weak performance in simulating the patch evolution of multiple land use types, especially for natural land use types. The PLUS model provides a support for high precision study of land use patch evolution. The PLUS model is a new and improved CA (Cellular Automata) model constructed on the basis of the FLUS model. It couples a new land use expansion analysis strategy and a CA model based on multi-class random patch seeds. On the one hand, it can better excavate the causal factors of various types of land use changes. On the other hand, it can also better simulate the multi-class land use patch-level changes. This study selects the Xinjiang Uyghur Autonomous Region of China as the study area and uses the PLUS model to conduct multi-scenario simulations of future land use changes in Xinjiang. Xinjiang has a diverse topography, landscape types, and faces issues with natural ecology and available land resources due to the arid climate and water scarcity. With increasing population and high-intensity oasis development, the fragile ecological environment in Xinjiang has been severely disturbed and damaged to varying degrees [22,23]. Under the influence of human activities, how will land use and landscape ecological risks change in Xinjiang? Furthermore, what changes will occur in landscape ecological risks under the influences of urban development and ecological conservation measures? These are critical issues that require in-depth discussion. Therefore, the objectives of this research paper are as follows: (1) Explore the spatial and temporal patterns of land use evolution in Xinjiang from 2000 to 2020. (2) Use the PLUS model to predict land use changes in Xinjiang in 2030 under natural development scenarios, urban development scenarios, and ecological conservation scenarios. (3) Assess the ecological risk of the landscape under different scenarios in 2030 and analyze its spatial and temporal patterns and change characteristics. This research can provide reference for the theory and method of ecological risk assessment, and provide scientific basis for land use planning and decision-making in Xinjiang, which can help to achieve sustainable development of the ecological environment in Xinjiang.

2. Study Area and Data Sources

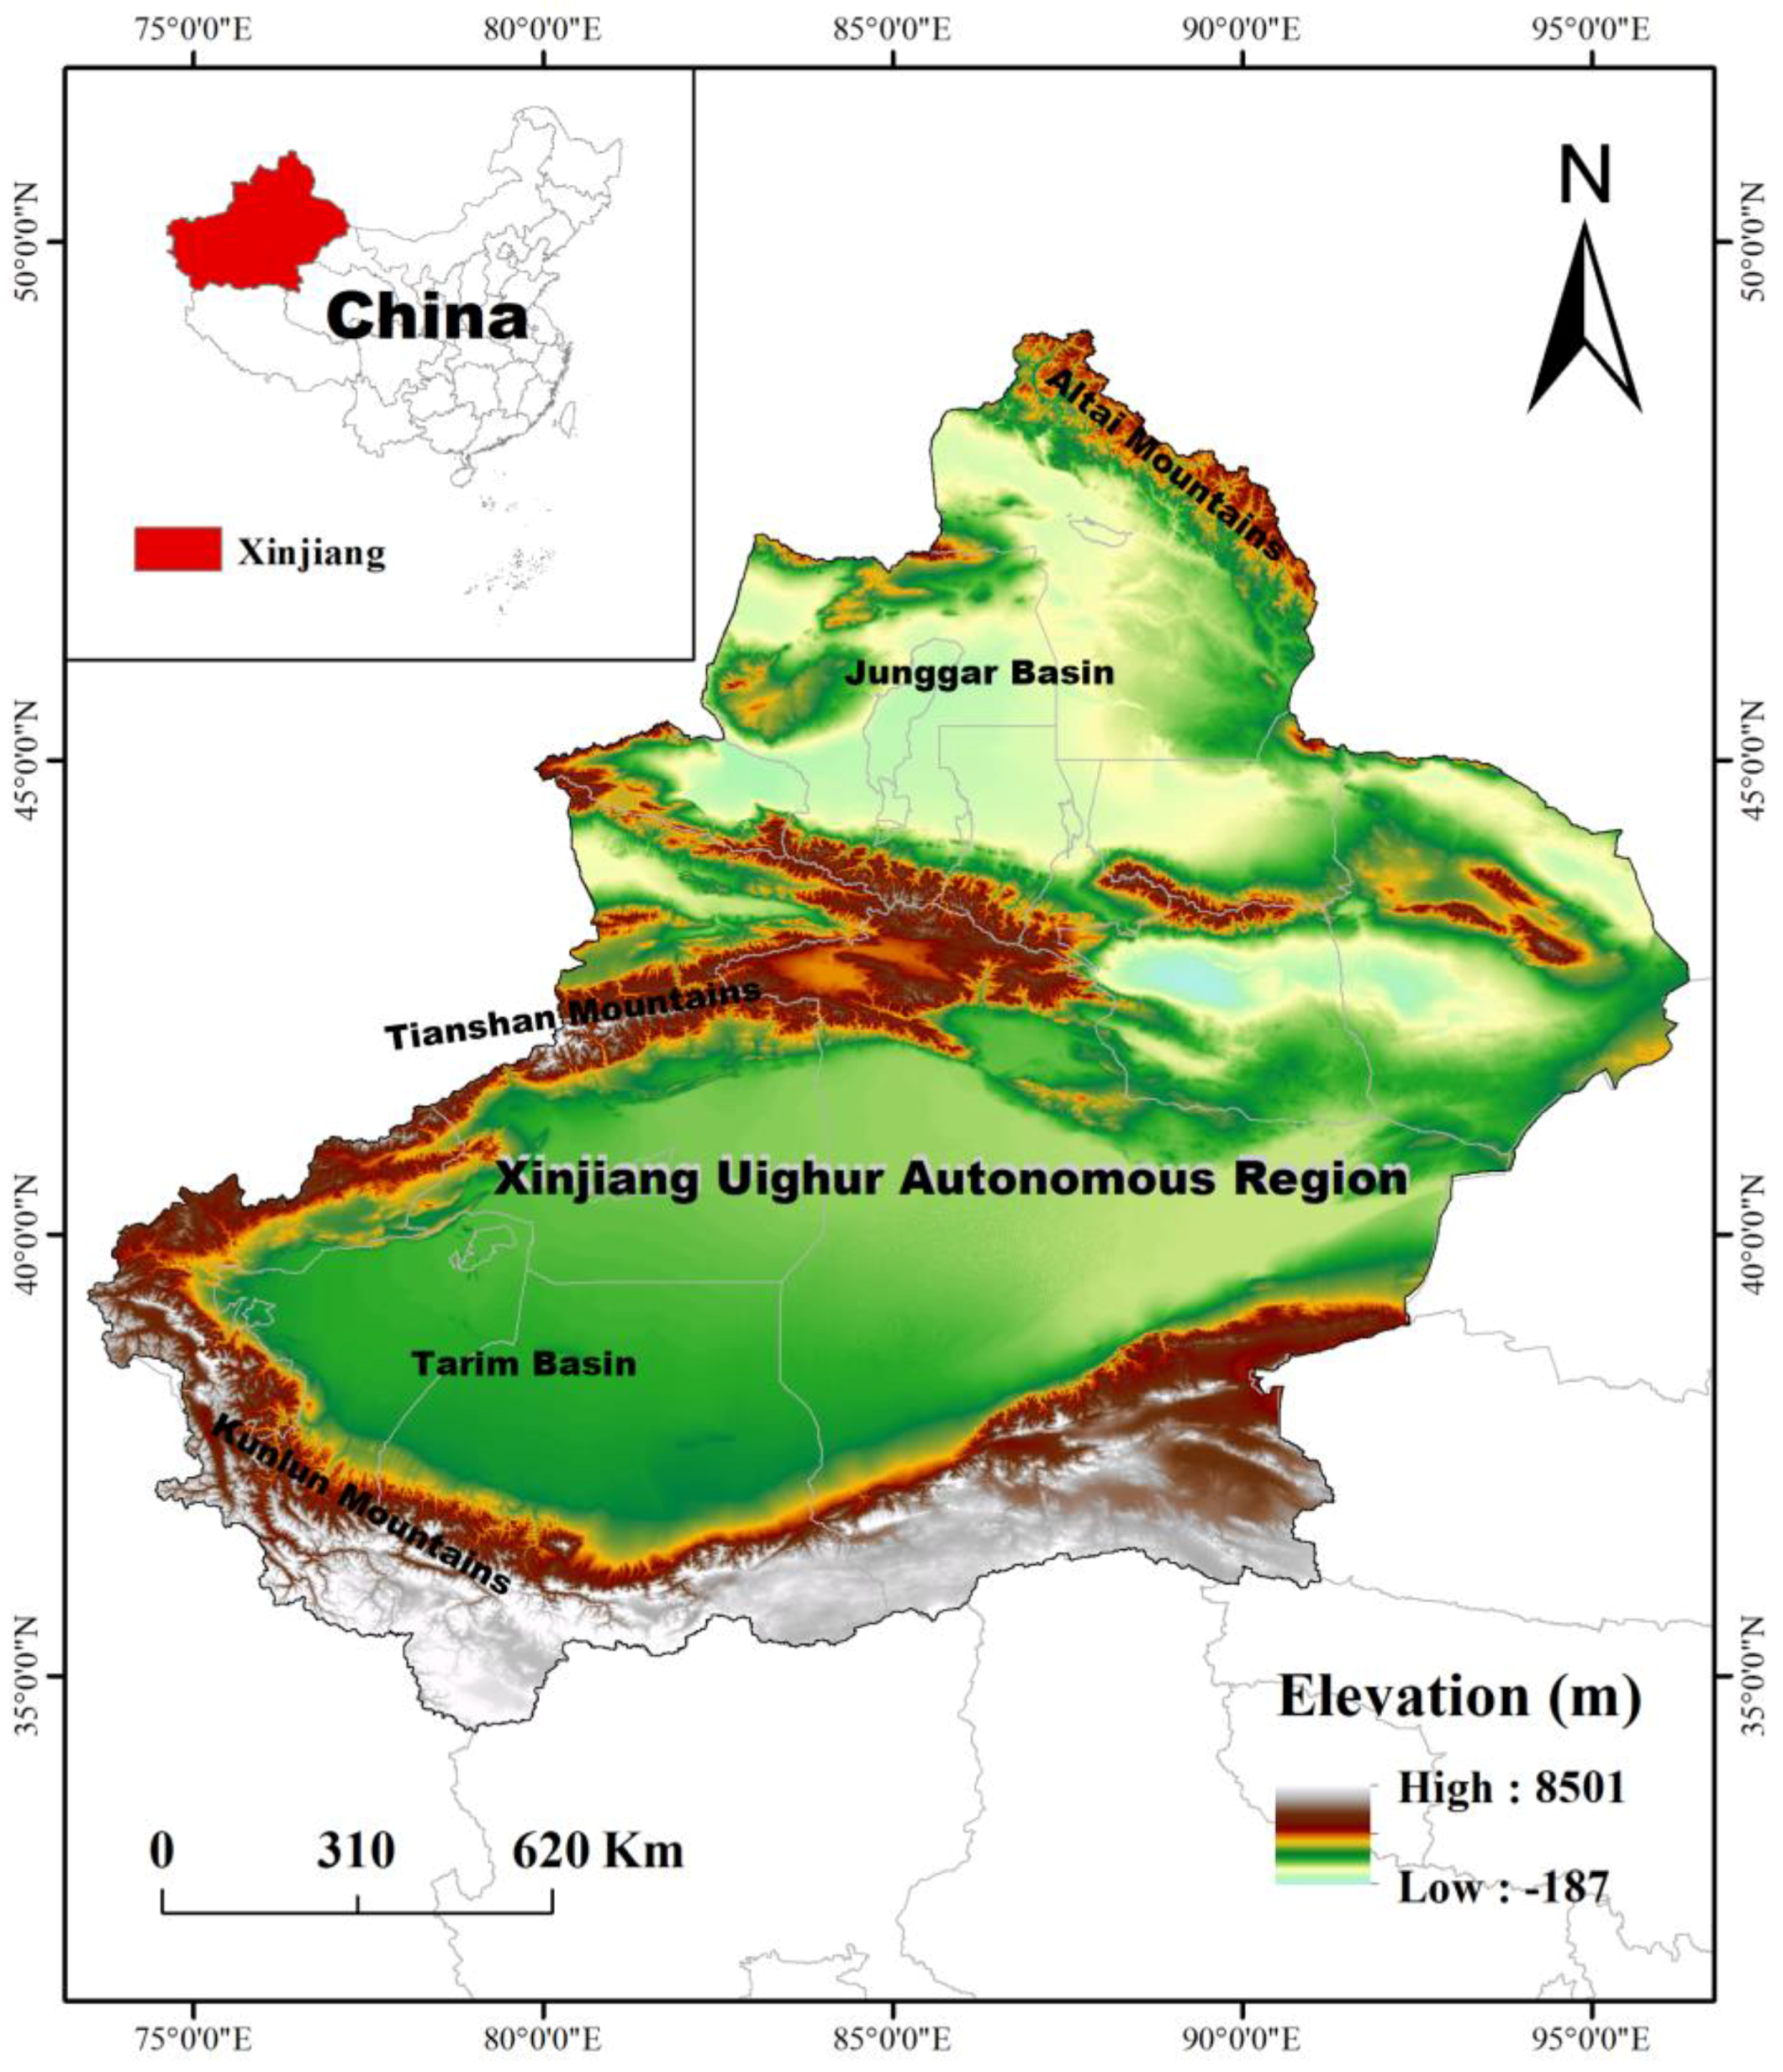
2.1. Overview of Study Area

Xinjiang Uygur Autonomous Region, abbreviated as Xinjiang, is located between longitude 73°40′–96°18′ E and latitude 34°25′–48°10′ N (Figure 1), in the hinterland of Northwest China and the Eurasian continent [24]. It is the largest provincial-level administrative region in China in terms of land area [25], with a total land border of more than 5600 km, bordering eight countries, and a total area of approximately 1.6649 million km2. The terrain is characterized by a combination of mountains and basins [26], including the Altai Mountains, Tianshan Mountains, Kunlun Mountains, Junggar Basin, and Tarim Basin, forming a topographical and ecological landscape pattern of “three mountains and two basins” and “mountains–oasis–desert” [27]. Xinjiang is located in the arid region of western China and has a typical temperate continental climate, with an average annual temperature of 9.72 °C and average annual precipitation of 135.31 mm [28]. In addition, abundant sunshine is a characteristic of Xinjiang’s climate, with a total annual sunshine duration of 2550–3500 h and a large amount of solar radiation energy received on the ground.

2.2. Data Sources

2.2.1. Land Use Data

The land use remote sensing monitoring data of Xinjiang used in this study include data from three periods: 2000, 2010, and 2020, with a spatial resolution of 30 m. The data were sourced from the Resource and Environmental Science and Data Center of the Chinese Academy of Sciences (http://www.resdc.cn (accessed on 10 January 2023)) [29]. This dataset is based on Landsat remote sensing images as the main source of information and is constructed through manual visual interpretation. It has high accuracy, reaching above 90% [30]. The dataset categorizes land use types into six distinct categories based on land resources and their utilization attributes. These categories include cultivated land, forest land, grassland, water area, construction land, and unused land. The unused land category includes land that has not been utilized, including land that is difficult to use, such as sandy land, Gobi, bare land, and bare rocky land.

2.2.2. Natural Geography Data

The physical geography data include digital elevation model (DEM), slope, aspect, annual precipitation (PRE), annual average temperature (TEM), distance to rivers, and boundary data of Chinese nature reserves. The slope and aspect data are extracted from the DEM data. The data for annual precipitation, annual average temperature, and boundary data of Chinese nature reserves are obtained from the Chinese Meteorological Element Annual Spatial Interpolation Data Set provided by the Resource and Environmental Science and Data Center of the Chinese Academy of Sciences (http://www.resdc.cn) [29].

2.2.3. Socio-Economic Data
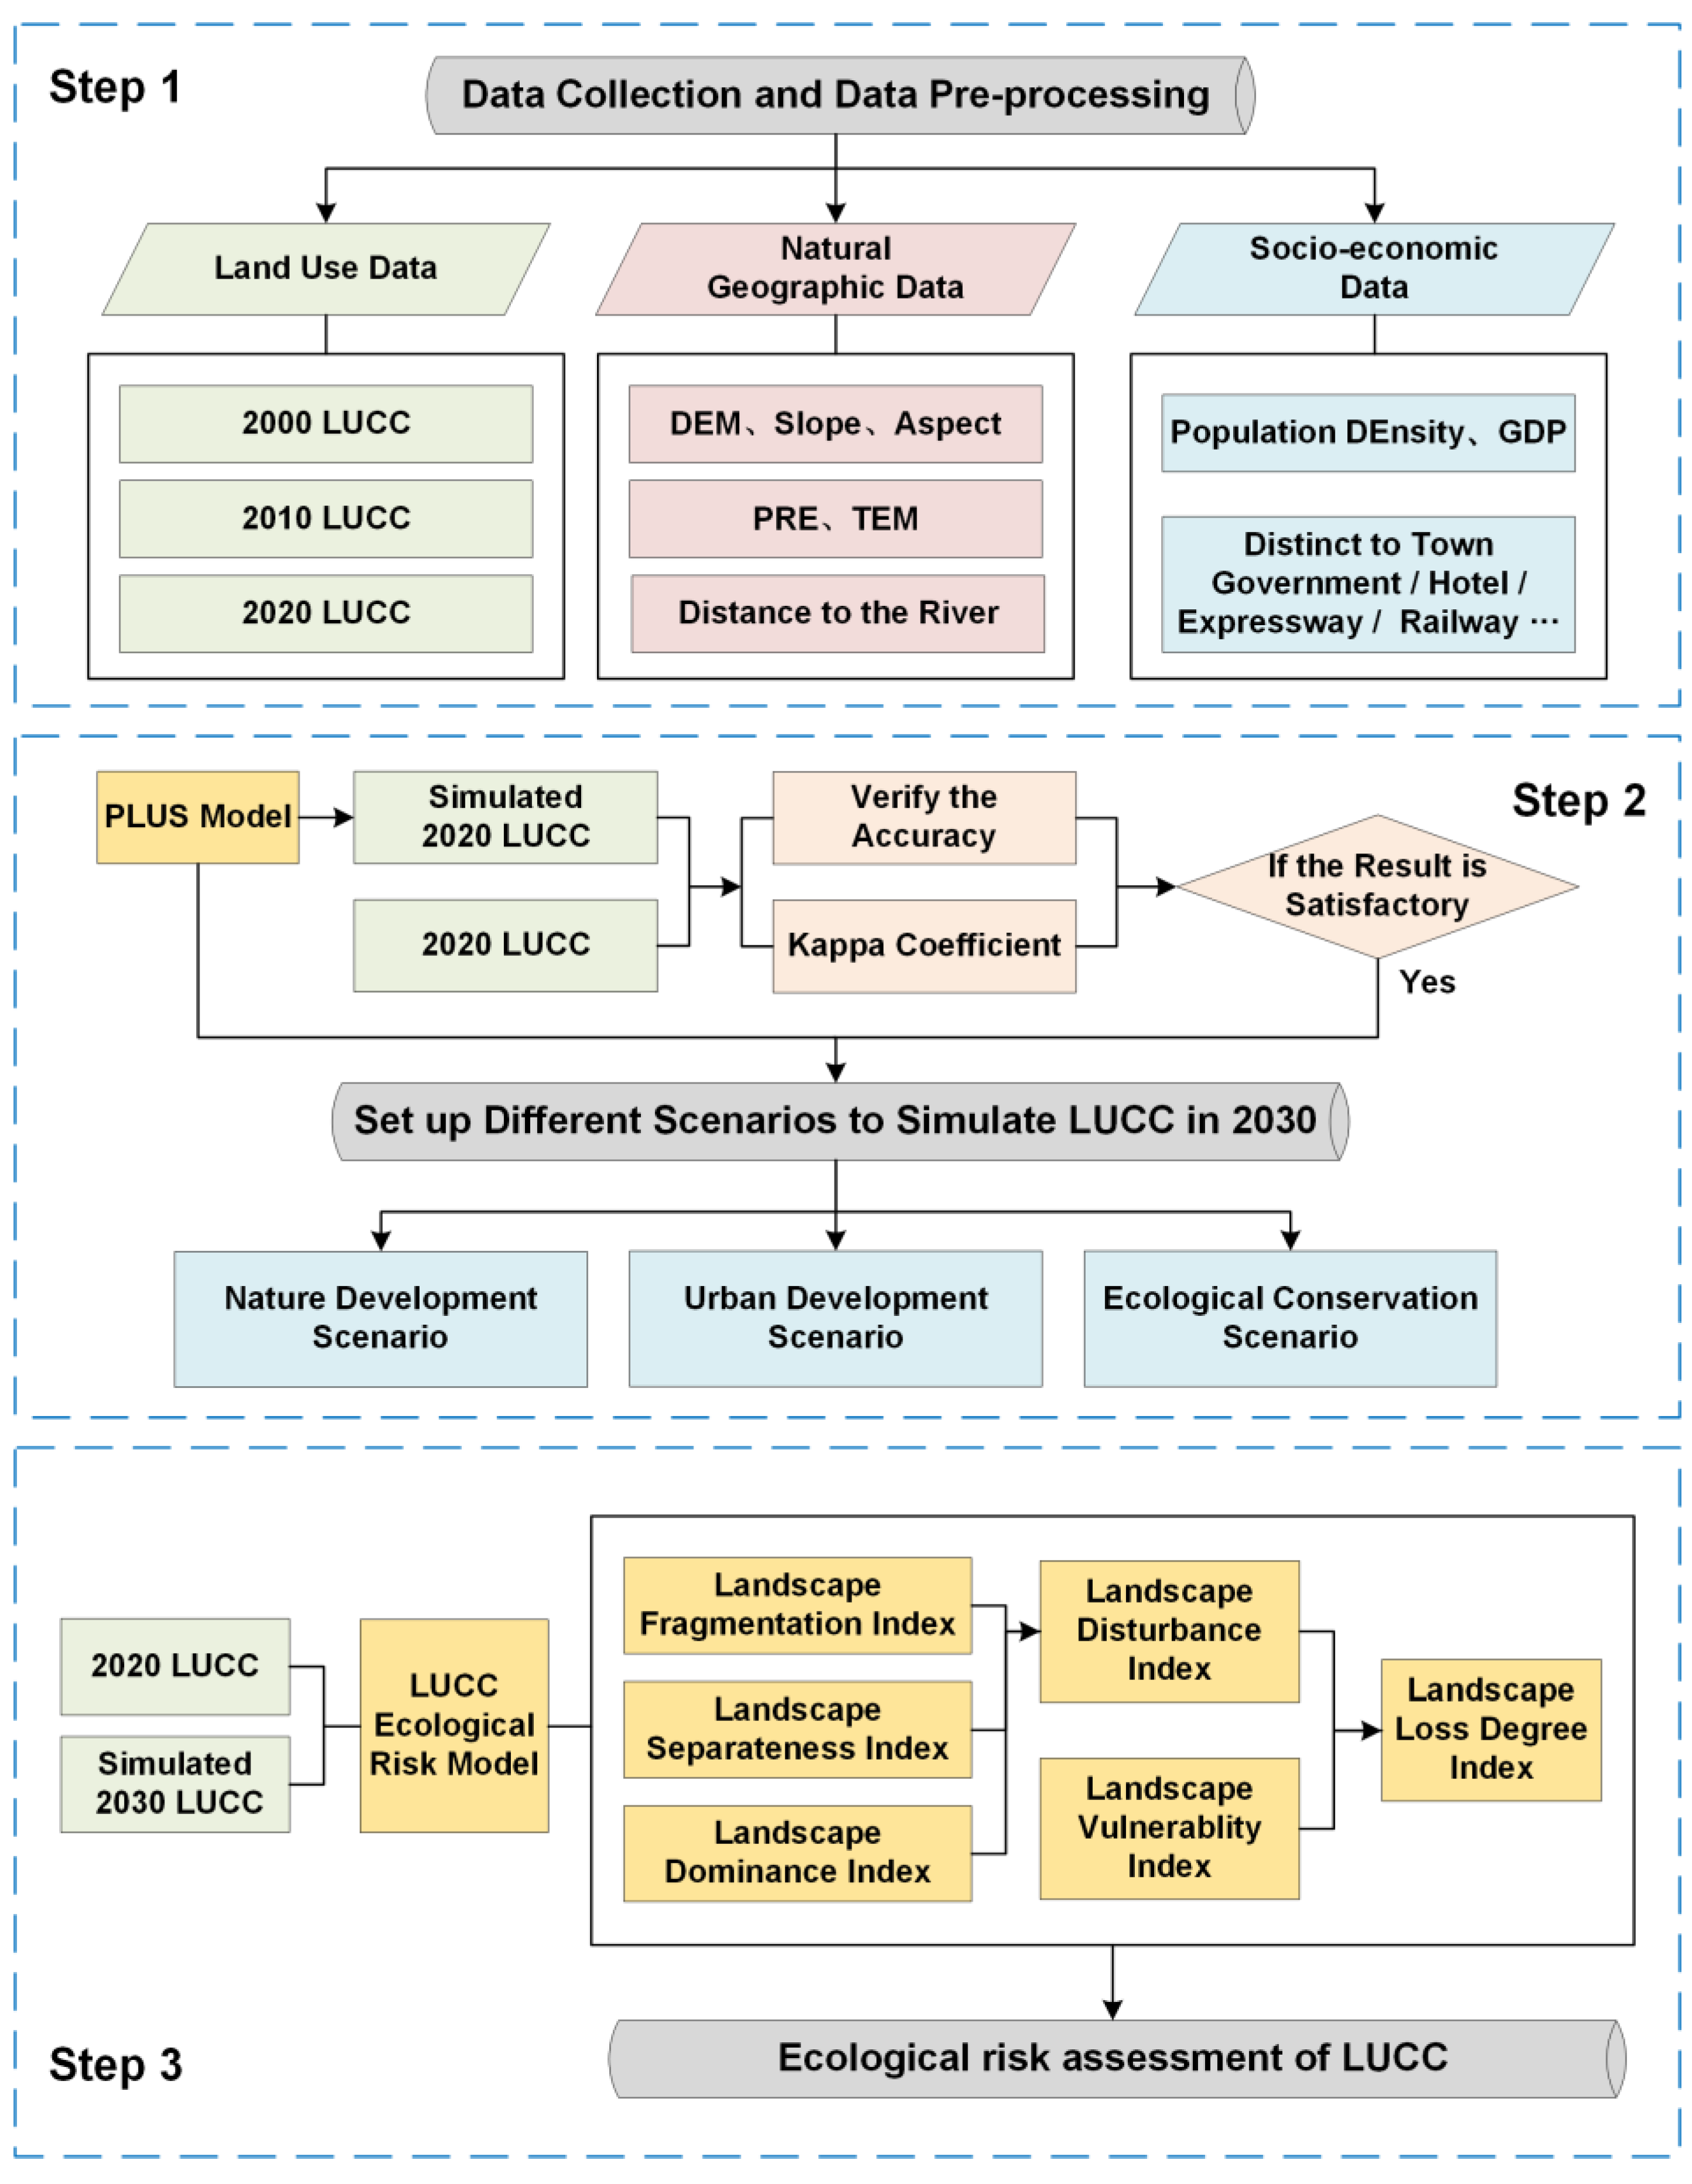
The socio-economic data include distance to town government, distance to hotels, distance to highways, distance to national highways, distance to provincial highways, distance to railways, distance to county roads, distance to primary roads, population density, and Gross Domestic Product (GDP), all with a spatial resolution of 1 km. The population density and GDP data are obtained from the Resource and Environmental Science and Data Center of the Chinese Academy of Sciences (http://www.resdc.cn) [29]. The transportation network data are obtained from Open Street Map (https://www.openstreetmap.org (accessed on 10 January 2023)) [31], and the raster data are obtained through Euclidean distance analysis.

3. Research Methods

The landscape ecological risk assessment framework in Xinjiang consists of three main steps (Figure 2): data collection and pre-processing, simulation of land use change scenarios, and ecological risk assessment. The first step is to select the driving factors that affect land use change. Driving factors are selected from two aspects: physical geography (including 7 factors such as DEM, slope, and aspect) and socio-economic (including 10 factors such as population density and GDP). The second step is to simulate the land use change situation in 2020 using the PLUS model based on the selected driving factors. The simulation results are then compared with the actual situation in 2020 to test their accuracy. If the accuracy meets the requirements, different development scenarios (natural development scenario, urban development scenario, and ecological conservation scenario) are set, and the land use change situation in Xinjiang in 2030 under different development scenarios is simulated. The third step is to assess the landscape ecological risk in Xinjiang based on the land use change at different stages, and explore its spatial and temporal characteristics. The spatial autocorrelation of the ecological risk index is analyzed using Moran’s I index and local spatial autocorrelation analysis methods.

3.1. Land Use Transfer Matrix

The land use transfer matrix is a significant method to investigate the dynamic changes in land use during a specific time period. It represents the dynamic characteristics of the transfer structure and direction between land use types in the study area at the beginning and end of the study. The transfer matrix is a clear reflection of the sources, destinations, transfer areas, and incoming areas of each land use type transformation, and can provide important insights into the dynamic characteristics of land use change in a study area. It is expressed as follows:
A = ( A i j ) n × n = [ A 11 A 1 n A n 1 A n n ]
Here, a represents the area of each land use type, n represents the number of land use types, and i and j represent the land use types at the beginning and end of the study period, respectively. Aij represents the area of land type i transferred to land type j in the end of the study period. Based on the land use data from the two periods, the land use transfer matrix can be calculated using spatial overlay analysis in ArcGIS software, and the dynamic evolution process of different land use types can be analyzed.

3.2. Simulation of Land Use Change

3.2.1. Construction Method of PLUS Model

The PLUS model is a cellular automaton (CA) model that operates on raster data and is suitable for simulating land use and land cover change (LUCC) at a patch scale. The software installation package and code can be downloaded for free from the website (https://github.com/HPSCIL/Patch-generating_Land_Use_Simulation_Model (accessed on 10 January 2023)). In this study, the PLUS model was used for land use scenario simulation. The model overlays land use data from two different periods, extracts the changed data, randomly selects sample points, uses the random forest algorithm to train the data for each land use type, and obtains the conversion rules for the expansion patterns of different land use types. Secondly, the model utilizes a multi-type random patch seed mechanism based on threshold lowering to simulate the evolution of multiple land use types. Lastly, the optimal land use structure under different scenarios is determined using multi-objective optimization [32].

3.2.2. Model Parameter Setting

(1)
Cost Matrix and Setting of Expansion Constraints
The cost matrix represents the conversion rules between different land use types and reflects the potential for conversion between them. When a certain land use type cannot be converted to other land use types, the corresponding value in the matrix is 0; when it is allowed to be converted, the corresponding value is 1. Whether different land use types can be converted into each other cannot be directly determined, and the model cost matrix parameters under different scenarios need to be set according to their constraints. In this study, the ecological conservation areas in Xinjiang were set as restrictive areas to limit the conversion of land use types within these areas.
(2)
Contextual Factors
Contextual factors are weights assigned to each land use type, ranging from 0 to 1. A larger weight indicates that the land use type is more difficult to convert into other land use types, and has a stronger expansion capacity. Conversely, a smaller weight indicates that it is easier to convert into other land use types. Through analyzing the actual situation of land use in the study area and combining with the land use transfer matrix, the contextual weights were obtained through debugging and validation in the PLUS software, with high simulation accuracy (Table 1).
(3)
Accuracy Verification
The Kappa coefficient combines map accuracy and user accuracy to assess the consistency between the predicted results and the monitoring results, and is widely used to evaluate the overall accuracy of simulated images [33]. The calculation formula is as follows:
K a p p a = P a P b 1 P b
In the formula, Pa represents the proportion of correctly simulated cells, Pb represents the expected proportion of correctly simulated cells, and 1 represents the proportion of cells that would be correctly classified by chance. The Kappa coefficient ranges from 0 to 1, with higher values indicating higher simulation accuracy. When the Kappa coefficient is greater than 0.75, it indicates a high level of consistency between the simulated and actual images, and a good simulation effect [34]. The accuracy of the simulation was tested by comparing the simulated data for 2020 with the actual data for 2020, and the Kappa coefficient was found to be 0.93, indicating a high level of simulation accuracy that meets the overall requirements for subsequent landscape ecological research.

3.2.3. Scenarios for Land Use Simulation

Different regions have different development needs. Based on the characteristics of land use change in Xinjiang and the guidance of urban development policies, this study sets three scenarios: natural development, urban development, and ecological conservation, to predict the land use change in Xinjiang by 2030.
Scenario One: Natural Development. This scenario is based on the land use change pattern from 2000 to 2020, following the current urbanization development mode without setting restrictions on the conversion among different land use types, and without government or market interventions. This scenario serves as the foundation for other scenarios.
Scenario Two: Urban Development. With the promotion of major project projects such as the construction of the core area of the Silk Road Economic Belt, Xinjiang is facing an important strategic opportunity period for high-quality economic development. Based on this, with the background of town development and in order to meet the needs of urban development, we set the scenario as follows: a 20% increase in the conversion probability from cultivated land, forest land, grassland, and unused land to construction land, and a 30% decrease in the conversion probability from construction land to other land use types except cultivated land.
Scenario Three: Ecological Conservation. The ecological protection scenario is to add ecological security protection constraints to the natural development scenario, aiming to protect the ecological environment and control the arbitrary transformation of the existing natural ecological land. Xinjiang is the ecological barrier of western China. Based on the protection of ecological environment, the expansion of construction land should be restricted, and the area of cultivated land, forest land, grassland and water area should be increased, while the unused land should be reasonably developed. We set the scenario as follows: the conversion probability from cultivated land and forest land to construction land is reduced by 30%, and the conversion probability from grassland and water area to construction land is reduced by 20%. The conversion probability from construction land to forest land is increased by 10%. The conversion probability from unused land to forest land, grassland, and water area is increased by 10%. The natural protected areas in the region are used as a constraint to limit their arbitrary conversion.

3.3. Landscape Ecological Risk Assessment

3.3.1. Division of Ecological Risk Assessment Units

In order to spatialize the ecological risk index, considering the scope of the study area, this study divided the study area into 5 km × 5 km ecological risk assessment units, totaling 68,784 units. The ecological risk index of each landscape type in each risk unit was calculated, and this was used as the ecological risk level of the center point of the risk unit [35].

3.3.2. Landscape Ecological Risk Index

To quantify the ecological risk in the study area, this research selected the landscape disturbance index, fragility index, and loss index to construct a comprehensive ecological risk index. The size of ecological risk depends on the strength of external disturbances on regional ecosystems and the resistance of internal factors. Different landscape types play distinct roles in maintaining biodiversity and facilitating natural evolution of the landscape structure, and exhibit varying degrees of resistance to external disturbances [2]. This study used the landscape structure as a starting point to analyze the size and changes in ecological risk in the watershed by calculating the ecological risk index for each landscape type in the ecological risk assessment units.
(1)
Landscape Disturbance Index
The landscape disturbance index is used to reflect the degree of external disturbance to the ecosystem represented by different landscapes, with higher levels of regional disturbance indicating greater ecological risk. Based on landscape pattern analysis, the landscape disturbance index E is constructed by adding various indices to reflect the degree of disturbance to the ecosystem represented by different landscapes [36], and its calculation formula is as follows:
E i = a C i + b N i + c D i
The coefficients a, b, and c represent the weights of C, N, and D, respectively, and a + b + c = 1. According to relevant literature, we assigned the values of 0.5, 0.3, and 0.2 to a, b, and c, respectively. C represents the landscape fragmentation index, which reflects changes in landscape structure, function, and ecological processes [37]. N represents the landscape isolation index [2], and D represents the landscape dominance index [36]. The calculation formulas are as follows:
C i = n i A i
N i = A 2 A i n i A
D i = Q i + M i 4 + L i 2
The formula shows that ni is the number of patches of landscape type i, Ai is the total area of landscape type i, A is the total landscape area. Qi is the number of sample units in which patch i appears divided by the total number of sample units, Mi is the number of patch i divided by the total number of patches, and Li is the area of patch i divided by the total area of sample units. The Fragstats software can be used to calculate the patch area and number of each land use type for the corresponding year.
(2)
Landscape Fragility Index
The landscape fragility index reflects the vulnerability of the internal structure of different landscape types, and can reflect the resistance of different landscape types to external disturbances. The smaller the ability of the landscape type to resist external disturbances, the greater the fragility and the higher the ecological risk [38]. In view of the actual situation of the study area, the fragility of landscape types in the study area is divided into six levels, from high to low: unused land, water bodies, cultivated land, grassland, forest land, and construction land. After normalization, the fragility index F of each landscape type is obtained.
(3)
Landscape Loss Degree Index
The landscape loss index R is used to reflect the degree of loss of the natural attributes of the ecosystem represented by different landscape types when subjected to natural and human disturbances [38]. It is calculated by adding different indices and is represented as follows:
R i = E i × F i
(4)
Landscape Ecological Risk Index
The landscape ecological risk index (ERI) reflects the overall ecological risk level of each risk unit [2], and its calculation formula is as follows:
E R I i = i = 1 N A k i A k R i
The ecological risk index of each risk unit is represented by ERIi, Aki represents the area of the ith landscape type in the kth risk unit, Ak represents the area of the kth risk unit, and Ri represents the landscape loss index of the ith landscape type.

3.4. Spatial Autocorrelation Analysis

Spatial autocorrelation analysis is a method used to represent the spatial distribution of a variable (ERI in our study) as a function of the spatial correlation between neighboring reference units. In our study, we used the GeoDa software to conduct global and local spatial autocorrelation analysis on the spatial distribution of landscape ecological risk in Xinjiang, which can reveal the clustering, dispersion, and randomness of landscape ecological risk in space [39]. The global spatial autocorrelation is represented by the Moran scatter plot and is calculated using the following formula [40]:
I = i = 1 n j = 1 n w i j ( x i x ¯ ) ( x j x ¯ ) S 2 i = 1 n j = 1 n w i j
S 2 = 1 n i = 1 n ( x i x ) 2
x ¯ = 1 n i = 1 n x i
where I is the global spatial autocorrelation Moran’s index, n is the total number of grid cells, xi (xj) represents the measure value of grid cell i (j), ( x i x ¯ ) represents the deviation of the measure value on the ith grid cell from the mean value, wij represents the standardized spatial weight matrix, and S2 represents the variance.
The local spatial autocorrelation (LISA) is used to calculate the degree of correlation between each spatial unit and its neighboring units for a certain attribute, which can detect spatial hotspots caused by spatial correlations and identify spatial differences [41]. The LISA distribution map is used to visualize the local spatial autocorrelation, and the calculation is shown in the following formula [42]:
I i = n ( x i x ¯ ) j i n w i j ( x i x ¯ ) i = 1 n ( x i x ¯ ) 2
Ii represents the local Moran’s index, and the other variables have the same meaning as in Formula (9). LISA identifies spatial clusters of landscape ecological security. In the LISA distribution map, H indicates that the data attribute value is higher than the mean, and L indicates that the data attribute value is lower than the mean. According to the clustering results, four cluster patterns can be divided: H-H clustering represents high-value areas surrounded by high-value neighbors, L-H clustering represents low-value areas surrounded by high-value neighbors, L-L clustering represents low-value areas surrounded by low-value neighbors, and H-L clustering represents high-value areas surrounded by low-value neighbors [43]. H-H clustering and L-L clustering indicate that the differences between the area and its surrounding areas are small, that is, high- or low-value-concentrated distribution areas, while LH clustering and HL clustering indicate that there are differences in variable values between the area and its surrounding areas [44].

4. Results

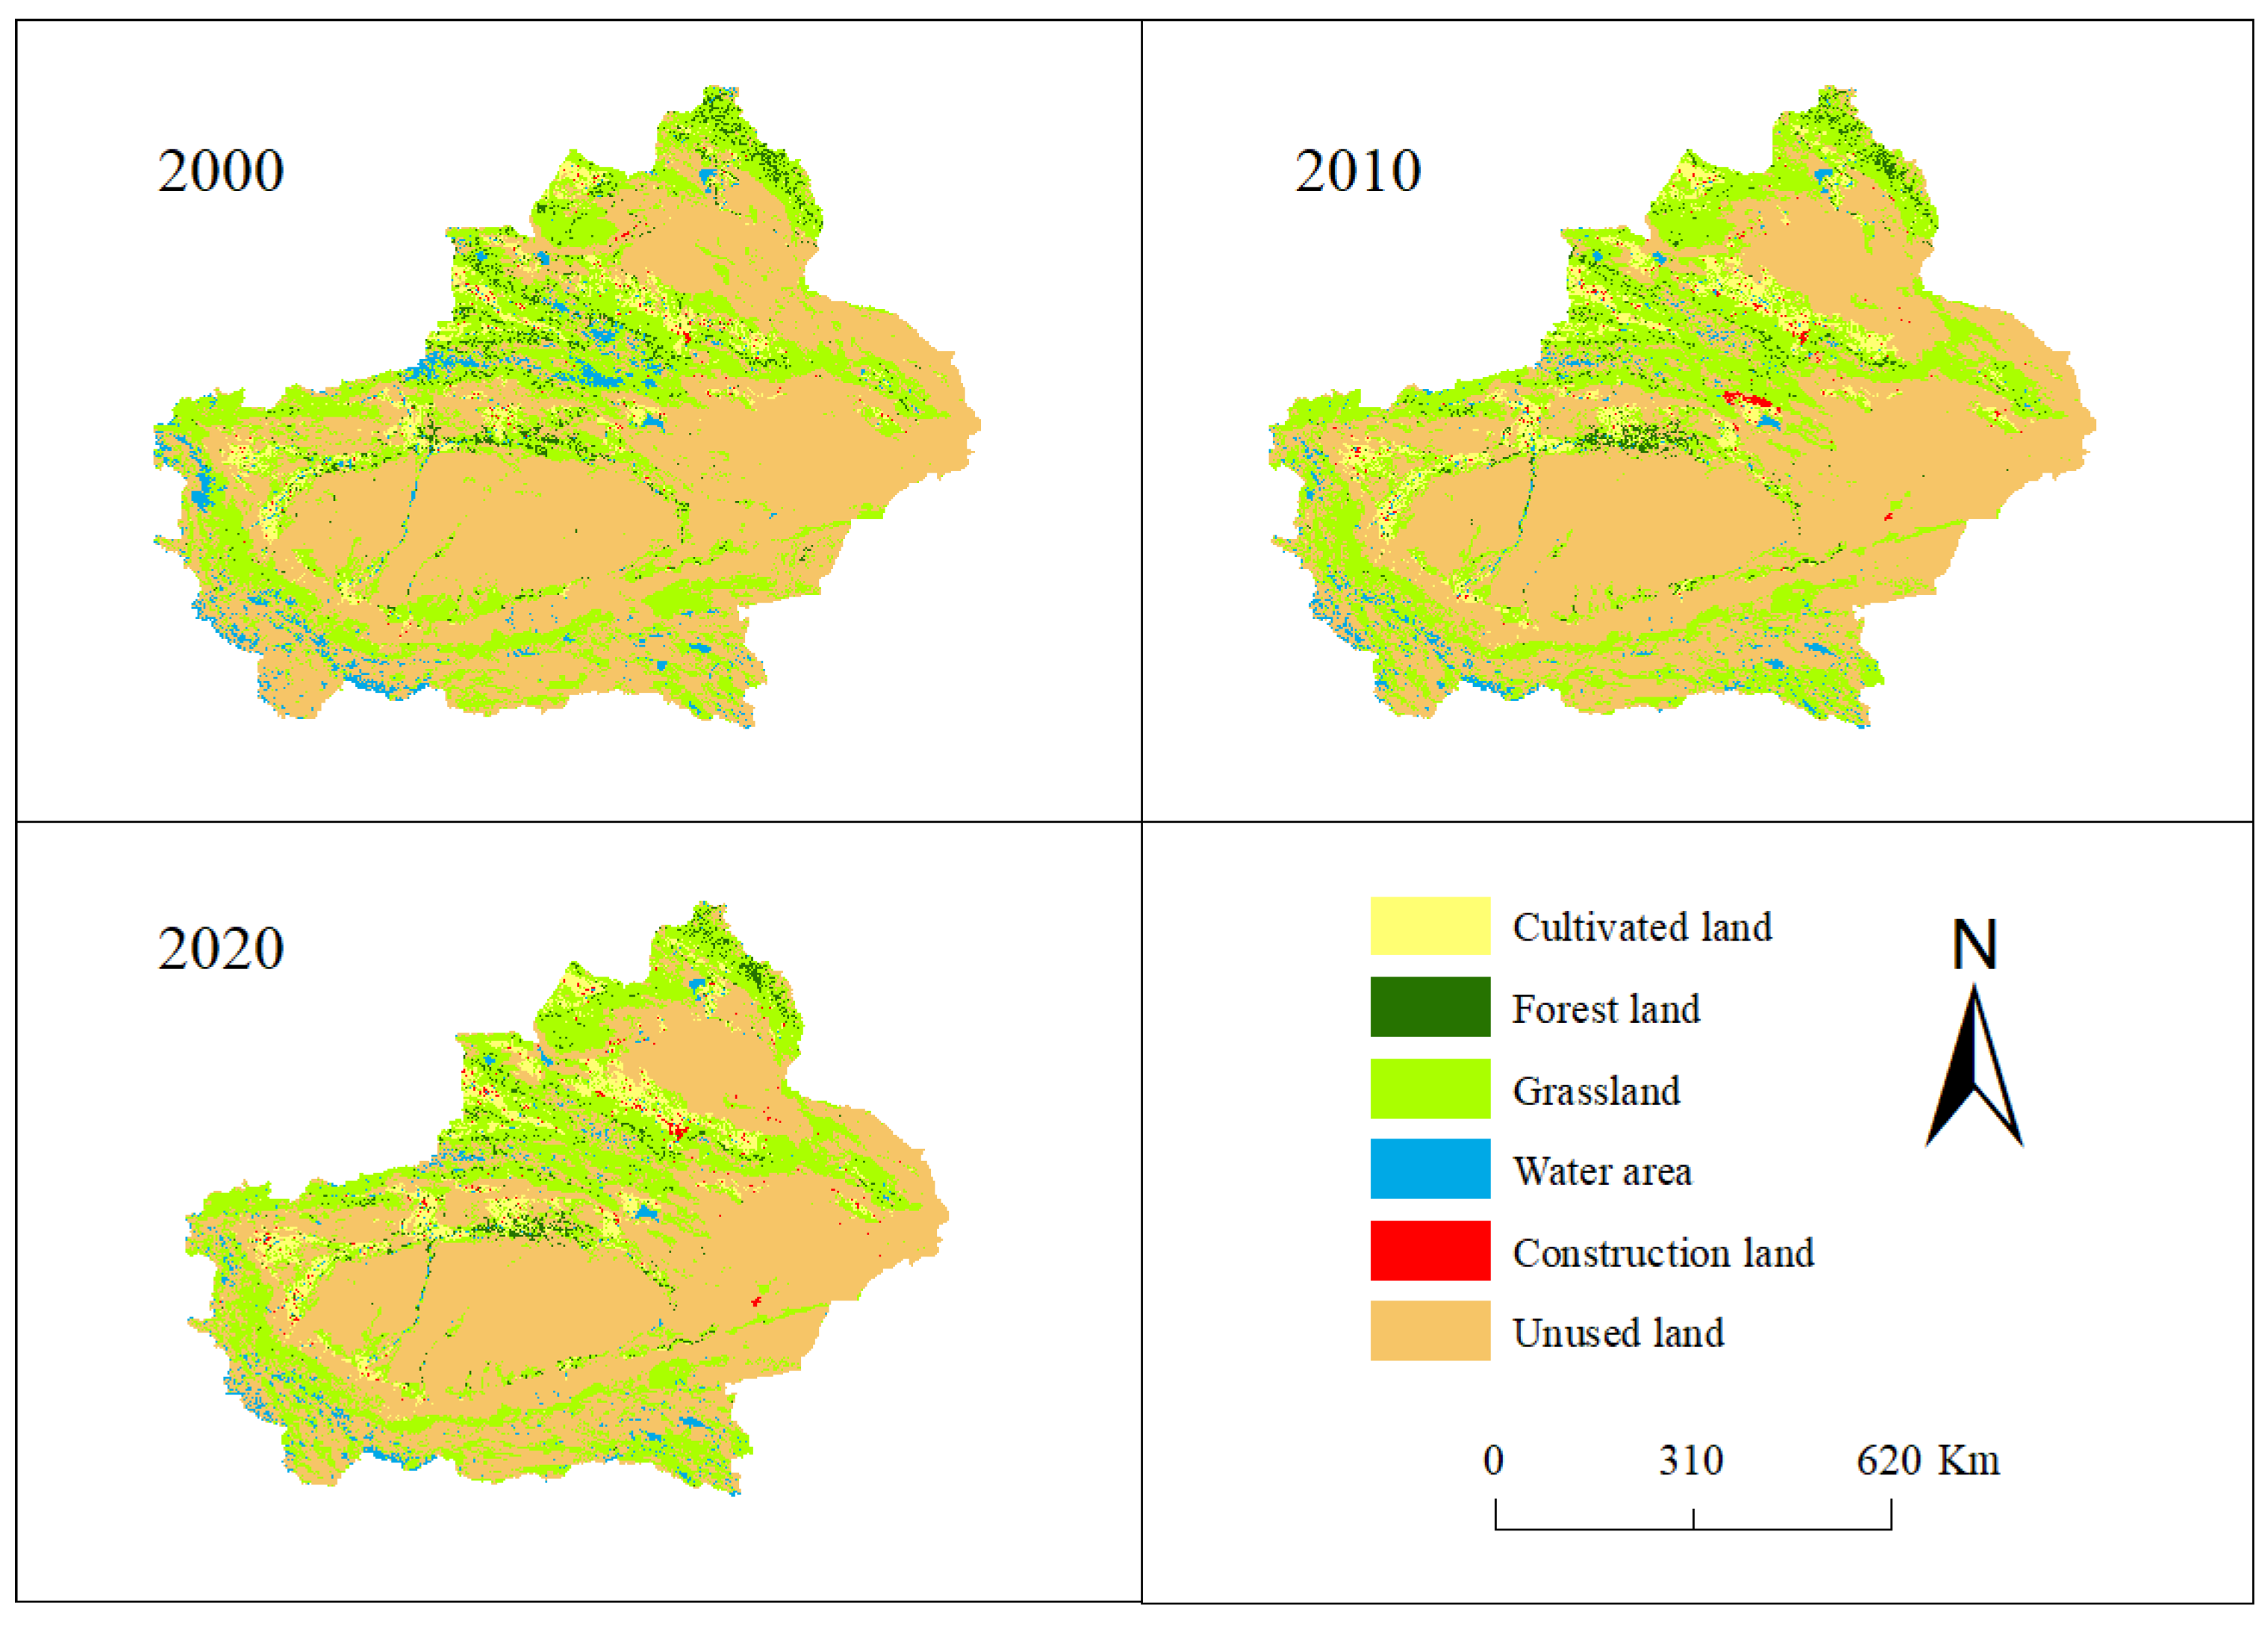
4.1. Spatial and Temporal Evolution of Land Use

Based on the land use status of Xinjiang in 2000, 2010, and 2020 (Figure 3), the area of each land use type in Xinjiang was calculated using ArcGIS software and presented in Table 2. In general, the land use types in Xinjiang include cultivated land, forest land, grassland, water area, construction land, and unused land. Over the past 20 years of the study period, the proportion of unused land in the total land area was the largest, making it the most significant land use type in Xinjiang. This is due to Xinjiang’s unique geographical location, surrounded by high mountains and with basins and desert areas, which are far away from the ocean and have low precipitation, resulting in a high proportion of unused land in Xinjiang.
In 2020, the land use types in the study area ranked in descending order by proportion of area are as follows: unused land, grassland, cultivated land, water area, forest land, and construction land (Table 2). We calculated the land use area transfer matrix in Xinjiang from 2000 to 2020 (Table 3), which indicates that cultivated land, grassland, and construction land have increased in area during the study period, while forest land, water area, and unused land have decreased overall. Cultivated land and construction land have shown a continuous increase, with an increase of 31,953.76 km2 and 4817.20 km2, respectively. This increase was facilitated by the implementation of national land policies that encouraged sustainable development practices. The increase in construction land is mainly due to the conversion of cultivated land, grassland, and unused land, caused by the expansion of urban land with economic and social development. Forest land and unused land have shown a continuous decrease, decreasing by 10,959.36 km2 and 13,389.96 km2, respectively, with forest land mainly being converted to grassland. Grassland is the second-largest land use type in Xinjiang, with an overall increase of 6019.40 km2, showing an increasing trend at first and then decreasing. Water areas have shown a decreasing trend first and then increasing, with an overall decrease of 18,302.88 km2, which may be related to climate change causing changes in ice, glaciers, and the equilibrium line.
From the perspective of spatial distribution of land use (Figure 3), the areas with the most frequent changes in land use in Xinjiang are mainly concentrated in the “three mountains” and oasis regions. Based on the spatial distribution of land use change in Xinjiang, there is a frequent conversion between grassland and unused land, with unused land being converted to grassland mainly in mountainous areas and grassland being converted to unused land mainly in oasis regions. Under the influence of global climate change, glaciers in the three major mountain ranges of Xinjiang have retreated to varying degrees. The melting of glaciers has improved the climatic conditions in mountainous areas, making it easy for unused land in mountainous areas to be converted into grassland, especially in areas previously covered by glacier snow. Since 2000, the climate in Xinjiang has undergone a significant shift from a “warm and humid” to a “warm and dry” condition, resulting in an increased susceptibility of the already unstable grasslands in oasis regions to conversion into unused land. The area of land converted to construction land is the smallest, with only 2147.72 km2 (0.13%). Water bodies are mainly converted to grassland and unused land, mainly in the Tian Shan and Kunlun Mountains regions.

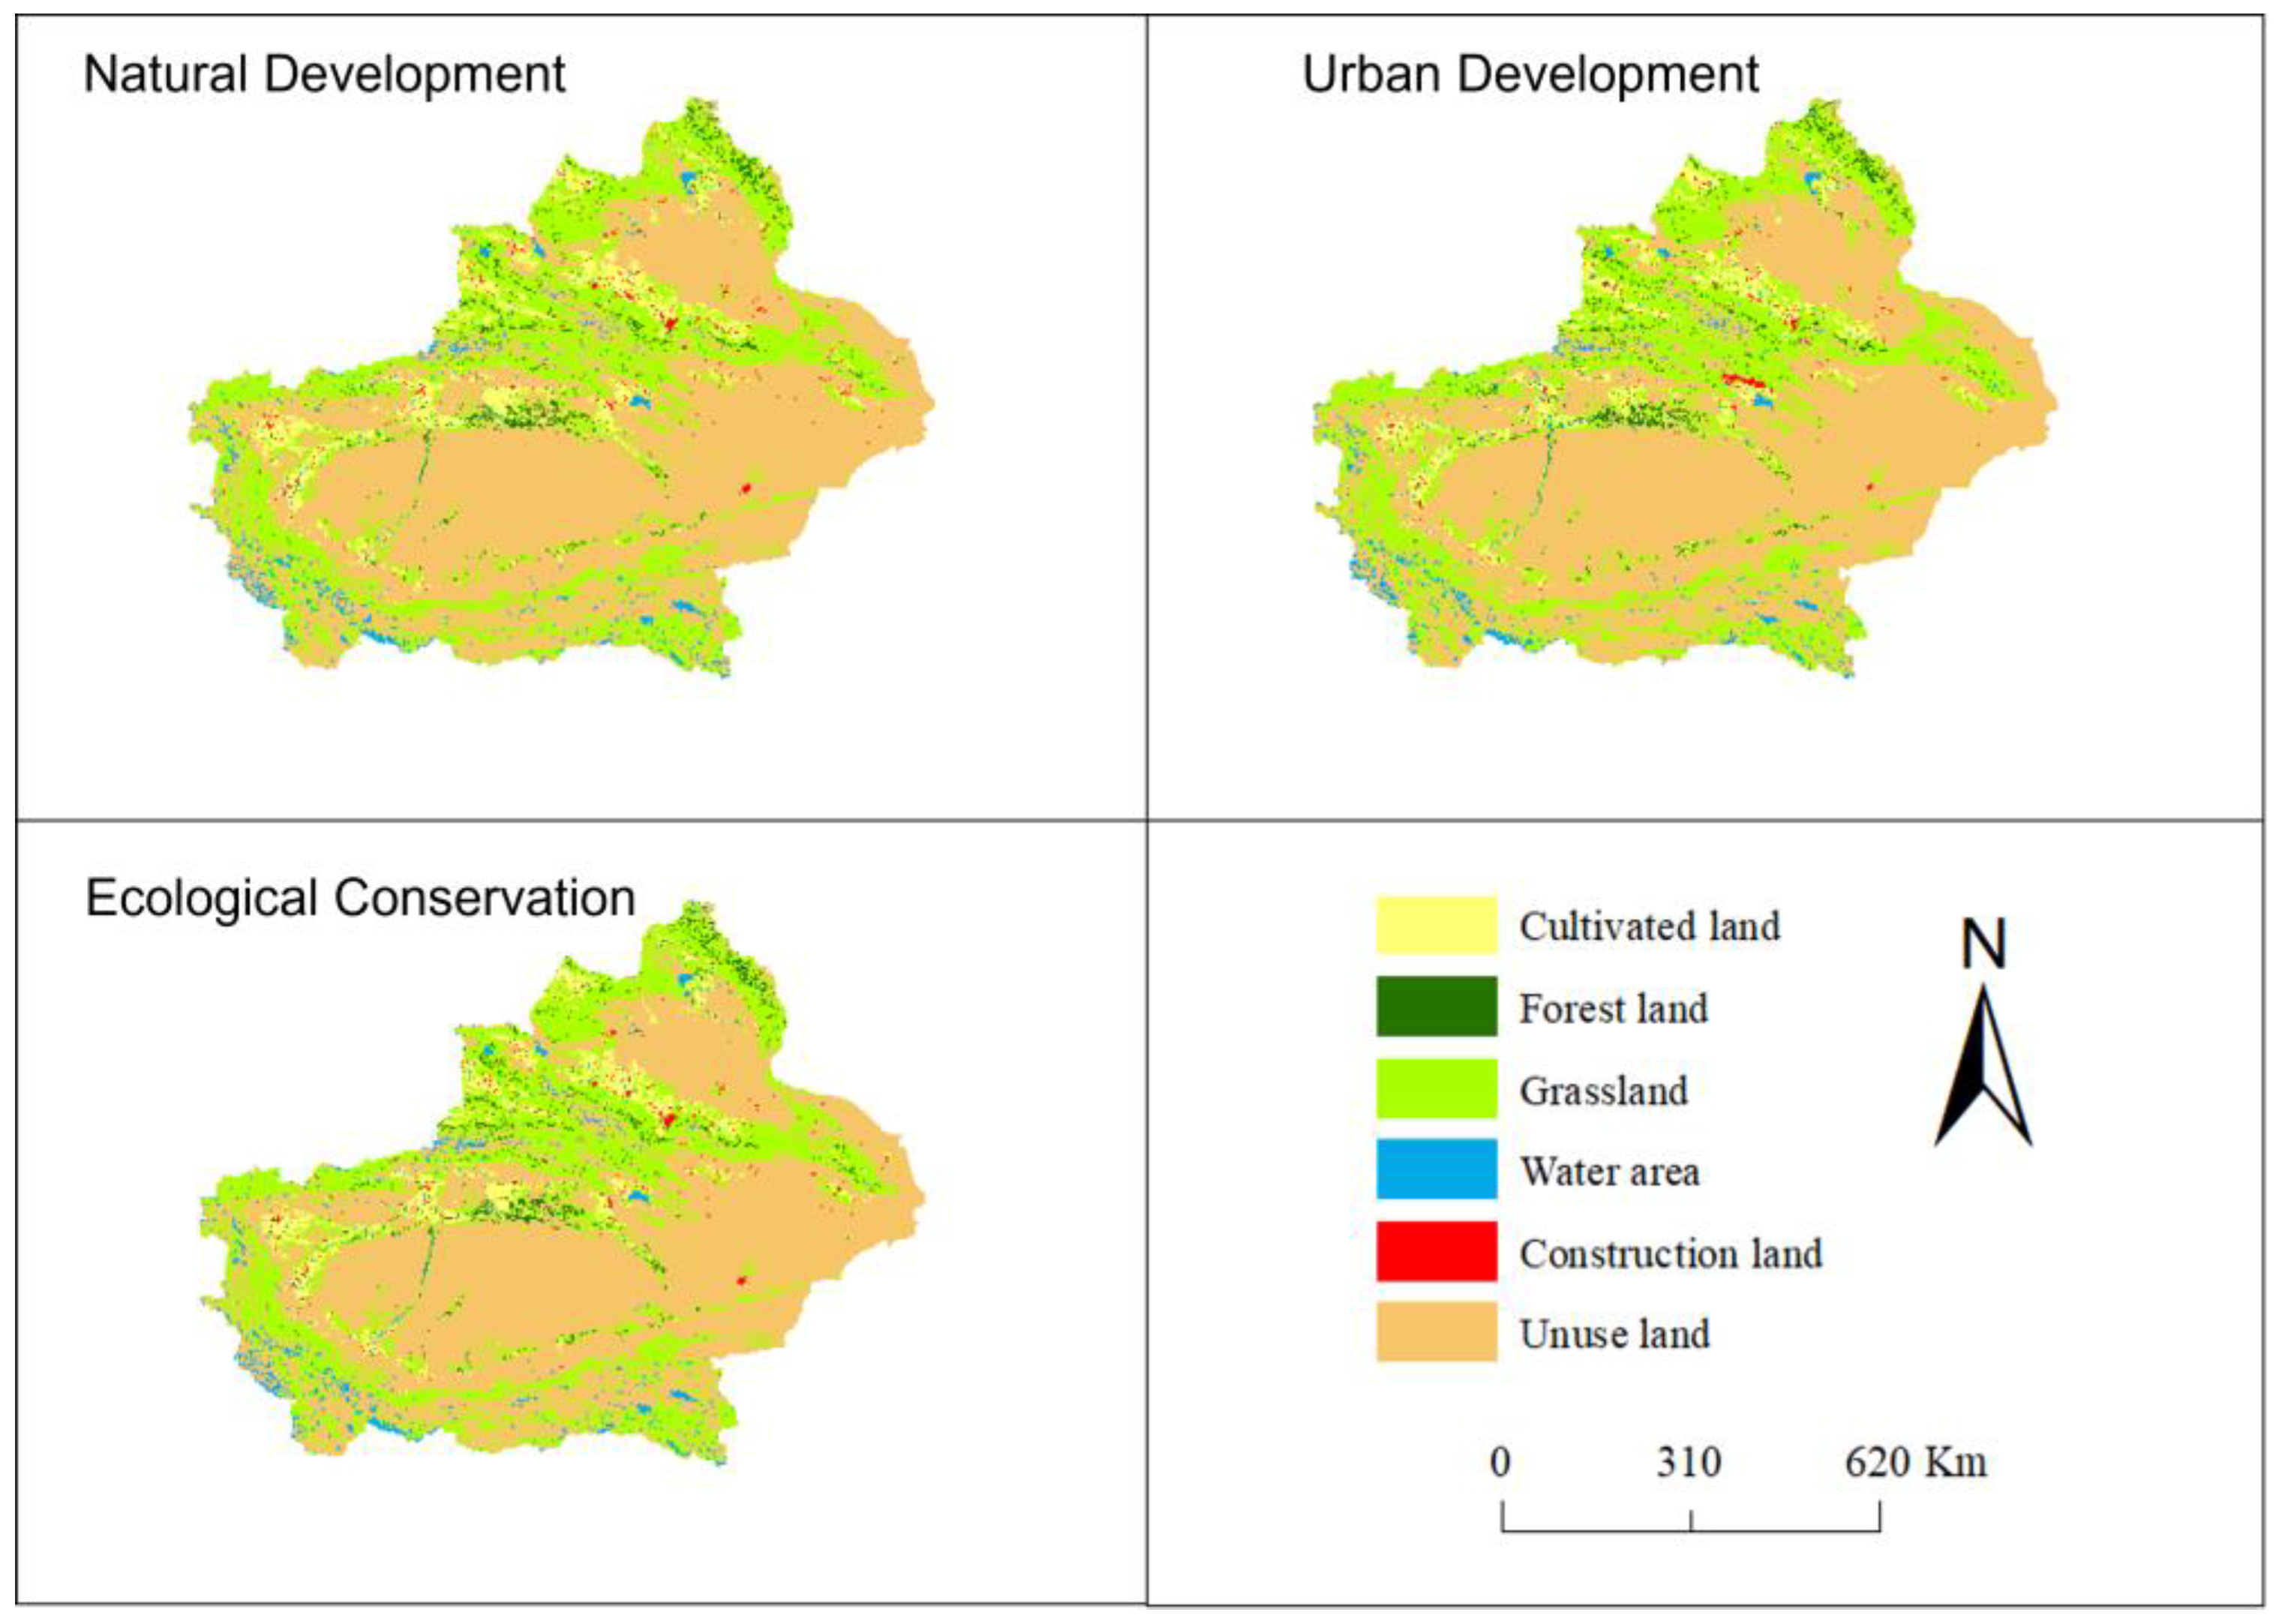
4.2. Simulation of Land Use Changes under Different Scenarios

The PLUS model was utilized to predict the 2020 land use based on the 2010 land use and relevant driving factors. Subsequently, the predicted data were validated using actual data, resulting in a high accuracy of 0.93 kappa coefficient and a good simulation effect of the PLUS model. Following this, the 2030 land use was predicted and simulated using the 2020 land use data and related influencing factors under different scenarios, including natural development, urban development, and ecological conservation. The simulation results are presented in Figure 4.

4.2.1. Natural Development Scenario

Under the natural development scenario, it is predicted that by 2030, the area of cultivated land, water areas, and construction land in Xinjiang will be 103,348.72 km2, 37,576.76 km2, and 3265.55 km2, respectively. From 2020 to 2030, there will be a positive change of 9402.12 km2, 1112.20 km2, and 882.84 km2, respectively.
The areas of forest land, grassland, and unused land will be 27,801.00 km2, 499,268.76 km2, and 1,016,016.32 km2, respectively, showing a decreasing trend, with a reduction of 683.08 km2, 3107.44 km2, and 7606.64 km2, respectively. The main types of land transformation under this scenario are cultivated land, grassland, water areas, and unused land. As this scenario is not constrained by other policy factors, its conversion rate is expected to remain roughly consistent with that of the 2010−2020 period, with an increase of 10.01% and 9.44% in the areas of cultivated land and construction land, respectively, and a decrease of 2.40% in the area of forest land. The expansion of cultivated land and construction land is significant, while forest land decreases slightly.

4.2.2. Urban Development Scenario

Compared to 2020, in the urban development scenario, the area of construction land in 2030 has increased to 11,537.32 km2, while the area of unused land has decreased by 8446.28 km2 to 1,015,176.68 km2. Compared to the natural development scenario, the urban development scenario is characterized by the conversion of unused land to construction land, with a significant increase in the area of construction land at an annual growth rate of 23.34%. The decrease in the area of forest land and grassland is roughly the same, with a decrease of 692.44 km2 and 3315.92 km2, respectively. Although the urban development scenario leads to economic growth, it does not sufficiently protect ecologically sensitive areas such as forests and grasslands, which are essential for maintaining ecological balance and biodiversity. Thus, it is not in line with the principles of sustainable development.

4.2.3. Ecological Conservation Scenario

Under the ecological conservation scenario, the area of cultivated land and forest in Xinjiang in 2030 will be 1940.96 and 3294.04 km2 respectively, and both will have different degrees of increase from 2020 to 2030. The area of grassland will increase significantly to 504,464.48 km2, while the area of unused land will decrease significantly by 8954.16 km2. The area of water and construction land will increase to 37,777.68 km2 and 9671.56 km2 respectively, and to some extent, construction land will meet the needs of economic and social development. The ecological conservation scenario mainly shows the conversion of unused land to forest and grassland. The increase in forest and grassland area is 2.07% and 11.56%, respectively. The scenario falls between the natural development scenario and the urban development scenario in terms of land use change and is consistent with the concept of sustainable development, promoting the co-development of ecological conservation and socio-economic development.

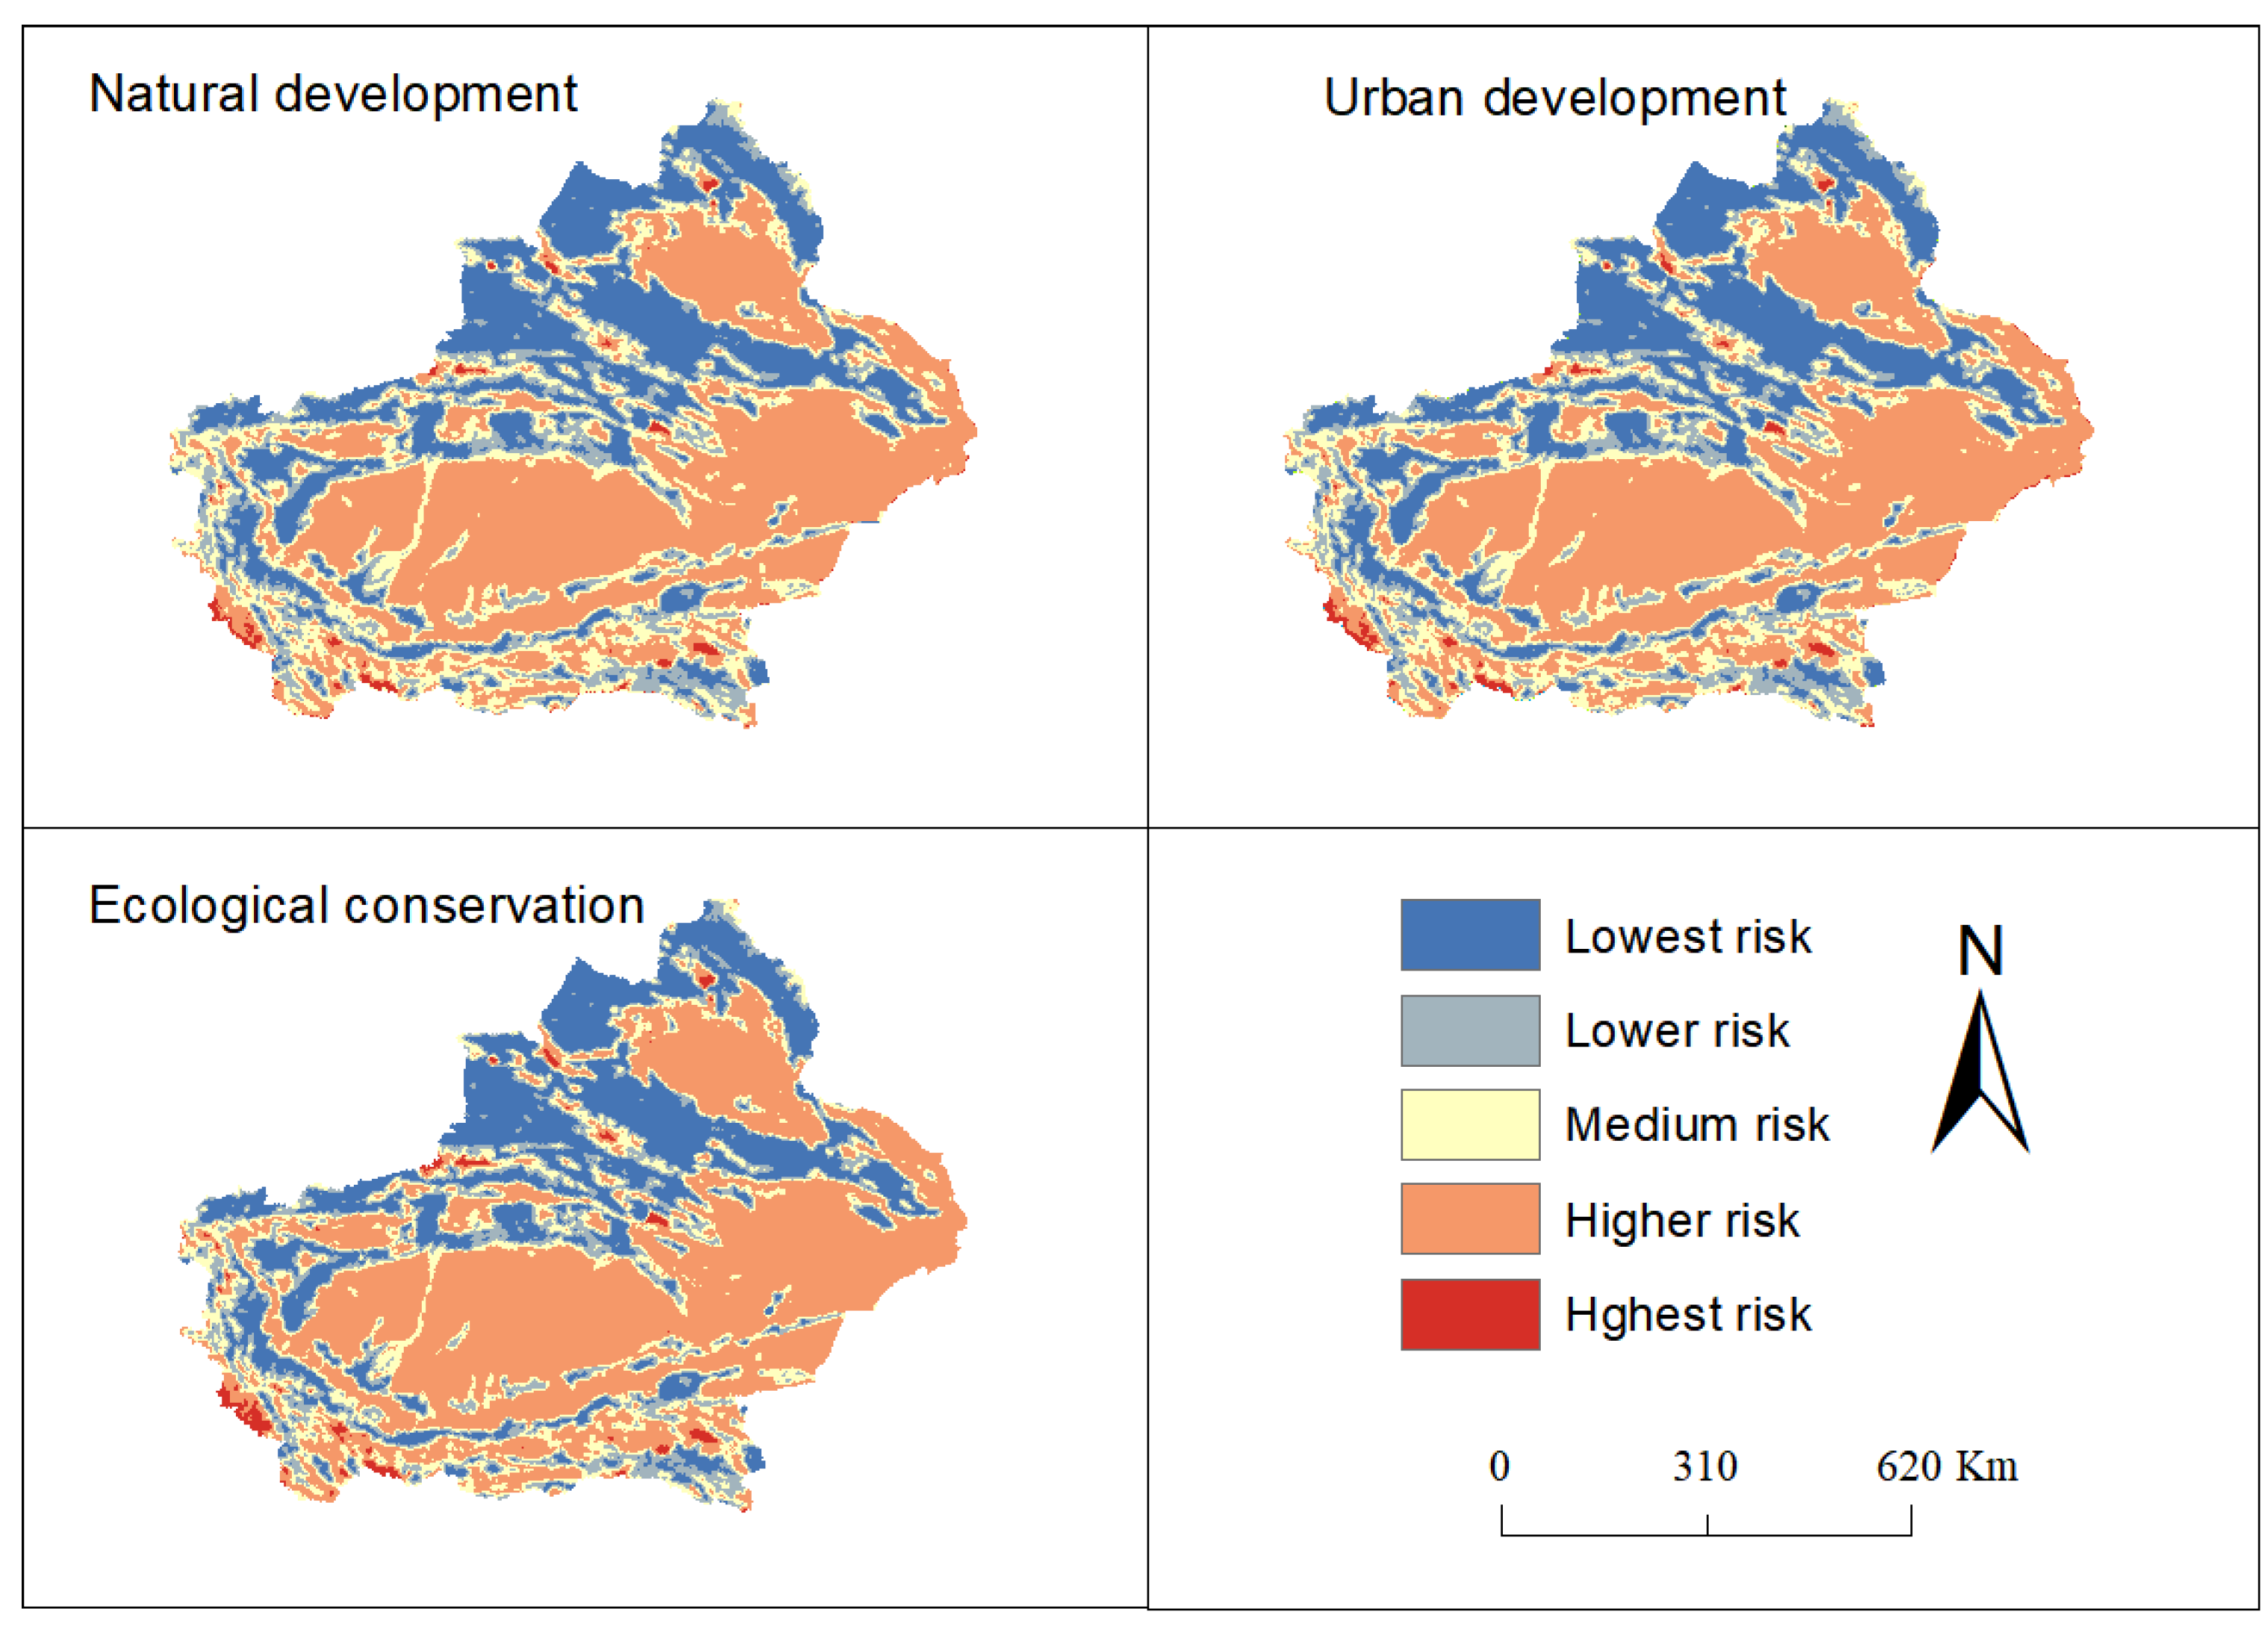
4.3. Spatial and Temporal Variation of Ecological Risk in the Landscape

We used the PLUS model to simulate the land use change in Xinjiang in 2030 under three different scenarios: natural development, urban development, and ecological conservation. In order to further explore the landscape ecological risks under different scenarios, we used a landscape ecological risk assessment model to calculate the landscape pattern index values of the land use types in 2030 under the three simulation scenarios. To analyze the spatio-temporal characteristics of landscape ecological risk in Xinjiang in 2030, we utilized the Kriging interpolation method in ArcGIS software to obtain the spatial distribution of landscape ecological risk under different scenarios. According to the range of ERI in each ecological risk small zone within the region, we used the natural break method provided by ArcGIS to divide the landscape ecological risk into five levels: lowest, lower, medium, higher, and highest. The ecological risk levels map of Xinjiang under different scenarios was obtained (Figure 5).
The spatial distribution of ERI in Xinjiang is quite apparent, showing a spatial pattern that matches the terrain of Xinjiang’s “three mountains and two basins”. The areas with the lowest and lower ecological risk are mainly distributed in the “three mountains” and the Ili region, where vegetation is lush and regional water resources and biodiversity are relatively abundant. The areas with medium and high ecological risk are primarily concentrated in the oasis regions of Xinjiang, where vegetation is sparse and human activities have a significant impact. The highest risk areas are located in the basins, which are primarily desert areas with low vegetation coverage and a fragile ecological environment.
From a spatial pattern evolution perspective, the distribution of ERI grades did not change significantly, but there were some changes in the area of each risk zone. To provide insights into these changes, we calculated the areas of different ERI levels in 2020 and under different scenarios in 2030 (Table 4). Under the natural development scenario, the area of the highest risk zones increased by 83.48 km2. The area of the lower and medium risk zones decreased, with reductions of 1.92% and 5.68%, respectively, decreasing from 325,335.56 km2 and 471,445.08 km2 in 2020 to 288,838.28 km2 and 363,708.92 km2 in 2030. Compared with the other two scenarios, the urban development scenario has a larger reduction in the area of the lowest and medium risk zones and a larger increase in the area of the higher and highest risk zones. This is due to the increased probability of transfer of ecological land such as cropland and forest land into construction land under this scenario, where construction land is used as a restricted conversion zone. This leads to further encroachment of construction land into surrounding ecological land such as cropland, forest land, and unused land. Under the ecological conservation scenario, compared with the other scenarios, the area of the lowest risk zones increased by 10,815.40 km2; the area of the lower risk zones decreased by 33,962.40 km2. From the perspective of land use type conversion in the lowest risk areas, there is a notable shift from unused land to forest and grassland, resulting in a comparatively larger area of the lowest risk areas as compared to the natural development and urban development scenarios. Examining the land use type conversion in the lowest risk areas, there is a discernible conversion from unused land to forest and grassland, resulting in a relatively larger area of the lowest risk areas as compared to the natural development and urban development scenarios.

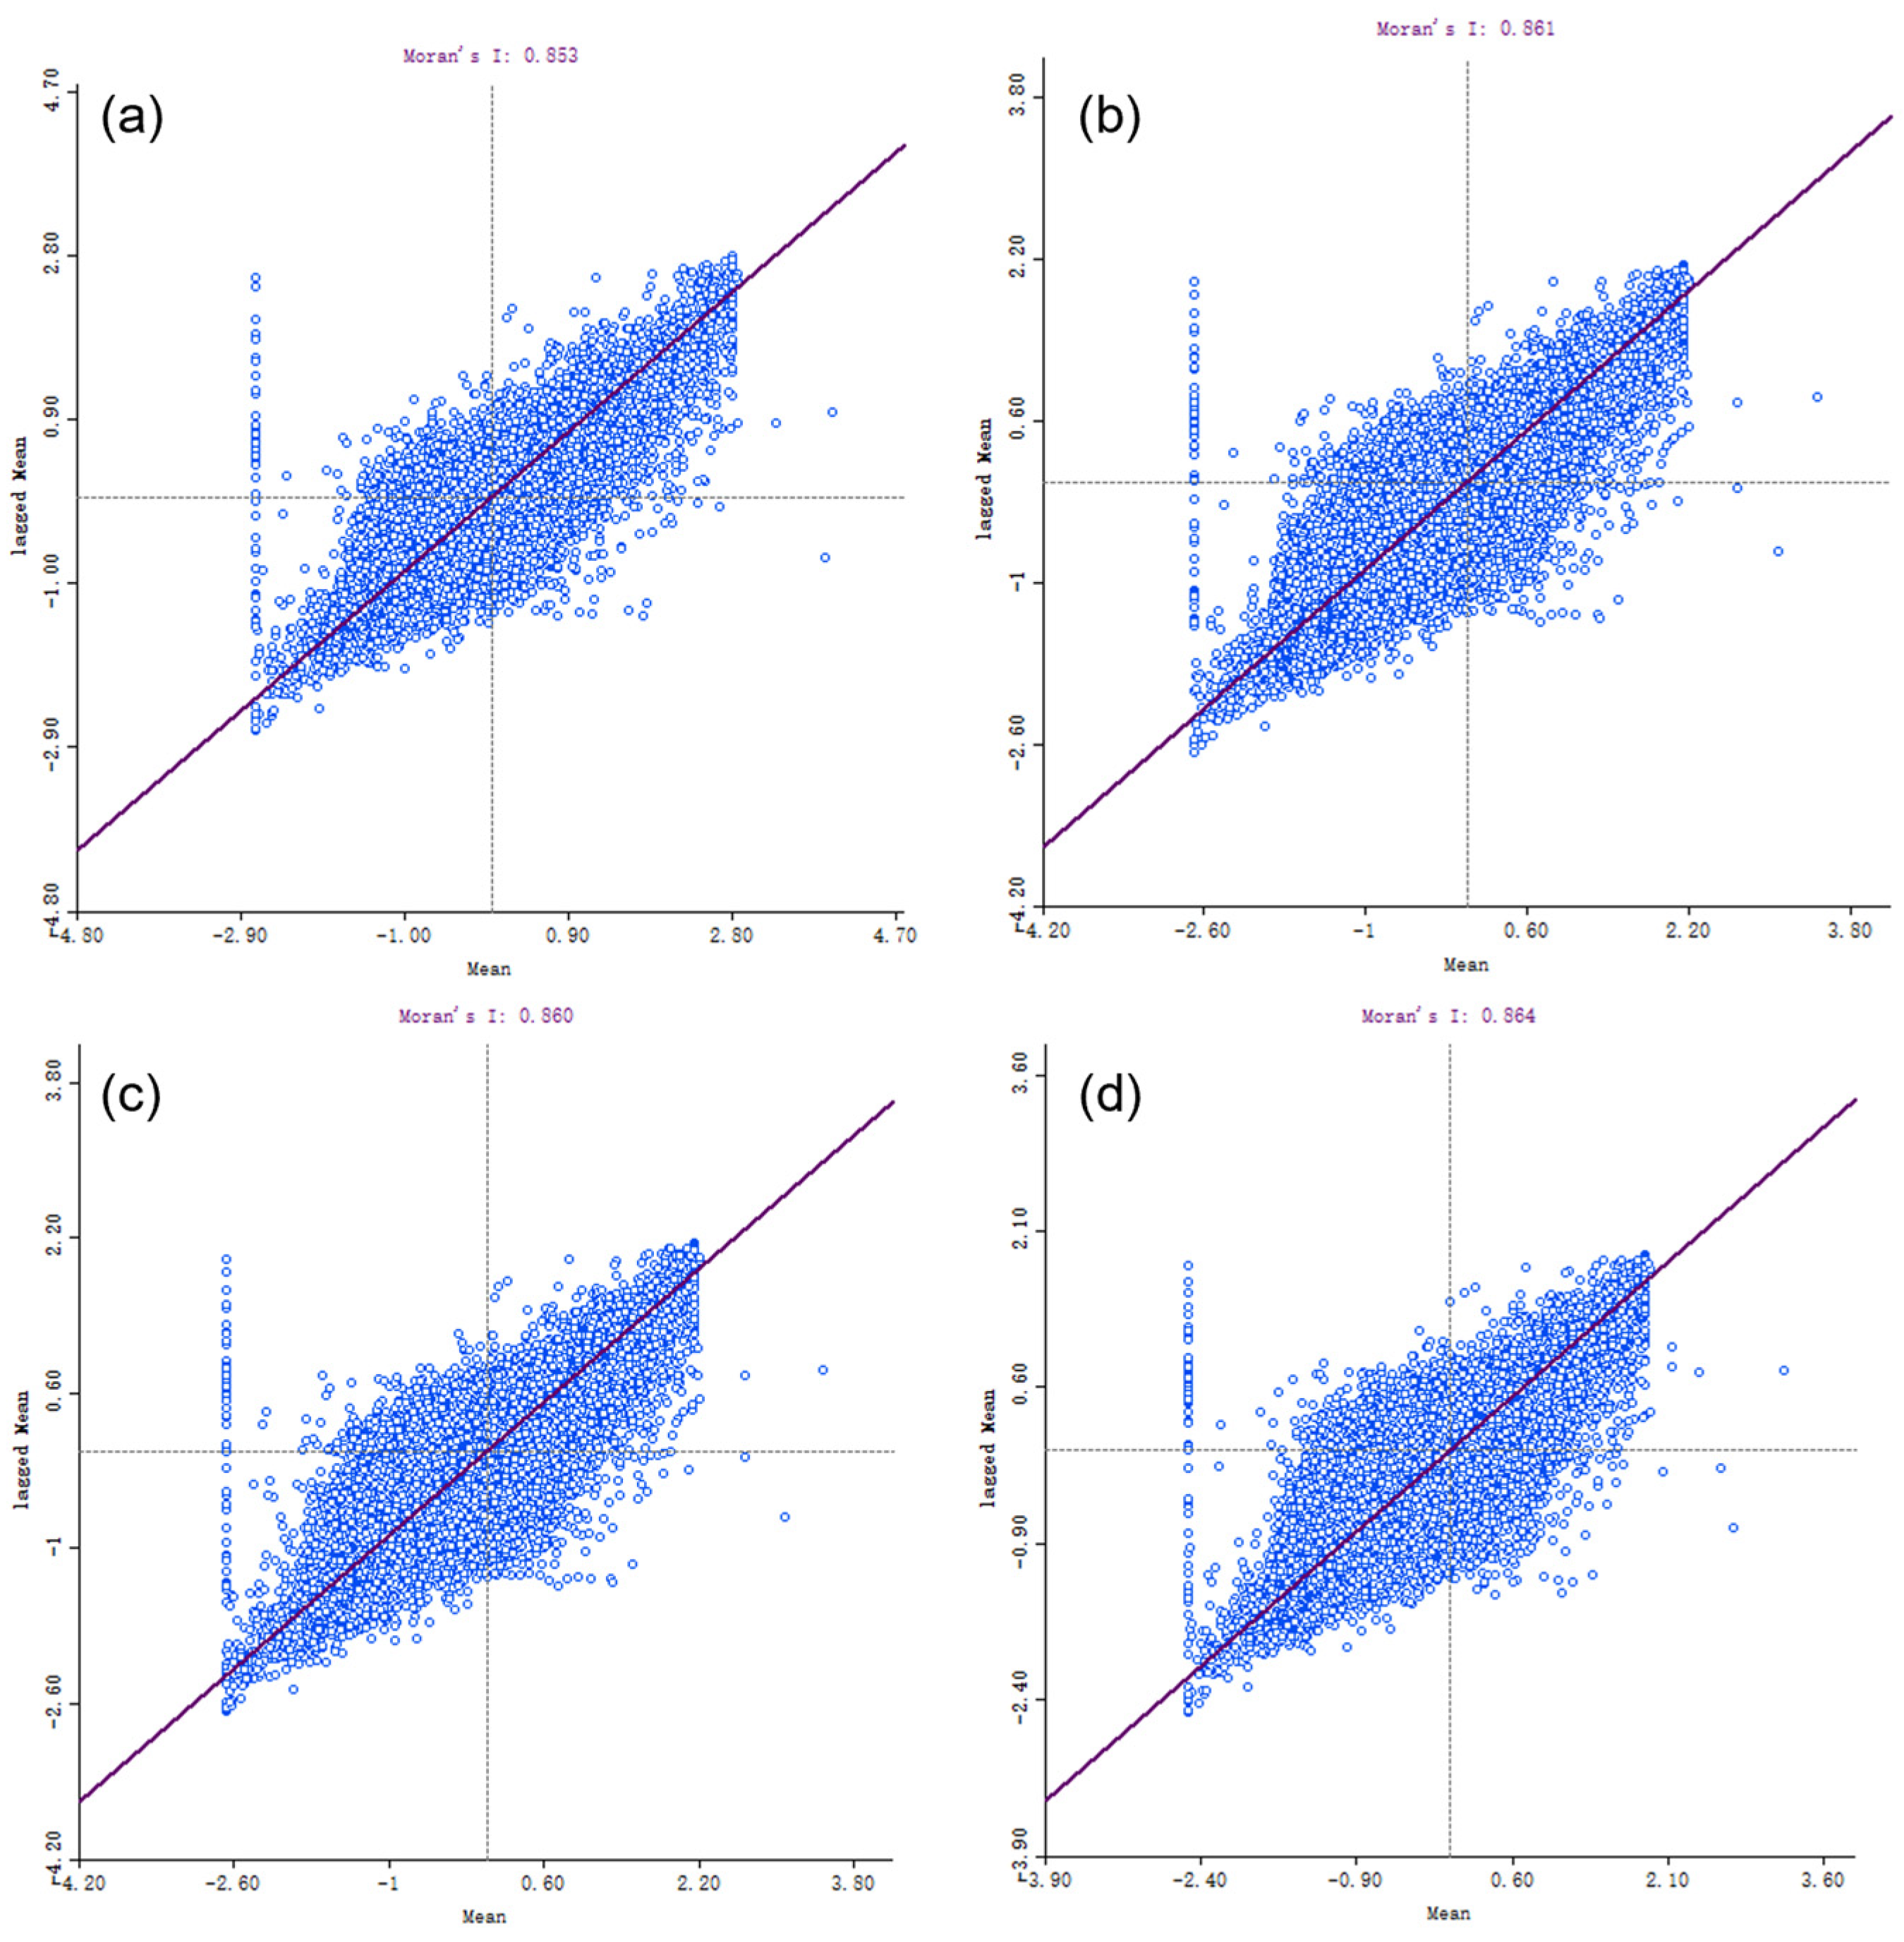
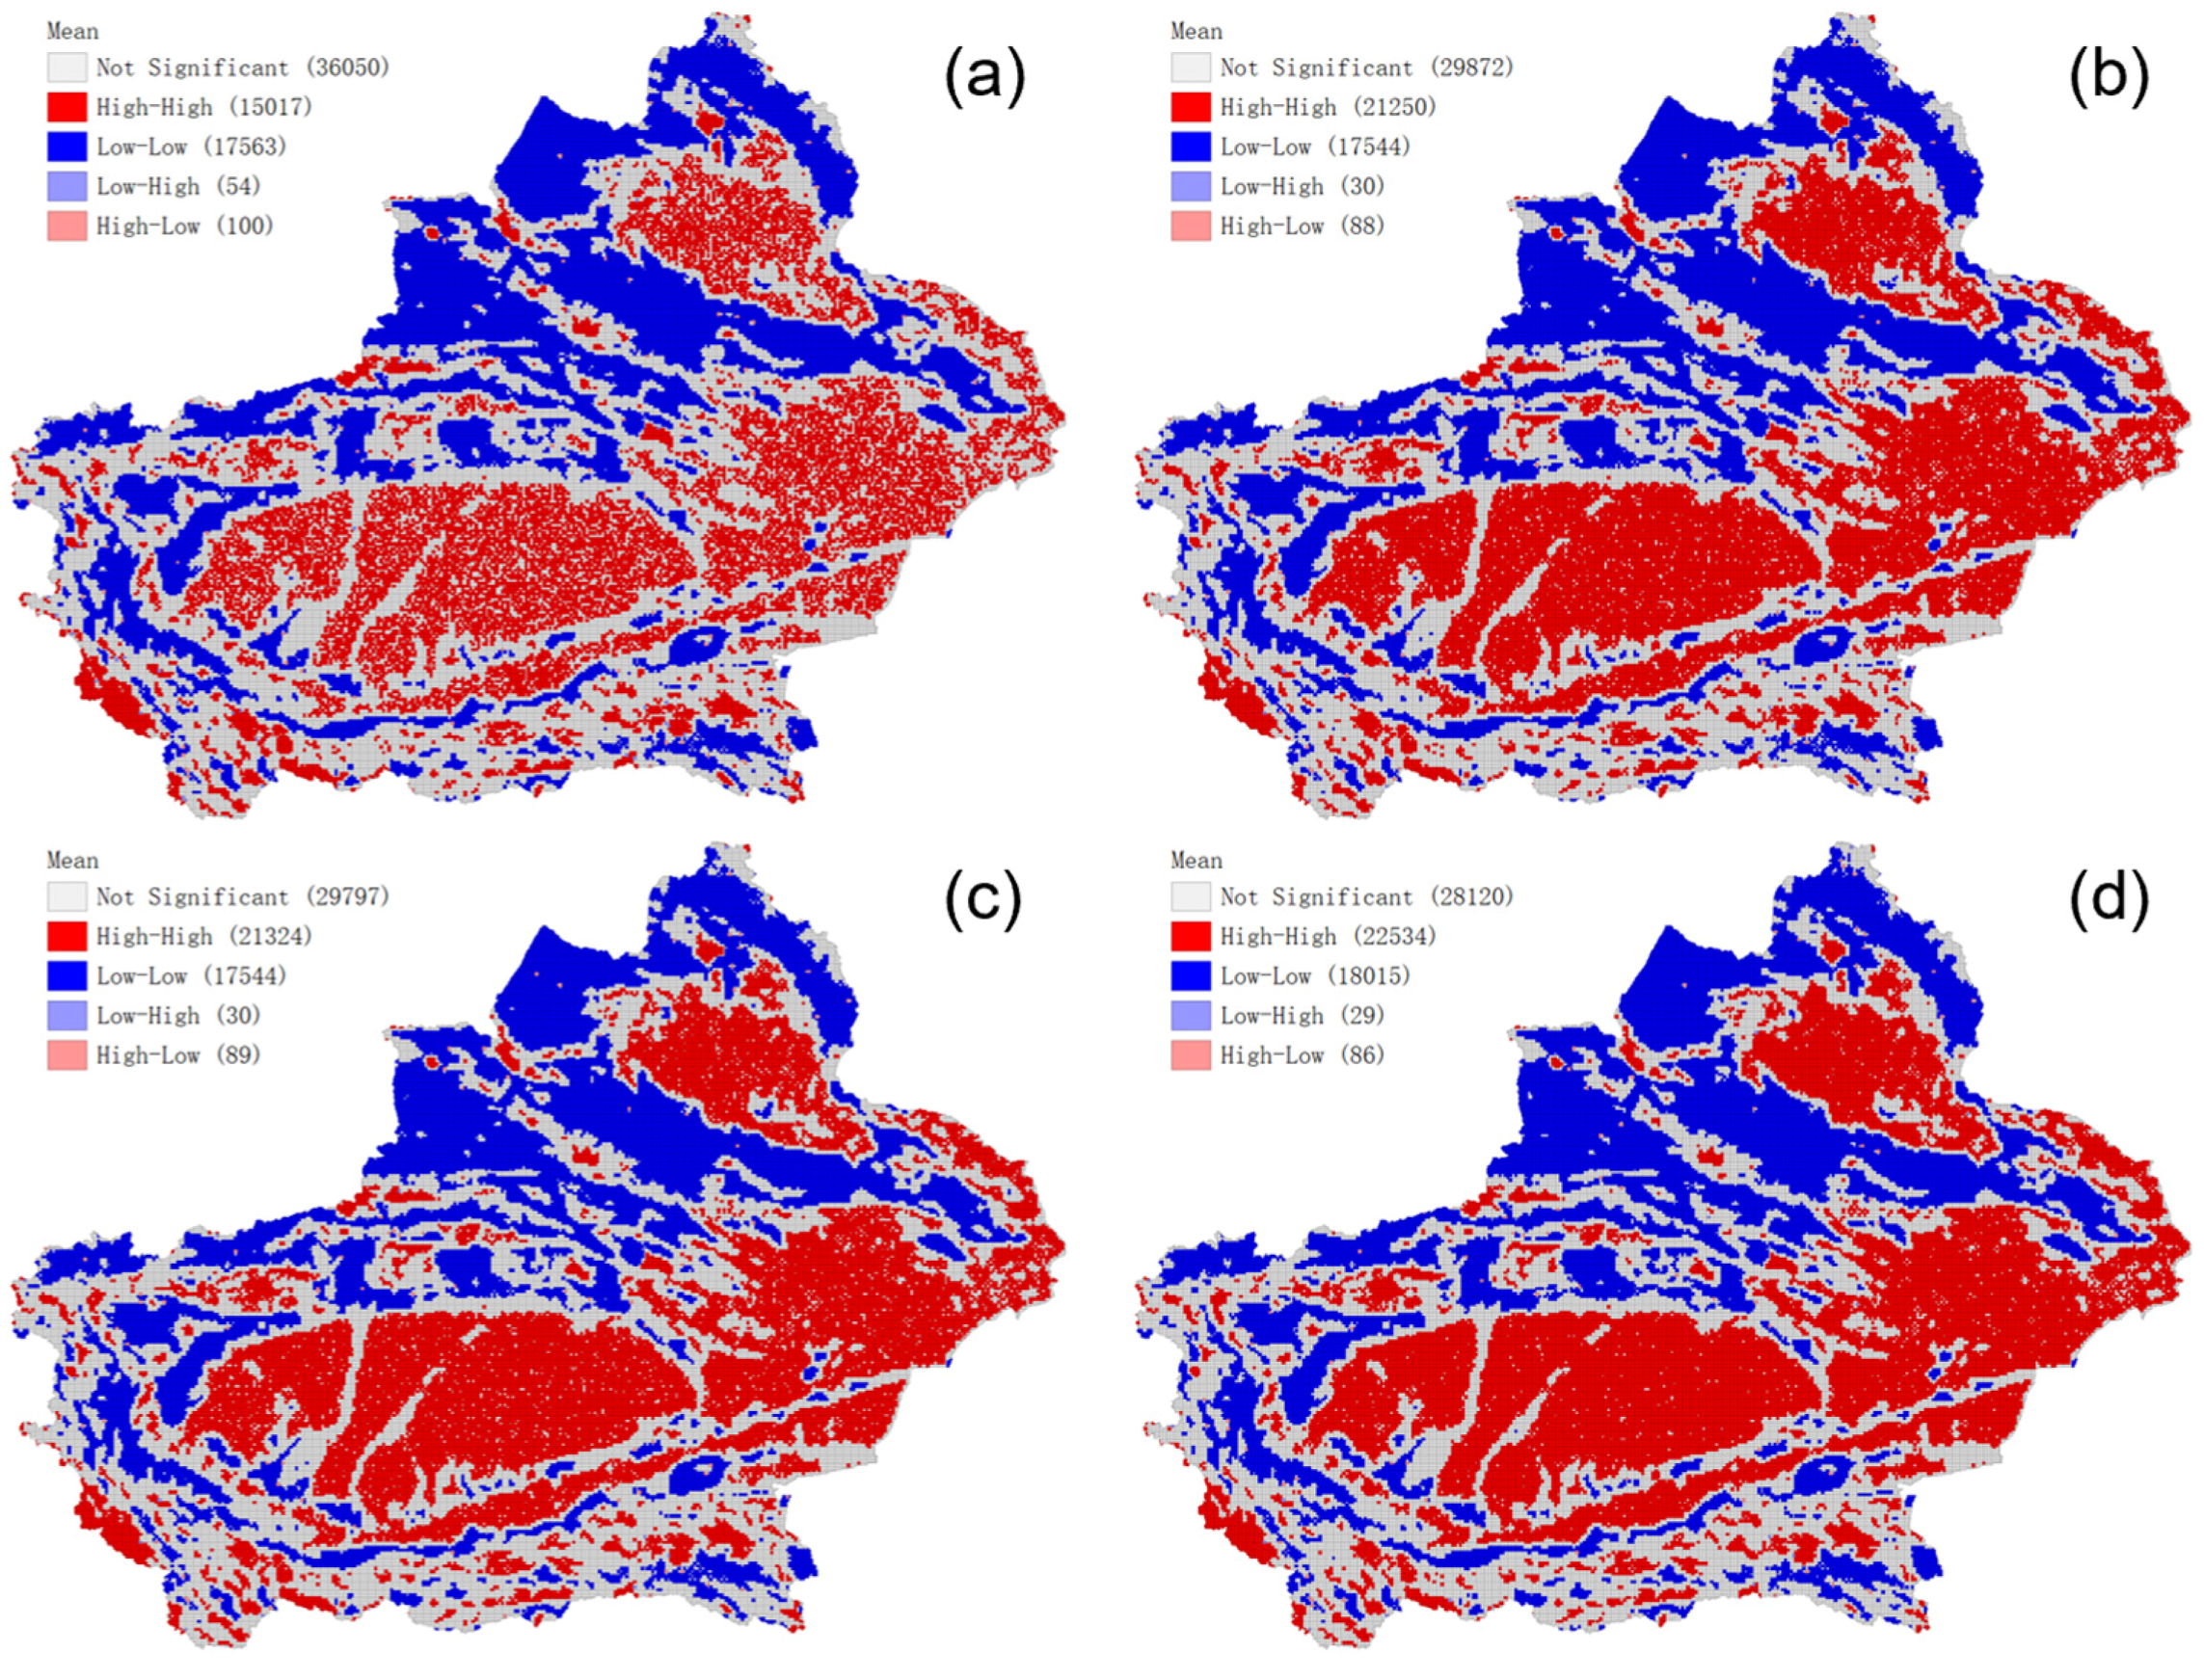
4.4. Spatial Autocorrelation Analysis of Landscape Ecological Risk

To clarify the spatial distribution characteristics of landscape ecological risk in Xinjiang in 2020 and 2030, this study characterized the distribution using Moran’s I and LISA cluster maps. The results showed that in 2020, the Moran’s I value was 0.853, indicating a high degree of spatial clustering and strong positive correlation in the spatial distribution of landscape ecological risk in Xinjiang (Figure 6a). Under the three simulated scenarios of natural development, urban development, and ecological conservation, the Moran’s I value in 2030 was 0.861, 0.860, and 0.864, respectively, indicating a stable overall global Moran’s I value. This suggests that the distribution pattern of landscape ecological risk in Xinjiang has maintained a high degree of clustering.
The Moran’s I index can be used to study the overall distribution and spatial clustering of a region, but it cannot reflect the spatial correlation within the region. Therefore, the Local Indicators of Spatial Association (LISA) clustering analysis was used to study the correlation of ecological risk and whether it exhibited a certain spatial clustering (Figure 7). Four significant autocorrelation relationships were identified: high-high (HH), low-low (LL), low-high (LH), and high-low (HL). At a 95% confidence level, the HH areas were mainly distributed in the central-southern, central-eastern, and northeastern parts of Xinjiang, and were relatively concentrated. The unused land and other fragile land use types were mostly distributed in this area, leading to high values of ecological risk in this region. In contrast, the LL areas were mainly concentrated in the central-northern and northern parts of Xinjiang, with scattered distribution in the western regions, where the land use types were mostly cultivated land, forest land, and grassland. Overall, the spatial differences in ecological risk in Xinjiang were significant, with HH and LL clustering types predominating, presenting a polarized distribution pattern with high values in the central and southern parts and low values in the northern part of the study area.

5. Discussion

5.1. Spatial Characteristics and Functional Patterns of Land Resources

Land use change is a crucial factor in understanding the relationship between human activities and the ecological environment in the evolution of resources and the environment. The characteristics of land resources and feasible ecological management strategies in this study are as follows: firstly, the land use structure in Xinjiang presents a mosaic distribution pattern of unused land, grassland, cultivated land, water area, forest land, and construction land, among which the unused land accounts for more than 60% and constitutes the main body of the land use pattern in Xinjiang. Therefore, the rational transformation and utilization of unused land play a crucial role in promoting the high-quality development of Xinjiang. In the past two decades, there has been a decrease in the amount of unused land due to the development of the economy [16]. The main types of land conversions have been from unused land to cultivated land and construction land. In the future, as urbanization continues, it will be essential to develop and utilize unused land in a rational manner. This will involve the intensive and efficient use of land with high fragmentation, and the appropriate transformation of such land into forest and grassland to achieve comprehensive benefits of land use.
Additionally, it is worth noting that the unused land is primarily concentrated in mountainous areas, and in recent years, a small portion of this unused land has been converted into grassland due to the impact of global climate change. The conversion of unused land to grassland and the persistence of grassland are affected by the “warm and dry” climate in Xinjiang. This climate trend has made the already unstable oasis grassland more vulnerable to conversion into unused land [42]. The proportion of grassland area in Xinjiang is about 30%, which constitutes the main part of the vegetation ecosystem in Xinjiang. Therefore, protecting grassland is an important aspect of maintaining a healthy ecosystem in Xinjiang. The spatial allocation of grassland resources can be considered from two aspects. Firstly, grassland resources are crucial ecological resources with substantial potential for ecological value. They play a significant role in providing essential ecological services, such as soil conservation, wind and sand fixation, water conservation, carbon sequestration, and oxygen release. Secondly, grassland resources serve as a vital strategic reserve for optimizing the production structure of agriculture and animal husbandry, and promoting the industrialization and scale of grassland agriculture. This can facilitate the optimization and intensification of grassland resource production functions, which is an effective strategy to drive the transformation and development of agriculture.

5.2. Landscape Ecological Risk Identification and Optimal Allocation Strategy

Zoning and controlling landscape ecological risks based on natural geographic conditions is a critical issue to ensure sustainable development in Xinjiang. With its unique terrain, topography, and climate, Xinjiang has a high proportion of unused land, which leads to significant uncertainty in landscape ecological risks. In the simulated scenarios of future landscape ecological risk changes in the next 10 years (2020−2030), both the natural development scenario and the urban development scenario show an increase in the area of high-risk zones, mainly due to urban expansion encroaching on cultivated land and forest land, as well as the degradation of cultivated land and forest land. This emphasizes the significance of implementing measures to restrict the expansion of construction land and mitigate the encroachment on arable and forest land as a key strategy to prevent and control landscape ecological risks [45]. Therefore, the territorial spatial planning of Xinjiang should emphasize spatial control of urban, agricultural, and ecological spaces. This includes standardizing the delineation of urban development boundaries, permanent basic cultivated land, and ecological conservation red lines, while reserving planning space. Additionally, reasonable land use conversion and overall protection and restoration of fragmented arable and forest land in the urban fringe area are necessary to reduce the area of high-risk and moderately high-risk zones [46]. To address the fluctuation in the area of high-risk zones, regional land consolidation should be strengthened to increase forest and grassland coverage, reduce landscape fragmentation, and enhance the stability of the ecological system. As cultivated land and grassland are mainly distributed in agricultural areas, it is important to promote land consolidation for agricultural use, improve the intensiveness of cultivated land and grassland, coordinate the relationship between cultivated land, grassland, and ecological landscape, and promote high-quality regional agricultural development, aiming to transform medium-risk zones into the lowest or lower ecological risk zones [47,48]. For the lowest-risk and lower zones dominated by high/medium forest and grassland coverage, it is necessary to continue to strengthen the ecological advantages of forest and grassland, create a combination of ecological value points, lines, and surfaces of forest and grassland, prevent the decrease in the area of low-risk zones, and guide the positive evolution of the forest and grassland ecological system, which are crucial strategies to avoid the increase of landscape ecological risks in Xinjiang.

5.3. Policy Insights

As an important ecological barrier in western China, Xinjiang’s natural ecological environment is an essential carrier for the socio-economic system [49]. On one hand, Xinjiang has a significant fluctuation in terrain, diverse landforms, and landscape types. However, its overall landscape pattern is relatively fragmented, with low stability and resilience, making its ecological environment vulnerable. On the other hand, under the influence of human activities and natural disturbances, Xinjiang’s ecological environment continues to deteriorate. Therefore, based on the evaluation of landscape ecological risks under different scenarios in the current and future conditions, it is suggested to pay attention to the impact of different land use patterns and functions on the changes of ecological risk zones during the rapid economic transformation and development in Xinjiang. The following suggestions are proposed for the prevention of ecological risks and the management of the ecological environment in Xinjiang: when planning the spatial layout of land resources, it is essential to pay attention to the rationality of the land use structure and spatial pattern. This can be achieved by strictly controlling the city’s development boundaries and protecting permanent basic cultivated land and ecological conservation red lines. Furthermore, it is necessary to scientifically arrange the urban space, agricultural space, and ecological space, and to expand urban land use in an orderly manner according to the requirements of intensification and green development. Additionally, it is important to strengthen the overall protection and restoration of the fragmented cultivated land and forest land caused by urban expansion. [50]. Secondly, while maintaining the current good natural environment, it is necessary to focus on the development and utilization of unused land and carry out reasonable transformation of unused land, such as the transformation of unused land into forest land or grassland, creating a multi-functional landscape system consisting of ecological background, open space system, and human landscapes. Finally, in order to ensure a healthy and stable ecological security pattern in Xinjiang, it is recommended to plan and develop construction land in a reasonable scale and intensity, cultivate water areas, and build ecological corridors. It is also important to moderately increase the scale of ecological greening land in urban areas, which is a scientific way to ensure the healthy and stable ecological security pattern in Xinjiang.

5.4. Research Prospects

The driving factors of land use landscape pattern change in Xinjiang are complex. In the simulation of multiple land use scenarios, the selection of driving factors greatly affects the accuracy of the model. Due to the availability of data and the difficulty of quantifying many factors, the 17 natural and socio-economic driving factors chosen in this study are not comprehensive and may also affect the simulation accuracy. However, in this study, the predicted land use in 2020 was checked against the real data for accuracy, and the Kappa coefficient obtained was 0.93. This indicates that the simulation accuracy is high and can meet the requirements of landscape ecological risk analysis. In the follow-up study, the simulation accuracy will be further improved if more data can be obtained.
In the process of landscape ecological risk assessment, this study divided the study area into 68,784 grid cells using a grid system. However, the scale effect in geographical research is inevitable, and this study did not explore whether there are differences in the landscape ecological risk results under different segmentation scales. Selecting a reasonable evaluation unit is of great significance for optimizing evaluation results. Therefore, in the future, different scales or methods can be further explored to divide the landscape. In addition, landscape ecological risk assessment involves multiple parameters, and different simulation results may occur due to different model parameter settings. Based on previous research results, the model parameters in this study were determined. However, finding the best model parameters suitable for different research purposes and research fields is crucial for future research. The evaluation model used in this study was not compared with other models, so it is not absolute. Therefore, selecting appropriate landscape pattern indices is also an important consideration for improving the applicability of the evaluation model in future research.

6. Conclusions

This study is based on the land use data of Xinjiang in 2000, 2010, and 2020, and selected various influencing factors such as natural geography and social economy. The PLUS model was used to predict the land use changes under the scenarios of natural development, urban development, and ecological conservation in 2030. Based on the simulation of the land use scenario in 2030, we evaluated the spatiotemporal patterns and change characteristics of landscape ecological risk under different scenarios in 2030.
The results show the following: (1) From 2000 to 2020, the main landscape type in Xinjiang was unused land, while the areas of cultivated land, grassland, and construction land showed an increasing trend, and the areas of forest land, water bodies, and unused land showed a decreasing trend. Among them, the most significant change was in the cultivated land area, which mainly shifted to grassland and construction land. The expansion of construction land landscape was dominant in the urbanization process, leading to a reduction in ecological landscapes such as grassland, which weakened the stability of the ecosystem. (2) Among the three scenarios, the urban development scenario mainly showed a conversion of unused land to construction land, which is beneficial for economic development, but the ecological land, such as forest and grassland, could not be fully protected, which is inconsistent with the concept of sustainable development. The ecological conservation scenario mainly showed a small increase in construction land and a conversion of unused land to forest and grassland, which is consistent with the concept of sustainable development, promoting the co-development of ecological conservation and socio-economic development. (3) Under different scenarios, the landscape types in Xinjiang showed varying degrees of changes in 2030, and the spatial distribution characteristics of landscape ecological risk were similar to those in 2020. Notably, under the urban development scenario, the area of lowest and medium risk areas decreases significantly while the area of higher and highest risk areas increases substantially. Conversely, under the ecological conservation scenario, the area of the lowest risk areas experiences a more significant increase. (4) The spatial aggregation of landscape ecological risk values in Xinjiang was obvious. The spatial differences in landscape ecological risk in Xinjiang were significant, with HH and LL being the main clustering types, showing polarization and exhibiting a distribution pattern of low in the north and high in the middle and south of the study area. The spatial distribution pattern of ecological risk is closely related to the spatial distribution pattern of human activities in Xinjiang. Therefore, it is necessary to focus on the dynamic changes in landscape type structure and ecological risk caused by the expansion of urban land use. This study provides a reference for the theory and method of ecological risk evaluation and provides scientific basis for Xinjiang’s land use planning and decision making, which is helpful for achieving sustainable development of the ecological environment in Xinjiang.

Author Contributions

Y.C., H.Y., X.W. and S.S.: methodology, software, data curation, validation, and writing—original draft; B.L., H.G., J.L., C.C. and D.Y.: project administration and writing—review and editing; W.S.: conceptualization, funding acquisition, writing—review and editing. All authors have read and agreed to the published version of the manuscript.

Funding

This research was supported by The Second Tibetan Plateau Scientific Expedition and Research (Grant No. 2019QZKK0603) and the Project of National Natural Science Foundation of China (Grant No. 42071233).

Institutional Review Board Statement

Not applicable.

Informed Consent Statement

Not applicable.

Data Availability Statement

All relevant data sets in this study are described in the manuscript.

Conflicts of Interest

The authors declare no conflict of interest.

References

  1. Xu, H.; Song, Y.; Tian, Y. Simulation of land-use pattern evolution in hilly mountainous areas of North China: A case study in Jincheng. Land Use Policy 2022, 112, 105826. [Google Scholar] [CrossRef]
  2. Gao, H.; Song, W. Assessing the Landscape Ecological Risks of Land-Use Change. Int. J. Environ. Res. Public Health 2022, 19, 13945. [Google Scholar] [CrossRef] [PubMed]
  3. Cao, C.; Song, W. Progress and prospect of ecological risks of land use change. Front. Environ. Sci. 2022, 10, 1077515. [Google Scholar] [CrossRef]
  4. Qiu, M.; Zuo, Q.; Wu, Q.; Yang, Z.; Zhang, J. Water ecological security assessment and spatial autocorrelation analysis of prefectural regions involved in the Yellow River Basin. Sci. Rep. 2022, 12, 5105. [Google Scholar] [CrossRef] [PubMed]
  5. Zhang, Y.; Li, X.; Song, W. Determinants of cultivated land abandonment at the parcel, household and village levels in mountain areas of China: A multi-level analysis. Land Use Policy 2014, 41, 186–192. [Google Scholar] [CrossRef]
  6. Song, W.; Pijanowski, B.C. The effects of China’s cultivated land balance program on potential land productivity at a national scale. Appl. Geogr. 2014, 46, 158–170. [Google Scholar] [CrossRef]
  7. Liang, X.; Li, Y.; Zhao, Y. Coupling land use analysis and ecological risk assessment: A study of the Three Gorges Reservoir area, China. Mt. Res. Dev. 2020, 40, R1. [Google Scholar] [CrossRef]
  8. U.S. Environmental Protection Agency, Risk Assessment Forum. Report on the Ecological Risk Assessment Guidelines Strategic Planning Workshop; U.S. Environmental Protection Agency, Risk Assessment Forum: Washington, DC, USA, 1992. [Google Scholar]
  9. U.S. Environmental Protection Agency, Risk Assessment Forum. Guidelines for Ecological Risk Assessment; U.S. Environmental Protection Agency, Risk Assessment Forum: Washington, DC, USA, 1998. [Google Scholar]
  10. Skaare, J.U.; Larsen, H.J.; Lie, E.; Bernhoft, A.; Derocher, A.E.; Norstrom, R.; Ropstad, E.; Lunn, N.F.; Wiig, Ø. Ecological risk assessment of persistent organic pollutants in the arctic. Toxicology 2002, 181, 193–197. [Google Scholar] [CrossRef]
  11. Xu, Y.; Gao, J.; Gao, Y. Landscape ecological risk assessment in the Taihu region based on land use change. J. Lake Sci. 2011, 23, 642–648. [Google Scholar]
  12. Song, W.; Deng, X. Land-use/land-cover change and ecosystem service provision in China. Sci. Total Environ. 2017, 576, 705–719. [Google Scholar] [CrossRef]
  13. Li, C.; Zhang, J.; Philbin, S.P.; Yang, X.; Dong, Z.; Hong, J.; Ballesteros-Pérez, P. Evaluating the impact of highway construction projects on landscape ecological risks in high altitude plateaus. Sci. Rep. 2022, 12, 5170. [Google Scholar] [CrossRef]
  14. Zhou, S.; Chang, J.; Hu, T.; Luo, P.; Zhou, H. Spatiotemporal Variations of Land Use and Landscape Ecological Risk in a Resource-Based City, from Rapid Development to Recession. Pol. J. Environ. Stud. 2020, 29, 475–490. [Google Scholar] [CrossRef]
  15. Yongnian, Z.; Wenping, J.; Huimin, W.; Honghui, Z. Simulation of land-use changes and landscape ecological assessment in eastern part of Qinghai Plateau. Trans. Chin. Soc. Agric. Eng. 2014, 30, 185–194. [Google Scholar]
  16. Xu, Q.; Guo, P.; Jin, M.; Qi, J. Multi-scenario landscape ecological risk assessment based on Markov–FLUS composite model. Geomat. Nat. Hazards Risk 2021, 12, 1449–1466. [Google Scholar] [CrossRef]
  17. Wang, D.; Ji, X.; Li, C.; Gong, Y. Spatiotemporal variations of landscape ecological risks in a resource-based city under transformation. Sustainability 2021, 13, 5297. [Google Scholar] [CrossRef]
  18. Guo, K.; Kuai, X.; Chen, Y.; Qi, L.; Zhang, L.; Liu, Y. Risk assessment of land ecology on a regional scale: Application of the relative risk model to the mining city of Daye, China. Hum. Ecol. Risk Assess. Int. J. 2017, 23, 550–574. [Google Scholar] [CrossRef]
  19. Liang, Y.; Song, W. Integrating potential ecosystem services losses into ecological risk assessment of land use changes: A case study on the Qinghai-Tibet Plateau. J. Environ. Manag. 2022, 318, 115607. [Google Scholar] [CrossRef]
  20. Zhang, W.; Sun, X.; Shan, R.; Liu, F. Spatio-temporal quantification of landscape ecological risk changes and its driving forces in the Nansihu Lake basin during 1975–2018. Ecol. Sci. 2020, 39, 172–181. [Google Scholar]
  21. Li, Q.; Zhang, Z.; Wan, L.; Yang, C.; Zhang, J.; Ye, C.; Chen, Y. Landscape pattern optimization in Ningjiang River Basin based on landscape ecological risk assessment. Acta Geogr. Sin. 2019, 74, 1420–1437. [Google Scholar]
  22. Chen, H.; Shi, T.; Wu, G. The dynamic analysis of lake landscape of Wuhan City in recent 40 years. J. Lake Sci. 2015, 27, 745–754. [Google Scholar]
  23. Yu, P.; Xu, H.; Liu, S.; Qiao, M.; Zhang, Q.; An, H.; Fu, J. Spatial distribution pattern changes of oasis soil types in Manasi River Basin, arid northwestern China. Catena 2011, 87, 253–259. [Google Scholar] [CrossRef]
  24. Chen, X. Physical Geography of Arid Areas in China; Science Press: Beijing, China, 2010. [Google Scholar]
  25. Cai, T.; Luo, X.; Fan, L.; Han, J.; Zhang, X. The Impact of Cultivated land Use Changes on Terrestrial Ecosystem Services Value in Newly Added Cultivated land Hotspots in China during 2000–2020. Land 2022, 11, 2294. [Google Scholar] [CrossRef]
  26. Li, Y.; Chen, Y.; Sun, F.; Li, Z. Recent vegetation browning and its drivers on Tianshan Mountain, Central Asia. Ecol. Indic. 2021, 129, 107912. [Google Scholar] [CrossRef]
  27. Cai, T.; Zhang, X.; Xia, F.; Lu, D. Function Evolution of Oasis Cultivated Land and Its Trade-Off and Synergy Relationship in Xinjiang, China. Land 2022, 11, 1399. [Google Scholar] [CrossRef]
  28. Wang, Y.; Shataer, R.; Zhang, Z.; Zhen, H.; Xia, T. Evaluation and Analysis of Influencing Factors of Ecosystem Service Value Change in Xinjiang under Different Land Use Types. Water 2022, 14, 1424. [Google Scholar] [CrossRef]
  29. Resource Environmental Science and Data Center, Chinese Academy of Sciences. Available online: http://www.resdc.cn/ (accessed on 10 January 2023).
  30. Liu, J.; Kuang, W.; Zhang, Z.; Xu, X.; Qin, Y.; Ning, J.; Zhou, W.; Zhang, S.; Li, R.; Yan, C.; et al. Spatiotemporal characteristics, patterns, and causes of land-use changes in China since the late 1980s. J. Geogr. Sci. 2014, 24, 195–210. [Google Scholar] [CrossRef]
  31. Open Data Commons Open Database License, OpenStreetMap Foundation. Available online: https://www.openstreetmap.org (accessed on 10 January 2023).
  32. Liang, X.; Guan, Q.; Clarke, K.C.; Liu, S.; Wang, B.; Yao, Y. Understanding the drivers of sustainable land expansion using a patch-generating land use simulation (PLUS) model: A case study in Wuhan, China. Comput. Environ. Urban Syst. 2021, 85, 101569. [Google Scholar] [CrossRef]
  33. Congalton, R.G. A review of assessing the accuracy of classifications of remotely sensed data. Remote Sens. Environ. 1991, 37, 35–46. [Google Scholar] [CrossRef]
  34. Lin, W.; Cen, J.; Xu, D.; Du, S.; Gao, J. Wetland landscape pattern changes over a period of rapid development (1985–2015) in the ZhouShan Islands of Zhejiang province, China. Estuar. Coast. Shelf Sci. 2018, 213, 148–159. [Google Scholar] [CrossRef]
  35. Wang, H.; Liu, X.; Zhao, C.; Chang, Y.; Liu, Y.; Zang, F. Spatial-temporal pattern analysis of landscape ecological risk assessment based on land use/land cover change in Baishuijiang National nature reserve in Gansu Province, China. Ecol. Indic. 2021, 124, 107454. [Google Scholar] [CrossRef]
  36. Kong, X.; Fu, M.; Zhao, X.; Wang, J.; Jiang, P. Ecological effects of land-use change on two sides of the Hu Huanyong Line in China. Land Use Policy 2022, 113, 105895. [Google Scholar] [CrossRef]
  37. Ran, P.; Hu, S.; Frazier, A.E.; Qu, S.; Yu, D.; Tong, L. Exploring changes in landscape ecological risk in the Yangtze River Economic Belt from a spatiotemporal perspective. Ecol. Indic. 2022, 137, 108744. [Google Scholar] [CrossRef]
  38. Wu, P.; Zhan, W.; Cheng, N.; Yang, H.; Wu, Y. A Framework to Calculate Annual Landscape Ecological Risk Index Based on Land Use/Land Cover Changes: A Case Study on Shengjin Lake Wetland. IEEE J. Sel. Top. Appl. Earth Obs. Remote Sens. 2021, 14, 11926–11935. [Google Scholar] [CrossRef]
  39. Ghulam, A.; Ghulam, O.; Maimaitijiang, M.; Freeman, K.; Porton, I.; Maimaitiyiming, M. Remote Sensing Based Spatial Statistics to Document Tropical Rainforest Transition Pathways. Remote Sens. 2015, 7, 6257–6279. [Google Scholar] [CrossRef]
  40. Darand, M.; Dostkamyan, M.; Rehmani, M.I.A. Spatial autocorrelation analysis of extreme precipitation in Iran. Russ. Meteorol. Hydrol. 2017, 42, 415–424. [Google Scholar] [CrossRef]
  41. Alexander, L.V.; Bador, M.; Roca, R.; Contractor, S.; Donat, M.G.; Nguyen, P.L. Intercomparison of annual precipitation indices and extremes over global land areas from in situ, space-based and reanalysis products. Environ. Res. Lett. 2020, 15, 055002. [Google Scholar] [CrossRef]
  42. Zhang, F.; Yushanjiang, A.; Wang, D. Ecological risk assessment due to land use/cover changes (LUCC) in Jinghe County, Xinjiang, China from 1990 to 2014 based on landscape patterns and spatial statistics. Environ. Earth Sci. 2018, 77, 491. [Google Scholar] [CrossRef]
  43. Yu, T.; Bao, A.; Xu, W.; Guo, H.; Jiang, L.; Zheng, G.; Yuan, Y.; Nzabarinda, V. Exploring Variability in Landscape Ecological Risk and Quantifying Its Driving Factors in the Amu Darya Delta. Int. J. Environ. Res. Public Health 2020, 17, 79. [Google Scholar] [CrossRef]
  44. Batlle, J.R.M.; van der Hoek, Y. Clusters of high abundance of plants detected from local indicators of spatial association (LISA) in a semi-deciduous tropical forest. PLoS ONE 2018, 13, e0208780. [Google Scholar] [CrossRef]
  45. Li, Z.; Cheng, X.; Han, H. Future Impacts of Land Use Change on Ecosystem Services under Different Scenarios in the Ecological Conservation Area, Beijing, China. Forests 2020, 11, 584. [Google Scholar] [CrossRef]
  46. Guo, Z.; Hu, Y.; Bai, Y.; Yang, L.; Wang, J. How to Control Coastal Zone Through Spatial Planning? Taking the Construction of the Spatial Monitoring Index System of the Coastal Zone in China as an Example. Front. Environ. Sci. 2022, 10, 876414. [Google Scholar] [CrossRef]
  47. Shi, M.; Wu, H.; Jiang, P.; Shi, W.; Zhang, M.; Zhang, L.; Zhang, H.; Fan, X.; Liu, Z.; Zheng, K.; et al. Cultivated land Expansion Mitigates the Supply and Demand Deficit for Carbon Sequestration Service under Different Scenarios in the Future—The Case of Xinjiang. Agriculture 2022, 12, 1182. [Google Scholar] [CrossRef]
  48. Wang, Y.; Li, X.; Zhang, Q.; Li, J.; Zhou, X. Projections of future land use changes: Multiple scenarios-based impacts analysis on ecosystem services for Wuhan city, China. Ecol. Indic. 2018, 94, 430–445. [Google Scholar] [CrossRef]
  49. Fang, S.; Tu, W.; Mu, L.; Sun, Z.; Hu, Q.; Yang, Y. Saline alkali water desalination project in Southern Xinjiang of China: A review of desalination planning, desalination schemes and economic analysis. Renew. Sustain. Energy Rev. 2019, 113, 109268. [Google Scholar] [CrossRef]
  50. Mu, R.; de Jong, M. A network governance approach to transit-oriented development: Integrating urban transport and land use policies in Urumqi, China. Transp. Policy 2016, 52, 55–63. [Google Scholar] [CrossRef]
Figure 1. Elevation and Geographic Location of Xinjiang Uygur Autonomous Region in China.
Land 12 00895 g001
Figure 2. Landscape Ecological Risk Assessment Framework of Land Use Change in Xinjiang.
Land 12 00895 g002
Figure 3. Land use types in Xinjiang in 2000, 2010 and 2020.
Land 12 00895 g003
Figure 4. Predicted land use changes in Xinjiang in 2030 under different development scenarios.
Land 12 00895 g004
Figure 5. Spatial distribution of landscape ecological risk in Xinjiang in 2030.
Land 12 00895 g005
Figure 6. Moran Scatter Map of Landscape Ecological Risk in Xinjiang in 2020 and 2030 under Different Simulation Scenarios. (a) The scatter plot of Moran’s I for landscape ecological risk in Xinjiang in 2020. (bd) are the Moran scatter plots for landscape ecological risk in Xinjiang under the simulated scenarios of natural development, urban development, and ecological conservation in 2030, respectively.
Land 12 00895 g006
Figure 7. LISA Cluster Map of Landscape Ecological Risk in Xinjiang in 2020 and 2030 under Different Simulation Scenarios. (a), the LISA clustering map of landscape ecological risk in Xinjiang in 2020; (bd) are the LISA clustering maps of landscape ecological risk in Xinjiang in 2030 under simulated natural development, urban development and ecological conservation scenarios, respectively.
Land 12 00895 g007
Table 1. Setting of Contextual Factor Weights.
Land Use TypeCultivated LandForestGrasslandWaterConstruction LandUnused Land
Domain weights0.275 0.046 0.339 0.067 0.069 0.202
Table 2. Land use situation in Xinjiang in 2000, 2010, and 2020.
Land Use Types200020102020
Area/km2Percentage/%Area/km2Percentage/%Area/km2Percentage/%
Cultivated land61,992.84 3.66%84,126.24 4.97%93,946.60 5.55%
Forest land39,443.44 2.33%29,251.12 1.73%28,484.08 1.68%
Grassland496,356.80 29.30%505,696.76 29.85%502,376.20 29.65%
Water area54,767.44 3.23%35,273.72 2.08%36,464.56 2.15%
Construction land4536.60 0.27%8298.80 0.49%9353.80 0.55%
Unused land1,037,012.92 61.21%1,031,601.56 60.89%1,023,622.96 60.42%
Table 3. Land use area transition matrix in Xinjiang from 2000 to 2020.
2000
Land Use Types
2020
Cultivated LandForest LandGrasslandWater AreaConstruction LandUnused Land
Cultivated land52,791.401322.083991.12372.882816.00697.96
Forest land3375.2814,459.4818,314.28498.32190.682602.44
Grassland24,507.2410,542.72340,964.404579.841605.52114,142.16
Water area690.16340.368937.6423,860.44108.8420,819.48
Construction land1531.7697.32255.8820.242388.88242.52
Unused land11,049.441720.44129,853.967121.482243.88885,002.00
Note: The unit of measurement for the data in the table is km2.
Table 4. Comparison of the area of each class of landscape ecological risk in Xinjiang in 2020 and 2030 under different scenarios.
Risk Level2020Natural Develoment
Scenario
Urban Development
Scenario
Ecological Conservtion
Scenario
Area/km2Percentage/%Area/km2Percentage/%Area/km2Percentage/%Area/km2Percentage/%
Lowest 422,814.0022.29%424,426.5222.37%396,763.0020.91%435,241.9222.94%
Lower 325,335.5617.15%288,838.2815.22%255,615.7213.47%254,875.8813.44%
Medium 471,445.0824.85%363,708.9219.17%248,043.6013.07%290,617.1615.32%
Higher 664,606.0435.03%807,143.4842.54%968,915.3651.07%895,807.6847.22%
Highest 13,016.800.69%13,100.280.69%27,879.801.47%20,433.481.08%
Disclaimer/Publisher’s Note: The statements, opinions and data contained in all publications are solely those of the individual author(s) and contributor(s) and not of MDPI and/or the editor(s). MDPI and/or the editor(s) disclaim responsibility for any injury to people or property resulting from any ideas, methods, instructions or products referred to in the content.

